Straight Long-Range Surface Plasmon Polariton Waveguide Sensor Operating at λ0 = 850 nm


1
State Key Laboratory of Integrated Optoelectronics, College of Electronic Science & Engineering, Jilin University, Changchun 130012, China
2
School of Electrical Engineering and Computer Science, Department of Physics, and Center for Research in Photonics, University of Ottawa, Ottawa, ON K1N 6N5, Canada
*
Author to whom correspondence should be addressed.
Sensors 2020, 20(9), 2507; https://doi.org/10.3390/s20092507
Submission received: 18 March 2020
/
Revised: 24 April 2020
/
Accepted: 25 April 2020
/
Published: 28 April 2020
(This article belongs to the Special Issue Recent Advances in Optical Waveguide Sensors 2021)
Abstract
:A bulk refractive index sensor based on a straight long-range surface plasmon polariton (LRSPP) waveguide is theoretically designed. The waveguide sensor consists of an Au stripe that is embedded in ultraviolet sensitive polymer SU-8. The geometric parameters are optimized by finite difference eigenmode method at the optical wavelength of 850 nm. The sensitivity of 196 dB/RIU/mm can be obtained with a 1.5 μm wide, 25 nm thick Au stripe waveguide. Straight LRSPP waveguides are fabricated by a double layer lift-off process. Its optical transmission is characterized to experimentally prove the feasibility of the proposed design. This sensor has potential for the realization of a portable, low-cost refractometer.
1. Introduction
Surface plasmon polaritons (SPPs) are transverse magnetic polarized optical surface waves that propagate typically along the interface between a metal and dielectric (the single interface). The nanometer-thick metal stripe cladded by dielectrics with close refractive index (RI) supports the existence of long-range SPPs (LRSPPs) [1]. This bounded SPP super-mode has a symmetric field distribution, and the centimeter-long propagation distance implies a long optical interaction length for biochemical sensing [2]. However, the long propagation distance comes at the expense of weaker mode confinement, which leads to lower surface sensitivity. However, the propagation length of LRSPPs increases more rapidly than its drop in confinement, leading to a better overall sensitivity (due to a longer optical interaction length with the sensing region) compared to SPPs used in surface plasmon resonance-based detection. Beside this, LRSPPs can provide deeper penetration depth than single-interface SPPs, thus they hold promise as a probe of internal changes in biological cells immobilized on the metal surface [3]. LRSPPs can be excited by end-fire coupling with polarization-maintaining (PM) fiber or by gratings. Compact monolithic integration with microfluidic networks can be realized. Different LRSPP waveguide sensors have been reported, including Y-branch for reference sensing [4] and Mach–Zehnder interferometer with multiple outputs for perturbation-suppressed sensing [5,6], as well as multichannel waveguides for parallel biosensing [7]. In fact, a straight LRSPP waveguide can also provide analyte-receptor interaction information by simply monitoring the output power over time [8].
Aqueous sensing solutions with analyte typically have a low optical absorption at 850 nm [9,10,11,12,13]. Also, strong mode confinement (LRSPP) can be achieved at this wavelength and the cost of the light source and detector or camera at 850 nm is low, which is favorable to low-cost, portable sensing applications. Moreover, low-RI polymers, such as CYTOP (Asahi) or Teflon (Dupont) are commonly adopted as cladding materials for LRSPP waveguide sensors [14,15,16], because these materials have an RI that is close to water (n~1.33). Due to the requirement for LRSPP mode symmetry, high-RI sensing is difficult to implement with low index polymer claddings. Alternatively, the ultraviolet (UV) cured polymer SU-8 has a high RI (n~1.574) and has been used in the construction of SPP waveguides [17,18,19,20]. Its good physicochemical characteristics allow flexible designs and easy fabrication of LRSPP waveguide sensors, which work better for the detection of chemical reagents or mixtures detection with RIs over 1.5.
In this work, an RI sensor based on straight LRSPP waveguides operating at 850 nm is theoretically investigated. The impact of gold stripe geometric parameters on the single-mode cut-off condition, attenuation, and coupling loss are analyzed in detail. The bulk sensitivity of the proposed straight LRSPP waveguide sensor is calculated. A double layer lift-off process is adopted to fabricate LRSPP waveguides cladded by SU-8. Optical transmission measurements prove that refractometers based on LRSPP waveguides operating at 850 nm are feasible.
2. Sensor Structure
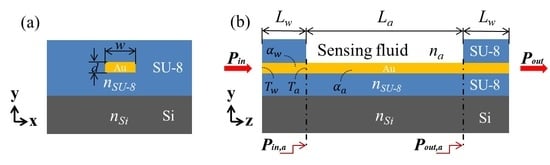
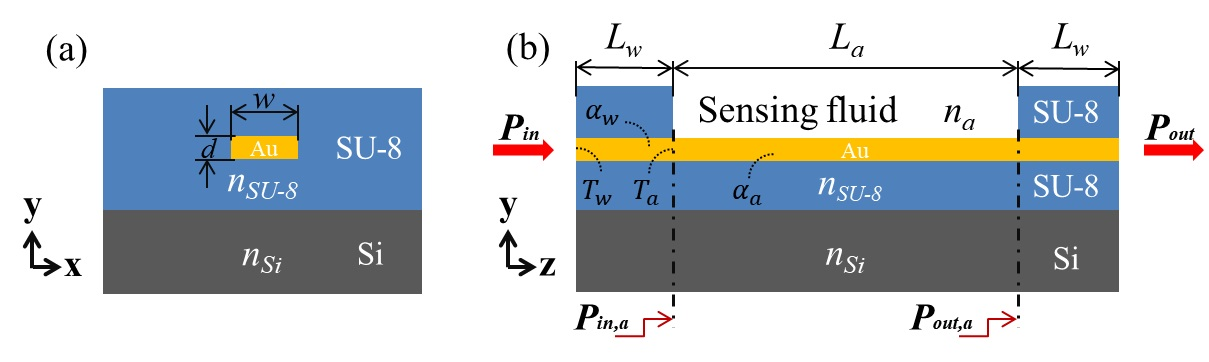
The proposed straight LRSPP waveguide RI sensor is shown in Figure 1a. A straight Au stripe of width w and thickness d is embedded in an SU-8 cladding. The Si wafer acts as the substrate to support the whole structure. The thickness of the upper and bottom cladding is 5 μm (each cladding). Figure 1b shows a longitudinal view of the proposed device. The fluidic channel of length La is formed on the surface of the Au stripe by dissolving unexposed SU-8 in its developer. During sensing, the fluid of RI na, which is close to that of the SU-8 cladding, flows through the channel. RI changes in the sensing solution above the Au stripe in the sensing section results in changes in the output optical power. At the operating wavelength of 850 nm, the RI of SU-8 (nSU-8) and silicon (nSi) are 1.574 and 3.643 + j0.00329, respectively [20]. The relative permittivity of Au at the wavelength of interest is −29.36 − j1.394 (which corresponds to a RI of 0.1286 + j5.420) [21]. The refractive index of the sensing solution in the fluidic channel ranges from 1.562 to 1.586, which is close to nSU-8, ensuring low-loss propagation of LRSPP mode.
3. Design and Optimization
3.1. Single-Mode LRSPP Waveguide
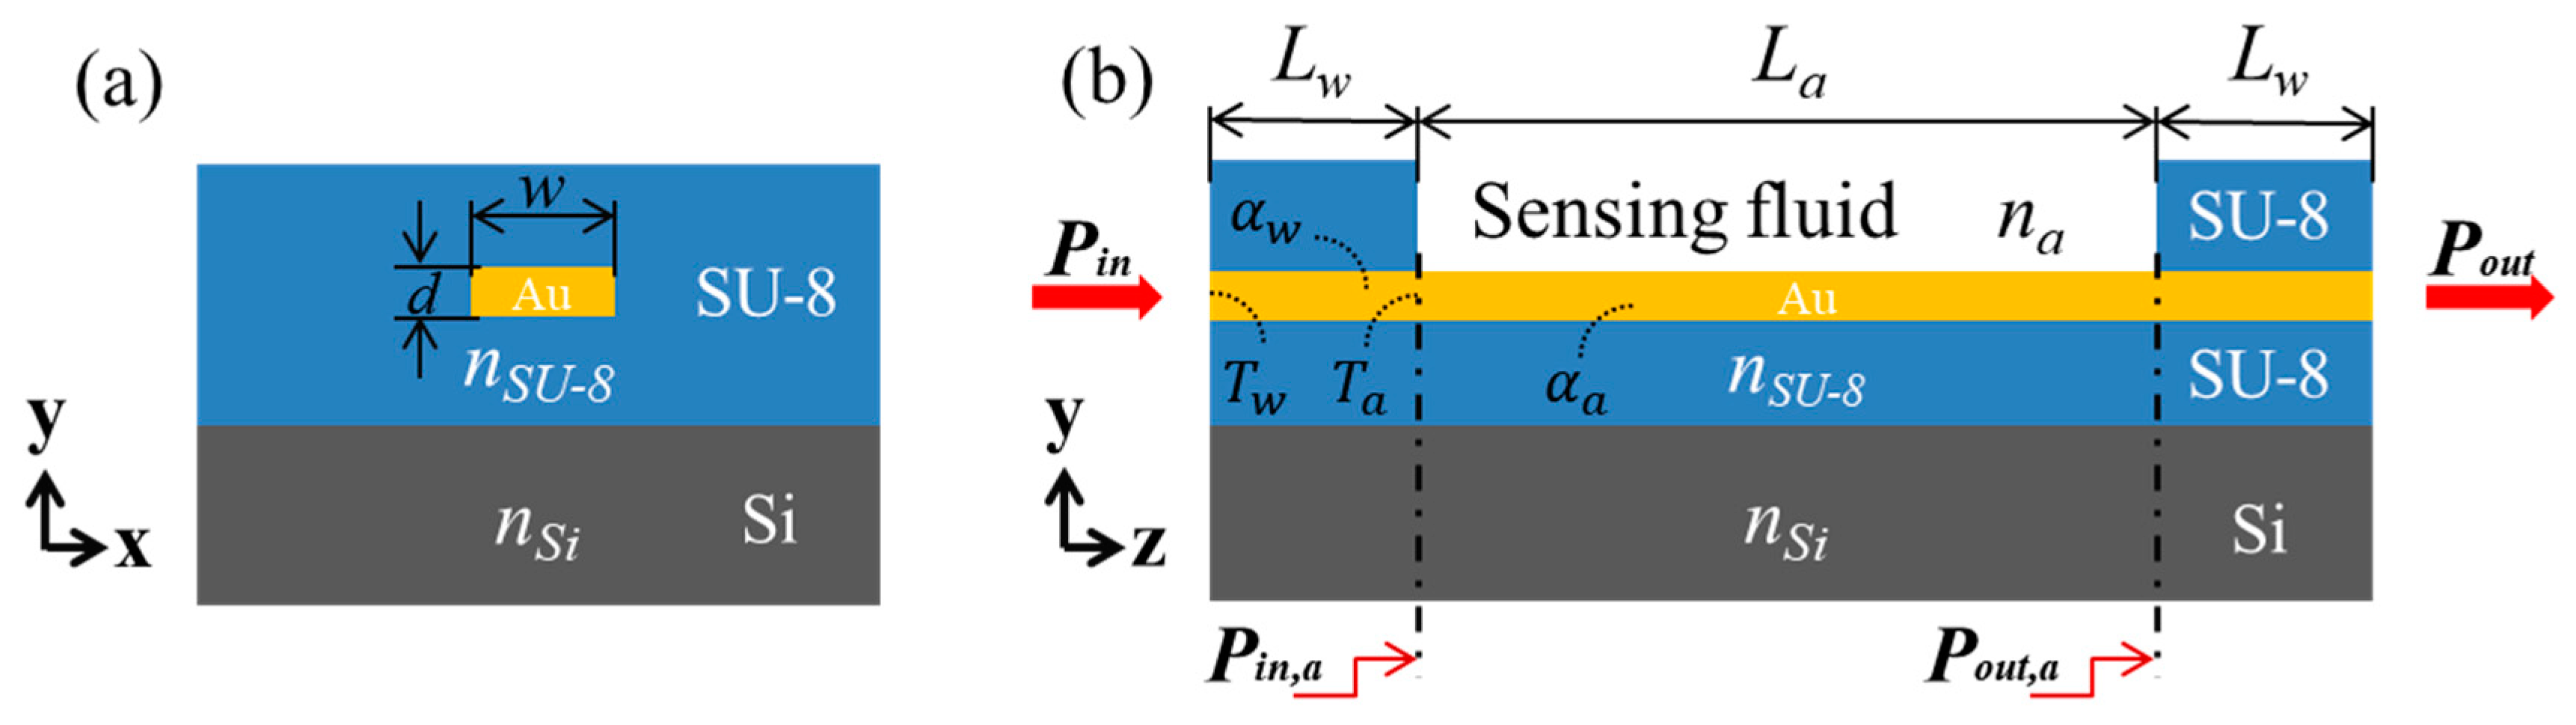
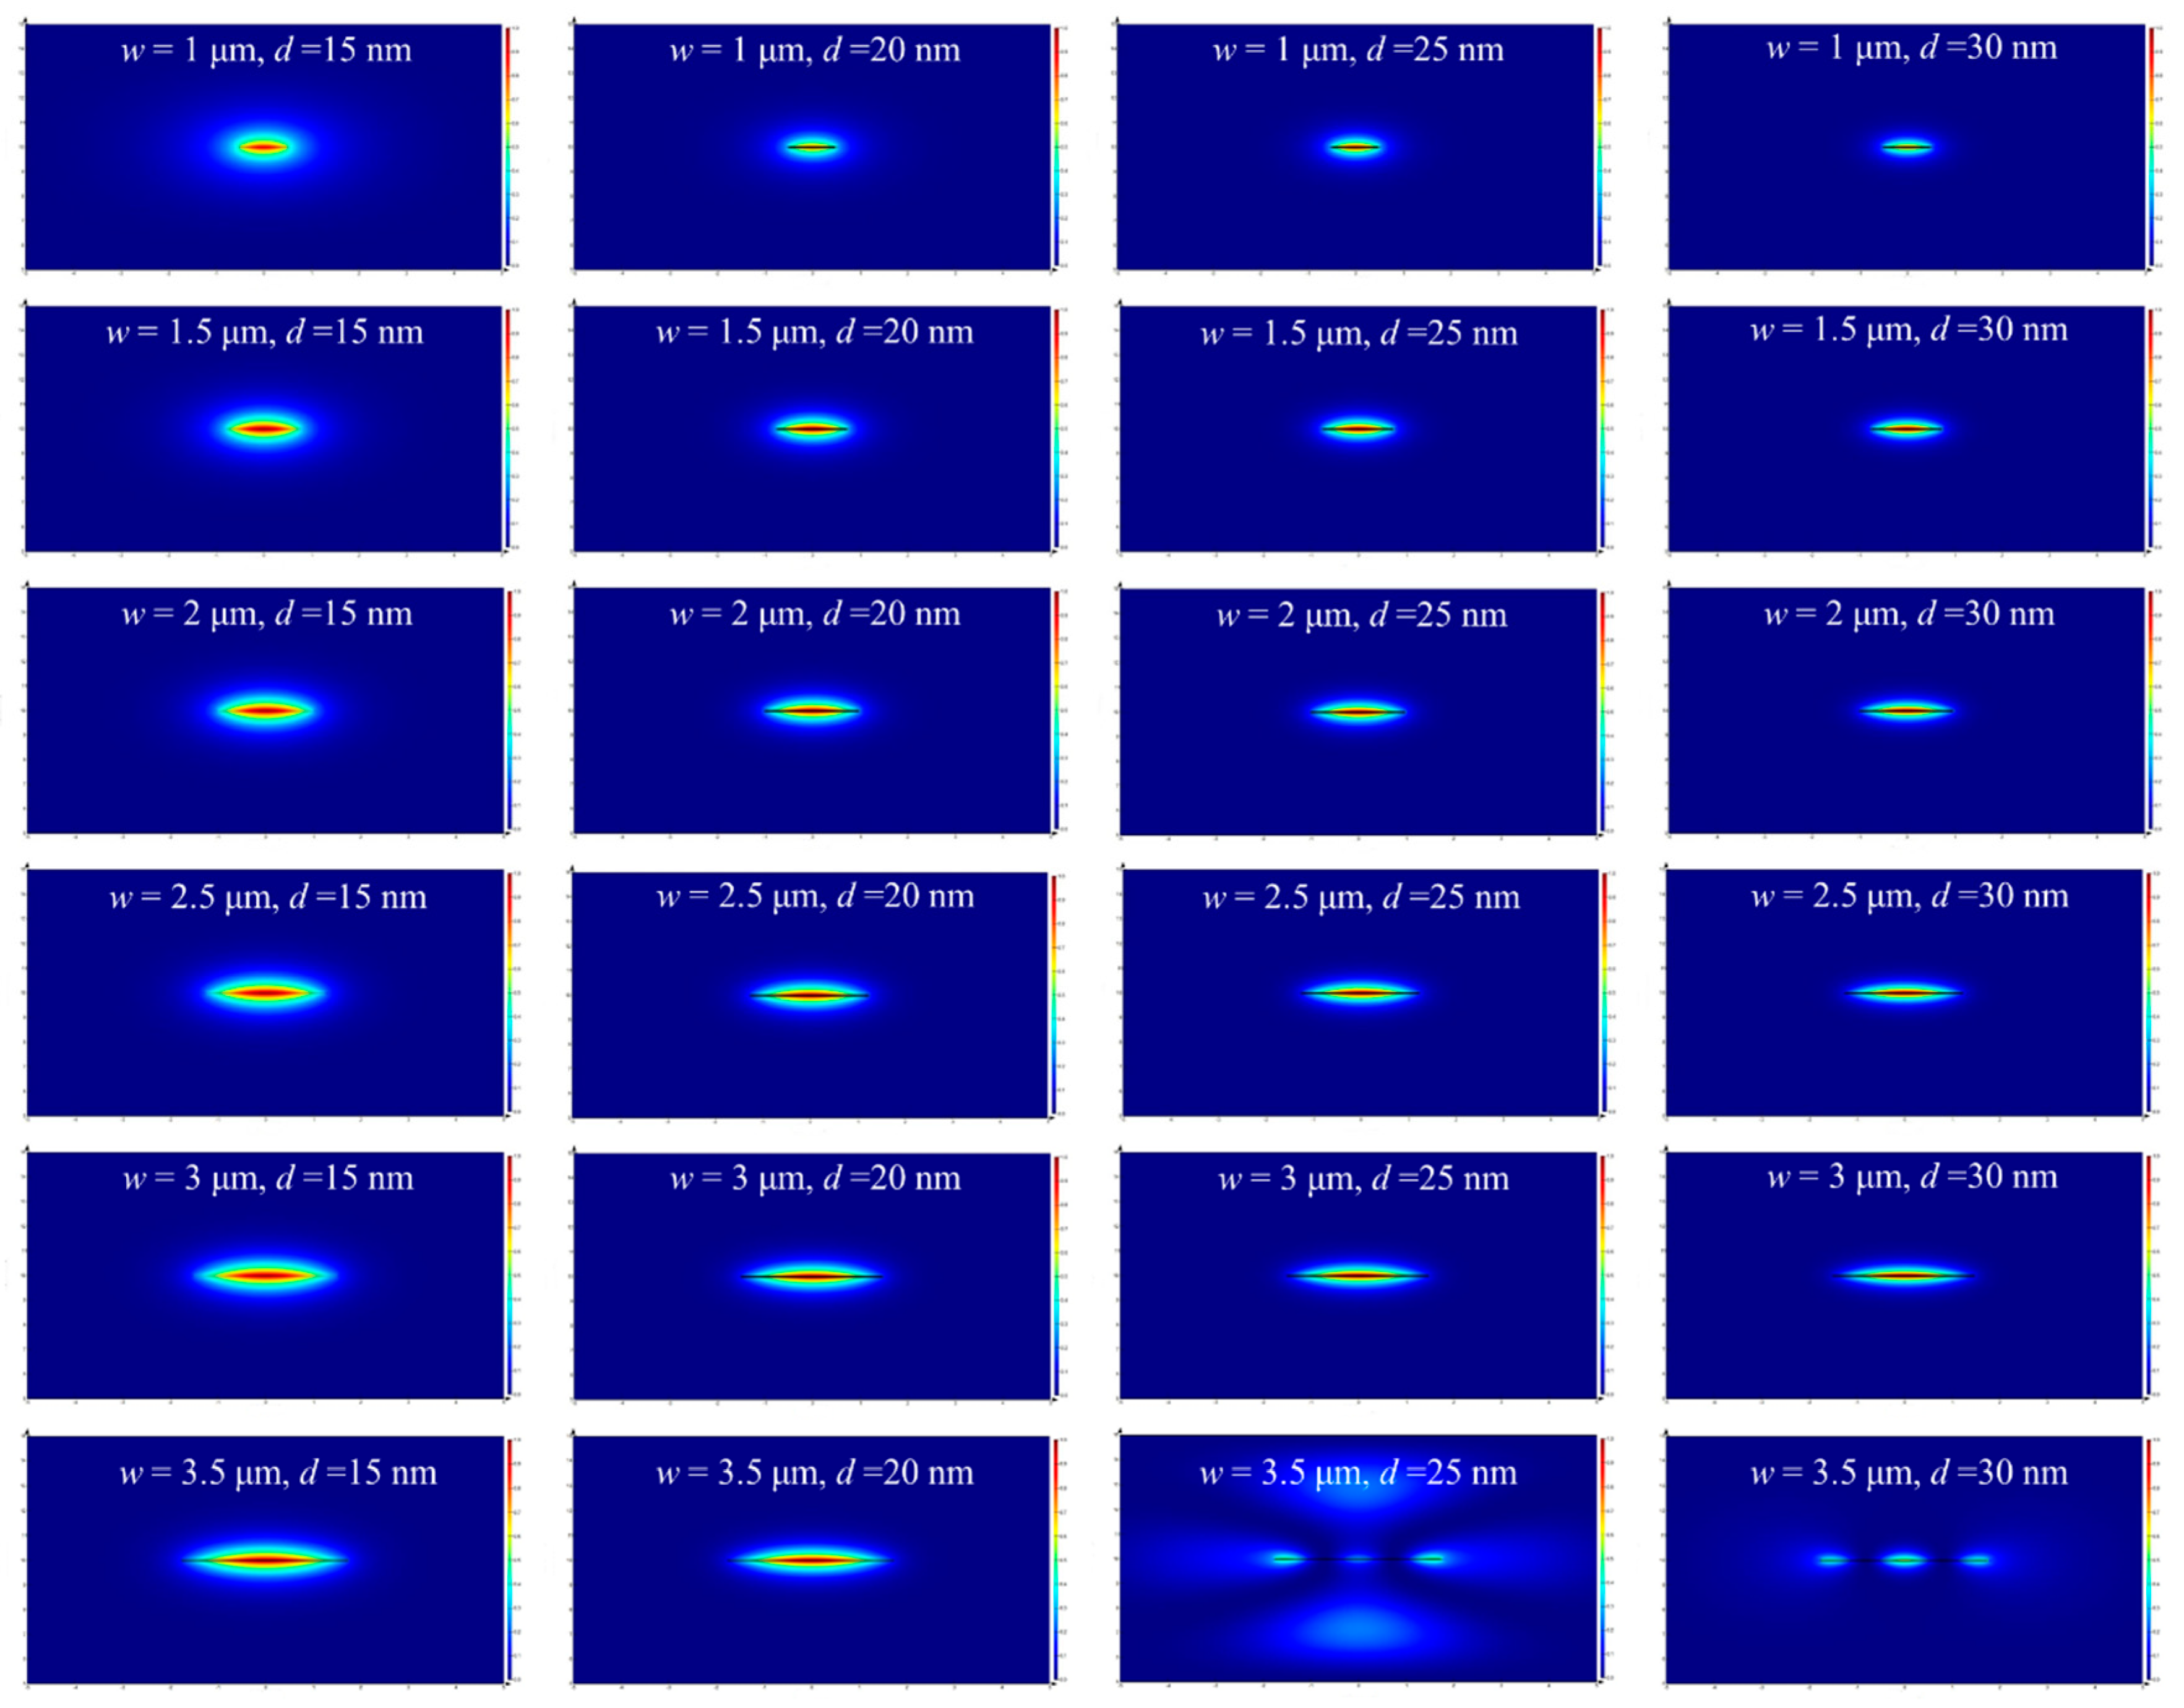
Appropriate mode confinement and a controllable attenuation are desirable for favorable sensing performance [22]. The geometric parameters of a straight single-mode Au stripe waveguide must be determined by computing the LRSPP mode properties numerically, and adjusting the geometry until suitable performance is achieved, at the operating wavelength of 850 nm. Here we used the finite-difference eigenmode method (FDE). The spatial distribution of the electric field of the LRSPP mode is shown in Figure 2 for the case where the sensing solution (upper cladding) was index-matched to SU-8 (lower cladding); i.e., the RIs of SU-8 and na were both 1.574, which resulted in symmetric RI distribution as a fully cladded case. Better mode confinement was observed as the width and thickness of the Au stripe increased; however, the propagation loss also increased with these dimensions. For different Au stripe thicknesses of d = 15, 20, 25, and 30 nm, the fundamental LRSPP mode is the only long-range mode supported when the Au stripe width w is smaller than 3 μm. As shown in Figure 2, for the case of w = 3.5 μm, d = 15 and 20 nm, the fundamental LRSPP mode is still the only long-range mode supported. When d = 25 and 30 nm, the high-order modes with mode power attenuations (MPAs) of 11.89 and 20.23 dB/mm, respectively, will be supported by the Au stripe. Though high-order mode sensing can be applied in dielectric-based photonic RI sensors [23,24,25], for this metal-based plasmonic RI sensing application, the analyte should be tested at the same mode condition, to avoid the interference of mode crosstalk. Therefore, the Au stripe width was chosen to be smaller than 3 μm in the following design.
3.2. Attenuation
As mentioned above, FDE was adopted to compute the modal properties of the LRSPP. Assuming that the LRSPPs propagate along the +z direction, the propagation constant γ can be written as α + jβ. Here α and β represented the attenuation and phase constant, respectively. The LRSPPs propagated along the input and output access waveguides (Lw) (both were embedded in SU-8), and the sensing waveguide section (La) in the +z direction, as shown in Figure 1. The optical power output emerging from the full structure (embedded and fluidic sections) can be expressed as
where Pin and Pout are the powers incident on the waveguide input facet and output from the waveguide, respectively, αw and αa are the mode field attenuation constants of the fully cladded and fluidic waveguides, respectively, Tw is the transmittance from the optical fiber mode to the LRSPP at the input facet, and Ta is the transmittance between the LRSPP mode in the sensing channel and that in the fully cladded waveguide. The mode power attenuation (MPA) in dB/mm of the LRSPP waveguide in access and sensing sections can be computed by
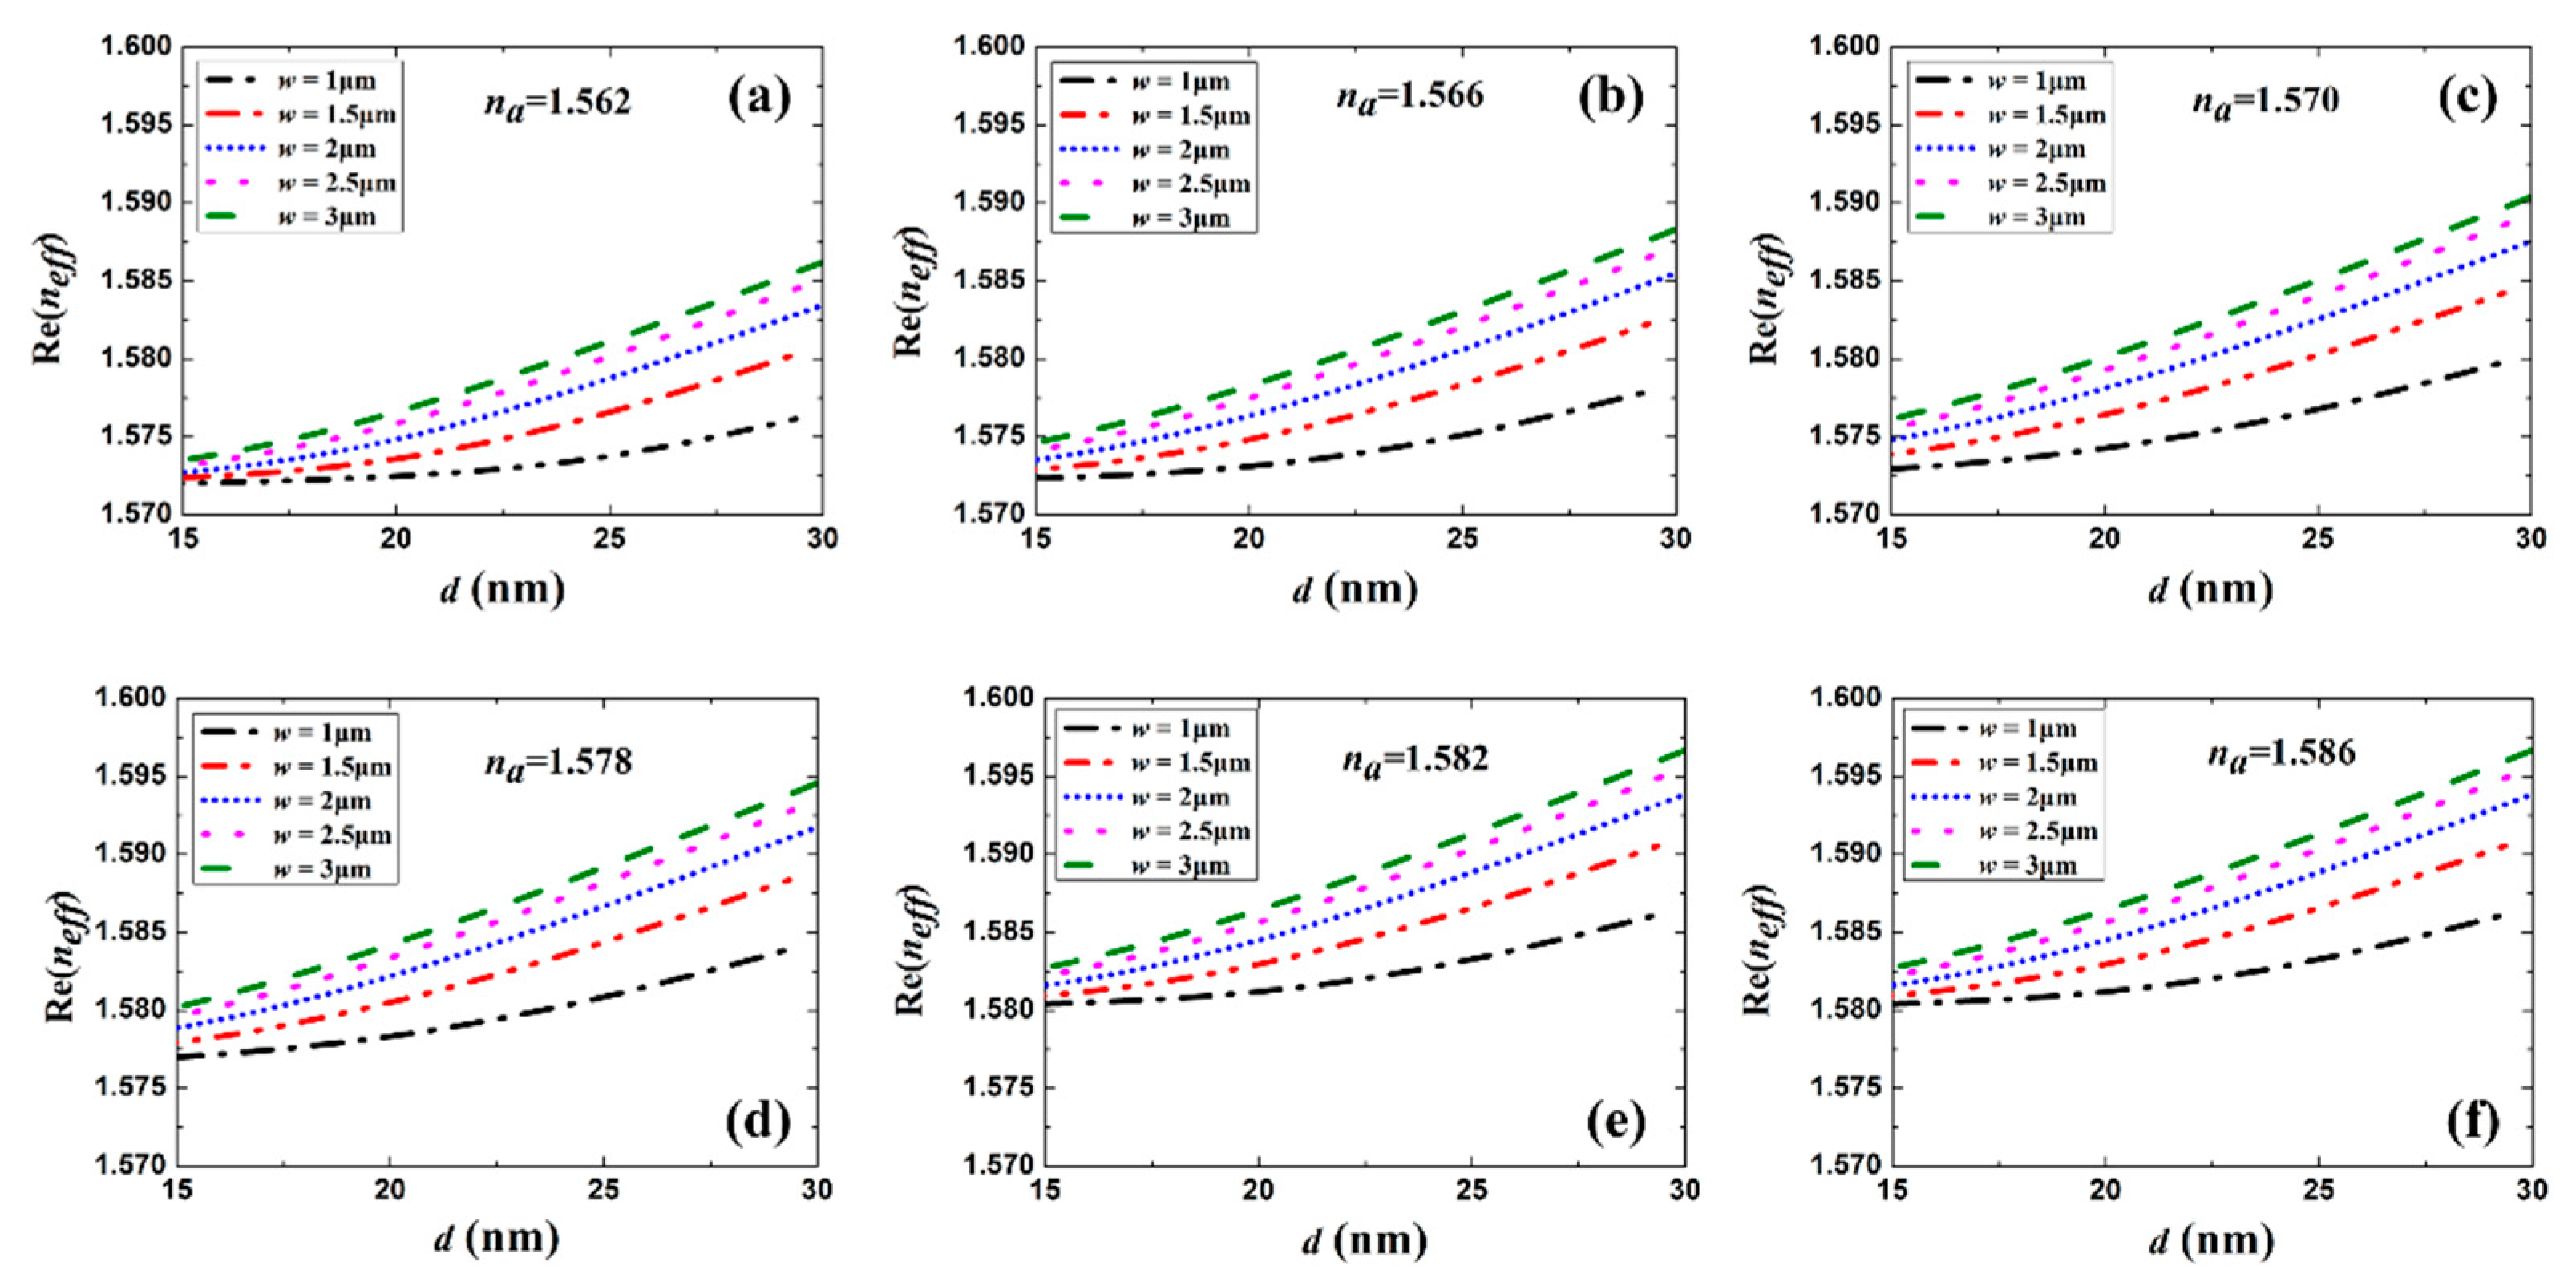
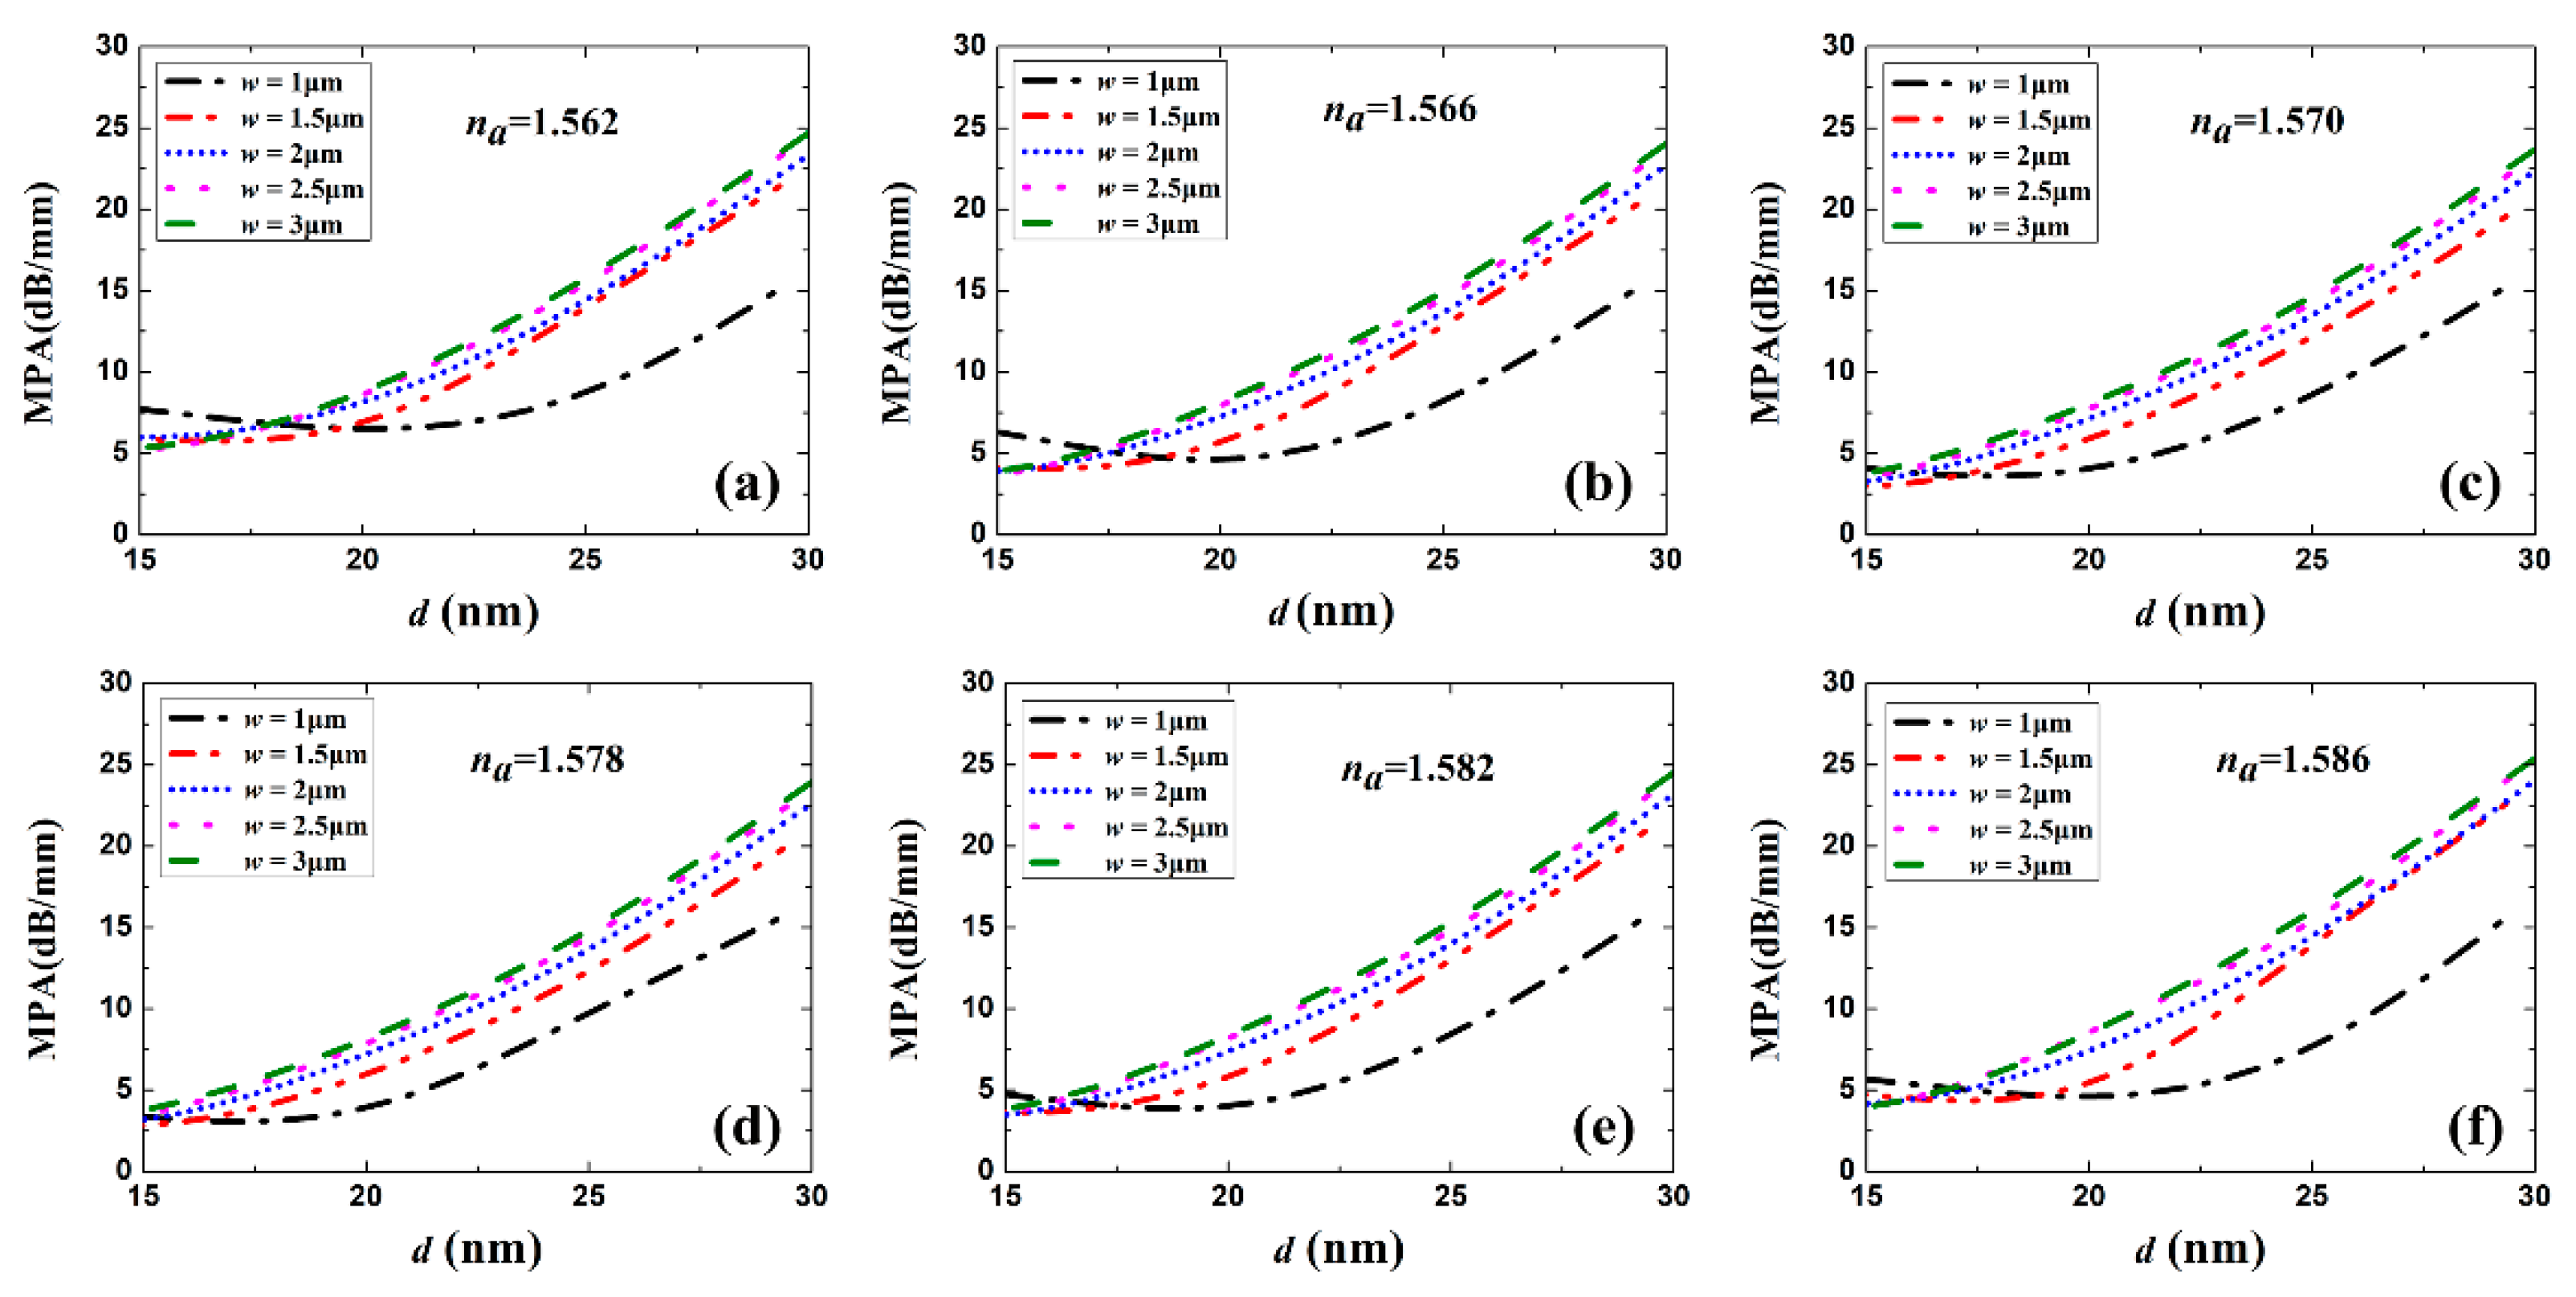
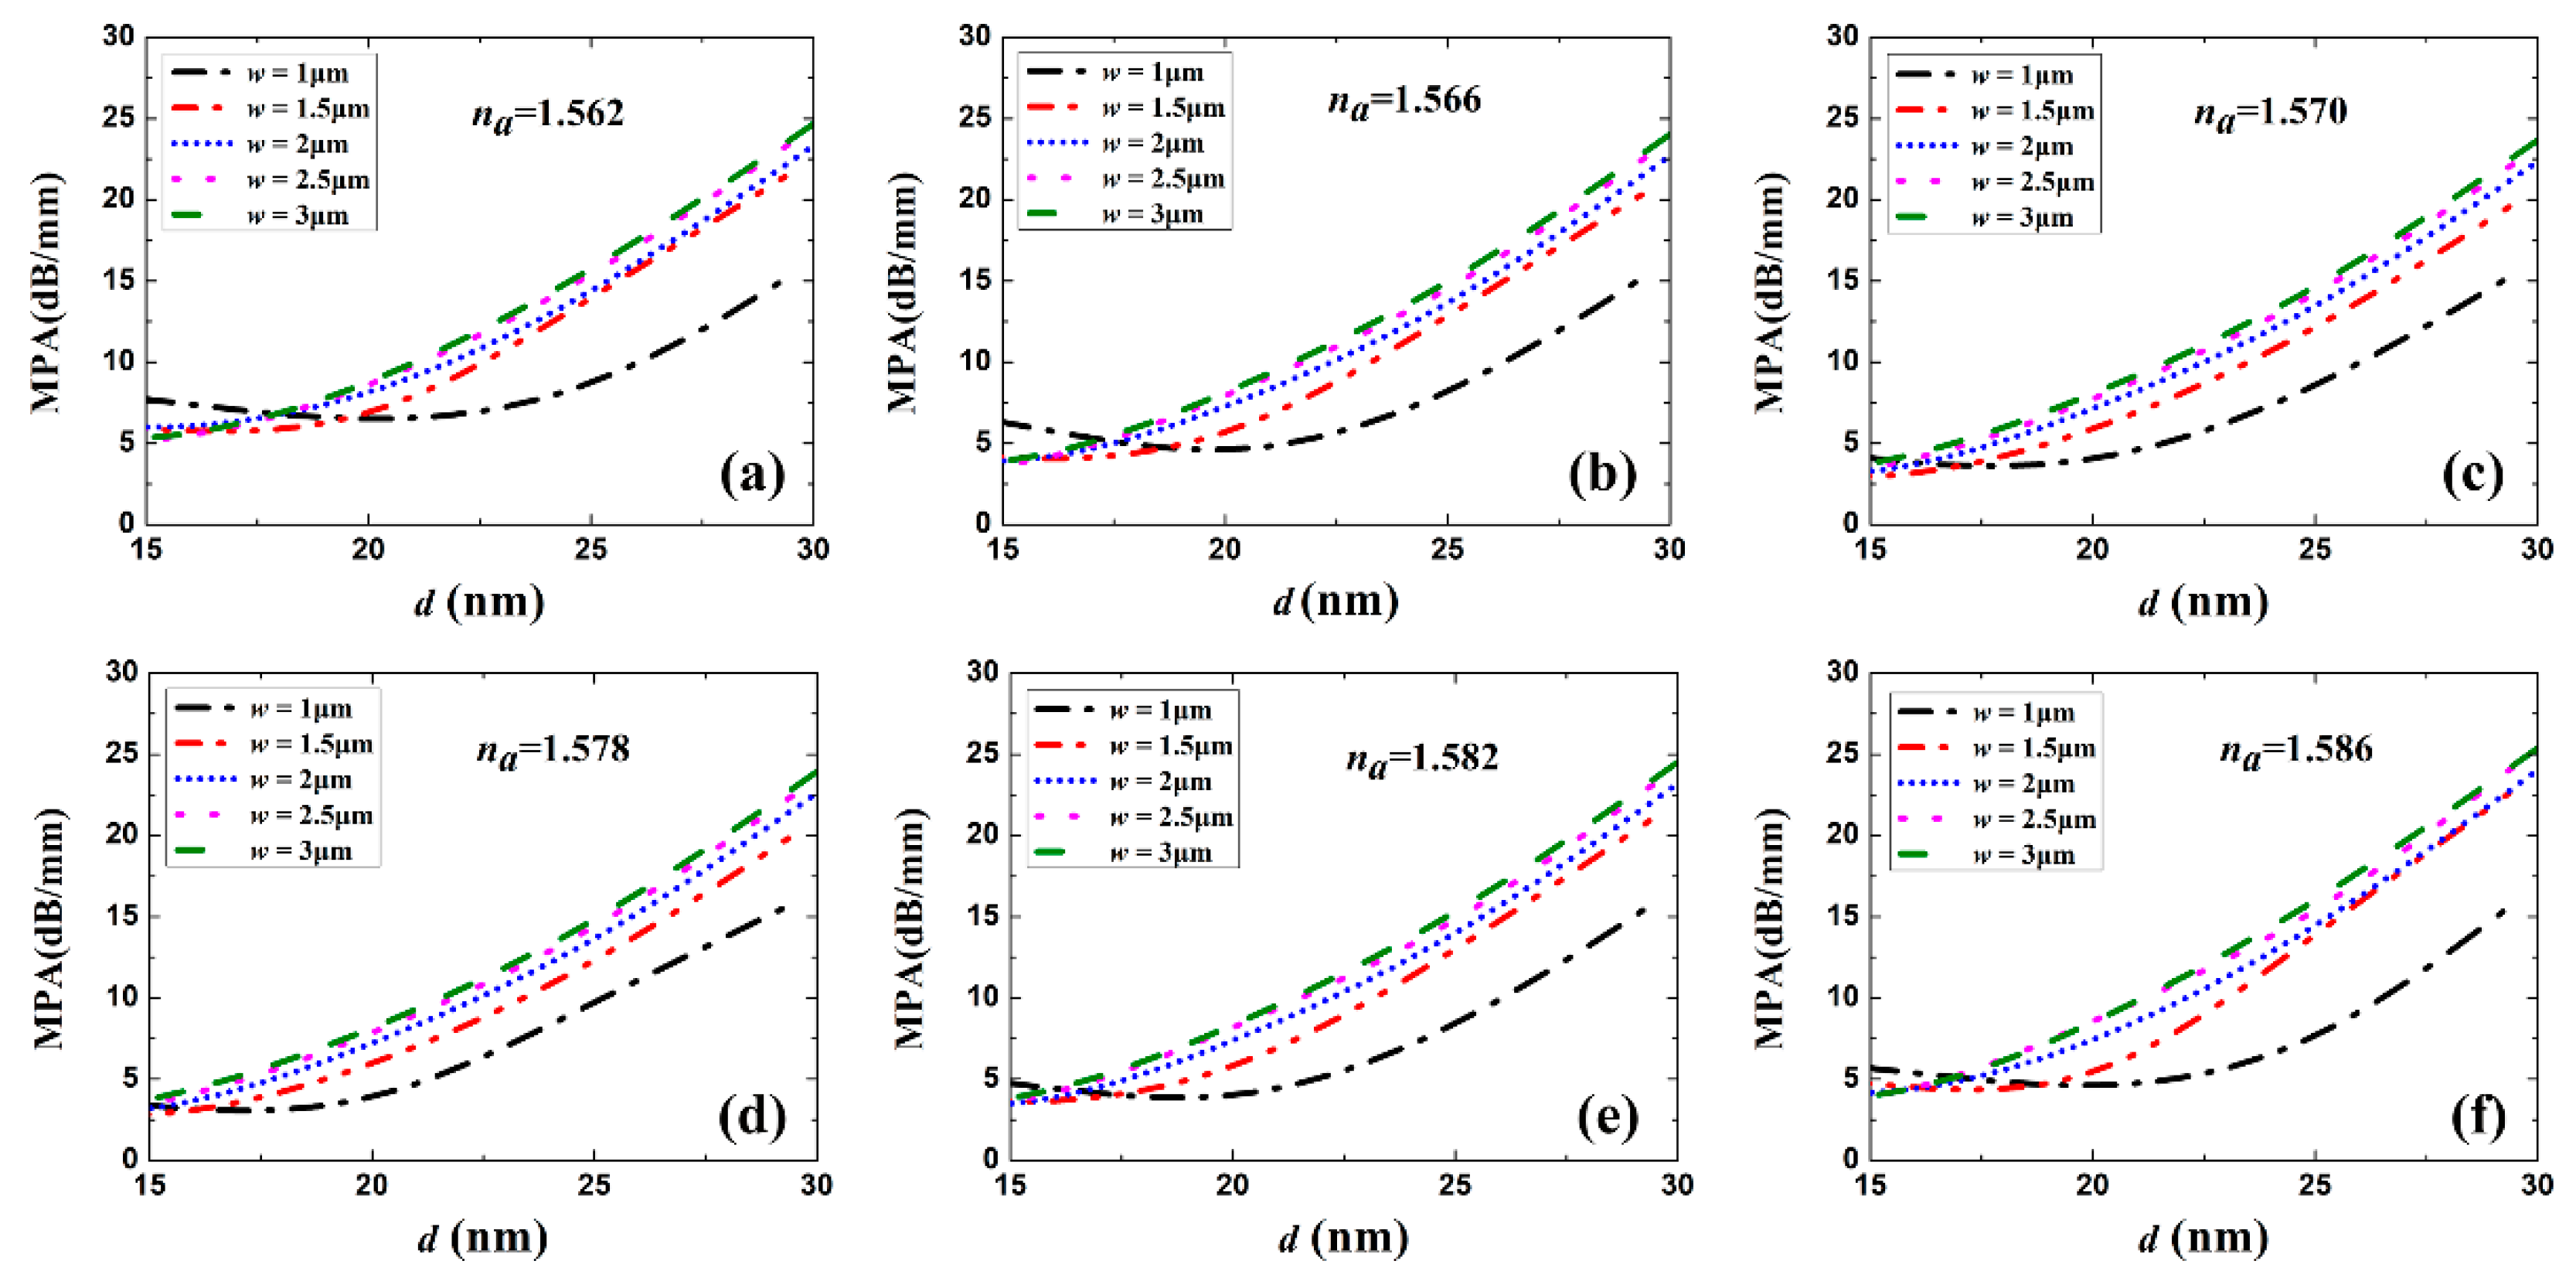
Figure 3 and Figure 4 show the real part of neff (Re(neff)) and the MPA vs. Au stripe thickness d for different stripe widths and sensing solution RI, respectively. Generally, Re(neff) and MPA increased with Au stripe thickness and width, which is in accordance with LRSPP theory that thicker and wider metal stripes imply tighter mode confinement and higher loss [3]. When w = 1 μm, a dip appears in the MPA vs. d curves, which differs in character from the continuous increase in the MPA for the cases w = 1.5 and 2 μm. This is explained by the weaker LRSPP confinement for the case w = 1 μm and d = 15 nm. The asymmetric mode field extends more into the high-index Si substrate in this case, resulting in a higher MPA. With the increase in Au stripe thickness, the increasing mode field confinement reduced the loss caused by the Si substrate. However, thicker stripes had a higher propagation loss. Therefore, there exists a balanced thickness and a minimum MPA.
3.3. Coupling Loss
The coupling loss in this sensor includes the loss at the interface between the input fiber and the access LRSPP waveguide (CLw), as well as the loss at the interface between the cladded and fluidic waveguide (CLw). These losses can be expressed as:
where the transmittances Tw and Ta are given by the squared magnitude of the mode field overlap factors computed using the FDE method, following [26] (neglecting Fresnel loss due to material discontinuity). Then, the coupling loss CLa of one facet can be computed vs. Au stripe thickness d for different widths w and different sensing fluid RI, as shown in Figure 5. When the RI of the sensing fluid takes on the values of na = 1.562, 1.566, 1.570, 1.578, 1.582, and 1.586, the symmetry of the structure is perturbed, increasing the coupling loss. For all cases of w and na considered, CLa decreases with increasing d, up to the maximum considered (d = 30 nm), as the confinement of the LRSPP increases. There is no coupling loss (CLa = 0) for na = 1.574 because the RI of the sensing solution is matched to the SU-8 cladding. When the RI of sensing fluid is lower or higher than that of SU-8, the coupling loss increases due to the distortion of waveguide RI symmetry. When w is larger than 1.5 μm, CLa changes little when the Au stripe thickness is over 20 nm, which is meaningful for waveguide geometry optimization. As shown in Figure 4 and Figure 5, when d is larger than 20 nm, a low CLa and MPA are expected for w = 1.5 μm. Therefore, the waveguide w is set to 1.5 μm in what follows.
3.4. Sensing Length
As has been reported, the sensing length La is key to sensor performance [27]. The optimized sensing length can be obtained from the insertion loss (IL) in dB, expressed using Equations (1)–(5) as:
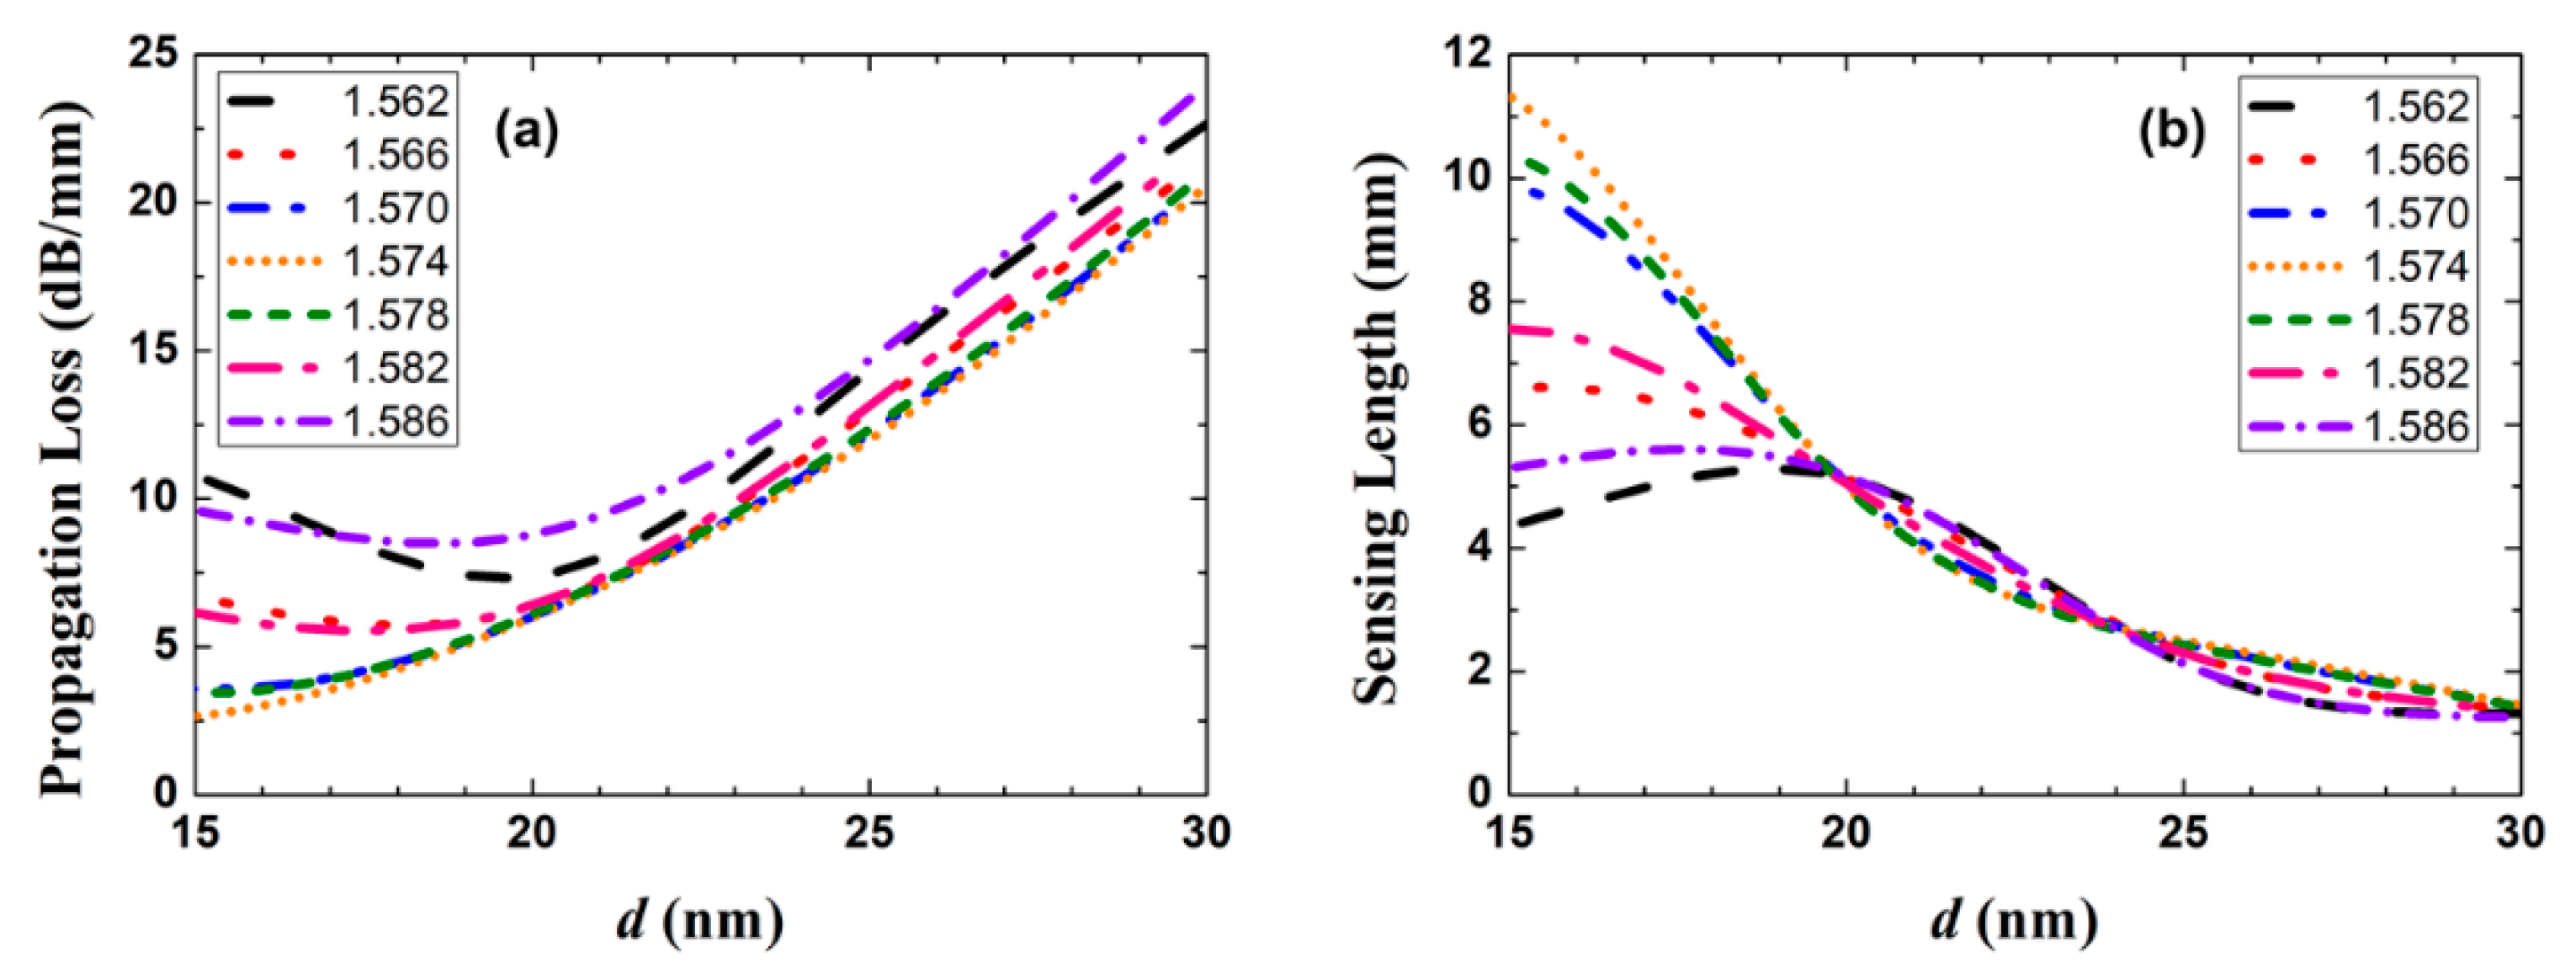
Theoretically, a longer sensing length gives a larger output power change for the same analyte. However, the impact of background noise and performance of optical power meter determine an upper limit for the insertion loss of the fluidic section, say, MPAaLa = 30 dB [28]. We then plot in Figure 6 the propagation loss (MPAa) and the corresponding sensing length (La) as a function of Au thickness d for different RI (setting w = 1.5 μm, as mentioned above). As shown in Figure 6a, when na is close to nSU-8, MPAa increases linearly with d. The existence of a minimum MPAa around d = 20 nm for na = 1.562, 1.566, 1.582, and 1.586 can be explained by the mode field distortion and loss induced by the high-index Si substrate. When d is larger than 20 nm, the propagation loss increases with the Au film thickness for different na, which is in accordance with the theoretical prediction in Section 3.2. As shown in Figure 6b, except for na = 1.562 and 1.586, La decreases with increasing d for d > 20 nm. Considering Figure 4, Figure 5 and Figure 6, the propagation loss trades off against the coupling loss and the sensing length—in order to have a compact sensor, d is selected to be 25 nm as a compromise.
4. Results and Discussion
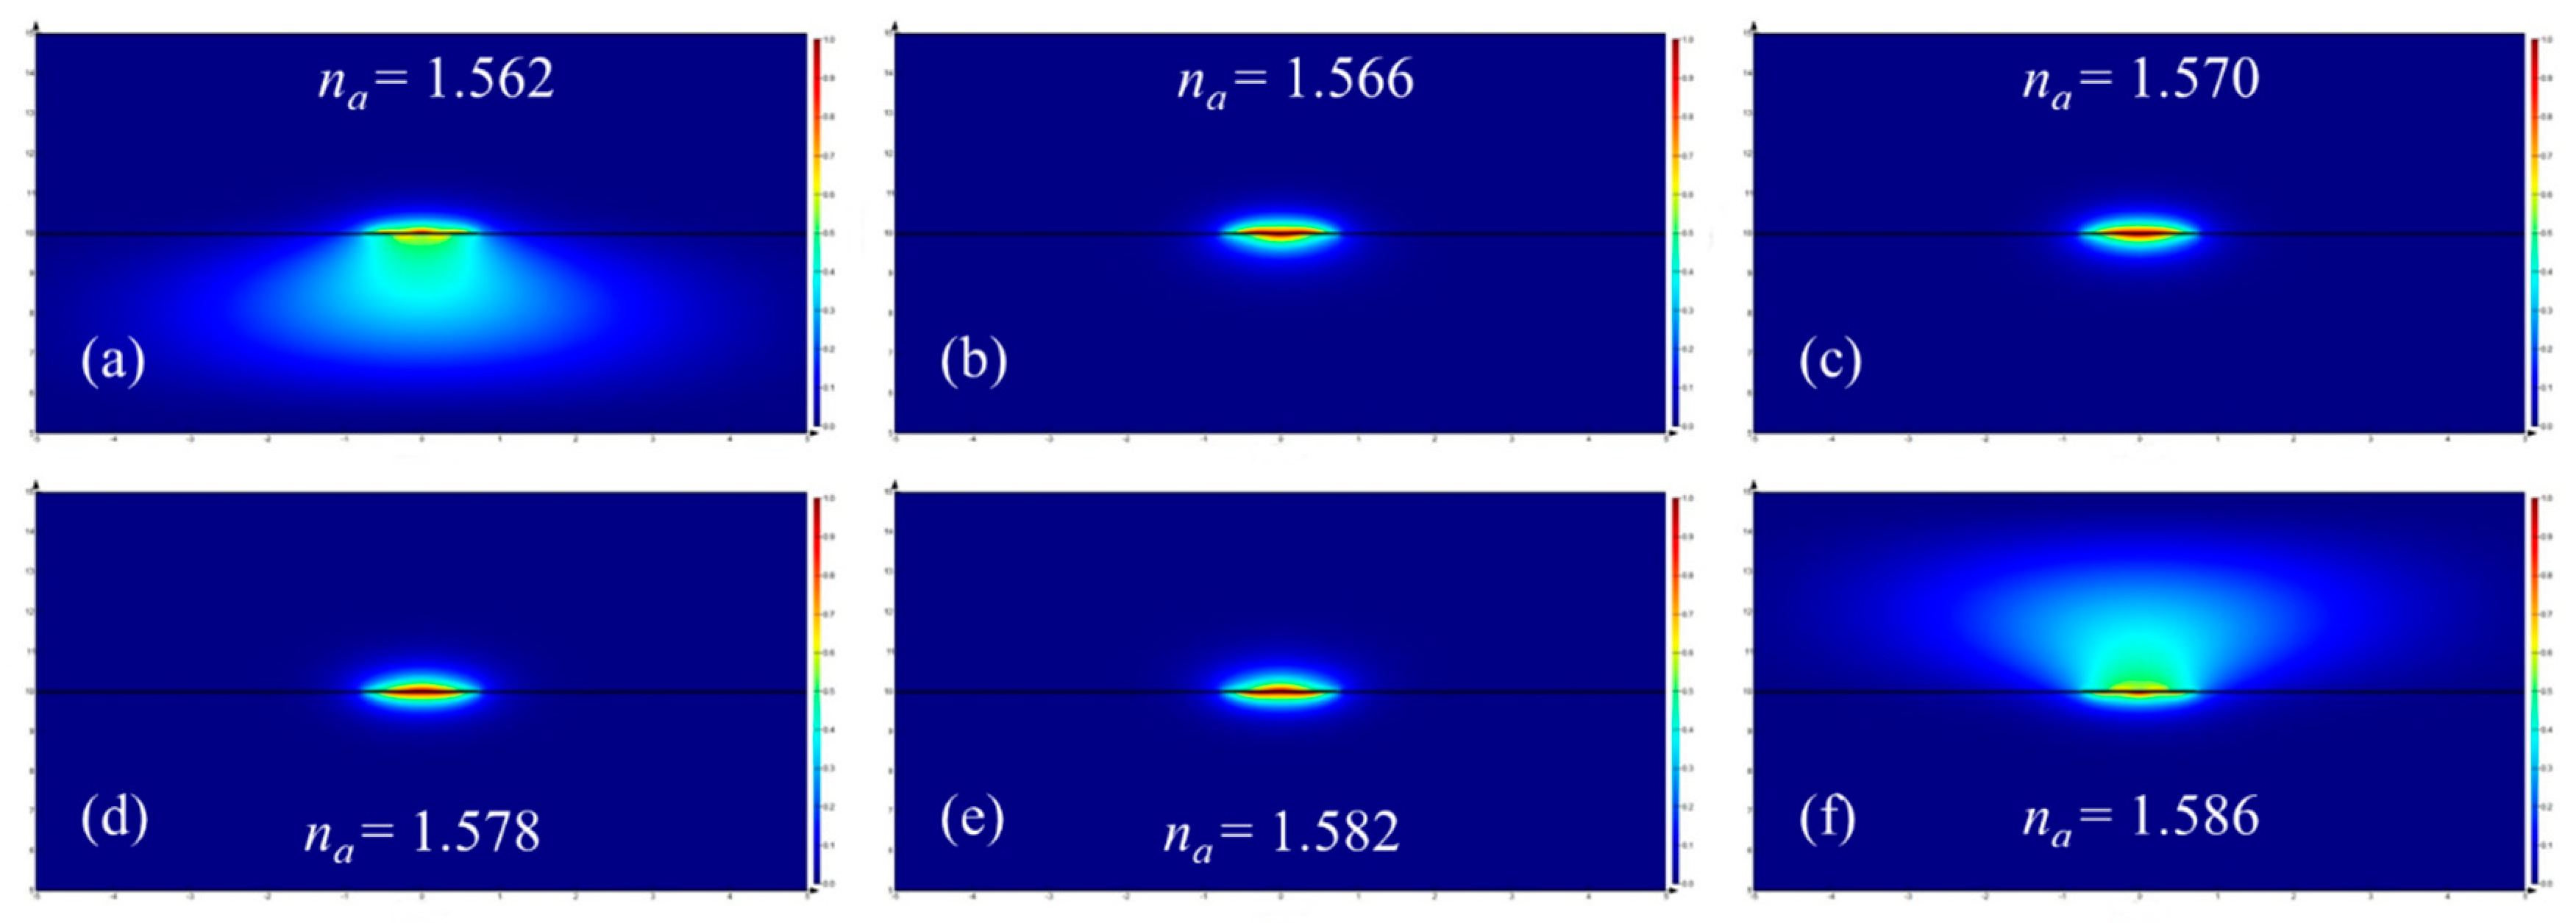
For bulk sensing, the output power of a straight fluidic waveguide with its channel filled with a standard RI fluid can be measured. The sensitivity can be obtained from the plot of Pout vs. standard RI and the slope obtained by linear fitting to the measured data. When the width and thickness of the Au stripe are 1.5 μm and 25 nm, respectively, the distribution of the vertical transverse electric field component (Ey) of the fundamental LRSPP is plotted in Figure 7 for different RI of the sensing fluid. When a fluid satisfying na < nSU-8 = 1.574 fills in the fluidic channel, the mode field distribution becomes slightly asymmetric, spreading into the SU-8 cladding, because of the mismatch of RI. For a sensing fluid satisfying na = nSU-8 filling the fluidic channel, the structure becomes symmetric, and the mode is identical to that in a fully cladded waveguide, exhibiting a mode field distribution that is symmetric. For the case of a sensing fluid satisfying na > nSU-8, the mode profile becomes increasingly asymmetric, spreading into the fluidic channel. Both asymmetric cases support LRSPPs that have a higher MPA than in the symmetric case.
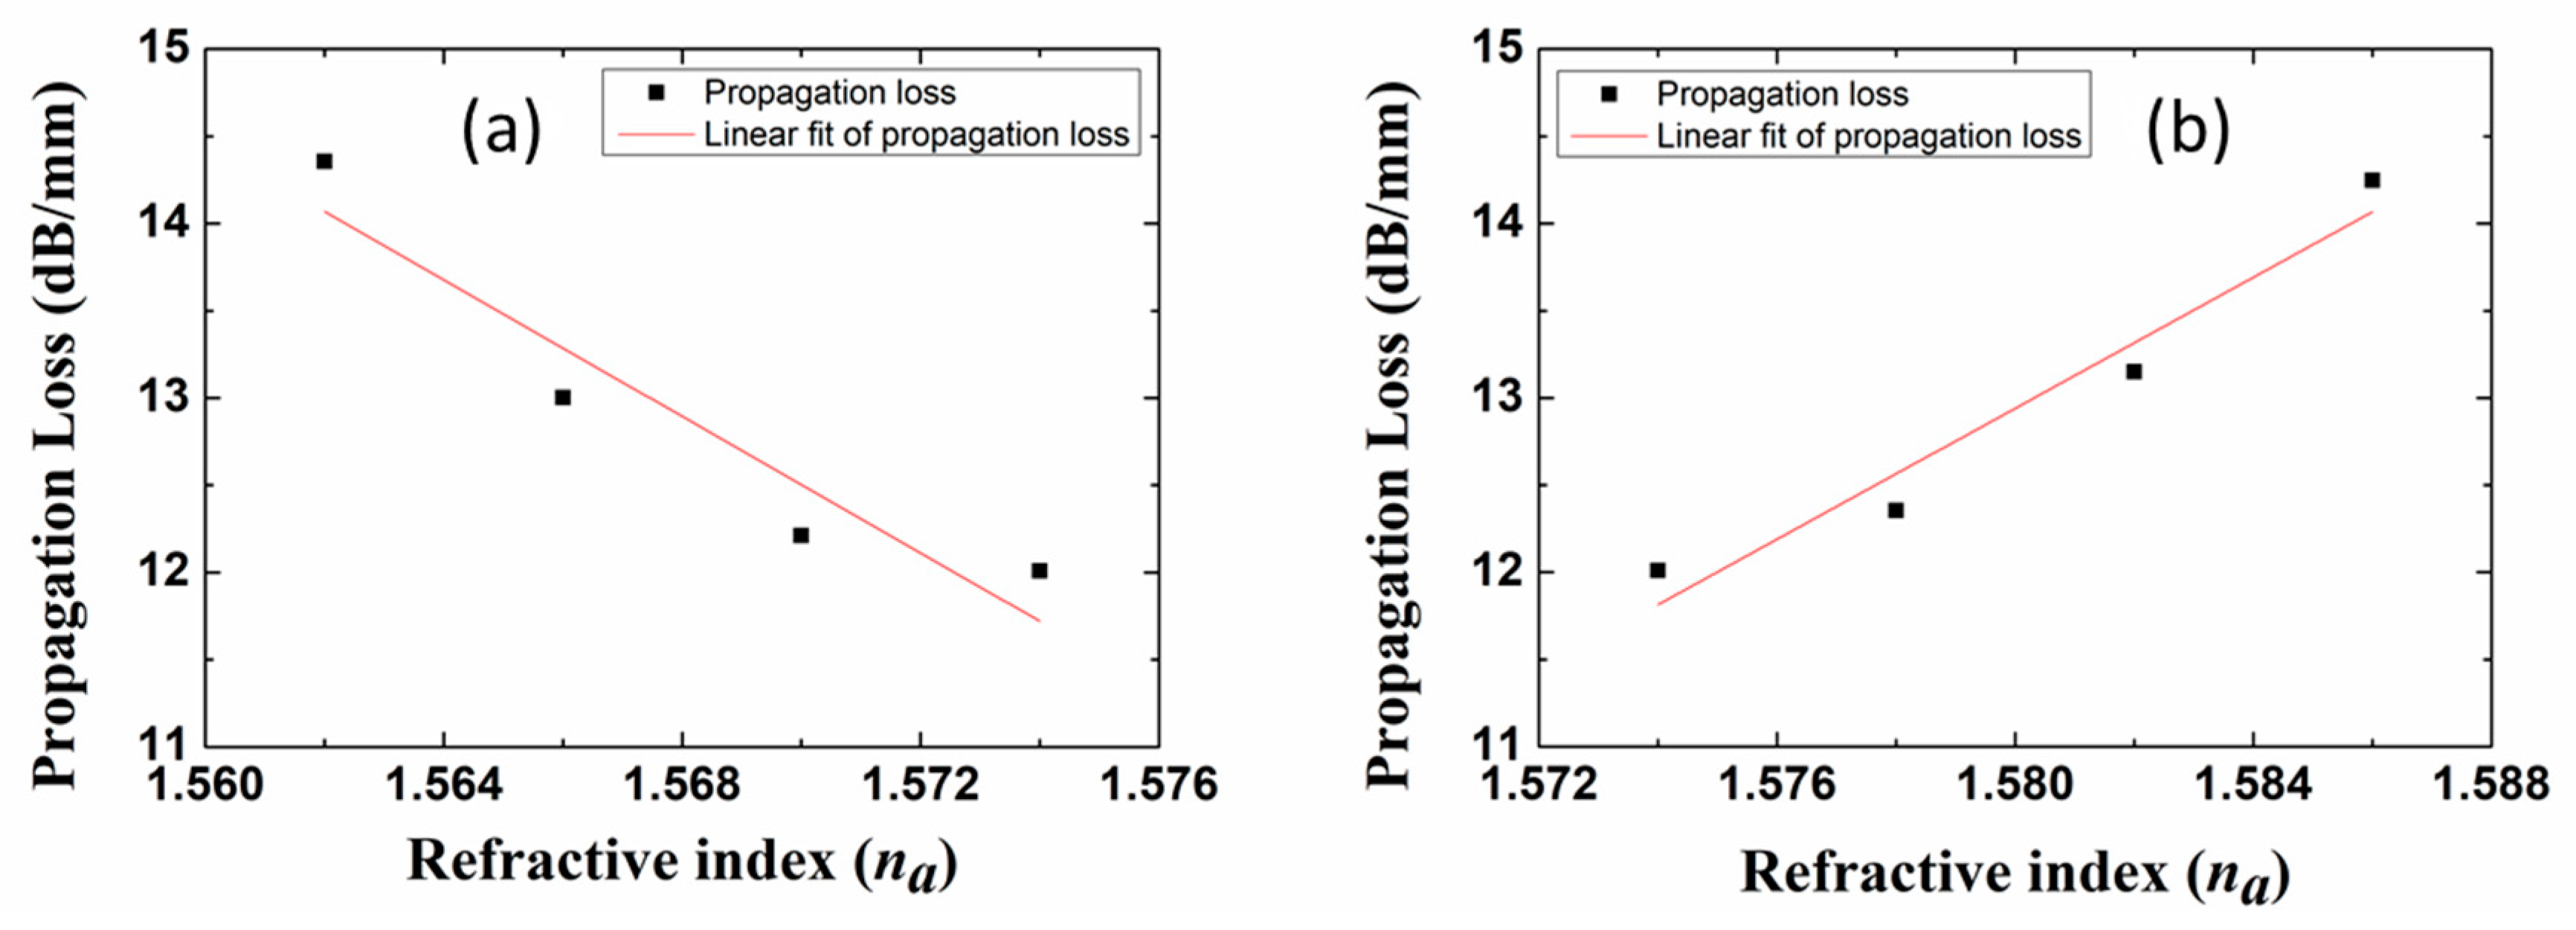
The propagation loss (MPAa) as a function of the RI of the fluid in the sensing channel is calculated and plotted in Figure 8. We observe that the sensor exhibits different sensitivities whether na is smaller (Figure 8a) or larger (Figure 8b) than nSU-8. In Figure 8a, the propagation loss increases with decreasing fluid RI, due to increasing mode field asymmetry (fields extending into the lower SU-8 cladding). In Figure 8b, the propagation loss increases with increasing fluid RI, also due to increasing mode field asymmetry (fields extending into the fluidic channel). According to the definition of bulk sensitivity S
sensitivities of 196 dB/RIU/mm and 188 dB/RIU/mm are deduced from Figure 8a,b, respectively. As shown in Figure 7, the slight sensitivity difference is induced by asymmetric mode field distribution and the Si substrate absorption when na < nSU-8.
To better illustrate the relationship between the mode field distribution and the sensing performance, the fundamental mode power distributions in SU-8, Au-stripe, and the analyte are calculated at w = 1.5 μm, d = 25 nm. As shown in Table 1, less than 0.05% fundamental mode power distributes in the Au core, because LRSPP mode is a surface wave, and hardly penetrates into the metal. Most power distributes in surrounding dielectrics, which is in favor of the analyte detection. Since the mode field extends deeper into the dielectric, that has a higher RI, mode power in SU-8 is larger than that in the analyte, when na < nSU-8. In addition, the asymmetry of power distribution, as well as the propagation loss, deteriorates with the progress of RI asymmetry between the upper and lower claddings. This rule also works at other Au stripe dimensions. According to LRSPP waveguide theory, better mode confinement implies less mode field spreading into the dielectric, accompanied by higher propagation loss. For sensing application, the larger the power ratio in the Au core, the higher the sensitivity that can be obtained under the same RI step variation. However, MPA increases with the improvement of sensitivity. Therefore, the compromising Au stripe dimensions of w = 1.5 μm and d = 25 nm are selected to offer the best sensitivity of 196 dB/RIU/mm.
To better evaluate the performance of the proposed sensor, we quantitatively compare the performance of the proposed sensor to those of traditional optical fiber sensors and SPP-based RI sensors. Due to the intrinsic characteristic diversity, the RI range and sensitivity of these RI sensors are inconsistent with each other. Therefore, it is hard to evaluate the performance of sensors under the same condition. Nevertheless, we try to make the comparison in terms of bulk RI sensitivity, figures of merit, and working wavelengths. As shown in Table 2 below, the proposed straight LRSPP waveguide sensor shows the highest RI detecting range, as well as the simplest structure. To be noted, compared with the experimental results in References [29,30,31,32,33,34], the data in this work is theoretically proved.
5. Experiment
5.1. Sensor Fabrication
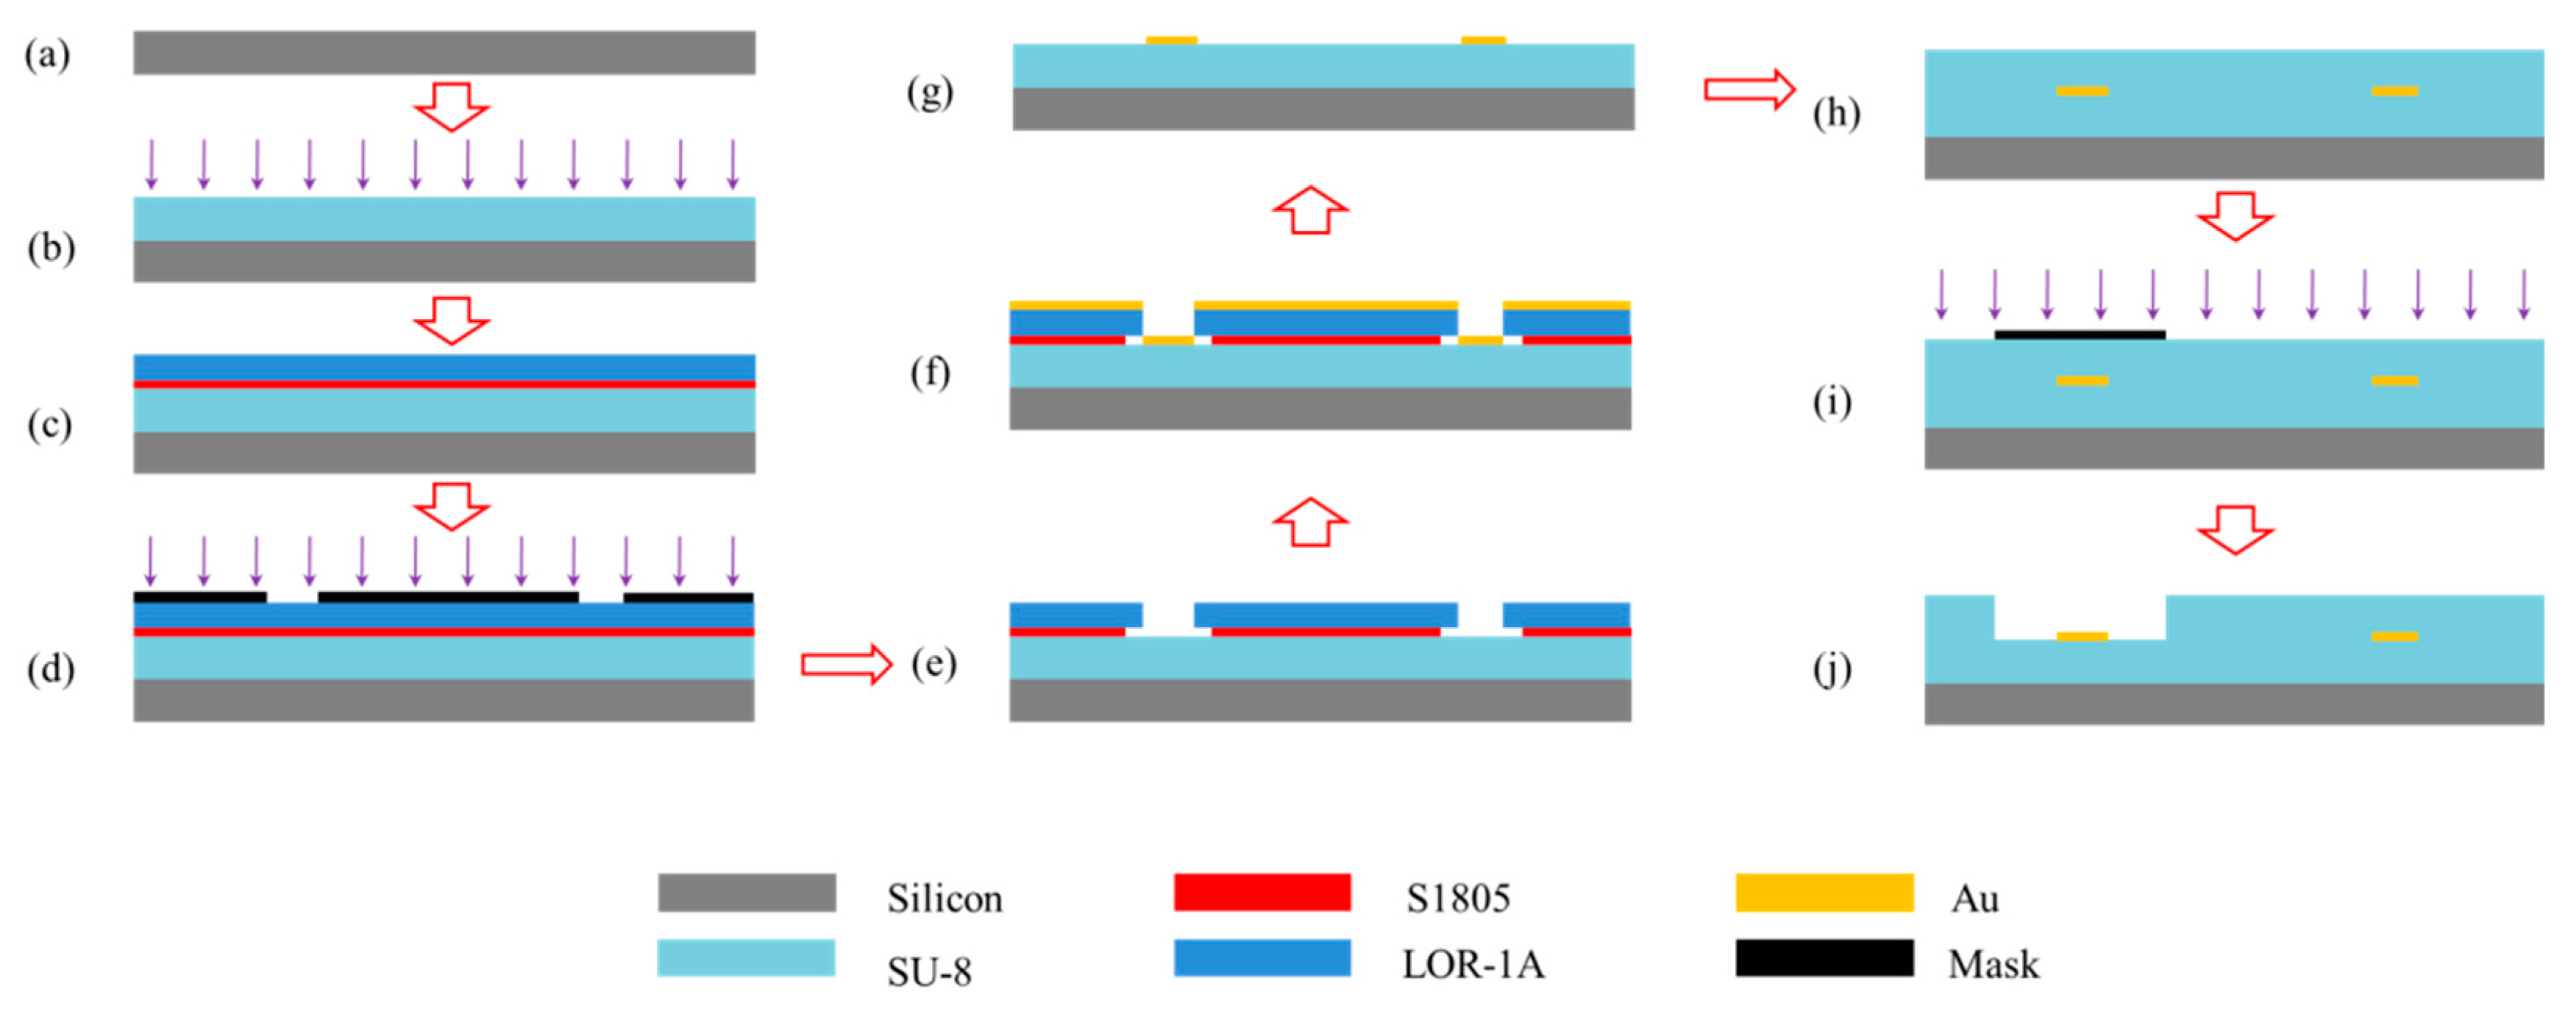
A double-layer lift-off process was adopted to fabricate the LRSPP waveguide sensor [35,36]. As shown in Figure 9, SU-8 2005 (Kayaku Advanced Materials Inc., Westborough, MA, USA) was first spin-coated on the silicon substrate and UV-cured at an exposure dose of 100 mW (λ = 365 nm). Then, the lift-off resist LOR-1A (Kayaku Advanced Materials Inc., Westborough, MA, USA) and photoresist S1805 (Shipley Corp., Coventry, UK) were spun onto the SU-8 bottom cladding and thermally cured, sequentially. The time and temperature of baking were well controlled to guarantee precise development. UV exposure was conducted at a dose of 60 mJ to transfer waveguide patterns into the resist S1805. After development in MF-321 (Shipley Corp., Coventry, UK), an undercut was successfully achieved. The Au film was deposited by a thermal evaporator. A quartz crystal microbalance was used to maintain the deposition rate at 0.5 Å/s to form a smooth continuous Au film with a thickness of 25 nm. Lift-off was done with PG Remover (Kayaku Advanced Materials Inc., Westborough, MA, USA) at room temperature, leaving the defined Au features on the SU-8 bottom cladding surface.
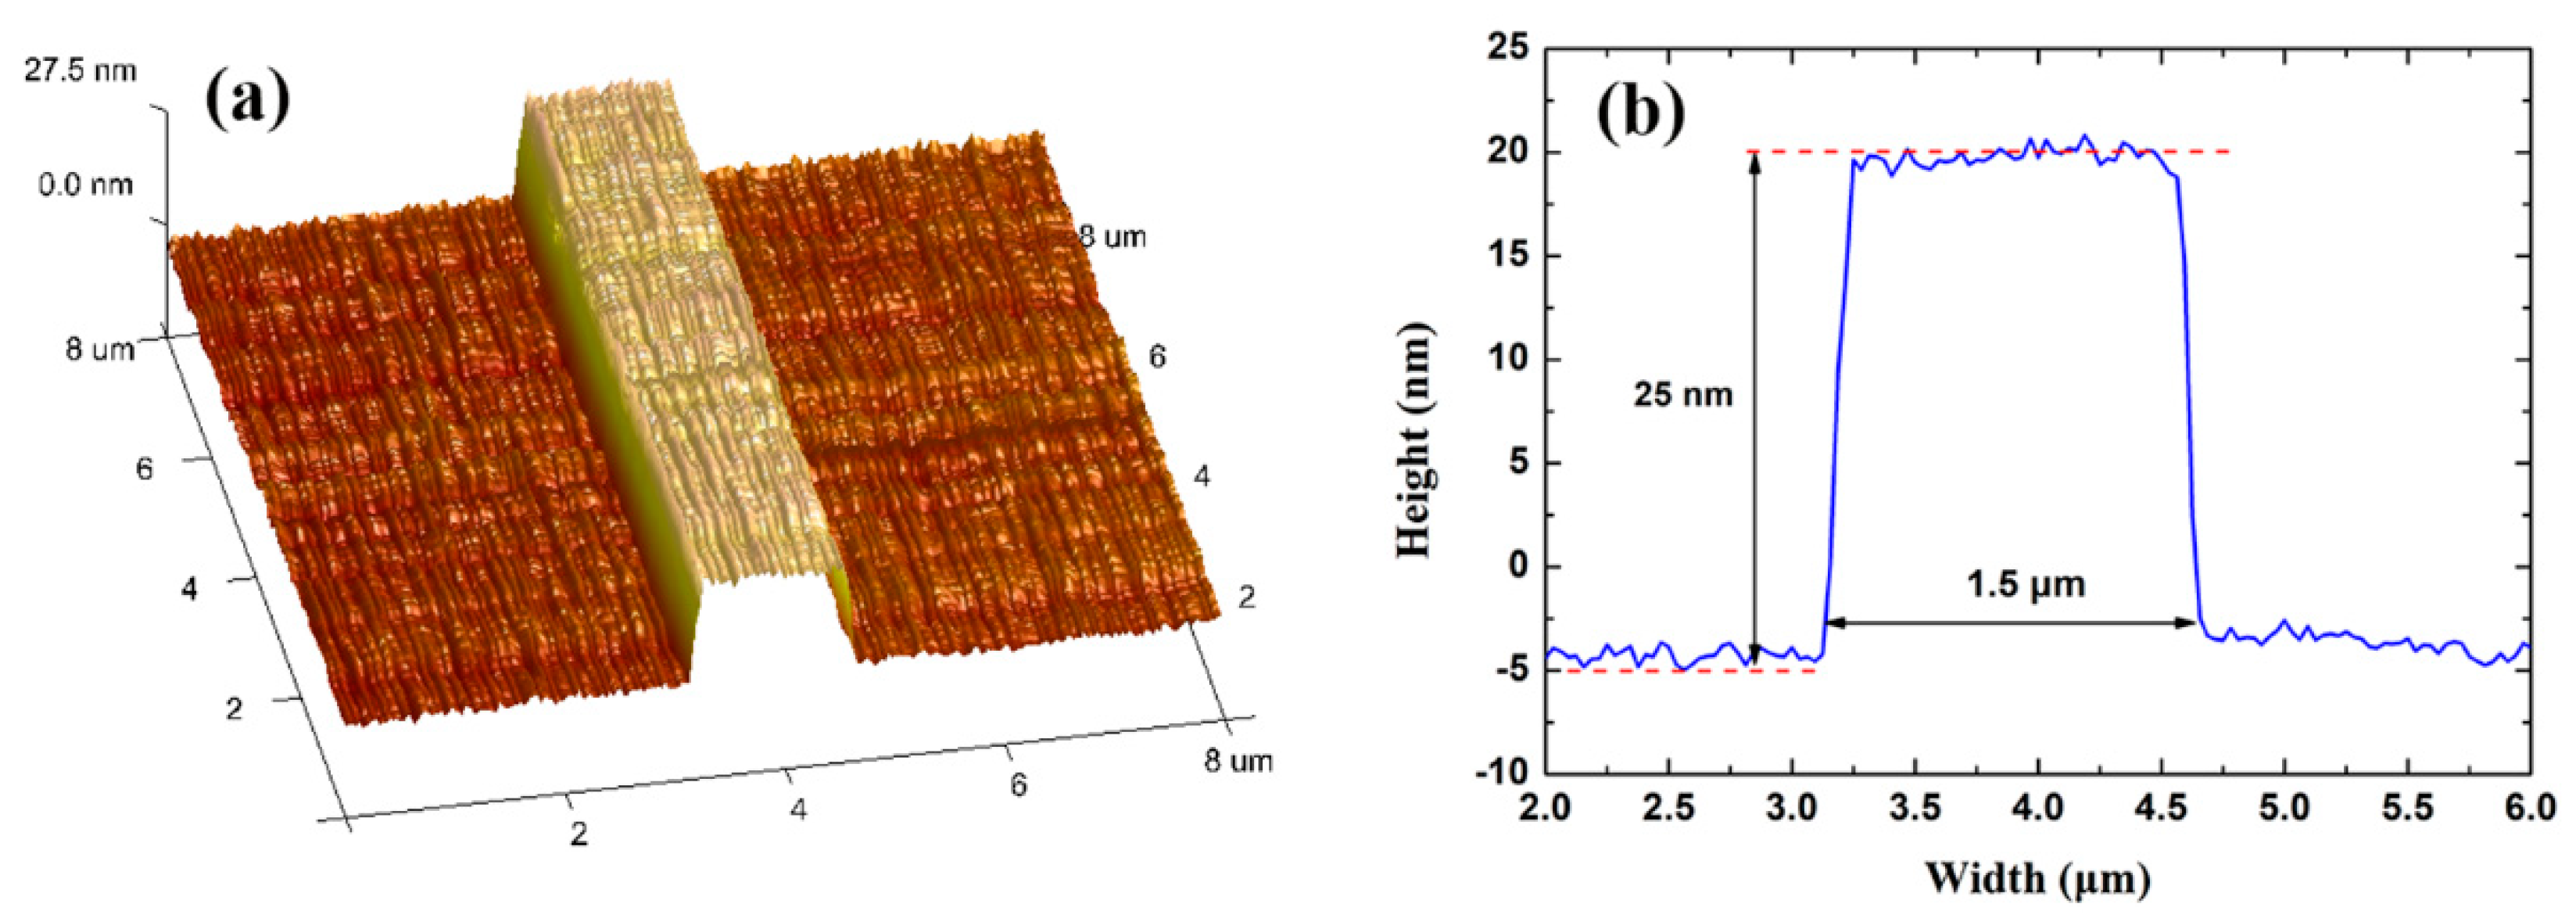
The Au stripe was characterized by atomic force microscopy (AFM) after step (g). As shown in Figure 10, the Au stripe has lift-off residue on the Au surface, which leads to a root mean square roughness (Rq) of 9.073 nm. To remove the residue, oxygen plasma cleaning was conducted, leading to a rectangular Au stripe with smoother surface (Rq = 1.480 nm), as shown in Figure 11. The increased stripe height compared to Figure 10a originates from the oxygen plasma etching into the SU-8 bottom cladding. After step (g), the top SU-8 cladding was spin-coated and cured using the same processing parameters as in the case of the SU-8 bottom cladding. The fluidic channel was defined lithographically through development of the SU-8, exposing the Au stripe.
5.2. Characterization
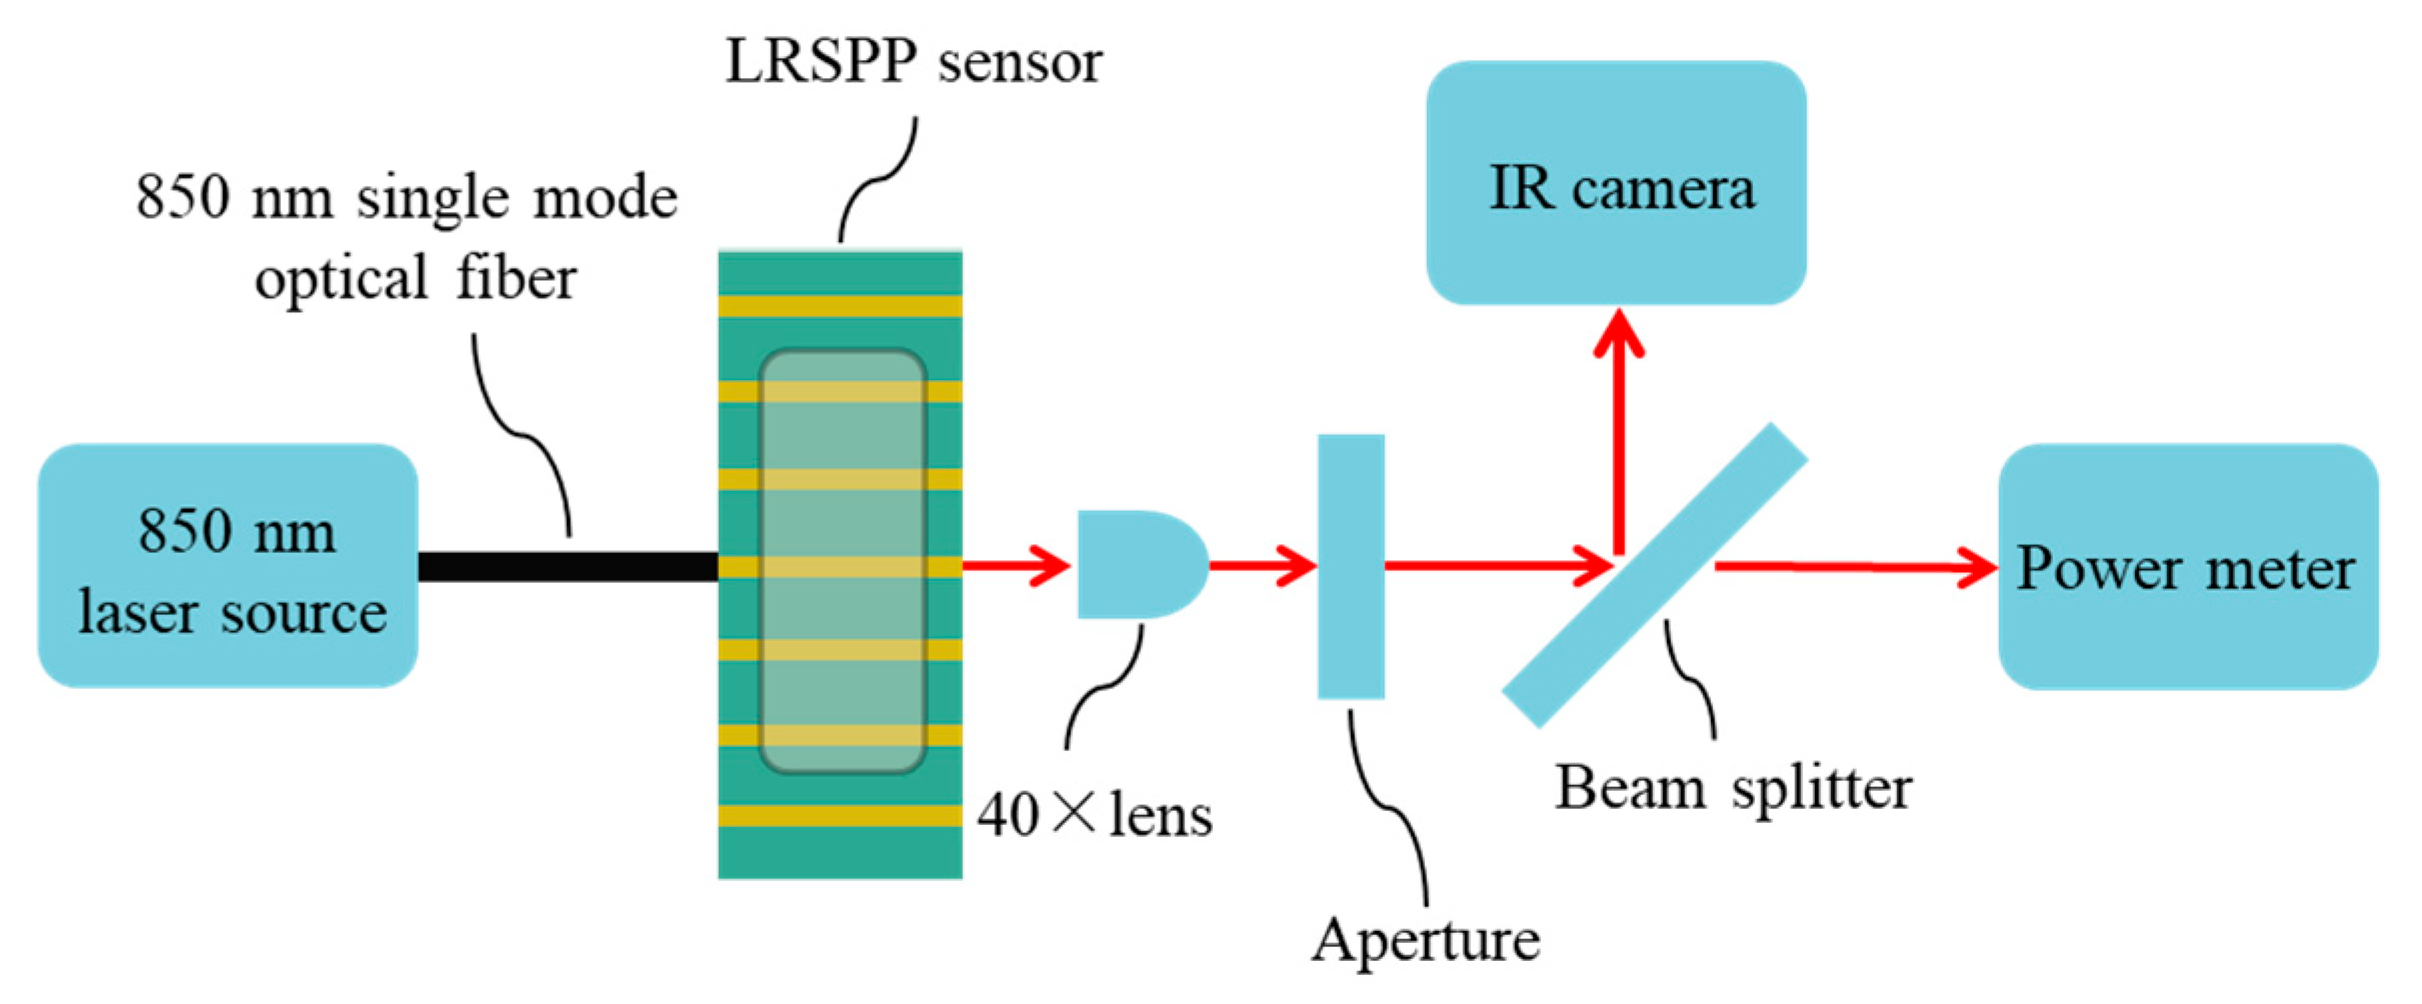
To confirm the optical transmission performance of waveguides, the propagation loss of fully cladded LRSPP waveguides was measured at λ0 = 850 nm, using the setup sketched in Figure 12. A polarization-maintaining single-mode optical fiber was butt-coupled to the input of an Au stripe, launching 850 nm light from a laser and exciting the LRSPP mode. A 40× objective was used to collimate the optical output from the LRSPP waveguide. The background radiation was blocked by a variable aperture before the light beam was allowed to pass through a 50:50 beam splitter. An infrared (IR) camera was used to capture the mode field pattern. A power meter was used to measure the output power.
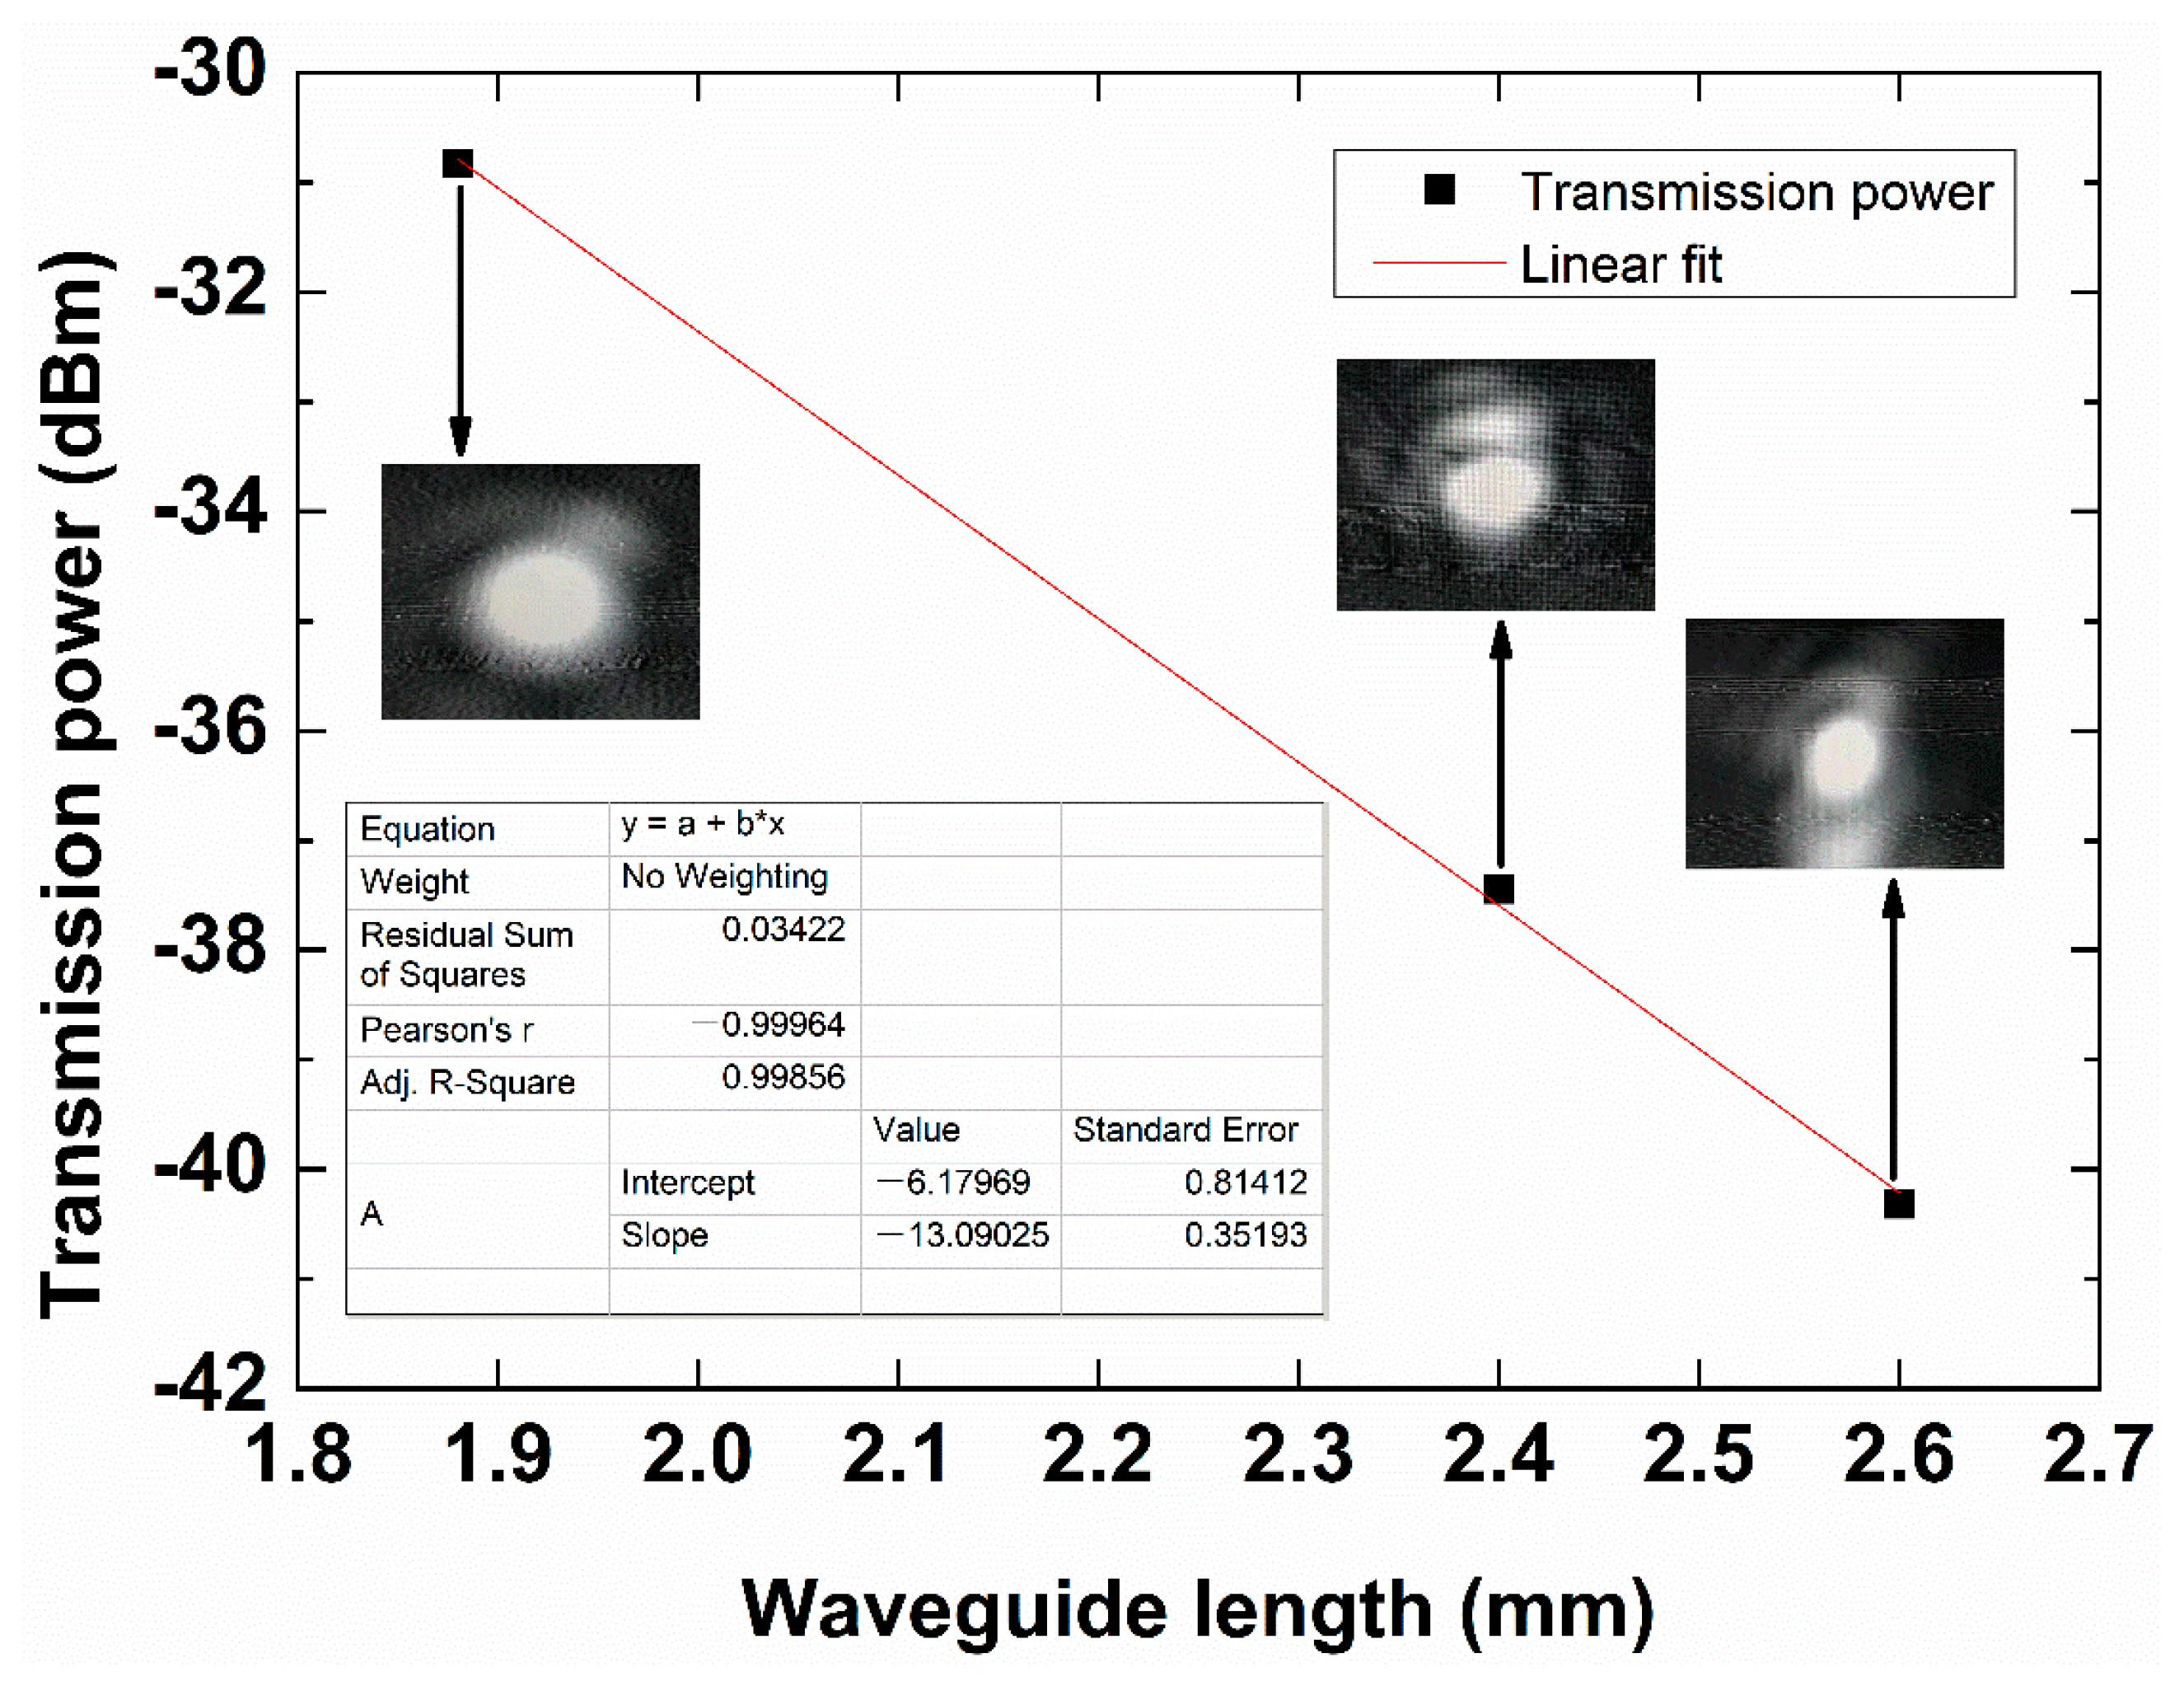
Following the cut-back method, the optical power emerging from 1.5 μm wide, 25 nm thick Au stripe waveguides, of lengths of 1.88, 2.40, and 2.60 mm, was measured. As shown in Figure 13, the insets show the captured far-field mode pattern. Linear fitting of the measured insertion loss of LRSPP waveguides with different lengths yields a mode power attenuation MPAw of 13.09 dB/mm at an adjusted R-squared of 0.99856, and a standard deviation of 0.814, which coincides well with the theoretical prediction of 12.01 dB/mm. The measured coupling loss of about 4.62 dB/facet is also close to the theoretical value of 3.92 dB/facet. During simulation, the fiber core diameter was chosen as 4.4 μm. The difference between the experimental results and theoretical expectations lies in the non-ideal waveguide end-facet at the input, which causes excess coupling loss. The facets were producing by slicing a wafer using a sharp knife (facets used as produced, unpolished). The coupling loss can be reduced by introducing dicing and polishing processes to obtain better facets. Nevertheless, this measurement supports the sensor design and the theoretical analysis, implying that the sensor design has good practical feasibility.
6. Conclusions
A bulk RI sensor based on a straight LRSPP waveguide is theoretically proposed. The polymer SU-8 was adopted as the cladding material to realize high-RI sensing. The LRSPP modal characteristics of Au stripes, and its geometric parameters, were investigated numerically via the FDE method at the optical free-space wavelength of 850 nm. The best bulk sensitivity can be obtained with a 1.5 μm wide, 25 nm thick, straight LRSPP waveguide. Fabricated waveguides were characterized, supporting the feasibility of the proposed design and validating the numerical modelling. This sensor has potential as a portable, low-cost refractometer.
Author Contributions
The work described in this manuscript is the collaborative development of all authors. Conceptualization: P.B.; formal analysis and investigation: Y.X.; validation: F.W.; resources: D.Z.; data curation: Y.G.; funding acquisition and writing—review and editing: X.S. All authors have read and agreed to the published version of the manuscript.
Funding
This research was funded by the National Key Research and Development Program of China (2019YFB2203001), National Natural Science Foundation of China (No. 61675087), and China Scholarship Council (Contract 201606175098).
Acknowledgments
The authors gratefully acknowledge Anthony Olivieri and Howard Northfield of the University of Ottawa for their technical support.
Conflicts of Interest
The authors declare no conflicts of interest.
References
- Fan, H.; Buckley, R.; Berini, P. Passive long-range surface plasmon-polariton devices in Cytop. Appl. Opt. 2012, 51, 1459–1467. [Google Scholar] [CrossRef]
- Berini, P. Bulk and surface sensitivities of surface plasmon waveguides. New J. Phys. 2008, 10, 105010. [Google Scholar] [CrossRef]
- Breukelaar, I.; Charbonneau, R.; Berini, P. Long-range surface plasmon-polariton mode cutoff and radiation in embedded strip waveguides. J. Appl. Phys. 2006, 100, 043104. [Google Scholar] [CrossRef]
- Wong, W.; Adikan, F.; Berini, P. Long-range surface plasmon Y-junctions for referenced biosensing. Opt. Express 2015, 23, 31098. [Google Scholar] [CrossRef] [PubMed]
- Fan, H.; Berini, P. Bulk sensing using a long-range surface-plasmon triple-output Mach-Zehnder interferometer. IEEE J. Lightwave Technol. 2018, 34, 2631–2638. [Google Scholar] [CrossRef]
- Khan, A.; Krupin, O.; Lisicka-Skrzek, E.; Berini, P. Mach-Zehnder refractometric sensor using long-range surface plasmon waveguides. Appl. Phys. Lett. 2013, 103, 111108. [Google Scholar] [CrossRef]
- Wong, W.; Berini, P.; Fan, H.; Adikan, F.R.M. Multichannel long-range surface plasmon waveguides for parallel biosensing. IEEE J. Lightwave Technol. 2018, 36, 5536–5546. [Google Scholar] [CrossRef]
- Oleksiy, K.; Hamoudi, A.; Chen, W.; Tait, R.N.; Berini, P. Biosensing using straight long-range surface plasmon waveguides. Opt. Express 2013, 21, 698–709. [Google Scholar]
- Schmidt, S.; Flueckiger, J.; Wu, W.; Grist, S.M.; Fard, S.T.; Donzella, V.; Khumwan, P.; Thompson, E.R.; Wang, Q.; Kulik, P.; et al. Improving the performance of silicon photonic rings, disks, and bragg gratings for use in label-free biosensing. SPIE 2014, 9166, 1–38. [Google Scholar]
- Salleh, M.; Glidle, A.; Sorel, M.; Reboud, J.; Cooper, J. Polymer dual ring resonators for label-free optical biosensing using microfluidics. Chem. Commun. 2013, 49, 3095–3097. [Google Scholar] [CrossRef] [Green Version]
- Halldorsson, J.; Arnfinnsdottir, N.; Jonsdottir, A.; Agnarsson, B.; Leosson, K. High index contrast polymer waveguide platform for integrated biophotonics. Opt. Express 2010, 18, 16217–16226. [Google Scholar] [CrossRef] [PubMed]
- Wang, X.; Sun, J.; Liu, Y.; Sun, J.-W.; Chen, C.-M.; Sun, X.-Q.; Wang, F.; Zhang, D.-M. 650-nm 1 × 2 polymeric thermo-optic switch with low power consumption. Opt. Express 2014, 22, 11119–11128. [Google Scholar] [CrossRef] [PubMed]
- Kou, L.; Labrie, D.; Chylek, P. Refractive indices of water and ice in the 0.65-to 2.5-µm spectral range. Appl. Opt. 1993, 32, 3531–3540. [Google Scholar] [CrossRef] [PubMed] [Green Version]
- Slavik, R.; Homola, J. Ultrahigh resolution long range surface plasmon-based sensor. Sens. Actuators B Chem. 2008, B123, 10–12. [Google Scholar] [CrossRef]
- Joo, Y.; Song, S.; Magnusson, R. Demonstration of long-range surface plasmon-polariton waveguide sensors with asymmetric double electrode structures. Appl. Phys. Lett. 2010, 97, 201105. [Google Scholar] [CrossRef]
- Wark, A.; Lee, H.; Corn, R. Long-range surface plasmon resonance imaging for bioaffinity sensors. Anal. Chem. 2005, 77, 3904–3907. [Google Scholar] [CrossRef]
- Ji, L.; Sun, X.; He, G.; Liu, Y.; Wang, X.; Yi, Y.; Chen, C.; Wang, F.; Zhang, D. Surface plasmon resonance refractive index sensor based on ultraviolet bleached polymer waveguide. Sens. Actuators B Chem. 2017, 244, 373–379. [Google Scholar] [CrossRef]
- Ji, L.; Sun, X.; Yang, G.; Sun, X.; Yi, Y.; Wang, X.; Chen, C.; Zhang, D. SU-8 grating assisted intermodal interference in surface plasmon polariton waveguide. Opt. Mater. Express 2017, 7, 2560–2570. [Google Scholar] [CrossRef]
- Huang, S.; Lai, C.; Sheu, F.; Tsai, W.-S. Characterization of long-range plasmonic waveguides at visible to near-infrared regime. AIP Adv. 2017, 7, 125221. [Google Scholar] [CrossRef]
- Prajzler, V.; Nekvindova, P.; Hyps, P.; Lyutakov, O.; Jeřábek, V. Flexible polymer planar optical waveguides. Radio Eng. 2014, 23, 776–782. [Google Scholar]
- Yakubovsky, D.; Arsenin, A.; Stebunov, Y.; Fedyanin, D.Y.; Volkov, V.S. Optical constants and structural properties of thin gold films. Opt. Express 2017, 25, 25574–25587. [Google Scholar] [CrossRef] [PubMed] [Green Version]
- Berini, P. Long-range surface plasmon-polariton waveguides in silica. J. Appl. Phys. 2007, 102, 053105. [Google Scholar] [CrossRef]
- Liu, W.; Yan, J.; Shi, Y. High sensitivity visible light refractive index sensor based on high order mode Si3N4 photonic crystal nanobeam cavity. Opt. Express 2017, 25, 31739. [Google Scholar] [CrossRef] [PubMed]
- Cai, H.; Yang, Y.; Chen, X.; AliMohammad, M.; Ye, T.-X.; Guo, C.-R.; Yi, L.-T.; Zhou, C.-J.; Liu, J.; Ren, T.-L. A third-order mode high frequency biosensor with atomic resolution. Biosens. Bioelectron. 2015, 71, 261–268. [Google Scholar] [CrossRef]
- Jhonattan, C.; Gabrielli, L.H.; Lechuga, L.M.; Figueroa, H.E.H. Trimodal waveguide demonstration and its implementation as a high order mode interferometer for sensing application. Sensors 2019, 19, 2821. [Google Scholar]
- Charbonneau, R.; Scales, C.; Breukelaar, I.; Fafard, S.; Lahoud, N.; Mattiussi, G.; Berini, P. Passive integrated optics elements based on long-range surface plasmon polaritons. IEEE J. Lightwave Technol. 2006, 24, 477–494. [Google Scholar] [CrossRef]
- Wong, W.; Krupin, O.; Mahamd, A.; Berini, P. Optimization of long-range surface plasmon waveguides for attenuation-based biosensing. IEEE J. Lightwave Technol. 2015, 33, 3234–3242. [Google Scholar] [CrossRef]
- Wong, W.; Mahamd, A.; Berini, P. Surface sensitivity of straight long-range surface plasmon waveguides for attenuation-based biosensing. Appl. Phys. A 2014, 117, 527–535. [Google Scholar] [CrossRef]
- Tai, Y.; Wei, P. Sensitive liquid refractive index sensors using tapered optical fiber tips. Opt. Lett. 2010, 35, 944–946. [Google Scholar] [CrossRef]
- Mallik, A. High sensitivity refractive index sensor based on a tapered small core single-mode fiber structure. Opt. Lett. 2015, 40, 4166–4169. [Google Scholar]
- Feng, D.; Liu, G.; Liu, X.; Jiang, M.-S.; Sui, Q.-M. Refractive index sensor based on plastic optical fiber with tapered structure. Appl. Opt. 2014, 53, 2007–2011. [Google Scholar]
- Madaan, D.; Kapoor, A.; Sharma, V. Ultrahigh sensitivity plasmonic refractive-index sensor for aqueous environment. IEEE Photon. Technol. Lett. 2018, 30, 149–152. [Google Scholar] [CrossRef]
- Sun, X.; Dai, D.; Thylén, L.; Wosinski, L. High-sensitivity liquid refractive-index sensor based on a Mach-Zehnder interferometer with a double-slot hybrid plasmonic waveguide. Opt. Express 2015, 23, 25688–25699. [Google Scholar] [CrossRef] [PubMed]
- Jiang, Y.; Liu, B.; Zhu, X.; Tang, X.-L.; Shi, Y.-W. Long-range surface plasmon resonance sensor based on dielectric/silver coated hollow fiber with enhanced figure of merit. Opt. Lett. 2015, 40, 744–747. [Google Scholar] [CrossRef]
- Vernoux, C.; Chen, Y.; Markey, L.; Spârchez, C.; Arocas, J.; Felder, T.; Neitz, M.; Brusberg, L.; Weeber, J.; Bozhevolnyi, S.I.; et al. Flexible long-range surface plasmon polariton single-mode waveguide for optical interconnects. Opt. Mater. Express 2018, 8, 469–484. [Google Scholar] [CrossRef]
- Tang, J.; Liu, Y.; Zhang, L.; Fu, X.-C.; Xue, X.-M.; Qian, G.; Zhao, N.; Zhang, T. Flexible thermo-optic variable attenuator based on long-range surface plasmon-polariton waveguides. Micromachines 2018, 9, 369. [Google Scholar] [CrossRef] [Green Version]
Figure 1.
Schematic diagram of the straight long-range surface plasmon polariton (LRSPP) waveguide refractive index (RI) sensor: (a) Constructed by embedding the Au stripe of width w and thickness d in the polymer SU-8, and (b) with a microfluidic channel etched over the Au stripe to define the sensing region.

Figure 2.
Electric field spatial distribution of Au stripe waveguide when the width w = 1, 1.5, 2, 2.5, 3, 3.5 μm and d = 15, 20, 25, 30 nm, respectively.
Figure 2.
Electric field spatial distribution of Au stripe waveguide when the width w = 1, 1.5, 2, 2.5, 3, 3.5 μm and d = 15, 20, 25, 30 nm, respectively.

Figure 3.
Re(neff) as a function of Au stripe thickness d for different stripe widths w and sensing solutions with na of (a) 1.562, (b) 1.566, (c) 1.570, (d) 1.578, (e) 1.582 and (f) 1.586.
Figure 3.
Re(neff) as a function of Au stripe thickness d for different stripe widths w and sensing solutions with na of (a) 1.562, (b) 1.566, (c) 1.570, (d) 1.578, (e) 1.582 and (f) 1.586.

Figure 4.
MPA as a function of Au stripe thickness d for different stripe widths w and sensing solutions with na of (a) 1.562, (b) 1.566, (c) 1.570, (d) 1.578, (e) 1.582 and (f) 1.586.
Figure 4.
MPA as a function of Au stripe thickness d for different stripe widths w and sensing solutions with na of (a) 1.562, (b) 1.566, (c) 1.570, (d) 1.578, (e) 1.582 and (f) 1.586.

Figure 5.
Coupling loss between cladded waveguide and sensing section as a function of Au stripe thickness d for different stripe widths w and sensing solutions with na of (a) 1.562, (b) 1.566, (c) 1.570, (d) 1.578, (e) 1.582 and (f) 1.586.
Figure 5.
Coupling loss between cladded waveguide and sensing section as a function of Au stripe thickness d for different stripe widths w and sensing solutions with na of (a) 1.562, (b) 1.566, (c) 1.570, (d) 1.578, (e) 1.582 and (f) 1.586.

Figure 6.
(a) Propagation loss (MPAa) and (b) sensing length (La) as a function of Au film thickness d for different na, with the width of Au stripe set to 1.5 μm.
Figure 6.
(a) Propagation loss (MPAa) and (b) sensing length (La) as a function of Au film thickness d for different na, with the width of Au stripe set to 1.5 μm.

Figure 7.
Distribution of the vertical transverse electric field component (Ey) of the fundamental LRSPP mode for different cases of RI (a) 1.562, (b) 1.566, (c) 1.570, (d) 1.578, (e) 1.582 and (f) 1.586 in the fluidic channel (na). Here, the width and thickness of the Au stripe are 1.5 μm and 25 nm, respectively.

Figure 8.
Propagation loss (MPAa) as a function of na; (a) na < nSU-8, and (b) na > nSU-8.

Figure 9.
Fabrication process flow of LRSPP waveguide sensors. (a) silicon substrate preparation, (b) spin-coating and curing of SU-8 bottom cladding, (c) LOR-1A and S1805 stack formation, (d) UV photolithography, (e) LOR-1A and S1805 development, (f) Au thermal deposition, (g) double-layer lift-off, (h) spin-coating and curing of SU-8 upper cladding, (i) UV photolithography, (j) development.

Figure 10.
(a) areal scan, and (b) linear scan of an Au stripe on the SU-8 bottom cladding by atomic force microscopy. The Au stripe is 1.5 μm wide and 25 nm high.
Figure 10.
(a) areal scan, and (b) linear scan of an Au stripe on the SU-8 bottom cladding by atomic force microscopy. The Au stripe is 1.5 μm wide and 25 nm high.

Figure 11.
(a) areal scan, and (b) linear scan of an Au stripe by atomic force microscopy after oxygen plasma cleaning, but before application, of the SU-8 upper cladding.
Figure 11.
(a) areal scan, and (b) linear scan of an Au stripe by atomic force microscopy after oxygen plasma cleaning, but before application, of the SU-8 upper cladding.

Figure 12.
Schematic diagram of setup for characterizing LRSPP waveguide sensors.

Figure 13.
Transmission power as a function of LRSPP waveguide length at optical wavelength 850 nm. Linear fitting of the measured insertion loss of LRSPP waveguides with different lengths yields a mode power attenuation MPAw of 13.09 dB/mm at an adjusted R-squared of 0.99856 and a standard deviation of 0.814. Insets show the far field LRSPP mode patterns.


Table 1.
Mode power distribution in SU-8, Au-stripe, and analyte.
| na | Power in Au (%) | Power in SU-8 (%) | Power in Analyte (%) | MPA (dB/mm) | Sensitivity (dB/RIU/mm) |
|---|---|---|---|---|---|
| 1.562 | 0.048 | 58.795 | 41.181 | 14.36 | 196 |
| 1.566 | 0.044 | 55.089 | 44.862 | 13.00 | |
| 1.570 | 0.042 | 52.331 | 47.597 | 12.21 | |
| 1.574 | 0.041 | 49.992 | 49.992 | 12.01 | |
| 1.578 | 0.042 | 47.637 | 52.290 | 12.35 | 188 |
| 1.582 | 0.045 | 45.058 | 54.917 | 13.15 | |
| 1.586 | 0.048 | 41.737 | 58.221 | 14.25 |
Table 2.
RI sensing performance comparison.
| Platform | Structure | RI Range | Sensitivity | Wavelength | Size | Ref |
|---|---|---|---|---|---|---|
| Fiber | Tapered core | 1.3–1.4 | 8000%/RIU | 632 nm | NA | [29] |
| Fiber | Tapered core | 1.4304–1.4320 | 19,212.5 nm/RIU | 1474–1615 nm | NA | [30] |
| POF | Tapered core | 1.33–1.41 | 950 μW/RIU @633 nm | 532, 633, and 780 nm | NA | [31] |
| Hybrid-plasmonic | Straight waveguide | 1.3306–1.3326 | 2 × 10⁵ dB/RIU | 632.8 nm | 75 μm | [32] |
| Hybrid-plasmonic | Dual slot waveguide | 10–100% IPA | 1061 nm/RIU | 1550 nm | 40 μm | [33] |
| LRSPR | Prism | 1.518–1.576 | 2000–6600 nm/RIU | 400–800 nm | NA | [34] |
| This work | Straight waveguide | 1.562–1.586 | 196 dB/RIU/mm | 850 nm | <3 mm |
© 2020 by the authors. Licensee MDPI, Basel, Switzerland. This article is an open access article distributed under the terms and conditions of the Creative Commons Attribution (CC BY) license (http://creativecommons.org/licenses/by/4.0/).
Share and Cite
MDPI and ACS Style
Xu, Y.; Wang, F.; Gao, Y.; Zhang, D.; Sun, X.; Berini, P. Straight Long-Range Surface Plasmon Polariton Waveguide Sensor Operating at λ0 = 850 nm. Sensors 2020, 20, 2507. https://doi.org/10.3390/s20092507
AMA Style
Xu Y, Wang F, Gao Y, Zhang D, Sun X, Berini P. Straight Long-Range Surface Plasmon Polariton Waveguide Sensor Operating at λ0 = 850 nm. Sensors. 2020; 20(9):2507. https://doi.org/10.3390/s20092507
Chicago/Turabian StyleXu, Yan, Fei Wang, Yang Gao, Daming Zhang, Xiaoqiang Sun, and Pierre Berini. 2020. "Straight Long-Range Surface Plasmon Polariton Waveguide Sensor Operating at λ0 = 850 nm" Sensors 20, no. 9: 2507. https://doi.org/10.3390/s20092507
Note that from the first issue of 2016, this journal uses article numbers instead of page numbers. See further details here.