Article

Functional Near-Infrared Spectroscopy for the Classification of Motor-Related Brain Activity on the Sensor-Level

by
Alexander E. Hramov
1,2,*,†,
Vadim Grubov
1,†,
Artem Badarin
1,
Vladimir A. Maksimenko
1 and
Alexander N. Pisarchik
1,3
1
Neuroscience and Cognitive Technology Laboratory, Center for Technologies in Robotics and Mechatronics Components, Innopolis University, Universitetskaja Str., 1, 420500 Innopolis, Russia
2
Saratov State Medical University, Bolshaya Kazachya Str., 112, 410012 Saratov, Russia
3
Center for Biomedical Technology, Technical University of Madrid, Campus Montegancedo, Pozuelo de Alarcón, 28223 Madrid, Spain
*
Author to whom correspondence should be addressed.
These authors contributed equally to this work.
Sensors 2020, 20(8), 2362; https://doi.org/10.3390/s20082362
Submission received: 12 March 2020 / Revised: 18 April 2020 / Accepted: 20 April 2020 / Published: 21 April 2020
(This article belongs to the Special Issue Biennial State-of-the-Art Sensors Technology in Russia 2020-2021)

Abstract

:
Sensor-level human brain activity is studied during real and imaginary motor execution using functional near-infrared spectroscopy (fNIRS). Blood oxygenation and deoxygenation spatial dynamics exhibit pronounced hemispheric lateralization when performing motor tasks with the left and right hands. This fact allowed us to reveal biomarkers of hemodynamical response of the motor cortex on the motor execution, and use them for designing a sensing method for classification of the type of movement. The recognition accuracy of real movements is close to 100%, while the classification accuracy of imaginary movements is lower but quite high (at the level of 90%). The advantage of the proposed method is its ability to classify real and imaginary movements with sufficiently high efficiency without the need for recalculating parameters. The proposed system can serve as a sensor of motor activity to be used for neurorehabilitation after severe brain injuries, including traumas and strokes.

1. Introduction

A study of neurophysiological brain activity attracts significant interest of researchers from various fields of science due to its interdisciplinary nature. The considerable progress in the development of experimental approaches for neuroimaging and mathematical methods for big data analysis provides great opportunities for vast and detailed studies of specific phenomena in the brain neural network and the creation of sensor systems for monitoring brain states. Recent progress in this field has been achieved at the junction of mathematics, physics, engineering and neuroscience [1]. This is confirmed by an increasing number of papers related to brain research and published in multidisciplinary journals (see, e.g., [2,3,4,5]).
From the viewpoint of nonlinear dynamics, brain is a very complex dynamical system, containing around 86 billion neurons [6]. The neurons are connected by synapses, thus forming a complex network with nodes and links represented respectively by neurons and synapses. Specific features of time-spatial activity of the neural network in the brain cortex and cooperative dynamics of different brain areas (e.g., event-related synchronization/desynchronization) on a sensor level provide important information about the current state of the nervous system and cognitive brain ability [7,8,9,10]. Particular brain states are associated with motor brain activity during either real or imaginary movement.
Revealing specific features of spatial brain cortex activity related to real motions and motor imagery of different limbs can be essential not only for basic research in neuroscience, but also for applications in medicine to improve the quality of life of post-traumatic and post-stroke patients using brain-computer interfaces (BCI) for rehabilitation [11,12,13] or to control prostheses and exoskeletons [14]. One of the important BCI functions is online detection of specific features of electromagnetic brain activity using electroencephalography (EEG) [15] or magnetoencephalography (MEG) [16], and transformation of certain patterns into control commands to perform specific actions in the environment without the need of “classical” methods of human–machine interaction [17].
Apart from EEG and MEG, other methods are also used to acquire information about brain states. In particular, functional near-infrared spectroscopy (fNIRS) [18,19] is a powerful tool of noninvasive optical imaging successfully used in BCI for registration of brain activity and control command formation [20,21,22]. Control commands for this kind of BCI should not be affected by any muscular activity [23]. Therefore, a study of brain states related to motor imagery is very important for designing such BCI [16,24]. Motor imagery is a mental process by which a person rehearses or simulates a given action with no real motor activity. Some researchers treat motor imagery as a conscious application of unconscious preparation for real motor activity [25]. A number of studies have highlighted common features for real and imaginary motor activity [26,27,28]. One of the common features, important for the BCI development, is that the cortical layout in the primary motor cortex M1 is quite similar between motor execution and motor imagery.
The most popular technique for studying brain activity during motor executions is EEG, that implies the location of special sensors on the scalp (or directly into the brain) and recording EEG signals as electric currents generated by a group of neurons [29]. The EEG signal or electrical response of the neural network is characterized by a complex time-frequency structure containing specific frequency ranges, oscillatory patterns, stochastic components, artifacts, etc. [30]. It is well known that there is a strong correlation between EEG rhythmic activity and functional states of the organism [31,32,33] that can be used for revealing specific features related to real and imagery motor activity [34,35,36]. The problem of detection and classification of different types of motor execution requires the application of various methods for time-frequency and spatio-temporal analyses [37], including artificial intelligence methods [4], recurrence measures of signal complexity [38], as well as event-related synchronization (ERS) and event-related desynchronization (ERD) [39].
In this work, we use fNIRS, an efficient noninvasive technique for brain activity estimation [40], that employs near-infrared light to detect changes in oxygenated (HbO) and deoxygenated (HbR) hemoglobin levels due to hemodynamic brain activity and the rapid delivery of oxygenated blood to active cortical areas through neurovascular coupling [41]. A high efficiency of fNIRS is achieved due to the use of laser lights with two different wavelengths which penetrate most tissues in the head, but are highly absorbed by oxyhemoglobin (HbO) and deoxyhemoglobin (HbR). According to changes in the absorption of these two wavelengths, corresponding changes in HbO and HbR concentrations can be calculated and hence the oxygenation of brain tissues can be assessed.
It should be noted that fNIRS has a common physiological basis with functional magnetic resonance imaging (fMRI), so that their signals are correlated [42]. Meanwhile, fNIRS has many advantages over fMRI, namely, resistance to motor artifacts, high mobility due to significantly smaller sizes, and higher temporal resolution for the determination of oxyhemoglobin and deoxyhemoglobin. At the same time, fNIRS has some drawbacks, in particular, fNIRS has lower spatial resolution than fMRI. Despite relatively low temporal resolution and the existence of time delay in the hemodynamic response compared to EEG signals, fNIRS is a powerful tool of functional neuroimaging and can compete with other imaging techniques such as fMRI and EEG. The fNIRS imaging is superior to other techniques in studying neural activity in the primary motor cortex M1 because this area lies on the outer cortices which is within the blood oxygenation level deprivation (BOLD) scanning range for fNIRS [43]. A significant advantage of fNIRS over MEG is its portability and more easy mounting of sensors on the patient’s head. Moreover, the fNIRS equipment is cheaper as compared to fMRI and MEG. Thus, fNIRS holds a special place among modern methods of neuroimaging due to a good combination of temporal and spatial resolutions, overall mobility and simplicity of use.
In this paper, we analyse fNIRS data acquired during human real and imaginary motor activity associated with motor cortex hemodynamics. In particular, we extract specific features of the fNIRS signals related to different types of motor activity, which can be used in BCIs. We also propose an universal method to classify fNIRS trials obtained during motor imagery and develop a sensor of motor activity to be used for neurorehabilitation systems after various brain injuries, including stroke.

2. Materials and Methods

2.1. Participants

Twelve healthy volunteers (age: 22–38 years, gender: 7 men and 5 women), right-handed, amateur practitioners of physical exercises, non-smokers participated in the experiment. None of the subjects had diagnosed diseases of the musculoskeletal system and neurological diseases and did not take medications. Every participant was asked to maintain a healthy lifestyle with 8-hours night rest for 48 h before starting the experiment.
Each participant provided informed written consent before participating in the experiment. The experimental procedure was performed in accordance with the Helsinki’s Declaration and approved by the local Ethics Committee of the Innopolis University.

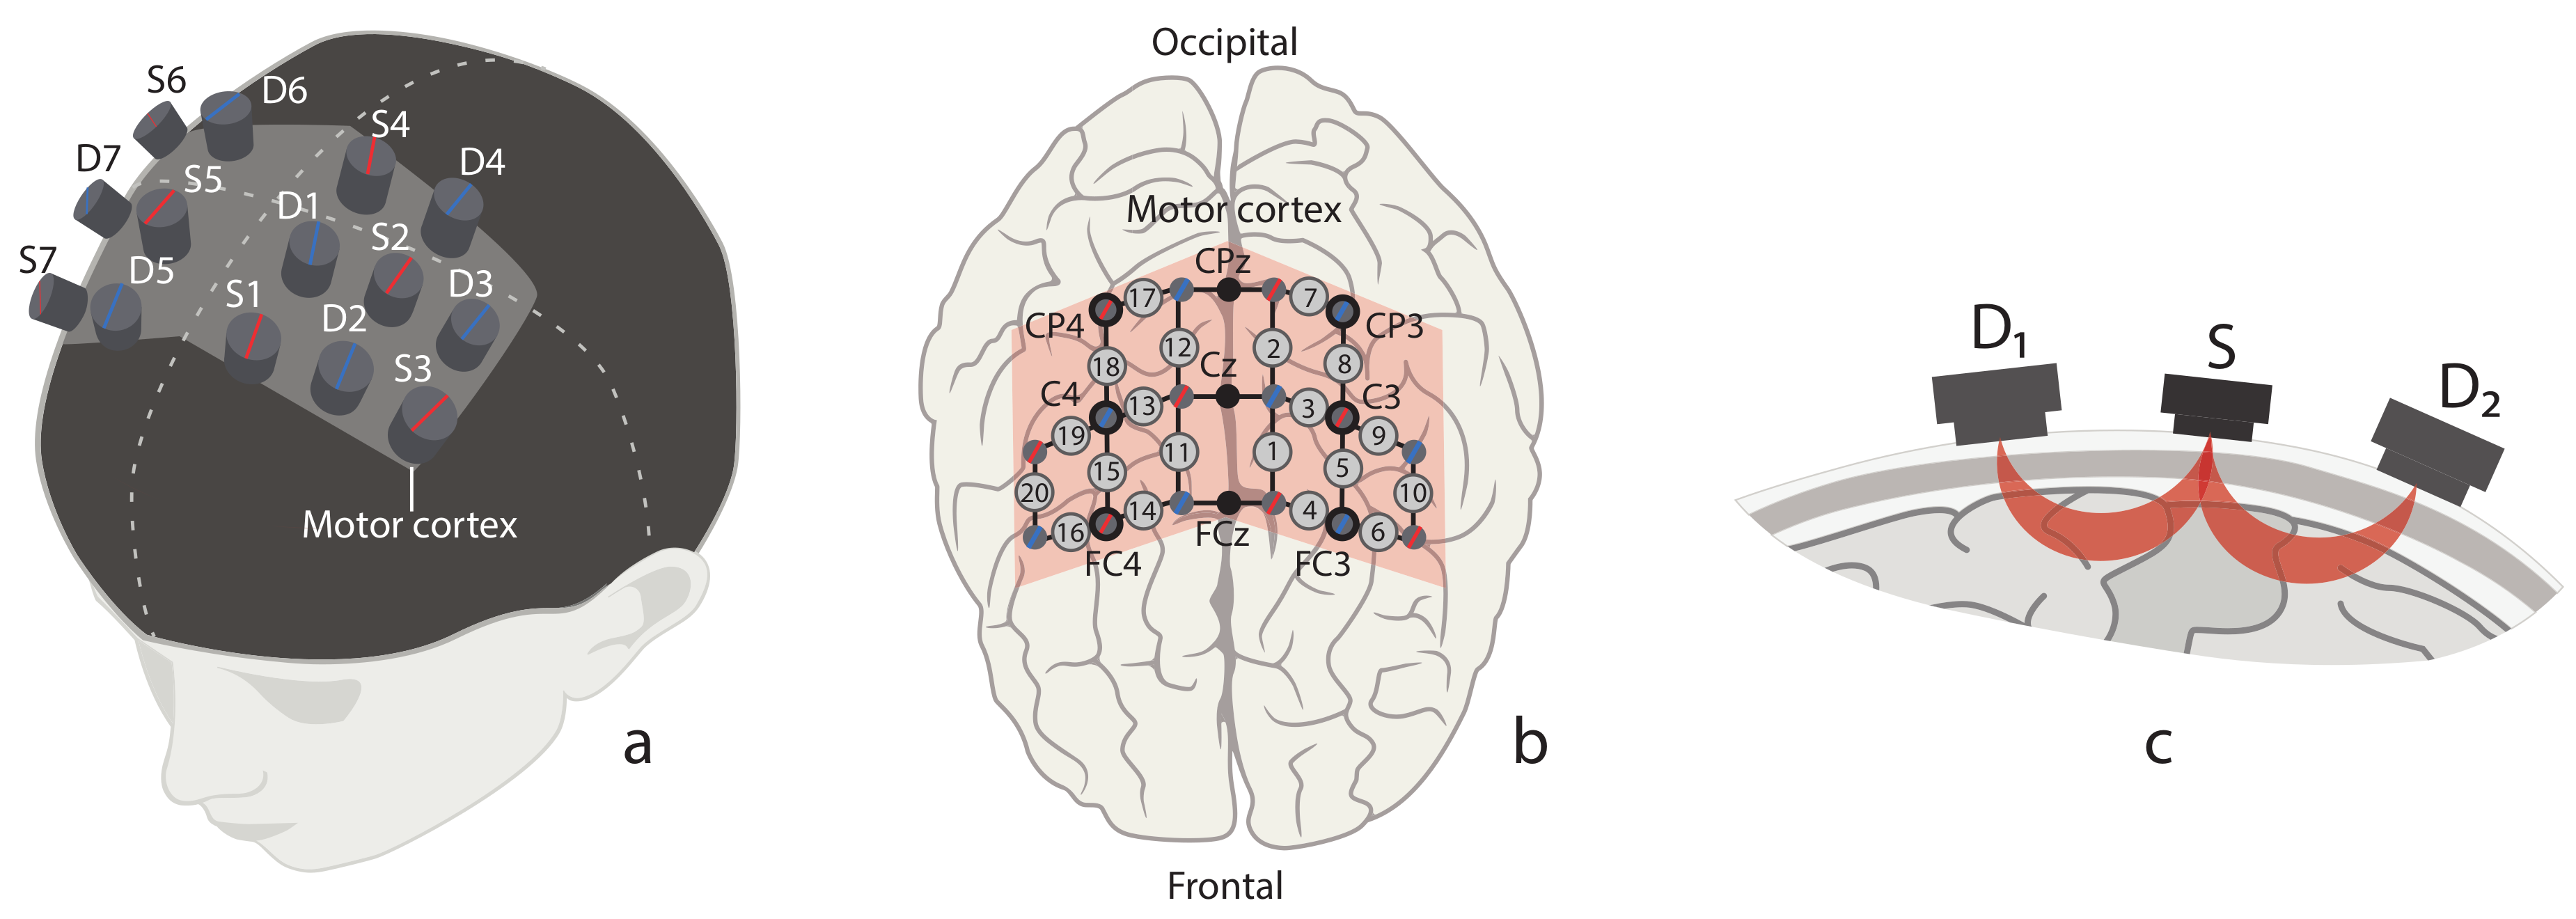
2.2. Experimental Equipment

The experiment was designed to record a hemodynamic neuronal response in the motor cortex using fNIRS which records fast changes in the brain activity. The fNIRS signals were acquired by the NIRScout device manufactured by the NIRx Company (Germany). The NIRScout system has a 7.8125-Hz resolution and contains 8 sources and 8 detectors placed on the subject’s scalp in the primary motor cortex area (M1) as shown in Figure 1a. Each pair “source–detector” was placed close enough to each other (about 3 cm) to form a fNIRS channel. In our experiments we used 20 fNIRS channels and 9 EEG electrodes located according to the international scheme “10–10” scheme [44], as illustrated in Figure 1b.
All experiments were carried out in the Neuroscience and Cognitive Technology Lab of the Innopolis University.

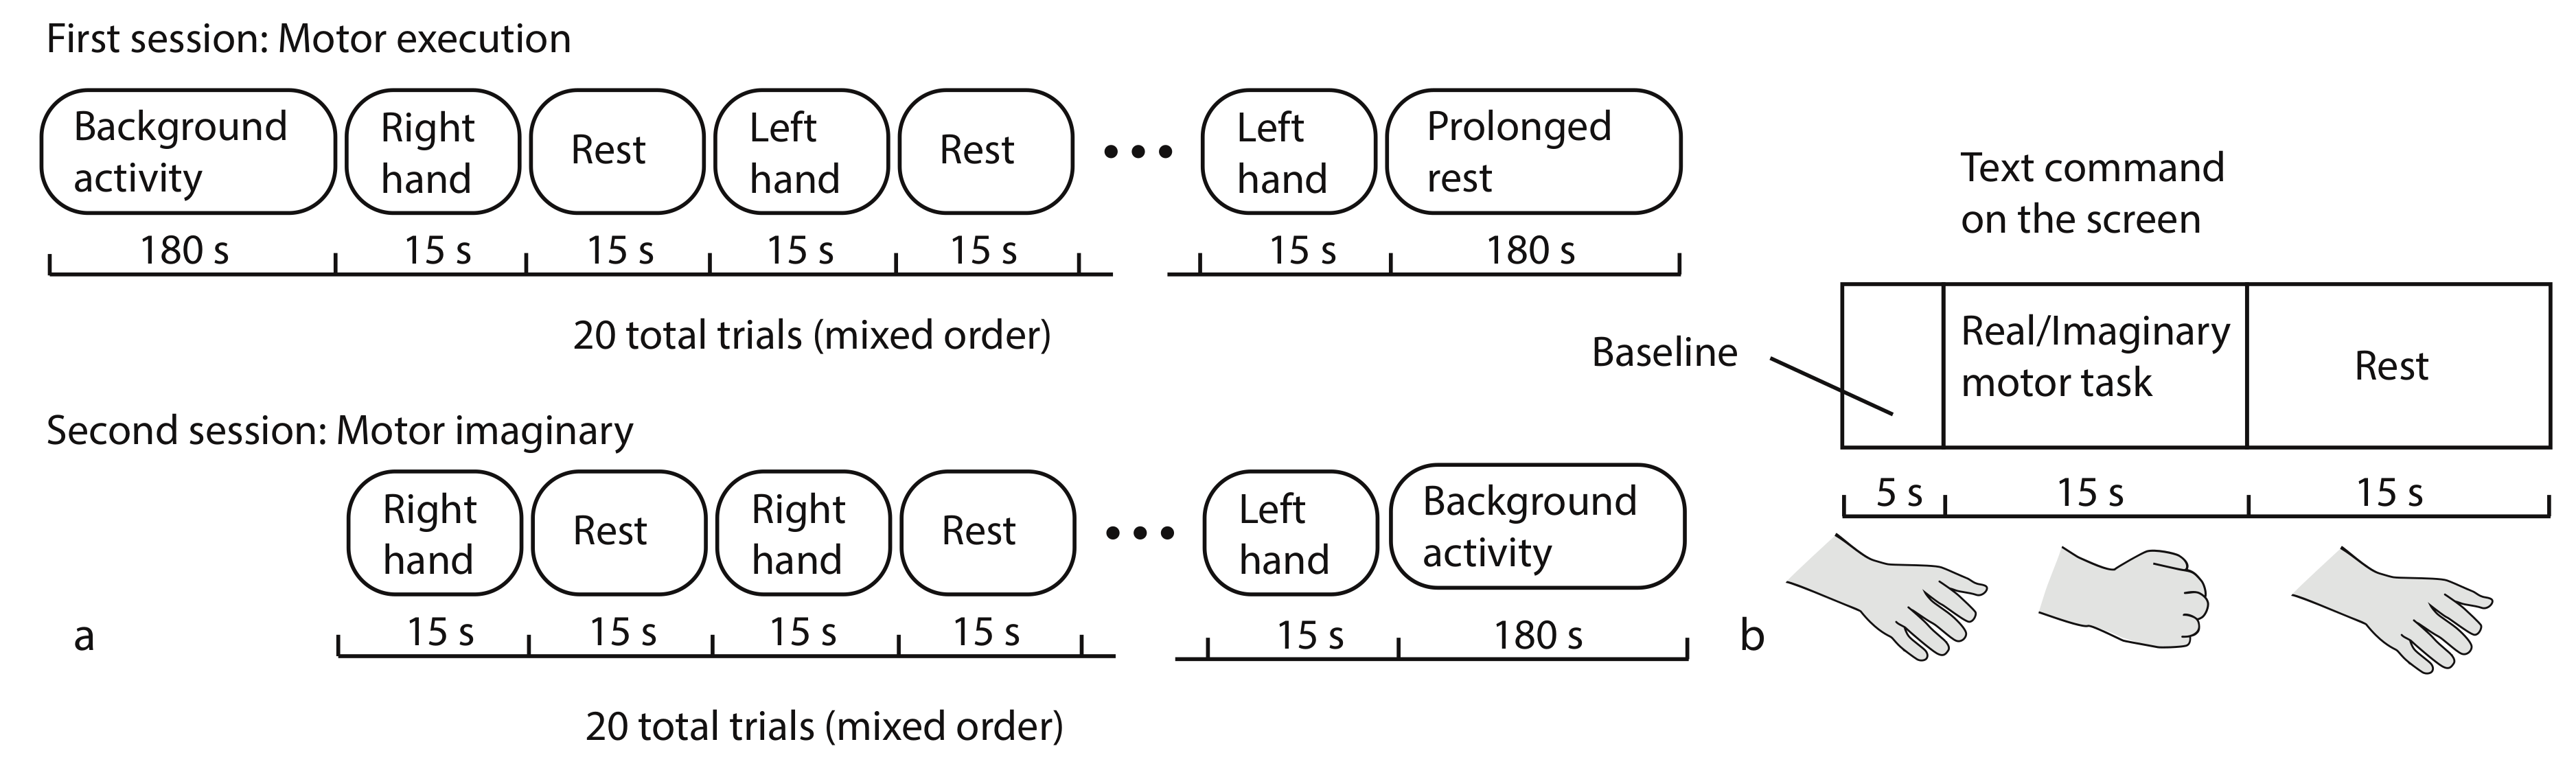
2.3. Experimental Procedure

The experiment was performed as follows. The subjects were sitting on a comfortable chair while performing motor actions or motor imaginary of left and right hands according to the corresponding text command on a computer monitor placed in front of the subject’s eyes at a distance of 70–80 cm.
The experimental design is schematically shown in Figure 2. Each experiment began and ended with a 3-min recording of background brain activity, during which the subject were instructed to relax and make no hand movements. The experiment included two sessions (Figure 2a). In the first session, the subject was asked to perform real movements with left or right hand according to the corresponding command on the screen. Then, after a short break, in the second session the subject was asked to imagine the same type of movement according to the corresponding command on the screen. Each fNIRS trial during every session consisted of the text command presentation indicating the type of motor activity (the subject was given 15 s to perform required movement) and the rest interval (15 s from the end of motor activity till the next command). There were 10 trials for each type of motor activity.
Hand movement consisted of repeated bending/unbending of fingers to the center of the palm (similar to clenching of imaginary ball), as illustrated in (Figure 2b). The repeated movements were performed at the pace comfortable for the subject.

2.4. Data Acquisition and Pre-Processing

In the fNIRS experiments, we used a laser light with two wavelengths, λ 1 = 785 nm and λ 2 = 850 nm, that can pass through skin, bone and water, but are highly absorbed by oxyhemoglobin and deoxyhemoglobin, respectively [45]. In the developed configuration for the fNIRS recording, the light sources and detectors were placed on the scalp and dual-wavelength light was transmitted through skin, skull, and top layer of the cerebral cortex.
As seen from Figure 1c, near-infrared light travels from the source to the detector through a specific path. First, it goes from the source to the tissue and at the depth of approximately 3 cm is reflected towards the detector. The path shape limits the distance between the source and detector to 2–3 cm and allows one to detect changes in the reflected near-infrared light.
In order to obtain information about changes in oxygenation of the tissue, we analyzed raw fNIRS data using special software. Since oxyhemoglobin and deoxyhemoglobin have different light absorption properties, we calculated changes in the reflected dual-wavelength light using the modified Beer–Lambert law [46]. For this purpose, we introduced a new characteristic measure (H) which reflects relative changes in oxyhemoglobin and deoxyhemoglobin.
The fNIRS data acquisition and pre-processing procedure were performed with software NIRScout. It is well-known that experimental fNIRS data are often affected by side physiological noises and artifacts, whose characteristic frequencies are in the fNIRS frequency band, including Mayer wave (with a typical frequency close to 0.1 Hz), respiration (close to 0.25 Hz), and heartbeat (close to 1 Hz). As was mentioned in the review paper [47], in many cases the band-pass filtering is mostly sufficient for removing low-frequency physiological noise in fNIRS data. According to this observation, we also applied the 0.01–0.1 Hz band-pass filter to the fNIRS signals using NIRScout to prevent the effect of side physiological activities.
The NIRScout software was also used for presentation of stimuli (text commands) and for logging the events (such as beginning and end of motor activity) in the protocol file. According to this file, 35-s long trials were formed by 5-s preparation before the text command, 15-s motor activity, and 15-s rest interval as illustrated in Figure 2b. The 5-s interval at the beginning of each trial was used for baseline correction. Specifically, the distribution of HbO/HbR was averaged over these 5 s and the obtained value was subtracted from the corresponding trial.

2.5. Data Analysis

The characteristic value H i ( i = 1 , , N f N I R S , where N f N I R S = 20 is the number of fNIRS channels) provides information about HbO/HbR dynamics obtained from corresponding fNIRS channels. At the same time, to compare significance of such dynamics across the channels we need to introduce new characteristic δ H i , j that can be calculated as follows.
First, we calculate the value of H i T as H i averaged for each fNIRS channel, separately for HbO and HbR, across time interval T ( 5 , 20 ) s corresponding to real or imaginary motor activity:
H i T = T Δ H i d t .
In the previous papers [48,49], we have introduced the measure of connectivity based on the reconstruction of functional links between neuronal ensembles in different frequency bands by comparing spectral components of the EEG signals belonging to these bands. Here, we extend this approach to the time domain for analyzing the restoration of connectivity by similarity of hemodynamic responses in different areas of the motor cortex. This allows us to identify the cortical region in M1 with most similar activity for further classification of motor execution events.
According to our approach, we calculate matrices δ H i , j of the difference between H T for all fNIRS channels i and j ( i , j = 1 , , 20 ) for each type of motor activity (real and imaginary) for both HbO and HbR as
d H i , j = H i T H j T .
Previous fMRI studies [50] indicate that the activation of primary motor cortex during real movement increases the level of oxyhemoglobin ( H HbO ) and decreases deoxyhemoglobin ( H HbR ). Therefore, in the resulting matrices d H i , j we leave only values d H i , j > 0 for HbO and d H i , j < 0 for HbR and take their absolute values for easier comparison. Finally, we construct the distributions N ( d H i , j ) of d H i , j for each 20 × 20 matrix obtained for HBO and HbR in the case of left/right real and imaginary movements. These diagrams are present in Figure 3 for subject #3.
Based on the obtained distributions N ( d H i , j ) we introduce cumulative distribution functions F d H i , j ( h ) = P ( d H i , j h ) which yield the probability for d H i , j to be smaller than h. The fourth quartile of the F ( h ) distribution is the value of h 0.75 . The corresponding cumulative distributions are shown in Figure 3 by blue curves, while dashed vertical lines indicate the border of the fourth quartile. As a consequence, we only consider d H ¯ i , j values that fall into the fourth quartile of distributions ( F ( H ¯ i , j ) 0.75 ) because the resulting values of d H ¯ i , j are the most significant and thus can be used to find fNIRS channels suitable for the classifier (see Results). Thus, for further mathematical analysis we obtain the following matrixes of functional connectivity between different fNIRS channels corresponding to the dynamics of oxygenation and deoxygenation, respectively:
δ H HbO i , j = | d H HbO i , j | , if d H HbO i , j > 0 F ( d H HbO i , j ) 0.75 , 0 , otherwise ,
δ H HbR i , j = | d H HbR i , j | , if d H HbR i , j < 0 F ( | d H HbR i , j | ) 0.75 , 0 , otherwise .

2.6. Algorithm for Classification of Brain Activity During Real and Imagery Motor Executions

Let us now consider the online algorithm based on the construction of a decision tree for binary classification of brain activity during real and imagery motor executions. The tree-like model of decisions was created as a result of empirical analysis of the experimental data. The proposed algorithm for processing fNIRS data is illustrated in Figure 4 in the form of a flowchat which contains the following main steps.
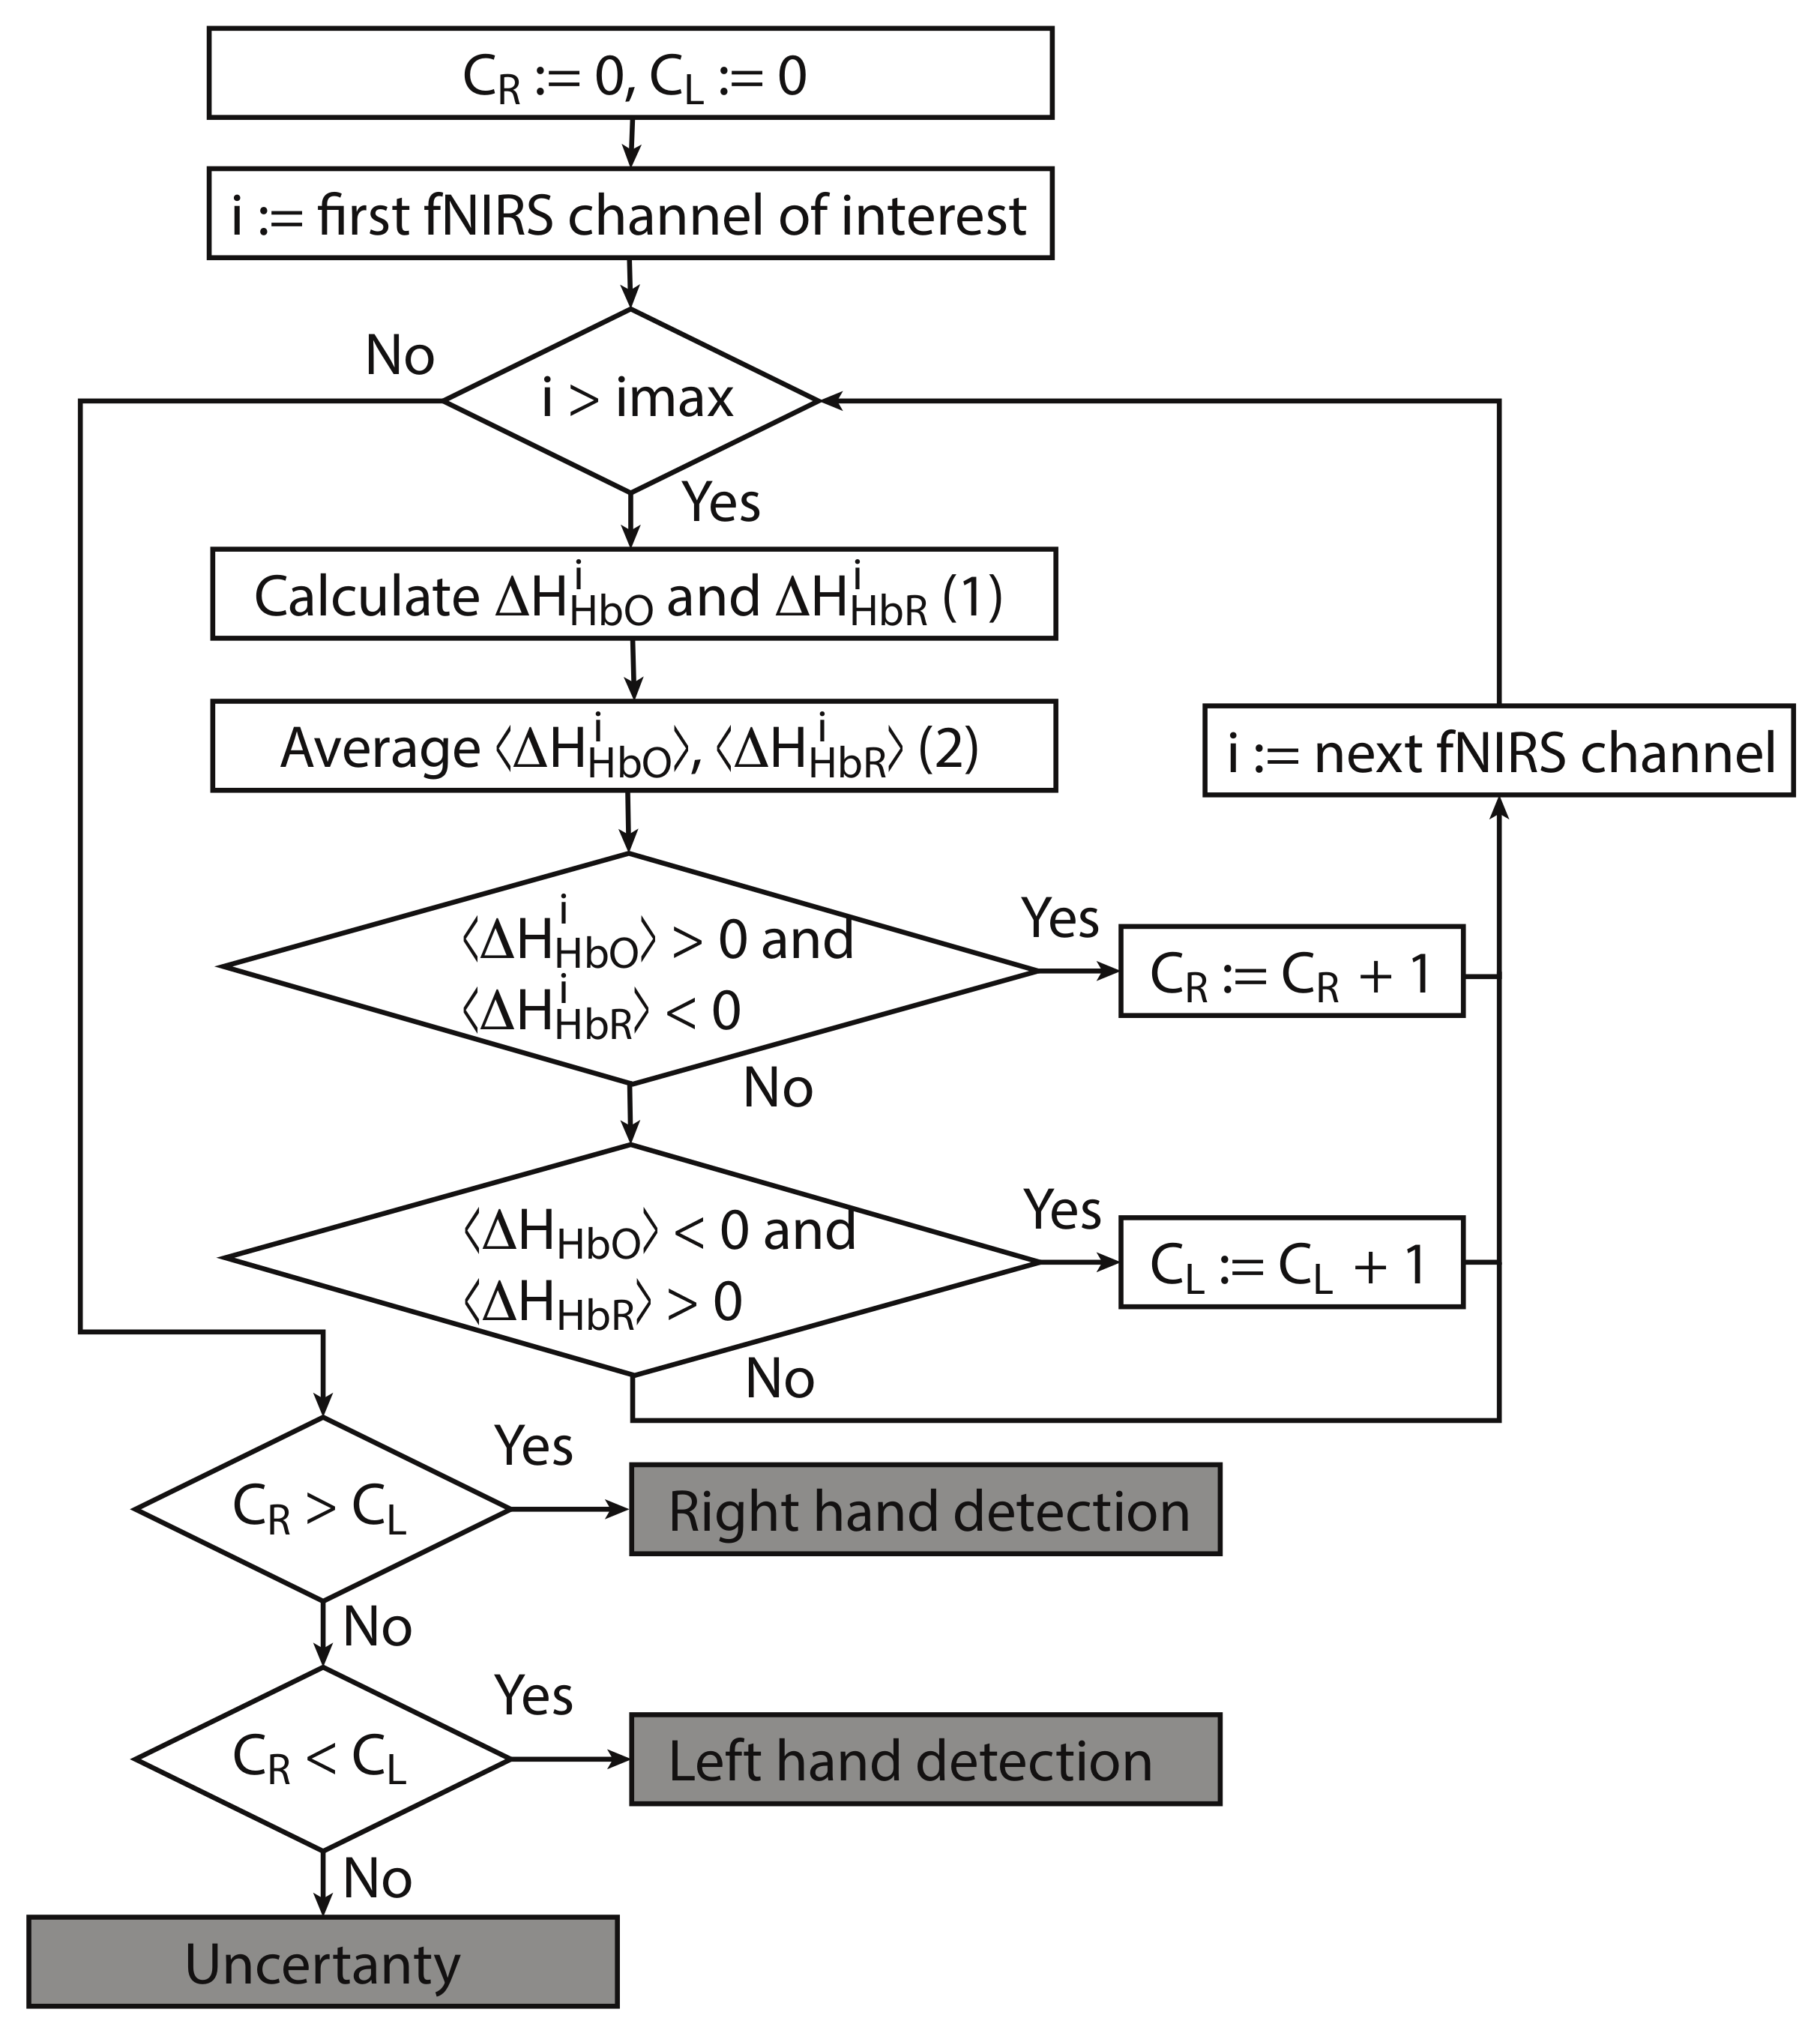
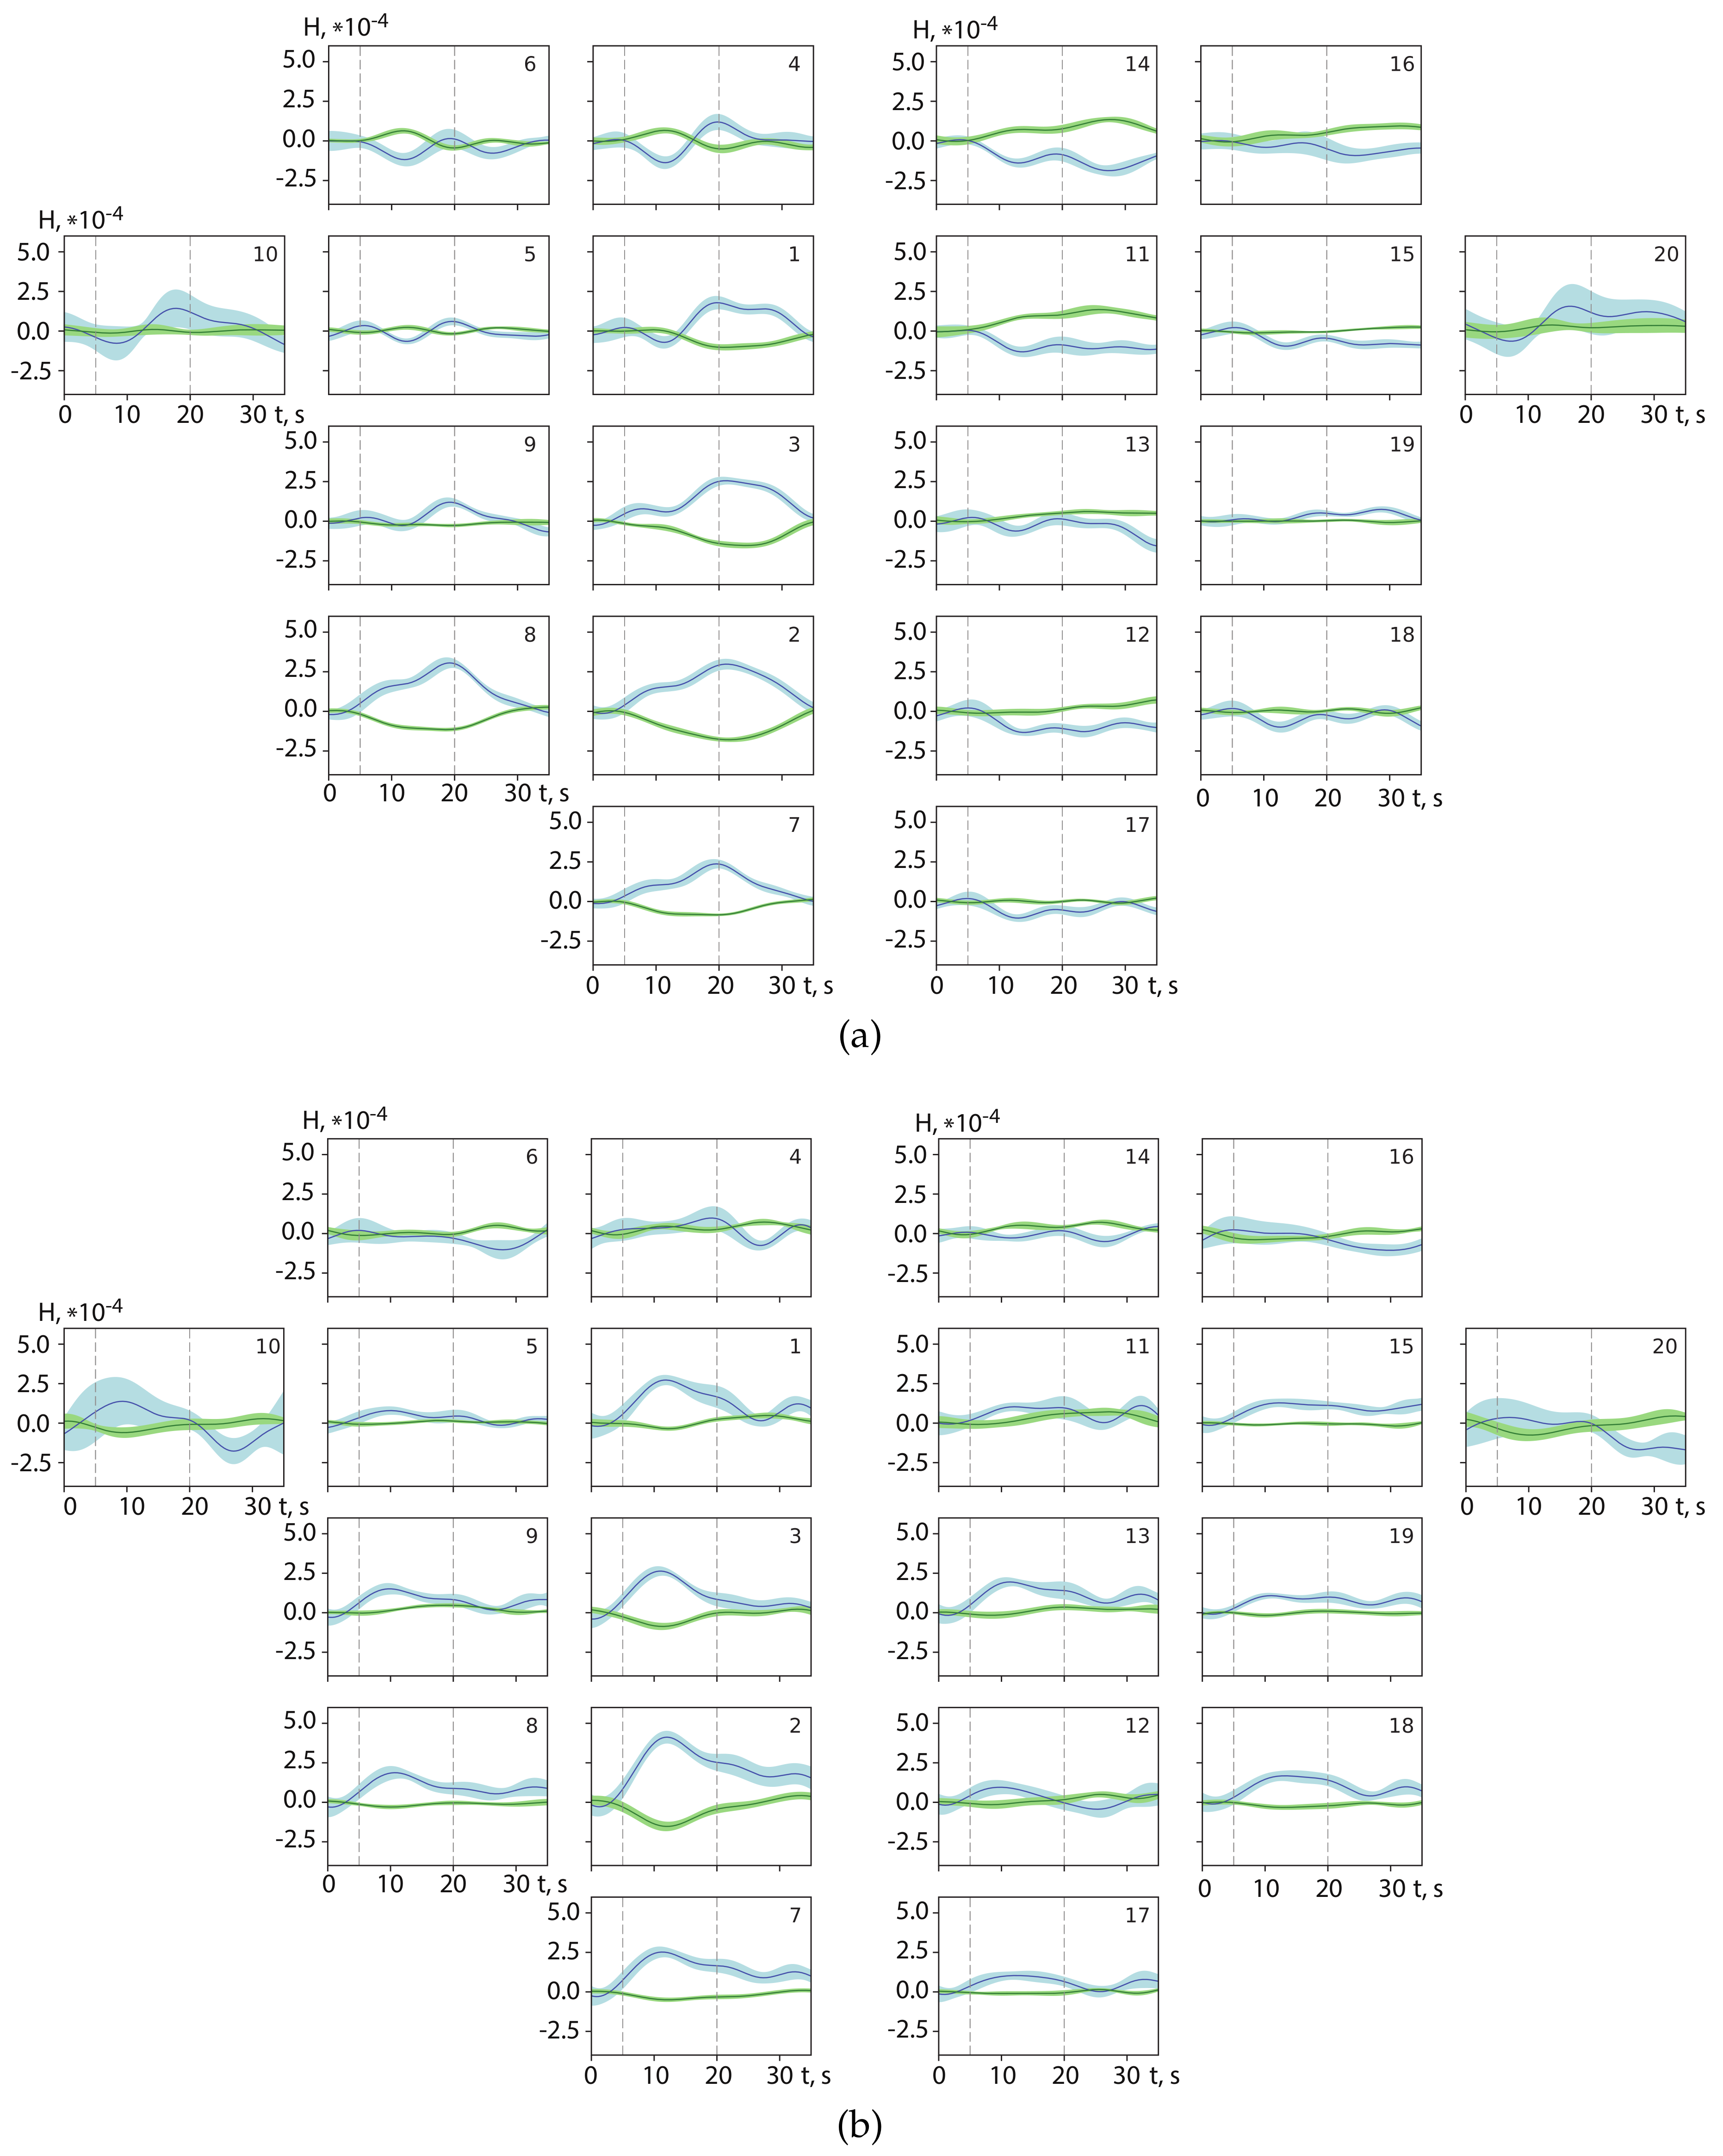
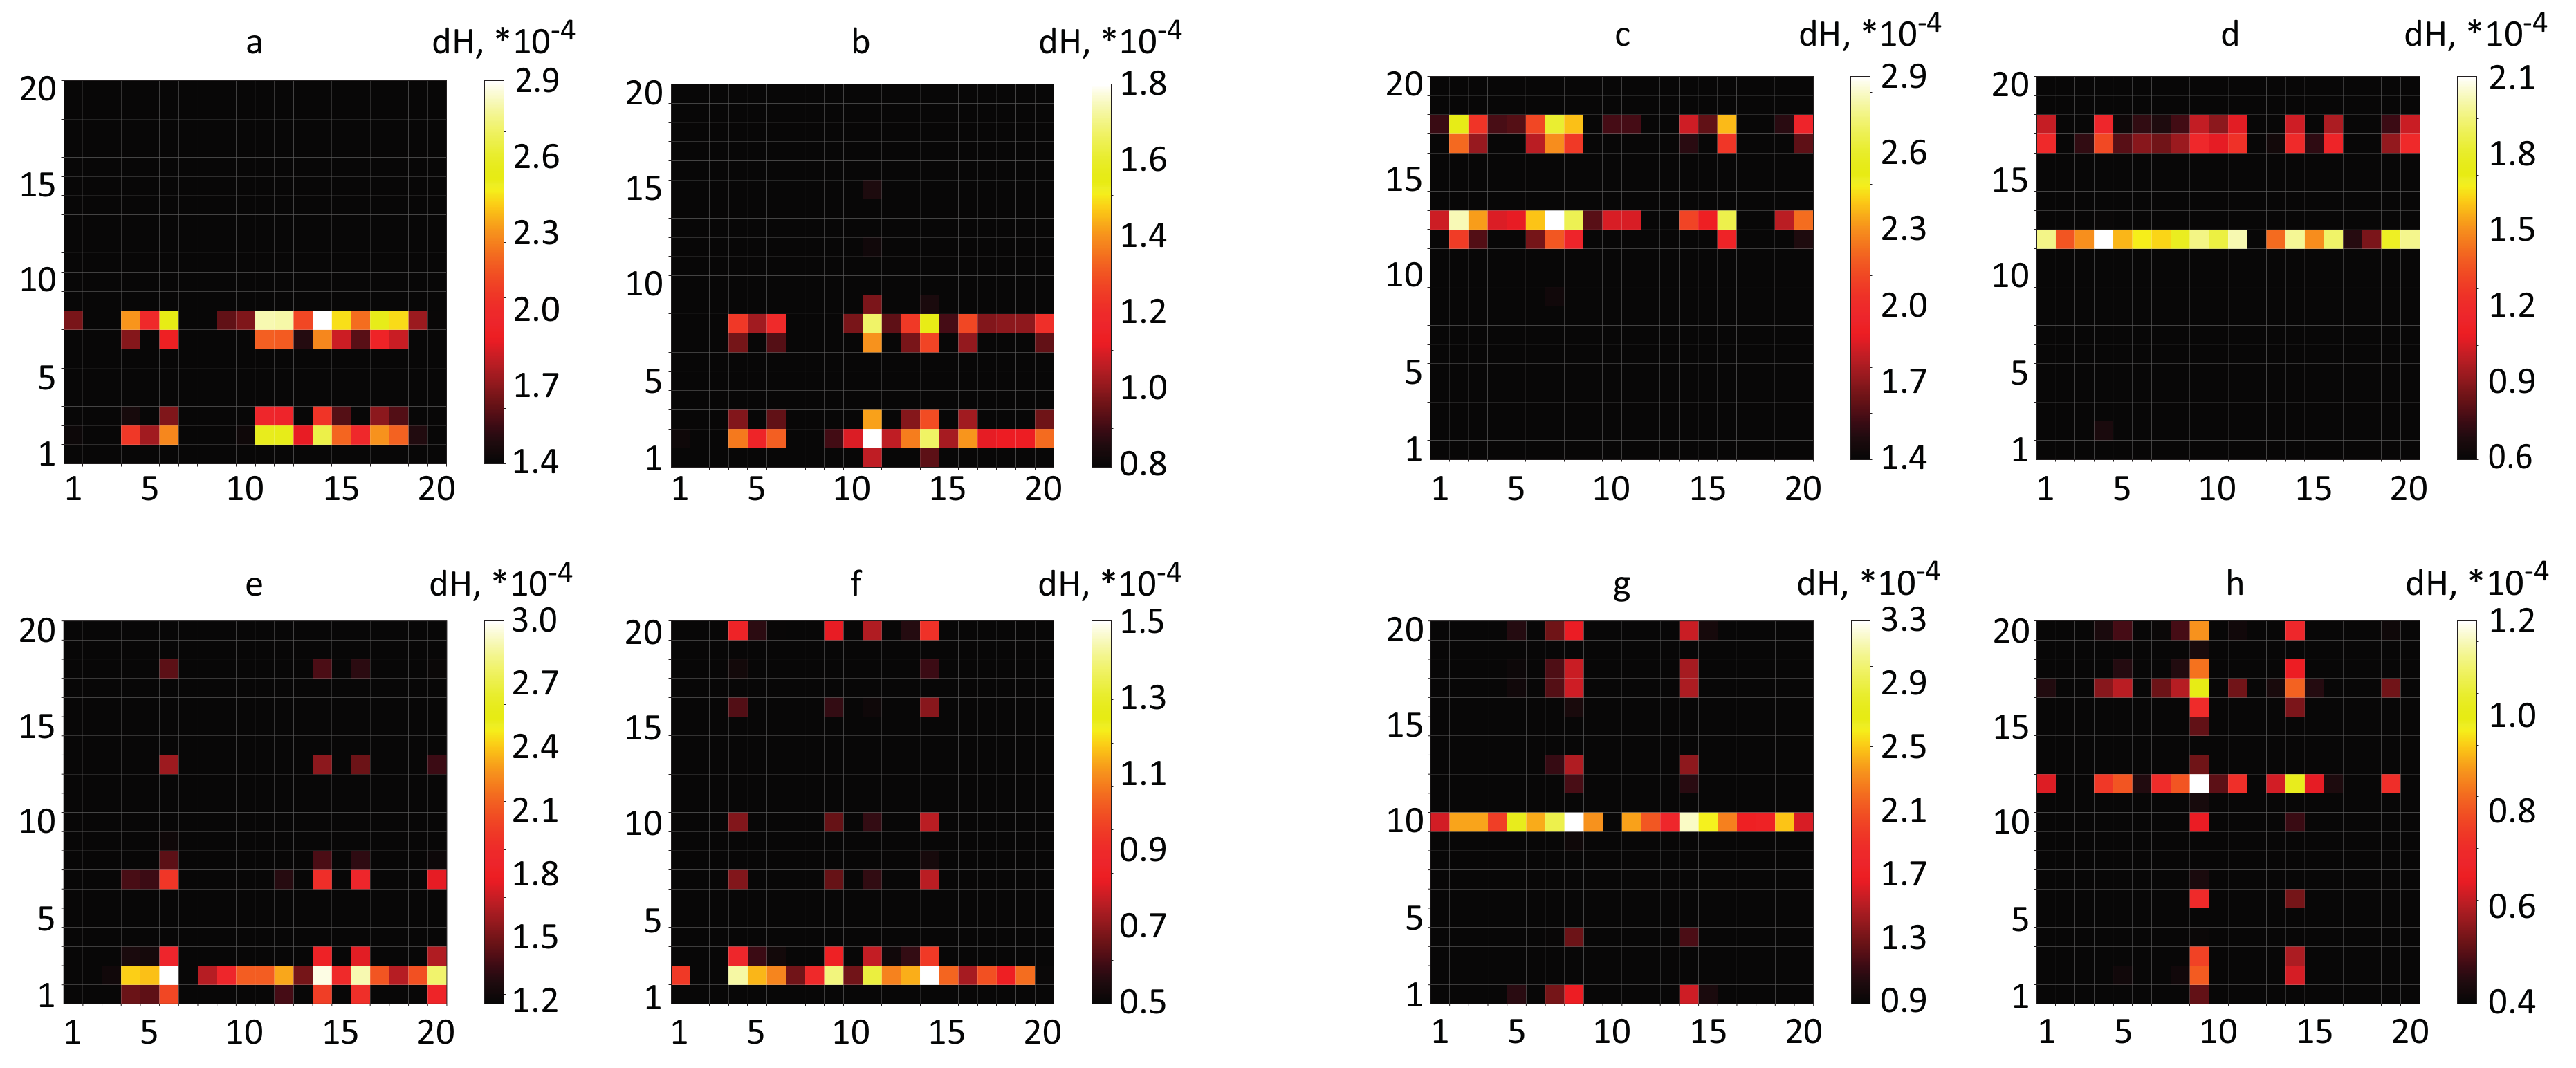
  • For each considered channel i and type of motor activity (right/left hand, execution/imagery) we subtract spatial oxyhemoglobin (HbO) ( H HbO i ) and deoxyhemoglobin (HbR) ( H HbR i ) distributions for the right hemisphere ( H R j , fNIRS channels j of interest from right hemisphere) from the corresponding distribution for the left hemisphere ( H L i , symmetrical channels i from left hemisphere). Similar to our approach (2) which uses average values, we calculate differences for individual symmetrical channels in the left and right hemispheres as
    Δ H HbO i = H HbO , L i H HbO , R j , Δ H HbR i = H HbR , L i H HbR , R j .
  • Then, we average Δ H HbO i and Δ H HbOR i over the time interval corresponding to motor activity T ( 5 , 20 ) s to find Δ H HbO i T and Δ H HbO i T as
    Δ H HbO i T = T Δ H HbO i d t , Δ H HbR i T = T Δ H HbR i d t .
  • For each separate fNIRS signal trial, we calculate characteristics C R and C L taking into account the following criteria for each considered symmetric fNIRS channels in the left and right hemispheres.
    (i)
    If Δ H HbO i T > 0 and Δ H HbR i T < 0 is true for one of the channels i, then C R : = C R + 1 (value C R takes discrete values, minimal value is C R = 0 and peak value is equal to the number of considered fNIRS channels of interest in one of the hemispheres).
    (ii)
    If Δ H HbO i T < 0 and Δ H HbR i T > 0 is true for one of the channels i, then C L : = C L + 1 (value C R takes discrete values, minimal value is C L = 0 and peak value is the same as peak value of C R ).
  • Finally, we make a decision according to the following criteria.
    (i)
    If C R > C L , then right-hand (real or imaginary) motor activity takes place.
    (ii)
    If C R < C L , then left-hand (real or imaginary) activity takes place.
    (iii)
    If C R = C L , then the type of activity is uncertain.

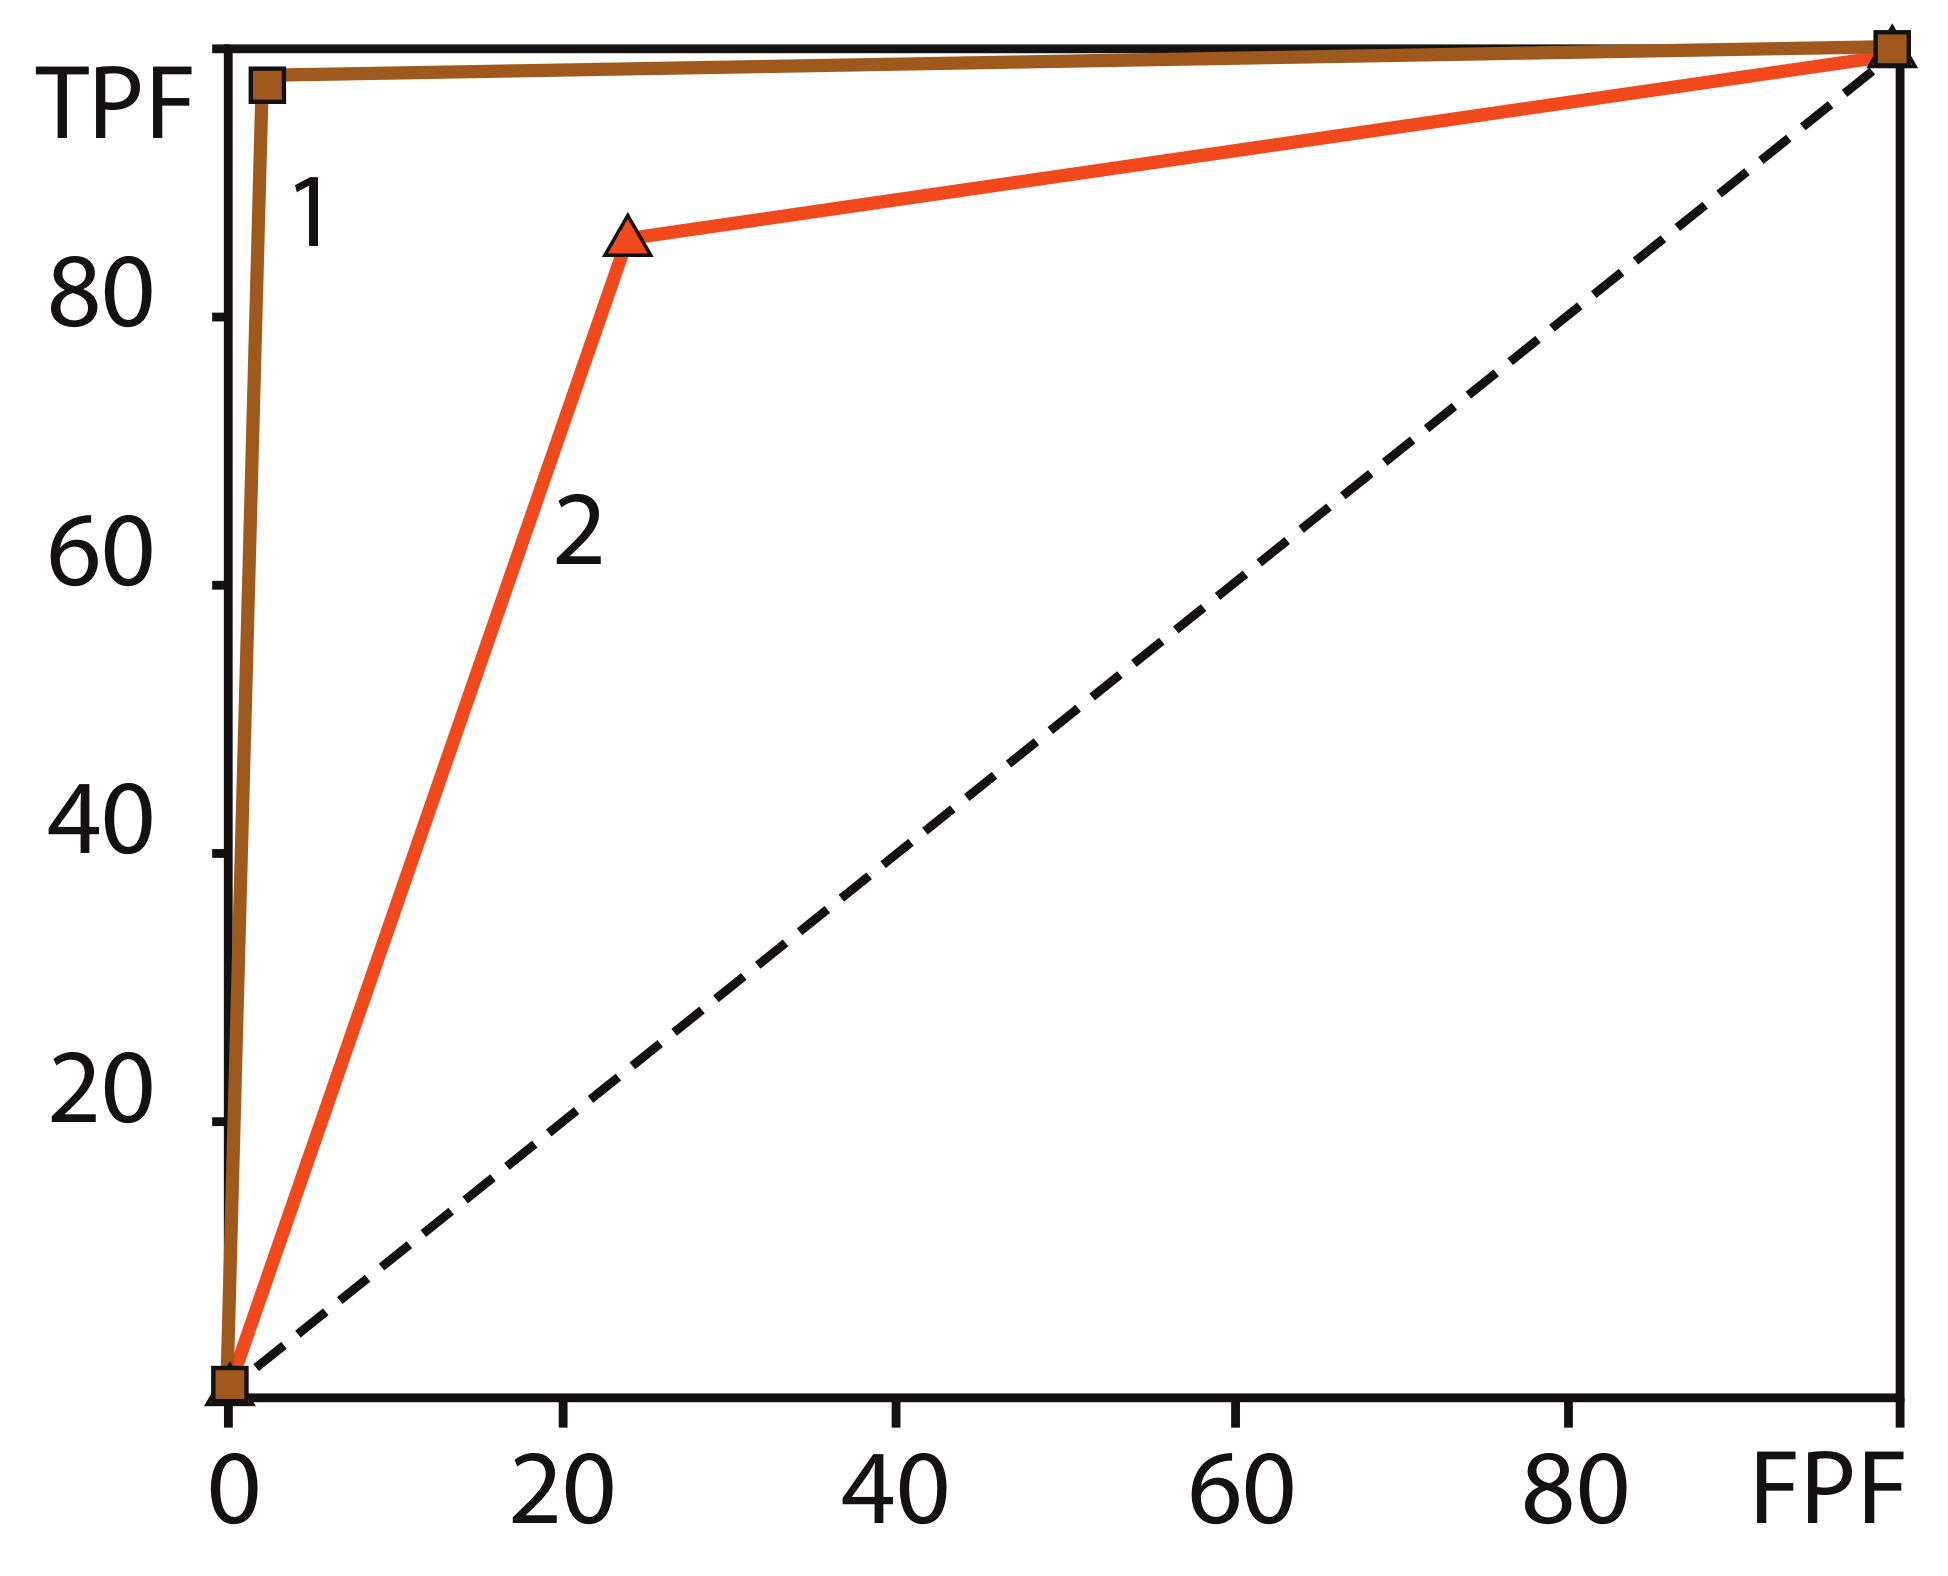
2.7. Estimation of Classification Accuracy of Brain Activity During Motor Execution and Motor Imagery

In order to generalize the results of statistical analysis to an independent data set, we applied the classical k-fold cross-validation technique [51] with k = 10 and 20 fNIRS trials to every subsample. Additionally, the accuracy of the proposed detection method was evaluated by computing a percentage of true positive and false positive, true and false negative detections, sensitivity and specificity [52,53] using a 20-min experimental session, during which (i) the commands described in Section 2.3 (to perform real/imaginary movement with left/right hand) were issued to the subject and (ii) the classification algorithm recognised the type of movement using only 6 fNIRS channels. The true positive ( T P ) was computed as a percentage of correctly classified trials of right hand, and true negatives ( T N ) correctly classified trials of left hand. The false positive/negative ( F P / F N ) represents a percentage of incorrect automatically detected motor actions ( F P being the trials classified as right-hand motor activity, but actually performed as left-hand motor activity, while F N denotes the opposite situation).
The true positive fraction ( T P F ) or sensitivity, true negative fraction ( T N F ) or specificity, and false positive fraction ( F P F ) of the method were assessed as [54]
T P F = T P T P + F N × 100 % , T N F = T N T N + F P × 100 % , F P F = 1 T N F .

3. Results

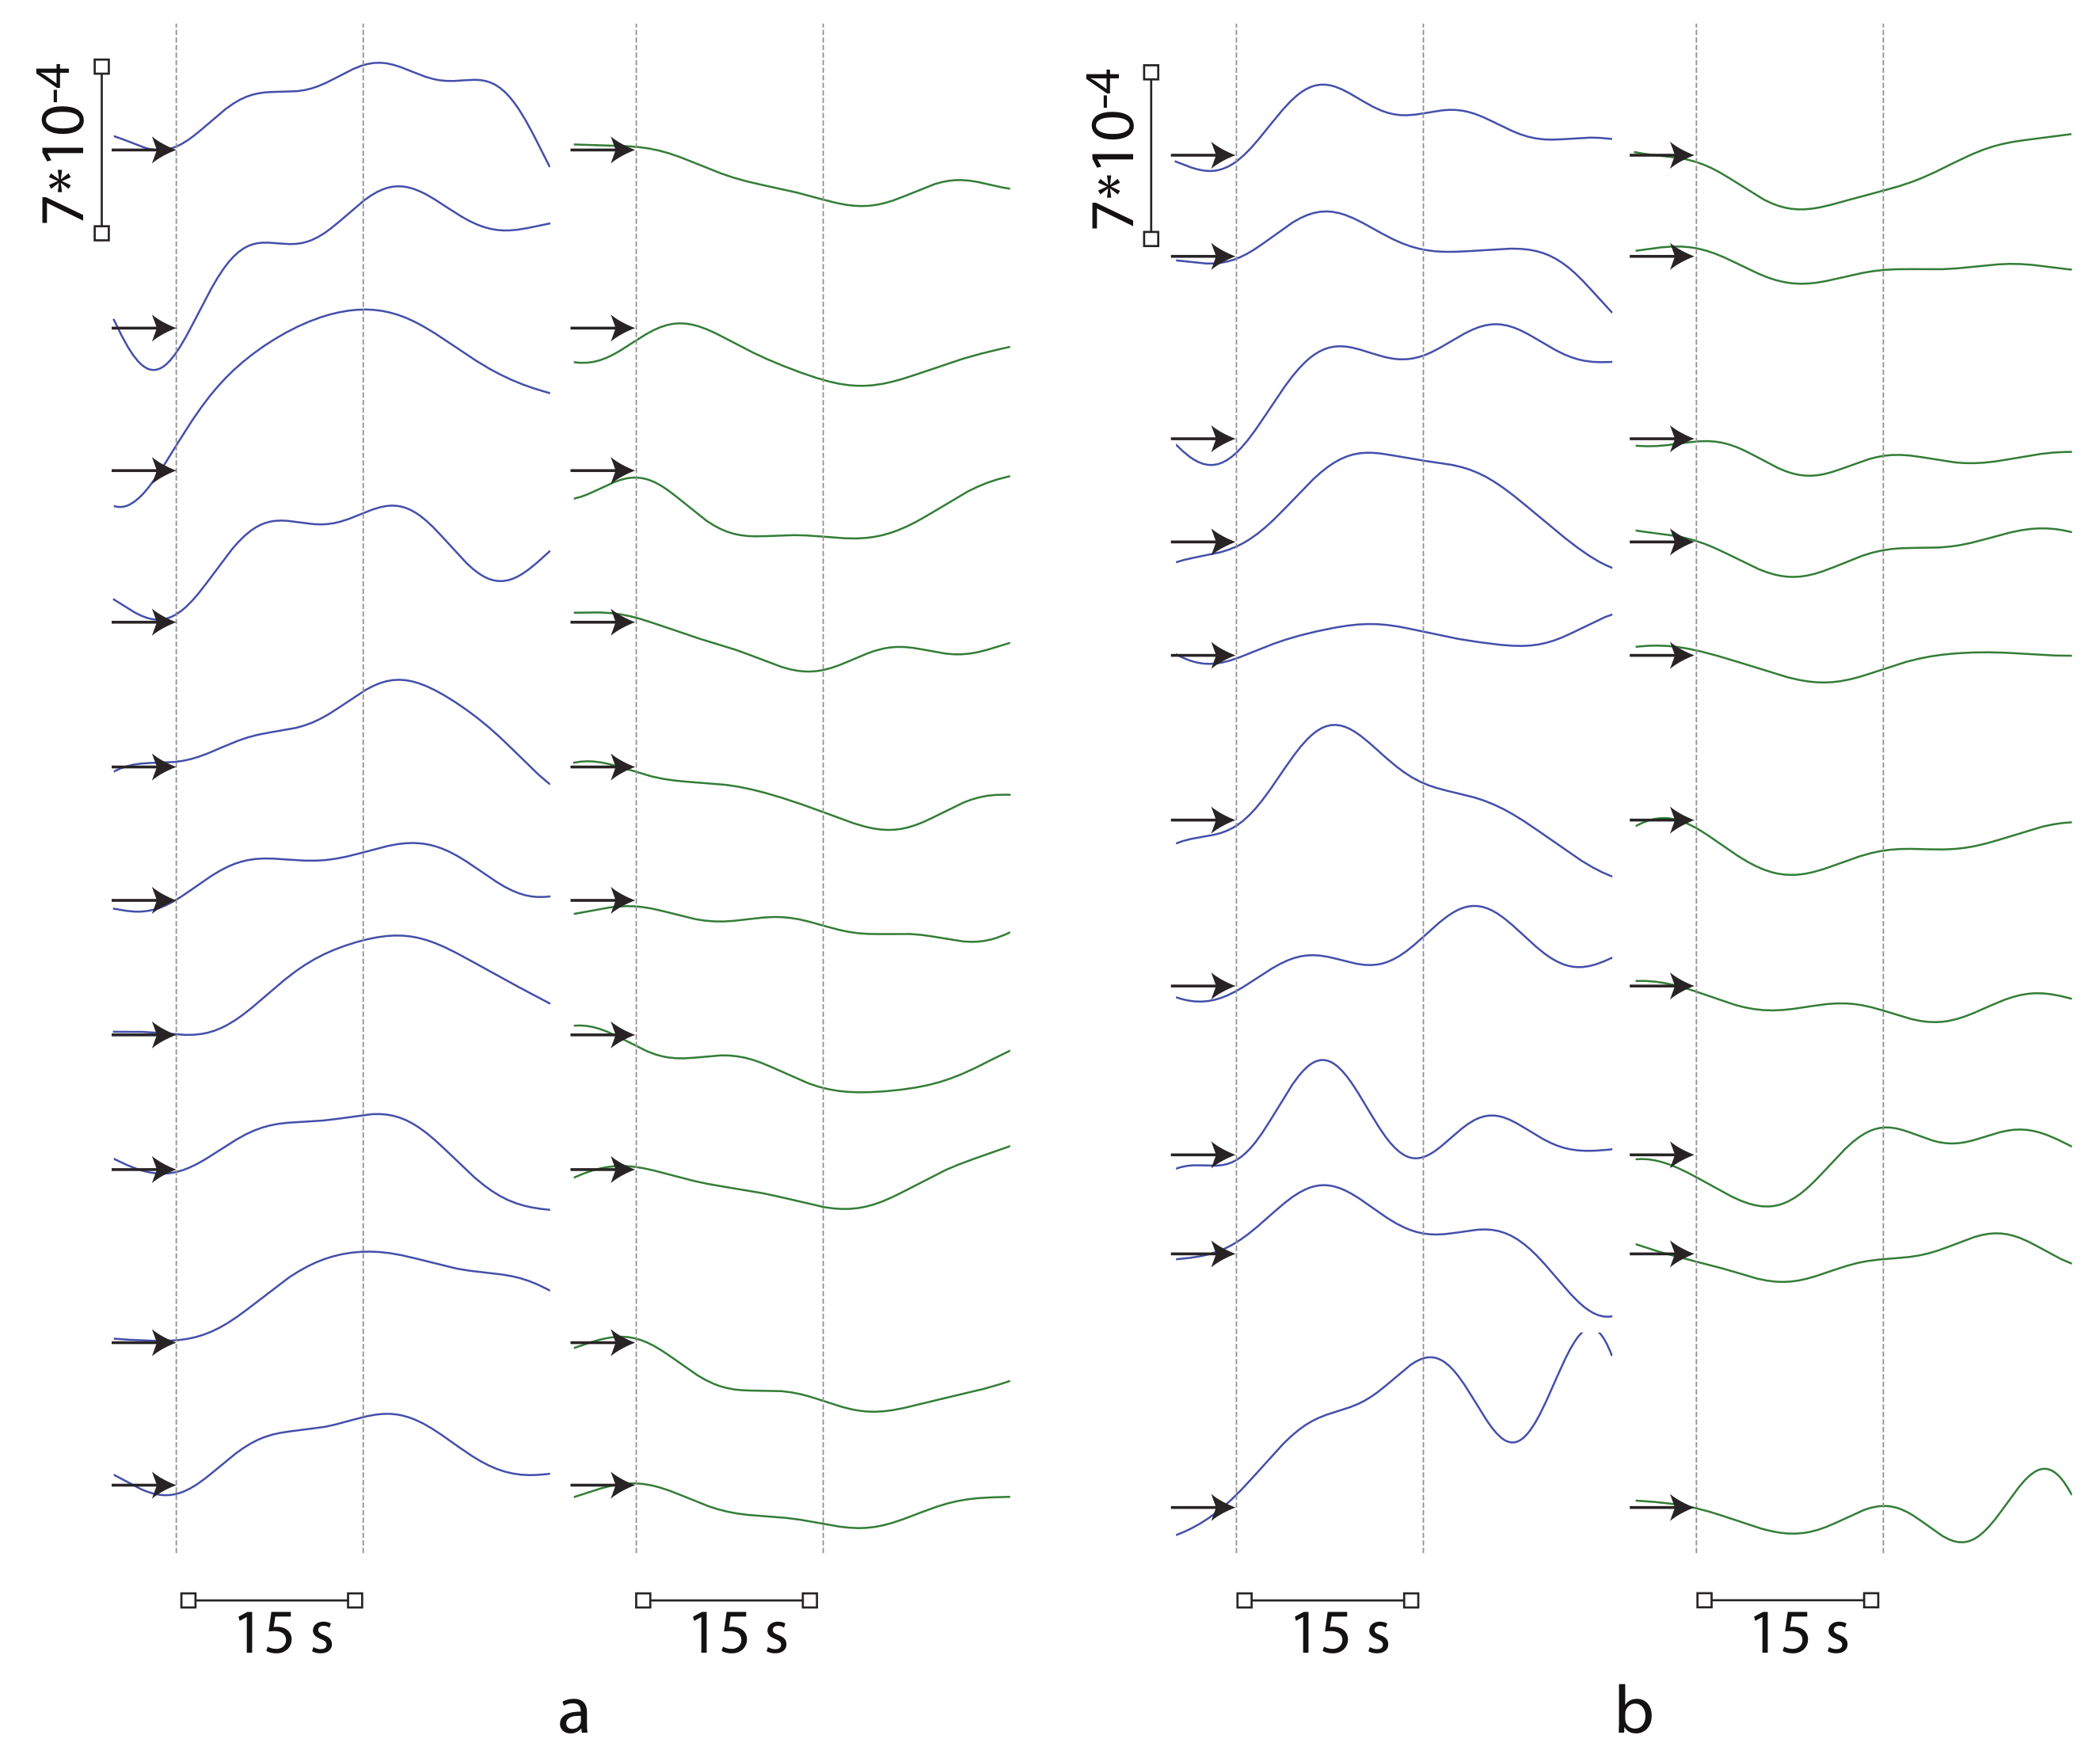
3.1. Spatial Brain Activity During Motor Execution and Motor Imagery

Figure 5 displays the results of the analysis of complex spatial brain activity in the primary motor cortex M1 detected by fNIRS. In Figure 5a,b we plot spatial distributions of oxyhemoglobin and deoxyhemoglobin, averaged over 10 trials of right-hand motor execution and right-hand motor imagery, respectively. The results for all 20 fNIRS channels are presented as mean values with a standard error.
In the case of motor execution, as seen from Figure 5a, several fNIRS channels demonstrate very specific dynamics; increasing oxyhemoglobin is accompanied by a corresponding decrease in deoxyhemoglobin during any motor activity, either real or imaginary (in time intervals between vertical dashed lines). We should note that this dynamics is much more pronounced in the left hemisphere (e.g., for channels 2, 3, 7, 8) for right hand and in the right hemisphere (for symmetric channels 12, 13, 17, 18) for left hand. Such a behavior, strongly linked to specific fNIRs channels, opens the opportunity to classify motor activity according to right and left hands.
It is worth noting that the above dynamics is less notable for motor imagery than for motor execution. As seen from Figure 5b, the oxyhemoglobin level slowly increases approximately 10 s after the beginning of movement imagination. The presence of the well-pronounced features of the hemodynamic response during motor imagery is very promissing for using fNIRS signals, to some degree, for detection of imaginary movements.
The most informative channels are those which display pronounced features of the hemodynamic response when performing both motor execution and motor imagery with left or right hand. The analysis of these channels is present in Figure 6 where we plot the matrices of functional connectivity (3) and () in the motor cortex for different types of motor activity (real/imaginary) related to right and left hands. First of all, one can clearly seen laterality between real and imaginary movements of left and right hands. When moving the right hand, the channels 2, 7 and 8 in the left hemisphere are most active exhibiting largest changes in the hemodynamic response. Whereas, when moving the right hand, the symmetric channels 12, 17 and 18 in the right hemisphere display the most pronounced activity. As a consequence, both an increase in oxygenation and a decrease in deoxygenation turn out to be informative in the mentioned channels, and its dynamics and connections with other channels are clearly seen in the connectivity matrices distributions. Secondly, the comparison of the brain response to real and imaginary movements allows us to conclude that motor execution yields a more accurate hemodynamic response. However, in the case of motor imagery, there is a strong connection with channel 2 in the left hemisphere for right hand, and channels 11 and 12 in the right hemisphere for left hand. At the same time, there is the activation (albeit less in amplitude as compared to real movements) of channels 7/8 and 17/18 for left/right hand, respectively. Since the particular areas of the motor cortex are responsible for different types of movement (real/imaginary), the fNIRS neuroimaging can be used for real-time diagnostics of motor activity.

3.2. Results of Real-Time Classification of Brain Activity

The main problem when creating any BCI based on motor imagery is a correct classification of single EEG/MEG trials. While averaged trials are usually exhibit a clearly pronounced difference between various types of movements (e.g., with left/right hand motor imagery), in the case of single trials, the classification problem is more drastic due to a high variability of EEG or MEG brain signals during imagination, as well as the existence of strong noise. Typically, the classification accuracy does not exceed 80% when special mathematical methods are applied, such as, e.g., SVM machines [55], wavelets [36,56], multilayer perceptrons [4], and recurrence quantitative measures [38].
The main advantage of fNIRS, as we demonstrated in the previous section, is a stable picture of spatial dynamics of oxygenation and deoxygenation in the M1 motor cortex during both real and imaginary movements. As seen from Figure 5, oxyhemoglobin and deoxyhemoglobin distributions exhibit qualitatively different dynamics on fNIRS channels in the left hemisphere and symmetric channels in the right hemisphere during 5–20 s intervals of right-hand motor execution/imagery. Considering the difference between hemoglobin dynamics in the left and right hemispheres, we can conclude that the oxyhemoglobin difference is mostly positive, while the deoxyhemoglobin difference is typically negative. In the case of left-hand motor activity, the opposite situation occurs, namely, the difference between signals from the left and right hemispheres is negative for oxyhemoglobin and positive for deoxyhemoglobin. It should be noted that these differences are manifested in the dynamics of i = { 2 , 7 , 8 } fNIRS channels in the left hemisphere and j = { 12 , 17 , 18 } symmetric channels in the right hemisphere.
This situation is illustrated in Figure 7, where plot the differences in temporal distributions of oxyhemoglobin and deoxyhemoglobin between left and right hemispheres for 10 trials recorded by fNIRS channels 2 and 12 for one subject. These results display the difference in the brain response between real and imaginary right-hand movements. The repeatability of the hemodynamic response in the motor cortex is clearly seen in Figure 7, when the same type of motor action is performed or imagined. One can also note the stability of the repeated maxima in the oxygenation difference between left and right hemispheres corresponding to real movement, whereas the maxima corresponding to motor imagery are unstable and varied over the trials. However, the tendency to increase the positive difference remains. Similar conclusions can be made when analyzing deoxygenation, but in this case the difference is negative. As a result, we can use these changes in oxygenation and deoxygenation dynamics in the left and right hemispheres as markers for classifying the type of movement and develop a method for online classification of right/left-hand motor activity based on fNIRS data.
Finally, we implemented the classification algorithm described in Section 2.6 in our fNIRS-based experimental system for online classification of real and imaginary motor actions. We used the proposed classifier with six fNIRS channels i = { 2 , 7 , 8 } in the left hemisphere and j = { 12 , 17 , 18 } symmetric channels in the right hemisphere. Notably, in the majority of cases the type of motor action (both real and imagery) in all subjects was correctly identified by the data from only three fNIRS channels. Table 1 shows the results of automatic classification of left/right hand real and imaginary movements, as well as statistical analysis of true positive fraction, true negative fraction, and false positive fraction calculated with Equation (7).
Figure 8 shows the receiver operating characteristic (ROC) curves for right/left hand motor action, which displays the values of false positive fraction ( F P F ) versus true positive fraction ( T P F ). In the considered case, the ROC curves have two segments ( 0 , 0 ) ( F P F , T P F ) ( 100 , 100 ) (in %) because a binary classifier (in our case, the decision tree) can only take the values of either 0 or 1. The statistical analysis shows that the selectivity and specificity of the classifier are sufficiently high and reach 85%–100%. The areas under the ROC curves in Figure 8 indicate that the accuracy of the binary algorithm for motor execution is higher than for motor imagery. The number of incorrectly detected and uncertain events is about 5%–20%. This reflects the fact that real and imaginary motor actions by left and right hands are reliably recognized using eight sources and eight fNIRS detectors, followed by data processing of spatial brain activity with the simple online decision tree-based classifier.

4. Discussion

The classification of brain activity trials associated with motor imagery using different methods of neuroimaging is a modern research topic widely explored by many researchers from different fields of science [13,57,58]. The diverse literature indicates that different brain regions can be involved in motor imaginary [59], including primary motor cortex (M1) [60], supplementary motor area (SMA) [61], posterior parietal cortex (PPC) [62], prefrontal cortex [63], etc. Moreover, there are at least two types of motor imagination (kinesthetic and visual) characterised by the involvement of various areas of the brain cortex. In particular, a well-pronounced suppression of alpha activity was observed in the occipital region in subjects exhibiting the visual type of motor imagery. In contrast, kinesthetic subjects displayed a pronounced suppression of mu activity in the motor and somatosensory cortexes [16]. In the referenced paper, 65%–80% classification accuracy was reported when choosing optimal MEG channels for both kinesthetic and visual untrained subjects. Notably, such accuracy for untrained subjects is similar to classification accuracy obtained in EEG studies with trained subjects [64]. Based on the effect of suppressing mu/alpha and beta activity during motor imagery, it is possible to obtain up to 70%–85% accuracy using various classifiers, including machine learning methods, SVM, ICA, etc. [65]. The main obstacle for achieving higher classification accuracy of single trials is the significant variability of temporal-spatial brain activity during motor imagery, which does not allow revealing universal patterns associated with a particular type of motor imagination.
In addition, the use of the hemodynamic response for the classification of motor imagery (e.g., for neurorehabilitation) also imposes a number of limitations. Firstly, the hemodynamic response is quite inertial, so that the registration of mild changes in oxygenation and deoxygenation of blood is required in the area of interest. Secondly, due to a relatively high cost and a large size, the MRI equipment is usually used in clinics for diagnosis, but not for regular training of motor imagery to restore motor activity after a stroke, as in the case of using EEG. In this context, it is of considerable interest to use the fNIRS device as a sensor of brain activity with an appropriate classification algorithm for the allocation of motor-related brain activity on the sensor level. As we have shown, the hemodynamic response generated by motor activity is strong enough to distinguish the corresponding region of the motor cortex responsible for the motor pattern formation. Thanks to the hemodynamic analysis, which is not sensitive to EEG background activity, it is possible to increase classification accuracy due to better signal repeatability in the analysis of single events. As a result, the classification accuracy of imaginary activity was increased up to more than 90%, which is quite sufficient for medical practice in neurorehabilitation procedures. It is important to emphasize that the fNIRS-based sensor is able to classify not only the kinesthetic mode of imagination, which is characterized by a pattern similar to real movements but also the visual type of imagination. However, we have to assume that in some cases, the classifier cannot recognize motor activity (the “uncertanity” algorithm branch in Figure 4).
In conclusion, it should be noted that imaginary movements are often used to form control commands in active brain-computer interfaces (BCI) [66,67]. Typically, such systems are based on the registration of electric brain activity (EEG) due to the fact that EEG gives a very fast response to changes in cognitive states. Moreover, EEG sensors are cheap and portable and do not impede the subject movement. Although the proposed fNIRS-based sensor system is also portable that allows the installation of sources and detectors faster and more convenient than EEG (or the same in the case of dry EEG electrodes [68,69,70]), the fNIRS device is more expensive than EEG. At the same time, the number of needed fNIRS channels for classifying activity is not high that can reduce the system cost. On the other hand, due to slow hemodynamic response, fNIRS exhibits a relatively large delay in detecting brain activity as compared to EEG, which restrict its application in BCIs. Nevertheless, the proposed fNIRS classifier can be used as a motor imagery sensor in neurorehabilitation systems with patients for which a 10–15 s latency is not significant. However, if such a BCI is used in game interfaces [71,72] or control interfaces of external devices (wheelchair, manipulator, etc.) [73,74,75], such delay time is critical and negate the advantages of our system in classification accuracy of brain states. One of the possible solutions to this problem could be the use of hybrid fNIRS-EEG BCIs [76,77,78]. The consideration of this type of classifier is out of the scope of this paper and might be the matter of future research.

5. Conclusions

In this paper, we have carried out the analysis of fNIRS data acquired during real and imaginary movements. Distinct spatial dynamics in the motor cortex when performing motor actions (real or imaginary) with the left or right hand exhibits pronounced laterality between two hemispheres. This allowed us to reveal hemodynamic biomarkers for classification of the type of movement. The proposed fNIRS-based sensor provides close to 100% recognition accuracy in the detection of real movements, while the classification accuracy of motor imagery is a little smaller and reach 90%.
The important advantage of the proposed method is the possibility to efficiently classify different types of movement, both real and imaginary, without recalculation of the system parameters. This essential feature of the developed sensor results from pronounced laterality of the hemodynamic brain response to motor activity.
The knowledge of the hemodynamic behavior in the motor cortex during real and imaginary motor activity along with approaches for its detection can be helpful not only for fundamental studies on human motor-related tasks but also for the development of fNIRS-based BCIs.

Author Contributions

Conceptualization, A.E.H. and V.G.; methodology, A.E.H. and V.A.M.; software, A.N.P.; validation, A.N.P. and A.B.; experimental investigation, V.G. and A.B.; data curation, A.E.H. and V.G.; writing–original draft preparation, A.E.H., V.G. and A.N.P.; visualization, A.E.H. and V.G.; supervision, A.E.H.; project administration, A.E.H.; preparation of revised manuscript, A.E.H., V.G. and A.N.P. All authors have read and agreed to the published version of the manuscript.

Funding

This research was funded by the Russian Science Foundation (17-72-30003) in the part of experimental study and development of classification algorithm, and President program for leading scientific school support (NSH-2594.2020.2) in the part of analysis of brain hemodynamic response during motor act.

Conflicts of Interest

The authors declare no conflict of interest. The funders had no role in the design of the study; in the collection, analyses, or interpretation of data; in the writing of the manuscript, or in the decision to publish the results.

Abbreviations

The following abbreviations are used in this manuscript:
fNIRSFunctional near-infrared spectroscopy
BCIBrain-computer interface
EEGElectroencephalography
MRIMagnetic resonance imaging
MEGMagnetoencephalography
ERSEvent-related synchronization
ERDEvent-related desynchronization
HbOoxygenated
HbRdeoxygenated
SVMSupport vector machine
ICAIndependent component analysis
ROCReceiver operating characteristic

References

  1. Rabinovich, M.I.; Varona, P.; Selverston, A.I.; Abarbanel, H.D.I. Dynamical principles in neuroscience. Rev. Mod. Phys. 2006, 78, 1213–1265. [Google Scholar] [CrossRef] [Green Version]
  2. Deco, G.; Jirsa, V.K.; McIntosh, A.R. Emerging concepts for the dynamical organization of resting-state activity in the brain. Nat. Rev. Neurosci. 2011, 12, 43–56. [Google Scholar] [CrossRef] [PubMed]
  3. Hramov, A.E.; Frolov, N.S.; Maksimenko, V.A.; Makarov, V.V.; Koronovskii, A.A.; Garcia-Prieto, J.; Antón-Toro, L.F.; Maestú, F.; Pisarchik, A.N. Artificial neural network detects human uncertainty. Chaos 2018, 28, 033607. [Google Scholar] [CrossRef] [PubMed]
  4. Maksimenko, V.A.; Kurkin, S.A.; Pitsik, E.N.; Musatov, V.Y.; Runnova, A.E.; Efremova, T.Y.; Hramov, A.E.; Pisarchik, A.N. Artificial neural network classification of motor-related EEG: An increase in classification accuracy by reducing signal complexity. Complexity 2018, 2018, 9385947. [Google Scholar] [CrossRef] [Green Version]
  5. Edge, L. Working across disciplines in neuroscience. Cell 2019, 179, 283–284. [Google Scholar]
  6. Herculano-Houzel, S. The human brain in numbers: A linearly scaled-up primate brain. Front. Hum. Neurosci. 2009, 3, 31. [Google Scholar] [CrossRef] [Green Version]
  7. Niedermeyer, E.; Fernando, L.S. Electroencephalography: Basic Principles, Clinical Applications, and Related Fields; Lippincott Williams & Wilkins: Philadelphia, PA, USA, 2004. [Google Scholar]
  8. Breakspear, M. Dynamic models of large-scale brain activity. Nat. Neurosci. 2017, 20, 340. [Google Scholar] [CrossRef]
  9. Maksimenko, V.A.; Runnova, A.E.; Frolov, N.S.; Makarov, V.V.; Nedaivozov, V.; Koronovskii, A.A.; Pisarchik, A.; Hramov, A.E. Multiscale neural connectivity during human sensory processing in the brain. Phys. Rev. E 2018, 97, 052405. [Google Scholar] [CrossRef] [Green Version]
  10. Maksimenko, V.A.; Frolov, N.S.; Hramov, A.E.; Runnova, A.E.; Grubov, V.V.; Kurths, J.; Pisarchik, A.N. Neural interactions in a spatially-distributed cortical network during perceptual decision-making. Front. Behav. Neurosci. 2019, 13, 220. [Google Scholar] [CrossRef] [Green Version]
  11. Buch, E.; Weber, C.; Cohen, L.G.; Braun, C.; Dimyan, M.A.; Ard, T.; Mellinger, J.; Caria, A.; Soekadar, S.; Fourkas, A.; et al. Think to move: A neuromagnetic brain-computer interface (BCI) system for chronic stroke. Stroke 2008, 39, 910–917. [Google Scholar] [CrossRef] [Green Version]
  12. Teo, W.P.; Chew, E. Is motor-imagery brain-computer interface feasible in stroke rehabilitation? PM R 2014, 6, 723–728. [Google Scholar] [CrossRef] [PubMed]
  13. Chaudhary, U.; Birbaumer, N.; Ramos-Murguialday, A. Brain-computer interfaces for communication and rehabilitation. Nat. Rev. Neurol. 2016, 12, 513. [Google Scholar] [CrossRef] [PubMed] [Green Version]
  14. Tucker, M.R.; Olivier, J.; Pagel, A.; Bleuler, H.; Bouri, M.; Lambercy, O.; del Millán, J.R.; Riener, R.; Vallery, H.; Gassert, R. Control strategies for active lower extremity prosthetics and orthotics: A review. J. Neuroeng. Rehabil. 2015, 12, 1. [Google Scholar] [CrossRef] [PubMed] [Green Version]
  15. Curran, E.A.; Stokes, M.J. Learning to control brain activity: A review of the production and control of EEG components for driving brain–computer interface (BCI) systems. Brain Cognit. 2003, 51, 326–336. [Google Scholar] [CrossRef]
  16. Chholak, P.; Niso, G.; Maksimenko, V.A.; Kurkin, S.A.; Frolov, N.S.; Pitsik, E.N.; Hramov, A.E.; Pisarchik, A.N. Visual and kinesthetic modes affect motor imagery classification in untrained subjects. Sci. Rep. 2019, 9, 9838. [Google Scholar] [CrossRef] [PubMed] [Green Version]
  17. Wolpaw, J.; Wolpaw, E.W. Brain-Computer Interfaces: Principles and Practice; OUP USA: New York, NY, USA, 2012. [Google Scholar]
  18. Abdalmalak, A.; Milej, D.; Norton, L.; Debicki, D.; Gofton, T.; Diop, M.; Owen, A.M.; Lawrence, K.S. Single-session communication with a locked-in patient by functional near-infrared spectroscopy. Neurophotonics 2017, 4, 040501. [Google Scholar] [CrossRef]
  19. Abdalmalak, A.; Milej, D.; Diop, M.; Shokouhi, M.; Naci, L.; Owen, A.M.; Lawrence, K.S. Can time-resolved NIRS provide the sensitivity to detect brain activity during motor imagery consistently? Biomed. Opt. Express 2017, 8, 2162–2172. [Google Scholar] [CrossRef] [Green Version]
  20. Tomita, Y.; Vialatte, F.B.; Dreyfus, G.; Mitsukura, Y.; Bakardjian, H.; Cichocki, A. Bimodal BCI using simultaneously NIRS and EEG. IEEE Trans. Biomed. Eng. 2014, 61, 1274–1284. [Google Scholar] [CrossRef]
  21. Schudlo, L.C.; Chau, T. Towards a ternary NIRS-BCI: Single-trial classification of verbal fluency task, stroop task and unconstrained rest. J. Neural Eng. 2015, 12, 066008. [Google Scholar] [CrossRef]
  22. Power, S.D.; Kushki, A.; Chau, T. Automatic single-trial discrimination of mental arithmetic, mental singing and the no-control state from prefrontal activity: Toward a three-state NIRS-BCI. BMC Res. Notes 2012, 5, 141. [Google Scholar] [CrossRef] [Green Version]
  23. Nicolas-Alonso, L.F.; Gomez-Gil, J. Brain computer interfaces, a review. Sensors 2012, 12, 1211–1279. [Google Scholar] [CrossRef] [PubMed]
  24. Lemm, S.; Schafer, C.; Curio, G. BCI competition 2003-data set III: Probabilistic modeling of sensorimotor/ spl mu/rhythms for classification of imaginary hand movements. IEEE Trans. Biomed. Eng. 2004, 51, 1077–1080. [Google Scholar] [CrossRef] [PubMed]
  25. Jeannerod, M. Mental imagery in the motor context. Neuropsychologia 1995, 33, 1419–1432. [Google Scholar] [CrossRef]
  26. Munzert, J.; Lorey, B.; Zentgraf, K. Cognitive motor processes: The role of motor imagery in the study of motor representations. Brain Res. Rev. 2009, 60, 306–326. [Google Scholar] [CrossRef] [PubMed]
  27. Sharma, N.; Jones, P.S.; Carpenter, T.; Baron, J.C. Mapping the involvement of BA 4a and 4p during motor imagery. Neuroimage 2008, 41, 92–99. [Google Scholar] [CrossRef]
  28. Solodkin, A.; Hlustik, P.; Chen, E.E.; Small, S.L. Fine modulation in network activation during motor execution and motor imagery. Cerebral Cortex 2004, 14, 1246–1255. [Google Scholar] [CrossRef]
  29. Daly, D.; Pedley, T. Current Practice of Clinical Electroencephalography; Raven Press: New York, NY, USA, 1990. [Google Scholar]
  30. Zschocke, S.; Speckmann, E.J. Basic Mechanisms of the EEG; Birkhäuser: Boston, MA, USA, 1993. [Google Scholar]
  31. Buzsaki, G.; Draguhn, A. Neuronal oscillations in cortical networks. Science 2004, 304, 1926–1929. [Google Scholar] [CrossRef] [Green Version]
  32. Jorge, J.; Van der Zwaag, W.; Figueiredo, P. EEG-fMRI integration for the study of human brain function. Neuroimage 2014, 102, 24–34. [Google Scholar] [CrossRef]
  33. Wackermann, J.; Lehmann, D.; Dvorak, I.; Michel, C.M. Global dimensional complexity of multi-channel EEG indicates change of human brain functional state after a single dose of a nootropic drug. Electroencephal. Clin. Neurophysiol. 1993, 86, 193–198. [Google Scholar] [CrossRef]
  34. Pavlov, A.; Grishina, D.; Runnova, A.; Maksimenko, V.; Pavlova, O.; Shchukovsky, N.; Hramov, A.; Kurths, J. Recognition of electroencephalographic patterns related to human movements or mental intentions with multiresolution analysis. Chaos Solitons Fractals 2019, 126, 230–235. [Google Scholar] [CrossRef]
  35. Pisarchik, A.N.; Maksimenko, V.A.; Hramov, A.E. From novel technology to novel applications: Comment on “An integrated brain-machine interface platform with thousands of channels” by Elon Musk and Neuralink. J. Med. Internet Res. 2019, 21, e16356. [Google Scholar] [CrossRef] [PubMed]
  36. Maksimenko, V.A.; Pavlov, A.N.; Runnova, A.E.; Nedaivozov, V.; Grubov, V.V.; Koronovskii, A.A.; Pchelintseva, S.V.; Pitsik, E.; Pisarchik, A.; Hramov, A. Nonlinear analysis of brain activity, associated with motor action and motor imaginary in untrained subjects. Nonlinear Dyn. 2018, 91, 2803–2817. [Google Scholar] [CrossRef]
  37. Aliakbaryhosseinabadi, S.; Kamavuako, E.N.; Jiang, N.; Farina, D.; Mrachacz-Kersting, N. Classification of EEG signals to identify variations in attention during motor task execution. J. Neurosci. Methods 2017, 284, 27–34. [Google Scholar] [CrossRef] [PubMed] [Green Version]
  38. Pitsik, E.; Frolov, N.; Hauke Kraemer, K.; Grubov, V.; Maksimenko, V.; Kurths, J.; Hramov, A. Motor execution reduces EEG signals complexity: Recurrence quantification analysis study. Chaos 2020, 30, 023111. [Google Scholar] [CrossRef] [PubMed]
  39. Pfurtscheller, G.; Da Silva, F.L. Event-related EEG/MEG synchronization and desynchronization: Basic principles. Clin. Neurophysiol. 1999, 110, 1842–1857. [Google Scholar] [CrossRef]
  40. Ayaz, H.; Onaral, B.; Izzetoglu, K.; Shewokis, P.A.; McKendrick, R.; Parasuraman, R. Continuous monitoring of brain dynamics with functional near infrared spectroscopy as a tool for neuroergonomic research: Empirical examples and a technological development. Front. Hum. Neurosci. 2013, 7, 871. [Google Scholar] [CrossRef] [PubMed] [Green Version]
  41. Villringer, A.; Chance, B. Non-invasive optical spectroscopy and imaging of human brain function. Trends Neurosci. 1997, 20, 435–442. [Google Scholar] [CrossRef]
  42. Cui, X.; Bray, S.; Bryant, D.M.; Glover, G.H.; Reiss, A.L. A quantitative comparison of NIRS and fMRI across multiple cognitive tasks. Neuroimage 2011, 54, 2808–2821. [Google Scholar] [CrossRef] [Green Version]
  43. Leff, D.R.; Orihuela-Espina, F.; Elwell, C.E.; Athanasiou, T.; Delpy, D.T.; Darzi, A.W.; Yang, G.Z. Assessment of the cerebral cortex during motor task behaviours in adults: A systematic review of functional near infrared spectroscopy (fNIRS) studies. Neuroimage 2011, 54, 2922–2936. [Google Scholar] [CrossRef]
  44. Yamada, T.; Meng, E. Practical Guide for Clinical Neurophysiologic Testing: EEG; Lippincott Williams & Wilkins: Philadelphia, PA, USA, 2012. [Google Scholar]
  45. Ayaz, H.; Shewokis, P.A.; Curtin, A.; Izzetoglu, M.; Izzetoglu, K.; Onaral, B. Using MazeSuite and functional near infrared spectroscopy to study learning in spatial navigation. J. Vis. Exp. 2011, 56, e3443. [Google Scholar] [CrossRef] [Green Version]
  46. Cope, M. The Development of a Near Infrared Spectroscopy System and Its Application for Non Invasive Monitoring of Cerebral Blood and Tissue Oxygenation in the Newborn Infants. Ph.D. Thesis, University of London, London, UK, 1991. [Google Scholar]
  47. Naseer, N.; Hong, K.S. fNIRS-based brain-computer interfaces: A review. Front. Hum. Neurosci. 2015, 9, 3. [Google Scholar] [CrossRef] [PubMed] [Green Version]
  48. Frolov, N.S.; Maksimenko, V.A.; Khramova, M.V.; Pisarchik, A.N.; Hramov, A.E. Dynamics of functional connectivity in multilayer cortical brain network during sensory information processing. Eur. Phys. J. Spec. Top. 2019, 228, 2381–2389. [Google Scholar] [CrossRef]
  49. Maksimenko, V.A.; Lüttjohann, A.; Makarov, V.V.; Goremyko, M.V.; Koronovskii, A.A.; Nedaivozov, V.; Runnova, A.E.; van Luijtelaar, G.; Hramov, A.E.; Boccaletti, S. Macroscopic and microscopic spectral properties of brain networks during local and global synchronization. Phys. Rev. E 2017, 96, 012316. [Google Scholar] [CrossRef] [PubMed] [Green Version]
  50. Richter, W.; Andersen, P.M.; Georgopoulos, A.P.; Kim, S.G. Sequential activity in human motor areas during a delayed cued finger movement task studied by time-resolved fMRI. Neuroreport 1997, 8, 1257–1261. [Google Scholar] [CrossRef] [PubMed]
  51. Koller, D.; Friedman, N.; Džeroski, S.; Sutton, C.; McCallum, A.; Pfeffer, A.; Abbeel, P.; Wong, M.F.; Heckerman, D.; Meek, C.; et al. Introduction to Statistical Relational Learning; MIT Press: Cambridge, MA, USA, 2007. [Google Scholar]
  52. Ovchinnikov, A.; Lüttjohann, A.; Hramov, A.; Van Luijtelaar, G. An algorithm for real-time detection of spike-wave discharges in rodents. J. Neurosci. Methods 2010, 194, 172–178. [Google Scholar] [CrossRef] [PubMed]
  53. Grubov, V.; Sitnikova, E.; Pavlov, A.; Koronovskii, A.; Hramov, A. Recognizing of stereotypic patterns in epileptic EEG using empirical modes and wavelets. Phys. A 2017, 486, 206–217. [Google Scholar] [CrossRef]
  54. Hajian-Tilaki, K. Receiver operating characteristic (ROC) curve analysis for medical diagnostic test evaluation. Casp. J. Intern. Med. 2013, 4, 627. [Google Scholar]
  55. Yi, W.; Qiu, S.; Qi, H.; Zhang, L.; Wan, B.; Ming, D. EEG feature comparison and classification of simple and compound limb motor imagery. J. Neuroeng. Rehabil. 2013, 10, 106. [Google Scholar] [CrossRef] [Green Version]
  56. Pavlov, A.; Runnova, A.; Maksimenko, V.; Pavlova, O.; Grishina, D.; Hramov, A. Detrended fluctuation analysis of EEG patterns associated with real and imaginary arm movements. Phys. A 2018, 509, 777–782. [Google Scholar] [CrossRef]
  57. Rahma, O.; Hendradi, R.; Fadli, A. Classifying imaginary hand movement through electroencephalograph signal for neuro-rehabilitation. Walailak J. Sci. Technol. 2019, 16, 943–953. [Google Scholar]
  58. Rosso, O.A.; Montani, F.; Baravalle, R.; Guisande, N.; Granado, M. Characterization of visuomotor/imaginary movements in EEG: An information theory and complex network approach. Front. Phys. 2019, 7, 115. [Google Scholar]
  59. Hanakawa, T. Organizing motor imageries. Neurosci. Res. 2016, 104, 56–63. [Google Scholar] [CrossRef] [PubMed] [Green Version]
  60. Sharma, N.; Pomeroy, V.M.; Baron, J.C. Motor imagery: A backdoor to the motor system after stroke? Stroke 2006, 37, 1941–1952. [Google Scholar] [CrossRef] [Green Version]
  61. Park, C.h.; Chang, W.H.; Lee, M.; Kwon, G.H.; Kim, L.; Kim, S.T.; Kim, Y.H. Which motor cortical region best predicts imagined movement? Neuroimage 2015, 113, 101–110. [Google Scholar] [CrossRef]
  62. Duque, J.; Labruna, L.; Verset, S.; Olivier, E.; Ivry, R.B. Dissociating the role of prefrontal and premotor cortices in controlling inhibitory mechanisms during motor preparation. J. Neurosci. 2012, 32, 806–816. [Google Scholar] [CrossRef] [PubMed]
  63. Krams, M.; Rushworth, M.; Deiber, M.P.; Frackowiak, R.; Passingham, R. The preparation, execution and suppression of copied movements in the human brain. Exp. Brain Res. 1998, 120, 386–398. [Google Scholar] [CrossRef]
  64. Hwang, H.J.; Kwon, K.; Im, C.H. Neurofeedback-based motor imagery training for brain–computer interface (BCI). J. Neurosci. Methods 2009, 179, 150–156. [Google Scholar] [CrossRef]
  65. Kevric, J.; Subasi, A. Comparison of signal decomposition methods in classification of EEG signals for motor-imagery BCI system. Biomed. Signal Process. Control 2017, 31, 398–406. [Google Scholar] [CrossRef]
  66. Mason, S.G.; Birch, G.E. A brain-controlled switch for asynchronous control applications. IEEE Trans. Biomed. Eng. 2000, 47, 1297–1307. [Google Scholar] [CrossRef] [Green Version]
  67. Yong, X.; Menon, C. EEG classification of different imaginary movements within the same limb. PLoS ONE 2015, 10, e0121896. [Google Scholar] [CrossRef]
  68. Grozea, C.; Voinescu, C.D.; Fazli, S. Bristle-sensors—Low-cost flexible passive dry EEG electrodes for neurofeedback and BCI applications. J. Neural Eng. 2011, 8, 025008. [Google Scholar] [CrossRef] [PubMed]
  69. Spüler, M. A high-speed brain-computer interface (BCI) using dry EEG electrodes. PLoS ONE 2017, 12, e0172400. [Google Scholar] [CrossRef] [PubMed]
  70. Di Flumeri, G.; Aricò, P.; Borghini, G.; Sciaraffa, N.; Di Florio, A.; Babiloni, F. The dry revolution: Evaluation of three different EEG dry electrode types in terms of signal spectral features, mental states classification and usability. Sensors 2019, 19, 1365. [Google Scholar] [CrossRef] [PubMed] [Green Version]
  71. Marshall, D.; Coyle, D.; Wilson, S.; Callaghan, M. Games, gameplay, and BCI: The state of the art. IEEE Trans. Comput. Intell. AI Games 2013, 5, 82–99. [Google Scholar] [CrossRef]
  72. Coyle, D.; Garcia, J.; Satti, A.R.; McGinnity, T.M. EEG-Based Continuous Control of a Game Using a 3 Channel Motor Imagery BCI: BCI Game. In Proceedings of the 2011 IEEE Symposium on Computational Intelligence, Cognitive Algorithms, Mind, and Brain (CCMB), Paris, France, 15 April 2011; pp. 1–7. [Google Scholar]
  73. Al-Qaysi, Z.; Zaidan, B.; Zaidan, A.; Suzani, M. A review of disability EEG based wheelchair control system: Coherent taxonomy, open challenges and recommendations. Comput. Methods Programs Biomed. 2018, 164, 221–237. [Google Scholar] [CrossRef]
  74. Malki, A.; Yang, C.; Wang, N.; Li, Z. Mind Guided MotionControl of Robot Manipulator Using EEG Signals. In Proceedings of the 5th International Conference on Information Science and Technology (ICIST), Changsha, China, 24–26 April 2015; pp. 553–558. [Google Scholar]
  75. Huang, D.; Qian, K.; Fei, D.Y.; Jia, W.; Chen, X.; Bai, O. Electroencephalography (EEG)-based brain-computer interface (BCI): A 2-D virtual wheelchair control based on event-related desynchronization/synchronization and state control. IEEE Trans. Neural Syst. Rehabil. Eng. 2012, 20, 379–388. [Google Scholar] [CrossRef]
  76. Putze, F.; Hesslinger, S.; Tse, C.Y.; Huang, Y.; Herff, C.; Guan, C.; Schultz, T. Hybrid fNIRS-EEG based classification of auditory and visual perception processes. Front. Neurosci. 2014, 8, 373. [Google Scholar] [CrossRef] [Green Version]
  77. Khan, M.J.; Hong, K.S. Hybrid EEG–fNIRS-based eight-command decoding for BCI: Application to quadcopter control. Front. Neurorobotics 2017, 11, 6. [Google Scholar] [CrossRef] [Green Version]
  78. Hong, K.S.; Khan, M.J.; Hong, M.J. Feature extraction and classification methods for hybrid fNIRS-EEG brain-computer interfaces. Front. Hum. Neurosci. 2018, 12, 246. [Google Scholar] [CrossRef]
Figure 1. (a) Location of fNIRS sources (marked with red) and detectors (marked with blue) on the subject’s head in the area of primary motor cortex (shaded area). (b) Location of 20 fNIRS channels (grey circles with channel numbers) across motor cortex (shaded area) and 9 EEG electrodes (CP4, CPz, CP3, C4, Cz, C3, FC4, FCz, FC3) according to “10–10” scheme (black circles with channel names). (c) Schematic illustration of traveling path of near-infrared light from source (S) to neighbour detectors ( D 1 and D 2 ) through brain cortex matter.
Sensors 20 02362 g001
Figure 2. Schematic representation of (a) experimental design and (b) task execution during a long fNIRS trial.
Sensors 20 02362 g002
Figure 3. Distribution of | d H i , j | values (3) and cumulative distribution function F for different types of motor activity. (Upper line) Real movement: (a) HbO and (b) NbR for right hand and (c) HbO and (d) NbR for left hand. (Lower line) Motor imagery: (e) HbO and (f) HbR for right hand and (g) HbO and (h) HbR for left hand. The vertical dashed line indicates the border of the fourth quartile (75%) of the distributions. These results were obtained for subject # 3 .
Sensors 20 02362 g003
Figure 4. Flowchart of online classification algorithm for fNIRS signals corresponding to left/right-hand movement. The main advantage of the algorithm is that it can be used for both real and imaginary movements.
Sensors 20 02362 g004
Figure 5. Distributions (mean ± S.D.) of oxyhemoglobin (blue) and deoxyhemoglobin (green) for (a) motor execution and (b) motor imaginary of right hand, for all 20 fNIRS channels. The data are averaged over 10 trials obtained for one subject. Vertical dashed lines indicate the beginning and end of each movement. The channel number is indicated in the upper right corner of each distribution. The results were obtained for subject #3.
Sensors 20 02362 g005
Figure 6. Distributions of δ H given by (3) and () across fNIRS channels for different types of motor activity. (Upper line) Motor execution: (a) HbO and (b) HbR for right hand and (c) HbO and (d) HbR for left hand. (Lower line) Motor imagery: (e) HbO and (f) HbR for right hand and (g) HbO and (h) HbR for left hand. The results were obtained for subject #3.
Sensors 20 02362 g006
Figure 7. Differences in oxyhemoglobin (blue) and deoxyhemoglobin (green) distributions between left and right hemispheres. The results are present for fNIRS channel 2 for 10 trials corresponding to (a) real and (b) imaginary right-hand movements for subject #3. The vertical dashed lines indicate the time moments of the beginning and end of the movements. The arrows mark zero level in each distribution.
Sensors 20 02362 g007
Figure 8. Receiver operating characteristic (ROC) in the units of true positive fraction (TPF) versus false positive fraction (FPF) [in %] of binary classification for motor execution (brown curve 1) and motor imaginary (orange curve 2).
Sensors 20 02362 g008
Table 1. The results of automatic classification of different types of motor action (mean ± S.D.) using i = { 2 , 7 , 8 } and j = { 12 , 17 , 18 } fNIRS channels in the left and right hemisphere, respectively.
MovementAutomatic Detection TPF , % TNF , % FPF , %
T P F P T N F N
Real 99.0 ± 3.1 2.0 ± 4.2 98.0 ± 4.2 2.0 ± 4.2 98.2 ± 3.8 98.0 ± 4.2 2.0 ± 4.2
Imaginary 86.0 ± 10.7 25.0 ± 12.6 78.0 ± 9.1 14.0 ± 8.4 86.1 ± 7.9 76.2 ± 11.2 23.8 ± 11.2

