Automatic Detection of Arrhythmia Based on Multi-Resolution Representation of ECG Signal


1
Software College, Northeastern University, Shenyang 110169, China
2
College of Medicine and Biological Information Engineering, Northeastern University, Shenyang 110169, China
*
Author to whom correspondence should be addressed.
Sensors 2020, 20(6), 1579; https://doi.org/10.3390/s20061579
Submission received: 15 February 2020
/
Revised: 7 March 2020
/
Accepted: 11 March 2020
/
Published: 12 March 2020
(This article belongs to the Special Issue ECG Monitoring System)
Abstract
:Automatic detection of arrhythmia is of great significance for early prevention and diagnosis of cardiovascular disease. Traditional feature engineering methods based on expert knowledge lack multidimensional and multi-view information abstraction and data representation ability, so the traditional research on pattern recognition of arrhythmia detection cannot achieve satisfactory results. Recently, with the increase of deep learning technology, automatic feature extraction of ECG data based on deep neural networks has been widely discussed. In order to utilize the complementary strength between different schemes, in this paper, we propose an arrhythmia detection method based on the multi-resolution representation (MRR) of ECG signals. This method utilizes four different up to date deep neural networks as four channel models for ECG vector representations learning. The deep learning based representations, together with hand-crafted features of ECG, forms the MRR, which is the input of the downstream classification strategy. The experimental results of big ECG dataset multi-label classification confirm that the F1 score of the proposed method is 0.9238, which is 1.31%, 0.62%, 1.18% and 0.6% higher than that of each channel model. From the perspective of architecture, this proposed method is highly scalable and can be employed as an example for arrhythmia recognition.
1. Introduction
Cardiac arrhythmia is an essential manifestation of cardiovascular disease (CVD). As the most significant cause of death in the world, CVD causes about 17.9 million deaths every year, accounting for 31% of the total global deaths [1]. Electrocardiogram (ECG) is a comprehensive tool widely used by clinicians in hospitals which captures the propagation of electrical signals in the heart from the body surface and then the state of the cardiovascular system can be detected through the morphology and rhythm of ECG. Because of its non-invasive and easily accessible characteristics, ECG has played a vital role in the diagnosis of various arrhythmia and acute coronary syndromes [2,3].
Automatic Detection of Arrhythmia (ADA) refers to the use of computer equipment to replace the tedious and time-consuming manual ECG data analysis, which will not lead to recognition problems due to expert differences or fatigue. The ADA problem has been widely researched in recent decades and the research can be generally divided into the following three steps: ECG data preprocessing, feature extraction, and classification, where data preprocessing includes noise filtering, baseline removal, and signal segmentation [4]. A typical solution for ADA is, similarly to [5], for each heartbeat, to combine the features extracted by wavelet transformation (WT) and independent component analysis (ICA) with the four RR interval features designed and then transmit all of them to a support vector machine (SVM) for classification. Acharya et al. extracted 13 types of non-linear features for a heartbeat signal and used the decision tree (DT) method to identify four beats of Normal, Atrial fibrillation, Atrial flutter and Ventricular fibrillation [6]. In [7], the authors made use of recurrence quantification analysis (RQA) technology to extract the hidden nonlinear features of ECG signals and feed these features to a rotation forest (ROF) classifier. Although these traditional methods claim that they achieved satisfying recognition performance, it is evident that this type of automatic detection solution heavily relies on the use of expertise for feature extraction or feature selection, which is not only difficult to generalize, but the performance is also not good enough for practice usage.
In recent years, with the rapid development of deep learning, this technology has dramatically improved the state of the art in image classification, target detection, speech recognition, and other fields [8,9,10,11,12]. Deep learning models can recognize patterns from the input data and learn useful features without a large amount of data preprocessing and feature engineering [13], which is also suitable for ECG data mining. Reference [14] used a Convolutional Neural Network (CNN) to detect the 2 seconds and 5 seconds ECG segments and achieved a good recognition accuracy. Researchers from Stanford University designed a thirty-four-layer CNN, which can recognize 14 types of arrhythmias and achieved expert performance [15]. Reference [16] proposed an end-to-end depth model to identify 17 types of arrhythmias and claimed it as one of the best multi classification results on the 1000 ECG signal fragments from the MIT - BIH Arrhythmia database for one lead (MLII) from 45 persons so far.
For a deep neural network, model training is a process of a layer-by-layer evolution of the abstraction level of the input data, which means that the outputs of different node layers of the same deep model provide different abstraction level vector representations of the input. At the same time, different deep neural networks try to extract meaningful representations of the input data from different angles. Golrizkhatami et al. exploited multi-stage learned features from a trained CNN and hand-crafted features extracted using well known algorithms to classify heartbeats into five different AAMI class types [17]. In [18], the researchers combined CNN and bi-directional Long Short-Term Memory (LSTM) into a network to achieve the fusion of the two network extraction features. However, the drawback is that the scalability of the model is poor, and its training time will increase exponentially with the number and complexity of the models used. In the field of natural language processing, Tolgahan Cakaloglu and Xiaowei Xu proposed a new method to generate multi-resolution word embedding and proved the effectiveness of the proposed approach through experiments [19]. Inspired by [19], in this paper, we propose a new ECG data representation construction method for the ADA tasks and call the representation constructed by this method the multi-resolution ECG data representation. The proposed method learns multiple features of the input ECG data by using distinct deep neural network models (called the channel models) separately and combining these features through a feature fusion strategy. The channel models used were GoogLeNet, ResNet, SeInceptionNet and SeResNet [20,21,22,23]. Among them, the latter two models are based on the InceptionNet and ResNet with the Squeeze-and-Excitation Network (SeNet) module added [23]. Then, the multi-resolution representation was be transmitted to a gradient boosting algorithm to perform ADA classifier training. For the training, the k-fold cross-validation strategy was applied, and a voting-based model fusion was used to predict arrhythmia. This method not only makes full use of the representation learning ability of channel models but also introduces the expert information in feature engineering, so it achieved a high recognition performance in our experiment.
The main contributions of this work are as follows:
- (1)
- An arrhythmia recognition method based on a Multi-Resolution Representation (MRR) of the ECG signal was proposed. Theoretically, the MRR mechanism can combine all possible features generated by any means. These features can vector representations learned by deep neural networks, categorize information of inputs or features extracted using domain knowledge.
- (2)
- The Convolutional Neural Network’s power of ECG signal representation by the Squeeze-and-Excitation mechanism was strengthened. The SE mechanism models the interdependencies between channels during training and pays more attention to the channel information useful for the final prediction.
As we know, for the reason of patients’ privacy protection, ECG data collection is a tough job, current research works usually use open-source datasets such as MIT-BIH Arrhythmia Database [24], which is limited by the amount of data. In this study, we conducted our research on a very recent bigger ECG dataset from Alibaba Tianchi Cloud Competition, which has 20036 8-lead ECG records. The dataset contains 34 arrhythmia categories, and the task is multi-label classification, which is more challenging.
2. Proposed Method
2.1. Model Architecture
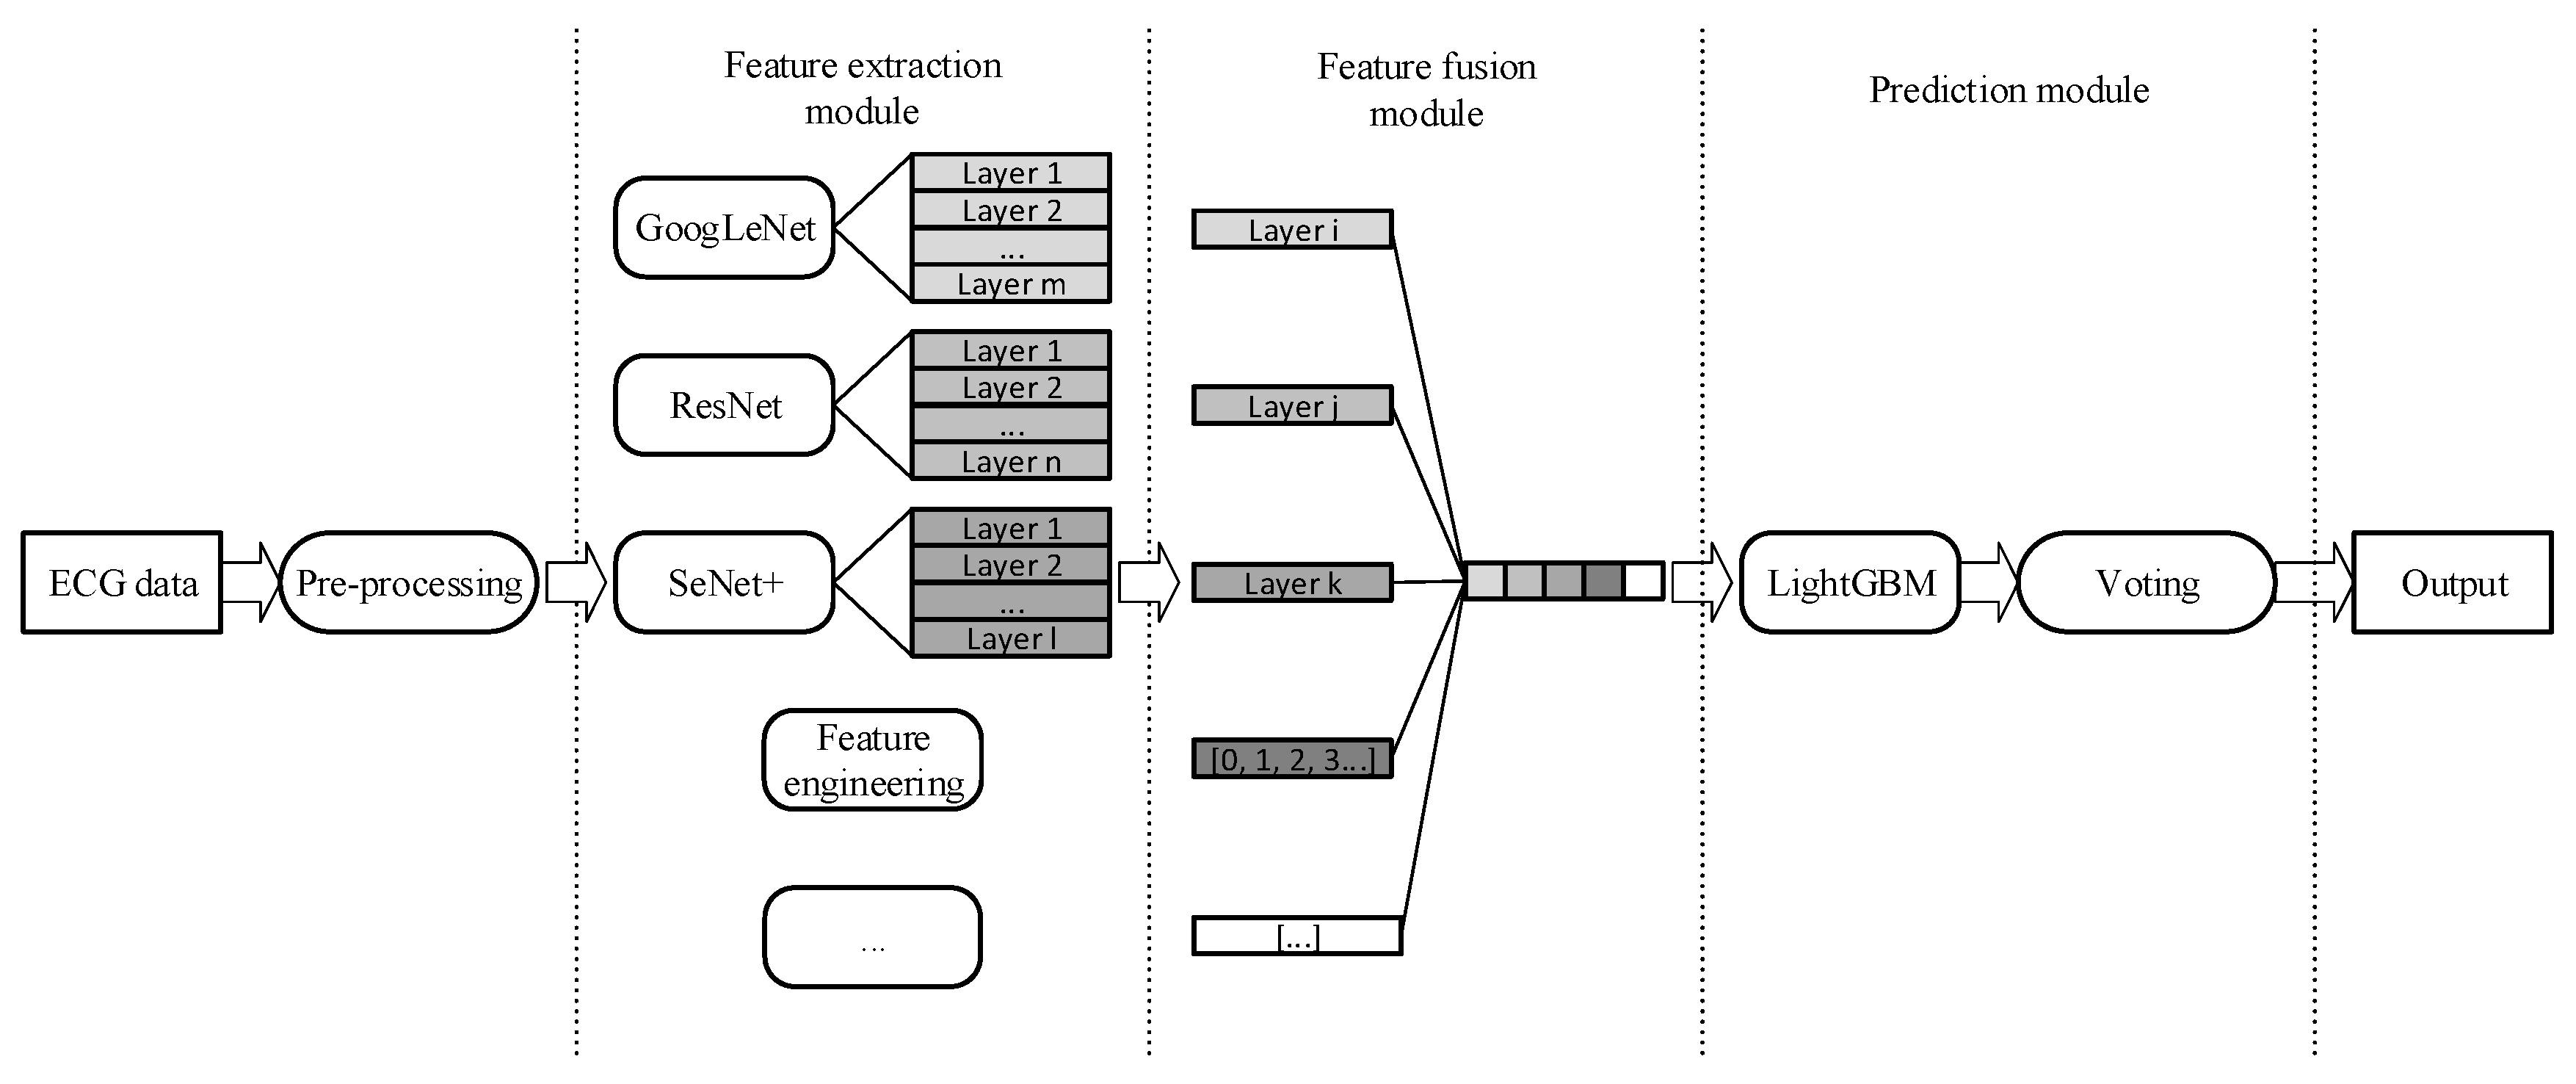
The proposed model, illustrated in Figure 1, is composed of the feature extraction module, the feature fusion module, and the prediction module. Firstly, in the preprocessing operation, we applied db6 wavelet transformation [25] to all ECG signals to reduce the impact of noise. Then, in the feature extraction module, the commonly used models in the field of deep learning, GoogleNet, ResNet, SeInceptionNet, and SeResNet, were selected to learn the deep vector representation of ECG data. Moreover, we also fed age, gender, and Heart Rate Variability (HRV) information [26] to the follow-up feature fusion module. Suppose that in the feature extraction module, each layer of the selected and trained deep model provides an abstract understanding (representation) of ECG data. Then, in the feature fusion step, we cose appropriate ones from these understandings and concatenate them with domain knowledge-based features to form a new representation. This new representation is a multi-level abstraction understanding of the ECG signal, and we named it the MRR of ECG. After this, we fed the MRR to a LightGBM model [27]. LightGBM is a gradient boosting framework that uses a decision tree based on the histogram. We expect to use LightGBM to achieve fast running speed and high classification accuracy at the same time. The last part of our proposed method is a model fusion-based classification decision module in which we used a voting method to fuse the models [28]. Researchers interested in re-implementing our proposed method can choose a more complex fusion strategy according to their own needs.
2.2. Deep Feature Extraction
2.2.1. Problem Formulation
As described above, the MRR of the ECG signal is constructed on the base of the multi-channel deep models’ training. Each model training itself is a multi-label classification task of input 8-lead ECG records; the output of the trained model is a sequence of probabilities that the input sample belongs to corresponding categories. We use binary cross-entropy to measure training loss; as is shown in Formula 1, the loss function minimizes the cross-entropy between ground truth and the channel model output. and denote the deep model output and the ground-truth labels of the input sample, respectively. is the number of arrhythmia categories in datasets and . The loss value is the weighted average of the loss on each category.
Considering the uneven distribution of different arrhythmia categories in the datasets, we assigned a weight to each type of arrhythmia to avoid a biased model where is the number of corresponding arrhythmia type samples in datasets. In this way, we assign more significant weights to arrhythmia types with a small number of samples to punish the model with a more considerable loss value. Therefore, the model pays more attention to the arrhythmia types with a smaller numbers of samples.
2.2.2. GoogLeNet
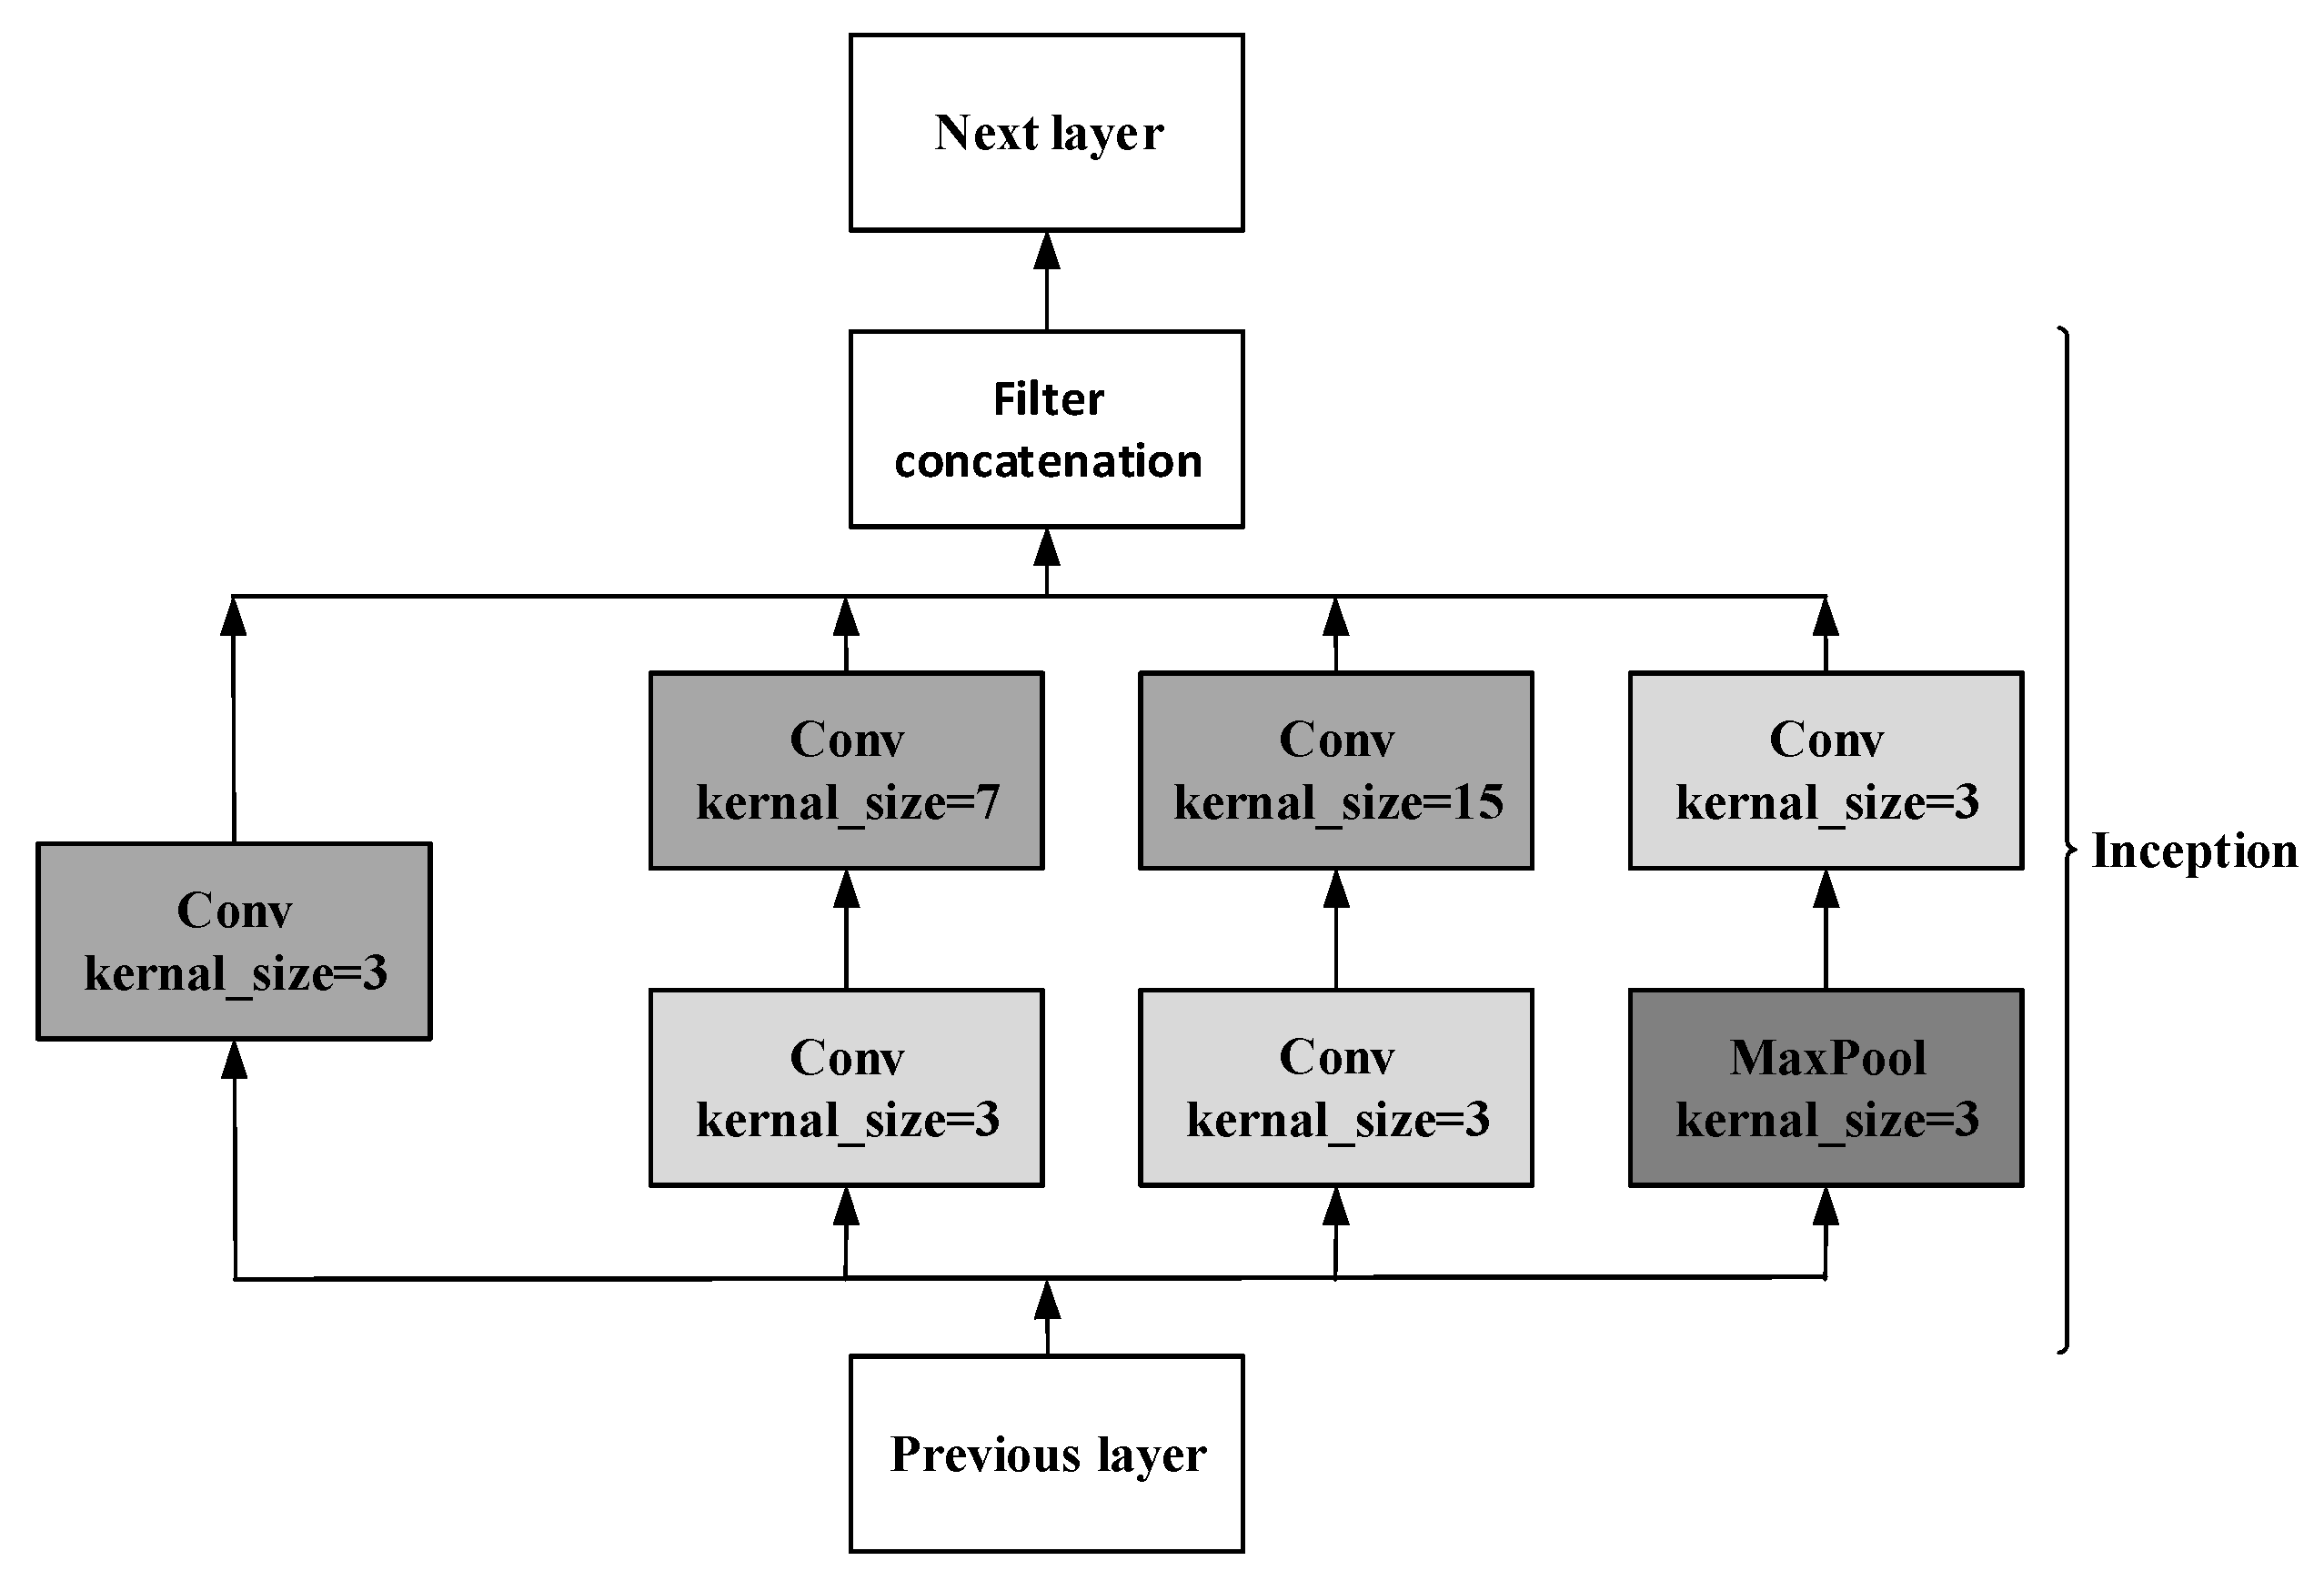
The traditional way to improve network performance by increasing the depth and width not only requires more parameters and computing resources but is also prone to overfitting. For this, GoogLeNet did not choose a deeper network but designed an Inception structure to improve the network performance. Referring to the model used in [20], we adjusted the Inception module to adapt to ECG data. As shown in Figure 2, the Inception module has convolution kernels of different sizes, which can extract ECG features of different scales. More abundant features are helpful for more accurate classification.
The whole network consists of 22 layers, including nine inception modules. Global average pooling was used to replace the fully connected layer. Averaging the entire feature map will reduce the calculation amount and increases the training speed and performance at the same time.
In addition, in order to prevent the gradient from disappearing due to depth in forwarding propagation, we employed two auxiliary branches in layer 10 and layer 16 of the model, which can take the output of the middle layer as the result of the classification. As shown in Formula 2, during training, three parts decide the final loss function where is the loss of the final output result, and two branches calculate and . The network parameters and structure can be found in the Supplementary Materials.
2.2.3. ResNet
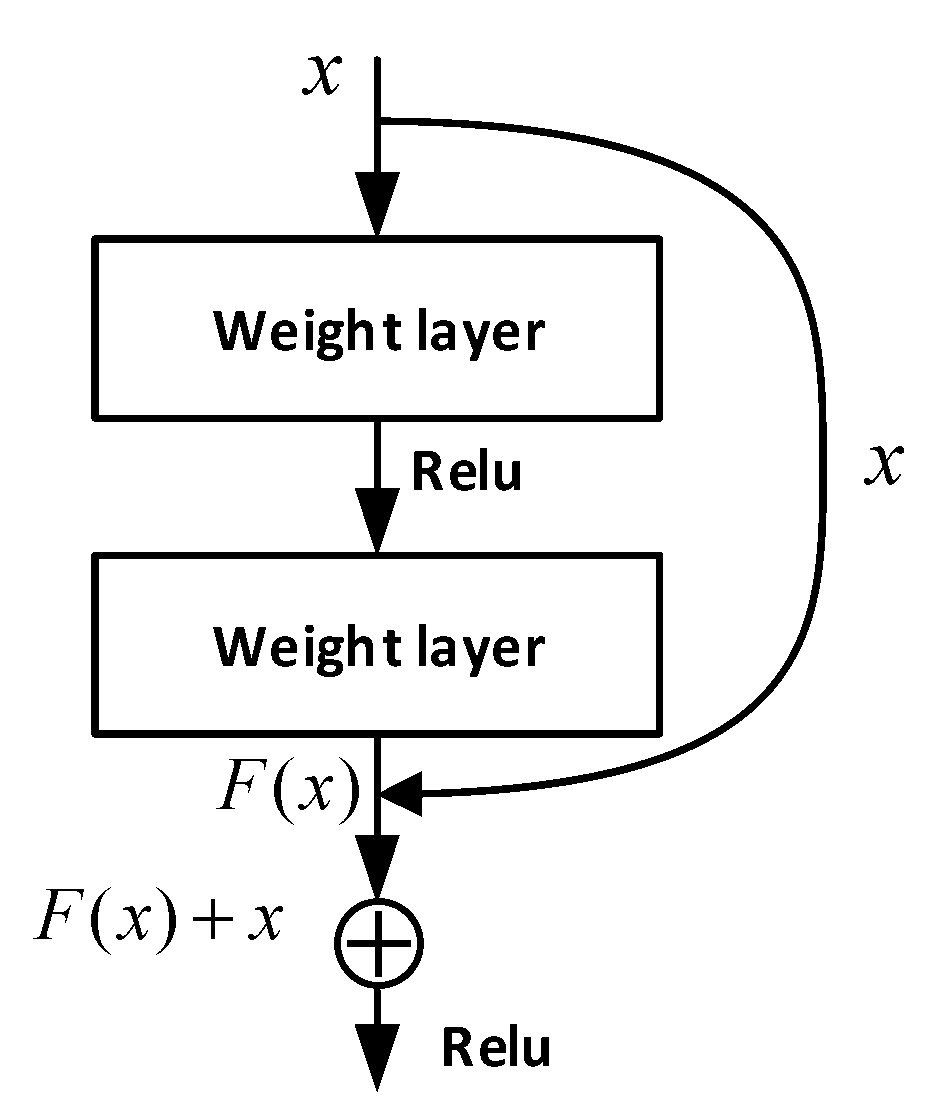
ResNet solves the problem of deep network degradation by introducing the deep residual learning framework [21]. As shown in Figure 3, comes from the upper layer network and is the output through two-layer neural network. Generally, features from shallow layers are usually lower semantic-level features with a higher resolution. In contrast, representations from deep layers are often more upper semantic-level features with a lower resolution. The combination of features with different resolutions is realized by adding the and .
According to the characteristics of ECG data, we modified the original ResNet to achieve a better recognition performance. The network parameters can be found in the Supplementary Materials.
2.2.4. SeNet
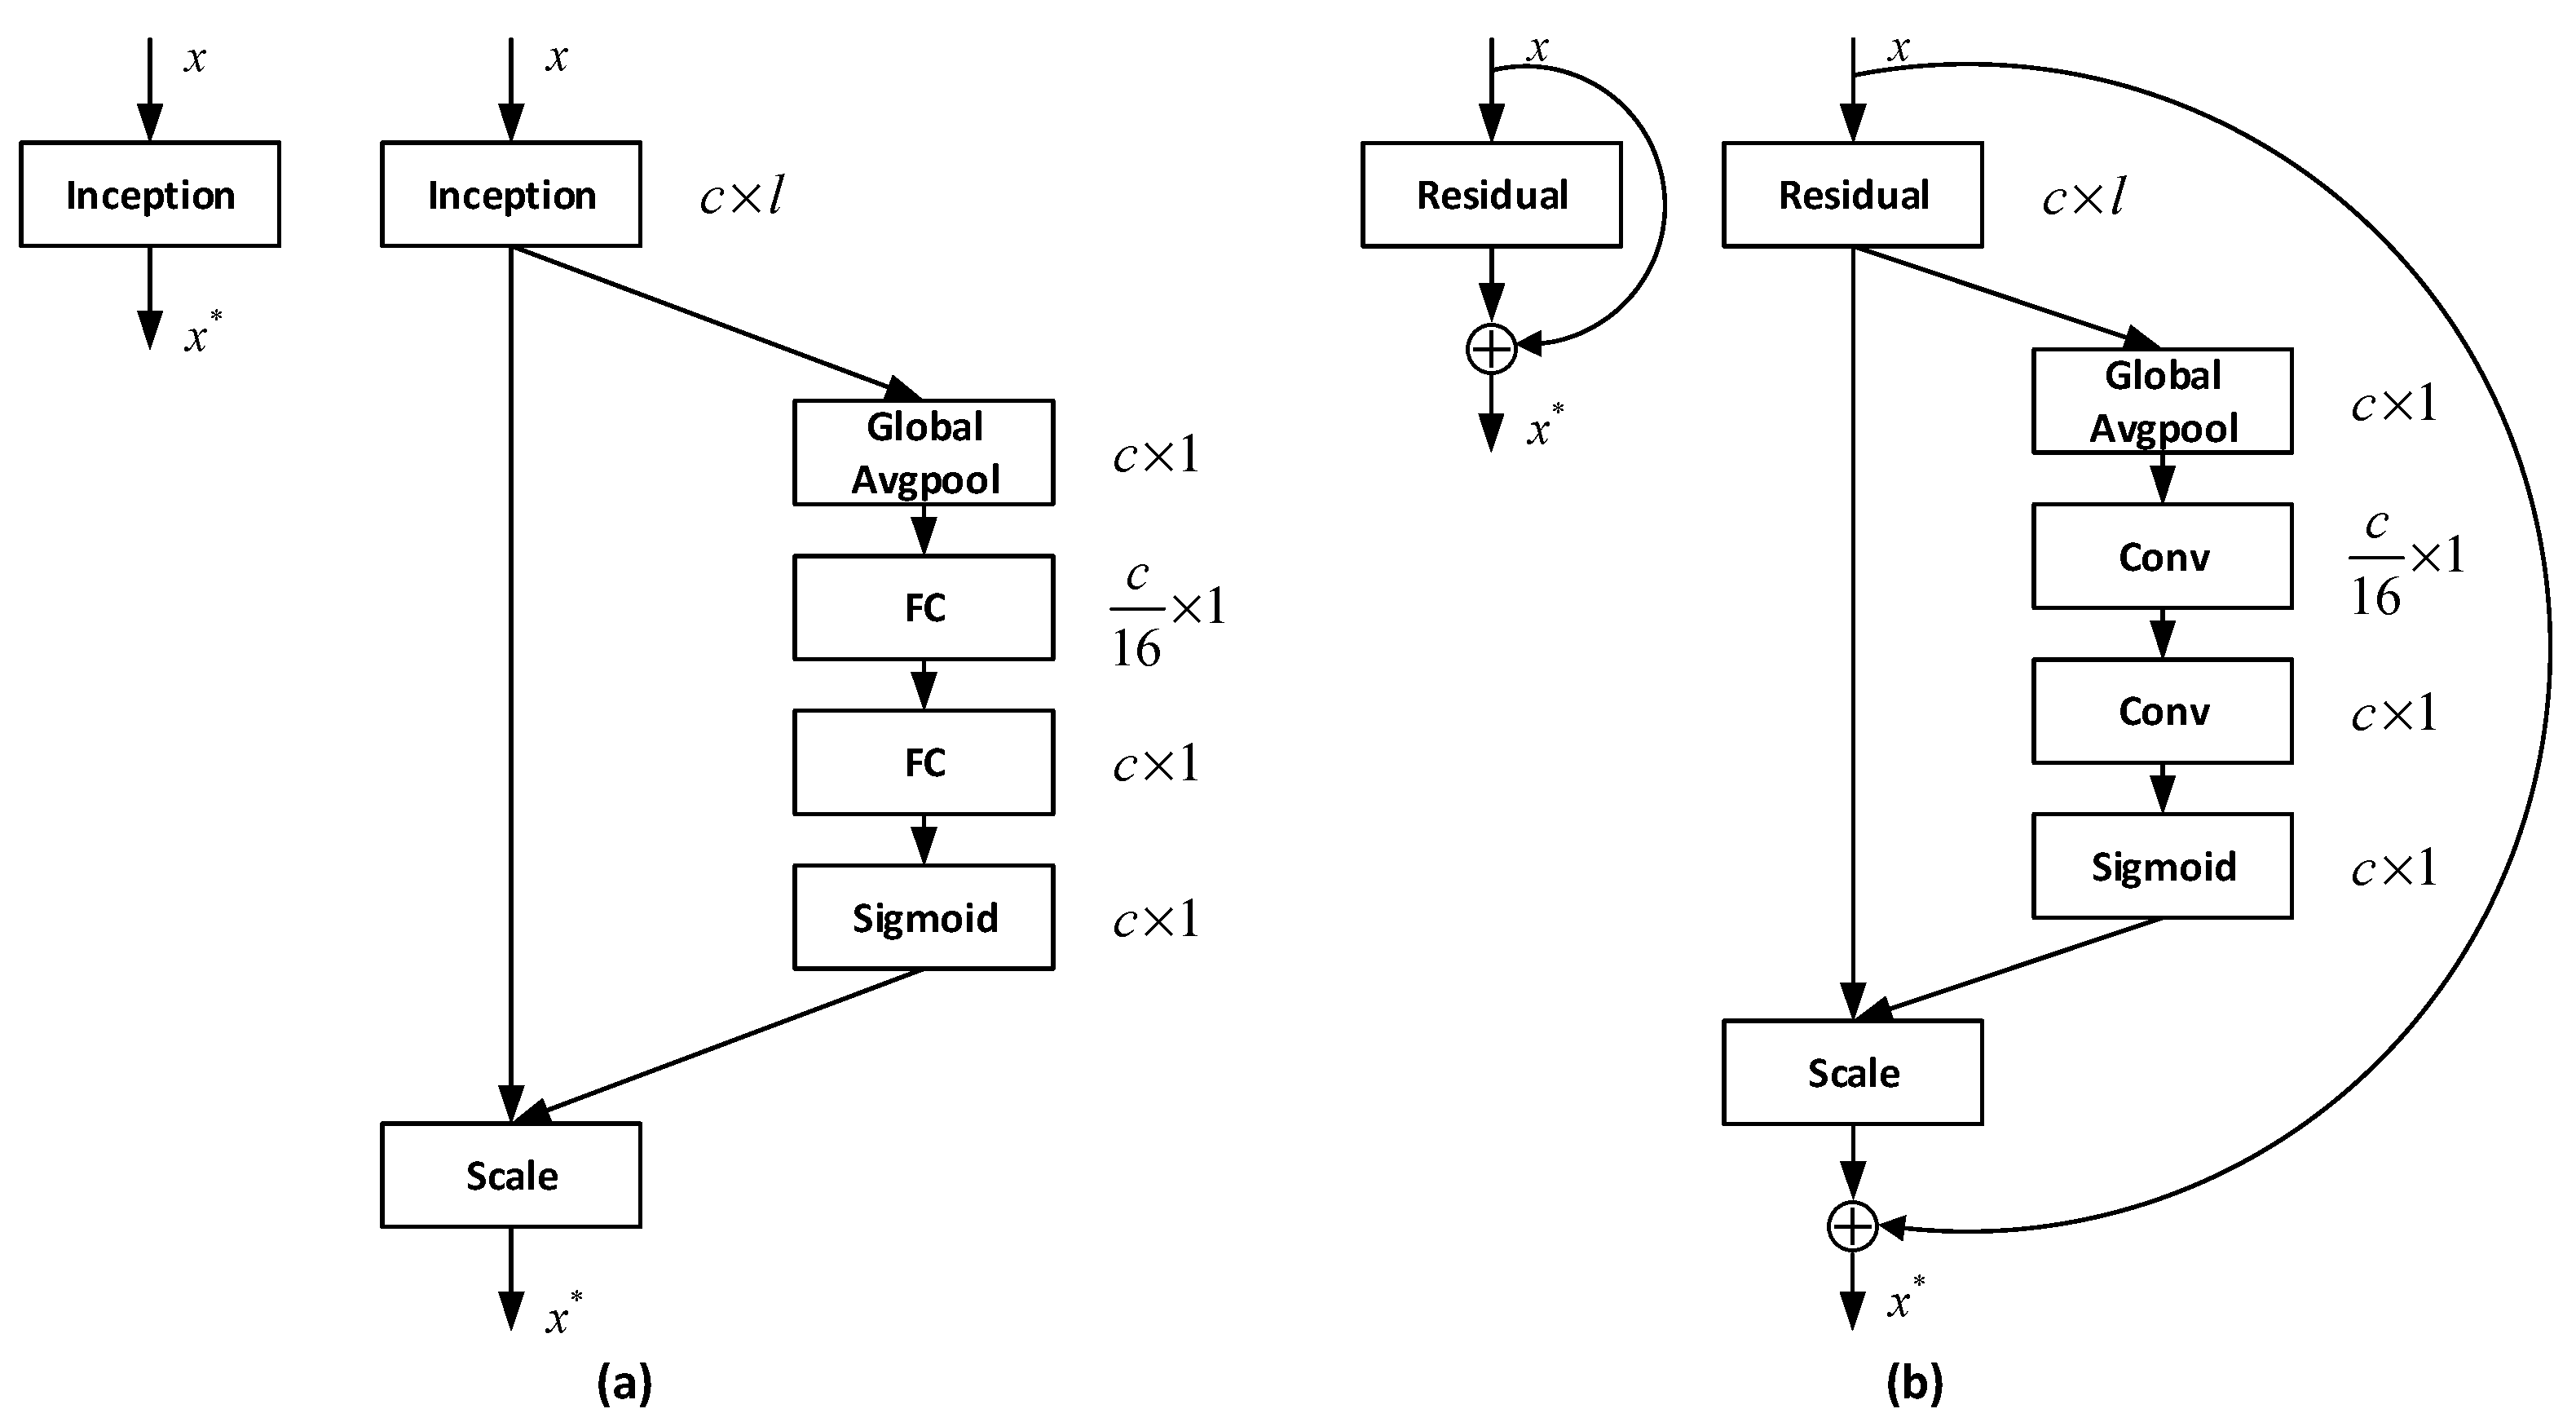
Many existing deep-learning-based arrhythmia detection solutions employ CNN to extract spatial information and do not consider the correlations between different feature channels during training. As is shown in Figure 4, to enhance the role of channel relationship in feature generation, we used two types of SeNet structures in the experiment, where is the input, is the output, and represents the number of channels. One SeNet structure (a, Figure 4) models the interdependencies between feature channels through fully connected neurons (FC) and the other SeNet structure (b, Figure 4) replaces the FCs with convolution operations (Conv). Both SeNet structures compress the number of convolution channels 16 times and then expand it to the original size. These structures explicitly model the relationship between feature channels and use the feature recalibration strategy to obtain the importance of each feature channel through learning automatically. This strategy has been proven to be able to ‘selectively enhance useful features and suppress less useful features’ in image classification applications [23], which we believe will also be able to serve our ECG signal feature extraction task.
2.3. Feature Fusion and Prediction
In addition to the features extracted by the above models, hand-crafted features were also used to construct MRR. In the feature fusion module (see Figure 1), the features extracted by deep neural networks concatenate with nine HRV indexes, age and gender information to be the Multi-Resolution Representation of ECG signal. HRV measures the change of continuous heart rate cycle, which is a valuable index to predict sudden cardiac death and arrhythmia [26]. In this experiment, we extracted nine HRV indexes from the lead II ECG signals, including RR interval standard deviation, maximum RR interval, minimum RR interval, average RR interval, pNN50 (ratio of adjacent RR interval difference higher than 50ms), R wave density, RMSSD (root mean square of adjacent RR interval difference), sampling entropy of RR interval (measuring RR interval change disorder, returning two values). Compared to representation learned by the single deep model, this representation contains the knowledge used in these channel models, so using this representation as input to train downstream classifier will achieve a higher recognition performance.
As shown in Figure 1, we used a LightGBM classifier in the prediction module. The output Multi-Resolution Representation of the feature fusion operation was used as the input of the classifier. LightGBM is a gradient lifting framework based on a decision tree algorithm. It uses the leaf-wise growth strategy to select the node with the most significant gain from the current leaf node each time to split. The model can effectively prevent overfitting by controlling the depth of the tree and the number of leaf nodes [27]. Finally, k models obtained by the k-fold method were used to predict the test set and the final classification results were determined by voting. A voting scheme is a standard model fusion scheme which is simple, fast, and easy to operate.
3. Experiments
3.1. Data Sets
The experimental data used are from the “Hefei high tech Cup” ECG Human-Machine Intelligence Competition held by the Tianchi platform [29,30,31]. This dataset contains 20,036 8-lead ECG records (including lead I, II, V1, V2, V3, V4, V5 and V6), each of which has a length of 10 s and a total of 34 categories. The sampling frequency was 500 Hz and the unit voltage was 4.88 mv. Moreover, each record also contains the patient’s age and gender information. These records were provided by the Engineering Research Center of the Ministry of Education of Hangzhou Normal University Mobile Health Management System. Table 1 gives details on this dataset.
3.2. Data Augmentation
As shown in Table 1, although there are more than 20,000 records, the dataset contains more than 30 types of arrhythmia, and the number of samples in many categories is relatively small. Therefore, we used three data enhancement schemes in the experiment to avoid overfitting.
- (1)
- Randomly select a scaling factor from the normal distribution (0, 0.1), and then use to scale the original signal. This method can simulate groups of different constitutions, because people of different constitutions tend to have various heart rhythm fluctuations.
- (2)
- Translation to generate more data is a common data augmentation method in the image field [32]. Inspired by this method, we translated the ECG signal as a whole to simulate the same individual’s ECG collected at different times.
- (3)
- During training, use an all-zero segment of (0, 1) s length fragment to randomly mask the ECG signal to prevent the model from focusing too much on some local features. [33]
3.3. Experimental Setting
We trained and tested our model on a server with 32 Cores Intel Xeon E5-2620 CPU, 128GB memory, and two GeForce RTX 2080 Ti cards. This server runs a Linux 3.10.0 system (Cloudhin, Shanghai, China). The development language we chose was Python and the deep learning framework was PyTorch 1.0.1.
We selected sigmoid function as the activation functions and binary cross-entropy as the loss function when training the deep learning models. The entire model was trained using the Adam optimizer with an initial learning rate of 0.001. In a total of 50 epochs of training, the learning rate was be multiplied by 0.1 when the number of epochs reached 35 and 45. In addition, we put a Batch Normalization layer [34] following each convolutional layer to accelerate the model’s convergence. Dropout was also introduced to prevent overfitting [35]. For further parameters-setting information, please see the Supplementary Materials.
3.4. Evaluation Metrics
In order to evaluate the performance of the proposed method, we employ typical classification metrics to measure experimental results. As is shown in formula 3–5, these metrics include Precision, Recall and F1 score.
where and denote the Precision and Recall, respectively. represents the number of samples correctly classified in a certain category. is the number of samples not belonging to a certain category but which are classified as this category. represents the number of samples mistakenly classified into other categories in a certain category.
4. Results and Discussion
4.1. Results
The experiment was carried out by 5-fold cross-validation. Without the help of other data, we use 20% of the data as the test set each time and average the results of all folds. Except for the test set, we divided the rest of the data into a training set and a verification set according to the method of cross-validation and selected the best sub-model through verification. The features extracted by channel models are middle layer features generated by the last fully connected layer of the corresponding model. Meanwhile, it should be noted that since the experiment involves two steps of training (the channel model training and the LightGBM classifier training), in order to ensure the performance of the experiment, the data set division of the two steps was consistent.
Table 2 lists the experimental results of several schemes under cross-validation. Column 1 indicates the methodology and column 2–4 indicate the performance of 34 types of arrhythmia classifiers, including F1 score, Precision, and Recall. In order to facilitate experimental comparison, LightGBM was still selected to train hand-crafted features. By comparing the F1 score and Recall value, we can find that the performance of the proposed method is better than the channel models, with an F1 score and a recall rate of 0.9238 and 0.9107, respectively. However, we found that the opposite situation occurred in the Precision. The method with a lower F1 score has a higher precision rate, which may be caused by the higher missed diagnosis rate of the model, and the lower true positive and false positive.
4.2. Discussion
As we can see, the feature extraction module (see Figure 1) can be easily extended by adding more deep learning models into it. To further illustrate the effectiveness of this Multi-Resolution Representation construction strategy, we used the following two schemes for each channel model.
- (1)
- For a specific channel model, a sub-model will be obtained in each fold’s training of a 5-fold cross validation. These sub-models vote to decide the prediction result on the test set.
- (2)
- For a specific channel model, differently from the strategy of using multiple models to construct MRR in the proposed scheme above, we used the five sub-models obtained by cross validation to extract features from the dataset and combine them as a new MRR of ECG data. Then feed the new MRR to LightGBM for training who vote to decide the prediction result on the test set.
In Table 3, scheme_1 and scheme_2 are the two schemes compared. The F1 score and recall rate shows that in each channel model, the results obtained by the scheme based on MRR are better than direct voting. This shows that the multi-resolution representation contains more information than the final prediction results, so the model fusion using the multi-resolution representation has a better recognition performance than using the prediction results directly. Furthermore, compared with the proposed method in Table 2, the experimental results of the multi-resolution representation of multiple models are better, which proves the effectiveness of the proposed scheme.
Moreover, we find that SeResNet performs better than ResNet, which verifies our previous point of view: considering the relationship between feature channels helps the model learn more information so that it can improve the model’s ability to classify ECGs.
Table 4 compares the number of parameters of a ResNet with and without the two kinds of SeNet structures. Compared to the original ResNet, the SeNet enhanced network only adds 0.41–6.22% additional parameters, which is a good performance improvement.
The main advantages of our proposed method are as follows:
- (1)
- It has good scalability and can fuse the useful information in any recognition scheme. Compared with the method used in [18], the training time of our model only has linear growth, which mainly depends on the time consumption of each fusion scheme.
- (2)
- The proposed method can combine the advantages of each recognition scheme. Because the classification method used in MRR generation filters the features according to the information gain of the nodes, the method is more robust than the ones that used the prediction results directly for model integration. In the worst case, the results will not be worse than every single model. On this basis, the scheme of model integration can further improve accuracy.
5. Conclusions
In this paper, we propose a multi-resolution representation-based arrhythmia detection solution. This solution integrates vector representations learned by different popular deep neural networks and commonly used hand-crafted ECG features to be the new representation for downstream ECG classifier. We call the integrated representation the ’Multi-Resolution Representation’ because it reveals the different abstraction level information of ECG signals. The proposed method has the following advantages: (1) High scalability. The MRR construction strategy can be extended to incorporate existing deep models into its framework as its channel models. (2) Stable performance. Theoretically, in the worst case, this method will still be able to achieve as good a performance as good as channel model-based solutions.
We carried out the arrhythmia detection experiment on a large dataset with 20,036 8-lead medical ECG records and 34 arrhythmia categories. The experimental results show that the proposed method achieved a high recognition performance. The F1 score was 0.9238, which is 0.883% higher than the channel models used on average.
Supplementary Materials
The following are available online at https://www.mdpi.com/1424-8220/20/6/1579/s1.
Author Contributions
Conceptualization, D.C. and D.W.; methodology, D.W., L.X. and Q.M.; software, Q.M. and H.Z.; validation, Q.M. and H.Z.; formal analysis, D.W. and Q.M.; investigation, Q.M.; resources, D.C., D.W. and L.X.; data curation, Q.M. and H.Z.; writing—original draft preparation, Q.M.; writing—review and editing, D.W., D.C., L.X. and Q.M.; visualization, D.W., L.X. and Q.M.; supervision, D.C., D.W. and L.X.; project administration, D.C.; funding acquisition, D.C. and L.X. All authors have read and agreed to the published version of the manuscript.
Funding
This research was funded by the National Natural Science Foundation of China (No.61773110), Liaoning Provincial Natural Science Foundation Project (20170540320), Liaoning Provincial Doctor Initiation Fund (20170520358) and Central University Basic Scientific Research Operational Expenses Project (N2017010, N172415005-2).
Conflicts of Interest
The authors declare no conflict of interest.
References
- Cardiovascular Diseases (CVDs). Available online: https://www.who.int/en/news-room/fact-sheets/detail/cardiovascular-diseases-(cvds) (accessed on 13 February 2020).
- Van Mieghem, C.; Sabbe, M.; Knockaert, D. The clinical value of the ECG in noncardiac conditions. Chest 2004, 125, 1561–1576. [Google Scholar] [CrossRef]
- Schlant, R.C.; Adolph, R.J.; DiMarco, J.; Dreifus, L.S.; Dunn, M.I.; Fisch, C.; Garson, A., Jr.; Haywood, L.; Levine, H.J.; Murray, J.A. Guidelines for electrocardiography. A report of the American College of Cardiology/American Heart Association Task Force on Assessment of Diagnostic and Therapeutic Cardiovascular Procedures (Committee on Electrocardiography). Circulation 1992, 85, 1221–1228. [Google Scholar] [CrossRef] [PubMed] [Green Version]
- Luz, E.J.; Schwartz, W.R.; Cámara-Chávez, G.; Menotti, D. ECG-based heartbeat classification for arrhythmia detection: A survey. Comput. Methods Programs Biomed. 2016, 127, 144–164. [Google Scholar] [CrossRef] [PubMed]
- Ye, C.; Kumar, B.V.; Coimbra, M.T. Heartbeat classification using morphological and dynamic features of ECG signals. IEEE Trans. Biomed. Eng. 2012, 59, 2930–2941. [Google Scholar] [PubMed]
- Acharya, U.R.; Fujita, H.; Adam, M.; Lih, O.S.; Hong, T.J.; Sudarshan, V.K.; Koh, J.E. Automated Characterization of Arrhythmias Using Nonlinear Features from Tachycardia ECG Beats. In Proceedings of the 2016 IEEE International Conference on Systems, Man, and Cybernetics (SMC), Budapest, Hungary, 9–12 October 2016; pp. 000533–000538. [Google Scholar]
- Desai, U.; Martis, R.J.; Acharya, U.R.; Nayak, C.G.; Seshikala, G.; Shetty, K.R. Diagnosis of multiclass tachycardia beats using recurrence quantification analysis and ensemble classifiers. J. Mech. Med. Biol. 2016, 16, 1640005. [Google Scholar] [CrossRef]
- He, K.; Zhang, X.; Ren, S.; Sun, J.; Sun, J. Delving deep into rectifiers: Surpassing human-level performance on imagenet classification. In Proceedings of the IEEE International Conference on Computer Vision, Santiago, Chile, 13–16 December 2015; pp. 1026–1034. [Google Scholar]
- Bai, J.; Wu, Y.; Zhang, J.; Chen, F. Subset based deep learning for RGB-D object recognition. Neurocomputing 2015, 165, 280–292. [Google Scholar] [CrossRef]
- Lin, T.-Y.; Dollár, P.; Girshick, R.; He, K.; Hariharan, B.; Belongie, S. Feature pyramid networks for object detection. In Proceedings of the IEEE Conference on Computer Vision and Pattern Recognition, Honolulu, HI, USA, 22–25 July 2017; pp. 2117–2125. [Google Scholar]
- Amodei, D.; Ananthanarayanan, S.; Anubhai, R.; Bai, J.; Battenberg, E.; Case, C.; Casper, J.; Catanzaro, B.; Cheng, Q.; Chen, G. Deep speech 2: End-to-end Speech Recognition in English and Mandarin. In Proceedings of the International Conference on Machine Learning, New York, NY, USA, 19–24 June 2016; pp. 173–182. [Google Scholar]
- Hannun, A.; Case, C.; Casper, J.; Catanzaro, B.; Diamos, G.; Elsen, E.; Prenger, R.; Satheesh, S.; Sengupta, S.; Coates, A. Deep speech: Scaling up end-to-end speech recognition. arXiv 2014, arXiv:1412.5567. [Google Scholar]
- LeCun, Y.; Bengio, Y.; Hinton, G. Deep learning. Nature 2015, 521, 436–444. [Google Scholar] [CrossRef]
- Acharya, U.R.; Fujita, H.; Lih, O.S.; Hagiwara, Y.; Tan, J.H.; Adam, M. Automated detection of arrhythmias using different intervals of tachycardia ECG segments with convolutional neural network. Inf. Sci. 2017, 405, 81–90. [Google Scholar] [CrossRef]
- Hannun, A.Y.; Rajpurkar, P.; Haghpanahi, M.; Tison, G.H.; Bourn, C.; Turakhia, M.P.; Ng, A.Y. Cardiologist-level arrhythmia detection and classification in ambulatory electrocardiograms using a deep neural network. Nat. Med. 2019, 25, 65. [Google Scholar] [CrossRef]
- Yıldırım, Ö.; Pławiak, P.; Tan, R.-S.; Acharya, U.R. Arrhythmia detection using deep convolutional neural network with long duration ECG signals. Comput. Biol. Med. 2018, 102, 411–420. [Google Scholar] [CrossRef] [PubMed]
- Golrizkhatami, Z.; Acan, A. ECG classification using three-level fusion of different feature descriptors. Expert Syst. Appl. 2018, 114, 54–64. [Google Scholar] [CrossRef]
- Guanglong, M.; Xiangqing, W.; Junsheng, Y. ECG Signal Classification Algorithm Based on Fusion Features; Journal of Physics: Conference Series; IOP Publishing: Bristol, UK, 2019; p. 012003. [Google Scholar]
- Cakaloglu, T.; Xu, X. A multi-resolution word embedding for document retrieval from large unstructured knowledge bases. arXiv 2019, arXiv:1902.00663. [Google Scholar]
- Szegedy, C.; Liu, W.; Jia, Y.; Sermanet, P.; Reed, S.; Anguelov, D.; Erhan, D.; Vanhoucke, V.; Rabinovich, A. Going deeper with convolutions. In Proceedings of the IEEE Conference on Computer Vision and Pattern Recognition, Boston, MA, USA, 8–10 June 2015; pp. 1–9. [Google Scholar]
- He, K.; Zhang, X.; Ren, S.; Sun, J. Deep residual learning for image recognition. In Proceedings of the IEEE Conference on Computer Vision and Pattern Recognition, Las Vegaas, NV, USA, 26 June–1 July 2016; pp. 770–778. [Google Scholar]
- Szegedy, C.; Vanhoucke, V.; Ioffe, S.; Shlens, J.; Wojna, Z. Rethinking the Inception Architecture for Computer Vision. In Proceedings of the IEEE Conference on Computer Vision and Pattern Recognition, Las Vegaas, NV, USA, 26 June–1 July 2016; pp. 2818–2826. [Google Scholar]
- Hu, J.; Shen, L.; Sun, G. Squeeze-and-excitation networks. In Proceedings of the IEEE Conference on Computer Vision and Pattern Recognition, Salt Lake, UT, USA, 18–22 June 2018; pp. 7132–7141. [Google Scholar]
- Goldberger, A.L.; Amaral, L.A.; Glass, L.; Hausdorff, J.M.; Ivanov, P.C.; Mark, R.G.; Mietus, J.E.; Moody, G.B.; Peng, C.-K.; Stanley, H.E. PhysioBank, PhysioToolkit, and PhysioNet: components of a new research resource for complex physiologic signals. Circulation 2000, 101, e215–e220. [Google Scholar] [CrossRef] [PubMed] [Green Version]
- Martis, R.J.; Acharya, U.R.; Min, L.C. ECG beat classification using PCA, LDA, ICA and discrete wavelet transform. Biomed. Signal Process. Control 2013, 8, 437–448. [Google Scholar] [CrossRef]
- Camm, A.J.; Malik, M.; Bigger, J.T.; Breithardt, G.; Cerutti, S.; Cohen, R.; Coumel, P.; Fallen, E.; Kennedy, H.; Kleiger, R. Heart rate variability: Standards of measurement, physiological interpretation and clinical use. Task Force of the European Society of Cardiology and the North American Society of Pacing and Electrophysiology. Circulation 1996, 93, 1043–1065. [Google Scholar]
- Ke, G.; Meng, Q.; Finley, T.; Wang, T.; Chen, W.; Ma, W.; Ye, Q.; Liu, T.-Y. Lightgbm: A highly efficient gradient boosting decision tree. In Proceedings of the Advances in Neural Information Processing Systems, Long Beach, CA, USA, 4–9 December 2017; pp. 3146–3154. [Google Scholar]
- Zhang, Z.; Luo, X. Heartbeat classification using decision level fusion. Biomed. Eng. Lett. 2014, 4, 388–395. [Google Scholar] [CrossRef]
- Experiment Dataset (ECG Signals). Available online: http://tianchi-competition.oss-cn-hangzhou.aliyuncs.com/231754/round2/hf_round2_train.zip (accessed on 13 February 2020).
- Experiment Dataset (Label). Available online: http://tianchi-competition.oss-cn-hangzhou.aliyuncs.com/231754/round2/hf_round2_train.txt (accessed on 13 February 2020).
- Experiment Dataset (Arrythmia). Available online: http://tianchi-competition.oss-cn-hangzhou.aliyuncs.com/231754/round2/hf_round2_arrythmia.txt (accessed on 13 February 2020).
- Shorten, C.; Khoshgoftaar, T.M. A survey on image data augmentation for deep learning. J. Big Data 2019, 6, 60. [Google Scholar] [CrossRef]
- DeVries, T.; Taylor, G.W. Improved regularization of convolutional neural networks with cutout. arXiv 2017, arXiv:1708.04552. [Google Scholar]
- Ioffe, S.; Szegedy, C. Batch normalization: Accelerating deep network training by reducing internal covariate shift. arXiv 2015, arXiv:1502.03167. [Google Scholar]
- Srivastava, N.; Hinton, G.; Krizhevsky, A.; Sutskever, I.; Salakhutdinov, R. Dropout: a simple way to prevent neural networks from overfitting. J. Mach. Learn. Res. 2014, 15, 1929–1958. [Google Scholar]
Figure 1.
Proposed arrhythmia detection framework based on multi-resolution representation (MRR) of an electrocardiogram (ECG).
Figure 1.
Proposed arrhythmia detection framework based on multi-resolution representation (MRR) of an electrocardiogram (ECG).

Figure 2.
Inception module structure.

Figure 3.
Residual module structure.

Figure 4.
The two types of SeNet module structures: (a) SeNet realized by fully connected neurons; (b) SeNet realized by convolution operations.
Figure 4.
The two types of SeNet module structures: (a) SeNet realized by fully connected neurons; (b) SeNet realized by convolution operations.


Table 1.
Statistics of dataset used in this study.
| # | Type | Records |
|---|---|---|
| 1 | Low QRS voltages | 3 |
| 2 | Right axis deviation | 1124 |
| 3 | Paced rhythm | 16 |
| 4 | T wave change | 3479 |
| 5 | Left axis deviation | 1124 |
| 6 | Atrial fibrillation | 120 |
| 7 | Nonspecific ST segment anomaly | 64 |
| 8 | Abnormal Q-wave in inferior wall | 52 |
| 9 | Poor R wave progression of the front wall | 16 |
| 10 | ST segment change | 286 |
| 11 | First degree atrioventricular block | 142 |
| 12 | Left bundle branch block | 25 |
| 13 | Right bundle branch block | 551 |
| 14 | Complete left bundle branch block | 25 |
| 15 | Left anterior fascicular block | 35 |
| 16 | Right atrial enlargement | 32 |
| 17 | Short PR interval | 23 |
| 18 | Left ventricular high voltage | 414 |
| 19 | Sinus bradycardia | 5264 |
| 20 | Early repolarization | 22 |
| 21 | Normal sinus rhythm | 9501 |
| 22 | Fusion beat | 7 |
| 23 | ST-T change | 299 |
| 24 | Nonspecific ST segment and T wave anomaly | 16 |
| 25 | Rapid ventricular rate | 29 |
| 26 | Nonspecific T wave anomaly | 34 |
| 27 | Ventricular premature beat | 543 |
| 28 | Atrial premature beat | 314 |
| 29 | Sinus arrhythmia | 901 |
| 30 | Complete right bundle branch block | 418 |
| 31 | Sinus tachycardia | 4895 |
| 32 | Incomplete right bundle branch block | 126 |
| 33 | Clockwise rotation | 35 |
| 34 | Counterclockwise rotation | 60 |
| - | Total | 29995 |
Table 2.
Classification performance for each channel model and the proposed method.
| Type | F1 Score | Precision | Recall |
|---|---|---|---|
| GoogleNet | 0.9118 | 0.9398 | 0.8854 |
| SeInceptionNet | 0.9181 | 0.9480 | 0.8902 |
| ResNet | 0.9130 | 0.9399 | 0.8876 |
| SeResNet | 0.9183 | 0.9427 | 0.8951 |
| Hand-crafted fea | 0.7922 | 0.9051 | 0.7045 |
| Multi-Resolution | 0.9238 | 0.9372 | 0.9107 |
Table 3.
Comparison of two experimental schemes in each single model.
| Type | F1 Score | Precision | Recall | |||
|---|---|---|---|---|---|---|
| scheme_1 | scheme_2 | scheme_1 | scheme_2 | scheme_1 | scheme_2 | |
| GoogleNet | 0.9118 | 0.9173 | 0.9398 | 0.9305 | 0.8854 | 0.9044 |
| SeInceptionNet | 0.9181 | 0.9196 | 0.9480 | 0.9320 | 0.8902 | 0.9077 |
| ResNet | 0.9130 | 0.9190 | 0.9399 | 0.9331 | 0.8876 | 0.9055 |
| SeResNet | 0.9183 | 0.9205 | 0.9427 | 0.9342 | 0.8951 | 0.9072 |
Table 4.
Number of parameters of the ResNet with and without SeNet.
| Net Type | Parameters |
|---|---|
| ResNet | 37899938 |
| SeResNet_1 | 38057122 |
| SeResNet_2 | 40257698 |
© 2020 by the authors. Licensee MDPI, Basel, Switzerland. This article is an open access article distributed under the terms and conditions of the Creative Commons Attribution (CC BY) license (http://creativecommons.org/licenses/by/4.0/).
Share and Cite
MDPI and ACS Style
Wang, D.; Meng, Q.; Chen, D.; Zhang, H.; Xu, L. Automatic Detection of Arrhythmia Based on Multi-Resolution Representation of ECG Signal. Sensors 2020, 20, 1579. https://doi.org/10.3390/s20061579
AMA Style
Wang D, Meng Q, Chen D, Zhang H, Xu L. Automatic Detection of Arrhythmia Based on Multi-Resolution Representation of ECG Signal. Sensors. 2020; 20(6):1579. https://doi.org/10.3390/s20061579
Chicago/Turabian StyleWang, Dongqi, Qinghua Meng, Dongming Chen, Hupo Zhang, and Lisheng Xu. 2020. "Automatic Detection of Arrhythmia Based on Multi-Resolution Representation of ECG Signal" Sensors 20, no. 6: 1579. https://doi.org/10.3390/s20061579
Note that from the first issue of 2016, this journal uses article numbers instead of page numbers. See further details here.