Cancer-Specific hNQO1-Responsive Biocompatible Naphthalimides Providing a Rapid Fluorescent Turn-On with an Enhanced Enzyme Affinity


Abstract
:
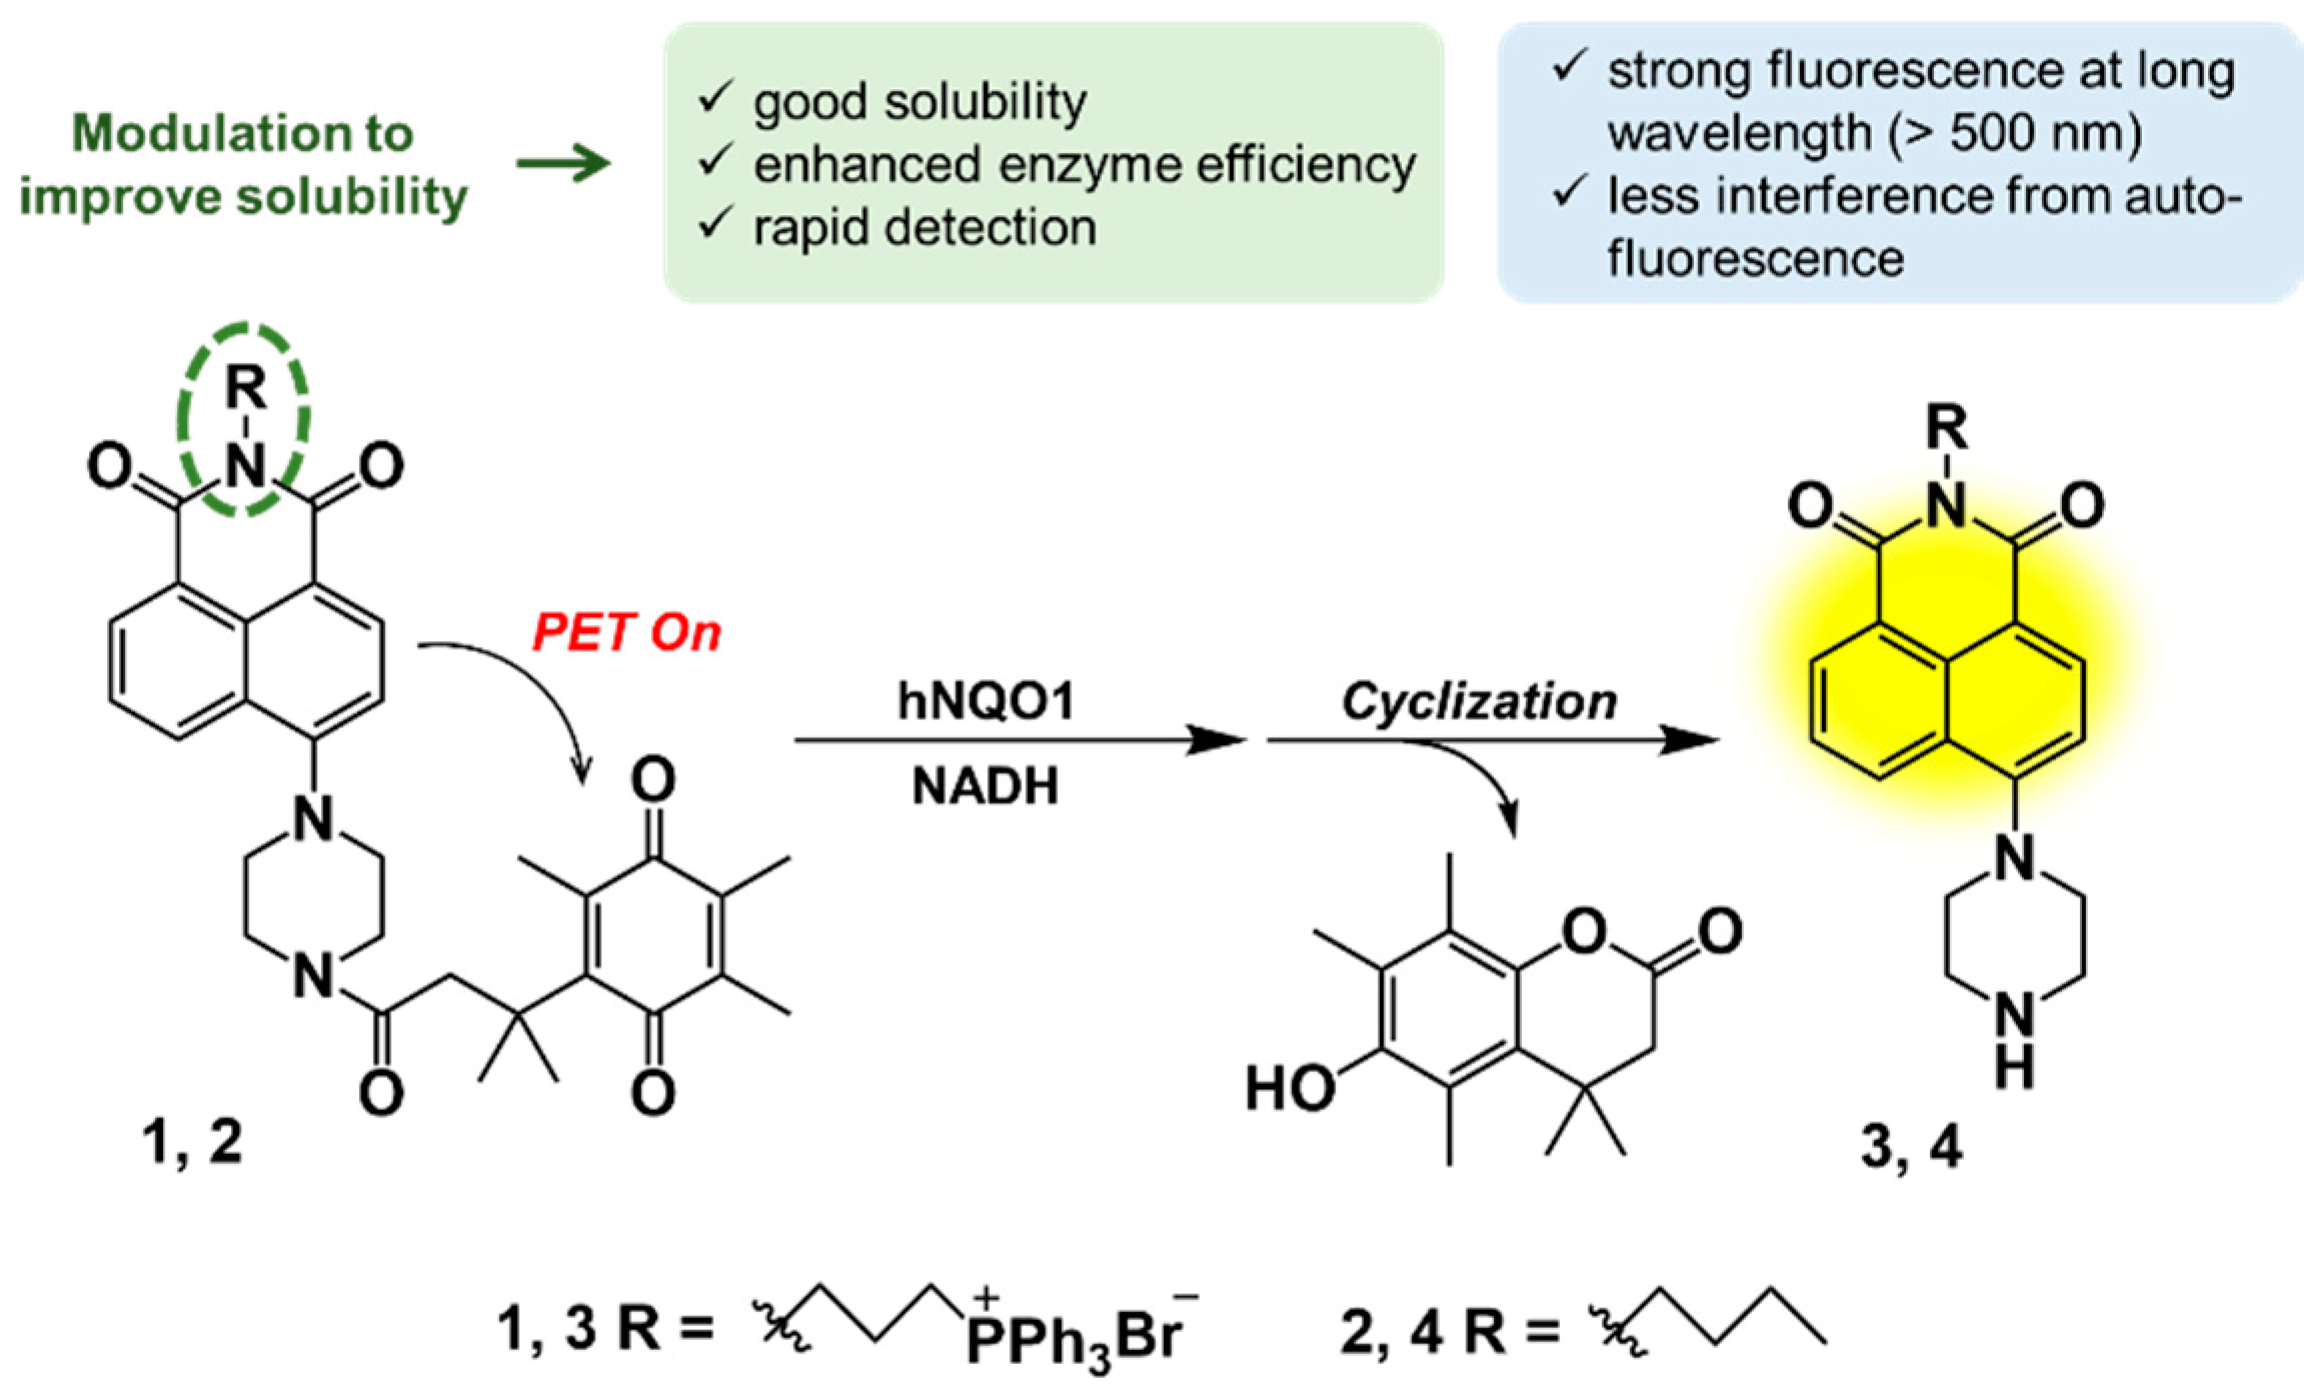
1. Introduction
2. Materials and Methods
2.1. Materials and Instrumentations
2.2. Cell Culture and Confocal Microscopic Methods
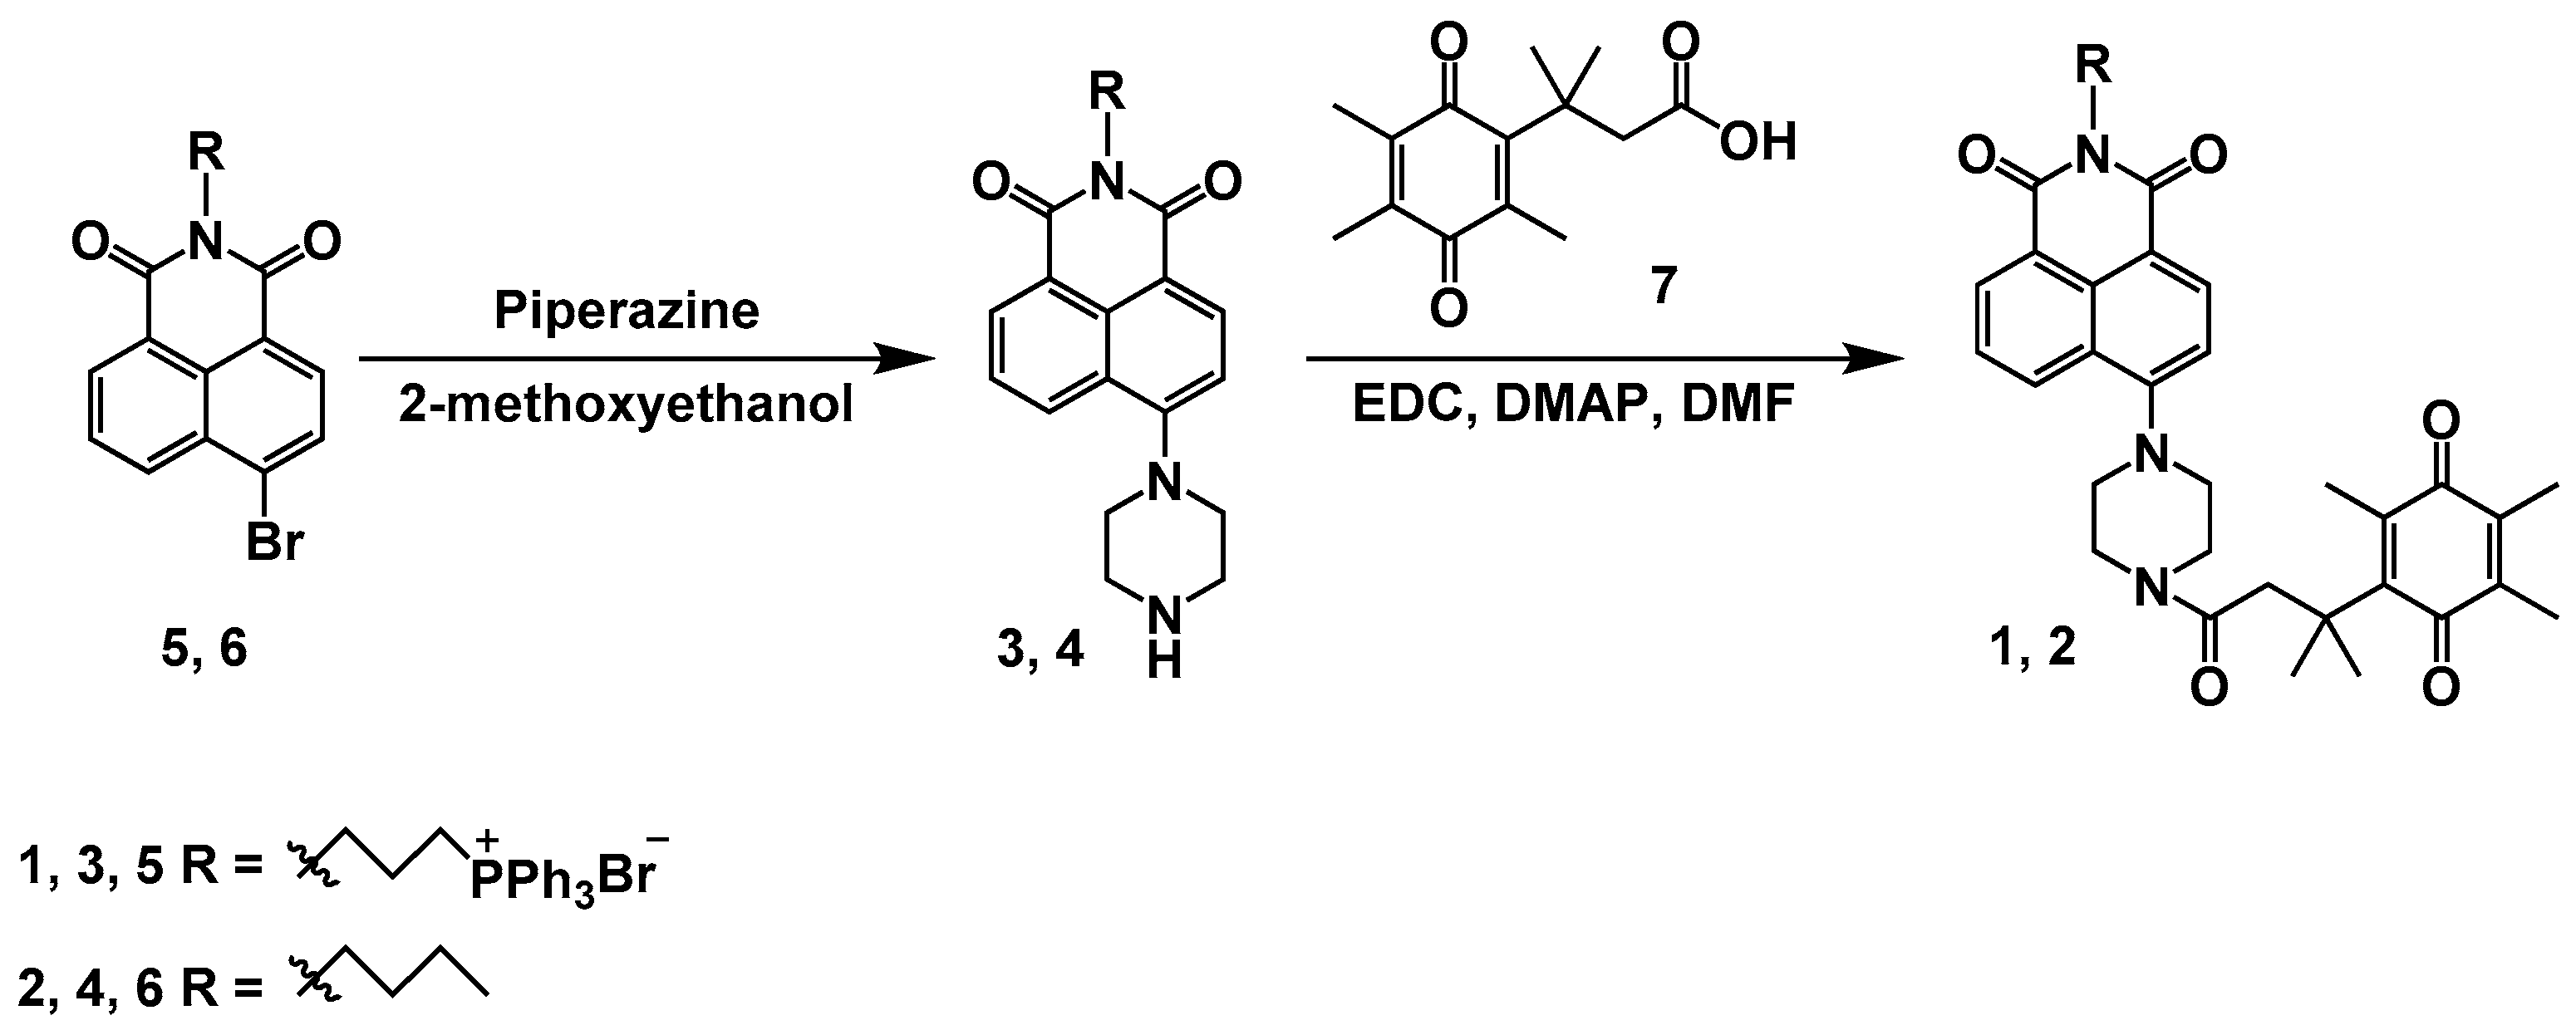
2.3. Synthesis
2.3.1. Synthesis of Probe 1
2.3.2. Synthesis of Probe 2
2.3.3. Synthesis of Triphenylphosphonium-Naphthalimide-Piperazine 3
2.3.4. Synthesis of Butyl-Naphthalimide-Piperazine 4
3. Results and Discussion
3.1. Spectroscopic Analyses of Probes 1 and 2 to hNQO1 Activity
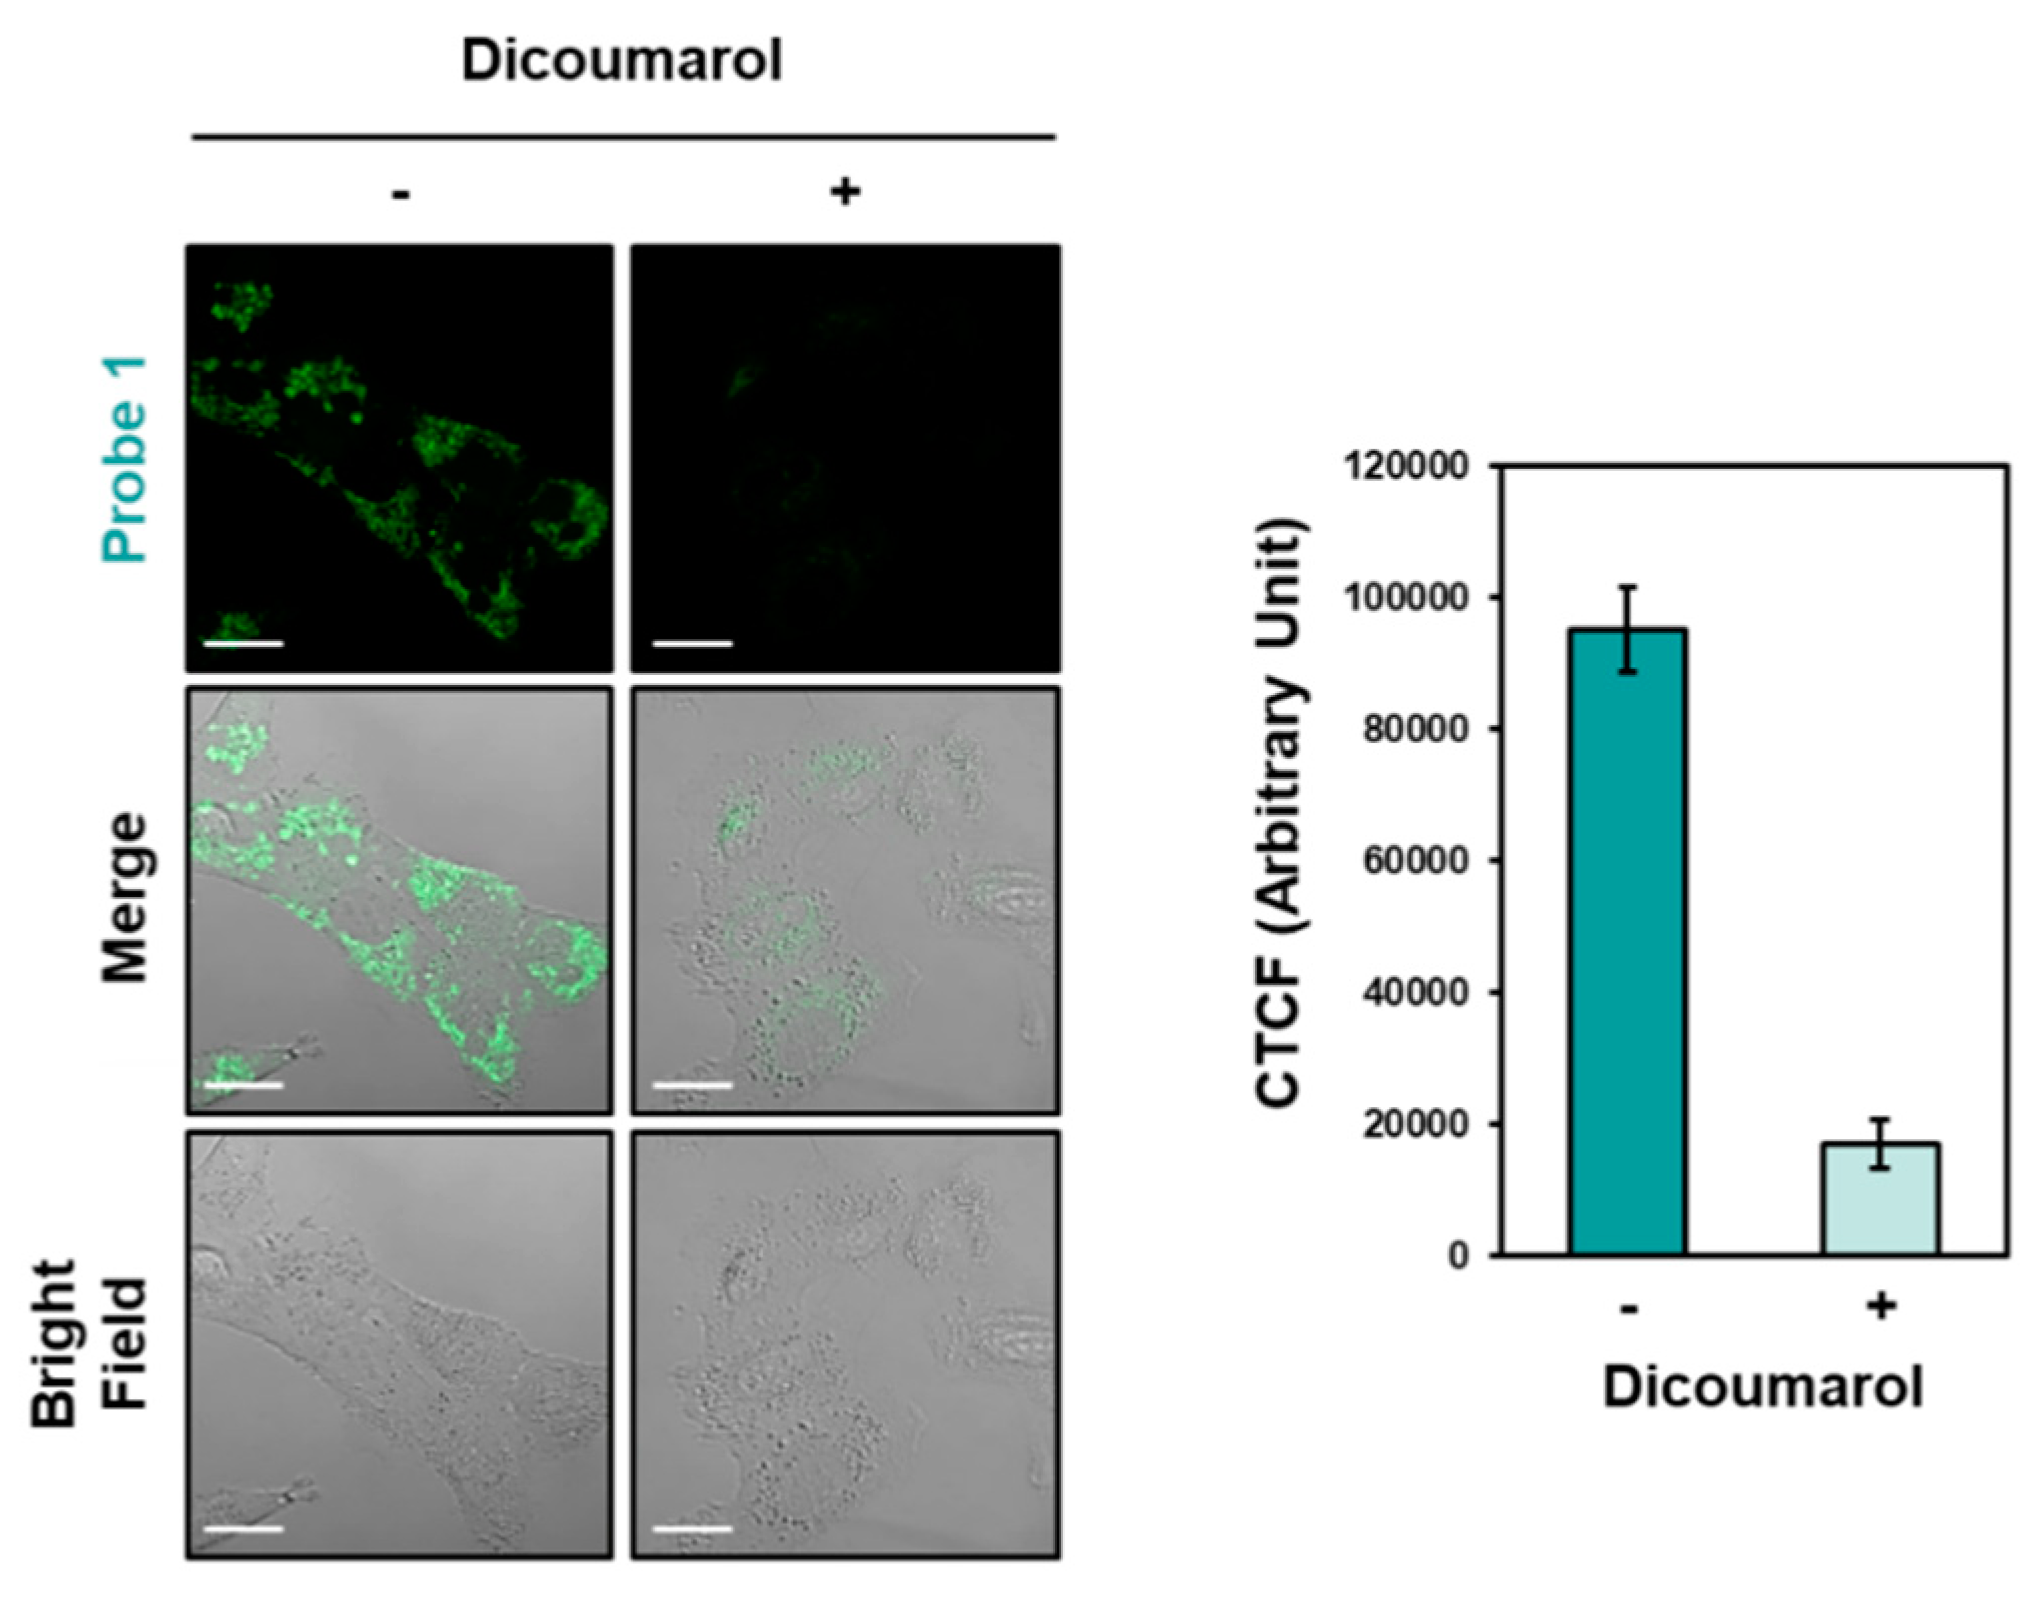
3.2. Detection Capabilities of Probe 1 to Cellular hNQO1 in Cancer Cells
4. Conclusions
Supplementary Materials
Author Contributions
Funding
Conflicts of Interest
References
- Nakamura, M.; Hayashi, T. One- and two-electron reduction of quinones by rat liver subcellular fractions reactive oxygen species. J. Biochem. 1994, 115, 1141–1147. [Google Scholar] [CrossRef] [PubMed]
- Danson, S.; Ward, T.H.; Butler, J.; Ranson, M. DT-diaphorase: A target for new anticancer drugs. Cancer Treat. Rev. 2004, 30, 437–449. [Google Scholar] [CrossRef] [PubMed]
- Buranrat, B.; Chau-in, S.; Prawan, A.; Puapairoj, A.; Zeekpudsa, P.; Kukongviriyapan, V. NQO1 expression correlates with cholangiocarcinoma prognosis. Asian Pac. J. Cancer Prev. 2012, 13, 131–136. [Google Scholar] [PubMed]
- Cui, X.; Li, L.; Yan, G.; Meng, K.; Lin, Z.; Nan, Y.; Jin, G.; Li, C. High expression of NQO1 is associated with poor prognosis in serous ovarian carcinoma. BMC Cancer 2015, 15, 1–8. [Google Scholar] [CrossRef] [PubMed] [Green Version]
- Srijiwangsa, P.; Na-Bangchang, K. Roles of NAD(P)H-quinone oxidoreductase 1 (NQO1) on cancer progression and chemoresistance. J. Clin. Exp. Oncol. 2017, 6, 1–6. [Google Scholar] [CrossRef] [Green Version]
- Chen, Y.; Hu, L. Design of anticancer prodrugs for reductive activation. Med. Res. Rev. 2009, 29, 29–64. [Google Scholar] [CrossRef] [PubMed]
- Begleiter, A.; El-Gabalawy, N.; Lange, L.; Leith, M.K.; Guziec, L.J.; Guziec Jr, F.S. A model for NAD(P) H: Quinoneoxidoreductase 1 (NQO1) targeted individualized cancer chemotherapy. Drug Target Insights 2009, 4, DTI–S1146. [Google Scholar] [CrossRef] [PubMed]
- Silvers, W.C.; Prasai, B.; Burk, D.H.; Brown, M.L.; McCarley, R.L. Profluorogenic reductase substrate for rapid, selective, and sensitive visualization and detection of human cancer cells that overexpress NQO1. J. Am. Chem. Soc. 2013, 135, 309–314. [Google Scholar] [CrossRef] [PubMed] [Green Version]
- Prasai, B.; Silvers, W.C.; McCarley, R.L. Oxidoreductase-facilitated visualization and detection of human cancer cells. Anal. Chem. 2015, 87, 6411–6418. [Google Scholar] [CrossRef] [PubMed]
- Kwon, N.; Cho, M.K.; Park, S.J.; Kim, D.; Nam, S.-J.; Cui, L.; Kim, H.M.; Yoon, J. An efficient two-photon fluorescent probe for human NAD(P) H: Quinone oxidoreductase (hNQO1) detection and imaging in tumor cells. Chem. Commun. 2017, 53, 525–528. [Google Scholar] [CrossRef] [PubMed]
- Cho, M.K.; Lim, C.S.; Sarkar, A.R.; Lee, H.W.; Choi, H.J.; Noh, C.-K.; Shin, S.J.; Kim, H.M. A two-photon ratiometric probe for detection of hNQO1 enzyme activity in human colon tissue. Sens. Actuators B Chem. 2018, 272, 203–210. [Google Scholar] [CrossRef]
- Park, S.Y.; Won, W.; Kang, C.; Kim, J.S.; Lee, M.H. A coumarin-naphthalimide hybrid as a dual emissive fluorescent probe for hNQO1. Dyes. Pigm. 2019, 164, 341–345. [Google Scholar] [CrossRef]
- Shin, W.S.; Lee, M.-G.; Verwilst, P.; Lee, J.H.; Chi, S.-G.; Kim, J.S. Mitochondria-targeted aggregation induced emission theranostics: Crucial importance of in situ activation. Chem. Sci. 2016, 7, 6050–6059. [Google Scholar] [CrossRef] [PubMed] [Green Version]
- Liu, H.-W.; Xu, S.; Wang, P.; Hu, X.-X.; Zhang, J.; Yuan, L.; Zhang, X.-B.; Tan, W. An efficient two-photon fluorescent probe for monitoring mitochondrial singlet oxygen in tissues during photodynamic therapy. Chem. Commun. 2016, 52, 12330–12333. [Google Scholar] [CrossRef] [PubMed]
- Li, C.Y.; Zhang, X.B.; Qiao, L.; Zhao, Y.; He, C.M.; Huan, S.Y.; Lu, L.M.; Jian, L.X.; Shen, G.L.; Yu, R.Q. Naphthalimide-porphyrin hybrid based ratiometric bioimaging probe for Hg2+: Well-resolved emission spectra and unique specificity. Anal. Chem. 2009, 81, 9993–10001. [Google Scholar] [CrossRef] [PubMed]
- Rohde, R.D.; Agnew, H.D.; Yeo, W.-S.; Bailey, R.C.; Heath, J.R. A non-oxidative approach toward chemically and electrochemically functionalizing Si (111). J. Am. Chem. Soc. 2006, 128, 9518–9525. [Google Scholar] [CrossRef] [PubMed] [Green Version]
- Asher, G.; Dym, O.; Tsvetkov, P.; Adler, J.; Shaul, Y. The crystal structure of NAD(P)H quinone oxidoreductase 1 in complex with its potent inhibitor dicoumarol. Biochemistry 2006, 45, 6372–6378. [Google Scholar] [CrossRef] [PubMed]
- Shrivastava, A.; Gupta, V.B. Methods for the determination of limit of detection and limit of quantitation of the analytical methods. Chron. Young Sci. 2011, 2, 21–25. [Google Scholar] [CrossRef]
- Lee, M.H.; Jeon, H.M.; Han, J.H.; Park, N.; Kang, C.; Sessler, J.L.; Kim, J.S. Toward a chemical marker for inflammatory disease: A fluorescent probe for membrane-localized thioredoxin. J. Am. Chem. Soc. 2014, 136, 8430–8437. [Google Scholar] [CrossRef] [PubMed]
- Karlgren, M.; Vildhede, A.; Norinder, U.; Wisniewski, J.R.; Kimoto, E.; Lai, Y.; Haglund, U.; Artursson, P. Classification of inhibitors of hepatic organic anion transporting polypeptides (OATPs): Influence of protein expression on drug-drug interactions. J. Med. Chem. 2012, 55, 4740–4763. [Google Scholar] [CrossRef] [PubMed]


| Probe | Detection Time | Emission | Specificity Constant (kcat/Km) | Ref. |
|---|---|---|---|---|
 | 37 min | 470 nm | (4.94 ± 0.33) × 103 M−1 s−1 | [8] |
 | N/A | 527 nm | (3.2 ± 0.6) × 104 M−1 s−1 | [9] |
 | 15 min | 520 nm | 2.78 × 10⁵ M−1 s−1 | [10] |
 | 12 min | 450 nm & 540 nm | 4.61 × 10³ M−1 s−1 | [11] |
 | 60 min | 460 nm & 540 nm | (7.66 ± 0.02) × 104 M−1 s−1 | [12] |
| Probe 2 | 10 min | 540 nm | (4.03 ± 0.14) × 105 M−1 s−1 | This work |
| Probe 1 | 6 min | 540 nm | (9.54 ± 0.20) × 105 M−1 s−1 | This work |
© 2019 by the authors. Licensee MDPI, Basel, Switzerland. This article is an open access article distributed under the terms and conditions of the Creative Commons Attribution (CC BY) license (http://creativecommons.org/licenses/by/4.0/).
Share and Cite
Park, S.Y.; Jung, E.; Kim, J.S.; Chi, S.-G.; Lee, M.H. Cancer-Specific hNQO1-Responsive Biocompatible Naphthalimides Providing a Rapid Fluorescent Turn-On with an Enhanced Enzyme Affinity. Sensors 2020, 20, 53. https://doi.org/10.3390/s20010053
Park SY, Jung E, Kim JS, Chi S-G, Lee MH. Cancer-Specific hNQO1-Responsive Biocompatible Naphthalimides Providing a Rapid Fluorescent Turn-On with an Enhanced Enzyme Affinity. Sensors. 2020; 20(1):53. https://doi.org/10.3390/s20010053
Chicago/Turabian StylePark, Sun Young, Eugeine Jung, Jong Seung Kim, Sung-Gil Chi, and Min Hee Lee. 2020. "Cancer-Specific hNQO1-Responsive Biocompatible Naphthalimides Providing a Rapid Fluorescent Turn-On with an Enhanced Enzyme Affinity" Sensors 20, no. 1: 53. https://doi.org/10.3390/s20010053