The State-of-the-Art of Sensors and Environmental Monitoring Technologies in Buildings

Abstract
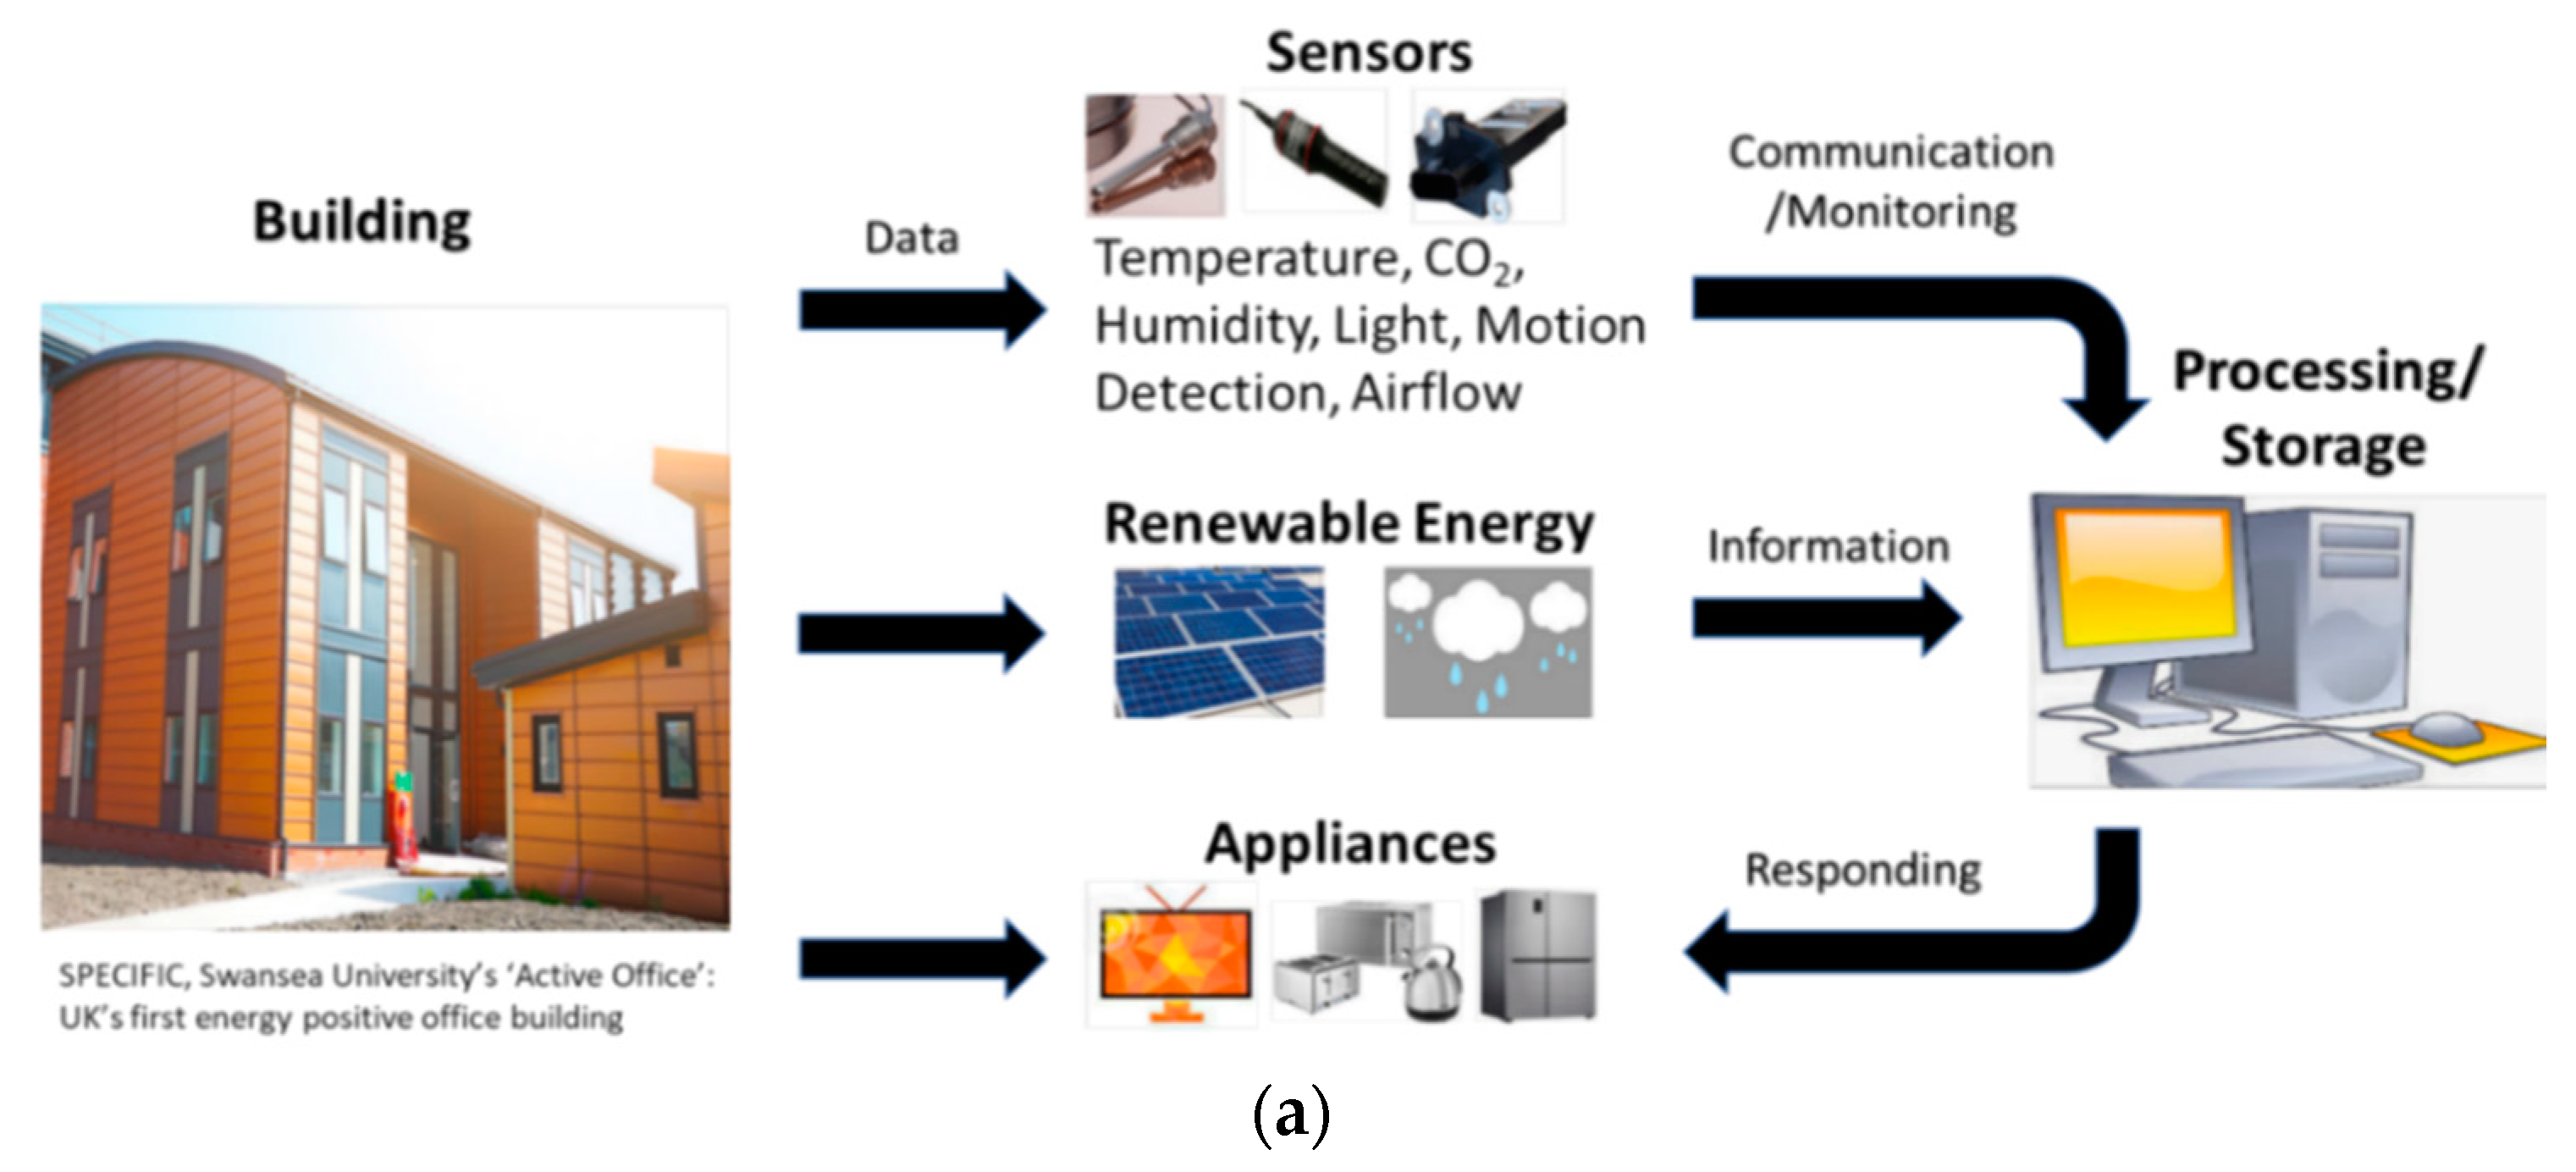
:1. Introduction
- (i)
- What is the current state-of-the art of commercially available sensors and monitoring devices in terms of operation principles, accuracy, measurement range, response times, portability, power consumption, and cost? (Section 2)
- (ii)
- What is the current state-of-the-art of commercially available wired and wireless communication technologies in terms of operation principles, connectivity and scalability, measurement range, data rates, power consumption and market adoption? (Section 3)
- (iii)
- What are the key characteristics, limitations and potential of various battery and energy harvesting technologies for sensing and monitoring applications in buildings? (Section 4)
- (iv)
- What are the key aspects regarding the application, challenges and future perspectives of sensing and monitoring technologies in buildings? (Section 5)
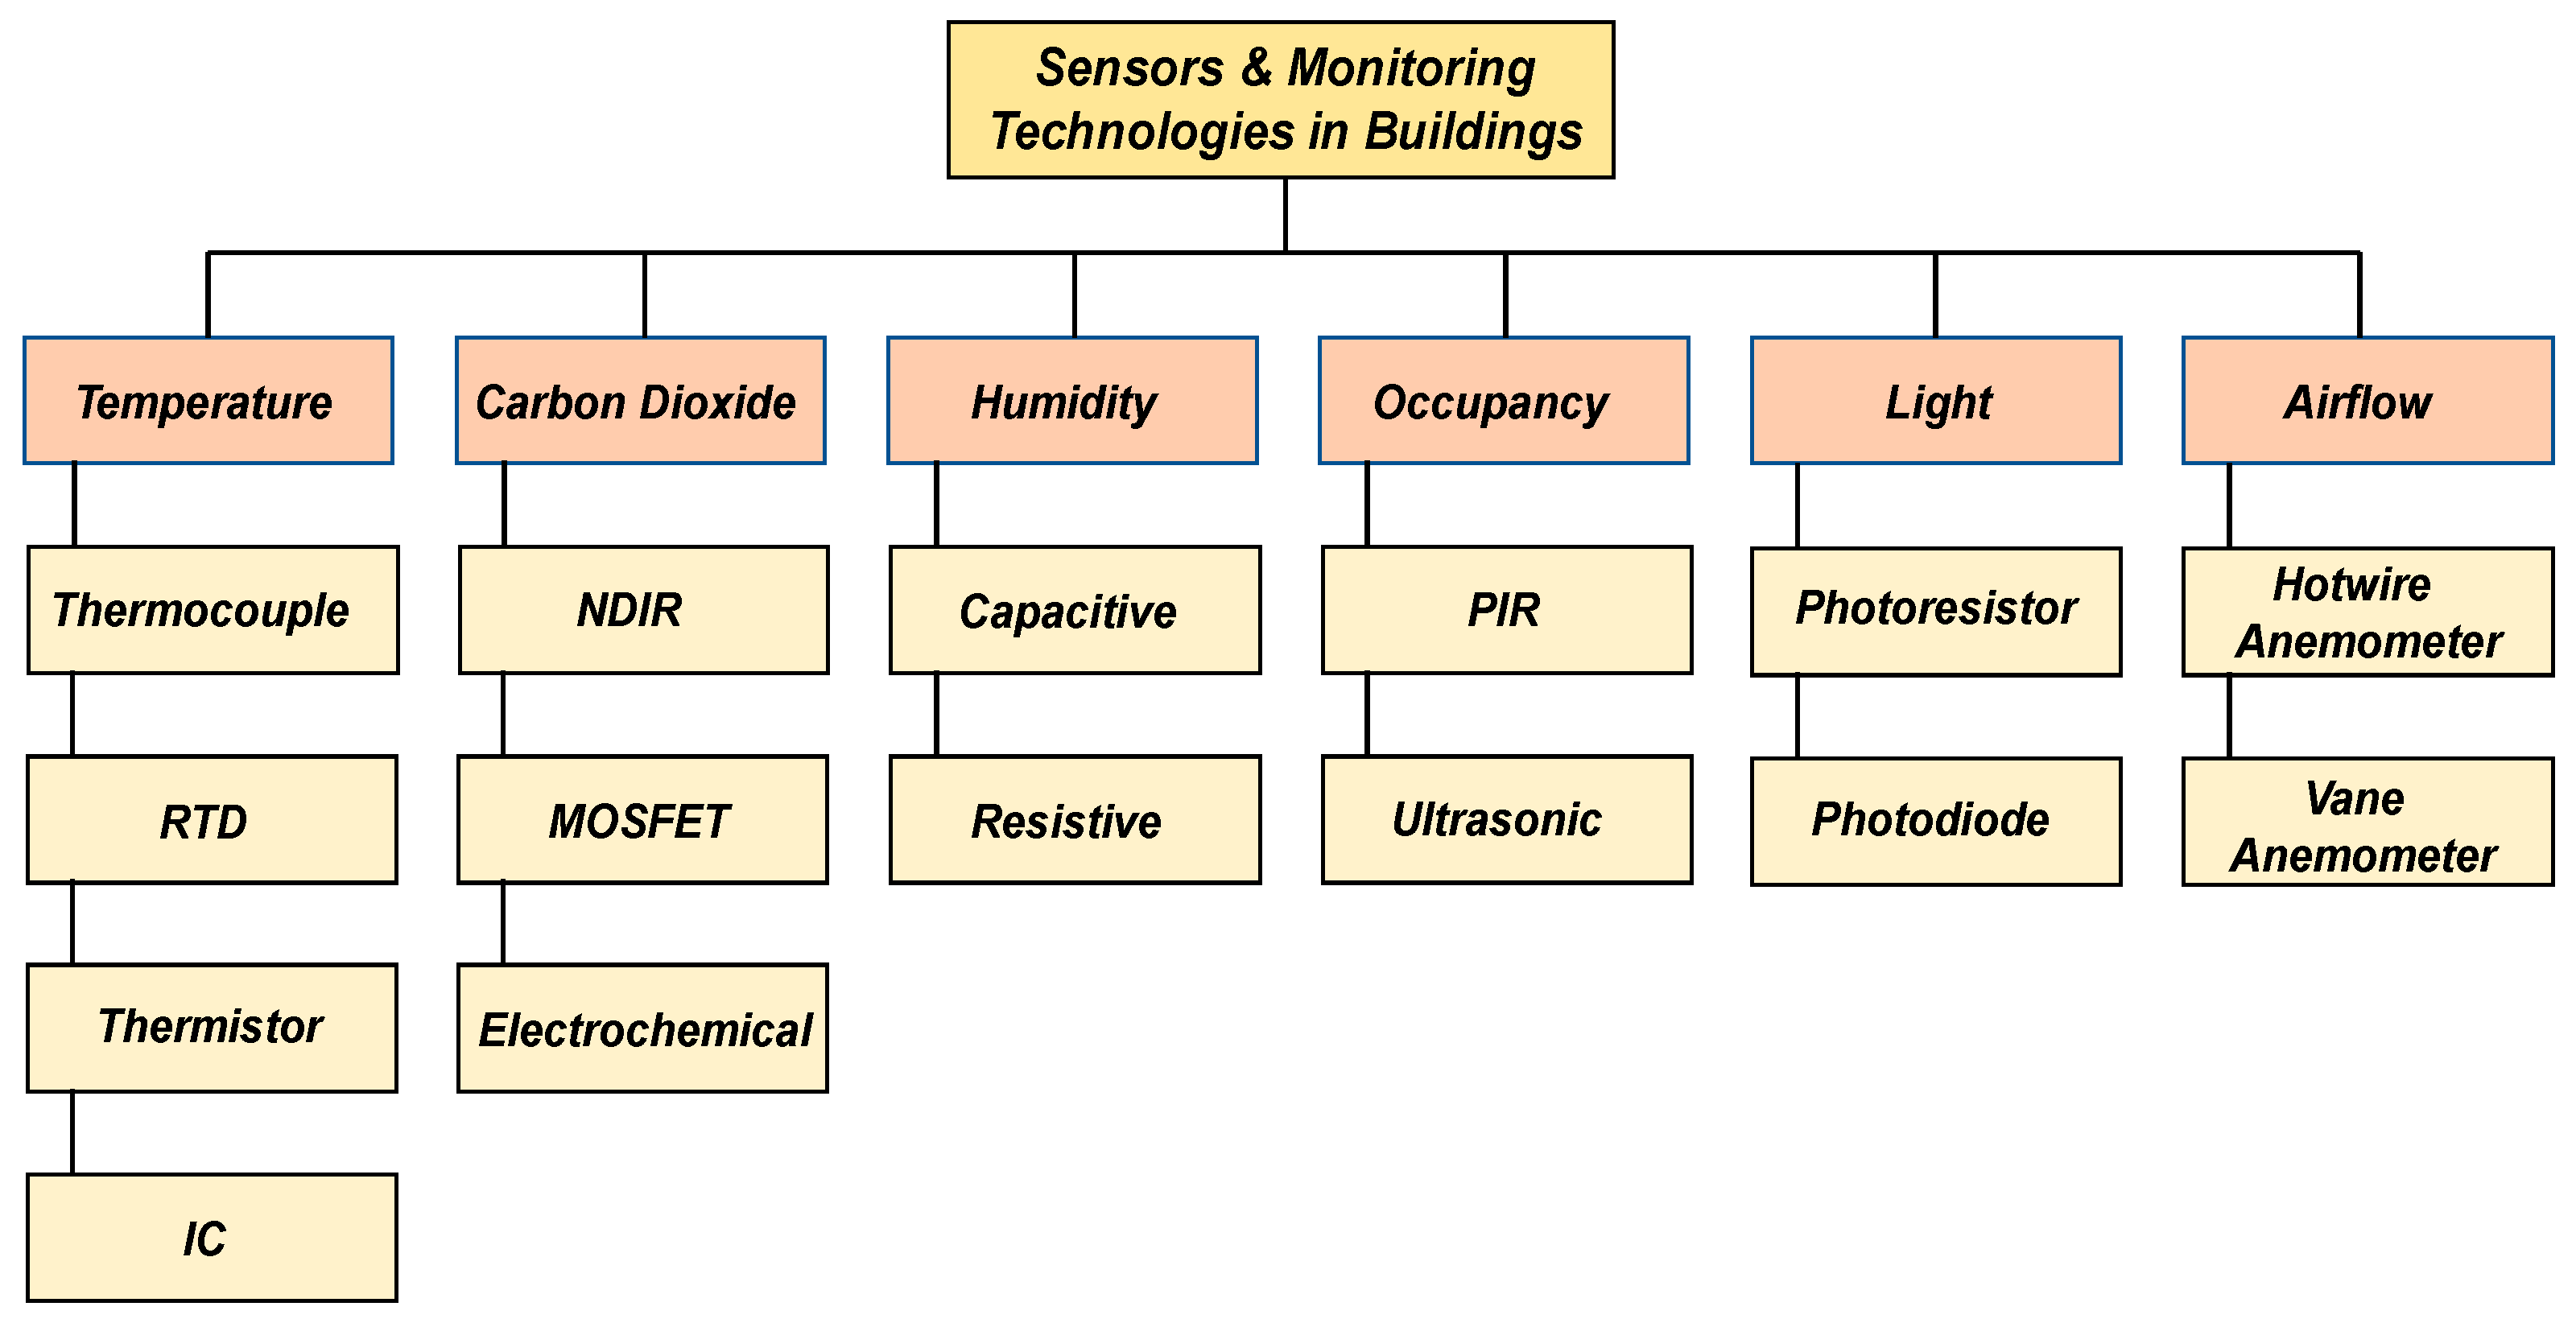
2. Sensors and Monitoring Technologies
2.1. Temperature Sensors
2.2. Carbon Dioxide Sensors
2.3. Humidity Sensors
2.4. Occupancy Sensors
2.5. Light Sensors
2.6. Airflow Sensors
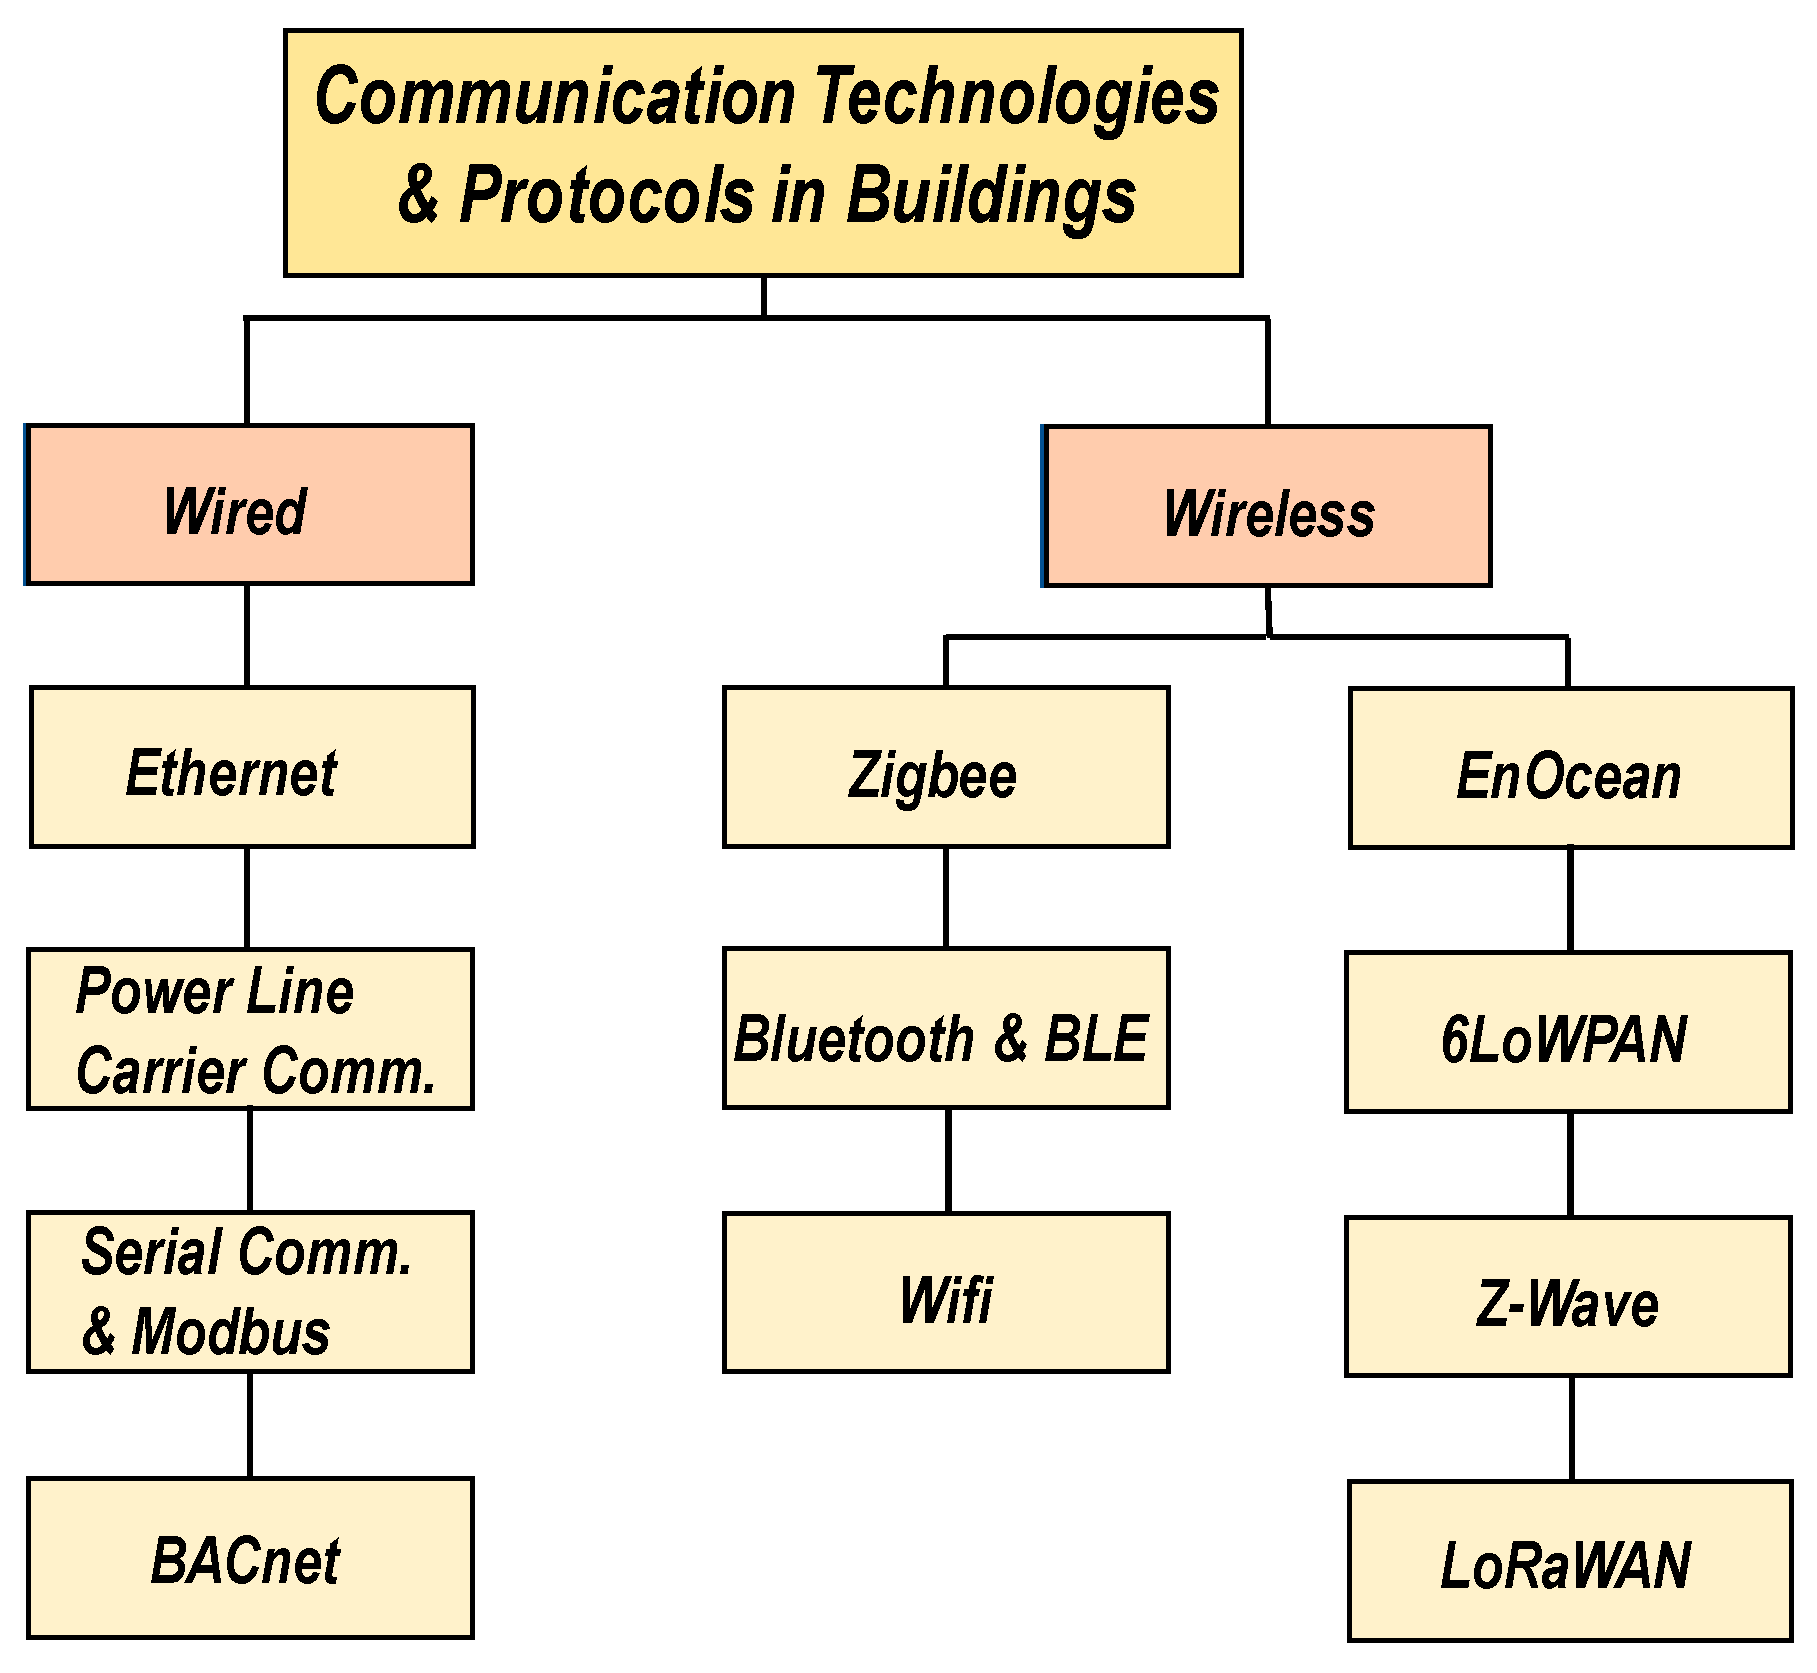
3. Communication Technologies and Protocols
3.1. Ethernet
3.2. Power Line Carrier Communication (PLCC)
3.3. Serial Communication and Modbus
3.4. Zigbee
3.5. Bluetooth and Bluetooth Low Energy (BLE)
3.6. Wifi
3.7. Other State-of-the-Art Communication Technologies
4. Battery and Energy Harvesting Technologies for Sensing and Monitoring in Buildings
4.1. Characteristics and Limitations of Battery Technologies
- (i)
- Lifespan and Replacement—The lifetime of sensing and monitoring devices is always longer than the lifetime of the battery and, therefore, at some point, battery replacement is required (depending on the lifespan of the selected battery technology).
- (ii)
- Self-discharging—Batteries self-discharge over time, which is caused by internal chemical reactions. Depletion due to self-discharging leads to reductions in the lifespan of the battery.
- (iii)
- Size—Battery size usually exceeds the size of most sensing and monitoring devices.
- (iv)
- Cost—Despite significant advancements in recent years, the cost of batteries continues to be higher than the cost of most sensing and monitoring devices summarized in Table 2 and Table 3. This cost increases further when more than one battery is required for a particular application (e.g., connecting multiple batteries in series or parallel for larger voltage requirements).
- (v)
- Installation—Most batteries are able to operate in any position and provide good resistance to shocks and vibrations. However, in some cases, batteries have to be positioned on shock-absorbing dampers and in upright positions.
- (vi)
- Disposal—Common battery technologies such as NiCd and Lead Acid contain environmentally hazardous materials and cannot be disposed with regular household items. Although NiMH and Lithium-based batteries are more environmentally friendly, it is still recommended to recycle all used batteries appropriately.
- (vii)
- Maintenance—Apart from Li-ion and Alkaline, all other widely used battery technologies require regular maintenance every 30–180 days depending on usage.
4.2. Potential of Building Energy Harvesting Technologies
- (i)
- Photovoltaic (PV)—PV or solar cells convert ambient light energy (either natural sun light or artificial light) into electrical power and are the most mature and commonly used energy harvesting technology today. The amount of power harvested in PV energy harvesting is directly dependent on the incident angle of the light, intensity of the source, and the surface, size, sensitivity and material of the PV cell.
- (ii)
- Thermal—Thermal (or Thermoelectric) energy harvesters convert heat into electrical power. These harvesters consist of arrays of thermocouples which sense a difference in temperature across their bimetal junctions (Seebeck effect) and produce a voltage in response to that.
- (iii)
- Kinetic—Kinetic energy harvesters convert ambient mechanical energy (typically vibrations) into electrical power. Most kinetic harvesters, to date, convert vibrations into electrical energy using one of three main mechanisms, i.e., (1) electromagnetic (EM), (2) piezoelectric, and (3) electrostatic.
- (iv)
- Radio Frequency (RF)—RF energy harvesters convert electromagnetic waves naturally available in the environment into electrical power. These RF waves are typically emitted from devices such as WiFi routers, radio and TV transmitters, mobile communications to and from base stations, etc.
- (v)
- Airflow—Airflow energy harvesters use the ambient air generated by air conditioners, etc., inside buildings and convert it into electrical power. This is typically achieved via one of three methods, i.e., (1) wind turbine approach, (2) vibrating ribbon approach, and (3) cantilever approach.
4.3. Commercial Building Energy Harvesting Solutions
5. Discussion: Application, Challenges and Future Perspectives
5.1. Selection Parameters for Sensors and Communication Technologies in Buildings
- (i)
- Heterogeneity—a single device/technology or a heterogeneous group with varying properties and hierarchies.
- (ii)
- Cost—purchasing, installation and maintenance.
- (iii)
- Availability—readily available for installation and replacement when required.
- (iv)
- Deployment—once, incremental or random.
- (v)
- Maintenance—monthly, quarterly, annually or maintenance-free.
- (vi)
- Connectivity—continuous, occasional or sporadic.
- (vii)
- Accuracy/Range—adequate accuracy and measurement/coverage range for desired application.
- (viii)
- Security—vulnerability to any potential hacking/viruses/noise/interference.
- (ix)
- Lifetime—a few hours, many months or several years.
- (x)
- Power Consumption—low consumption to ensure long battery lifetimes, low energy bills etc.
- (xi)
- Reliability—susceptibility to any potential disconnections/loss of power during data acquisition/storage/transmission.
- (xii)
- Ruggedness—suitability for indoor/outdoor environments.
- (xiii)
- Portability—flexibility to adjust/move network if and when required.
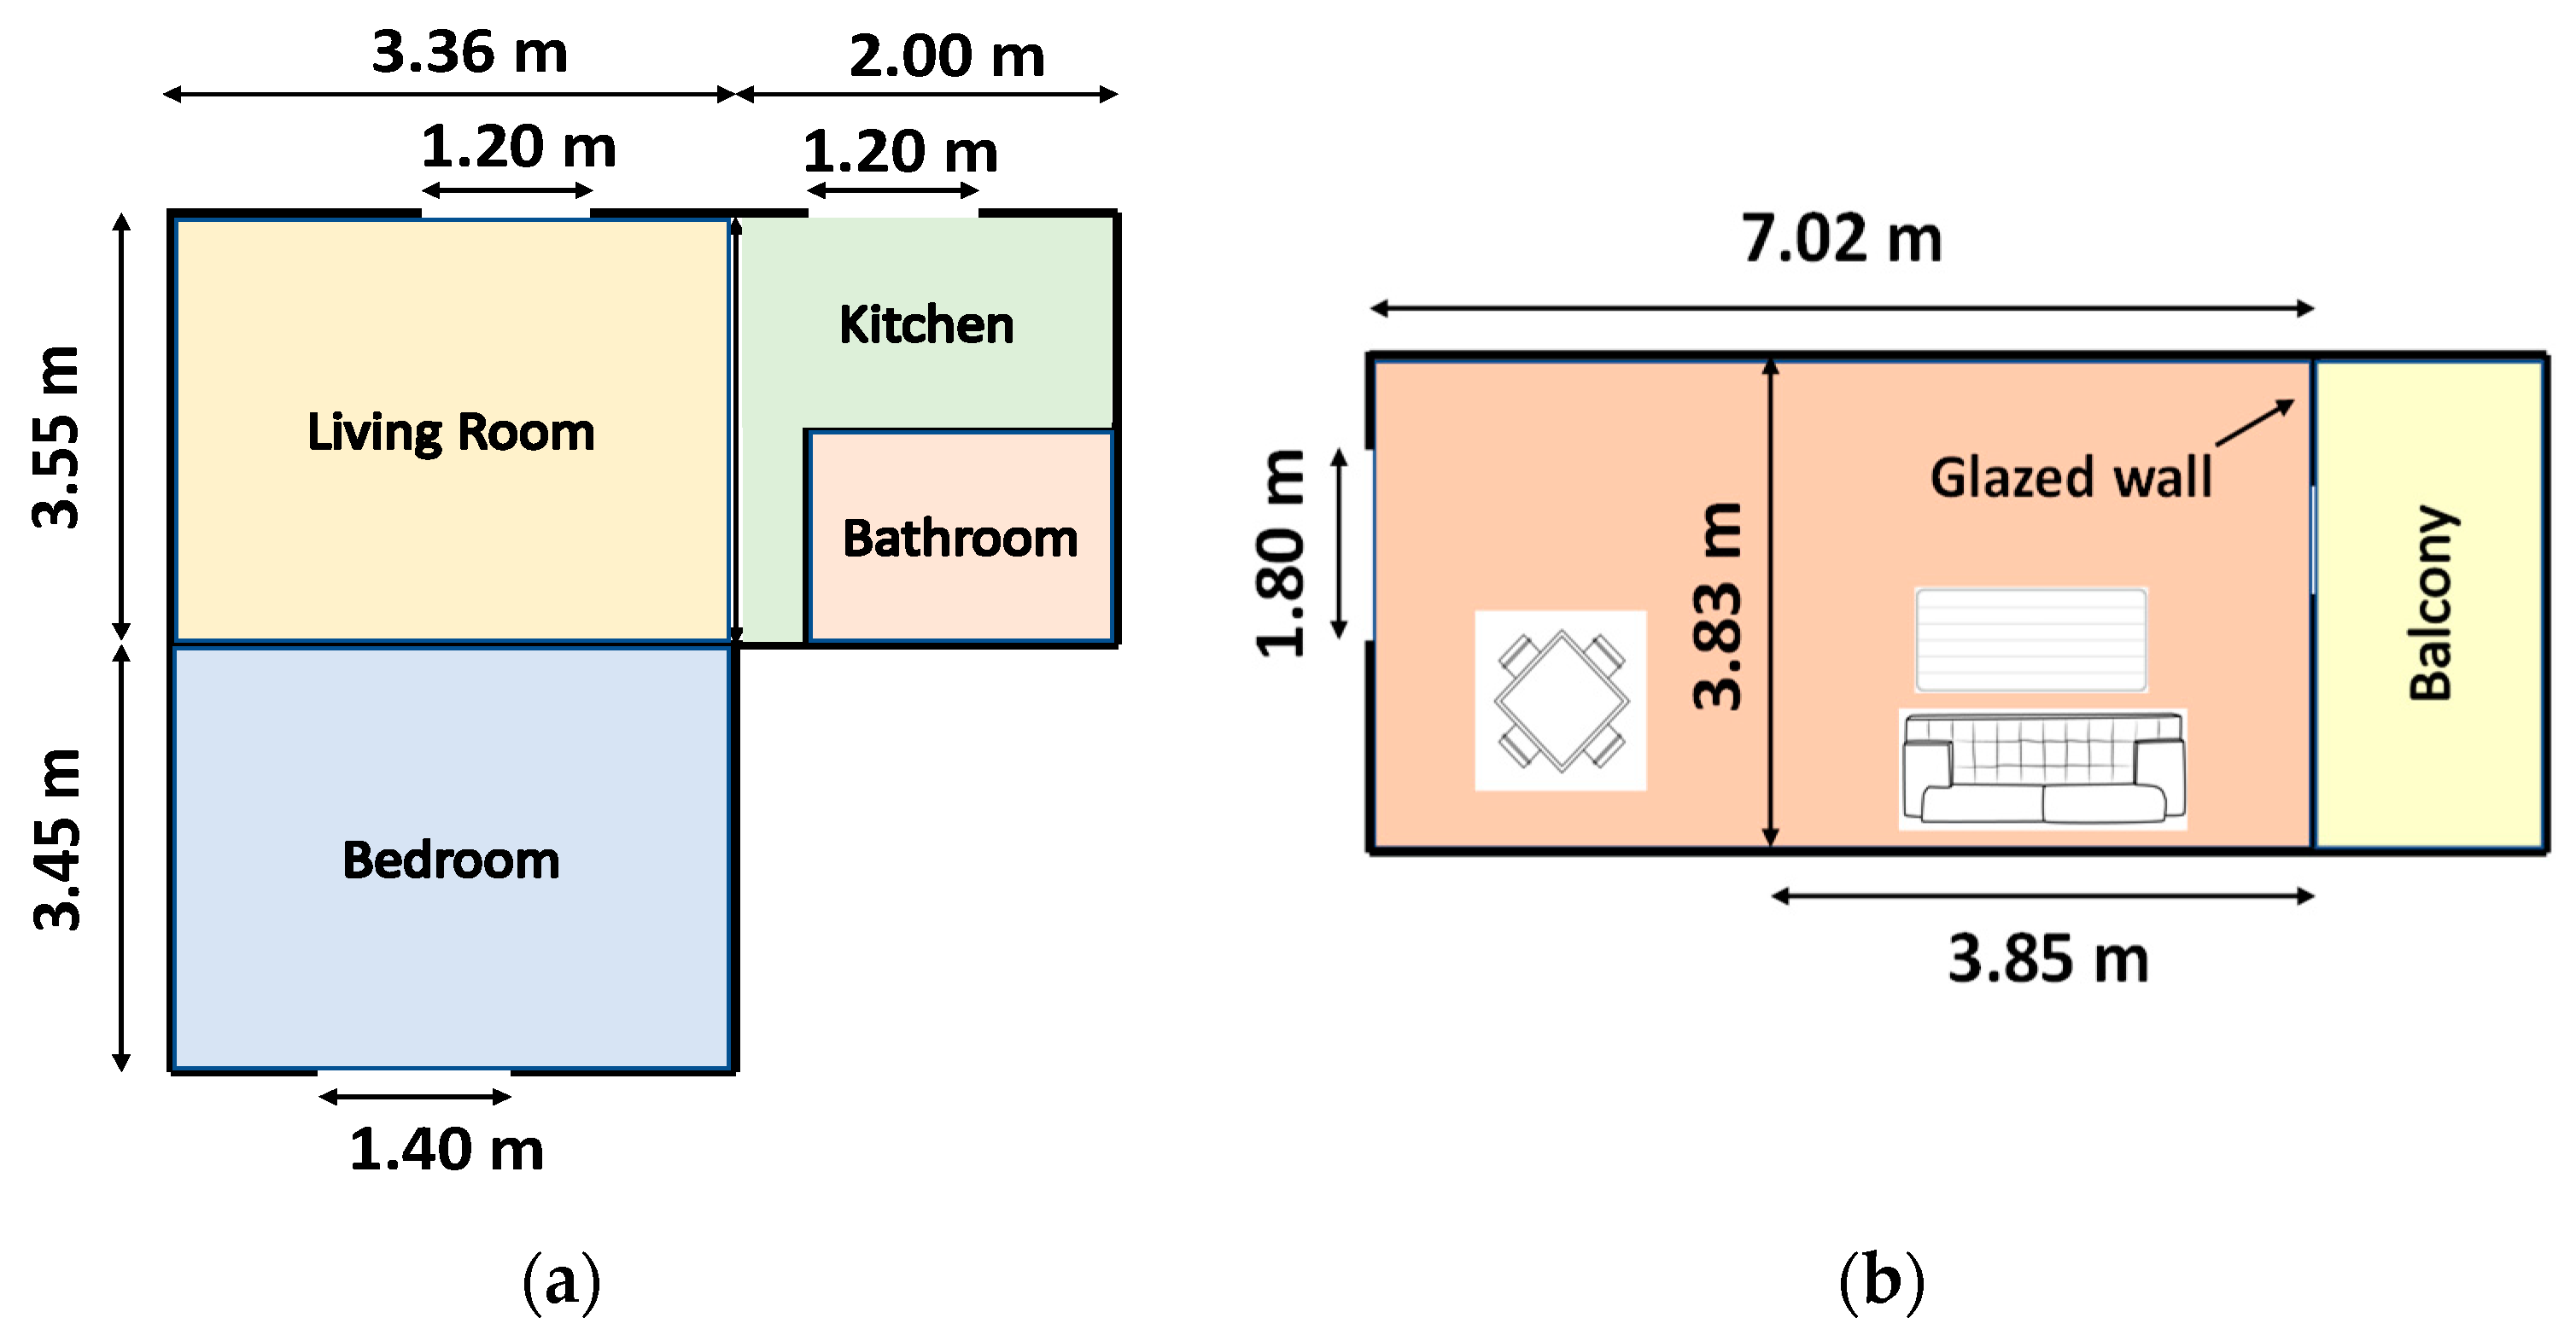
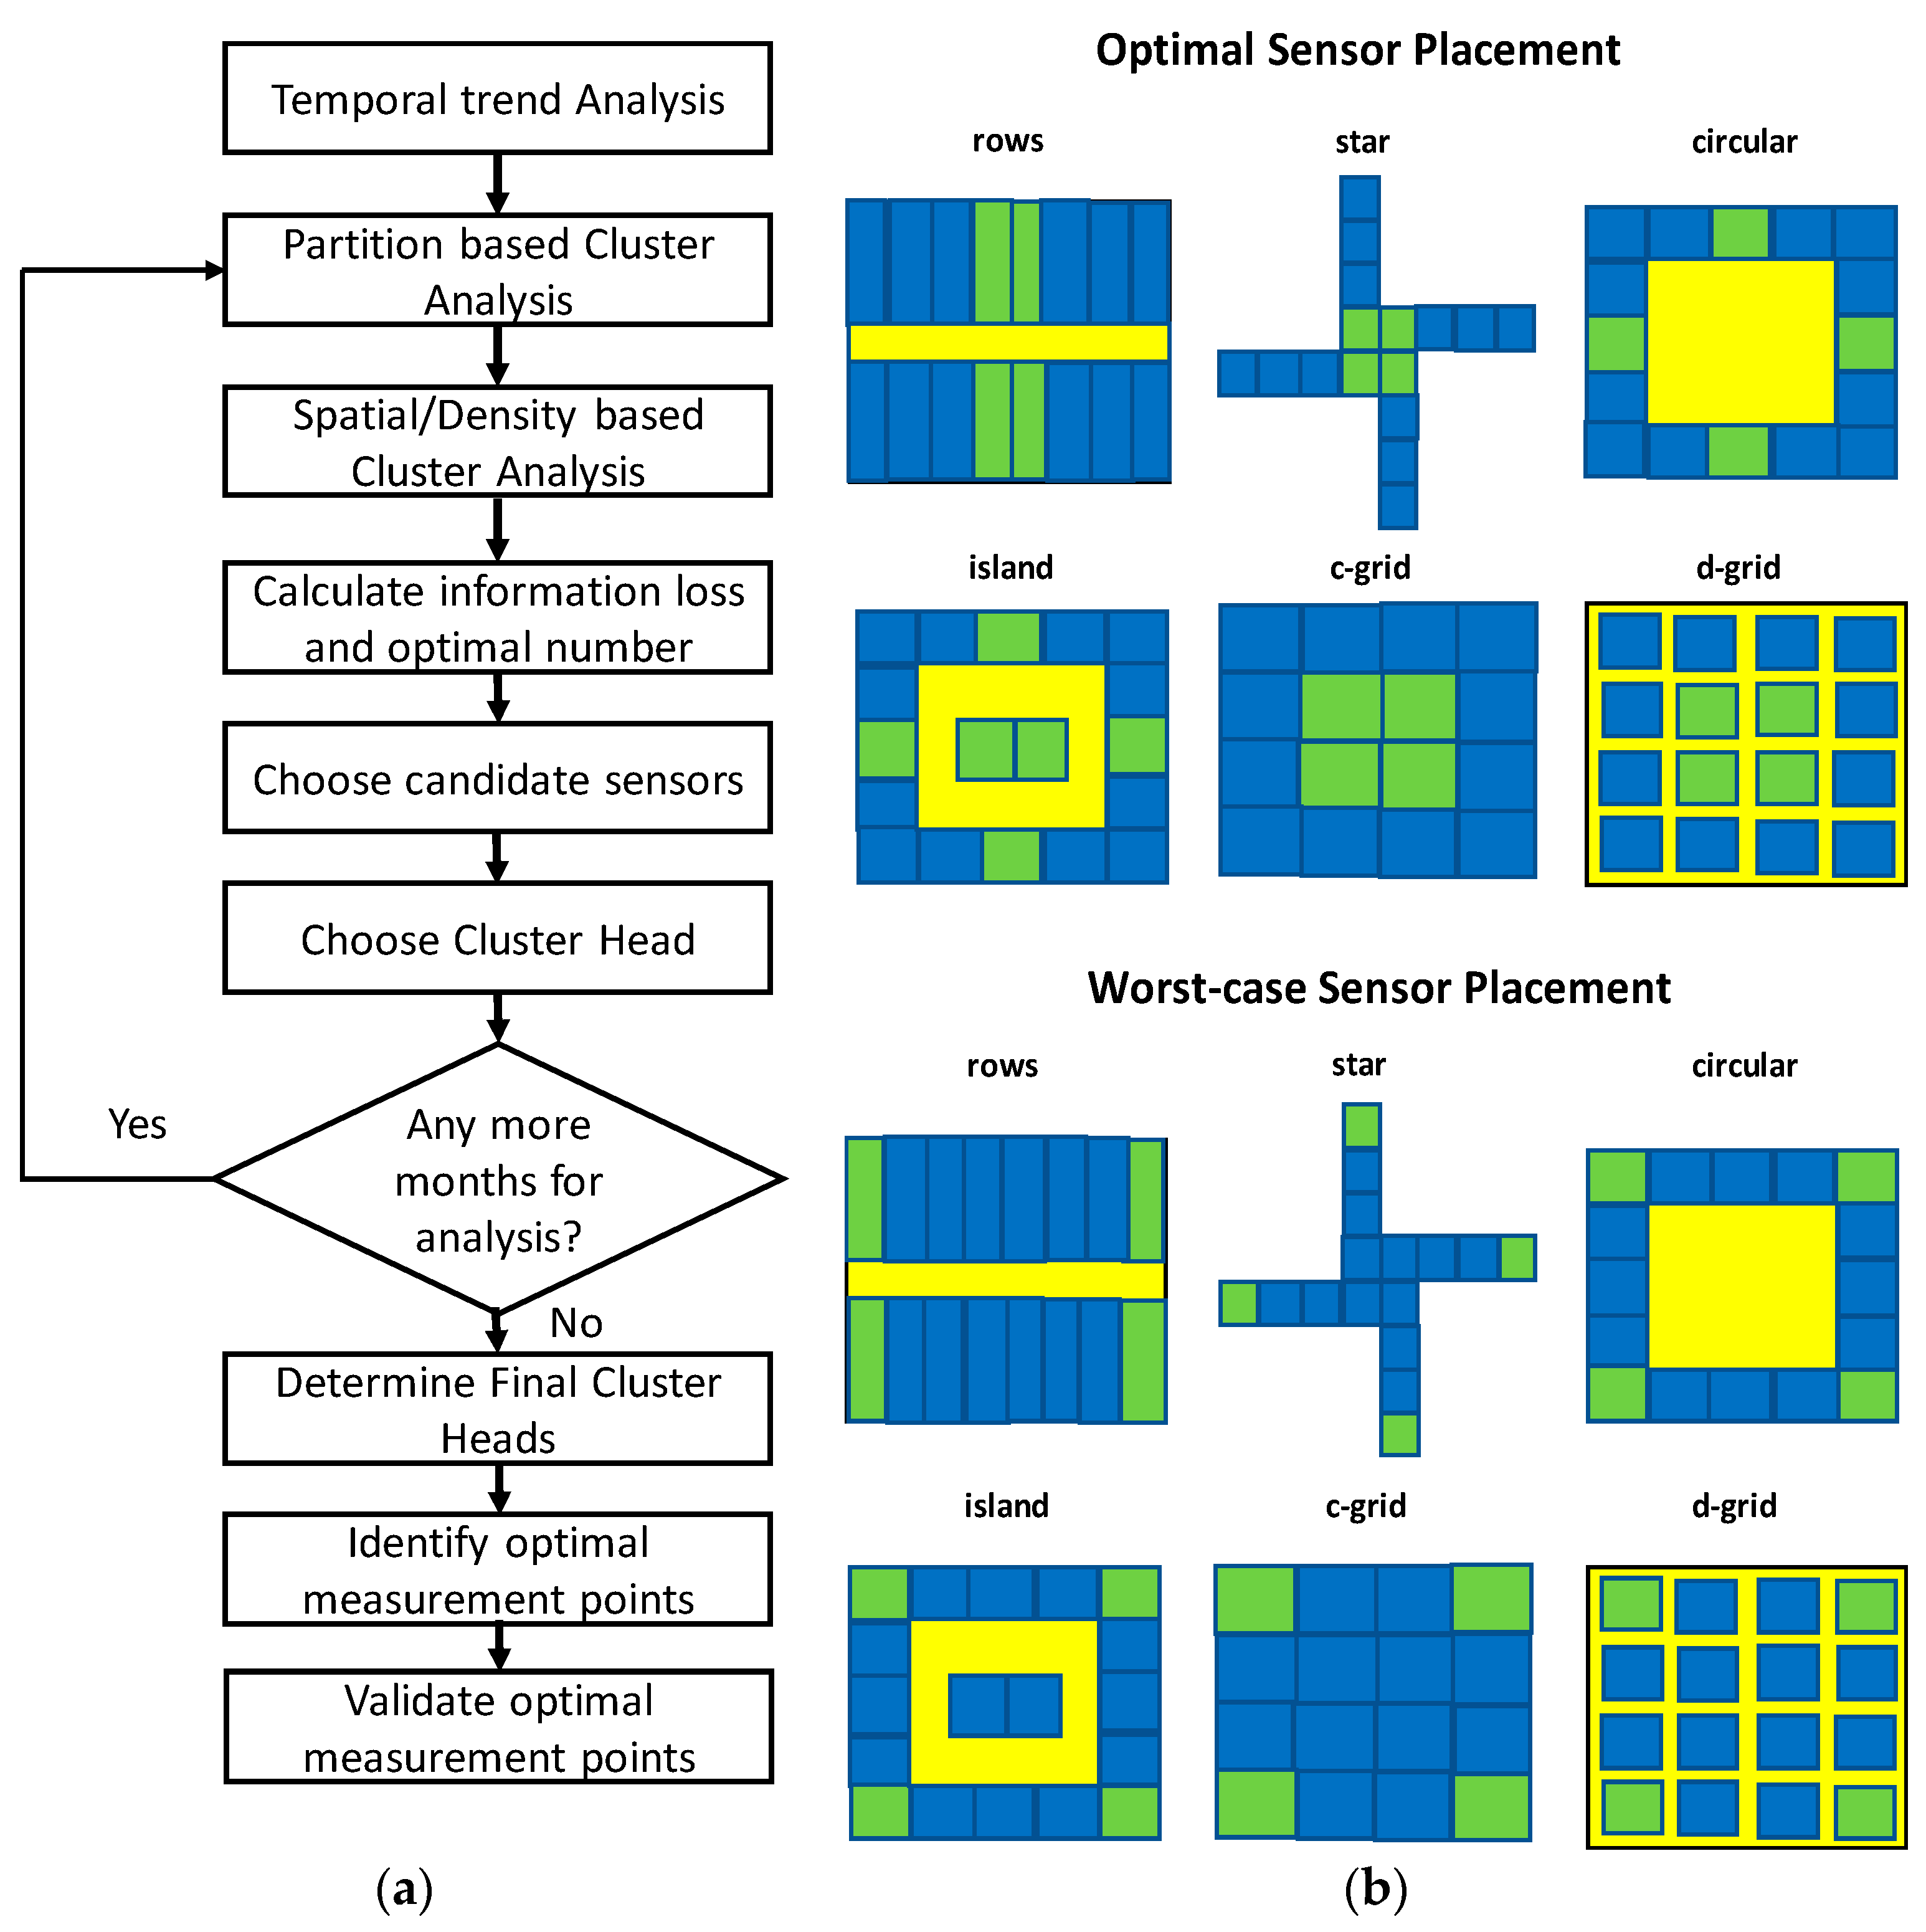
5.2. Optimal Placement of Sensors in Buildings
- (i)
- Rows—two rows of rooms in a corridor.
- (ii)
- Star—rooms meet at a central point.
- (iii)
- Circular—all rooms have two neighbours and surround a central space.
- (iv)
- Island—Similar to circle but with rooms in the central space.
- (v)
- Compact-Grid—All rooms are connected with no corridors.
- (vi)
- Dispersed-Grid—All rooms are disconnected by a corridor.
5.3. Routing Protocols for Energy Efficiency Enhancement
- (i)
- Hierarchical protocols—in these protocols the sensor network is broken down into clusters with multiple gateways where each sensor node within a cluster communicates with other nodes in a multi-hop manner, leading to more efficient energy consumption. Some of the prominent Hierarchical protocols include LEACH (low-energy adaptive clustering hierarchy) [128], PEGASIS (power efficient gathering in sensor information systems) [129], TEEN (threshold sensitive energy efficient network) [130] and APTEEN (adaptive threshold sensitive energy efficient network) [131].
- (ii)
- Data-Centric protocols—in these protocols, a set of sensor nodes can be selected based on a query-based model and data can also be acquired whilst being transmitted to the base station (i.e., the sink node where data is collected and processed). Some of the prominent Data-Centric protocols include SPIN (sensor protocols for information via negotiation) [132] and Directed Diffusion [133].
- (iii)
- Location-based (Geographical) protocols—in these protocols, the location information of sensor nodes is required in order to calculate the distance between two particular nodes and draw the most energy-efficient path between them. Some of the prominent Location-based protocols include GAF (geographic adaptive fidelity) [134], GEAR (geographic and energy-aware routing) [135] and LEAR (location-based energy-aware routing) [136].
5.4. Data Analysis and Network Security
5.5. The Future of Building IOT (Internet of Things) Technologies
5.6. The Future of Building Energy Harvesting
6. Summary and Conclusions
Author Contributions
Funding
Conflicts of Interest
References
- BEIS. Energy Consumption in the UK; Tech. Rep.; Department for Business, Energy and Industrial Strategy: London, UK, 2016. Available online: https://www.gov.uk/government/organisations/department-for-business-energy-and-industrial-strategy (accessed on 30 May 2019).
- DTI. The Energy Challenge Review; Tech Rep.; Department of Trade and Industry: London, UK, 2006. Available online: https://www.gov.uk/government/publications/the-energy-challenge-energy-review-a-report (accessed on 20 November 2018).
- Conti, J.; Holtberg, P.; Diefenderfer, J.; LaRose, A.; Turnure, J.T.; Westfall, L. International Energy Outlook 2016 with Projections to 2040; (No. DOE/EIA-0484 (2016)); Office of Energy Analysis, USDOE Energy Information Administration (EIA): Washington, DC, USA, 2016.
- Ahmad, M.W.; Mourshed, M.; Mundow, D.; Sisinni, M.; Rezgui, Y. Building energy metering and environmental monitoring—A state-of-the-art review and directions for future research. Energy Build. 2016, 120, 85–102. [Google Scholar] [CrossRef]
- Dean, B.; Dulac, J.; Petrichenko, K.; Graham, P. Towards Zero-Emission Efficient and Resilient Buildings; Global Status Report; Global Alliance for Buildings and Construction (GABC), 2016; Available online: https://orbit.dtu.dk/files/127199228/GABC_Global_Status_Report_V09_november.pdf (accessed on 21 August 2019).
- Grözinger, J.; Boermans, T.; Wehringer, A.J.F.; Seehusen, J. Overview of Member States Information on NZEBs: Background Paper—Final Report; ECOFYS GmbH: Cologne, Germany, 2014. [Google Scholar]
- Department of Energy and Climate Change (DECC). Available online: https://www.gov.uk/ 2050-pathways-analysis (accessed on 19 November 2018).
- The World Bank. World Development Indicators 1960–2013; The World Bank: Washington, DC, USA, 2014. [Google Scholar]
- GAIA—“Green Awareness in Action”. Available online: gaia-project.eu (accessed on 15 November 2018).
- OrbEEt. Available online: https://orbeet.eu/ (accessed on 15 November 2018).
- TRIBE: “Training Behaviours towards Energy Efficiency: Play It”. Available online: https://tribe-h2020.eu/ (accessed on 15 November 2018).
- SPECIFIC—“Buildings as Power Stations”. Available online: https://specific.eu.com/ (accessed on 15 November 2018).
- Chung, M.H.; Rhee, E.K. Potential opportunities for energy conservation in existing buildings on university campus: A field survey in Korea. Energy Build. 2014, 78, 176–182. [Google Scholar] [CrossRef]
- Council, G.B. Carbon Reductions in Existing Non-Domestic Buildings; UK Green Building Council: London, UK, 2011. [Google Scholar]
- Menezes, A.C.; Cripps, A.; Bouchlaghem, D.; Buswell, R. Analysis of electricity consumption for lighting and small power in office buildings. In CIBSE Technical Symposium; De Montfort University: Leicester, UK, 2011. [Google Scholar] [Green Version]
- Standeven, M.; Cohen, R.; Bordass, B.; Leaman, A. PROBE 14: Elizabeth fry building. Build. Serv. J. 1998, 20, 37–42. [Google Scholar]
- Rajaram, S. Global Markets and Technologies for Sensors; IAS006G; BCC Research: Wellesley, MA, USA, February 2016. [Google Scholar]
- Johnson, R.C. Roadmap to Trillion Sensors Forks—EE Times Dec. 2015; Trillion Sensors Summit: Munich, Germany, 15–17 September 2014. [Google Scholar]
- Mohassel, R.R.; Fung, A.; Mohammadi, F.; Raahemifar, K. A survey on advanced metering infrastructure. Int. J. Electr. Power Energy Syst. 2014, 63, 473–484. [Google Scholar] [CrossRef]
- Behrooz, F.; Mariun, N.; Marhaban, M.; Mohd Radzi, M.; Ramli, A. Review of control techniques for HVAC systems—Nonlinearity approaches based on Fuzzy cognitive maps. Energies 2018, 11, 495. [Google Scholar] [CrossRef]
- Darby, S. Energy feedback in buildings: Improving the infrastructure for demand reduction. Build. Res. Inf. 2008, 36, 499–508. [Google Scholar] [CrossRef]
- Bichiou, Y.; Krarti, M. Optimization of envelope and HVAC systems selection for residential buildings. Energy Build. 2011, 43, 3373–3382. [Google Scholar] [CrossRef]
- Childs, P.R.N.; Greenwood, J.R.; Long, C.A. Review of temperature measurement. Rev. Sci. Instrum. 2000, 71, 2959–2978. [Google Scholar] [CrossRef] [Green Version]
- Cheng, C.C.; Lee, D. Enabling Smart Air Conditioning by Sensor Development: A Review. Sensors 2016, 16, 2028. [Google Scholar] [CrossRef]
- Doukas, H.; Patlitzianas, K.D.; Iatropoulos, K.; Psarras, J. Intelligent building energy management system using rule sets. Build. Environ. 2007, 42, 3562–3569. [Google Scholar] [CrossRef]
- Kolokotsa, D.; Pouliezos, A.; Stavrakakis, G.; Lazos, C. Predictive control techniques for energy and indoor environmental quality management in buildings. Build. Environ. 2009, 44, 1850–1863. [Google Scholar] [CrossRef]
- Kumar, P.; Martani, C.; Morawska, L.; Norford, L.; Choudhary, R.; Bell, M.; Leach, M. Indoor air quality and energy management through real-time sensing in commercial buildings. Energy Build. 2016, 111, 145–153. [Google Scholar] [CrossRef]
- OMEGA Temperature Sensors Website. Available online: https://www.omega.co.uk/subsection/temperature-sensors-instruments.html (accessed on 5 November 2018).
- Texas Instruments Website. Available online: https://www.e2e.ti.com (accessed on 5 November 2018).
- National Instruments Website. Available online: https://www.ni.com (accessed on 6 November 2018).
- Leephakpreeda, T.; Thitipatanapong, R.; Grittiyachot, T.; Yungchareon, V. Occupancy-based control of indoor air ventilation: A theoretical and experimental study. Sci. Asia 2001, 27, 279–284. [Google Scholar] [CrossRef]
- Prill, R. Why Measure Carbon Dioxide Inside Buildings; Washington State University Extension Energy Program WSUEEP07: Washington, DC, USA, 2000; p. 3. [Google Scholar]
- Mysen, M.; Rydock, J.P.; Tjelflaat, P.O. Demand controlled ventilation for office cubicles—Can it be profitable? Energy Build. 2003, 35, 657–662. [Google Scholar] [CrossRef]
- Dougan, D.S.; Damiano, L. CO2-based demand control ventilation: Do risks outweigh potential rewards? ASHRAE J. 2004, 46, 47. [Google Scholar]
- Mumma, S.A. Transient occupancy ventilation by monitoring CO2. ASHRAE IAQ Appl. 2004, 5, 21–23. [Google Scholar]
- Nassif, N. A robust CO2-based demand-controlled ventilation control strategy for multi-zone HVAC systems. Energy Build. 2012, 45, 72–81. [Google Scholar] [CrossRef]
- Yasuda, T.; Yonemura, S.; Tani, A. Comparison of the characteristics of small commercial NDIR CO2 sensor models and development of a portable CO2 measurement device. Sensors 2012, 12, 3641–3655. [Google Scholar] [CrossRef]
- Senseair Website. Available online: https://www.senseair.com (accessed on 9 November 2018).
- Vaisala Website. Available online: https://www.vaisala.com (accessed on 9 November 2018).
- Amphenol Website. Available online: https://www.amphenol-sensors.com (accessed on 9 November 2018).
- Trotec Website. Available online: https//www.trotec.com (accessed on 9 November 2018).
- Lin, C.; Xian, X.; Qin, X.; Wang, D.; Tsow, F.; Forzani, E.; Tao, N. High Performance Colorimetric Carbon Monoxide Sensor for Continuous Personal Exposure Monitoring. ACS Sens. 2018, 3, 327–333. [Google Scholar] [CrossRef]
- Spinelle, L.; Gerboles, M.; Kok, G.; Persijn, S.; Sauerwald, T. Review of portable and low-cost sensors for the ambient air monitoring of benzene and other volatile organic compounds. Sensors 2017, 17, 1520. [Google Scholar] [CrossRef]
- Patil, S.J.; Patil, A.V.; Dighavkar, C.G.; Thakare, K.S.; Borase, R.Y.; Nandre, S.J.; Deshpande, N.G.; Ahire, R.R. Semiconductor metal oxide compounds based gas sensors: A literature review. Front. Mater. Sci. 2015, 9, 14–37. [Google Scholar] [CrossRef]
- Szulczyński, B.; Gębicki, J. Currently commercially available chemical sensors employed for detection of volatile organic compounds in outdoor and indoor air. Environments 2017, 4, 21. [Google Scholar] [CrossRef]
- Mullassery, D.J. Sensors and Analytics for Smart Buildings; University of British Columbia: Vancouver, BC, Canada, 2015. [Google Scholar]
- Fraden, J. Handbook of Modern Sensors: Physics, Designs, and Applications; Springer Science & Business Media: Berlin, Germany, 2004. [Google Scholar]
- Farahani, H.; Wagiran, R.; Hamidon, M.N. Humidity sensors principle, mechanism, and fabrication technologies: A comprehensive review. Sensors 2014, 14, 7881–7939. [Google Scholar]
- Roveti, D.K. Choosing a Humidity Sensor: A Review of Three Technologies. Available online: https://www.fierceelectronics.com/components/choosing-a-humidity-sensor-a-review-three-technologies (accessed on 21 August 2019).
- OMEGA Humidity Sensors Website. Available online: https://www.omega.com/en-us/sensors-and-sensing-equipment/c/humidity (accessed on 12 November 2018).
- TE Connectivity Website. Available online: https://www.te.com (accessed on 12 November 2018).
- Honeywell Sensors Website. Available online: https://sensing.honeywell.com (accessed on 12 November 2018).
- Garg, V.; Bansal, N.K. Smart occupancy sensors to reduce energy consumption. Energy Build. 2000, 32, 81–87. [Google Scholar] [CrossRef]
- Yavari, E.; Song, C.; Lubecke, V.; Boric-Lubecke, O. Is there anybody in there? Intelligent radar occupancy sensors. IEEE Microw. Mag. 2014, 15, 57–64. [Google Scholar] [CrossRef]
- Oldewurtel, F.; Sturzenegger, D.; Morari, M. Importance of occupancy information for building climate control. Appl. Energy 2013, 101, 521–532. [Google Scholar] [CrossRef]
- Yun, J.; Song, M.H. Detecting direction of movement using pyroelectric infrared sensors. IEEE Sens. J. 2014, 14, 1482–1489. [Google Scholar] [CrossRef]
- Labeodan, T.; Zeiler, W.; Boxem, G.; Zhao, Y. Occupancy measurement in commercial office buildings for demand-driven control applications—A survey and detection system evaluation. Energy Build. 2015, 93, 303–314. [Google Scholar] [CrossRef]
- Schneider Electric—Sensors Website. Available online: https://www.schneider-electric.com (accessed on 18 November 2018).
- Hubbell Sensors Website. Available online: https://www.hubbell.com (accessed on 18 November 2018).
- Ul Haq, M.A.; Hassan, M.Y.; Abdullah, H.; Rahman, H.A.; Abdullah, M.P.; Hussin, F.; Said, D.M. A review on lighting control technologies in commercial buildings, their performance and affecting factors. Renew. Sustain. Energy Rev. 2014, 33, 268–279. [Google Scholar] [CrossRef]
- Guo, X.; Tiller, D.K.; Henze, G.P.; Waters, C.E. The performance of occupancy-based lighting control systems: A review. Lighting Res. Technol. 2010, 42, 415–431. [Google Scholar] [CrossRef]
- Candanedo, L.M.; Feldheim, V. Accurate occupancy detection of an office room from light, temperature, humidity and CO2 measurements using statistical learning models. Energy Build. 2016, 112, 28–39. [Google Scholar] [CrossRef]
- Benezeth, Y.; Laurent, H.; Emile, B.; Rosenberger, C. Towards a sensor for detecting human presence and characterizing activity. Energy Build. 2011, 43, 305–314. [Google Scholar] [CrossRef]
- Huang, Q.; Ge, Z.; Lu, C. Occupancy estimation in smart buildings using audio-processing techniques. arXiv 2016, arXiv:1602.08507. [Google Scholar]
- Pathak, P.H.; Feng, X.; Hu, P.; Mohapatra, P. Visible light communication, networking, and sensing: A survey, potential and challenges. IEEE Commun. Surv. Tutor. 2015, 17, 2047–2077. [Google Scholar] [CrossRef]
- Vishay Sensors Website. Available online: https://www.vishay.com (accessed on 20 November 2018).
- Panasonic Sensors Website. Available online: https://www.panasonic.com (accessed on 20 November 2018).
- Philips Sensors Website. Available online: https://www.philips.com (accessed on 20 November 2018).
- Mayer, H.; Höppe, P. Thermal comfort of man in different urban environments. Theor. Appl. Climatol. 1987, 38, 43–49. [Google Scholar] [CrossRef]
- De Dear, R.J.; Brager, G.S. Thermal comfort in naturally ventilated buildings: Revisions to ASHRAE Standard 55. Energy Build. 2002, 34, 549–561. [Google Scholar] [CrossRef]
- Saddoughi, S.G.; Veeravalli, S.V. Hot-wire anemometry behaviour at very high frequencies. Meas. Sci. Technol. 1996, 7, 1297. [Google Scholar] [CrossRef]
- Adamec, R.J.; Thiel, D.V.; Tanner, P. MEMS wind direction detection: From design to operation. In Proceedings of the IEEE Sensors 2003, Piscataway, NJ, USA, 22–24 October 2003; Volume 1, pp. 340–343. [Google Scholar]
- Caracoglia, L.; Jones, N.P. Analysis of full-scale wind and pressure measurements on a low-rise building. J. Wind Eng. Ind. Aerodyn. 2009, 97, 157–173. [Google Scholar] [CrossRef]
- Siemens Sensors Website. Available online: https://www.siemens.com (accessed on 25 November 2018).
- Testo Website. Available online: https://www.testo.com (accessed on 25 November 2018).
- Seton Website. Available online: https://www.seton.com (accessed on 25 November 2018).
- Labeodan, T.; De Bakker, C.; Rosemann, A.; Zeiler, W. On the application of wireless sensors and actuators network in existing buildings for occupancy detection and occupancy-driven lighting control. Energy Build. 2016, 127, 75–83. [Google Scholar] [CrossRef] [Green Version]
- Rodrigues, F.; Cardeira, C.; Calado, J.M.F. The Impact of Wireless Sensors in Buildings Automation; Ibersensor: Lisbon, Portugal, 2010. [Google Scholar]
- De Farias, C.; Soares, H.; Pirmez, L.; Delicato, F.; Santos, I.; Carmo, L.F.; de Souza, J.; Zomaya, A.; Dohler, M. A control and decision system for smart buildings using wireless sensor and actuator networks. Trans. Emerg. Telecommun. Technol. 2014, 25, 120–135. [Google Scholar] [CrossRef]
- Kazmi, A.H.; O’grady, M.J.; Delaney, D.T.; Ruzzelli, A.G.; O’hare, G.M. A review of wireless-sensor-network-enabled building energy management systems. ACM Trans. Sens. Netw. 2014, 10, 66. [Google Scholar] [CrossRef]
- Grimard, T.; Kieran, L. Wireless Options Becoming More Prevalent with BAS. Available online: https://www.facilitiesnet.com/buildingautomation/article/Wireless-Options-Becoming-More-Prevalent-with-BAS--16393 (accessed on 21 August 2019).
- Jansen, D.; Buttner, H. Real-time Ethernet: The EtherCAT solution. Comput. Control. Eng. 2004, 15, 16–21. [Google Scholar] [CrossRef]
- Schemm, E. SERCOS to link with ethernet for its third generation. Comput. Control. Eng. 2004, 15, 30–33. [Google Scholar] [CrossRef]
- Kjellsson, J.; Vallestad, A.E.; Steigmann, R.; Dzung, D. Integration of a wireless I/O interface for PROFIBUS and PROFINET for factory automation. IEEE Trans. Ind. Electron. 2009, 56, 4279–4287. [Google Scholar] [CrossRef]
- Pedreiras, P.; Gai, P.; Almeida, L.; Buttazzo, G.C. FTT-Ethernet: A flexible real-time communication protocol that supports dynamic QoS management on Ethernet-based systems. IEEE Trans. Ind. Inform. 2005, 1, 162–172. [Google Scholar] [CrossRef]
- Corrêa, T.P.; Almeida, L. Ultra short cycle protocol for partly decentralized control applications. In Proceedings of the 2017 22nd IEEE International Conference on Emerging Technologies and Factory Automation (ETFA), Limassol, Cyprus, 12–15 September 2017; IEEE: Piscataway, NJ, USA, 2017; pp. 1–5. [Google Scholar]
- Galli, S.; Scaglione, A.; Wang, Z. For the grid and through the grid: The role of power line communications in the smart grid. Proc. IEEE 2011, 99, 998–1027. [Google Scholar] [CrossRef]
- Kuzlu, M.; Pipattanasomporn, M.; Rahman, S. Review of communication technologies for smart homes/building applications. In Proceedings of the 2015 IEEE Innovative Smart Grid Technologies-Asia (ISGT ASIA), Bangkok, Thailand, 4–6 November 2015; IEEE: Piscataway, NJ, USA, 2015; pp. 1–6. [Google Scholar]
- Sharma, K.; Saini, L.M. Power-line communications for smart grid: Progress, challenges, opportunities and status. Renew. Sustain. Energy Rev. 2017, 67, 704–751. [Google Scholar] [CrossRef]
- Texas Instruments Website. RS-232, RS-422, RS-485 Serial Communication General Concepts. Available online: https://www.ni.com/white-paper/11390 (accessed on 30 November 2018).
- Powell, J.; Eng, P. Profibus and Modbus: A Comparison. Available online: https://www.scribd.com/document/340198066/Siemens-Profibus-and-Modbus-Comparison (accessed on 21 August 2019).
- Centenaro, M.; Vangelista, L.; Zanella, A.; Zorzi, M. Long-range communications in unlicensed bands: The rising stars in the IoT and smart city scenarios. IEEE Wirel. Commun. 2016, 23, 60–67. [Google Scholar] [CrossRef]
- Mahmood, A.; Javaid, N.; Razzaq, S. A review of wireless communications for smart grid. Renew. Sustain. Energy Rev. 2015, 41, 248–260. [Google Scholar] [CrossRef]
- Han, D.M.; Lim, J.H. Design and implementation of smart home energy management systems based on zigbee. IEEE Trans. Consum. Electron. 2010, 56, 1417–1425. [Google Scholar] [CrossRef]
- Alliance, Z.; Alliance, H. Smart Energy Profile 2 Application Protocol Standard. document 13–0200-00, Zigbee Public Document, 2013. Available online: https://zigbee.org/download/standard-smart-energy-profile-2-0/ (accessed on 3 December 2018).
- Bisdikian, C. An overview of the Bluetooth wireless technology. IEEE Commun. Mag. 2001, 39, 86–94. [Google Scholar] [CrossRef] [Green Version]
- Jain, R. Bluetooth and Bluetooth Smart; Washington University in Saint Louis: Louis, MO, USA, 2014. [Google Scholar]
- Gomez, C.; Oller, J.; Paradells, J. Overview and Evaluation of Bluetooth Low Energy: An Emerging Low-Power Wireless Technology. Sensors 2012, 12, 11734–11753. [Google Scholar] [CrossRef]
- Riggio, R.; Rasheed, T.; Testi, S.; Granelli, F.; Chlamtac, I. Interference and traffic aware channel assignment in WiFi-based wireless mesh networks. Ad Hoc Netw. 2011, 9, 864–875. [Google Scholar] [CrossRef]
- Camps-Mur, D.; Garcia-Saavedra, A.; Serrano, P. Device-to-device communications with Wi-Fi Direct: Overview and experimentation. IEEE Wirel. Commun. 2013, 20, 96–104. [Google Scholar] [CrossRef]
- Ploennigs, J.; Ryssel, U.; Kabitzsch, K. Performance analysis of the EnOcean wireless sensor network protocol. In Proceedings of the 2010 IEEE Conference on Emerging Technologies and Factory Automation (ETFA), Bilbao, Spain, 13–16 September 2010; IEEE: Piscataway, NJ, USA, 2010; pp. 1–9. [Google Scholar]
- Newman, H.M. BACnet: The Global Standard for Building Automation and Control Networks; Momentum Press: New York, NY, USA, 2013. [Google Scholar]
- Shelby, Z.; Bormann, C. 6LoWPAN: The Wireless Embedded Internet; John Wiley & Sons: Hoboken, NJ, USA, 2011; Volume 43. [Google Scholar]
- Yassein, M.B.; Mardini, W.; Khalil, A. Smart homes automation using Z-wave protocol. In Proceedings of the International Conference on Engineering & MIS (ICEMIS), Agadir, Morocco, 22–24 September 2016; IEEE: Piscataway, NJ, USA, 2016; pp. 1–6. [Google Scholar]
- Adelantado, F.; Vilajosana, X.; Tuset-Peiro, P.; Martinez, B.; Melia-Segui, J.; Watteyne, T. Understanding the limits of LoRaWAN. IEEE Commun. Mag. 2017, 55, 34–40. [Google Scholar] [CrossRef]
- Cho, J.; Jeong, S.; Kim, Y. Commercial and research battery technologies for electrical energy storage applications. Prog. Energy Combust. Sci. 2015, 48, 84–101. [Google Scholar] [CrossRef]
- Eddahech, A.; Briat, O.; Vinassa, J.M. Performance comparison of four lithium–ion battery technologies under calendar aging. Energy 2015, 84, 542–550. [Google Scholar] [CrossRef]
- Sabihuddin, S.; Kiprakis, A.E.; Mueller, M. A numerical and graphical review of energy storage technologies. Energies 2014, 8, 172–216. [Google Scholar] [CrossRef]
- Malhotra, A.; Battke, B.; Beuse, M.; Stephan, A.; Schmidt, T. Use cases for stationary battery technologies: A review of the literature and existing projects. Renew. Sustain. Energy Rev. 2016, 56, 705–721. [Google Scholar] [CrossRef]
- Battery University Website. Available online: https://www.batteryuniversity.com (accessed on 4 December 2018).
- World Economic Forum, 2012. The Top 10 Emerging Technologies for 2012. Available online: https://www.weforum.org/agenda/2012/02/the-2012-top-10-emerging-technologies/ (accessed on 6 December 2018).
- Ku, M.L.; Li, W.; Chen, Y.; Liu, K.R. Advances in Energy Harvesting Communications: Past, Present, and Future Challenges. IEEE Commun. Surv. Tutor. 2016, 18, 1384–1412. [Google Scholar] [CrossRef]
- Mitcheson, P.D.; Yeatman, E.M.; Rao, G.K.; Holmes, A.S.; Green, T.C. Energy harvesting from human and machine motion for wireless electronic devices. Proc. IEEE 2008, 96, 1457–1486. [Google Scholar] [CrossRef]
- Wan, Z.G.; Tan, Y.K.; Yuen, C. Review on energy harvesting and energy management for sustainable wireless sensor networks. In Proceedings of the 2011 IEEE 13th International Conference on Communication Technology (ICCT), Jinan, China, 25–28 September 2011; IEEE: Piscataway, NJ, USA, 2011; pp. 362–367. [Google Scholar]
- Matiko, J.W.; Grabham, N.J.; Beeby, S.P.; Tudor, M.J. Review of the application of energy harvesting in buildings. Meas. Sci. Technol. 2014, 25, 012002. [Google Scholar] [CrossRef]
- Zhou, G.; Huang, L.; Li, W.; Zhu, Z. Harvesting ambient environmental energy for wireless sensor networks: A survey. J. Sens. 2014, 2014, 815467. [Google Scholar] [CrossRef]
- Lee, H.K.H.; Wu, J.; Barbé, J.; Jain, S.M.; Wood, S.; Speller, E.M.; Li, Z.; Castro, F.A.; Durrant, J.R.; Tsoi, W.C. Organic photovoltaic cells–promising indoor light harvesters for self-sustainable electronics. J. Mater. Chem. A 2018, 6, 5618–5626. [Google Scholar] [CrossRef]
- Eliades, D.G.; Michaelides, M.P.; Panayiotou, C.G.; Polycarpou, M.M. Security-oriented sensor placement in intelligent buildings. Build. Environ. 2013, 63, 114–121. [Google Scholar] [CrossRef] [Green Version]
- Yoganathan, D.; Kondepudi, S.; Kalluri, B.; Manthapuri, S. Optimal sensor placement strategy for office buildings using clustering algorithms. Energy Build. 2018, 158, 1206–1225. [Google Scholar] [CrossRef]
- Udwadia, F.E. Optimal sensor location for geotechnical and structural identification. In Proceedings of the 8th World Conference on Earthquake Engineering, San Francisco, CA, USA, 21–28 July 1984; pp. 315–322. [Google Scholar]
- Kammer, D.C. Sensor placement for on-orbit modal identification and correlation of large space structures. J. Guid. Control. Dyn. 1991, 14, 251–259. [Google Scholar] [CrossRef]
- Papadimitriou, C.; Beck, J.L.; Au, S.K. Entropy-based optimal sensor location for structural model updating. J. Vib. Control. 2000, 6, 781–800. [Google Scholar] [CrossRef]
- Seabrook, T. Optimal Placement Strategies of Minimum Effective Sensors for Application in Smart Buildings. 2016. Available online: https://www.semanticscholar.org/paper/Optimal-Placement-Strategies-of-Minimum-Effective-Seabrook/ (accessed on 10 December 2018).
- Akkaya, K.; Younis, M. A survey on routing protocols for wireless sensor networks. Ad Hoc Netw. 2005, 3, 325–349. [Google Scholar] [CrossRef] [Green Version]
- Warrier, M.M.; Kumar, A. An energy efficient approach for routing in wireless sensor networks. Procedia Technol. 2016, 25, 520–527. [Google Scholar] [CrossRef]
- Guleria, K.; Verma, A.K. Comprehensive review for energy efficient hierarchical routing protocols on wireless sensor networks. Wirel. Netw. 2019, 25, 1159–1183. [Google Scholar] [CrossRef]
- Bhattacharyya, D.; Kim, T.H.; Pal, S. A comparative study of wireless sensor networks and their routing protocols. Sensors 2010, 10, 10506–10523. [Google Scholar] [CrossRef] [PubMed]
- Heinzelman, W.B.; Chandrakasan, A.P.; Balakrishnan, H. An application-specific protocol architecture for wireless microsensor networks. IEEE Trans. Wirel. Commun. 2002, 1, 660–670. [Google Scholar] [CrossRef]
- Lindsey, S.; Raghavendra, C.; Sivalingam, K.M. Data gathering algorithms in sensor networks using energy metrics. IEEE Trans. Parallel Distrib. Syst. 2002, 1, 924–935. [Google Scholar] [CrossRef]
- Manjeshwar, A.; Agrawal, D. TEEN: A protocol for enhanced efficiency in WSNs. In Proceedings of the First International Workshop on Parallel and Distributed Computing Issues in Wireless Networks and Mobile Computing, San Francisco, CA, USA, 23–27 April 2001. [Google Scholar]
- Manjeshwar, A.; Agrawal, D.P. APTEEN: A hybrid protocol for efficient routing and comprehensive information retrieval in wireless sensor networks. In Proceedings of the Symposium International Parallel and Distributed, San Francisco, CA, USA, 15–19 April 2002; IEEE: Piscataway, NJ, USA, 2002. [Google Scholar]
- Kulik, J.; Heinzelman, W.; Balakrishnan, H. Negotiation-based Protocols for Disseminating Information in Wireless Sensor Networks. Wirel. Netw. 2002, 8, 169–185. [Google Scholar] [CrossRef]
- Intanagonwiwat, C.; Govindan, R.; Estrin, D. Directed Diffusion: A Scalable and Robust Communication Paradigm for Sensor Networks. In Proceedings of the Sixth Annual International Conference on Mobile Computing and Networking (MOBICOM), Boston, MA, USA, 6–11 August 2000. [Google Scholar]
- Xu, Y.; Heidemann, J.; Estrin, D. Geography-informed energy conservation for ad hoc routing. In Proceedings of the 7th Annual International Conference on Mobile Computing and Networking, Rome, Italy, 16–21 July 2001; ACM: New York, NY, USA, 2001; pp. 70–84. [Google Scholar]
- Yu, Y. Geographical and Energy-Aware Routing: A Recursive Data Dissemination Protocol for Wireless Sensor Networ. UCLA Computer Science Department Technical Report. Available online: https://pdfs.semanticscholar.org/11ca/e1f847d741052bffba9af8d9fbd39973fd94.pdf (accessed on 21 August 2019).
- Alasem, R.; Reda, A.; Mansour, M. Location based energy-efficient reliable routing protocol for wireless sensor networks. In Recent Researches in Communications, Automation, Signal. Processing, Nanotechnology, Astronomy and Nuclear Physics; WSEAS Press: Cambridge, UK, 2011; pp. 180–185. [Google Scholar]
- Curry, E.; O’Donnel, J.; Corry, E.; Hasan, S.; Keane, M.; O’Riain, S. Linking building data in the cloud: Integrating cross-domain building data using linked data. Adv. Eng. Inform. 2013, 27, 206–219. [Google Scholar] [CrossRef] [Green Version]
- Gil, D.; Johnsson, M.; Mora, H.; Szymański, J. Review of the Complexity of Managing Big Data of the Internet of Things. Complexity 2019, 2019, 4592902. [Google Scholar] [CrossRef]
- Satyanarayanan, M. The emergence of edge computing. Computer 2017, 50, 30–39. [Google Scholar] [CrossRef]
- Balaji, B.; Bhattacharya, A.; Fierro, G.; Gao, J.; Gluck, J.; Hong, D.; Johansen, A.; Koh, J.; Ploennigs, J.; Agarwal, Y.; et al. Brick: Metadata schema for portable smart building applications. Appl. Energy 2018, 226, 1273–1292. [Google Scholar] [CrossRef]
- ASHRAE’s BACnet Committee, Project Haystack and Brick Schema Collaborating to Provide Unified Data Semantic Modeling Solution. Available online: https://www.ashrae.org/ (accessed on 8 December 2018).
- Kayastha, N.; Niyato, D.; Hossain, E.; Han, Z. Smart grid sensor data collection, communication, and networking: A tutorial. Wirel. Commun. Mob. Comput. 2014, 14, 1055–1087. [Google Scholar] [CrossRef]
- Sorrell, S. The Internet of Things: Consumer, Industrial & Public Services; Juniper Research, 2016. pp. 2016–2021. Available online: https://www.juniperresearch.com/researchstore/iot-m2m/internet-of-things (accessed on 8 December 2018).
- Manyika, J.; Chui, M.; Bisson, P.; Woetzel, J.; Dobbs, R.; Bughin, J.; Aharon, D. Unlocking the Potential of the Internet of Things. Available online: https://www.mckinsey.com/business-functions/digital-mckinsey/ (accessed on 10 December 2018).
- Habibzadeh, M.; Hassanalieragh, M.; Ishikawa, A.; Soyata, T.; Sharma, G. Hybrid solar-wind energy harvesting for embedded applications: Supercapacitor-based system architectures and design tradeoffs. IEEE Circuits Syst. Mag. 2017, 17, 29–63. [Google Scholar] [CrossRef]
- Bhuyan, S.; Hu, J. A natural battery based on lake water and its soil bank. Energy 2013, 51, 395–399. [Google Scholar] [CrossRef]
- Trizcinski, P.; Nathan, A.; Karanassios, V. Approaches to energy harvesting and energy scavenging for energy autonomous sensors and microinstruments. Proc. SPIE 2017, 10194, 1019431. [Google Scholar]
- Souza, C.P.; Carvalho, F.B.; Silva, F.A.; Andrade, H.A.; Silva, N.D.V.; Baiocchi, O.; Müller, I. On harvesting energy from tree trunks for environmental monitoring. Int. J. Distrib. Sens. Netw. 2016, 12, 9383765. [Google Scholar] [CrossRef]
- McGarry, S.; Knight, C. The potential for harvesting energy from the movement of trees. Sensors 2011, 11, 9275–9299. [Google Scholar] [CrossRef] [PubMed]
- Tarelho, J.P.; dos Santos, M.P.S.; Ferreira, J.A.; Ramos, A.; Kopyl, S.; Kim, S.O.; Hong, S.; Kholkin, A. Graphene-based materials and structures for energy harvesting with fluids—A review. Mater. Today 2018, 21, 1019–1041. [Google Scholar] [CrossRef]


| Parameter. | Sensor | Measurement Range | Accuracy | Response Time | Power Consumption | Applications/Technology | Cost |
|---|---|---|---|---|---|---|---|
| Temperature | Thermocouples | −100–500 °C | ±1–4 °C | 5–80 s | Low–High (0.5 µA–30 mA) | BMS, HVAC/Wired, Portable | $6–50 |
| RTDs | −50–250 °C | ±0.2–1 °C | 1–8 min | High during measurement (1.5–100 mA) | BMS, HVAC and Visualisation/Wired, Wireless | $30–100 | |
| Thermistors | −50–130 °C | ±0.05–0.5 °C | 0.2–10 s | High during measurement (1–80 mA) | BMS, HVAC and Visualization/Wired, Wireless | $20–70 | |
| IC sensors | −40–150 °C | ±0.5–1 °C | 0.5–100 s | Low (0.5–100 µA) | BMS, HVAC and Visualisation/Wired, Wireless | $1–15 | |
| Carbon emissions | NDIR (CO2) | 0–10,000 ppm | ±30–200 ppm | 30–100 s | Low–High (20–200 mA) | Airflow Control, Monitoring/Wired, Wireless | $100–600 |
| MOSFET (CO and VOC) | 400–20,000 ppm | ±30–100 ppm | 50–60 s | High (typ. >50 mA) | Airflow Control, Monitoring/Wired, Wireless | $25–250 | |
| Electrochem. (CO and VOC) | 0–1000 ppm | ±0–30 ppm | 10–60 s | Low (30 µA–10 mA) | Airflow Control, Monitoring/Wired, Wireless | $100–650 | |
| Humidity | Capacitive sensors | 0%–100% RH | ±0%–5% | 15–90 s | Low (2 µA–4 mA) | BMS, HVAC and Visualisation/Wired, Wireless | $40–200 |
| Resistive sensors | 5%–90% RH | ±1%–10% | 10–60 s | Low (0.5–5 mA) | BMS, HVAC and Visualisation/Wired, Wireless | $25–170 |
| Parameter | Sensor | Measurement Range/Accuracy | Response Time | Power Consumption | Applications/Technology | Suitability for both Indoor and Outdoor Environments | Cost |
|---|---|---|---|---|---|---|---|
| Occupancy | PIR Ultrasonic | 3–10 m distance >70 m | 0.5 s–10 min 1.3 ms–30 min | Low–High (5–15 mA) Low–High (5–30 mA) | BMS, HVAC and Visualisation/Wired, Wireless BMS, HVAC and Visualisation/Wired, Wireless | No Yes | $20–65 $130–500 |
| Light | Photores. Photodiode | ±5%–10% of reading ±5%–10% of reading | 5–20 s 1–10 s | Low–High (10–60 mA) Low (100 µA–5 mA) | BMS, HVAC and Visualisation/Wired, Wireless BMS, HVAC and Visualisation/Wired, Wireless | Yes Yes | $50–200 $15–65 |
| Airflow | Hotwire Anemom. Vane Anemom. | 0.1–45 m/s air velocity 0.25–50 m/s air velocity | 0.1–5 s 0.5–5 s | Low–High (10–40 mA) Low–High (2–50 mA) | HVAC, Airflow control and monitoring/Wired, Wireless HVAC, Airflow control and monitoring/Wired, Wireless | No Yes | $25–200 $25–300 |
| Technology (Standard) | Coverage Range | Theoretical Data Rate | Maximum Number of Nodes | Power Consumption | Market Adoption |
|---|---|---|---|---|---|
| Ethernet (IEEE 802.3) | 100 m | 10 Mbps–100 Gbps | 1 per wire (254 on a subnet) | Low | High |
| PLCC (Insteon, IEEE 1901, CE bus, LonWorks) | 300–3000 m | 13 kbps–200 Mbps | 500–1000 | Low–High | Low |
| Serial Comm. and Modbus (RS232, RS422, RS485) | 15–1200 m | 1–10 Mbps | 32 typical. Up to 256 with some ICs | Low | High |
| Zigbee (IEEE 802.15.4) | 10–100 m | 250 kbps | 255 | Low | High |
| Bluetooth (IEEE 802.15.1) BLE | 10 m 50 m | 2–24 Mbps 2 Mbps | 8 8 | High Low | High Low |
| WiFi (IEEE 802.11 a,b,g,n,ac) | 50–70 m | 11–1300 Mbps | 255 | High | High |
| EnOcean (EnOcean standard) | 20–200 m | 125 kbps | 232 | Low | Low |
| BACnet (ANSI/ASHRAE 135) | 1200 m | 9.6–115.2 kbps | 32 typical. Up to 128 Master Nodes on same Segment | Low | Low |
| 6LoWPAN (IEEE 802.15.4) | 10–100 m | 250 kbps | 264 | Low | Low |
| Z-Wave (Z-Wave Alliance) | 30–300 m | 100 kbps | 232 | Low | Low |
| LoRaWAN (LoRa Alliance) | 10,000 m | 0.3–50 kbps | 2000–3000 | Low | Low |
| Parameter | NiCd | NiMH | NiFe | Lead Acid | Li-ion | Reusable Alkaline |
|---|---|---|---|---|---|---|
| Cycle Life (cycles) | 1000–5000 | 300–2000 | 1000–8000 | 100–500 | 300–5000 | 10–100 |
| Lifespan (years) | 5–15 | 2–8 | 10–30 | 1.5–10 | 2–10 | 1–5 |
| Self-discharge Rate (%/month) | 15–20 (typ. decrease of 10% in first 24 h, then 10% for 30 days) | 25–35 | 20–30 | 3–6 | 10%–15% (typ. 3% of energy consumed by internal circuit protection) | 0.2–1 |
| Fast Charge Time (hours) | 1–2 | 2–4 | 4–6 | 8–14 | 2–4 | 1–3 |
| Power Density (µW/cm3) | 40,000–100,000 | 8000–500,000 | 10,000–30,000 | 10,000–350,000 | 60,000–800,000 | 10,000–100,000 |
| Market Adoption | High | High | Medium | High | High | High |
| Environmental Impact | High | Medium | Low | High | Medium | High |
| Maintenance Requirement (days) | 30–60 | 60–90 | 70–100 | 90–180 | Not required | Not required |
| Battery Cost ($/kWh) | $250–550 | $250–500 | $180–250 | $100–200 | $200–400 | $70–200 |
| Energy Harvesting Source | Typical Range of Ambient Energy Levels | Estimated Electrical DC Power | Calculated Power Density |
|---|---|---|---|
| Photovoltaic | Light intensity: 100–3700 1x | 25–1149 µW | 9–399 µW/cm3 |
| Thermal | Thermal gradient: 10–40 °C | 1–10 mW | 0.7–7.1 mW/cm3 |
| Kinetic | Acceleration: 0.0245–2.82 m/s2 Frequency: 43.1–162.3 Hz | 0.008–68.97 µW | 0.05–459.8 µW/cm3 |
| RF | EM wave strength: −74 to −29 dBm | 0.028–944 nW | 0.00169–57.37 nW/cm3 |
| Airflow | Airflow speed: 1–10 m/s | 0.9–324 mW | 0.017–6.0 mW/cm3 |
| Product ID | Harvesting Technology | Product Type | Manufacturer | Cost |
|---|---|---|---|---|
| ‘Aerial Switch’ | Photovoltaic | Turnkey product—HMI switch | NISSHA | POA |
| S3001-D330 | Photovoltaic | Turnkey product—Temperature sensor | EnOcean | $27 |
| S3001-D320 | Photovoltaic | Turnkey product—Magnetic contact sensor | EnOcean | $30 |
| EPACA | Photovoltaic | Turnkey product | EnOcean | n/a |
| AEM40940 | RF | Power Management IC | E.PEAS | $4 |
| STM300 | n/a | Low-power transmitter module | EnOcean | $26 |
| PCT100 | RF via RFID (less than 10 m) | Light and temperature transmitter module | Powercast | $83 |
| PMG17-100 | Vibration-EM coil | Energy source | Perpetuum | POA |
| APA 400M | Vibration-Piezo | Energy source | Cedrat Technologies | POA |
| S233-H5FR | Vibration-Piezo | Energy source | Mide | $140 |
| HZ-14 | Thermoelectric (Seebeck) | Energy source | Hi-Z | $11 |
| CZ1 | Thermoelectric (Seebeck) | Energy source | Tellurex | $12 |
| PL-ENO-SET1 | Mechanical | Turnkey product—HMI switch | EnOcean | $100 |
| EH300 | Any intermittent electric source (0–500V AC/DC) | Energy source | Advanced Linear Devices | $80 |
| Protocol | Type | Scalability | Power Management | Mobility | Resource Awareness | Lifetime | Data Aggregation |
|---|---|---|---|---|---|---|---|
| LEACH | Hierarchical | High | Very Good | Sink node (base station) is fixed | Yes | Very Good | Yes |
| PEGASIS | Hierarchical | High | Very Good | Sink node (base station) is fixed | Yes | Very Good | Yes |
| TEEN | Hierarchical | High | Very Good | Sink node (base station) is fixed | Yes | Very Good | Yes |
| APTEEN | Hierarchical | High | Very Good | Sink node (base station) is fixed | Yes | Very Good | Yes |
| SPIN | Data-Centric | Low | Limited | Supported | Yes | Good | Yes |
| Direct Diffusion | Data-Centric | Low | Limited | Limited | Yes | Good | Yes |
| GAF | Location-based | Low | Limited | Limited | Yes | Good | No |
| GEAR | Location-based | Low | Limited | Limited | Yes | Good | No |
© 2019 by the authors. Licensee MDPI, Basel, Switzerland. This article is an open access article distributed under the terms and conditions of the Creative Commons Attribution (CC BY) license (http://creativecommons.org/licenses/by/4.0/).
Share and Cite
Hayat, H.; Griffiths, T.; Brennan, D.; Lewis, R.P.; Barclay, M.; Weirman, C.; Philip, B.; Searle, J.R. The State-of-the-Art of Sensors and Environmental Monitoring Technologies in Buildings. Sensors 2019, 19, 3648. https://doi.org/10.3390/s19173648
Hayat H, Griffiths T, Brennan D, Lewis RP, Barclay M, Weirman C, Philip B, Searle JR. The State-of-the-Art of Sensors and Environmental Monitoring Technologies in Buildings. Sensors. 2019; 19(17):3648. https://doi.org/10.3390/s19173648
Chicago/Turabian StyleHayat, Hasan, Thomas Griffiths, Desmond Brennan, Richard P. Lewis, Michael Barclay, Chris Weirman, Bruce Philip, and Justin R. Searle. 2019. "The State-of-the-Art of Sensors and Environmental Monitoring Technologies in Buildings" Sensors 19, no. 17: 3648. https://doi.org/10.3390/s19173648