Effects of Chemical State of the Pd Species on H2 Sensing Characteristics of PdOx/SnO2 Based Chemiresistive Sensors

Institute of Chemical Materials, China Academy of Engineering Physics, Mianyang 621999, China
*
Author to whom correspondence should be addressed.
Sensors 2019, 19(14), 3131; https://doi.org/10.3390/s19143131
Submission received: 13 June 2019
/
Revised: 8 July 2019
/
Accepted: 12 July 2019
/
Published: 16 July 2019
(This article belongs to the Special Issue Nanoparticles-Based Gas Sensors)
Abstract
:In this paper, the PdOx nanoparticles modified SnO2 are prepared using sputtering and wet chemical methods. The SnO2 nanoparticles are separately added to a concentration of 0.75% to 10% PdCl2 to obtain a PdCl2/SnO2 composite material, which is calcined for 1 to 2 h at the temperatures of 120 °C, 250 °C, 450 °C and 600 °C. The PdOx/SnO2 nanocomposite was characterized by X-ray photoelectron spectroscopy (XPS), X-ray diffractometry (XRD) and transmission electron microscopy (TEM). Microstructural observations revealed PdOx with different chemical states attached to the surface of SnO2. Hydrogen response change tests were performed on the obtained PdOx/SnO2 gas sensing materials. The results show that the high gas sensing performance may be attributed to the contribution of the PdOx-loaded SnO2. In hydrogen, the best sensitivity response was attained at 80 °C, which is 60 times that of pristine SnO2. It clarifies the role of PdOx in the gas sensing mechanisms.
1. Introduction
Hydrogen is expected to become a green and renewable energy source, in response to air pollution, global warming and the increasing shortage of fossil fuels. However, this light and odorless gas is highly flammable, and the leakage can result in disastrous consequences, such as explosions [1]. Therefore, there has been a huge demand for effective hydrogen sensors that can be used for providing a warning about the leakage of hydrogen during the production, storage, delivery, and usage stages [2].
Metal oxide semiconductors based chemiresistive gas sensors are widely used to detect varieties of inflammable gases and toxic pollutants [3,4], due to their high sensitivity, simplicity in fabrication, low cost, and simple measuring electronics [5]. As a typical n-type wide bandgap semiconductor, tin oxide (SnO2, with a bandgap (Eg) of 3.6 eV at 300 K) has been highly investigated due to its high gas sensitive activity to a wide variety of gases [6]. Meanwhile, their poor selectivity creates a huge limitation for achieving wide applications. Furthermore, the high working temperature (usually superior to 200 °C) requires high power consumption, and restricts the integration and the use of materials for device assembling [7].
In order to improve the H2-selectivity and decrease in operating temperature of SnO2-based gas sensors, surface modifications of SnO2 with PdOx nanoparticles, have been widely employed [8,9]. The electronic sensitization mechanism has been proposed to explain the improvement in gas-sensing performance [10,11]. The reaction with H2 molecules takes place on the surfaces of PdOx nanoparticles and not on the SnO2 [12]. The PdOx nanoparticles change their charge state, which induces a variation of the surface barrier height and therefore leads to a conductance change on the SnO2 [13]. In this case, the PdOx nanoparticles act as a “receptor” through a specific interaction with H2 molecules [14], and SnO2 only has a “transducer” role of the changes induced by the interaction of PdOx nanoparticles with H2 molecules [15].
The PdOx nanoparticles modified SnO2 can be prepared though sputtering and wet chemical methods [16,17]. However, the impregnation-calcination method has been extensively used to prepare PdOx/SnO2 composites using PdCl2 as precursor due to its technological simplicity. In spite of numerous papers reporting on the improvements in the H2-sensing performances by using PdCl2 as a precursor, the origin of these improvements [18] and the correlation of H2-sensing characteristics and chemical state of the introduced materials haven’t been investigated systematically [19].
In this study, we studied the sensing behavior of the PdOx/ SnO2 sensor at different annealing temperatures that obtained different chemical states of Pd toward H2 at the optimal operating temperature. From the study, the different chemical states of Pd substantially participated in the gas sensing reaction, thereby improving the H2 sensing performance of the sensor.
2. Materials and Methods
2.1. Preparation of PdOx/SnO2 Composites
The PdOx/SnO2 composite was obtained using a simple synthesis-calcination method. First, 5 mol% of PdCl2 was dissolved in ethanol, then SnO2 nanoparticles having a particle diameter of 50 to 70 nm were added to a PdCl2/ethanol solution and thoroughly mixed, sonicated for 30 min. The prepared mixture was dried at 100 °C to obtain PdCl2/SnO2 composites. Finally, the PdCl2/SnO2 composite was calcined at a heating rate of 5 °C min−1 for 2 h at 120 °C, 250 °C, 450 °C, and 600 °C under an air atmosphere to obtain a final sample. According to the difference in calcination temperature, the obtained PdOx/SnO2 composites were abbreviated as PdOx/SnO2-120, PdOx/SnO2-250, PdOx/SnO2-450, and PdOx/SnO2-600, respectively.
2.2. Characterization
To examine the chemical states of components sensitivity materials, all the sensors were characterized by X-ray photoelectron spectroscopy (XPS, VG 250, Thermo); the powder phases were analyzed by X-ray diffraction (XRD, Bruker D8) with Cu-Kα radiation (λ = 1.5406 Å). The morphology was analyzed using field emission scanning electron microscopy (SEM) and transmission electron microscopy (TEM). The SEM was performed on a FEI Sirion-200 with an acceleration voltage of 10 kV. The TEM was carried on a Tecnai G2F20 with a typical acceleration voltage of 200 kV.
2.3. Fabrication and Measurement of Gas Sensor
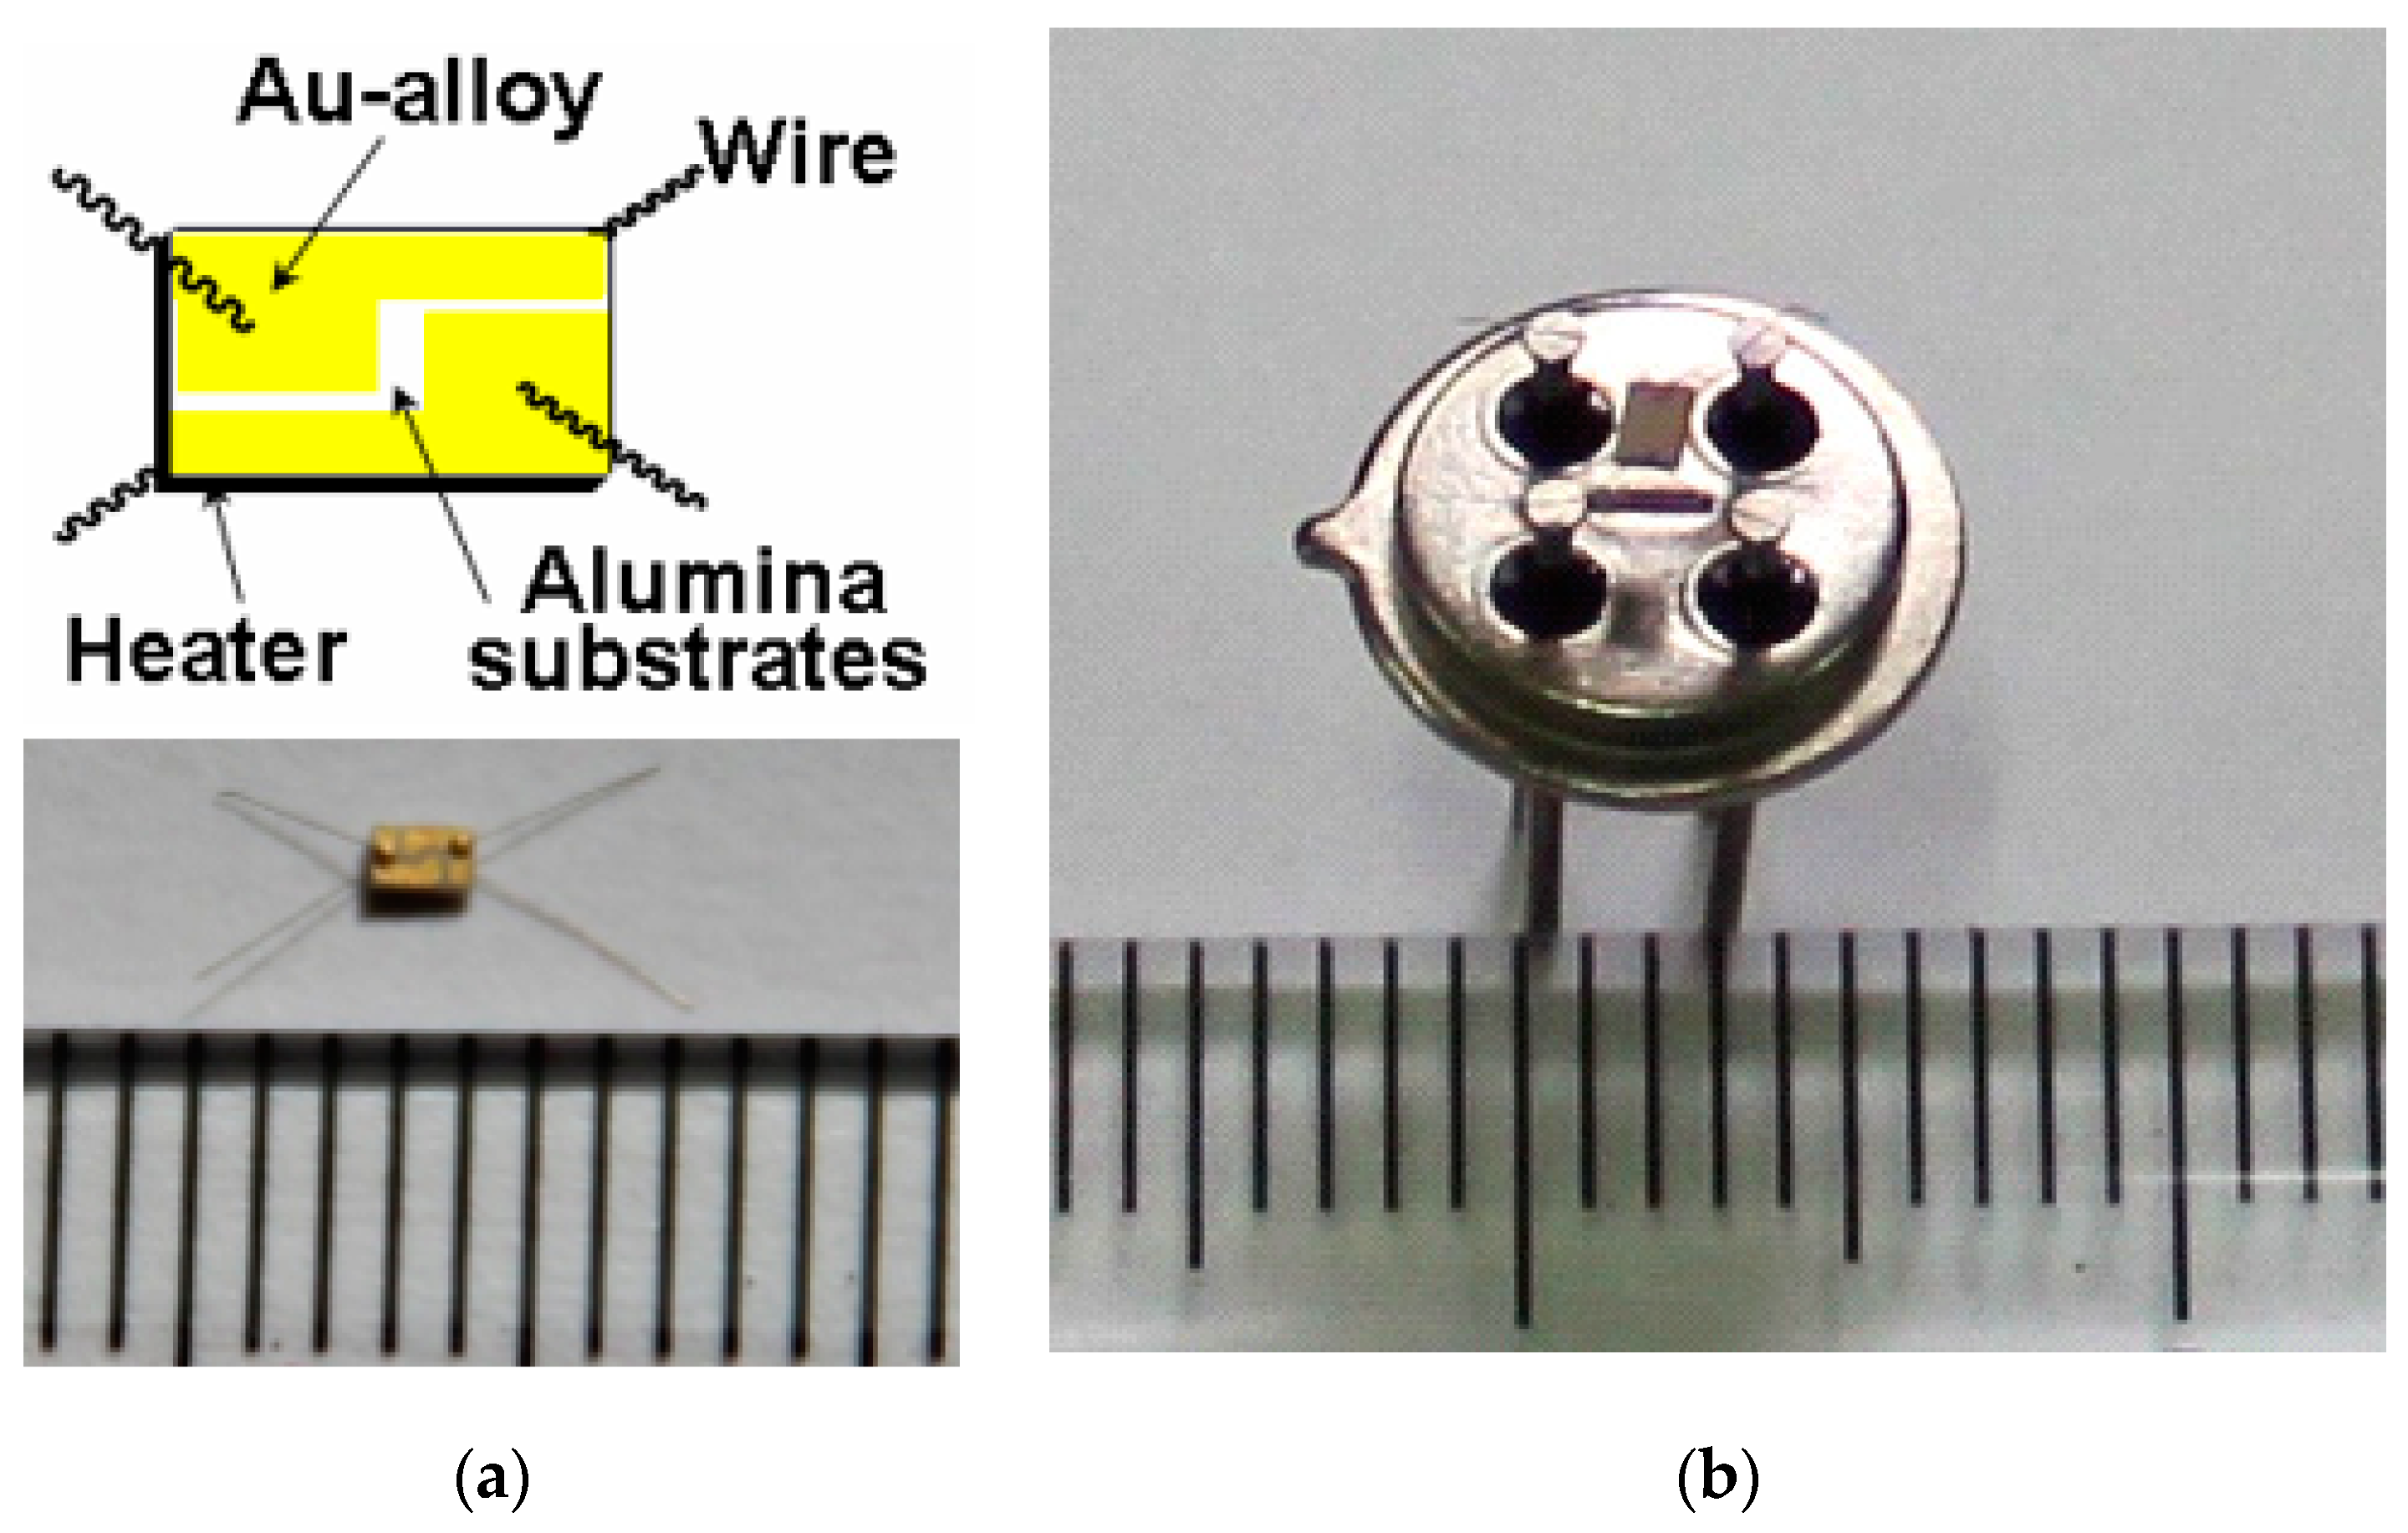
The gas-sensing characteristics of H2 in different chemical state Pd-doped SnO2 based sensors were characterized. The as-synthesized composites were mixed with terpineol, and then, the pastes were uniformly coated on the Au-alloy electrodes and dried at 100 °C to obtain the gas sensors. The schematic diagram and photograph of Au-alloy electrode are shown in Figure 1a, which is a composite of an alumina substrate (area = 1 mm × 1.5 mm), two Au electrodes on the upper surface, and a micro heater on the lower surface. The photograph of the final gas sensor is shown in Figure 1b. The gas sensors were aged to make sure the sensitivity was stable before the first measurement.
The gas-sensing characteristics of the gas sensors were operated on a specially designed home-made gas sensing analysis system. The electrical current of sensor is measured by an electrochemistry analyzer (CHI1000B, Chenhua Shanghai) with a potential of 1 V. The heating voltage is supplied by a power voltage supplier. A constant flux of air of 100 sccm as gas carrier was mixed with the gas to be measured and dispersed in the synthesized air to obtain different gas concentrations. All measurements were conducted in a temperature-stabilized sealed chamber. Air was injected in until the system became stable, then the system switched to alternating between the test gas and carrier gas every 15 min. The gas flow rates were precisely manipulated using a computer controlled multi-channel mass flow controllers, and humidity was controlled under 40 RH%.
The sensing response was defined as: S = Ig/Ia, where the Ia is the background current in carrier gas, and Ig is the changed current in test gas.
3. Results and Discussion
3.1. Microstructure Characterization of PdOx/SnO2 Composites
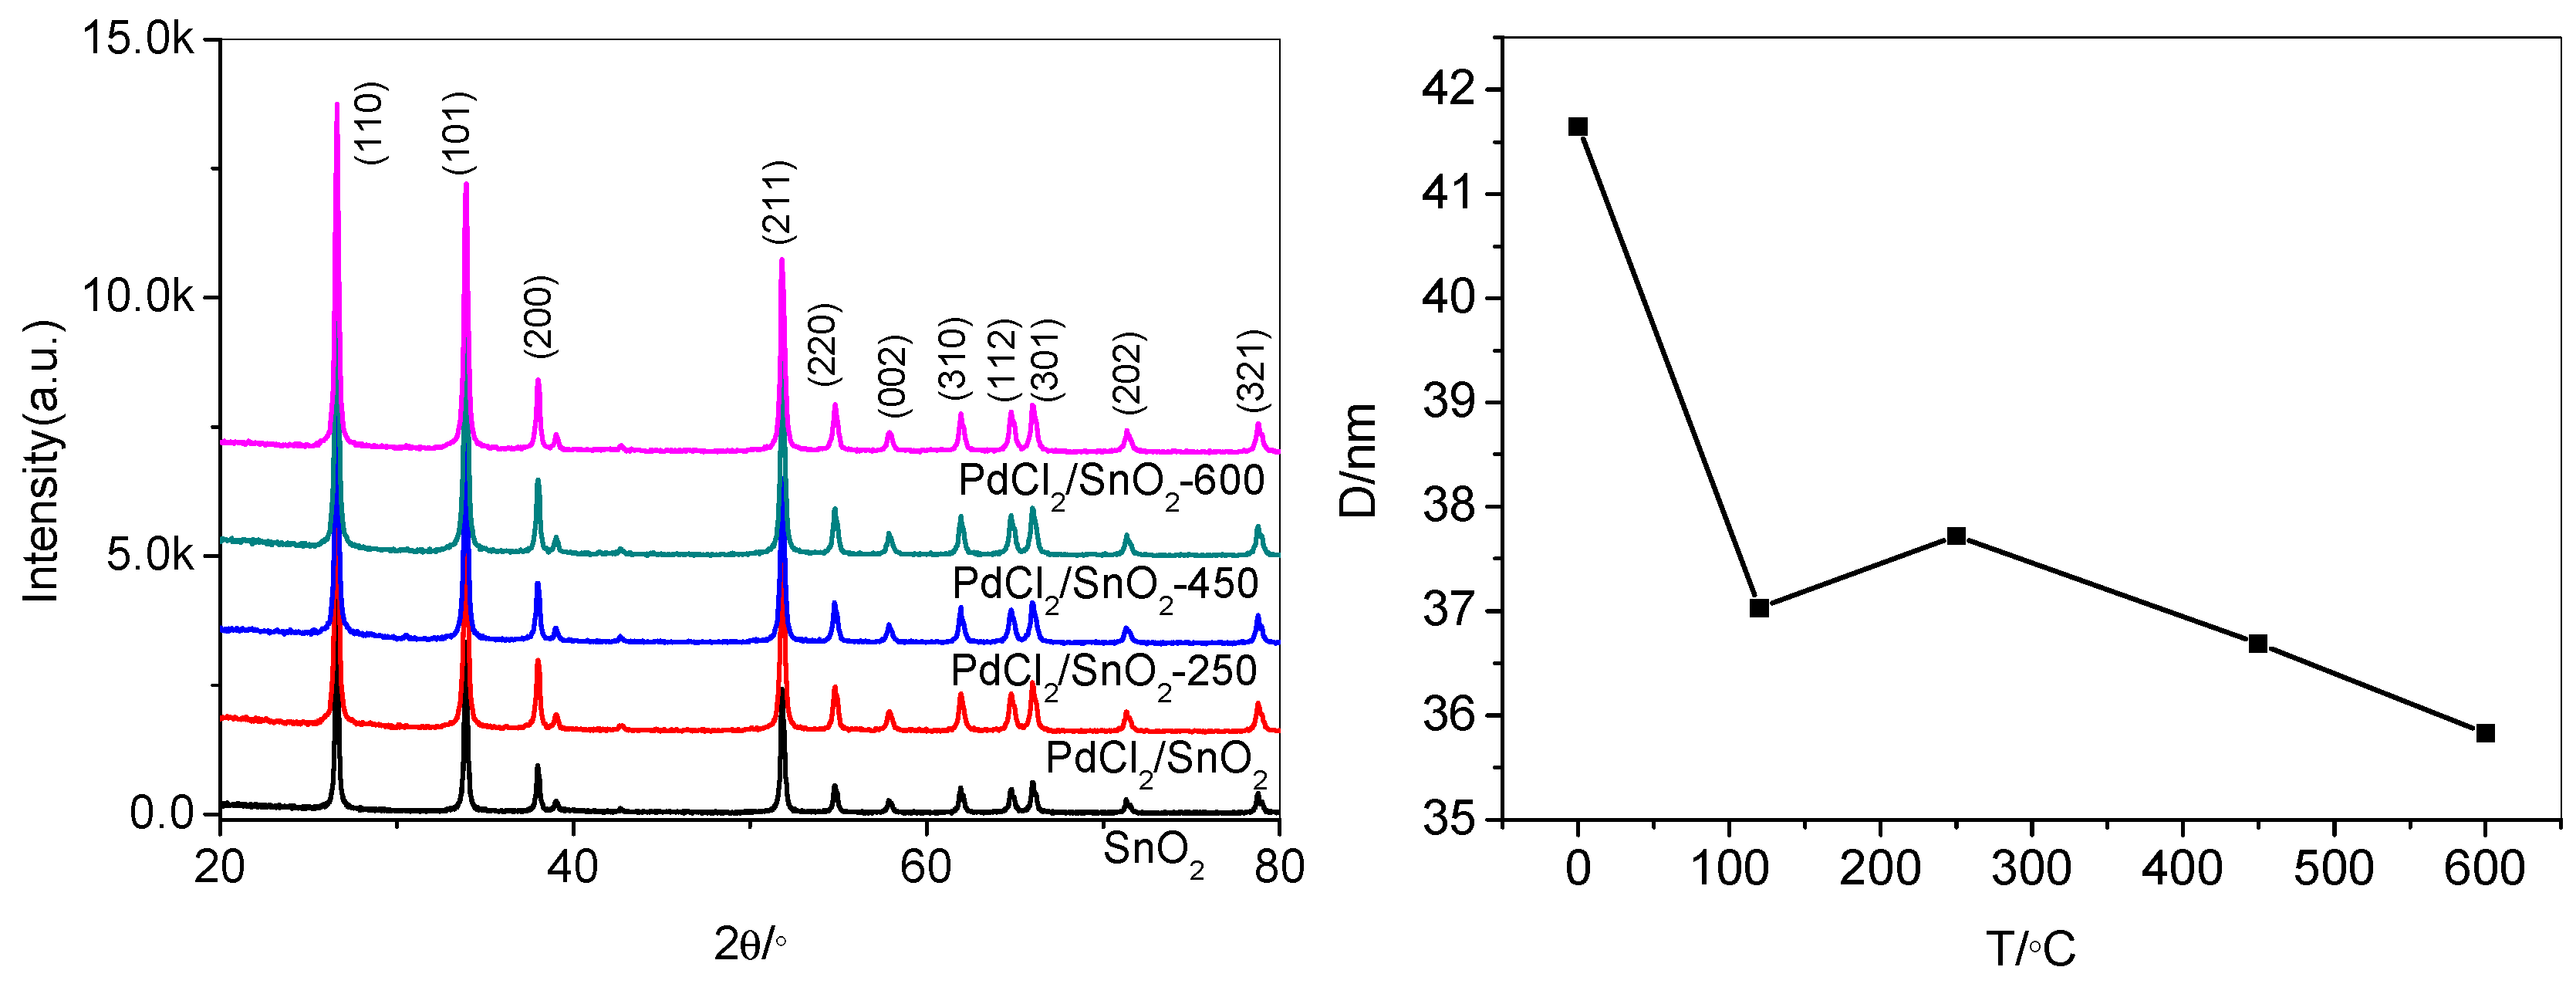
The XRD patterns of SnO2, PdCl2/SnO2, and PdOx/SnO2 composites were indicated in Figure 2. The recognizable diffraction peaks can be assigned to the tetragonal SnO2 (JCPDS 41-1445). There is no recognizable peak of PdOx or other crystalline phases appeared, probably due to the low crystallization and small content of the additives.
The crystalline sizes were measured by means of an X-ray line-broadening method, using the Scherrer equation:
D = kλ/βhklcos θ
D is the crystalline size in nanometers; λ is the wavelength of the radiation (1.54056Å for CuKα radiation); k is 0.94; βhkl is the peak width at half-maximum intensity, and θ is the peak position.
It can be seen that the peaks of Pd doped SnO2 NPs with different annealing temperature are wider than the peak of no annealing. The crystallite size calculated by the Scherrer method is decreasing with annealing temperature increasing. In 1991, Yamazoe demonstrated that a reduction in crystal size would significantly increase the sensor’s performance [20].
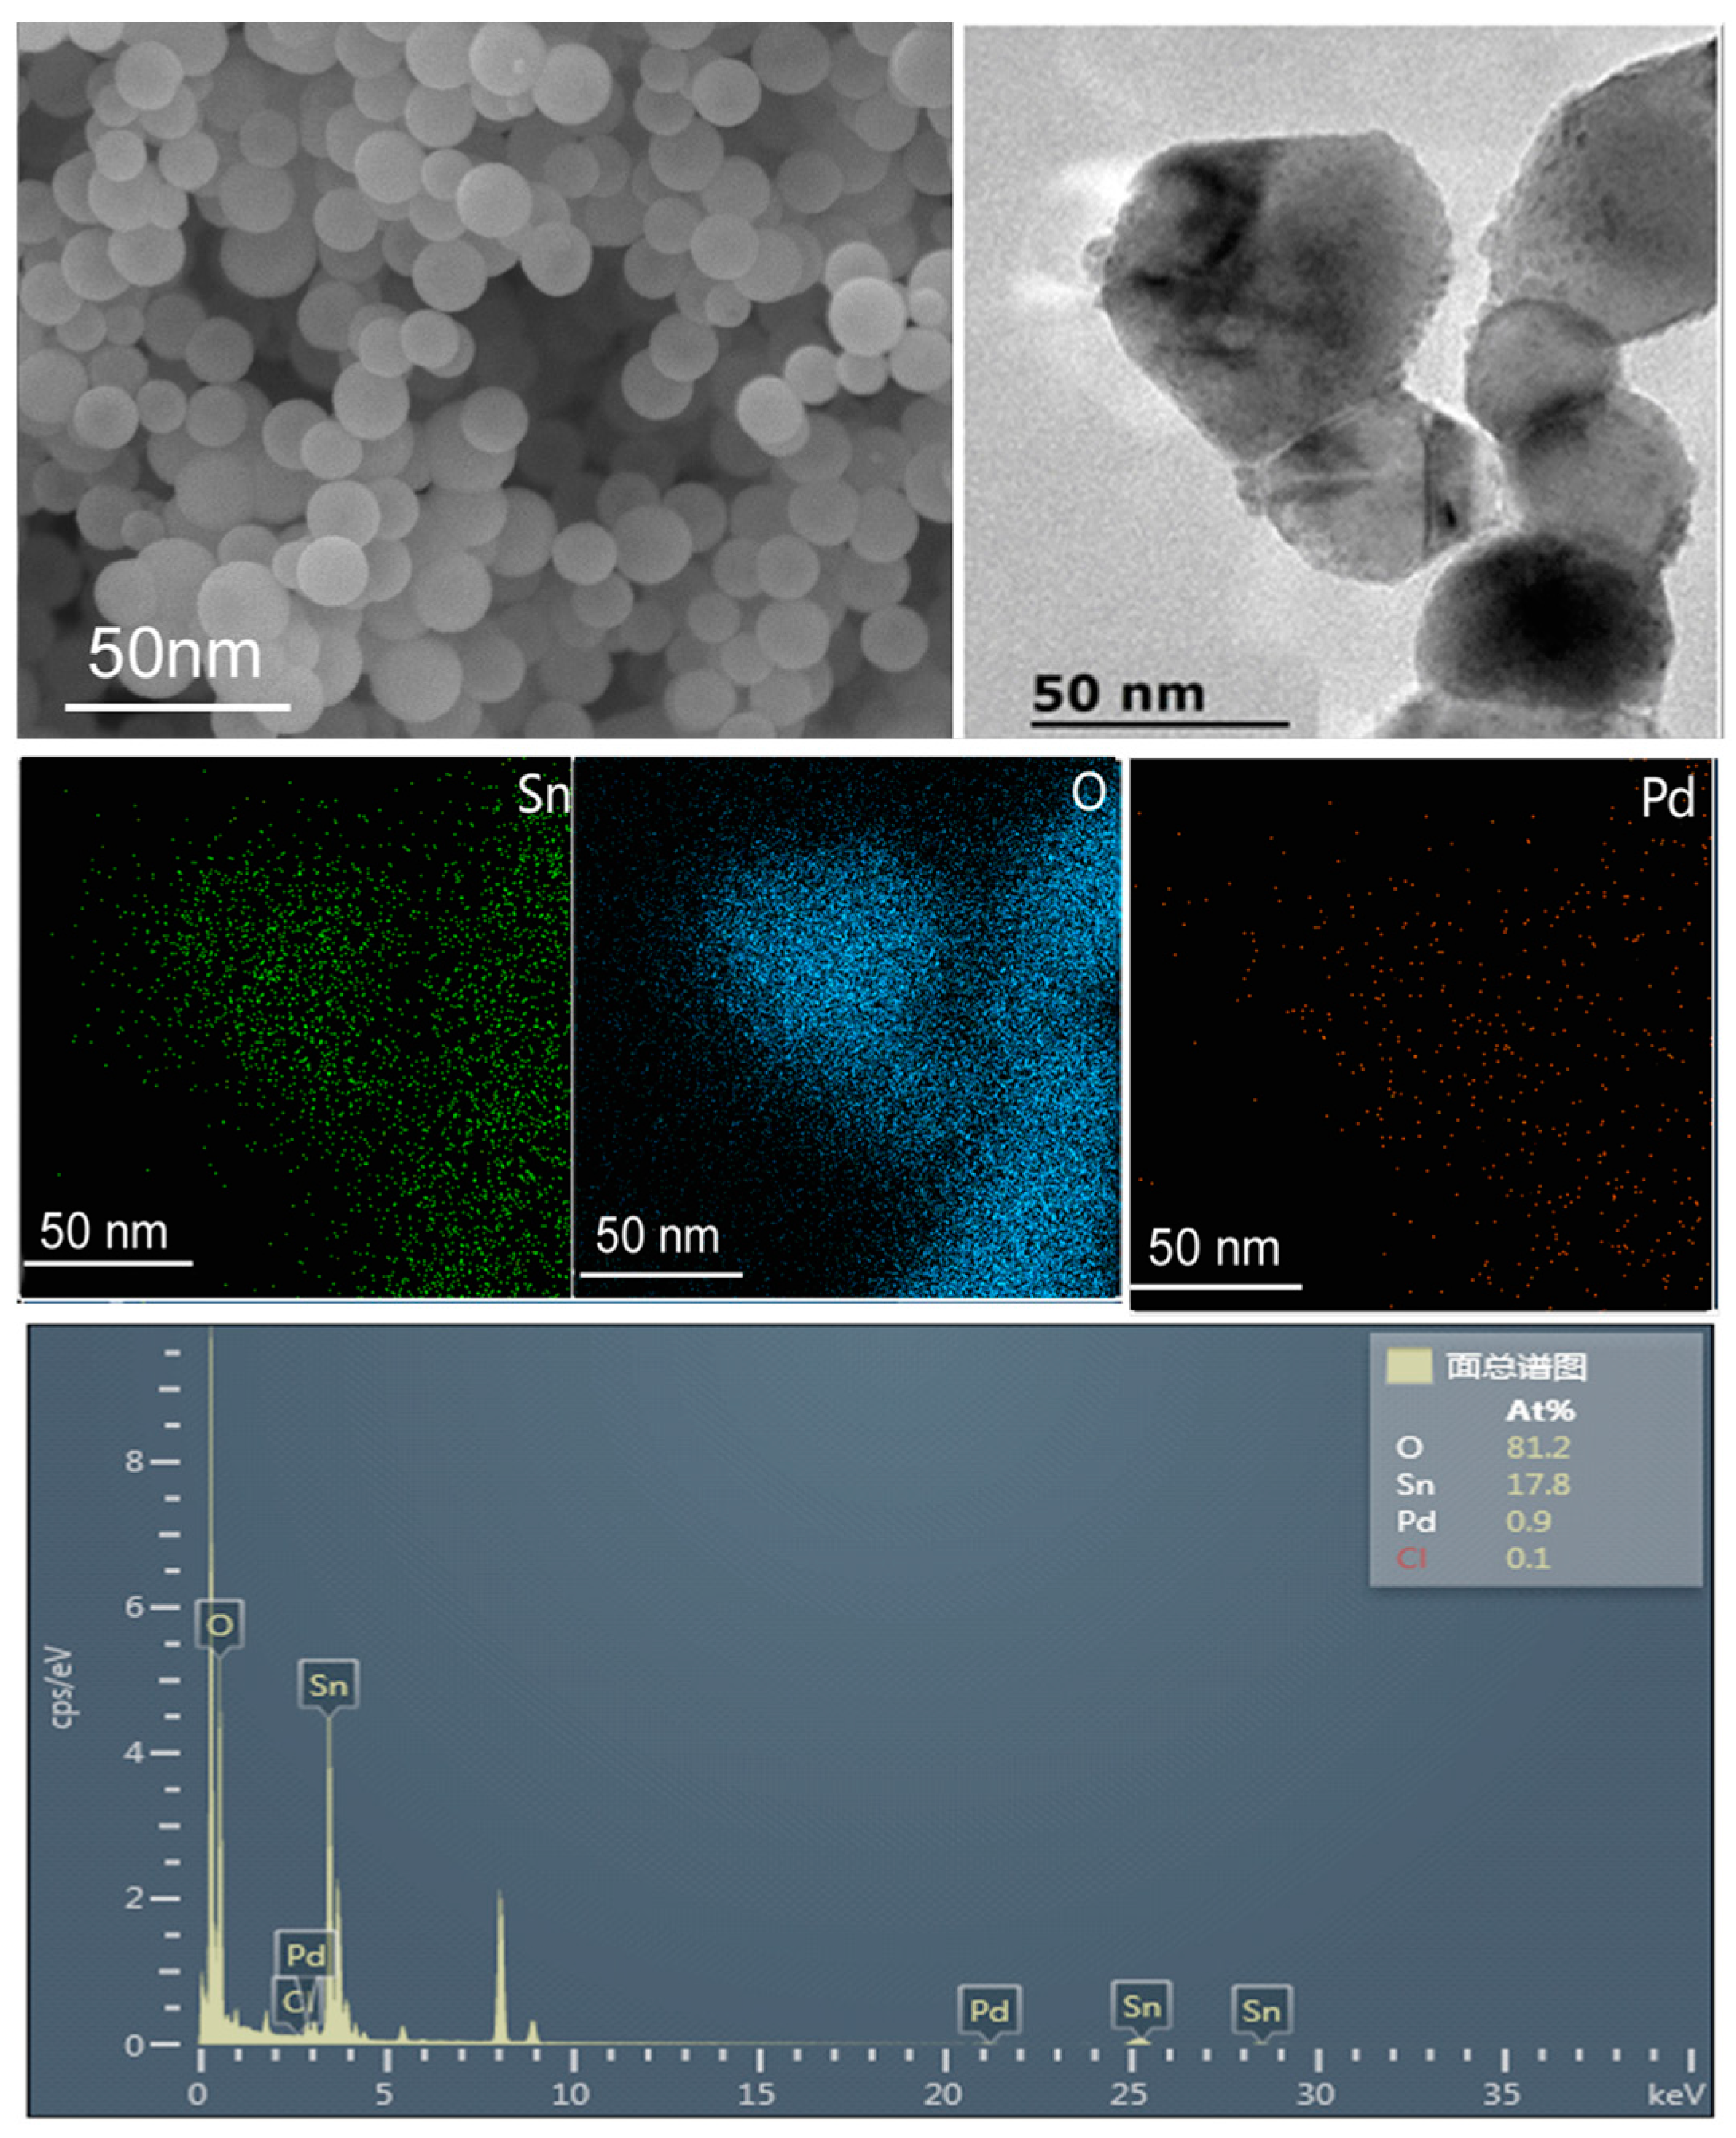
The microstructure of PdOx/SnO2-450 composite was investigated by TEM and STEM-EDS characterizations. The TEM image of PdOx/SnO2-450 is shown in Figure 3, where the size of nanoparticles is 50 to 70 nm and the shape is a sphere. The particle size is consistent with that of SnO2. Furthermore, the rough surface morphology of PdOx/SnO2-450 composite is obviously different from the smooth surface morphology of SnO2 nanoparticles, indicating that the PdOx nanoparticles are homogenously dispersed on the surfaces of SnO2 nanoparticles.
The corresponding elemental mapping of Sn, O, and Pd reveals that the PdOx nanoparticles are uniformly dispersed on the surfaces of SnO2 nanoparticles.
3.2. Chemical States of PdOx Dispersed on the Surfaces of SnO2
X-ray Photoelectron Spectroscope proves a very effective method in identifying the elements of the materials, chemical states and electronic states of the elements [21].
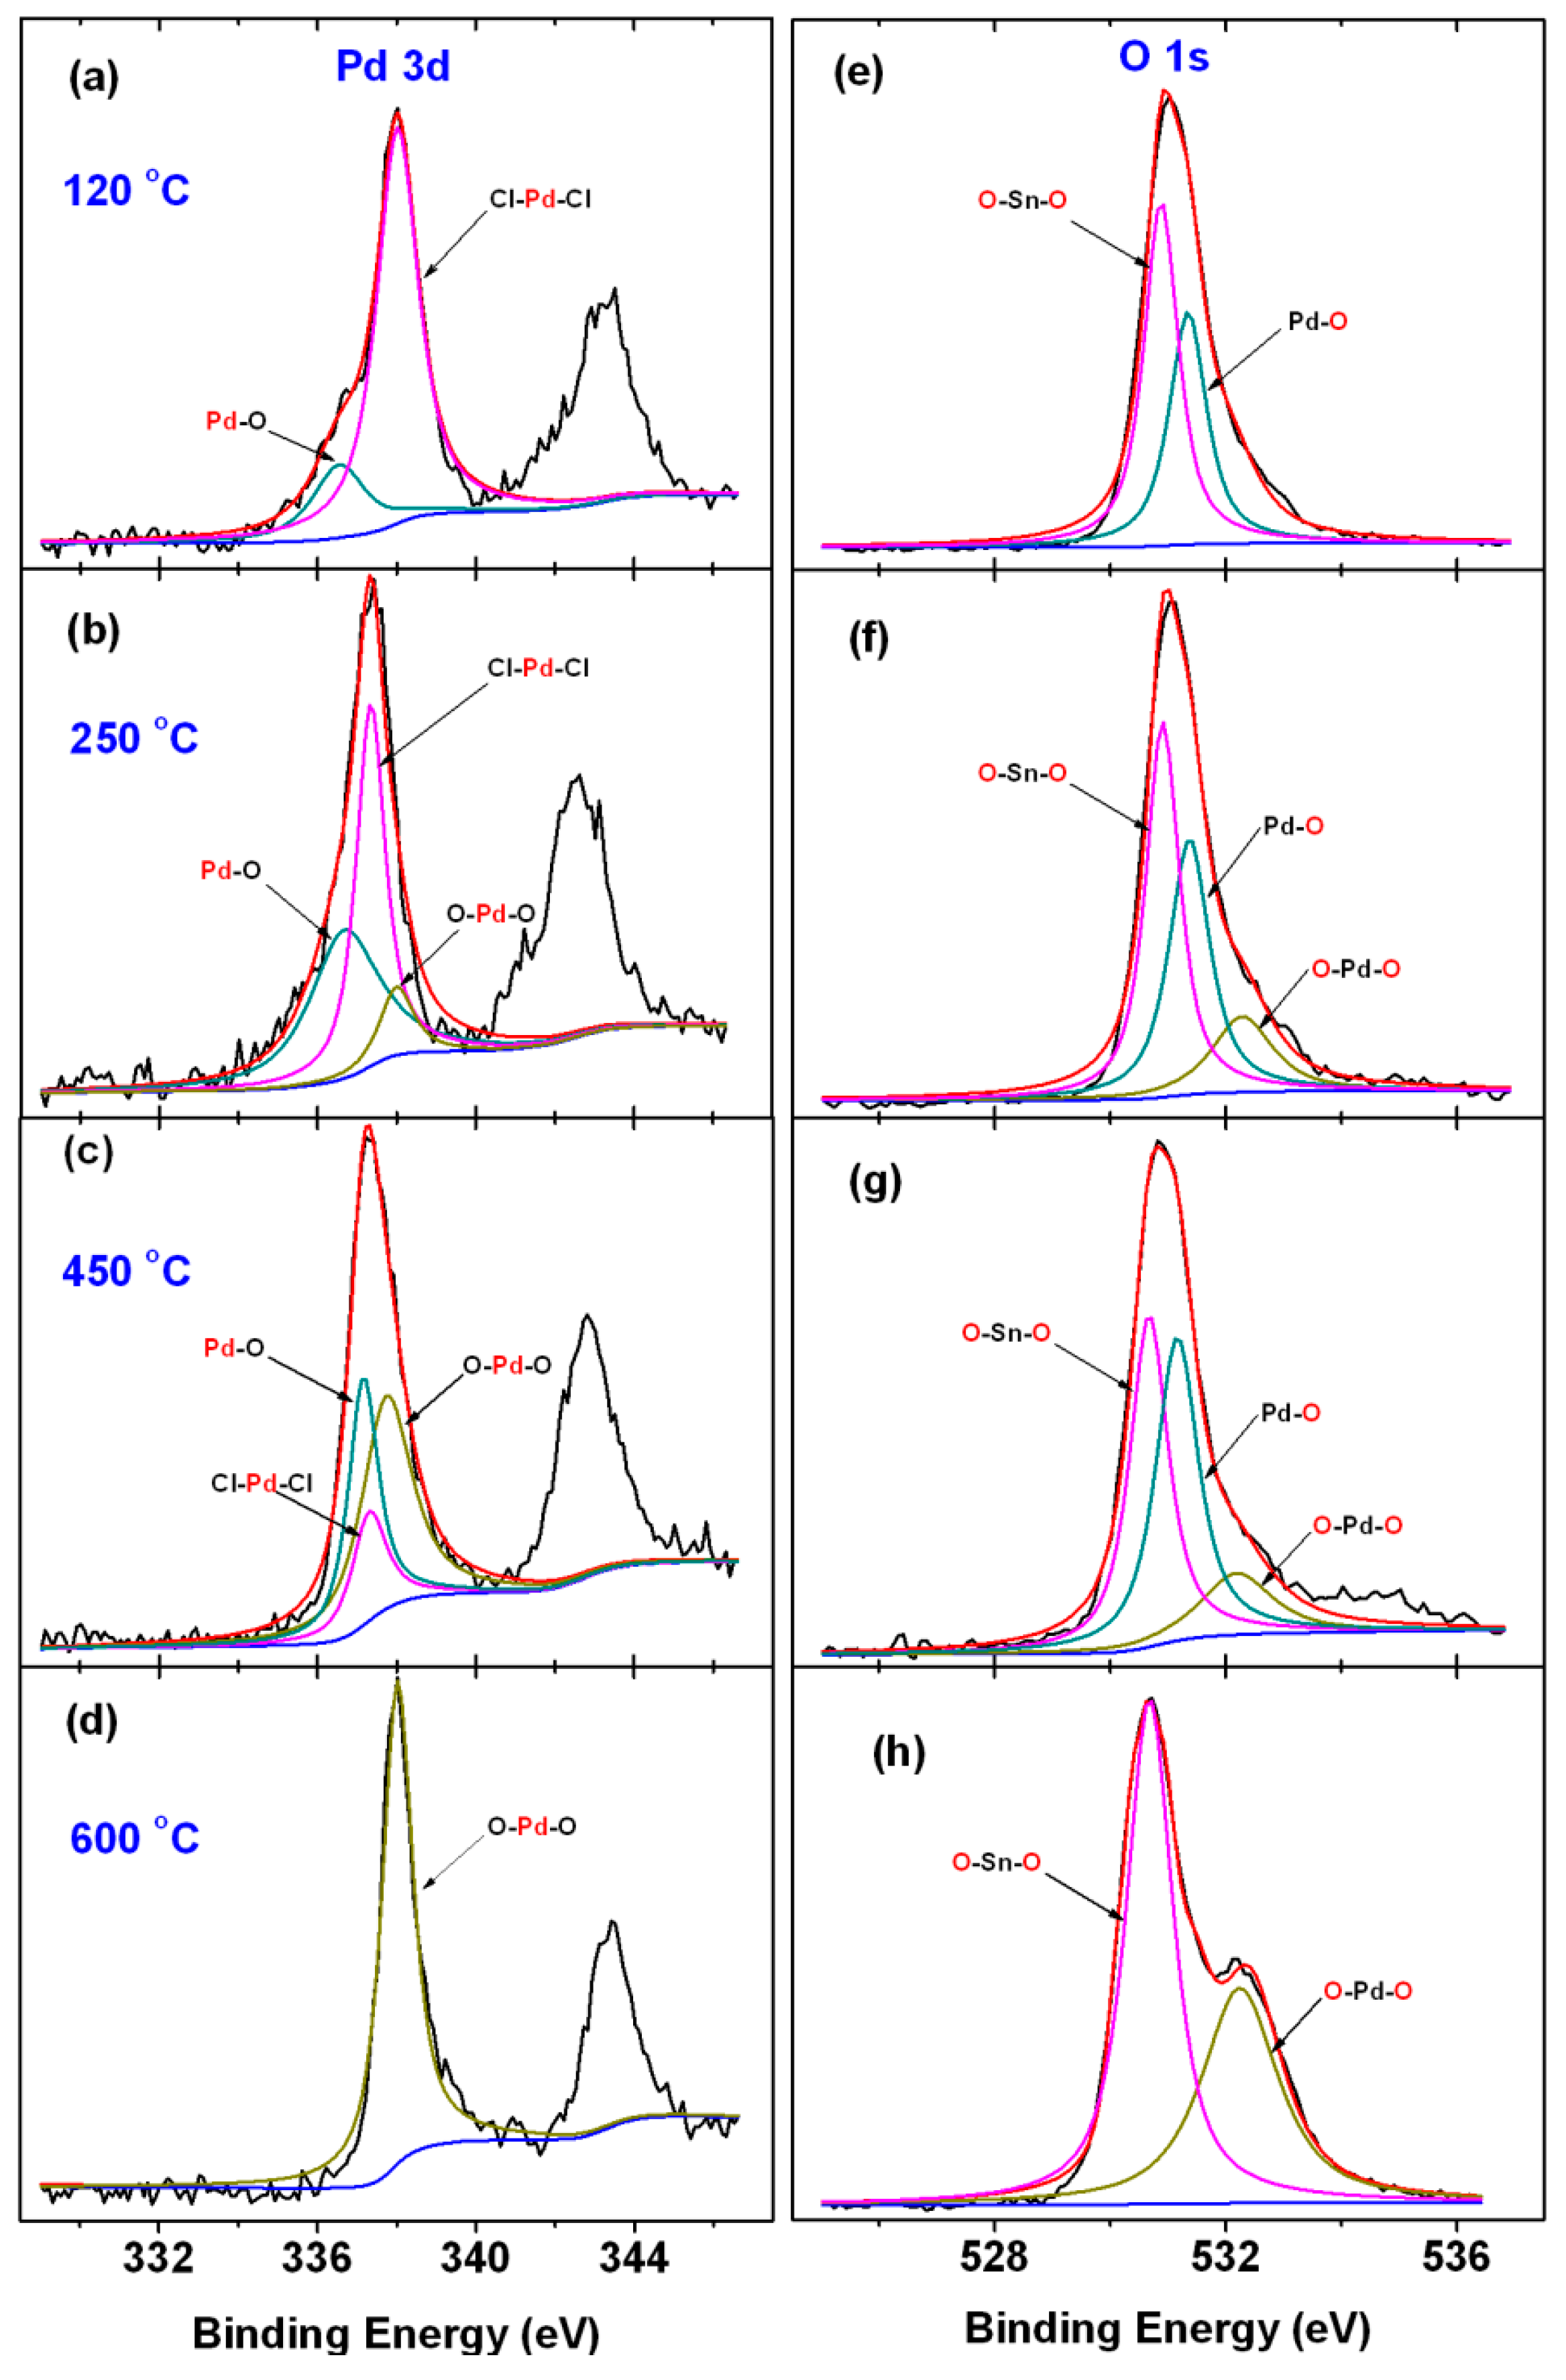
In Figure 4a–d, we plotted evolution of the Pd 3d5/2 spectrum in the dependence on the different annealing temperature. The Pd1s spectra of the XPS results were analyzed with more details. During annealing treatment, three characteristic peaks Cl-Pd-Cl (BE = 337.3 eV), Pd-O (BE = 336.6 eV), and O-Pd-O (BE = 338.1 eV) are observed and these peaks indicate the changes of chemical state of palladium. The asymmetric peak was belonged to two components with BE of 337.3 eV and 336.6 eV, with spectrums that are typical of palladium in the oxidation state of Pd2+ and Pd4+. And increasing the temperature to 450 °C resulted in the peak Pd (BE = 337.3 eV) which corresponds to the Cl-Pd-Cl structure having disappeared in the spectra. When the temperature is to 600 °C, we also observed further changes that the binding energy (BE) of Pd was shifted to lower values for smaller particles, see Figure 4a, and the intensity ratio of peak O-Pd-O to peak Pd-O increased gradually. According to Table 1, it is interesting in the series of spectra in Figure 4a–d that pure Pd0 or Pdn+ situations are never obtained.
For more understanding of the chemical states of Pd, the O 1s spectra of the XPS results were analyzed with more details in Figure 4e–h. The asymmetric O 1s peak was deconvoluted into three components with binding energies of O-Sn-O (BE = 530.9 eV), Pd-O (BE = 531.3 eV) and O-Pd-O (BE = 532.3 eV) [23]. As the temperature increases to 120 °C, two new peaks BE = 530.9 eV and BE = 531.3 eV of O-Sn-O, and Pd-O, appear respectively. As the temperature reaches 250 °C, a peak BE = 532.3 eV is observed to be the structure of O-Pd-O. When the temperature is in the range of 250 °C to 600 °C, the intensity ratio of peak O-Pd-O and Pd-O is gradually increased. Figure 4 illustrates the process of Pd surface change on Pd-SnO2. O2 diffuses to the surface of Pd and adsorbs on the surface of Pd to form an active adsorption state. Then, the oxygen atoms and Pd atoms on the surface of Pd undergo an orderly remodeling to form PdO. As the temperature increases, the oxygen atoms accumulated on the surface further react with PdO to form PdO2. The chemical state transition of palladium and the order in which these peaks appear are as follows:
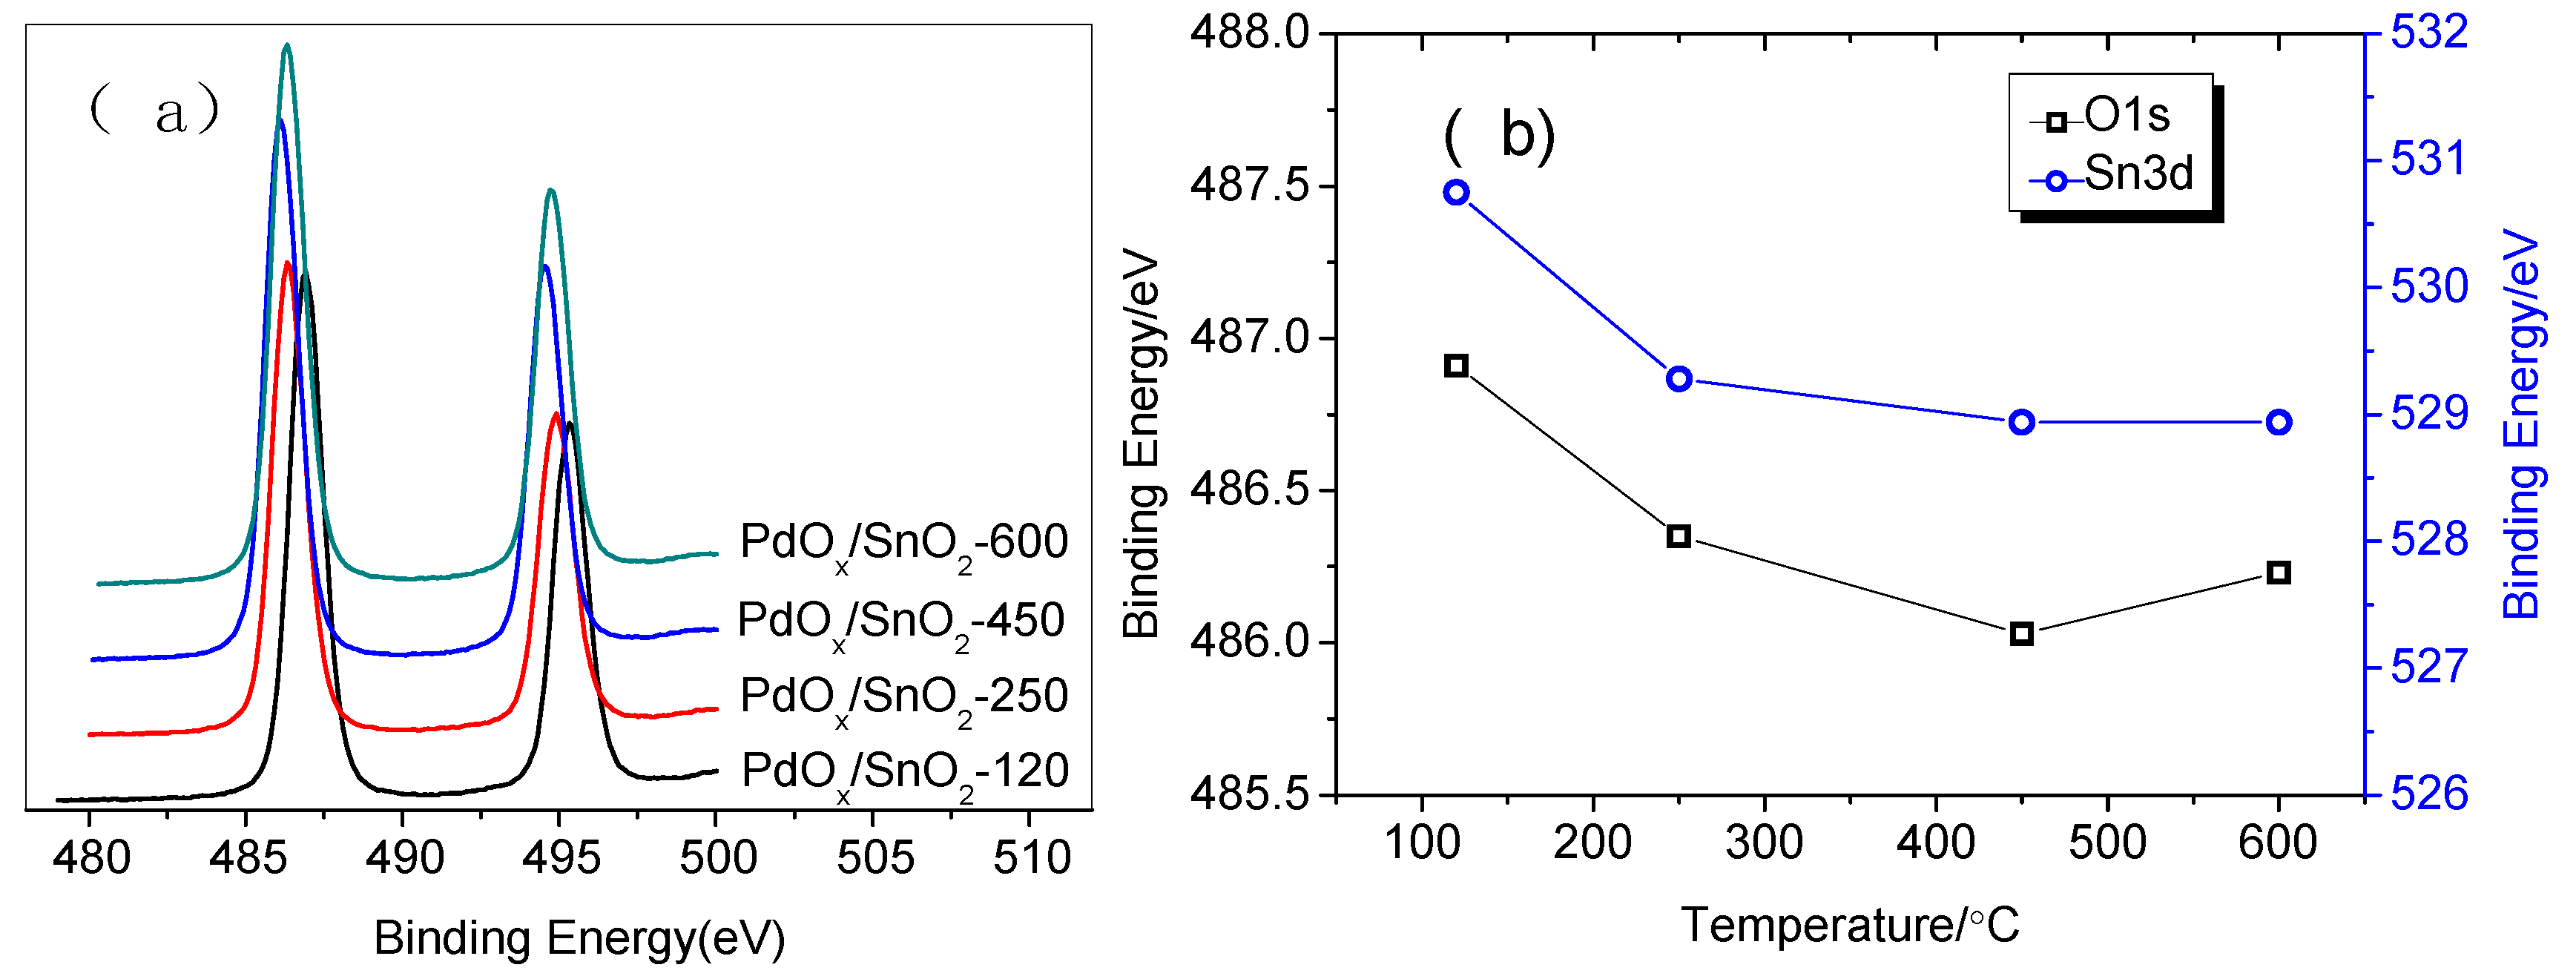
Figure 5 shows the variation of the Sn 3d (a) binding energy (BE) of the PdCl2/SnO2 nanoparticles with the different annealing temperature. As shown in Figure 4b, the two BEs have the same tendency, which indicates that the BE of Sn 3d3/2 and O 1s decreases with increasing temperature, the value of Sn is 1.92 eV, the value of O is 1.82 eV, and the oxygen in SnO2 loses electrons. As a result, the Fermi level shifts and bends upward, forming a depletion layer.
3.3. H2 Sensing Characteristics of PdOx/SnO2 Composites
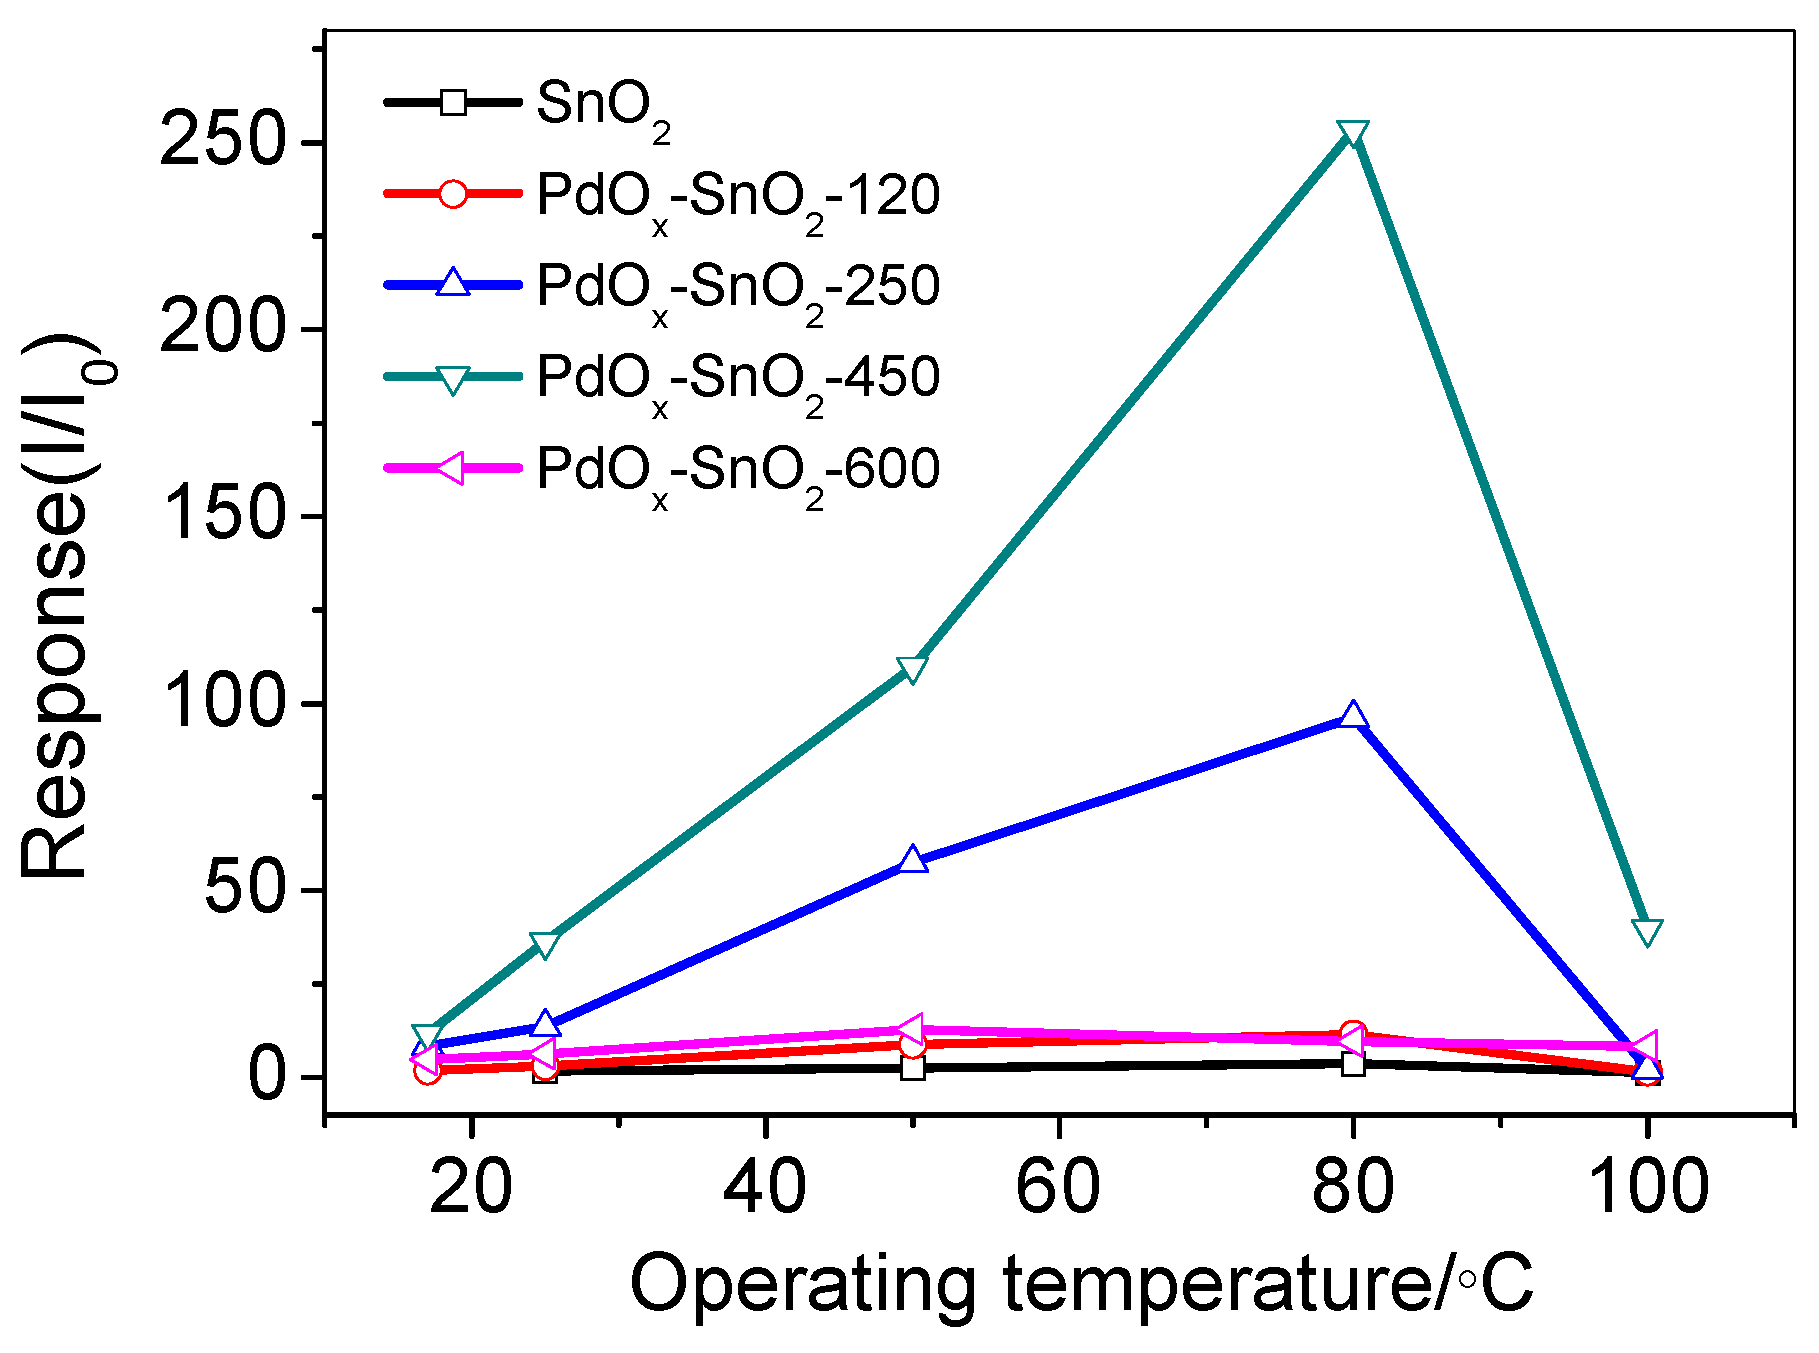
To determine the optimum operating temperature, we tested the response of Pd-doped SnO2 gas sensors at different operating temperatures. The response of the material to 100 ppm H2 was tested at 25, 50, 80 and 100 °C and the results are shown in Figure 6. As the operating temperature increases, the response of the Pd-doped SnO2 first increases and reaches a maximum at 80 °C, whereas the temperature continues to increase, and the sensitivity is reduced. This is caused by the gas adsorption/desorption process on the sensor surface of Pd-doped SnO2. When the working temperature rises to a certain temperature, the desorption rate of the gas increases, resulting in a decrease in sensitivity. At different annealing temperatures, there is a similar trend.
Normally, the reactivity between the target gas and adsorption oxygen needed certain activation energy, which was provided by increasing the work temperature. Since the Pd nanoparticles have a catalytic effect, the activation energy is lowered, thus the optimum working temperature is lowered to 80 °C. As the temperature increases, the diffusion rate of gas molecules increases, and it is easier to react with gas-sensitive materials. In addition, at high temperatures, due to a large decrease in adsorbed oxygen, the grain boundary barrier decreases and the conductance increases, so that the resistance change decreases when contacted with H2. The gas sensitivity performance is declining. In the experiments, the following sensing characteristic of Pd-doping SnO2 was tested at the optimal operating temperature (80 °C).
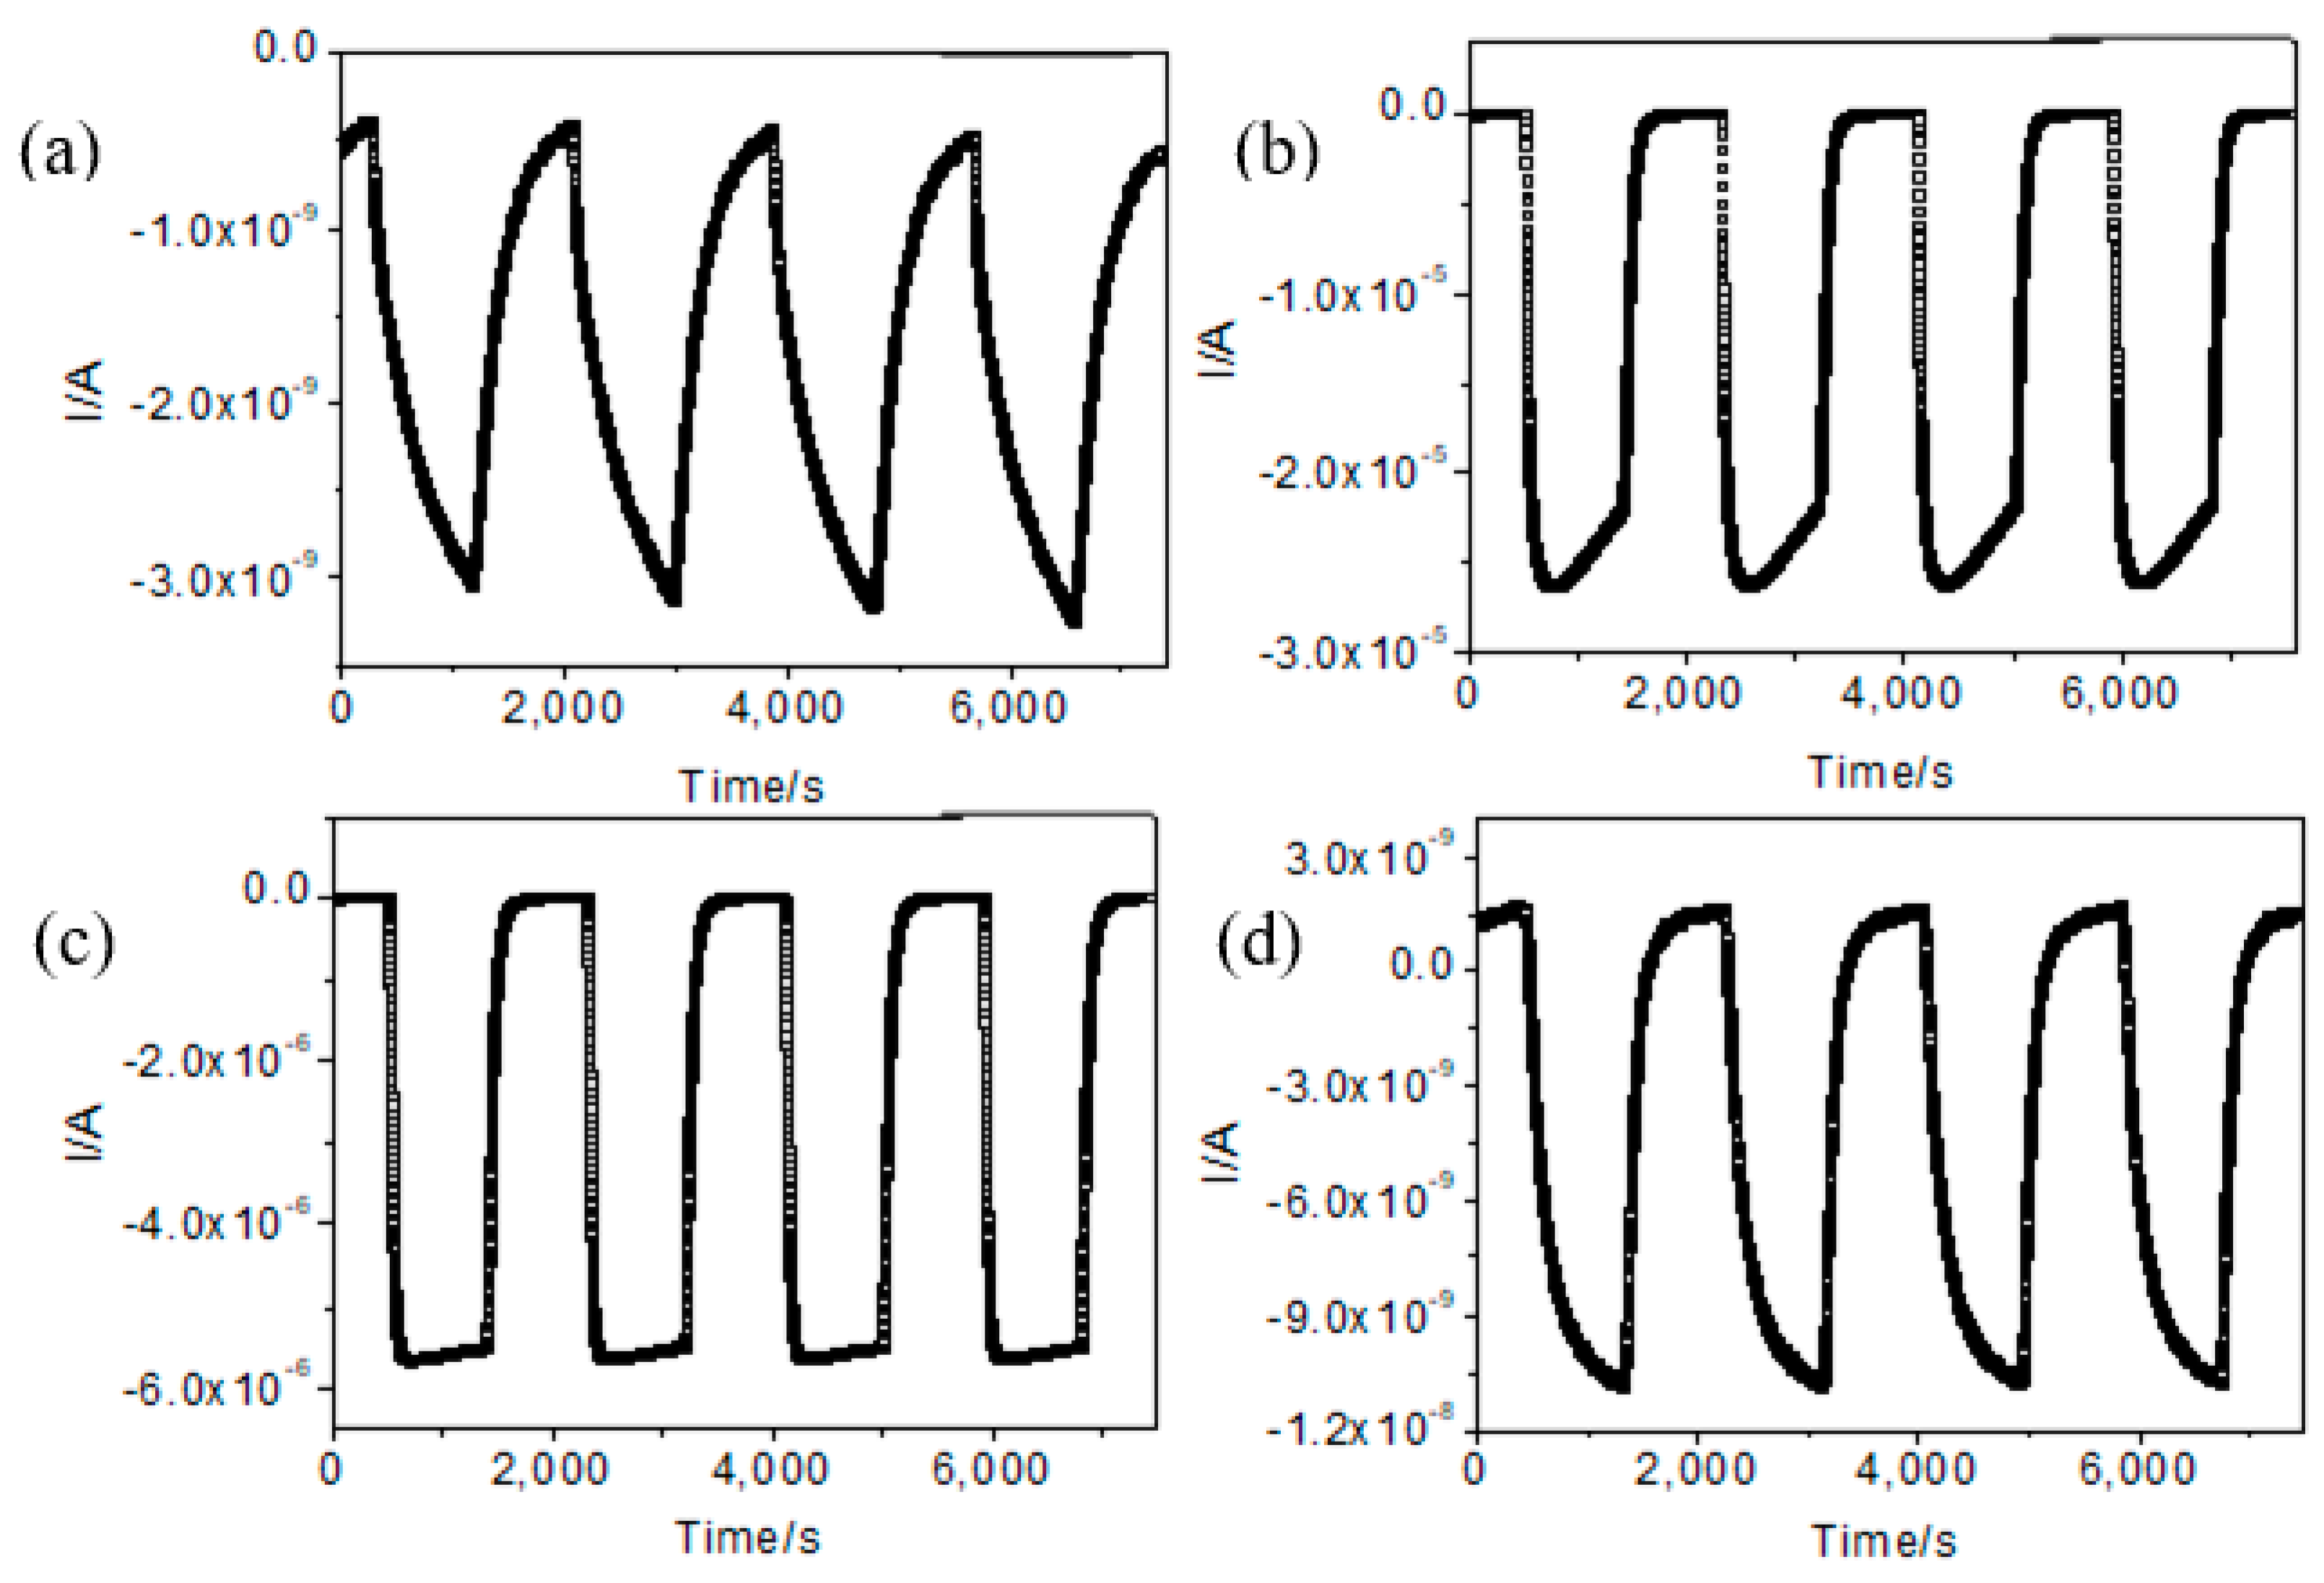
The sensor is annealed from 120 °C to 600 °C, showing a high corresponding sensitivity. The results of four reproducibility tests performed at the optimum operating temperature are shown in Figure 7, indicating that the sensor has good repeatability and stability.
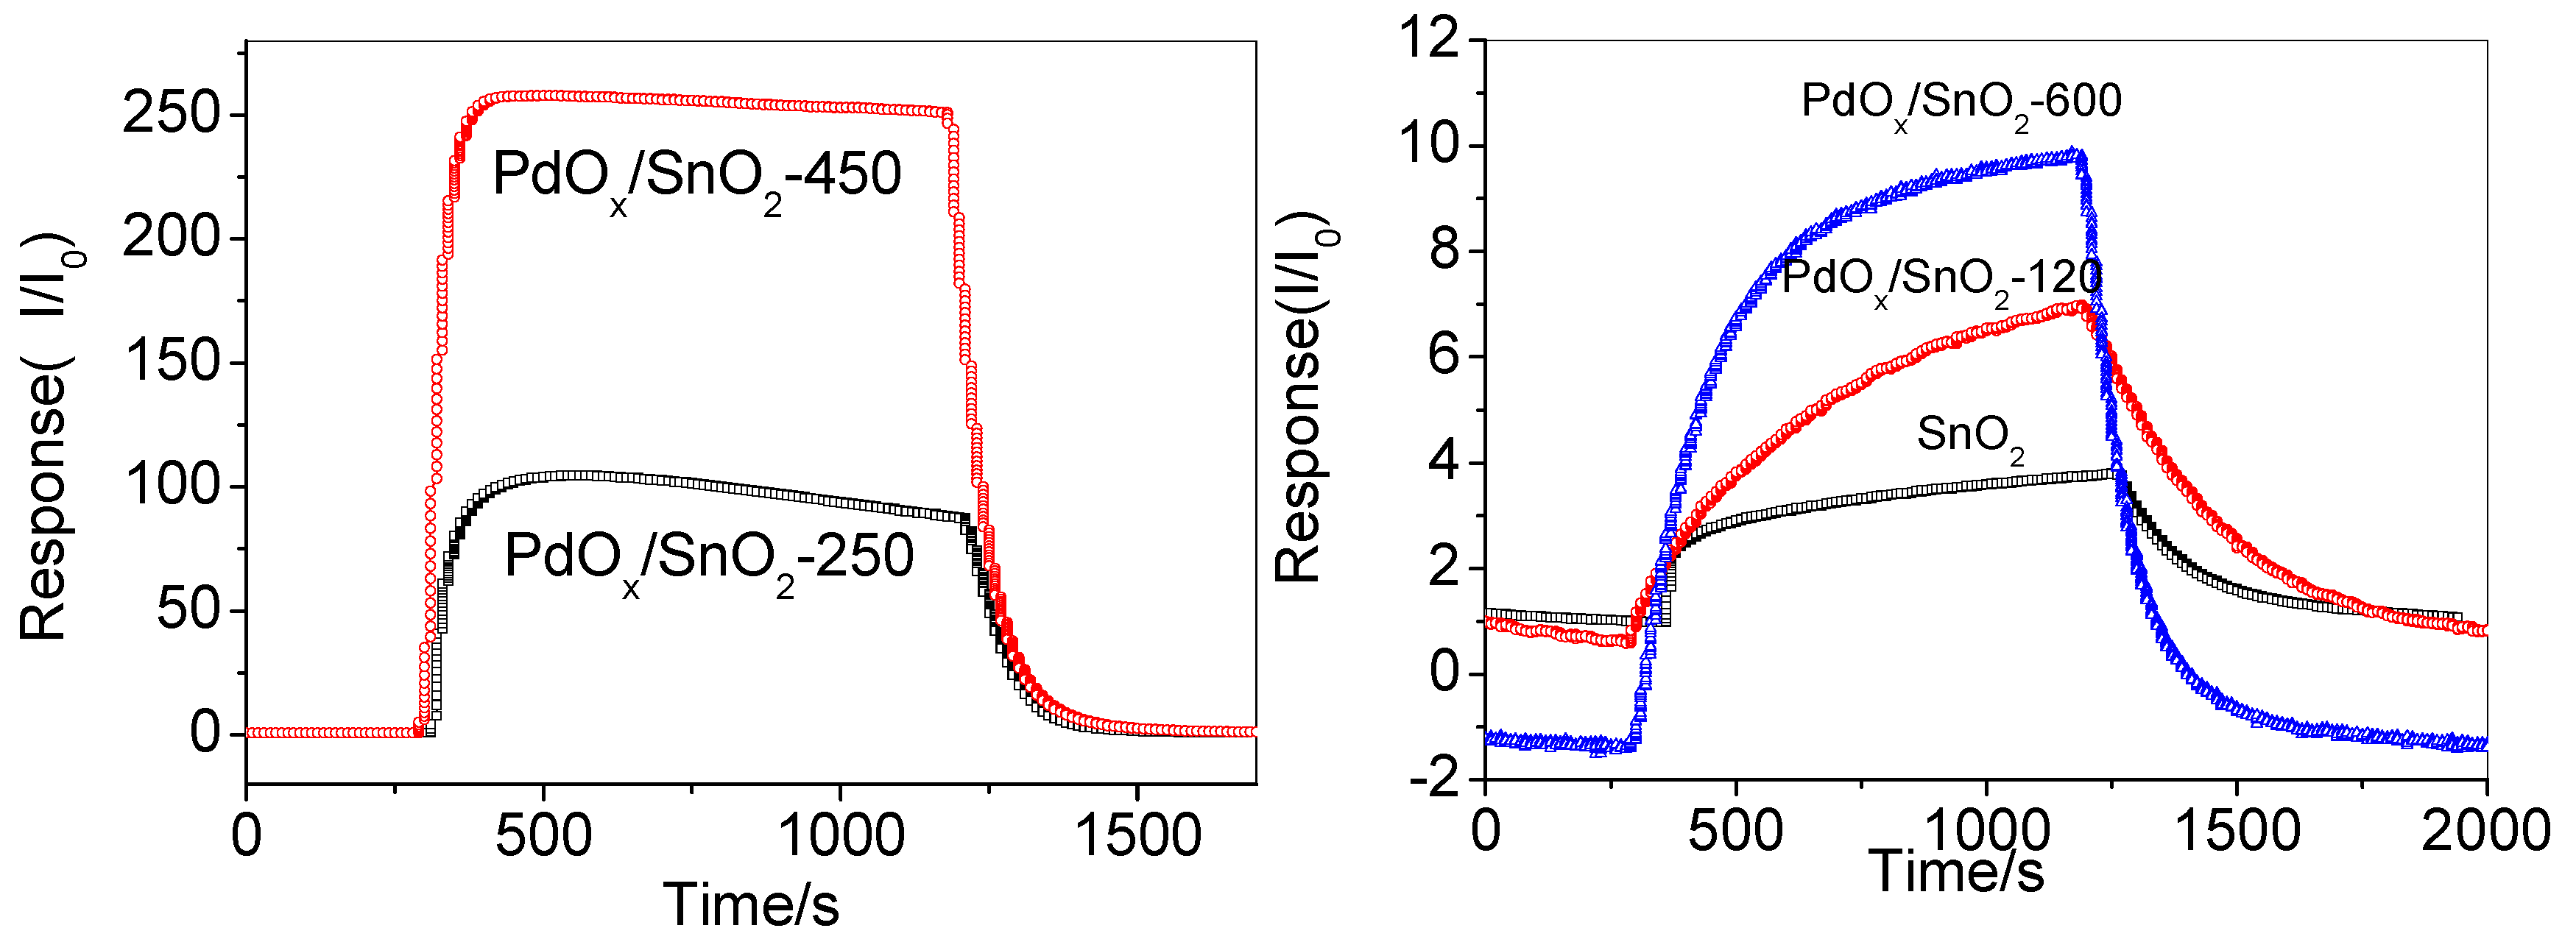
The response recovery time is also one of the important parameters for evaluating the gas sensor, as shown in Figure 8. Gas sensing materials are often required to have fast response and recovery characteristics in applications. We can see that the response time is similar as 100 s at PdOx/SnO2-120, -250, -450, and the response time at PdOx/SnO2-600 is slower than the others. The recovery time is faster at higher temperature than those in lower temperature (from 120 °C to 450 °C). The recovery times were 340 s and 185 s for the sensor based on annealing temperature at 120 °C and 250 °C, respectively, and 140 s for the sensor based on annealing temperature at 450 °C. Moreover, the recovery time of annealing temperature at 600 °C is 290 s that is not better than lower temperature. It can be seen that when hydrogen is introduced, the resistance of the sensor is reduced and then the steady state is reached. The nanostructures provide a larger specific surface area that can speed up the adsorption and desorption processes, which shorten response and recovery time.
Figure 8 also demonstrates that the sensitivity of the PdOx/SnO2 at the different annealing temperature. The sensitivity of sensor at 450 °C is higher than the others. These features are produced by the influence of grain boundaries between the nanoparticles. In XRD, we know that the crystallite size is decreasing as the annealing temperature is increasing. By studying the effect of grain size on the sensitivity of the H2 sensor, it is found that the larger the particle size of the nano-gas sensitive material, the lower the sensitivity.
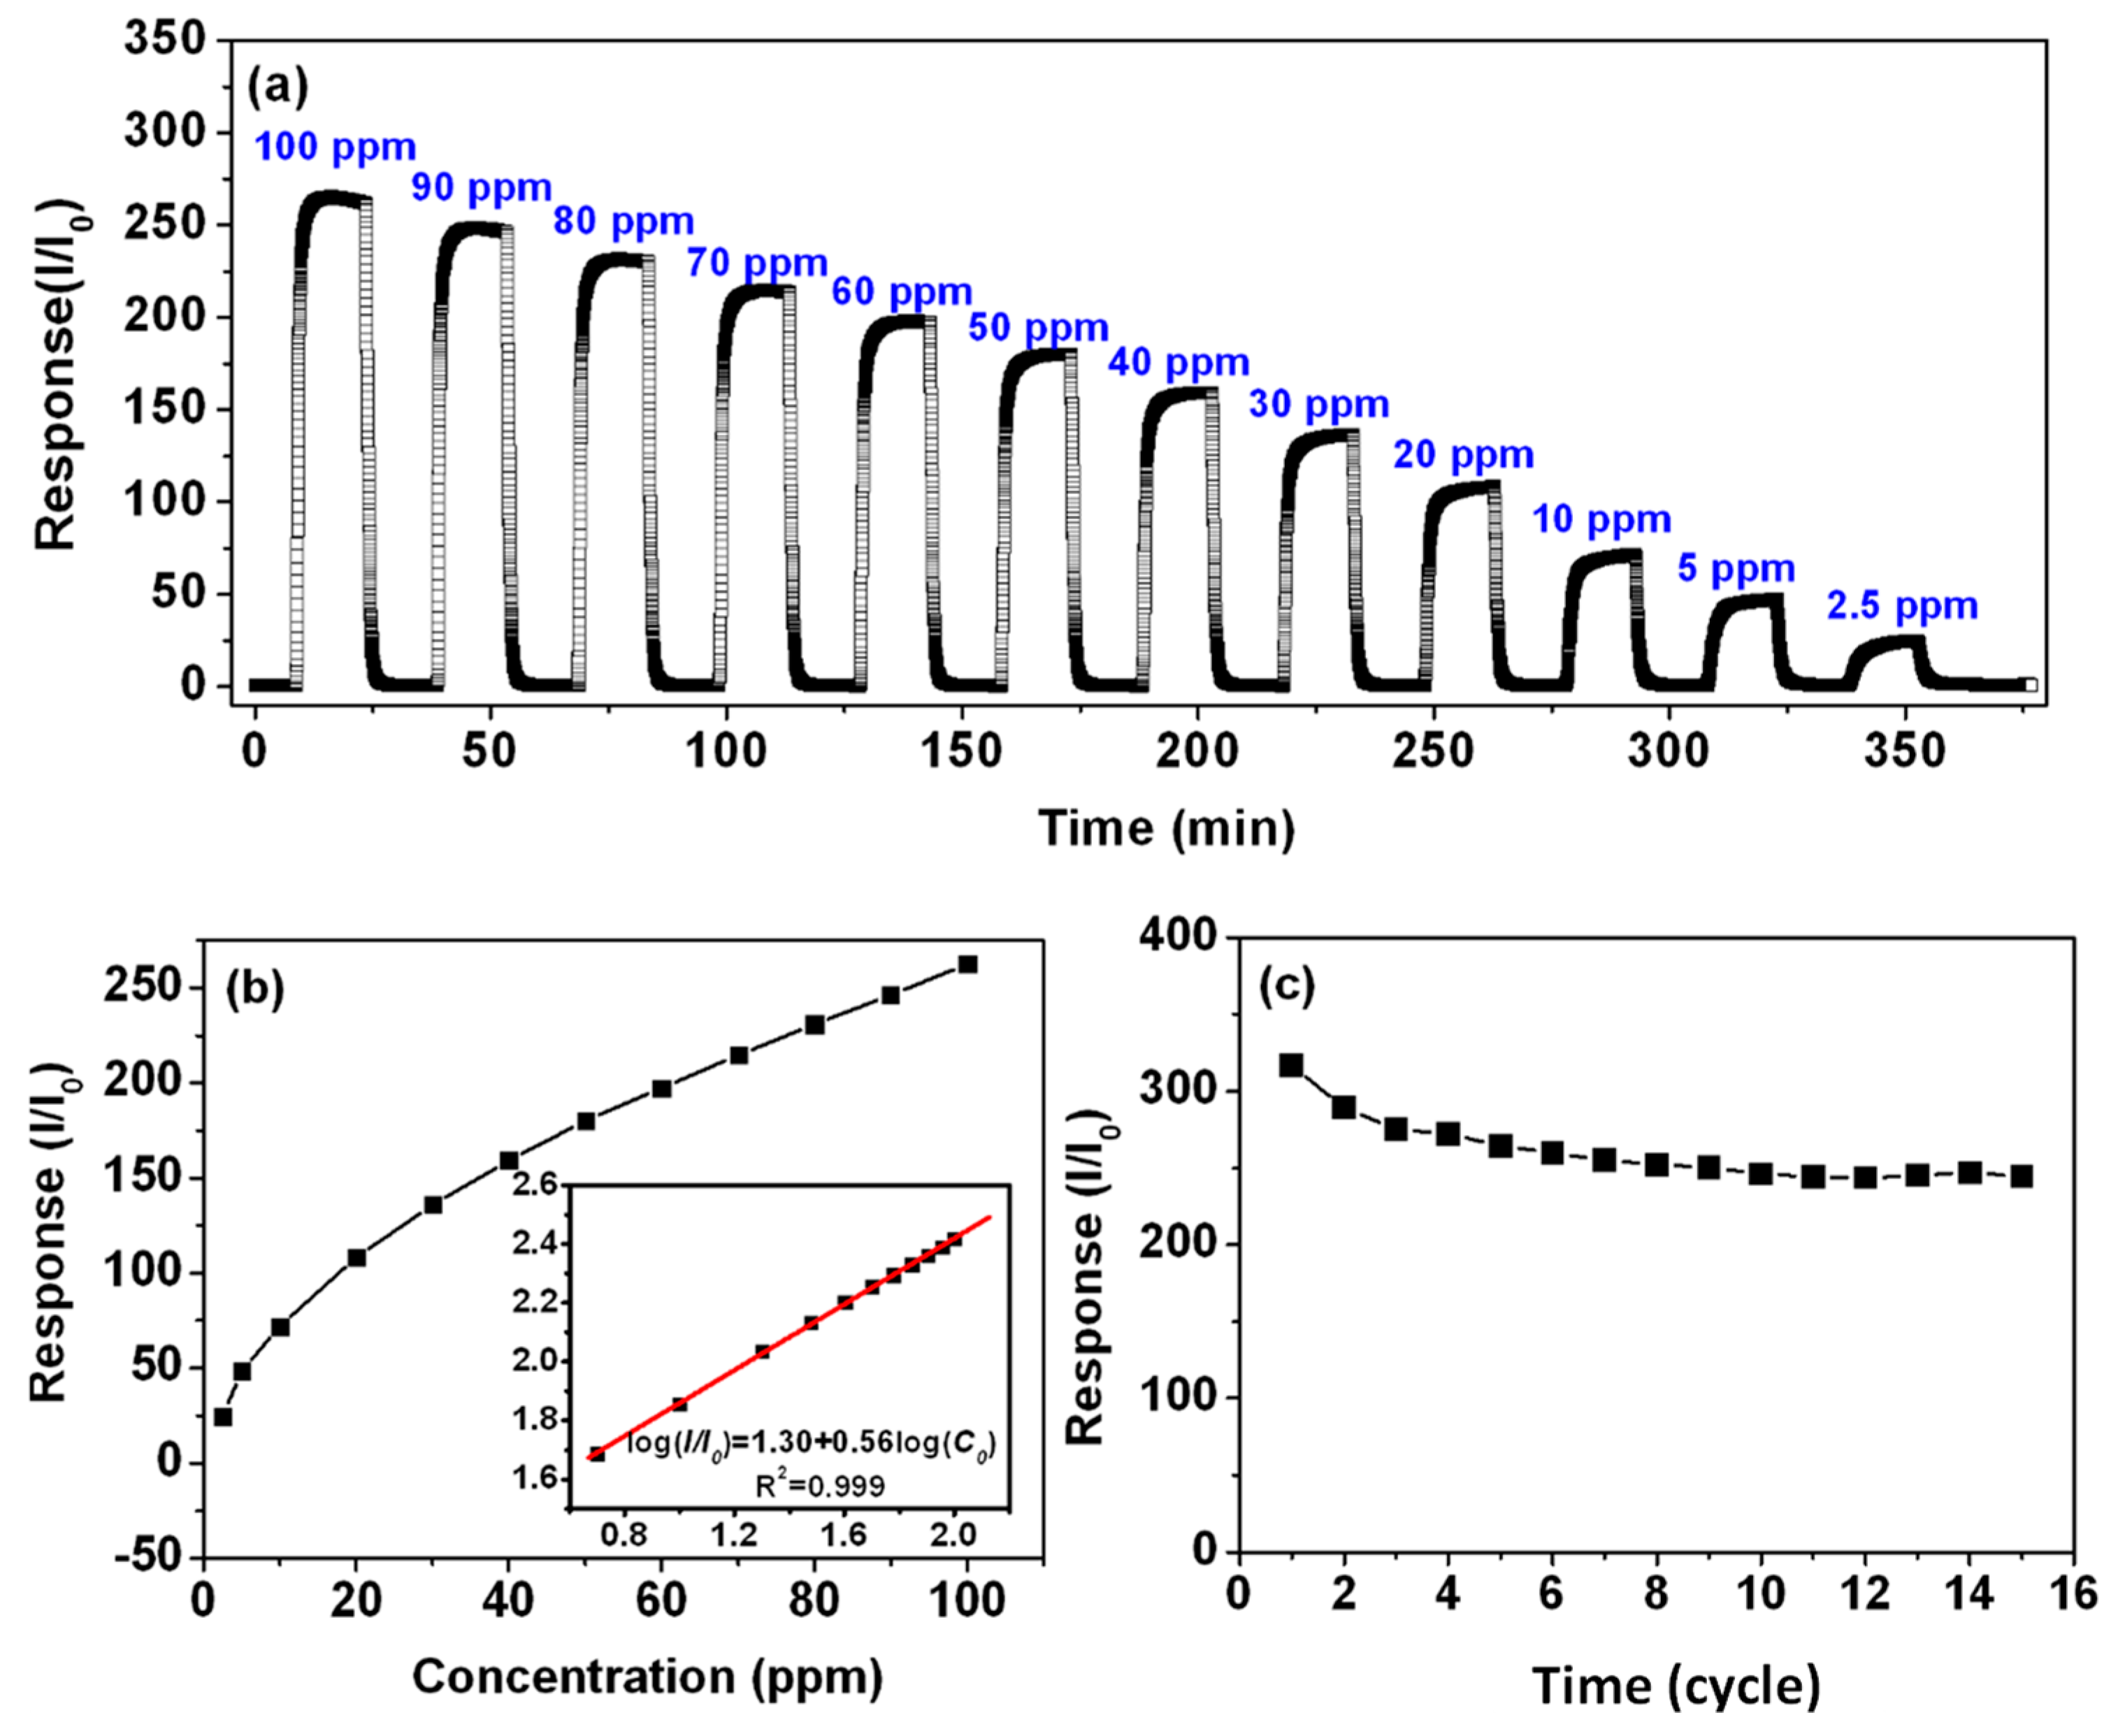
Figure 9a shows that the response of PdOx/SnO2 to different concentrations of H2 in air. The sensor chips were tested at an optimum temperature of 80 °C It can be found that the sensor show strong responses from 2.5 ppm to 100 ppm. Figure 9 shows that as the H2 concentration increases, the response sensitivity increases. When exposed to H2, the mechanism is that hydrogen converted to atomic hydrogen at the material interface, causing the current signal to change.
The corresponding sensitivity can be obtained from the slope of the standard curve and the gas concentration. This result indicates that the sensitivity is related to the adsorption of H2 molecules on the surface of the gas sensing material.
The response stability of the PdOx modified SnO2 gas sensor to 100 ppm H2 was tested at 80 °C with 15 cycles (Figure 9c). As the number of times increases, the sensitivity decreases and gradually reaches a steady state. This may be due to the deposition of some contaminants on the sensor surface after the first few cycles. Obviously, Pd decorated SnO2 has good stability and can be used in various practical applications.
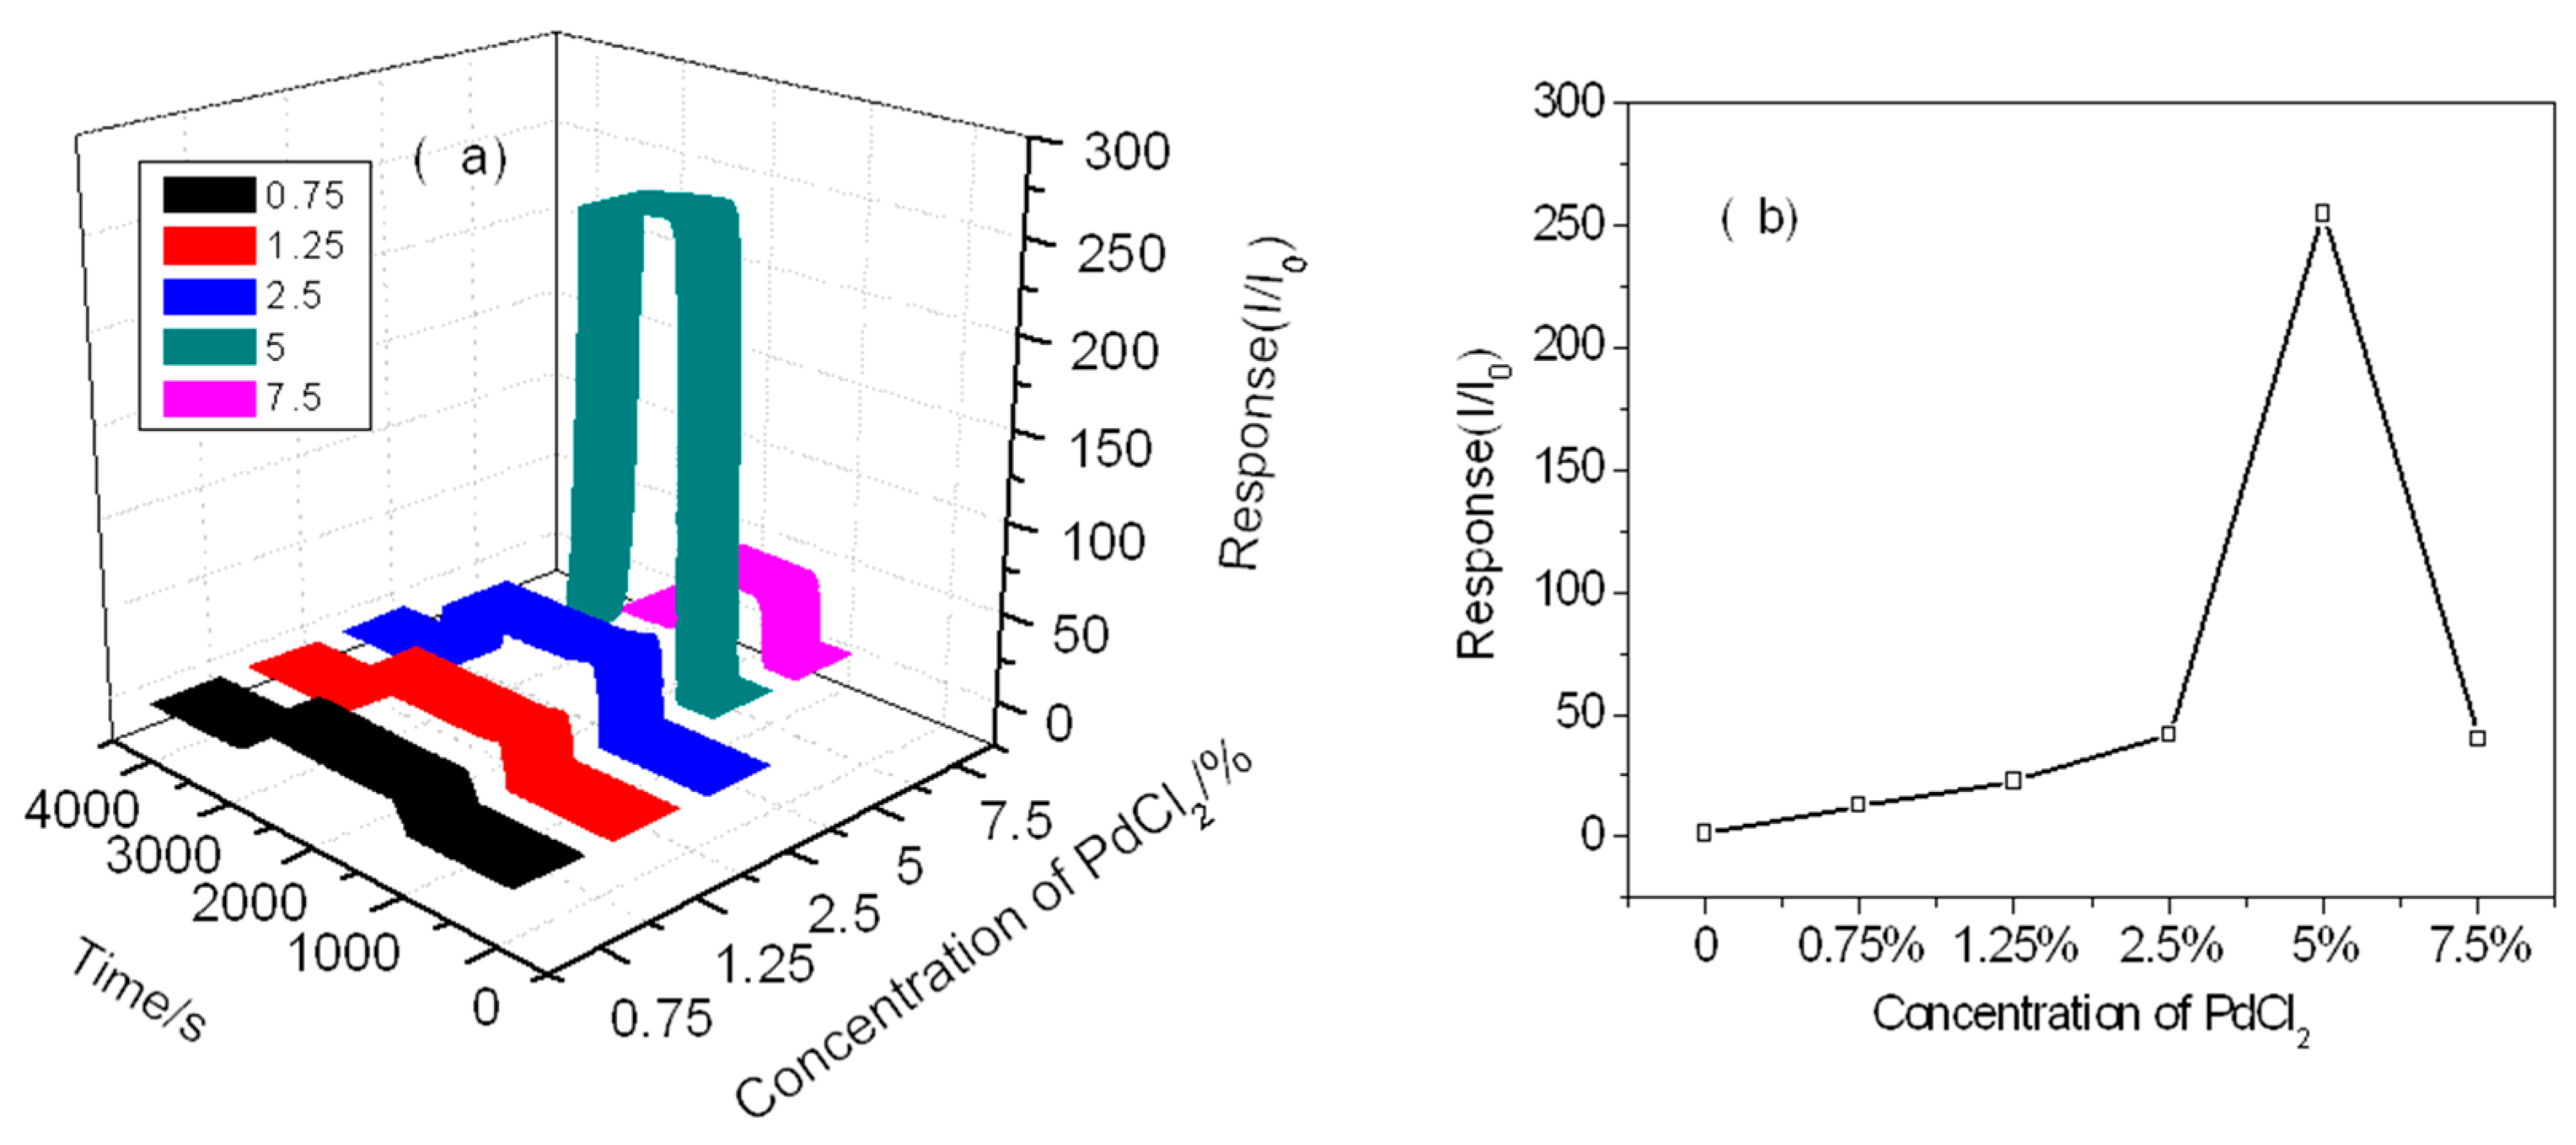
We investigated the gas response characteristics of the sensor to different concentrations of PdOx loaded SnO2 at its optimum operating temperature. Sensors of 0.75 wt%, 1.25 wt%, 2.5 wt%, 5 wt%, and 7.5 wt% PdCl2 supported SnO2 were prepared and annealed at 450 °C. The results are shown in Figure 10, where the change in sensitivity indicates that the corresponding performance is highly correlated with the Pd loading amount. We can see that the 5.0% by weight load sensor more sensitive to hydrogen than other concentrations of PdCl2. Because of more PdOx is on the surface of SnO2, the stronger reaction captures electrons and generates an electron depletion layer on the surface of SnO2. The higher loading of Pd leads to its full coverage on the surface of SnO2, which reduces the contact between gas and SnO2. The effect of PdOx greatly exceeds the influence of SnO2 bulk material, so that the performance of SnO2 itself can’t be fully reflected, and therefore the sensitivity decreases.
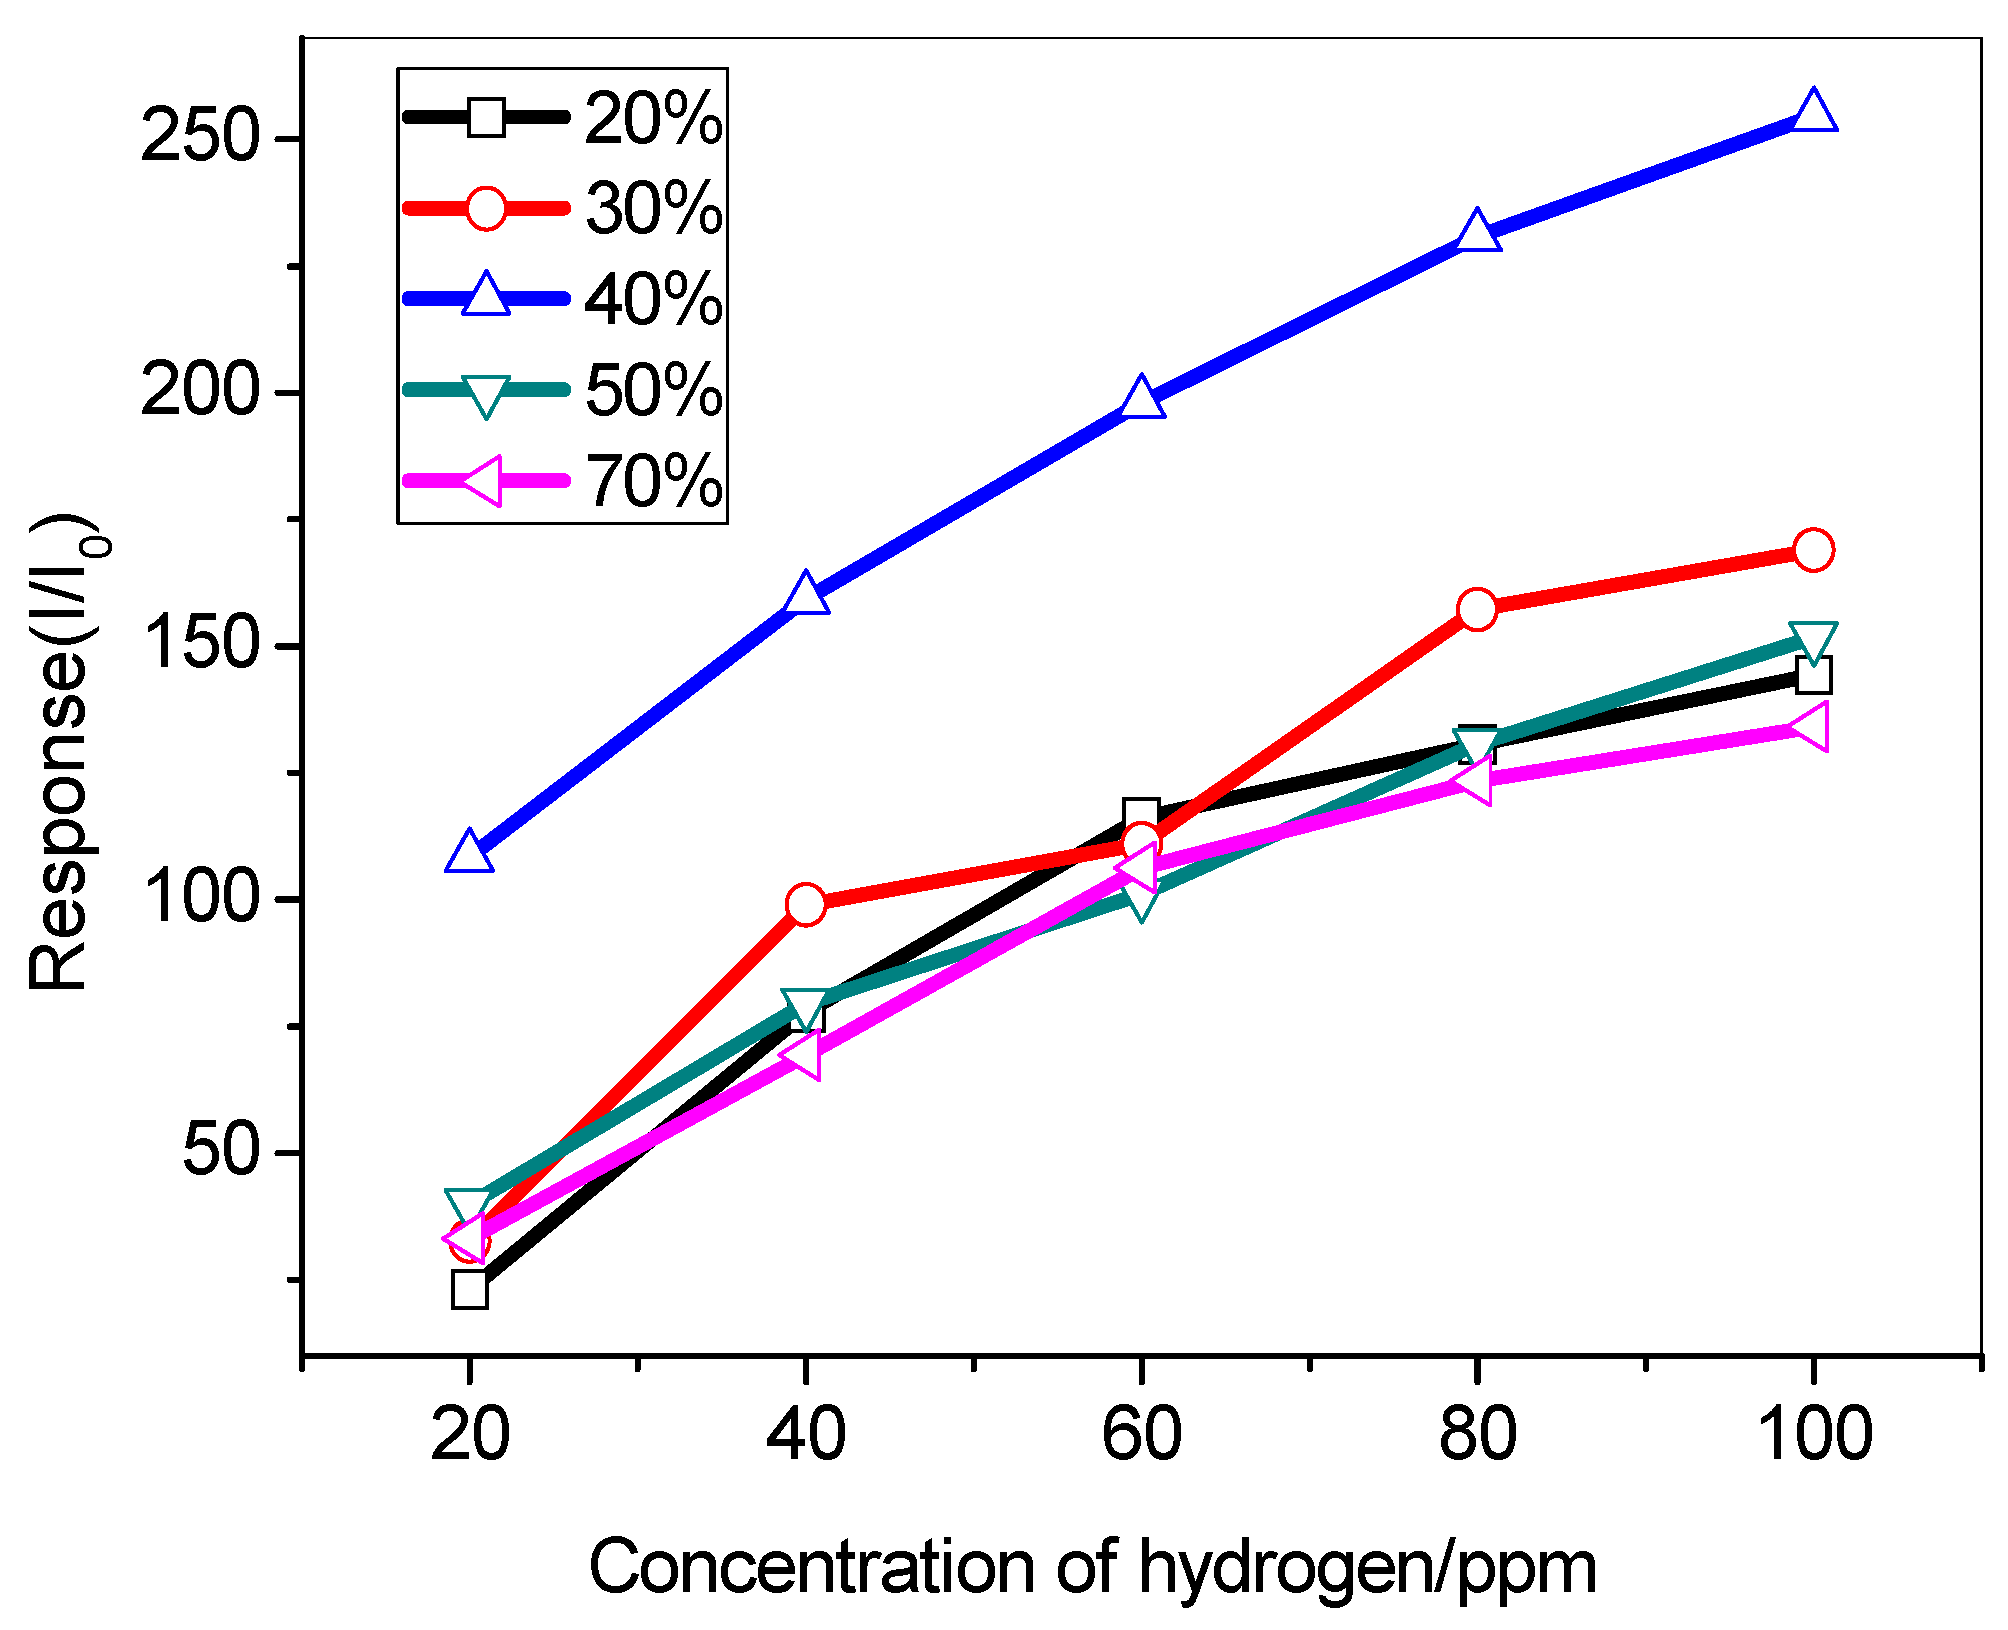
Figure 11 shows the experimental results of the effect of humidity on the H2 sensitivity. We have performed sensor response tests of Pd/SnO2-450 under relative humidity from 20% to 70% conditions. The sensitivity changed significantly in different humid environments. It can be showed that Pd/SnO2-450 has less sensitivity in low and high relative humidity at an operating temperature of 80 °C, while the corresponding sensitivity to 100 ppm H2 is highest at 40% humidity. This is that water vapor increases the electron concentration of Pd/SnO2-450, thereby increasing oxygen absorption. When the relative humidity is further increased, the sensitivity starts to decrease, which is caused by the synergistic competition between H2 and water vapor.
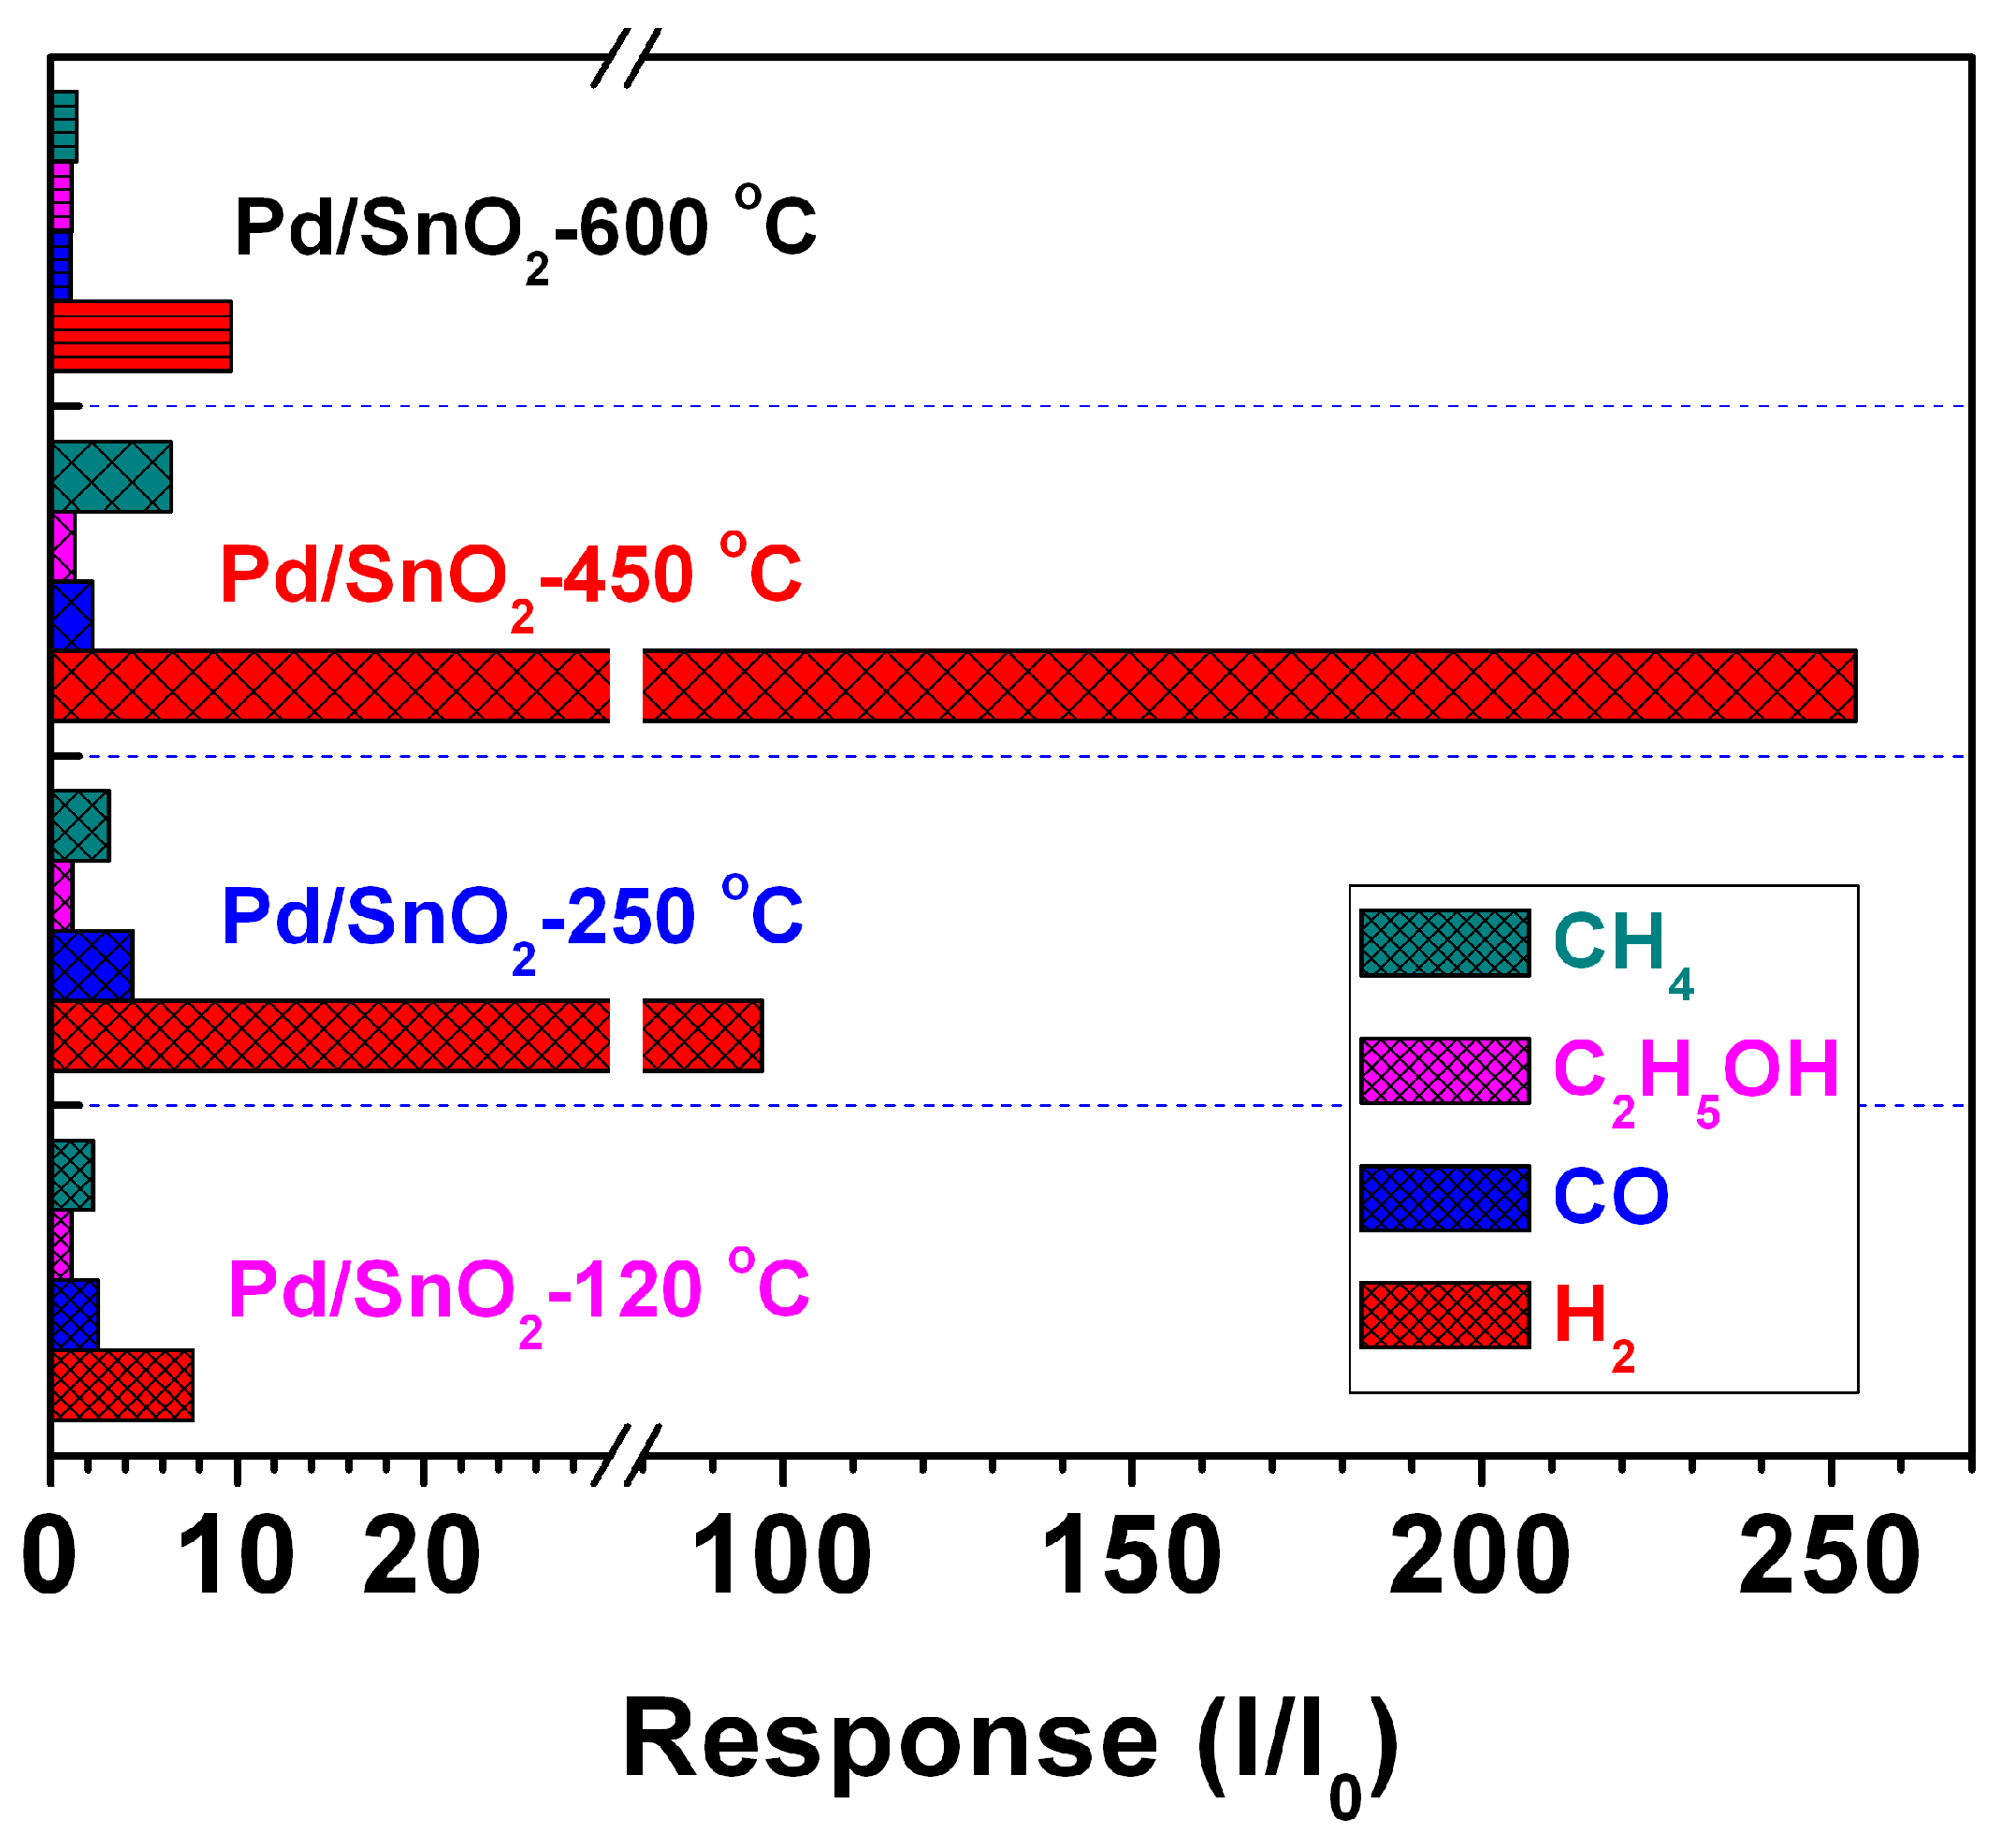
The selectivity of the gas sensor is another important parameter for assessing the sensing capabilities of gas sensing materials. The gas selection performance of the material was obtained by testing the sensitivity of PdOx-doped SnO2 to 100 ppm different kinds of gases. The testing gases include hydrogen (H2), ethanol (EtOH), carbon monoxide (CO) and methane (CH4). As can be seen from Figure 12, the Pd-doped SnO2 gas sensor exhibits significantly higher response sensitivity to H2 and a smaller change to other gases. Therefore, we believe that the gas sensor has good selectivity for H2.
3.4. Sensing Mechanism
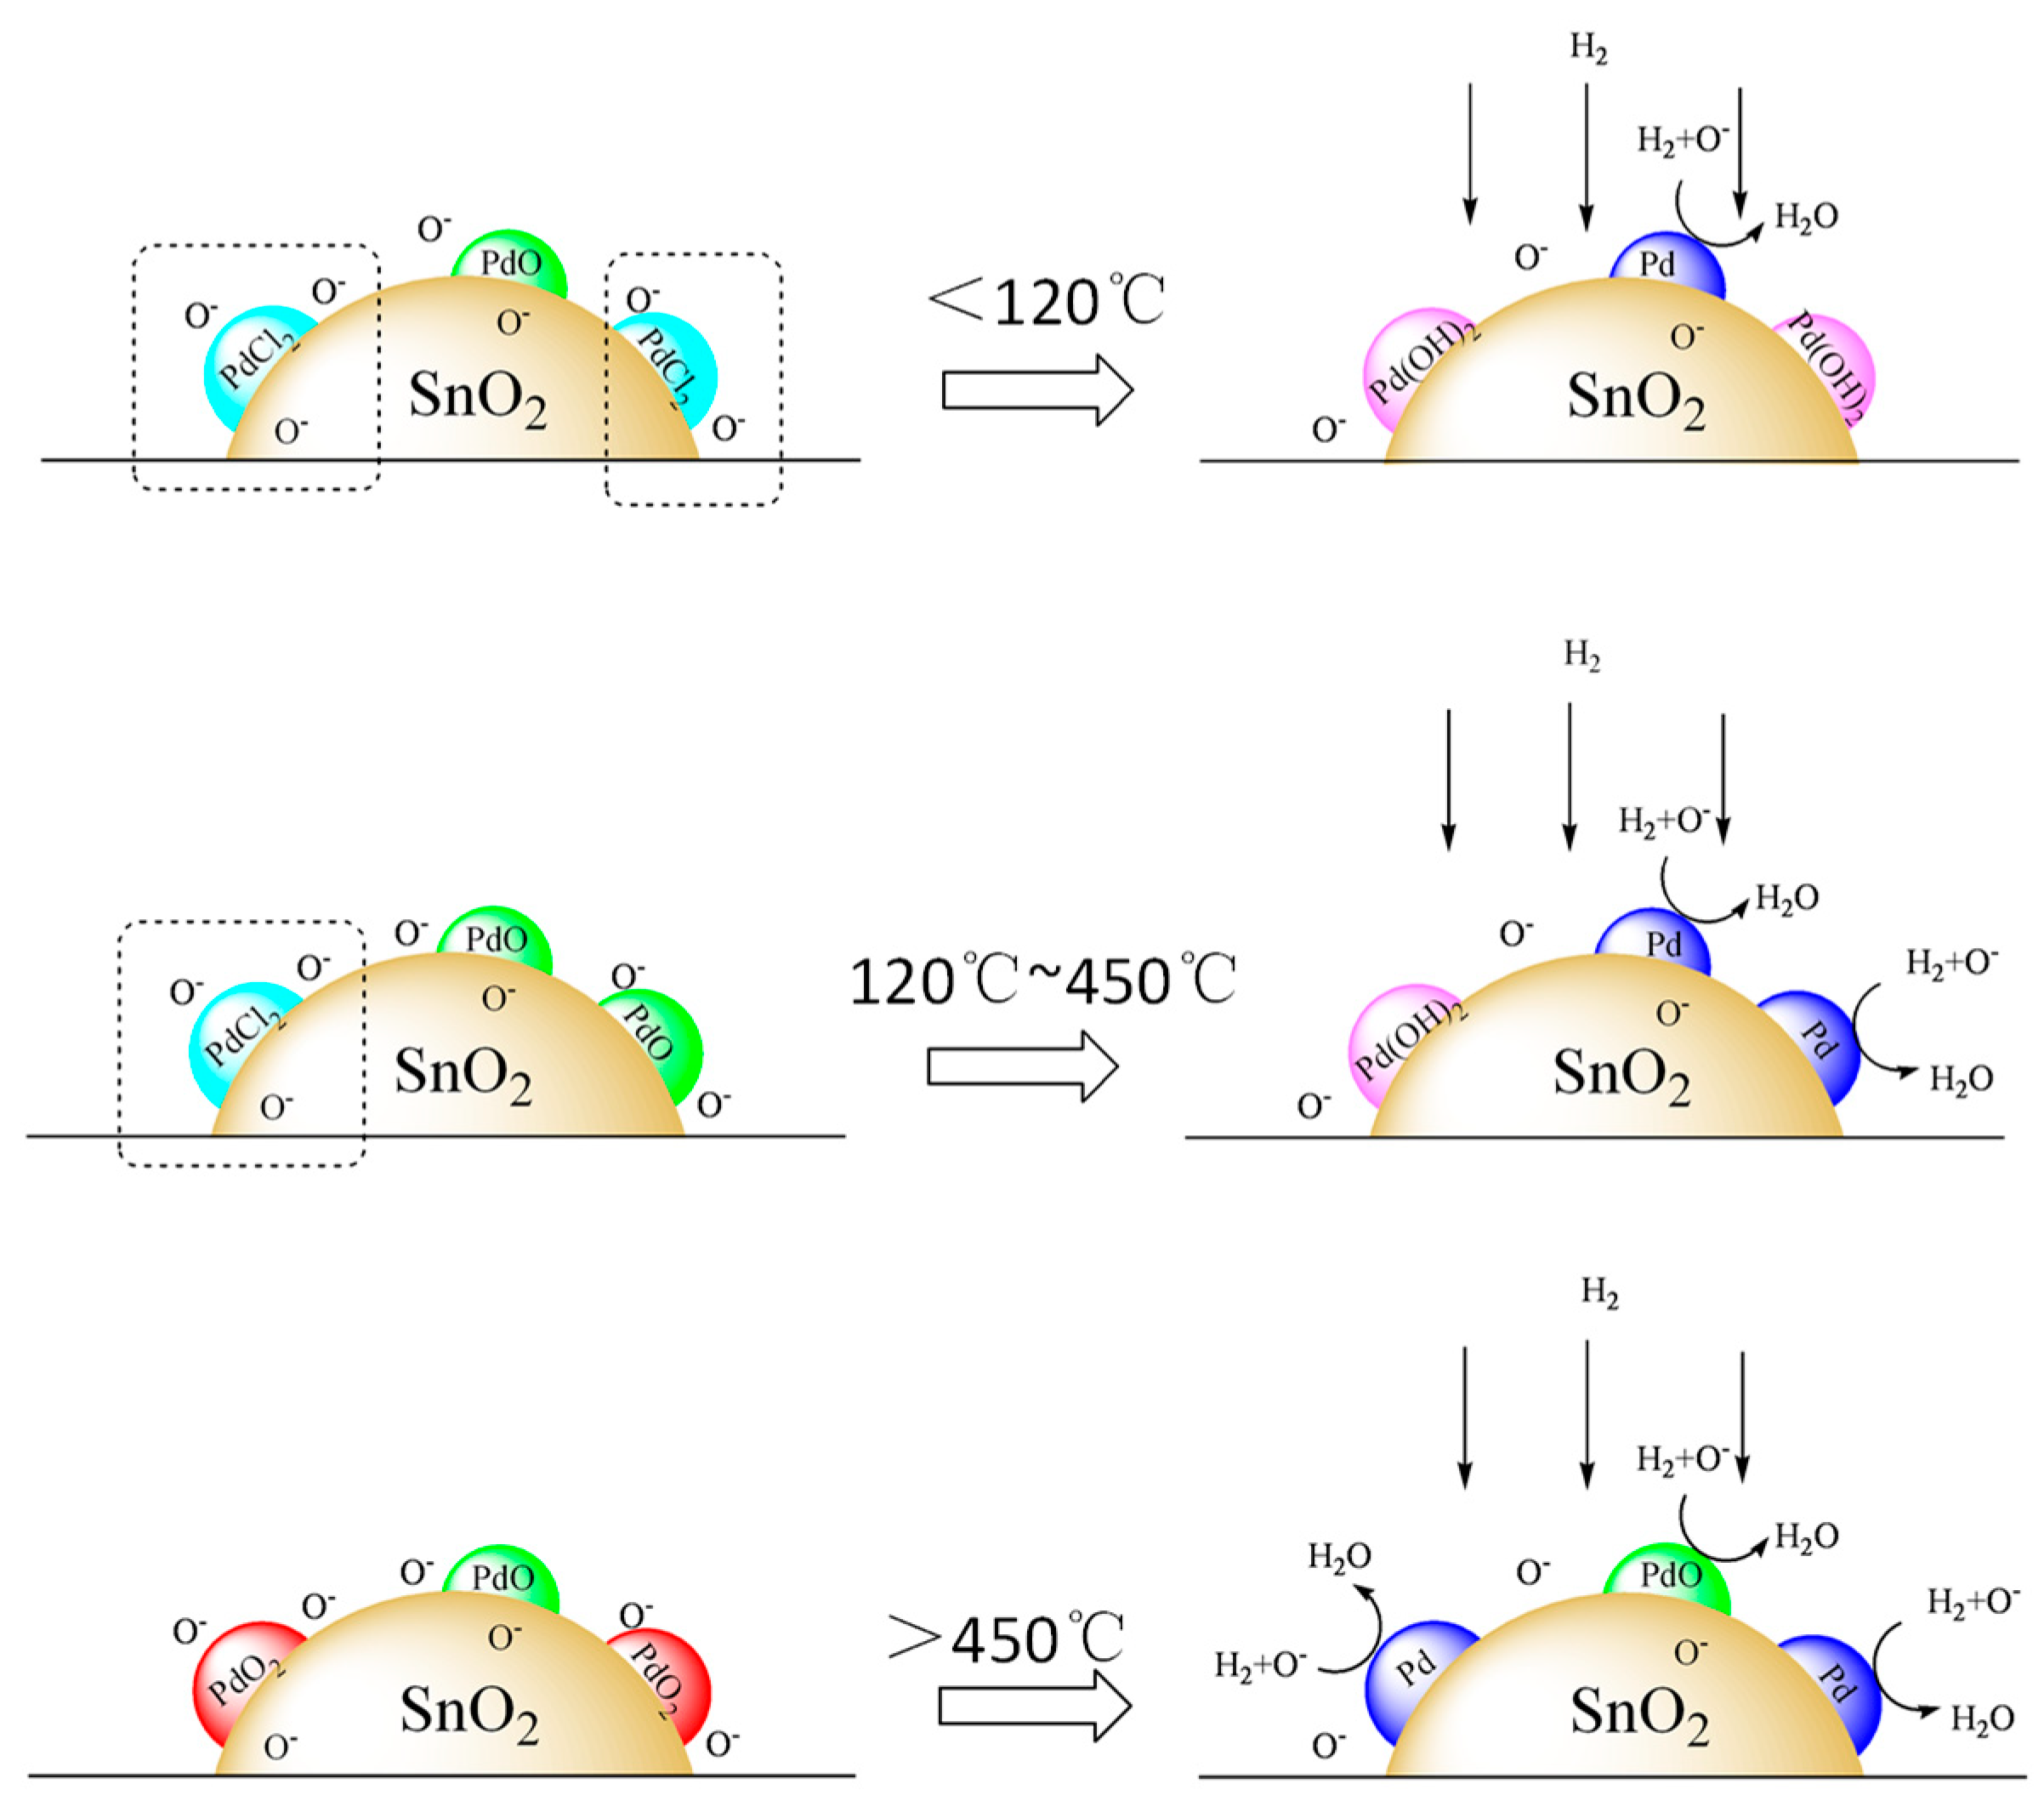
The sensing mechanism of semiconductor material sensors is based on semiconductor oxygen vacancy reactions. In air, due to the difference in temperature, molecular oxygen may exist in the form of O2−, O− or O22−, etc., and oxygen forms an electron depletion layer by depleting electrons on the surface of the material to lower the electrical conductivity. When the palladium atom acts as a catalyst, its function is to dissociate oxygen on the surface of SnO2, thus increasing the overflow of oxygen from the surface of SnO2 to obtain a greater amount of electrons and thereby increasing sensor sensitivity [24,25,26]. In addition, in order to increase the conductivity, the palladium atom can be divided into two processes. First, hydrogen molecules dissociate into hydrogen atoms on the surface of Pd, and then hydrogen atoms adsorbed at moderate temperatures act as donors, providing additional electrons to the material and inducing a cumulative layer.
With increasing the annealing temperature, different chemical states of Pd doped SnO2 complex materials were obtained (Figure 13). The Pd2+ additive on SnO2 substrate is reduced to a Pd metal, which plays an important sensitivity role in hydrogen and leads to change of conductivity. But partial PdCl2 of the sensor on a low annealing temperature was hydrolyzed to Pd(OH)2 in wet air and it is generation of [PdCl4]2− in different pH. From the potential of the reduction reaction, we know that Pd(OH)2 and [PdCl4]2− are more difficult to reduce to catalytic Pd metal than Pd2+. So the sensitivity of the sensors at a low annealing temperature is worse than the high annealing temperature.
| Pd2+ + 2e→Pd | φ = 0.915 V. |
| Pd(OH)2 + 2e→Pd + 2OH− | φ = 0.07 V |
| [PdCl4]2− + 2e→Pd+ 4Cl− | φ = 0.621 V |
It is deduced that Pd4+ is the key factor to promote the sensitivity. Basing on the valence electron layer structure of platinum group metals, the stability of high-valent Pd(Ⅳ) is lower than Pd(Ⅱ). So the conversion of Pd4+ is easier. On the high annealing temperature, the proportion of PdO2 is increasing. This is one of the reasons why sensor chips at high annealing temperatures have better gas sensitivity. In addition, while increasing the annealing temperature, the sensitivity performance was stronger because of the unpreventable decrease of the grain sizes. In our study, when the annealing temperature is higher than 600 °C, the gas sensitivity is reduced in contrast. The detailed mechanism of different Pd chemical states doping SnO2 affecting the performance of the sensor still needs further investigation.
4. Conclusions
In conclusion, SnO2 nanoparticles loaded with PdOx at different annealing temperatures have been systemically studied for H2-sensing applications. XPS and XRD were used to study elements analysis and crystalline sizes changes that accompany the different chemical states phase transformation. The sensor chips were produced by coating with as-preparation Pd-doped SnO2 materials, with preformed interdigitated planar heatertype sensor electrodes. In particular, the different annealing temperature Pd loaded SnO2 film had a good stability and exhibited the best H2-sensing performances, which were increased by a factor of 15 at an optimum operating temperature of 80 °C. In addition, different annealing temperature Pd/SnO2 complex materials show much higher H2 selectivity against CO, CH4 and CH3CH2OH. Compared with annealing temperature at 120 °C, 250 °C, 450 °C and 600 °C, the 450 °C showed enhanced H2 sensing properties, such as a higher response (260–100 ppm H2), rapid response/recovery time, and good selectivity and stability. The sensing behavior of the sensor can be understood simply by the potential of the reduction reaction and the oxygen ionosorption model. PdO and PdO2 play important roles in modifying SnO2 by means of H2 adsorption on the sensor chips.
Author Contributions
Conceptualization, J.S. and X.Y.; methodology, validation and investigation, T.Q. and F.Y.; data curation and writing—original draft preparation, T.Q.; writing—review and editing and project administration, J.Z.
Funding
This research received no external funding
Conflicts of Interest
The authors declare no conflict of interest.
References
- Ling, C.; Xue, Q.; Han, Z.; Lu, H.; Xia, F.; Yan, Z.; Deng, L. Room temperature hydrogen sensor with ultrahigh-responsive characteristics based on Pd/SnO2/SiO2/Si heterojunctions. Sens. Actuators B 2016, 1, 438–447. [Google Scholar] [CrossRef]
- Ayesh, A.I.; Mahmoud, S.T.; Ahmad, S.J.; Haik, Y. Novel hydrogen gas sensor based on Pd and SnO2 nanoclusters. Mater. Lett. 2014, 128, 354–357. [Google Scholar] [CrossRef]
- Wang, C.; Zeng, W.; Luo, L.; Zhang, P.; Wang, Z. Gas-sensing properties and mechanisms of Cu-doped SnO2 spheres towards H2S. Ceram. Int. 2016, 8, 10006–10013. [Google Scholar] [CrossRef]
- Su, P.; Yang, L. NH3 gas sensor based on Pd/SnO2/RGO ternary composite operated at room-temperature. Sens. Actuators B 2016, 223, 202–208. [Google Scholar] [CrossRef]
- Sa´aedi, A.; Yousefi, R.; Jamali-Sheini, F.; Zak, A.K.; Cheraghizade, M.; Mahmoudian, M.R.; Baghchesara, A.B.; Dezaki, A.S. XPS studies and photocurrent applications of alkali-metals-doped ZnO nanoparticles under visible illumination conditions. Phys. E 2016, 79, 113–118. [Google Scholar] [CrossRef]
- Lee, D.; Kim, Y.T.; Huh, J.; Lee, D. Fabrication and characteristics of SnO2 gas sensor array for volatile organic compounds recognition. Thin Solid Films 2002, 416, 271–278. [Google Scholar] [CrossRef]
- Van Duy, N.; Toan, T.H.; Hoa, N.D.; Van Hieu, N. Effects of gamma irradiation on hydrogen gas-sensing characteristics of Pd-SnO2 thin film sensors. Int. J. Hydrogen Energy 2015, 40, 12572–12580. [Google Scholar] [CrossRef]
- Lim, C.B.; Oh, S. Microstructure evolution and gas sensitivities of Pd-doped SnO2-based sensor prepared by three different catalyst-addition processes. Sens. Actuators B 1996, 30, 223–231. [Google Scholar] [CrossRef]
- Kissa, G.; Josepovits, V.K.; Kova’cs, K.; CO, Ti. Sensitivity of the PtO/SnO2 and PdO/SnO2 layer structures: Kelvin probe and XPS analysis. Thin Solid Films 2003, 436, 115–118. [Google Scholar] [CrossRef]
- Srivastava, J.K.; Pandey, P.; Mishra, V.N.; Dwivedi, R. Sensing mechanism of Pd-doped SnO2 sensor for LPG detection. Solid State Sci. 2009, 11, 1602–1605. [Google Scholar] [CrossRef]
- Li, S.; Lu, Z.; Yang, Z.; Chu, X. The sensing mechanism of Pt-doped SnO2 surface toward CO: A first-principle study. Sens. Actuators B 2014, 202, 83–92. [Google Scholar] [CrossRef]
- Liewhiran, C.; Tamaekong, N.; Wisitsoraat, A.; Tuantranont, A.; Phanichphant, S. Ultra-sensitive H2 sensors based on flame-spray-made Pd-loaded SnO2 sensing films. Sens. Actuators B 2013, 176, 893–905. [Google Scholar] [CrossRef]
- Oleksenko, L.P.; Maksymovych, N.P.; Sokovykh, E.V.; Matushko, I.P. Stability of semiconductor sensors based on nanosized SnO2 and Pd/SnO2. Russ. J. Phys. Chem. A 2014, 88, 831–835. [Google Scholar] [CrossRef]
- Liu, P.; Zhao, Y.; Qin, R.; Mo, S.; Chen, G.; Gu, L.; Chevrier, D.M.; Zhang, P.; Guo, Q.; Zang, D.; et al. Photochemical route for synthesizing atomically dispersed palladium catalysts. Science 2016, 352, 797–800. [Google Scholar] [CrossRef] [PubMed] [Green Version]
- Lin, Y.; Wei, W.; Li, Y.; Li, F.; Zhou, J.; Sun, D.; Chen, Y.; Ruan, S. Preparation of Pd nanoparticle-decorated hollow SnO2 nanofibers and their enhanced formaldehyde sensing properties. J. Alloys Compd. 2015, 651, 690–698. [Google Scholar] [CrossRef]
- Hu, R.-J.; Wang, J.; Zhu, H.-C. Preparation and Gas Sensing Properties of PdO, Au, CdO Coatings on SnO2 Nanofibers. Acta Phys. Chim. Sin 2015, 31, 1997–2007. [Google Scholar]
- Wang, Q.; Wang, C.; Sun, H.; Sun, P.; Wang, Y.; Lin, J.; Lu, G. Microwave assisted synthesis of hierarchical Pd/SnO2 nanostructures for CO gas sensor. Sens. Actuators B 2016, 222, 257–263. [Google Scholar] [CrossRef]
- Kim, B.; Lu, Y.; Hannon, A.; Meyyappan, M.; Li, L. Low temperature Pd/SnO2 sensor for carbon monoxide detection. Sens. Actuators B 2013, 177, 770–775. [Google Scholar] [CrossRef]
- Datye, A.K.; Bravo, J.; Nelson, T.R.; Atanasova, P.; Lyubovsky, M.; Pfefferle, L. Catalyst microstructure and methane oxidation reactivity during the Pd/PdO transformation on alumina supports. Appl. Catal. A 2000, 198, 179–196. [Google Scholar] [CrossRef]
- Yamazoe, N. New approaches for improving semiconductor gas sensors. Sens. Actuators B 1991, 5, 7–19. [Google Scholar] [CrossRef]
- Iltona, E.S.; Post, J.E.; Heaneyc, P.J.; Ling, F.T.; Kerisit, S.N. XPS determination of Mn oxidation states in Mn (hydr)oxides. Appl. Surf. Sci. 2016, 366, 475–485. [Google Scholar] [CrossRef] [Green Version]
- Kibis, L.S.; Titkov, A.I.; Stadnichenko, A.I.; Koscheev, S.K.; Boronin, A.I. X-ray photoelectron spectroscopy study of Pd oxidation by RF discharge in oxygen. Appl. Surf. Sci. 2009, 255, 9248–9254. [Google Scholar] [CrossRef]
- Yan, L.; Pan, J.S. XPS studies of room temperature magnetic Co-doped SnO2 deposited on Si. Mater. Sci. Eng. B 2006, 128, 34–36. [Google Scholar] [CrossRef]
- Baek, D.-H.; Kim, J. MoS2 gas sensor functionalized by Pd for the detection of hydrogen. Sens. Actuators B 2017, 250, 686–691. [Google Scholar] [CrossRef]
- Cho, S.-Y.; Ahn, H.; Park, K.; Choi, J.; Kang, H.; Jung, H.-T. Ultrasmall Grained Pd Nanopattern H2 Sensor. ACS Sens. 2018, 3, 1876–1883. [Google Scholar] [CrossRef]
- Tang, Z.; Zhang, Y.; Deng, X.; Dai, Y.; Zhang, W.; Fan, F.; Qing, B.; Zhu, C.; Fan, J.; Shi, Y. The H2 sensing properties of facets-dependent Pd nanoparticles-supported ZnO nanorods. Dalton Trans. 2018, 47, 15331–15337. [Google Scholar] [CrossRef] [PubMed]
Figure 1.
(a) Schematic diagram and photograph of Au-alloy electrode, which is composite of an alumina substrate (area = 1 mm × 1.5 mm), two Au electrodes on the upper surface, and a micro heater on the lower surface. (b) Photograph of the final gas sensor.
Figure 1.
(a) Schematic diagram and photograph of Au-alloy electrode, which is composite of an alumina substrate (area = 1 mm × 1.5 mm), two Au electrodes on the upper surface, and a micro heater on the lower surface. (b) Photograph of the final gas sensor.

Figure 2.
XRD patterns and grain size of SnO2, PdCl2/SnO2, and PdOx/SnO2 composites.

Figure 3.
Bright-field TEM image of PdOx/SnO2-450 composite and the corresponding STEM-EDS elemental maps.
Figure 3.
Bright-field TEM image of PdOx/SnO2-450 composite and the corresponding STEM-EDS elemental maps.

Figure 4.
XPS narrow scan spectra (a–d) the Pd 3d XPS spectra; (e–h) the O 1s XPS spectra.

Figure 5.
(a) The typical Sn 3d XPS (b) The change trend that the BE of Sn 3d3/2 and O 1s.

Figure 6.
The sensors responses to 100 ppm H2 at PdOx/SnO2 composites.

Figure 7.
Four periods of response curve of the sensor using different annealing temperature at their optimal operating conditions respectively at 100 ppm H2: (a) PdOx/SnO2-120; (b) PdOx/SnO2-250; (c) PdOx/SnO2-450; (d) PdOx/SnO2-600.
Figure 7.
Four periods of response curve of the sensor using different annealing temperature at their optimal operating conditions respectively at 100 ppm H2: (a) PdOx/SnO2-120; (b) PdOx/SnO2-250; (c) PdOx/SnO2-450; (d) PdOx/SnO2-600.

Figure 8.
Response and recovery characteristics of PdOx/SnO2 composites to100 ppm H2.

Figure 9.
(a) Response (S) of sensor based on PdOx/SnO2 to various concentration of H2 at optimal operating temperature and (b) linear dependence of response (S) of H2 gas sensor based on PdOx/SnO2 on concentration of H2 gas at optimal operating temperature, (c) the response stability of the PdOx modified SnO2 gas sensor to 100 ppm H2 with 15 cycles.

Figure 10.
Different concentrations of PdCl2 loaded at theirs optimal operating temperatures respectively to 100 ppm H2: (a) Response transients of the sensor from 0.75% to 7.5% Pd loaded, (b) Sensor response as a function of Pd concentration.
Figure 10.
Different concentrations of PdCl2 loaded at theirs optimal operating temperatures respectively to 100 ppm H2: (a) Response transients of the sensor from 0.75% to 7.5% Pd loaded, (b) Sensor response as a function of Pd concentration.

Figure 11.
Responses of the Pd/SnO2-450 °C to different concentration of hydrogen at 20%–70% relative humidity.
Figure 11.
Responses of the Pd/SnO2-450 °C to different concentration of hydrogen at 20%–70% relative humidity.

Figure 12.
Responses of the PdOx/SnO2 to 100 ppm different gases at their optimum operating temperature.
Figure 12.
Responses of the PdOx/SnO2 to 100 ppm different gases at their optimum operating temperature.

Figure 13.
Schematic representation of different chemical states of Pd on the SnO2, as well as the proposed mechanism of H2 sensitivity.
Figure 13.
Schematic representation of different chemical states of Pd on the SnO2, as well as the proposed mechanism of H2 sensitivity.


Table 1.
BE values for Pd 3d5/2 photoemission signal in several reference compounds [22].
Table 1.
BE values for Pd 3d5/2 photoemission signal in several reference compounds [22].
| Compound Bulk | Pd 3d5/2 BE (eV) |
|---|---|
| Pd | 334.8–335.1 |
| PdOx,x < 1 | 335.3 |
| Pd-O | 336.9 |
| O-Pd-O | 337.9 |
| Cl-Pd-Cl | 337.8 |
© 2019 by the authors. Licensee MDPI, Basel, Switzerland. This article is an open access article distributed under the terms and conditions of the Creative Commons Attribution (CC BY) license (http://creativecommons.org/licenses/by/4.0/).
Share and Cite
MDPI and ACS Style
Qi, T.; Sun, J.; Yang, X.; Yan, F.; Zuo, J. Effects of Chemical State of the Pd Species on H2 Sensing Characteristics of PdOx/SnO2 Based Chemiresistive Sensors. Sensors 2019, 19, 3131. https://doi.org/10.3390/s19143131
AMA Style
Qi T, Sun J, Yang X, Yan F, Zuo J. Effects of Chemical State of the Pd Species on H2 Sensing Characteristics of PdOx/SnO2 Based Chemiresistive Sensors. Sensors. 2019; 19(14):3131. https://doi.org/10.3390/s19143131
Chicago/Turabian StyleQi, Tianjiao, Jie Sun, Xi Yang, Fanfan Yan, and Ji Zuo. 2019. "Effects of Chemical State of the Pd Species on H2 Sensing Characteristics of PdOx/SnO2 Based Chemiresistive Sensors" Sensors 19, no. 14: 3131. https://doi.org/10.3390/s19143131
Note that from the first issue of 2016, this journal uses article numbers instead of page numbers. See further details here.