Contrast and Homogeneity Feature Analysis for Classifying Tremor Levels in Parkinson’s Disease Patients

 ,
,  , and
, and
Abstract
:1. Introduction
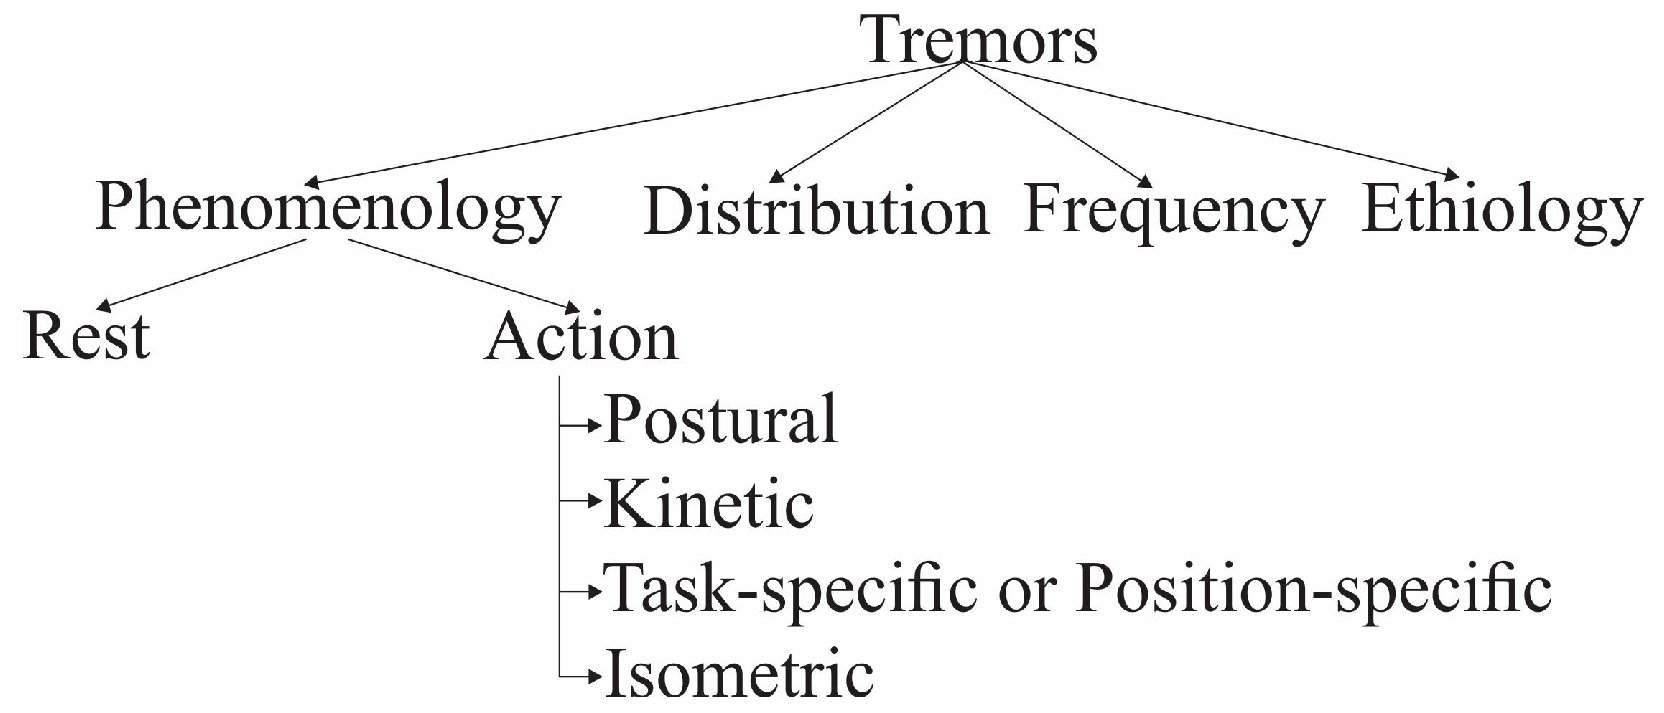
2. Background
3. Materials and Methods
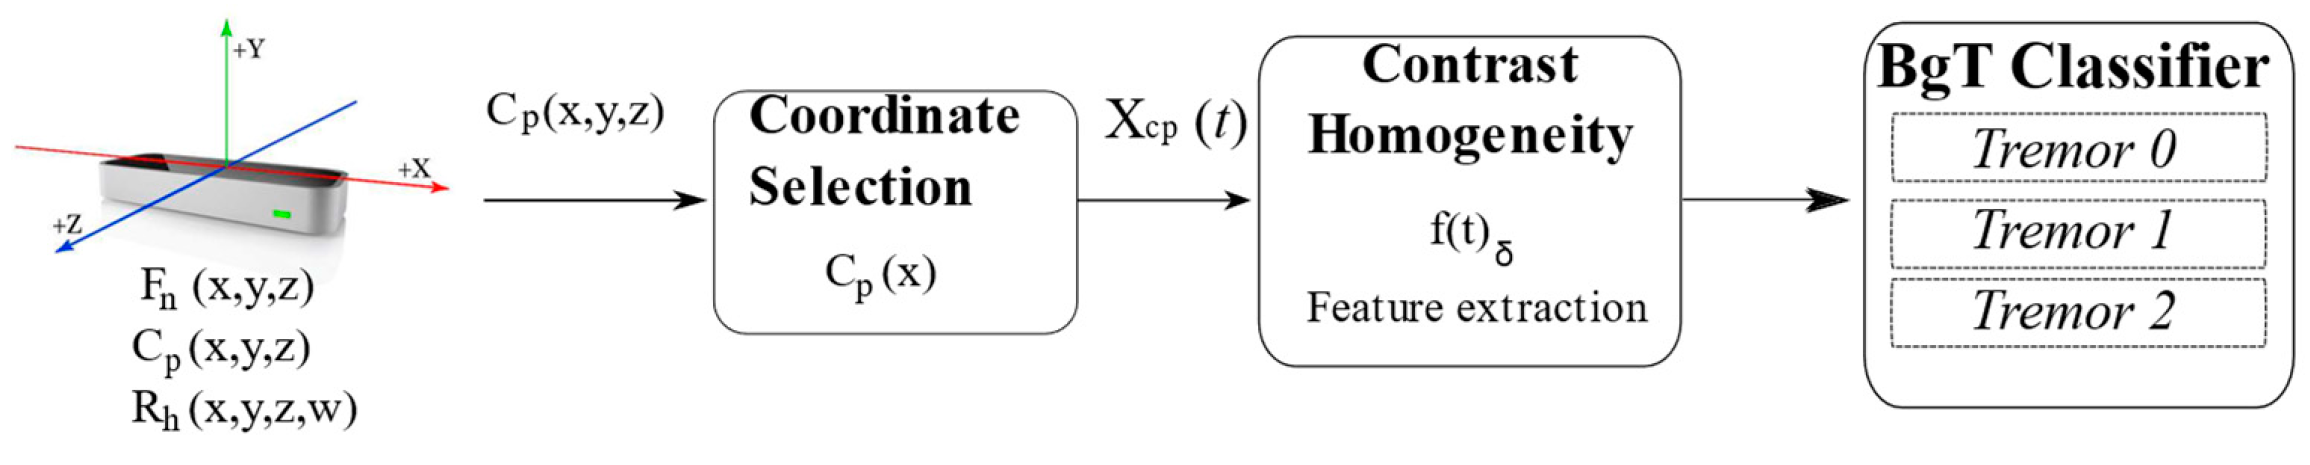
3.1. Methodology
3.2. Data Acquisition
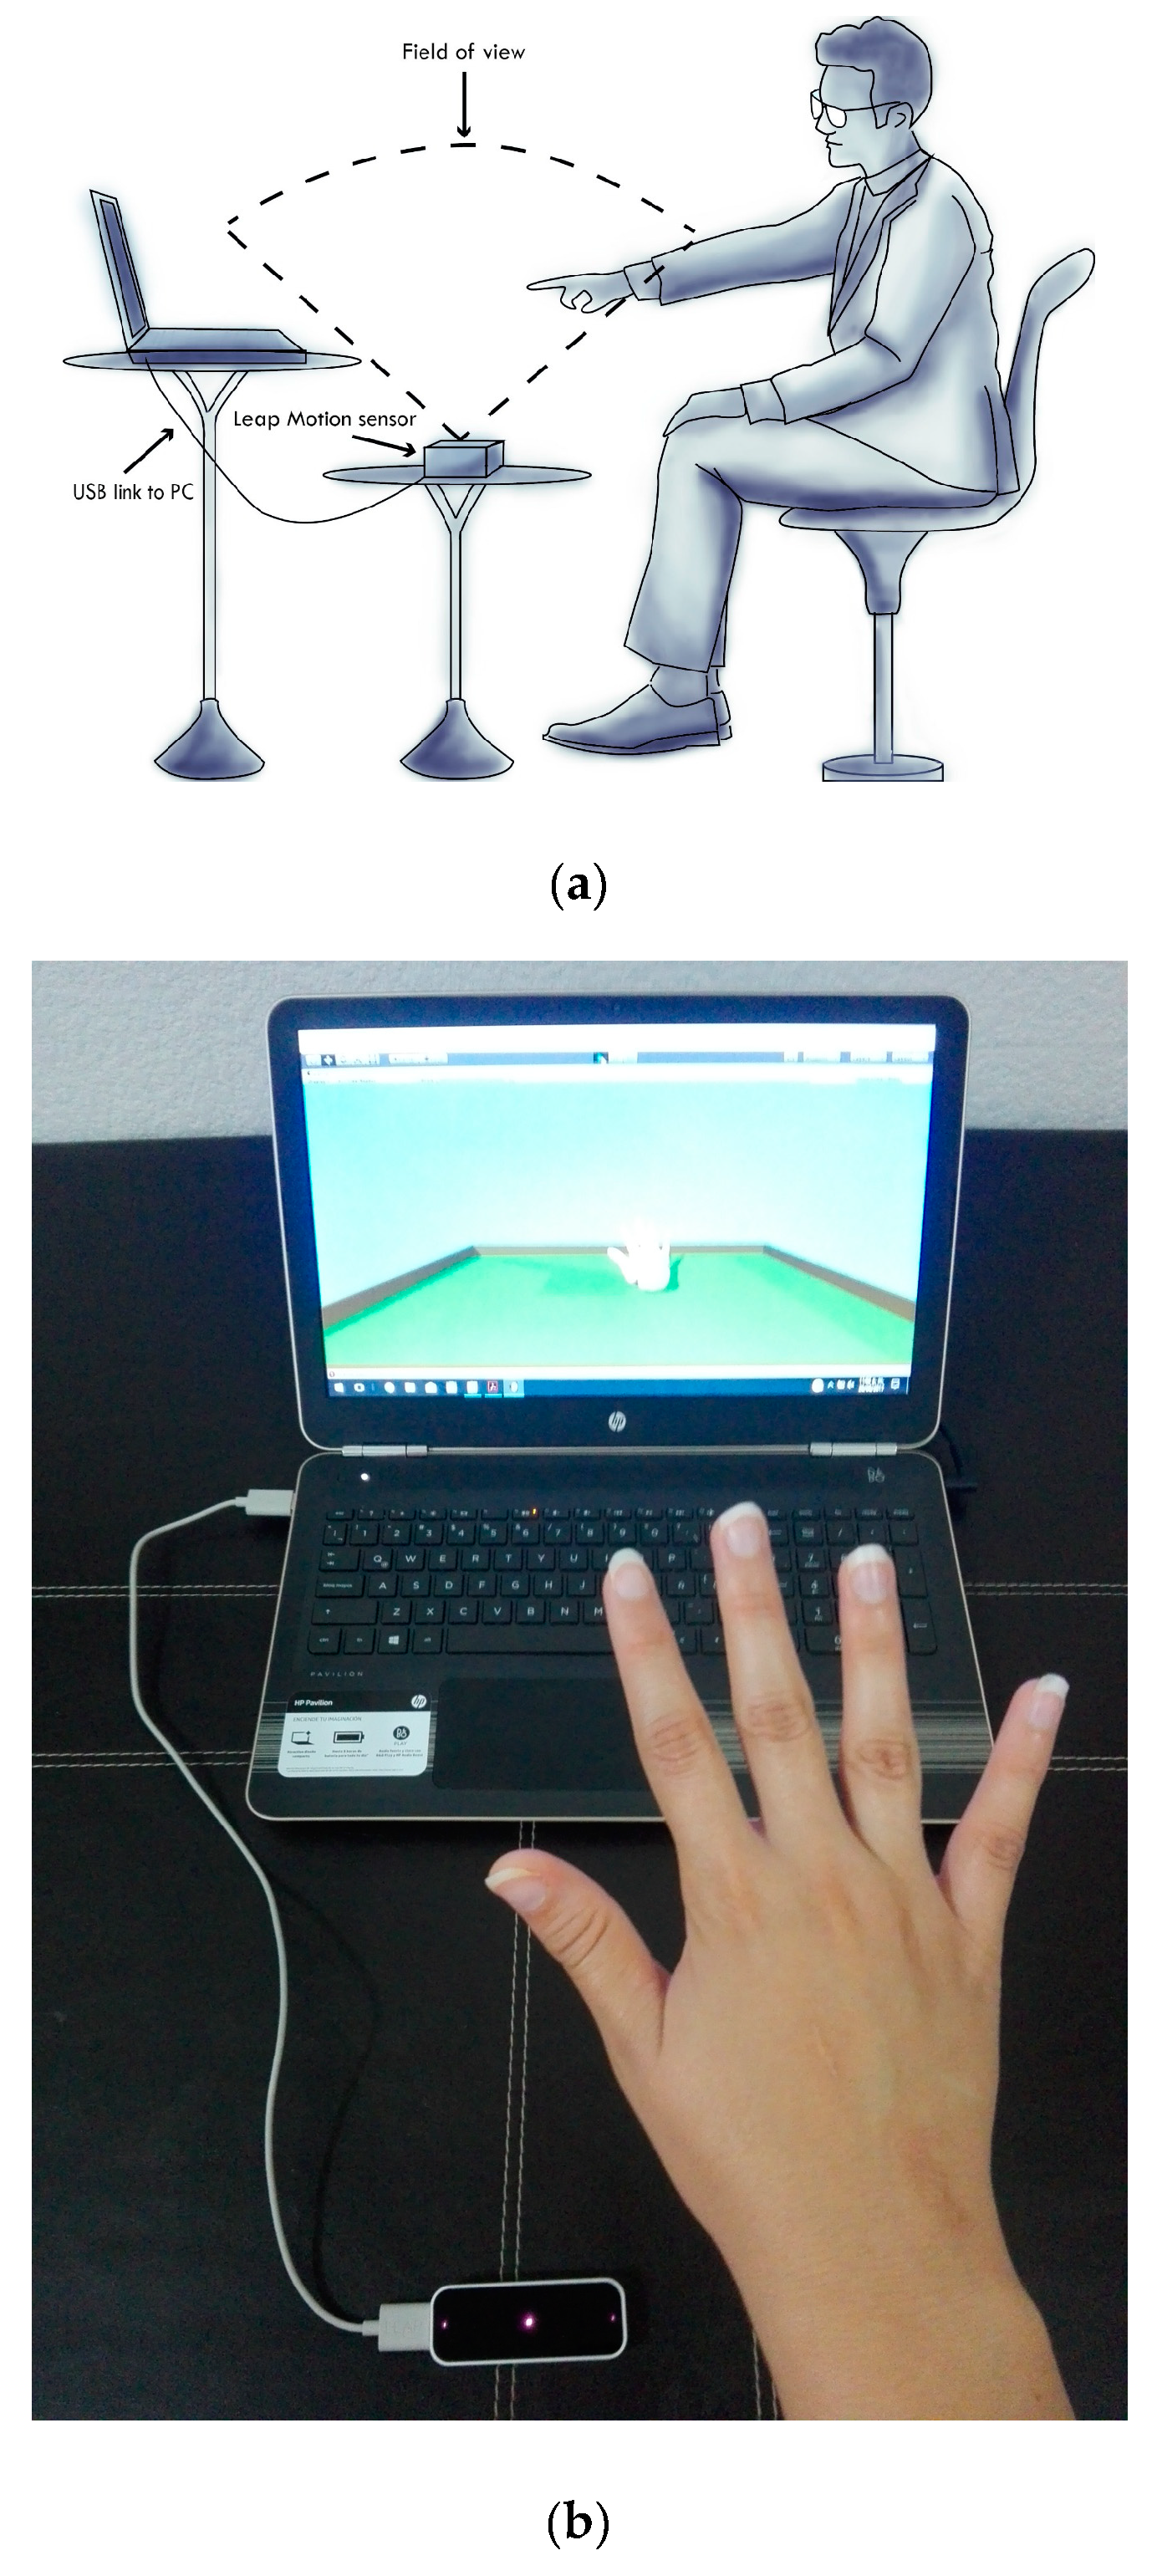
3.2.1. Experimental Protocol
3.2.2. Tremor Database
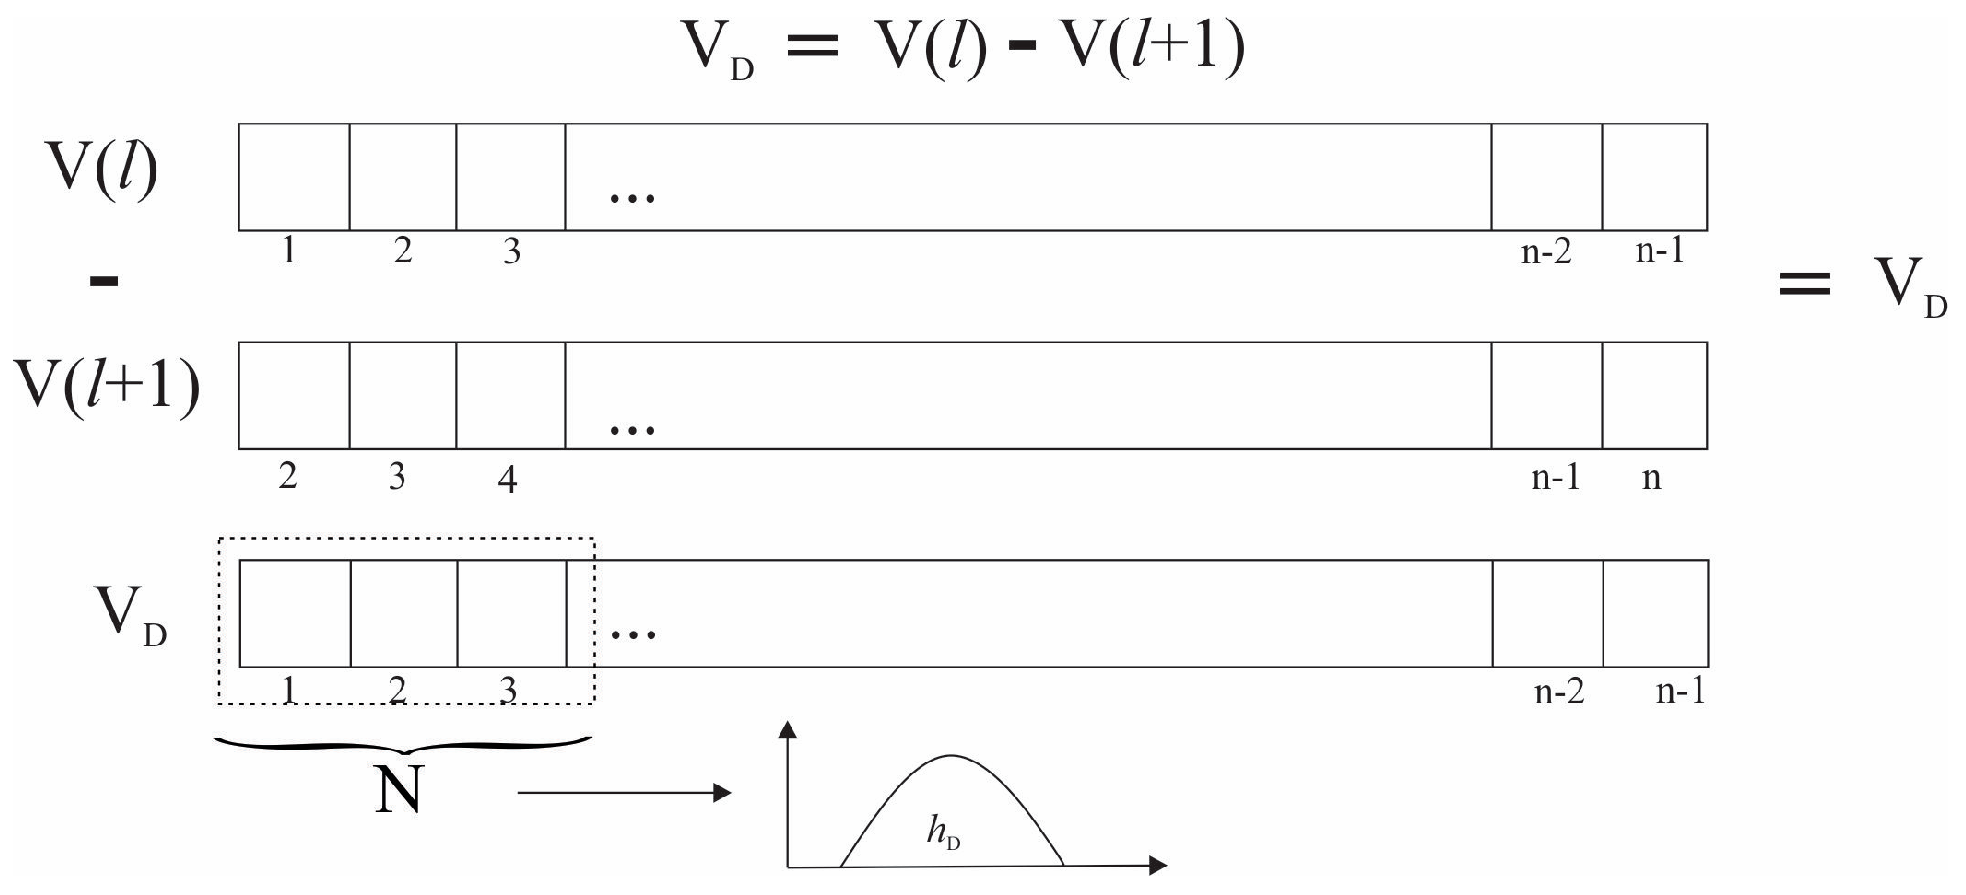
3.3. Feature Extraction
3.4. Coordinate Selection
3.5. Select the Feature
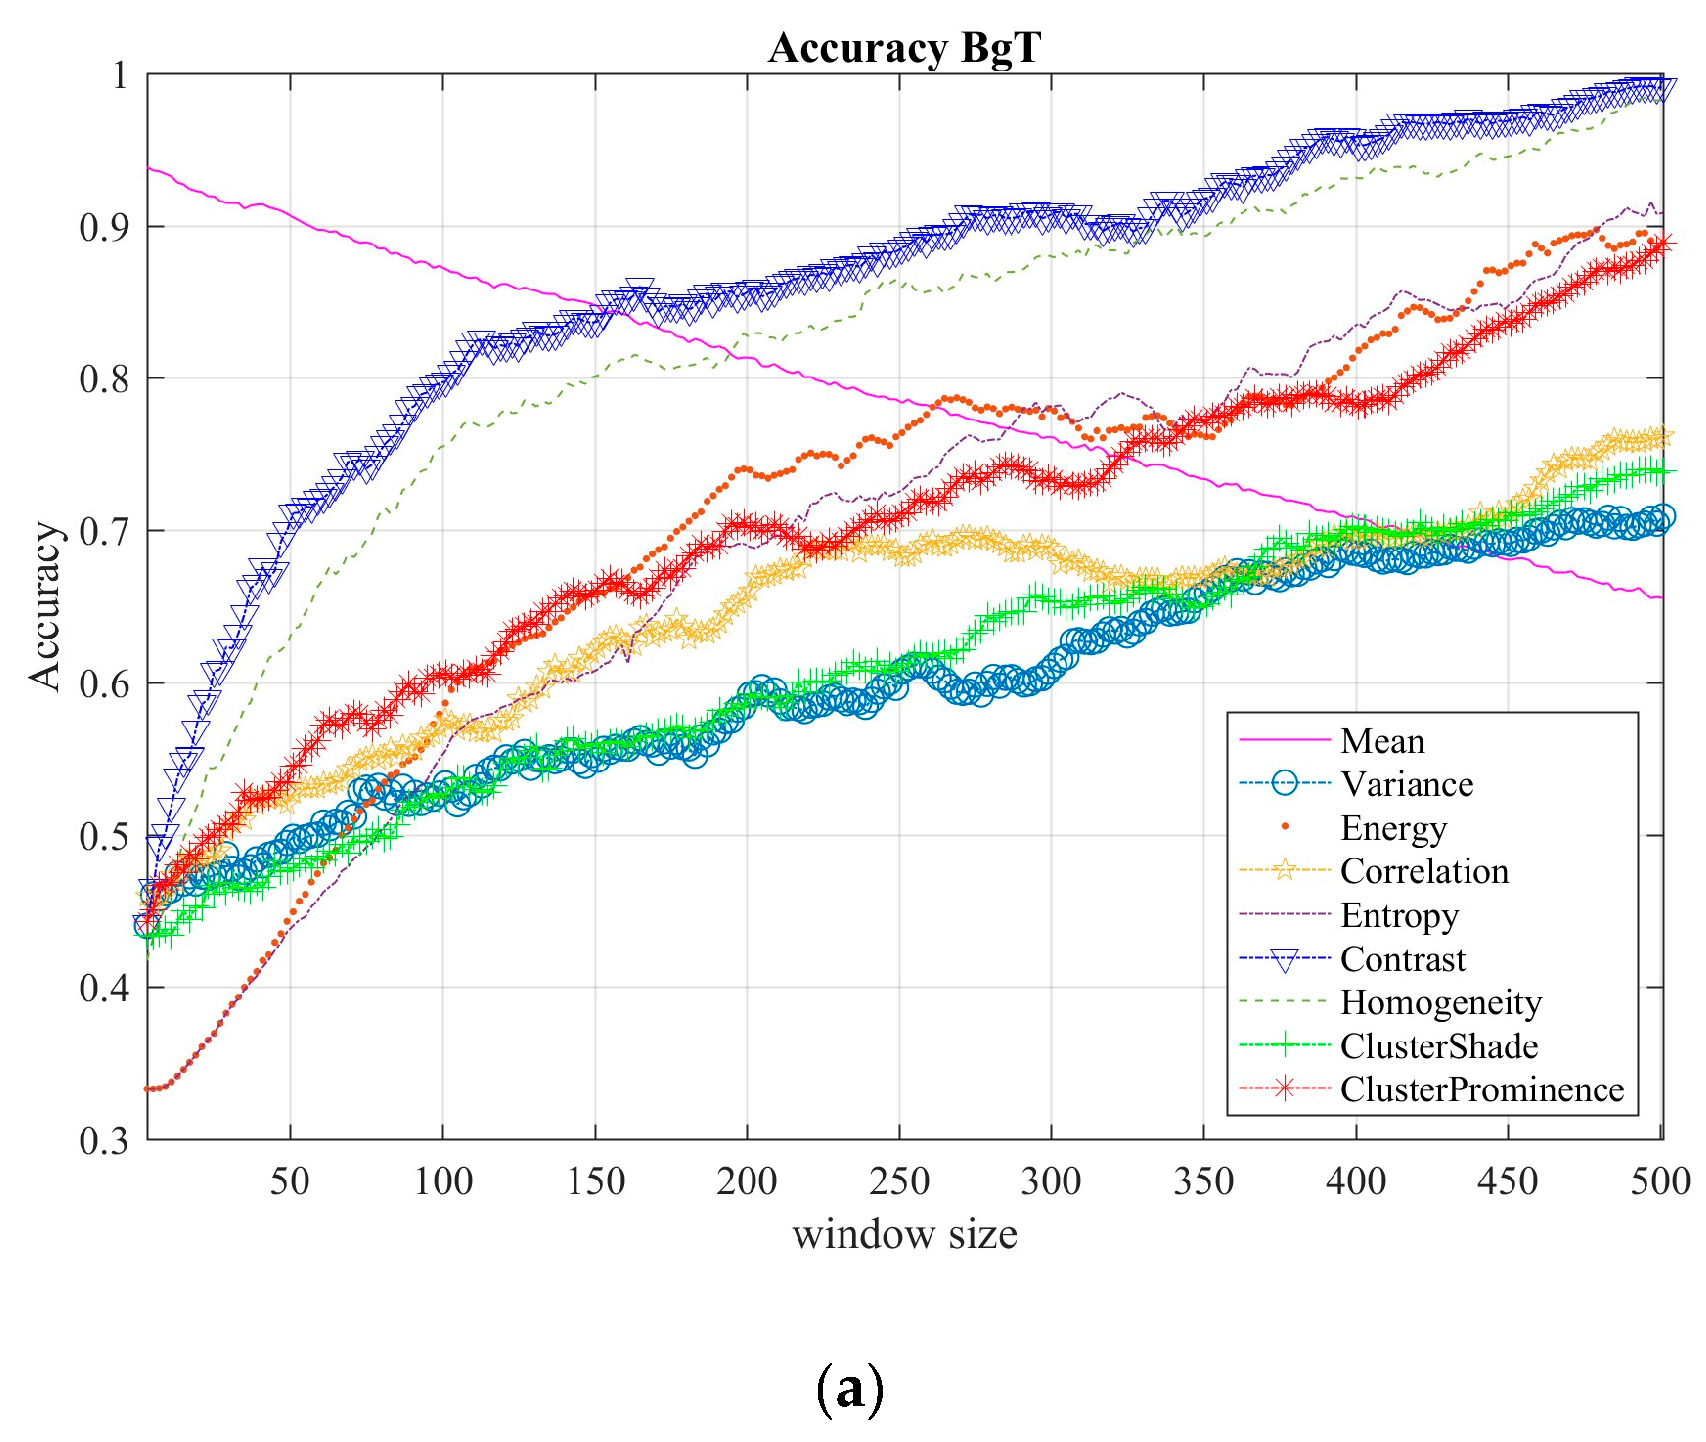
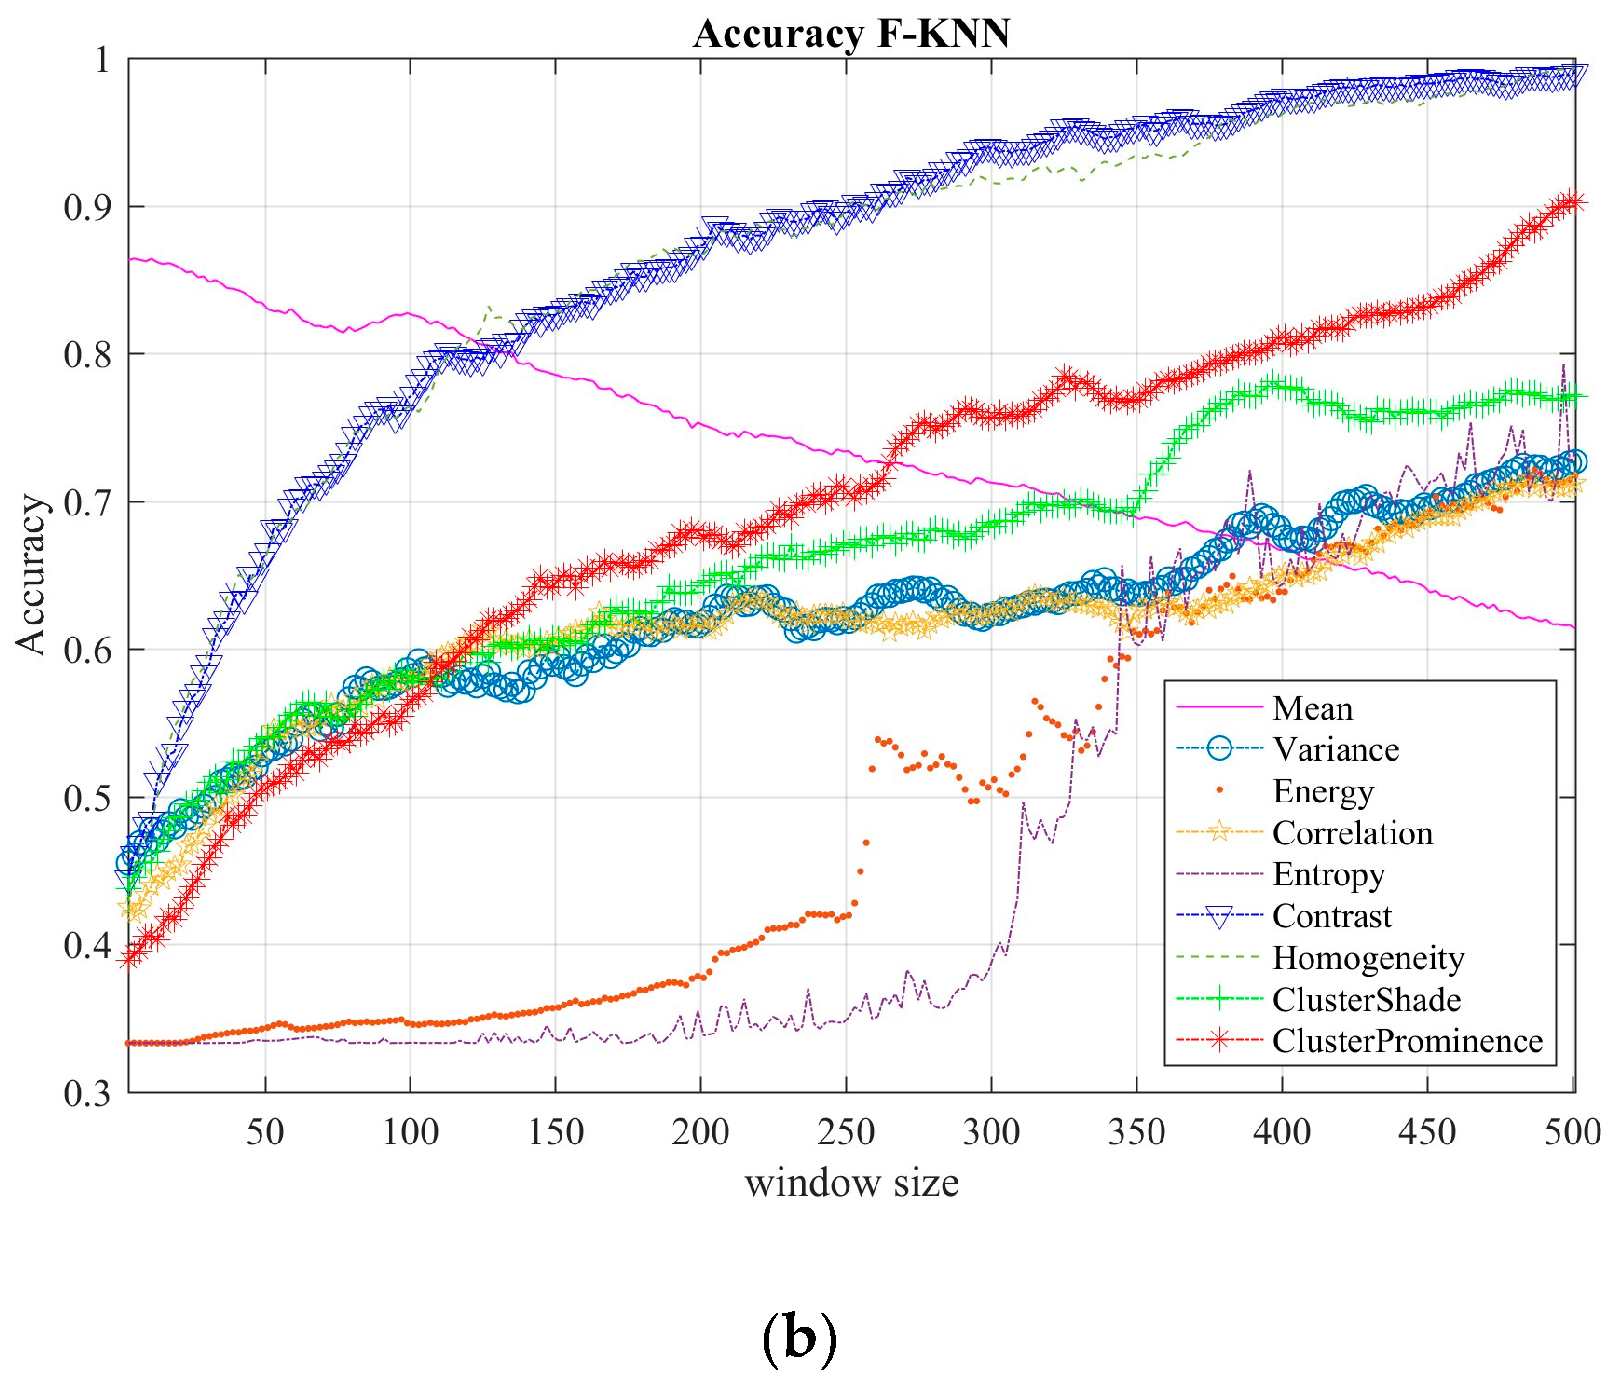
3.6. Tremor Classification and Performance
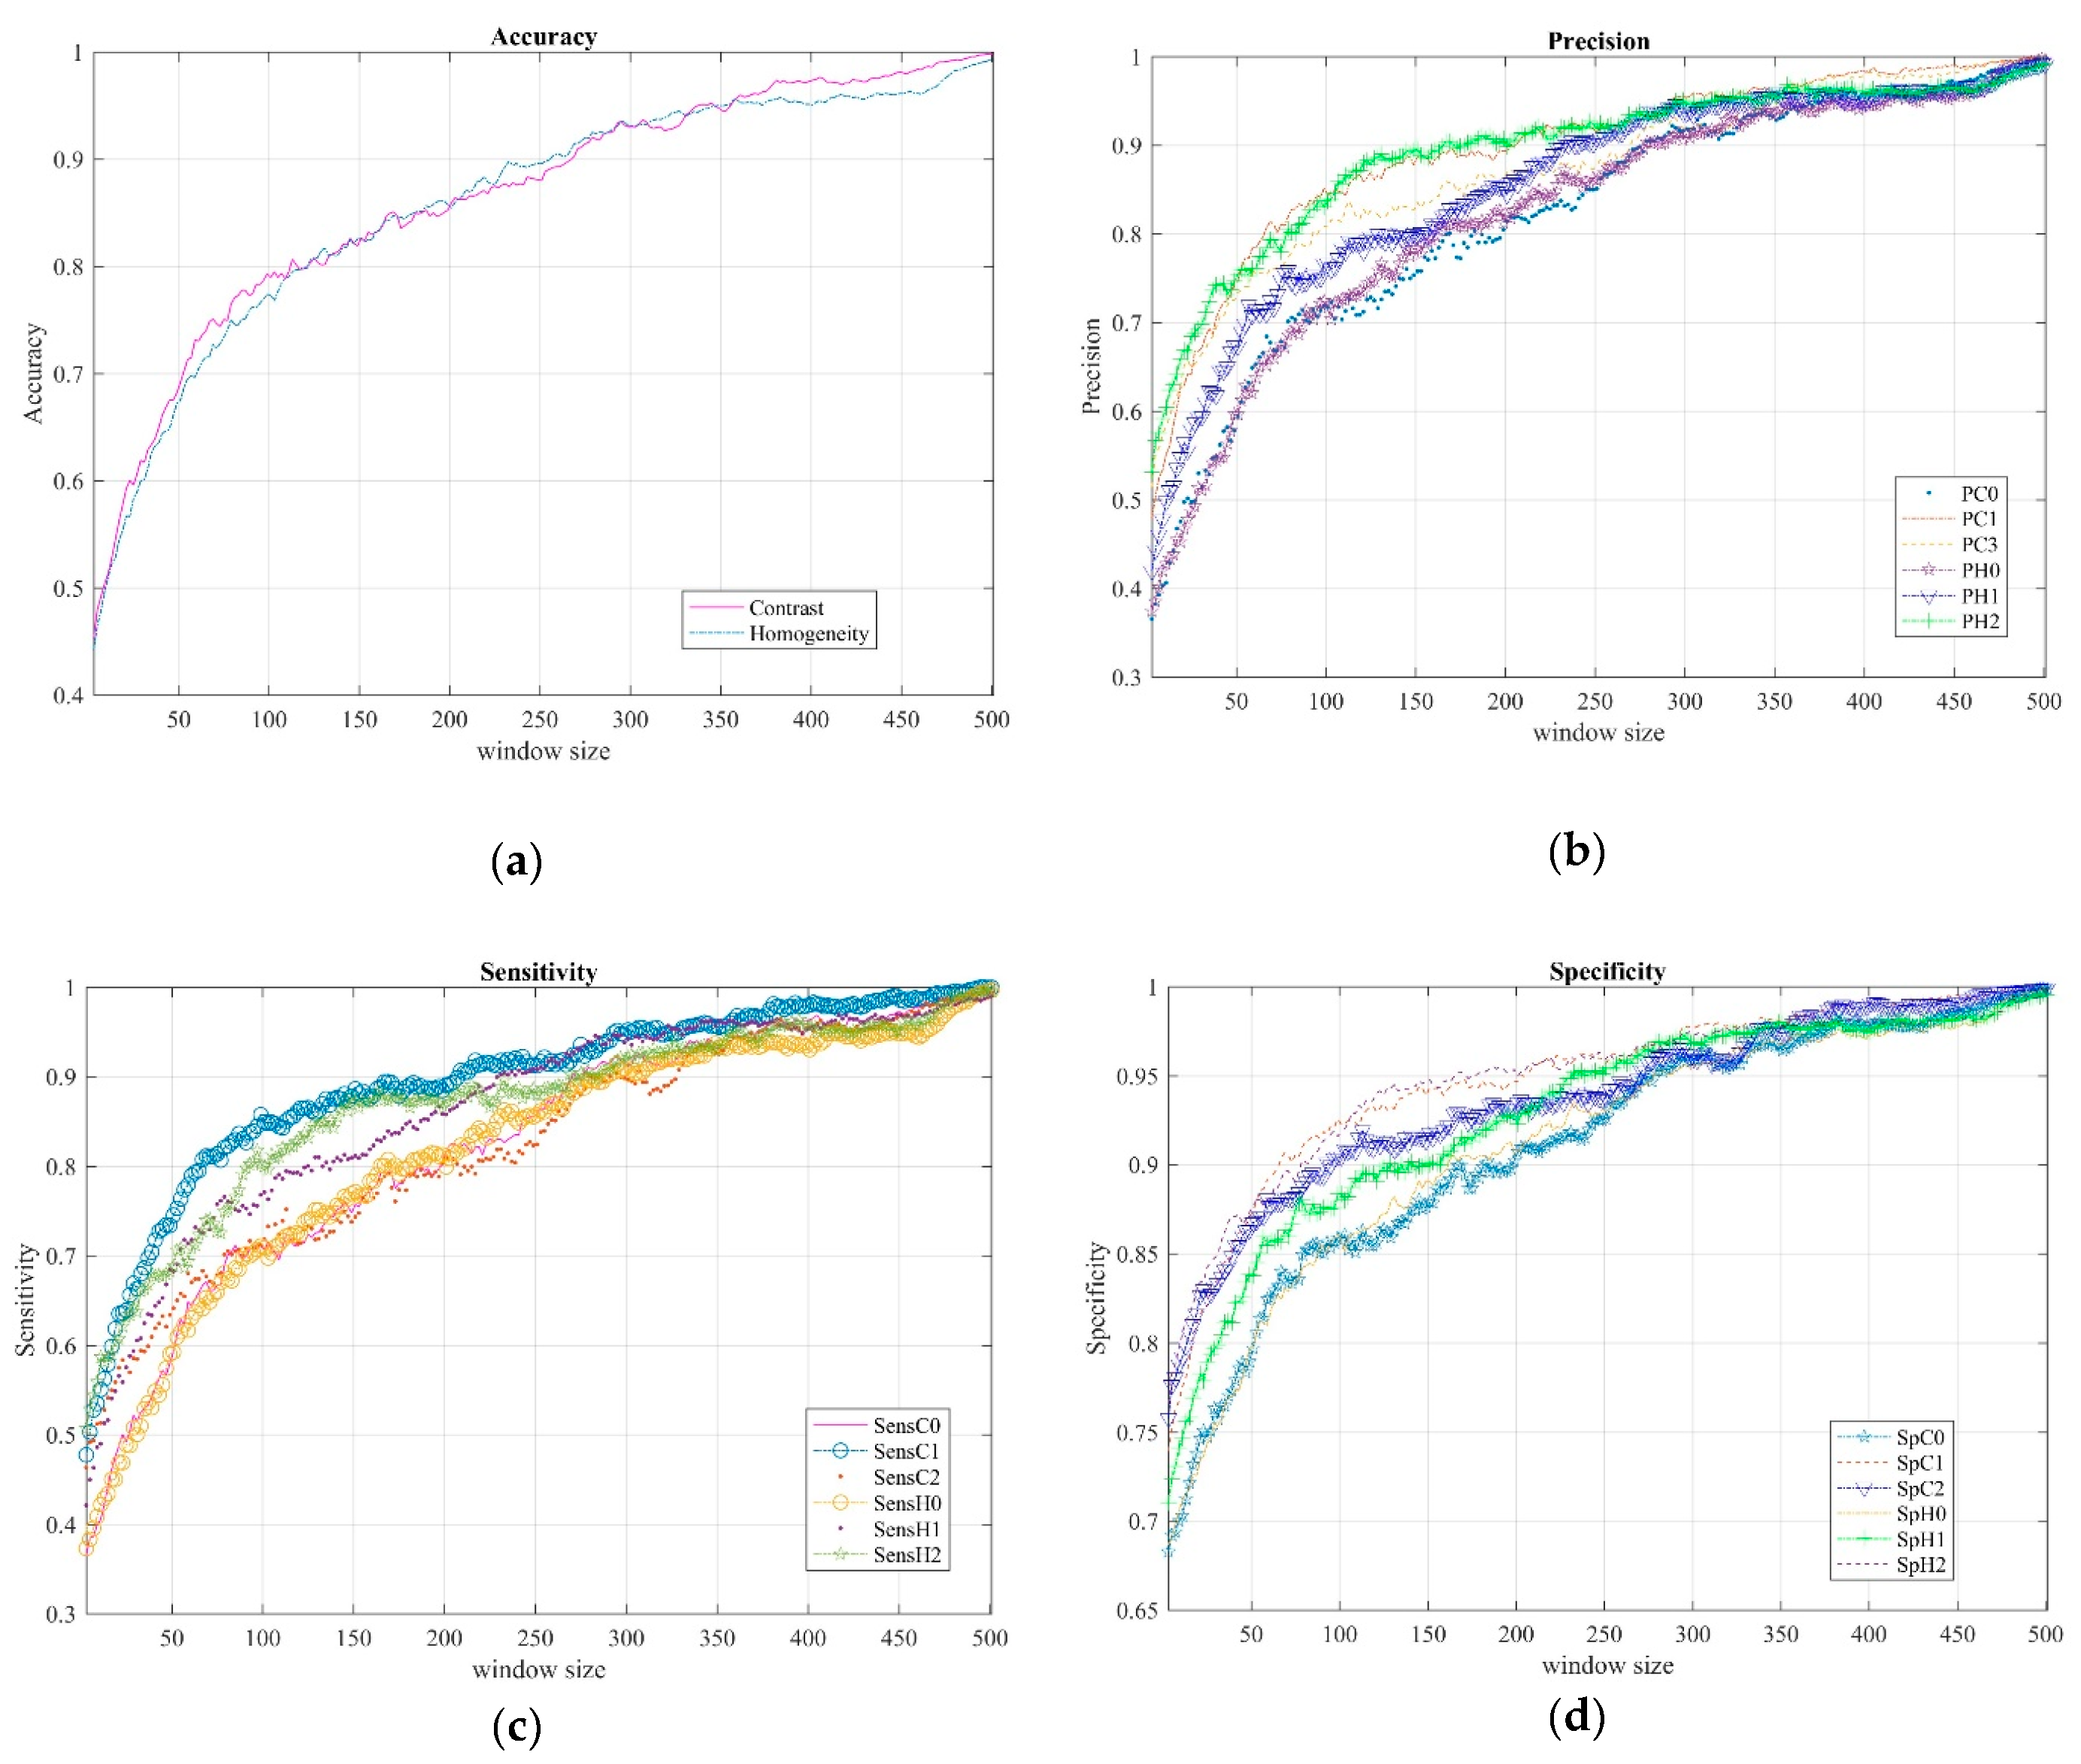
4. Results and Discussion
5. Conclusions
Author Contributions
Funding
Acknowledgments
Conflicts of Interest
References
- Nussbaum, R.L.; Ellis, C.E. “Alzheimer’s Disease and Parkinson’s Disease”. N. Engl. J. Med. 2003, 348, 1356–1364. [Google Scholar] [CrossRef] [PubMed]
- Tolosa, E.; Wenning, G.K.; Poewe, W. The diagnosis of Parkinson’s disease. Lancet Neurol. 2006, 5, 75–86. [Google Scholar] [CrossRef]
- Dorsey, E.R.; Constantinescu, R.; Thompson, J.P.; Biglan, K.M.; Holloway, R.G.; Kieburtz, K.; Marshall, F.J.; Ravina, B.M.; Schifitto, G.; Siderowf, A.; et al. Projected Number of People with Parkinson Disease in the Most Populous Nations, 2005 through 2030. Neurology 2007, 68, 384–386. [Google Scholar] [CrossRef] [PubMed]
- Zach, H.; Dirkx, M.; Bloem, B.R.; Helmich, R.C. The Clinical Evaluation of Parkinson’s Tremor. J. Parkinsons Dis. 2015, 5, 471–474. [Google Scholar] [CrossRef] [PubMed] [Green Version]
- Tsanas, A.; Little, M.A.; McSharry, P.E.; Scanlon, B.K.; Papapetropoulos, S. Statistical Analysis and Mapping of the Unified Parkinson’s Disease Rating Scale to Hoehn and Yahr Staging. Parkinsonism Relat. Disord. 2012, 18, 697–699. [Google Scholar] [CrossRef]
- Ramaker, C.; Marinus, J.; Stiggelbout, A.M.; Van Hilten, B.J. Systematic Evaluation of Rating Scales for Impairment and Disability in Parkinson’s Disease. Mov. Disord. 2002, 17, 867–876. [Google Scholar] [CrossRef]
- Goetz, C.G.; Tilley, B.C.; Shaftman, S.R.; Stebbins, G.T.; Fahn, S.; Martinez-Martin, P.; Poewe, W.; Sampaio, C.; Stern, M.B.; Dodel, R.; et al. Movement Disorder Society-Sponsored Revision of the Unified Parkinson’s Disease Rating Scale (MDS-UPDRS): Scale Presentation and Clinimetric Testing Results. Mov. Disord. 2008, 23, 2129–2170. [Google Scholar] [CrossRef] [PubMed]
- Skorvanek, M.; Martinez-Martin, P.; Kovacs, N.; Rodriguez-Violante, M.; Corvol, J.-C.; Taba, P.; Seppi, K.; Levin, O.; Schrag, A.; Foltynie, T.; et al. Differences in MDS-UPDRS Scores Based on Hoehn and Yahr Stage and Disease Duration. Mov. Disord. Clin. Pract. 2017, 4, 536–544. [Google Scholar] [CrossRef]
- Fahn, S.; Elton, R.L. UPDRS Development Committee. Unified Parkinson’s Disease Rating Scale. In Recent Developments in Parkinson’s Disease; Fahn, S., Marsden, C.D., Calne, D.B., Goldstein, M., Eds.; Macmillan: Florham Park, NJ, USA; London, UK, 1987; Volume 2, pp. 153–304. [Google Scholar]
- Opara, J.; Małecki, A.; Małecka, E.; Socha, T. Motor Assessment in Parkinson‘s Disease. Ann. Agric. Environ. Med. 2017, 24, 411–415. [Google Scholar] [CrossRef]
- Oung, Q.W.; Muthusamy, H.; Lee, H.L.; Basah, S.N.; Yaacob, S.; Sarillee, M.; Lee, C.H. Technologies for Assessment of Motor Disorders in Parkinson’s Disease: A Review. Sensors 2015, 15, 21710–21745. [Google Scholar] [CrossRef] [Green Version]
- Sánchez-Ferro, Á.; Elshehabi, M.; Godinho, C.; Salkovic, D.; Hobert, M.A.; Domingos, J.; van Uem, J.M.; Ferreira, J.J.; Maetzler, W. New Methods for the Assessment of Parkinson’s Disease (2005 to 2015): A Systematic Review. Mov. Disord. 2016, 31, 1283–1292. [Google Scholar] [CrossRef] [PubMed]
- Çakmak, Y.Ö.; Ölçek, S.C.; Özsoy, B.; Gökçay, D. Quantitative Measurement of Bradykinesia in Parkinson’s Disease Using Commercially Available Leap Motion. In Biosignals, Proceedings of the 11th International Joint Conference on Biomedical Engineering Systems and Technologies; Funchal: Madeira, Portugal, 2018; Volume 3, pp. 227–232. [Google Scholar]
- Johnson, M. Detection of Parkinson Disease Rest Tremor. Master’s Thesis, Washington University, St. Louis, MO, USA, 2014. Available online: https://openscholarship.wustl.edu/eng_etds/12/ (accessed on 25 February 2019).
- Kincaid, J.P.; Charles, S.K. The Feasibility of Using a Markerless Motion Capture Sensor (Leap Motion TM Controller) for Quantitative Motor Assessment Intended for a Clinical Setting Clay. Master’s Thesis, Brigham Young University, 2018. Available online: https://scholarsarchive.byu.edu/etd/6262/ (accessed on 25 February 2019).
- Vivar-Estudillo, G.; Ibarra-Manzano, M.A.; Almanza-Ojeda, D.L. Tremor Signal Analysis for Parkinson’s Disease Detection Using Leap Motion Device. In Proceedings of the Mexican International Conference on Artificial Intelligence (MICAI), Guadalajara, Jalisco, México, 22–27 October 2018; pp. 342–353. [Google Scholar] [CrossRef]
- Fahn, S.; Jankovic, J.; Hallett, M. Clinical overview and phenomenology of movements disorders. In Principles and Practice of Movements Disorder, 2nd ed.; E-book; Elsevier Health Sciences: Edinburgh, Scotland, 2011; Volume 3, pp. 1–35. ISBN 978143772369. [Google Scholar]
- Tysnes, O.-B.; Storstein, A. Epidemiology of Parkinson’s Disease. J. Neural. Trans. 2017, 124, 901–905. [Google Scholar] [CrossRef] [PubMed]
- Fahn, S.; Tolosa, E.; Marín, C. Clinical Rating Scale for Tremor. In Parkinson’s Disease and Movement Disorders; Jankovik, J., Tolosa, E., Eds.; Urban & Schwarzenberg: Baltimore, MD, USA, 1988; pp. 225–234. [Google Scholar]
- Elble, R.J. Tremor. In Neuro-Geriatrics: A Clinical Manual; Tousi, B., Cummings, J., Eds.; Springer International Publishing: Cham, Switzerland, 2017; pp. 311–326. [Google Scholar]
- Lee, H.J.; Lee, W.W.; Kim, S.K.; Park, H.; Jeon, H.S.; Kim, H.B.; Jeon, B.S.; Park, K.S. Tremor Frequency Characteristics in Parkinson’s Disease under Resting-State and Stress-State Conditions. J. Neurol. Sci. 2016, 362, 272–277. [Google Scholar] [CrossRef]
- Bartolić, A.; Pirtosek, Z.; Rozman, J.; Ribaric, S. Tremor Amplitude and Tremor Frequency Variability in Parkinson’s Disease Is Dependent on Activity and Synchronisation of Central Oscillators in Basal Ganglia. Med. Hypotheses 2010, 74, 362–365. [Google Scholar] [CrossRef]
- Anouti, A.; Koller, W.C. Tremor Disorders. Diagnosis and Management. West. J. Med. 1995, 162, 510–513. [Google Scholar] [PubMed]
- Bhatia, K.P.; Bain, P.; Bajaj, N.; Elble, R.J.; Hallett, M.; Louis, E.D.; Raethjen, J.; Stamelou, M.; Testa, C.M.; Deuschl, G.; et al. Consensus Statement on the Classification of Tremors. from the Task Force on Tremor of the International Parkinson and Movement Disorder Society. Mov. Disord. 2018, 33, 75–87. [Google Scholar] [CrossRef]
- Nolden, L.F.; Tartavoulle, T.; Porche, D.J. Parkinson’s Disease: Assessment, Diagnosis, and Management. J. Nurse Pract. 2014, 10, 500–506. [Google Scholar] [CrossRef]
- Fahn, S.; Jankovic, J.; Hallett, M. Tremor. In Principles and Practice of Movements Disorder, 2nd ed.; E-book; Elsevier Health Sciences: Edinburgh, Scotland, 2011; Volume 3, pp. 389–414. ISBN 9781437723694. [Google Scholar]
- Dai, H.; Zhang, P.; Lueth, T.C. Quantitative Assessment of Parkinsonian Tremor Based on an Inertial Measurement Unit. Sensors 2015, 15, 25055–25071. [Google Scholar] [CrossRef] [Green Version]
- Wile, D.J.; Ranawaya, R.; Kiss, Z.H.T. Smart Watch Accelerometry for Analysis and Diagnosis of Tremor. J. Neurosci. Methods 2014, 230, 1–4. [Google Scholar] [CrossRef]
- Lemoyne, R.; Mastroianni, T.; Cozza, M.; Coroian, C.; Grundfest, W. Implementation of an IPhone for Characterizing Parkinson’s Disease Tremor through a Wireless Accelerometer Application. In Proceedings of the 2010 Annual International Conference of the IEEE Engineering in Medicine and Biology, Buenos Aires, Argentina, 31 August–4 September 2010; Volume 2010, pp. 4954–4958. [Google Scholar] [CrossRef]
- Das, R. A Comparison of Multiple Classification Methods for Diagnosis of Parkinson Disease. Expert Syst. Appl. 2010, 37, 1568–1572. [Google Scholar] [CrossRef]
- Pan, S.; Iplikci, S.; Warwick, K.; Aziz, T.Z. Parkinson’s Disease Tremor Classification—A Comparison between Support Vector Machines and Neural Networks. Expert Syst. Appl. 2012, 39, 10764–10771. [Google Scholar] [CrossRef]
- Halawani, S.M.; Ahmad, A. Ensemble Methods for Prediction of Parkinson Disease. In Intelligent Data Engineering and Automated Learning-IDEAL 2012; Lecture Notes in Computer Science; Yin, H., Costa, J.A.F., Barreto, G., Eds.; Springer: Berlin/Heidelberg, Germany, 2012; pp. 516–521. [Google Scholar]
- Ahlrichs, C.; Lawo, M. Parkinson’s Disease Motor Symptoms in Machine Learning: A Review. Health Inform. J. 2013, 2, 1–18. [Google Scholar] [CrossRef]
- Hernqvist, C.; Rosander, M. Machine Learning for Symptoms Quantification of Parkinson’s Disease Patients. Master’s Thesis, Chalmers University of Technology, Gothenburg, Sweden, 2017. [Google Scholar]
- Alam, M.N.; Johnson, B.; Gendreau, J.; Tavakolian, K.; Combs, C.; Fazel-Rezai, R. Tremor Quantification of Parkinson’s Disease—A Pilot Study. In Proceedings of the 2016 IEEE International Conference on Electro Information Technology (EIT), Lincoln, NE, USA, 14–17 May 2017; pp. 755–759. [Google Scholar] [CrossRef]
- Fraiwan, L.; Khnouf, R.; Mashagbeh, A.R. Parkinson’s Disease Hand Tremor Detection System for Mobile Application. J. Med. Eng. Technol. 2016, 40, 127–134. [Google Scholar] [CrossRef]
- Jeon, H.; Lee, W.; Park, H.; Lee, H.J.; Kim, S.K.; Kim, H.B.; Jeon, B.; Park, K.S. Automatic Classification of Tremor Severity in Parkinson’s Disease Using a Wearable Device. Sensors 2017, 17, 2067. [Google Scholar] [CrossRef]
- Rigas, G.; Gatsios, D.; Fotiadis, D.I.; Chondrogiorgi, M.; Tsironis, C.; Konitsiotis, S.; Gentile, G.; Marcante, A.; Antonini, A. Tremor UPDRS Estimation in Home Environment. In Proceedings of the 2016 38th Annual International Conference of the IEEE Engineering in Medicine and Biology Society (EMBC), Orlando, FL, USA, 16–20 August 2016; pp. 3642–3645. [Google Scholar] [CrossRef]
- Kaji, H.; Sugano, M. A Noncontact Tremor Measurement System Using Leap Motion. In Proceedings of the 6th International Conference on Informatics, Environment, Energy and Applications (IEEA ’17), Jeju, Korea, 29–31 March 2017; ACM: New York, NY, USA, 2017; pp. 76–79. [Google Scholar] [CrossRef]
- API Overview—Leap Motion C# SDK v3.2 Beta Documentation. Available online: https://developer-archive.leapmotion.com/documentation/csharp/devguide/Leap_Overview.html (accessed on 26 February 2019).
- Lugo, G.; Ibarra-Manzano, M.; Ba, F.; Cheng, I. Virtual Reality and Hand Tracking System as a Medical Tool to Evaluate Patients with Parkinson’s. In Proceedings of the 11th EAI International Conference on Pervasive Computing Technologies for Healthcare (PervasiveHealth ’17), Barcelona, Spain, 23–26 May 2017; ACM: New York, NY, USA, 2017; pp. 405–408. [Google Scholar] [CrossRef]
- Bane, S.; Pawar, P.D.R. Survey on Feature Extraction Methods in Object Recognition. Int. J. Comput. Sci. Inf. Technol. 2014, 5, 3224–3226. [Google Scholar]
- Villalon-Hernandez, M.-T.; Almanza-Ojeda, D.-L.; Ibarra-Manzano, M.-A. Color-Texture Image Analysis for Automatic Failure Detection in Tiles. In Pattern Recognition; Lecture Notes in Computer Science; Carrasco-Ochoa, J.A., Martínez-Trinidad, J.F., Olvera-López, J.A., Eds.; Springer International Publishing: Berlin, Germany, 2017; pp. 159–168. [Google Scholar]
- Ibarra-Manzano, M.; Devy, M.; Boizard, J. Real-Time Classification Based on Color and Texture Attributes on an FPGA-Based Architecture. In Proceedings of the 2010 Conference on Design and Architectures for Signal and Image Processing (DASIP), Edinburgh, Scotland, 26–28 November 2010; pp. 250–257. [Google Scholar] [CrossRef]
- Ibarra-Manzano, M.; Almanza-Ojeda, D.; Lopez-Hernandez, J. Design and Optimization of Real-Time Texture Analysis Using Sum and Difference Histograms Implemented on an FPGA. In Proceedings of the 2010 IEEE Electronics, Robotics and Automotive Mechanics Conference, Cuernavaca, Mexico, 28 September–1 October 2010; pp. 325–330. [Google Scholar] [CrossRef]
- Kuncheva, L.I. Bagging and Boosting. In Combining Pattern Classifiers; John Wiley & Sons, Ltd.: Hoboken, NJ, USA, 2004; pp. 203–235. [Google Scholar]
- Andrew, A.M. Statistical Pattern Recognition, 2nd ed.; Cambridge University Press: New York, NY, USA, 1999; ISBN 0-340-74164-3. [Google Scholar]
- Bind, S.; Tiwari, A.K.; Sahani, A.K. A Survey of Machine Learning Based Approaches for Parkinson Disease Prediction. Int. J. Comput. Sci. Inf. Technol. 2015, 6, 1648–1655. [Google Scholar]
- Bazgir, O.; Frounchi, J.; Habibi, S.A.H.; Palma, L.; Pierleoni, P. A Neural Network System for Diagnosis and Assessment of Tremor in Parkinson Disease Patients. In Proceedings of the 2015 22nd Iranian Conference on Biomedical Engineering (ICBME), Tehran, Iran, 25–27 November 2015; pp. 1–5. [Google Scholar] [CrossRef]
- Kim, H.B.; Lee, W.W.; Kim, A.; Lee, H.J.; Park, H.Y.; Jeon, H.S.; Kim, S.K.; Jeon, B.; Park, K.S. Wrist Sensor-Based Tremor Severity Quantification in Parkinson’s Disease Using Convolutional Neural Network. Comput. Biol. Med. 2018, 95, 140–146. [Google Scholar] [CrossRef] [PubMed]
- Bazgir, O.; Habibi, S.A.H.; Palma, L.; Pierleoni, P.; Nafees, S. A Classification System for Assessment and Home Monitoring of Tremor in Patients with Parkinson’s Disease. J. Med. Signals Sens. 2018, 8, 65–72. [Google Scholar] [CrossRef] [PubMed]


| Tremor Level | Gender (F—Female/M—Male) | Right Hand | Left Hand | Subtotal |
|---|---|---|---|---|
| 0—Normal | F | 7 | 6 | 13 |
| M | 5 | 4 | 9 | |
| 1—Slight | F | 2 | 3 | 5 |
| M | 4 | 5 | 9 | |
| 2—Mild | F | 0 | 0 | 0 |
| M | 1 | 2 | 3 | |
| Total | 19 | 20 | 39 |
| Data | Acquired Data | Coordinates | Total |
|---|---|---|---|
| Position, velocity | Thumb, index, middle, ring, little, palmar region | (x, y, z) | 36 |
| Rotation | Hand | (x, y, z, w) | 4 |
| Total | 40 | ||
| Classifier/Acc. | Cp(x) | Cp(y) | Cp(z) | Cp (x, y, z) |
|---|---|---|---|---|
| Bagged Tree | 100 | 100 | 100 | 100 |
| Boosted Tree | 99.8 | 33.3 | 99.5 | 100 |
| Coarse Gaussian Support Vector Machine (SVM) | 73.1 | 78.3 | 63.5 | 52.3 |
| Coarse K-Nearest Neighbor (KNN) | 90.4 | 96.8 | 90.4 | 86.5 |
| Cosine KNN | 99.6 | 99.9 | 100 | 99.5 |
| Cubic SVM | 99.8 | 93 | 86.8 | 92.5 |
| Complex Tree | 99.7 | 99.9 | 99.4 | 99.8 |
| Cubic KNN | 99.6 | 99.8 | 96.6 | 99.3 |
| Fine Gaussian SVM | 99.8 | 93 | 82.9 | 92.6 |
| Fine KNN | 100 | 100 | 99.4 | 100 |
| Linear Discriminant | 62.1 | 61.1 | 60 | 53.5 |
| Linear SVM | 67.3 | 77.8 | 57.3 | 52.9 |
| Medium Gaussian SVM | 97.1 | 93 | 77 | 87.6 |
| Medium KNN | 99.6 | 99.8 | 97.2 | 99.4 |
| Medium Tree | 99.7 | 99.9 | 93.7 | 96.3 |
| Quadratic Discriminant | 49.5 | 61.5 | 46.2 | 43.6 |
| Quadratic SVM | 99 | 98.2 | 81.3 | 85 |
| Random Under Sampling (RUS) Boosted Tree | 99.7 | 33.3 | 93.7 | 96.3 |
| Subspace KNN | 99.6 | 99.4 | 94 | 99.3 |
| Subspace Discriminant | 67.5 | 63.6 | 62.8 | 51.5 |
| Simple Tree | 88.3 | 97.2 | 77.8 | 74.5 |
| Weighted KNN | 100 | 99.9 | 98.7 | 99.9 |
| Mean Accuracy | 90.50 | 85.39 | 84.46 | 84.65 |
| ws | 149 | 299 | 449 | ||||||
|---|---|---|---|---|---|---|---|---|---|
| Min | Mean | Max | Min | Mean | Max | Min | Mean | Max | |
| Acc C | 0.8049 | 0.8189 | 0.8286 | 0.9181 | 0.9300 | 0.9395 | 0.9681 | 0.9801 | 0.9859 |
| Acc H | 0.8057 | 0.8257 | 0.8407 | 0.9226 | 0.9311 | 0.9395 | 0.9427 | 0.9599 | 0.9710 |
| P C0 | 0.7195 | 0.7533 | 0.7880 | 0.8879 | 0.9159 | 0.9395 | 0.9487 | 0.9714 | 0.9872 |
| P C1 | 0.8407 | 0.8771 | 0.9006 | 0.9324 | 0.9546 | 0.9680 | 0.9724 | 0.9880 | 0.9951 |
| P C2 | 0.7979 | 0.8262 | 0.8529 | 0.8879 | 0.9195 | 0.9386 | 0.9566 | 0.9811 | 0.9921 |
| P H0 | 0.7437 | 0.7835 | 0.8084 | 0.8701 | 0.9063 | 0.9297 | 0.9230 | 0.9514 | 0.9724 |
| P H1 | 0.7646 | 0.7996 | 0.8302 | 0.9208 | 0.9367 | 0.9520 | 0.9487 | 0.9628 | 0.9763 |
| P H2 | 0.8577 | 0.8939 | 0.9143 | 0.9279 | 0.9505 | 0.9689 | 0.9398 | 0.9655 | 0.9822 |
| Sens C0 | 0.7175 | 0.7480 | 0.7731 | 0.8879 | 0.9148 | 0.9416 | 0.939 | 0.9693 | 0.9831 |
| Sens C1 | 0.8500 | 0.8786 | 0.8962 | 0.9203 | 0.9470 | 0.9718 | 0.9765 | 0.9901 | 0.9970 |
| Sens C2 | 0.6983 | 0.7379 | 0.7702 | 0.8419 | 0.8991 | 0.9172 | 0.9436 | 0.9634 | 0.9820 |
| Sens H0 | 0.7280 | 0.7693 | 0.7898 | 0.8914 | 0.9092 | 0.9263 | 0.9229 | 0.9503 | 0.9725 |
| Sens H1 | 0.7935 | 0.8095 | 0.8399 | 0.9152 | 0.9383 | 0.9666 | 0.9241 | 0.9646 | 0.9826 |
| Sens H2 | 0.8237 | 0.8782 | 0.9046 | 0.8915 | 0.9177 | 0.9517 | 0.9003 | 0.9503 | 0.9798 |
| Sp C0 | 0.8624 | 0.8624 | 0.8904 | 0.9450 | 0.9450 | 0.9694 | 0.9744 | 0.9744 | 0.9934 |
| Sp C1 | 0.9219 | 0.9219 | 0.9494 | 0.9665 | 0.9665 | 0.9838 | 0.9863 | 0.9863 | 0.9975 |
| Sp C2 | 0.9020 | 0.9020 | 0.9295 | 0.9451 | 0.9451 | 0.9691 | 0.9787 | 0.9787 | 0.9960 |
| Sp H0 | 0.8744 | 0.8908 | 0.9019 | 0.9367 | 0.9533 | 0.9645 | 0.9620 | 0.9757 | 0.9861 |
| Sp H1 | 0.8853 | 0.9005 | 0.9139 | 0.9610 | 0.9684 | 0.9756 | 0.9744 | 0.9814 | 0.9880 |
| Sp H2 | 0.9306 | 0.9472 | 0.9558 | 0.9643 | 0.9752 | 0.9843 | 0.9704 | 0.9828 | 0.9910 |
| Reference | Technology Device | Acc. (%) | Sp. (%) | Sens. (%) | Classifier | Standard | #level |
|---|---|---|---|---|---|---|---|
| Our approach | LMC | 98 avg | BgT | MDS- UPDRS | 0,1,2 | ||
| Bazgir et al. [49] (2015) | Sony Xperia SP smartphone | 91 | 90.64 | 89.6 | Artificial Neural Network (ANN) | UPDRS | 0,1,2,3,4 |
| Rigas et al. [38] (2016) | Wrist-worn sensor | 94 | - | - | C4.5 Decision Tree | UPDRS | 0,1,2,3,4 |
| Jeon et al. [37] (2017) | Wrist-watch type | 85.55 (±6.03) 1 | - | - | Decision Tree | UPDRS | 0,1,2,3 |
| Bazgir et al. [51] (2018) | Sony Xperia SP Android smartphone | 100 | - | - | Naive Bayesian | UPDRS | 0,1,2,3,4 |
| STM32F407VG ARM-based microcontroller | 94 | - | - | ||||
| Kim et al. [50] (2018) | Wrist sensor | 85 | - | - | Convolutional Neural Network (CNN) | UPDRS | 0,1,2,3 |
© 2019 by the authors. Licensee MDPI, Basel, Switzerland. This article is an open access article distributed under the terms and conditions of the Creative Commons Attribution (CC BY) license (http://creativecommons.org/licenses/by/4.0/).
Share and Cite
Vivar, G.; Almanza-Ojeda, D.-L.; Cheng, I.; Gomez, J.C.; Andrade-Lucio, J.A.; Ibarra-Manzano, M.-A. Contrast and Homogeneity Feature Analysis for Classifying Tremor Levels in Parkinson’s Disease Patients. Sensors 2019, 19, 2072. https://doi.org/10.3390/s19092072
Vivar G, Almanza-Ojeda D-L, Cheng I, Gomez JC, Andrade-Lucio JA, Ibarra-Manzano M-A. Contrast and Homogeneity Feature Analysis for Classifying Tremor Levels in Parkinson’s Disease Patients. Sensors. 2019; 19(9):2072. https://doi.org/10.3390/s19092072
Chicago/Turabian StyleVivar, Guillermina, Dora-Luz Almanza-Ojeda, Irene Cheng, Juan Carlos Gomez, J. A. Andrade-Lucio, and Mario-Alberto Ibarra-Manzano. 2019. "Contrast and Homogeneity Feature Analysis for Classifying Tremor Levels in Parkinson’s Disease Patients" Sensors 19, no. 9: 2072. https://doi.org/10.3390/s19092072