A Fluorescence Inner-Filter Effect Based Sensing Platform for Turn-On Detection of Glutathione in Human Serum


Department of Pharmaceutical Analysis, Faculty of Pharmacy, Fujian Medical University, Fuzhou 350108, China
*
Author to whom correspondence should be addressed.
†
These authors contributed equally to this work.
Sensors 2019, 19(2), 228; https://doi.org/10.3390/s19020228
Submission received: 23 November 2018
/
Revised: 27 December 2018
/
Accepted: 2 January 2019
/
Published: 9 January 2019
(This article belongs to the Section Biosensors)
Abstract
:A novel turn-on fluorescence assay was developed for the rapid detection of glutathione (GSH) based on the inner-filter effect (IFE) and redox reaction. Molybdenum disulfide quantum dots (MoS2 QDs), which have stable fluorescent properties, were synthesized with hydrothermal method. Manganese dioxide nanosheets (MnO2 NSs) were prepared by exfoliating the bulk δ-MnO2 material in bovine serum albumin (BSA) aqueous solution. The morphology structures of the prepared nanoparticles were characterized by transmission electron microscope (TEM). Studies have shown that the fluorescence of MoS2 QDs could be quenched in the presence of MnO2 NSs as a result of the IFE, and is recovered after the addition of GSH to dissolve the MnO2 NSs. The fluorescence intensity showed a good linear relationship with the GSH concentration in the range 20–2500 μM, the limit of detection was 1.0 μM. The detection method was applied to the analysis of GSH in human serum samples. This simple, rapid, and cost-effective method has great potential in analyzing GSH and in disease diagnosis.
1. Introduction
Glutathione (GSH), the most abundant intracellular low-molecular-weight biothiol, is a tripeptide consisting of cysteine, glutamic acid, and glycine. As an essential endogenous antioxidant, GSH plays crucial roles in biological systems and many cellular processes, such as maintaining the appropriate intracellular redox status, protecting against many toxins, and promoting metabolism [1]. Abnormal GSH levels in the blood are closely related with some clinical diseases including leucocyte loss, inflammation, liver damage, psoriasis, Parkinson’s, Alzheimer’s, and cancer [2,3]. It has been found that the GSH level is significantly elevated in cancer cells [4]. Therefore, developing a simple and sensitive method for GSH detection in human serum is critically important for understanding GSH homeostasis in clinical settings and in effective cancer diagnosis at an early stage.
To date, a number of analytical methods have been established for GSH measurement, including high-performance liquid chromatography [5], mass spectrometry [6], surface enhanced Raman scattering [7], enzyme-linked immunosorbent assay [8], electrochemical analysis [9], and fluorescence spectroscopy [10]. Fluorescence spectrometry has been found to be a powerful tool for GSH detection because of its simplicity, high sensitivity, good flexibility, and nondestructive readout [11,12]. Several fluorescence assays have been developed for estimating GSH levels in biological samples [13,14]. Most of these assays are based on fluorescence “turn-off” patterns or organic dye probes, which make them susceptible to false positive results, lowered sensitivity, or poor photostability. Thus, we still need to establish a novel fluorescence “turn-on” method for the sensing of GSH.
Owing to the exceptional advantages, fluorescent nanomaterials have recently gained great attention as promising substitutes for organic dyes, such as quantum dots [15,16], gold nanoclusters [17,18], carbon dots [19,20], and upconversion nanoparticles [21]. Among them, quantum dots (QDs), which display superior properties including a high-fluorescence quantum yield, size/composition-dependent tunable luminescence, broad excitation/narrow emission spectrum, excellent stability, and good resistance to photobleaching [22], have become ideal probes for signal transduction in the fluorescent assays. For instance, CdSe@ZnS QDs have been used to construct a fluorescence lateral flow biosensor for the rapid detection of GSH [16]. Crystal violet-functionalized CdTe QDs were synthesized for detecting GSH in water [23]. Au nanocluster based fluorescent sensor has been designed for turn-on sensing of GSH, in which Hg2+ acted as a quencher [24]. The introduction of highly toxic heavy metal ions (Cd2+ or Hg2+) into these systems posed a big threat to the environment. MoS2 QDs, novel fluorescent nanoparticles with ideal environmental compatibility, high fluorescent intensity, easy operability, and a low cost are a promising candidate for GSH analysis [25,26,27].
Conventional sensing systems based on fluorescence resonance energy transfer (FRET) have been used to detect various analytes. However, they only work when the fluorophore and quencher are at a particular distance, which restrict the application of FRET-based fluorescence assays. The fluorescence inner-filter effect (IFE) refers to the absorption of the excitation/emission light of fluorophores by appropriate absorbers [28]. The sensitivity of the IFE system can be enhanced due to that the fluorescence of fluorophore would be exponentially changed with the absorbance of absorber [29]. MnO2 nanosheets (NSs), a new class of two-dimensional nanomaterials, have received increasing attention due to their attractive characteristics, including their high specific surface area, broad absorption spectrum (200–600 nm), large extinction coefficient (9.6 × 10³ M−1 cm−1) [30], unique redox activity, stability, and biocompatibility [31]. These features enable them to be used as a potentially ideal fluorescent absorber in the IFE-based assay.
Herein, we developed a simple “turn-on” fluorescence assay for the rapid detection of GSH based on the IFE. In this system, MoS2 QDs were used as the fluorophore and MnO2 NSs as the absorber. The existence of GSH can cause the decomposition of MnO2 NSs, leading to a concentration-dependent reduction of MnO2 and proportional increase of the fluorescence. This assay can be conveniently used for the sensing of GSH in human blood serum, which holds great promise for biomedical applications.
2. Materials and Methods
2.1. Materials and Instruments
Hydrogen peroxide (H2O2) was purchased from Hengxing Chemical Reagent Co., Ltd. (Tianjin, China). Sodium molybdate dihydrate (Na2MoO4·2H2O) was purchased from Phygene Biotechnology Co., Ltd. (Fuzhou, China). Manganese sulfate monohydrate (MnSO4·H2O), magnesium chloride hexahydrate (MgCl2·6H2O), sodium chloride (NaCl), calcium chloride (CaCl2), copper sulfate (CuSO4), and hydrochloric acid (HCl) were purchased from the Sinopharm Chemical Reagent Co., Ltd. (Shanghai, China). Bovine serum albumin (BSA), tetramethylammonium hydroxide (TMA·OH), glutathione (GSH), oxidized glutathione (GSSG), l-glutamate (l-Glu), l-histidine (l-His), l-phenylalanine (l-Phe), glycine (Gly), cystine (3,3′-Dith), l-methionine (l-Met), and dl-α-aminopropionic acid (dl-α-Ala) were purchased from Aladdin Reagent Company (Shanghai, China). The reagents used were all analytical grade. Human serum was kindly provided by the Hospital of Fujian Medical University. Deionized water was prepared by Milli-Q Water Purification System for all the experiments.
The absorption spectra were conducted on a UV-2600 UV-vis spectrophotometer (Shimadzu, Tokyo, Japan). Fluorescence spectrum was recorded on an F-4600 fluorescence spectrophotometer (Hitachi, Tokyo, Japan). High-resolution transmission electron microscopic (HRTEM) imaging was performed on a JEOL 2100F field emission transmission electron microscope (JEOL, Tokyo, Japan). The dynamic light scattering (DLS) experiment was performed on a Zetasizer Nano-ZS90 (Malvern, Worcestershire, UK). The XRD pattern was obtained by a D8 Advance X-ray diffractometer (Bruker, Karlsruhe, Germany). Absolute fluorescence quantum yields (QY) measurements were conducted on an Edinburgh FLS 980 spectrometer with an integrating sphere (Edinburgh, Livingston, UK).
2.2. Preparation of Bulk δ-MnO2 and MnO2 NSs
Bulk δ-MnO2 was prepared as reported previously [32]. Typically, 20 mL of a mixture containing TMA·OH (0.6 M) and H2O2 (3 wt %) was added into 10 mL of MnSO4 (0.3 M) aqueous solution within 15 s. The as-prepared dark brown solution was stirred vigorously overnight at room temperature. Then, the resulting precipitate was removed by centrifugation at 10,000 rpm for 10 min, and washed three times with ultrapure water. Finally, the precipitate was dried in a vacuum oven at 30 °C.
The MnO2 NSs were prepared by exfoliating the bulk δ-MnO2 in BSA aqueous solution [33]. Briefly, 10 mg bulk δ-MnO2 was added into a 10 mL BSA (1 mg/mL) aqueous solution and the mixture was sonicated for 12 h. Then, the suspension was centrifuged at 1000 rpm for 20 min to remove the unexfoliated MnO2. The supernatant, which contained the MnO2 NSs, was collected and stored in a refrigerator at 4 °C.
2.3. Preparation of MoS2 QDs
MoS2 QDs were synthesized by a hydrothermal method according to the literature [34] with some modifications. Concisely, 0.25 g of Na2MoO4·2H2O was dissolved in 25 mL of water and subjected to ultrasonication for 5 min. Then, the solution was adjusted to pH 6.5 with 0.1 M HCl. After that, 0.5 g Cys and 50 mL water were added into the solution followed by ultrasonication for 10 min. The mixture was then heated in a Teflon-lined stainless steel autoclave at 200 °C for 36 h. After cooling to room temperature, the supernatant was collected after being centrifuged at 12,000 rpm for 30 min. Finally, the stable MoS2 QDs were obtained after dialyzed for 19 h to remove the impurity using dialysis bag (3500 Da).
2.4. Detection of GSH
Firstly, 5 μL of GSH aqueous solution with different concentrations was added into 100 μL of 0.2 M acetate buffer (pH = 5.0) in a low adsorption tube. Then, 15 μL of MnO2 NSs (1.0 mM) was added and the mixture was shaken and reacted for 10 min. Next, 80 μL of MoS2 QDs (1.6 mg/mL) was added into the as-prepared solution, shaking well to ensure complete reaction. Finally, the fluorescence intensity of the whole reaction solution was detected at room temperature (Ex: 320 nm, Em: 340–600 nm, the peak was about 400 nm). The specific experiments were conducted in the same way, except using other amino acid instead of GSH solution.
2.5. Analysis of GSH in Human Serum Samples
The standard addition method was used to analyze the GSH level in human serum. Briefly, 95 μL of 0.2 M acetate buffer (pH = 5.0), 5 μL different concentrations of GSH aqueous solution, 5 μL human serum, and 15 μL of MnO2 NSs were added into a low-adsorption tube. After being reacted for 10 min, 80 μL of MoS2 QDs was added into the above mixture, shaking well to ensure complete reaction. Finally, the fluorescence intensity of the resulting solution was measured. The whole process was carried out at room temperature.
3. Results and Discussion
3.1. Fluorescence Sensing Principle of GSH
The sensing principle of GSH is shown in Scheme 1. The synthesized MoS2 QDs emitted blue fluorescence under irradiation at 320 nm. MnO2 NSs possessed a broad absorption spectrum and large molar extinction coefficient, making them a promising quencher in the IFE. After the addition of MnO2 NSs, the fluorescence of MoS2 QDs was effectively quenched as a result of the IFE. In the presence of reductive GSH, the MnO2 NSs (strong oxidation ability) can be decomposed through the redox reaction. The released Mn2+ lost its quenching ability, thus the fluorescence of MoS2 QDs was recovered. On the basis of this mechanism, a “turn-on” fluorescent detection method was developed for the rapid sensing of GSH in human serum.
3.2. Characterization of MoS2 QDs and MnO2 NSs
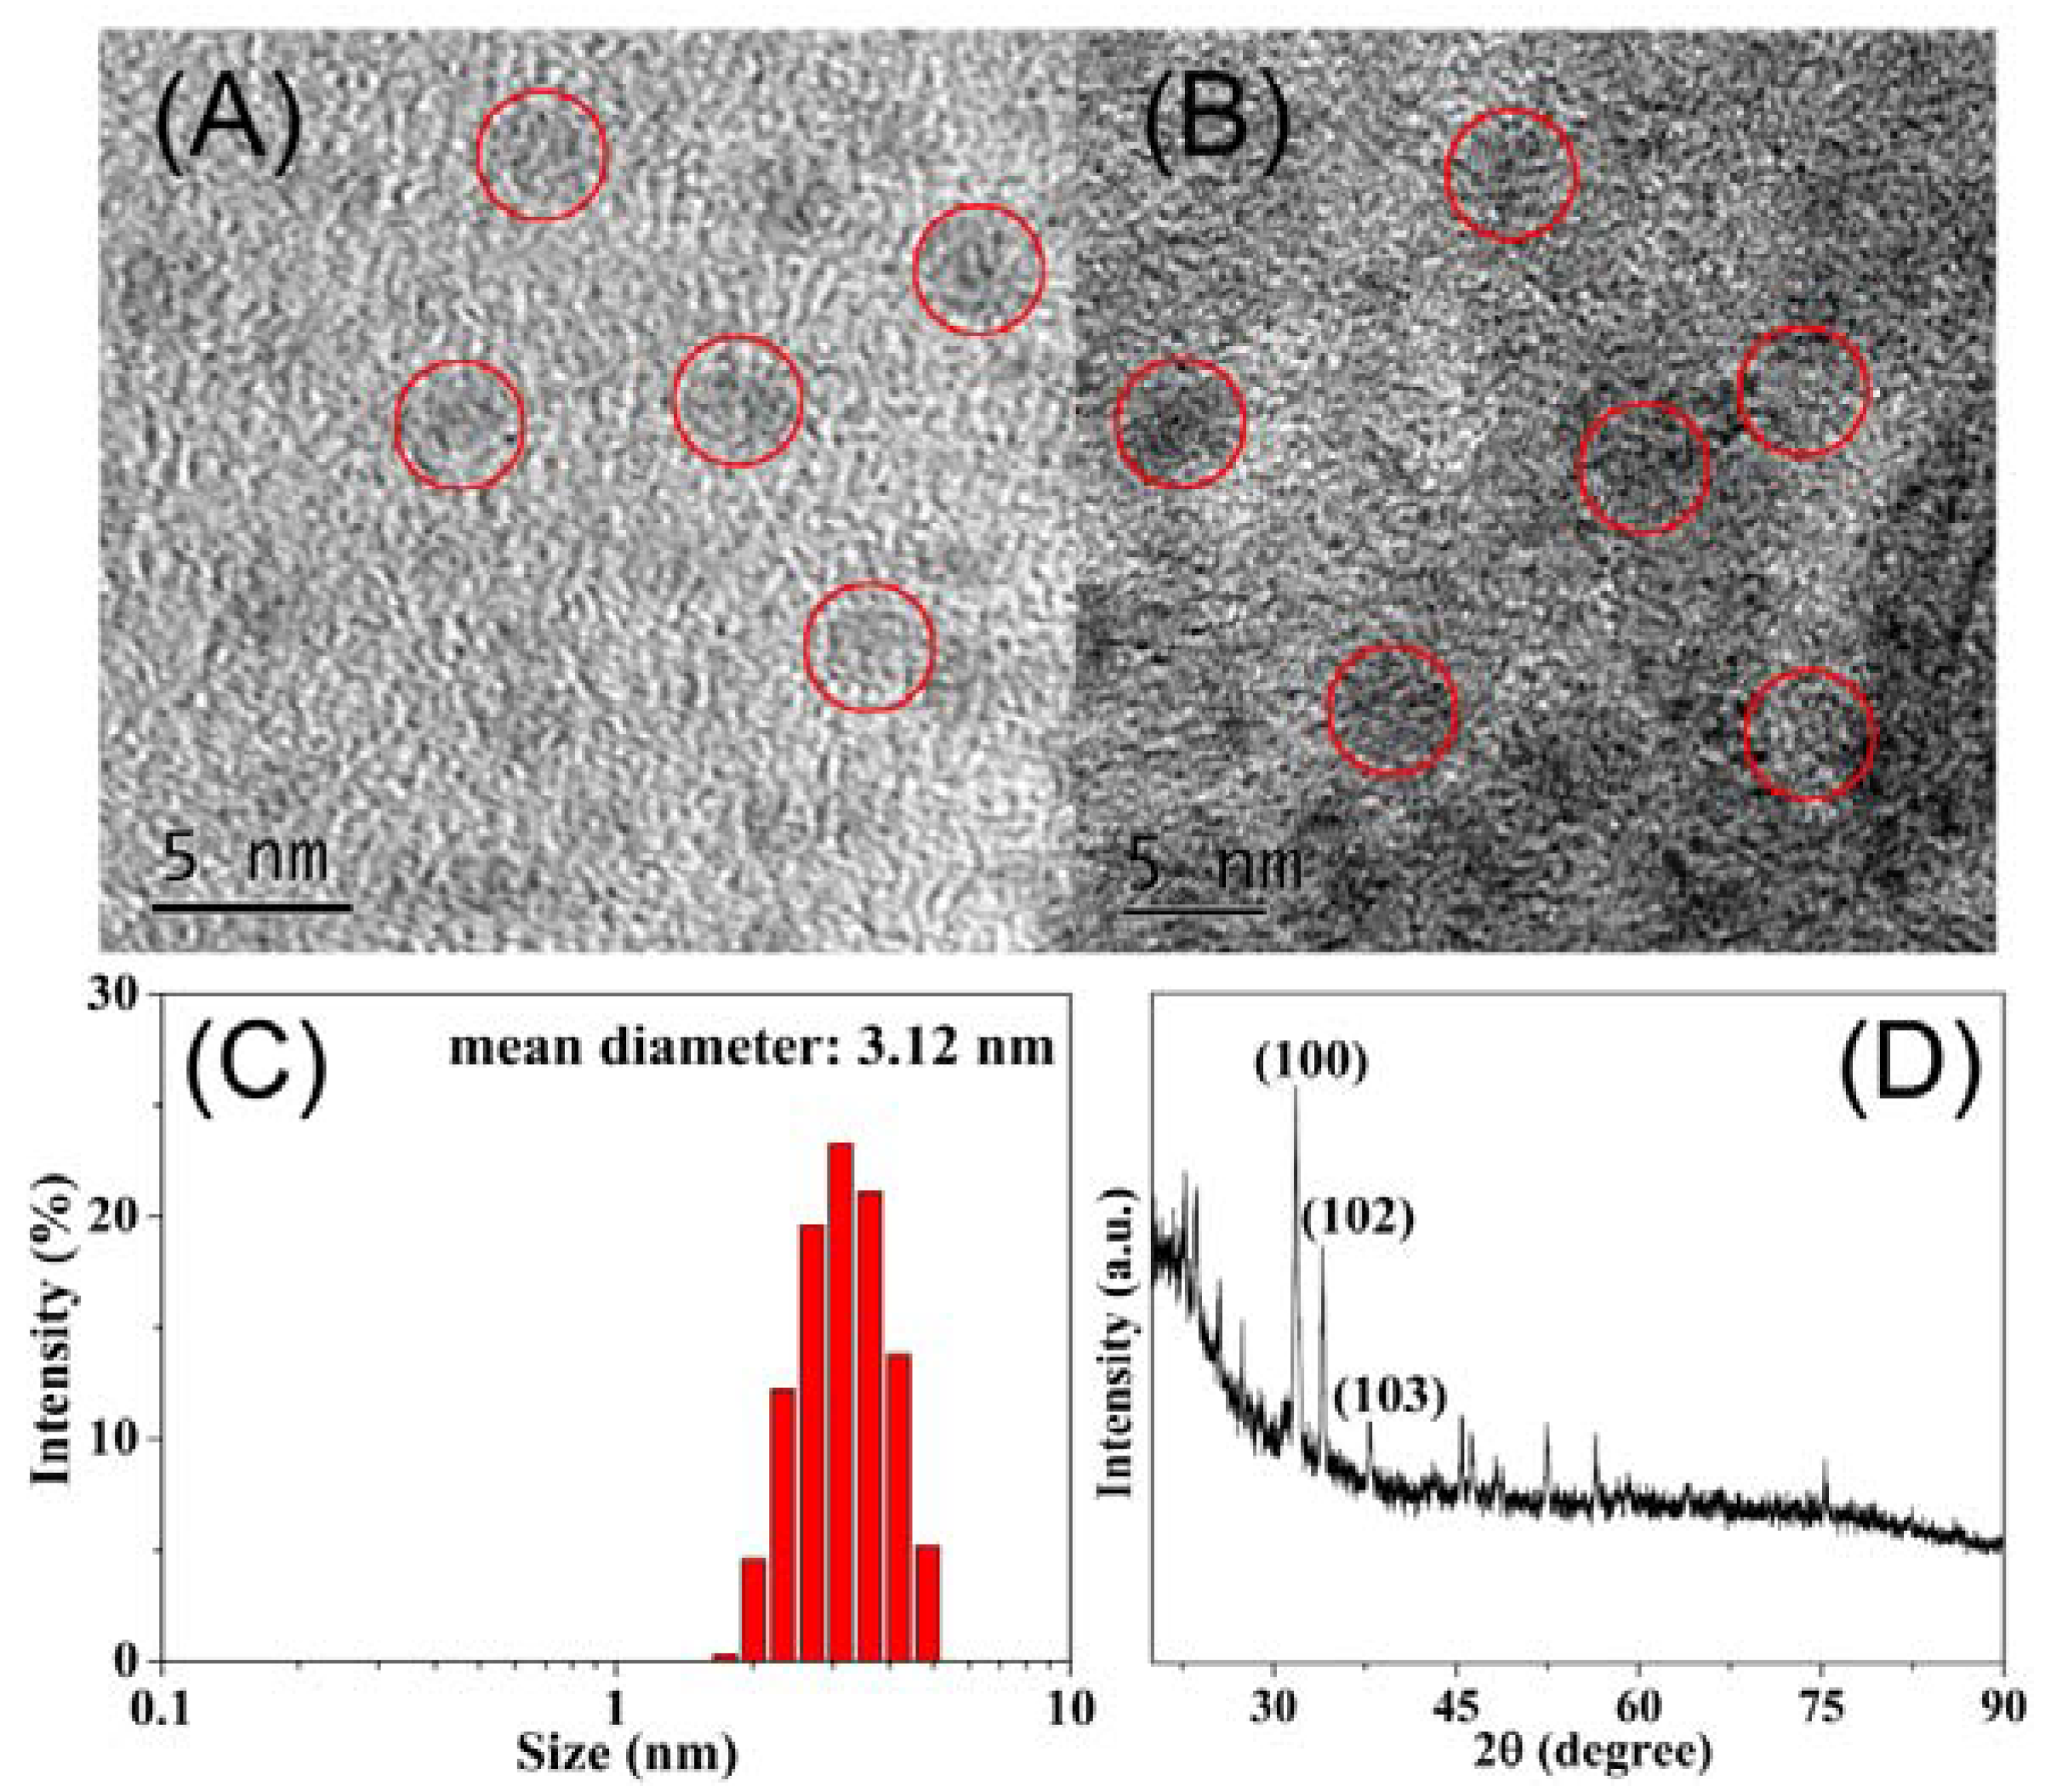
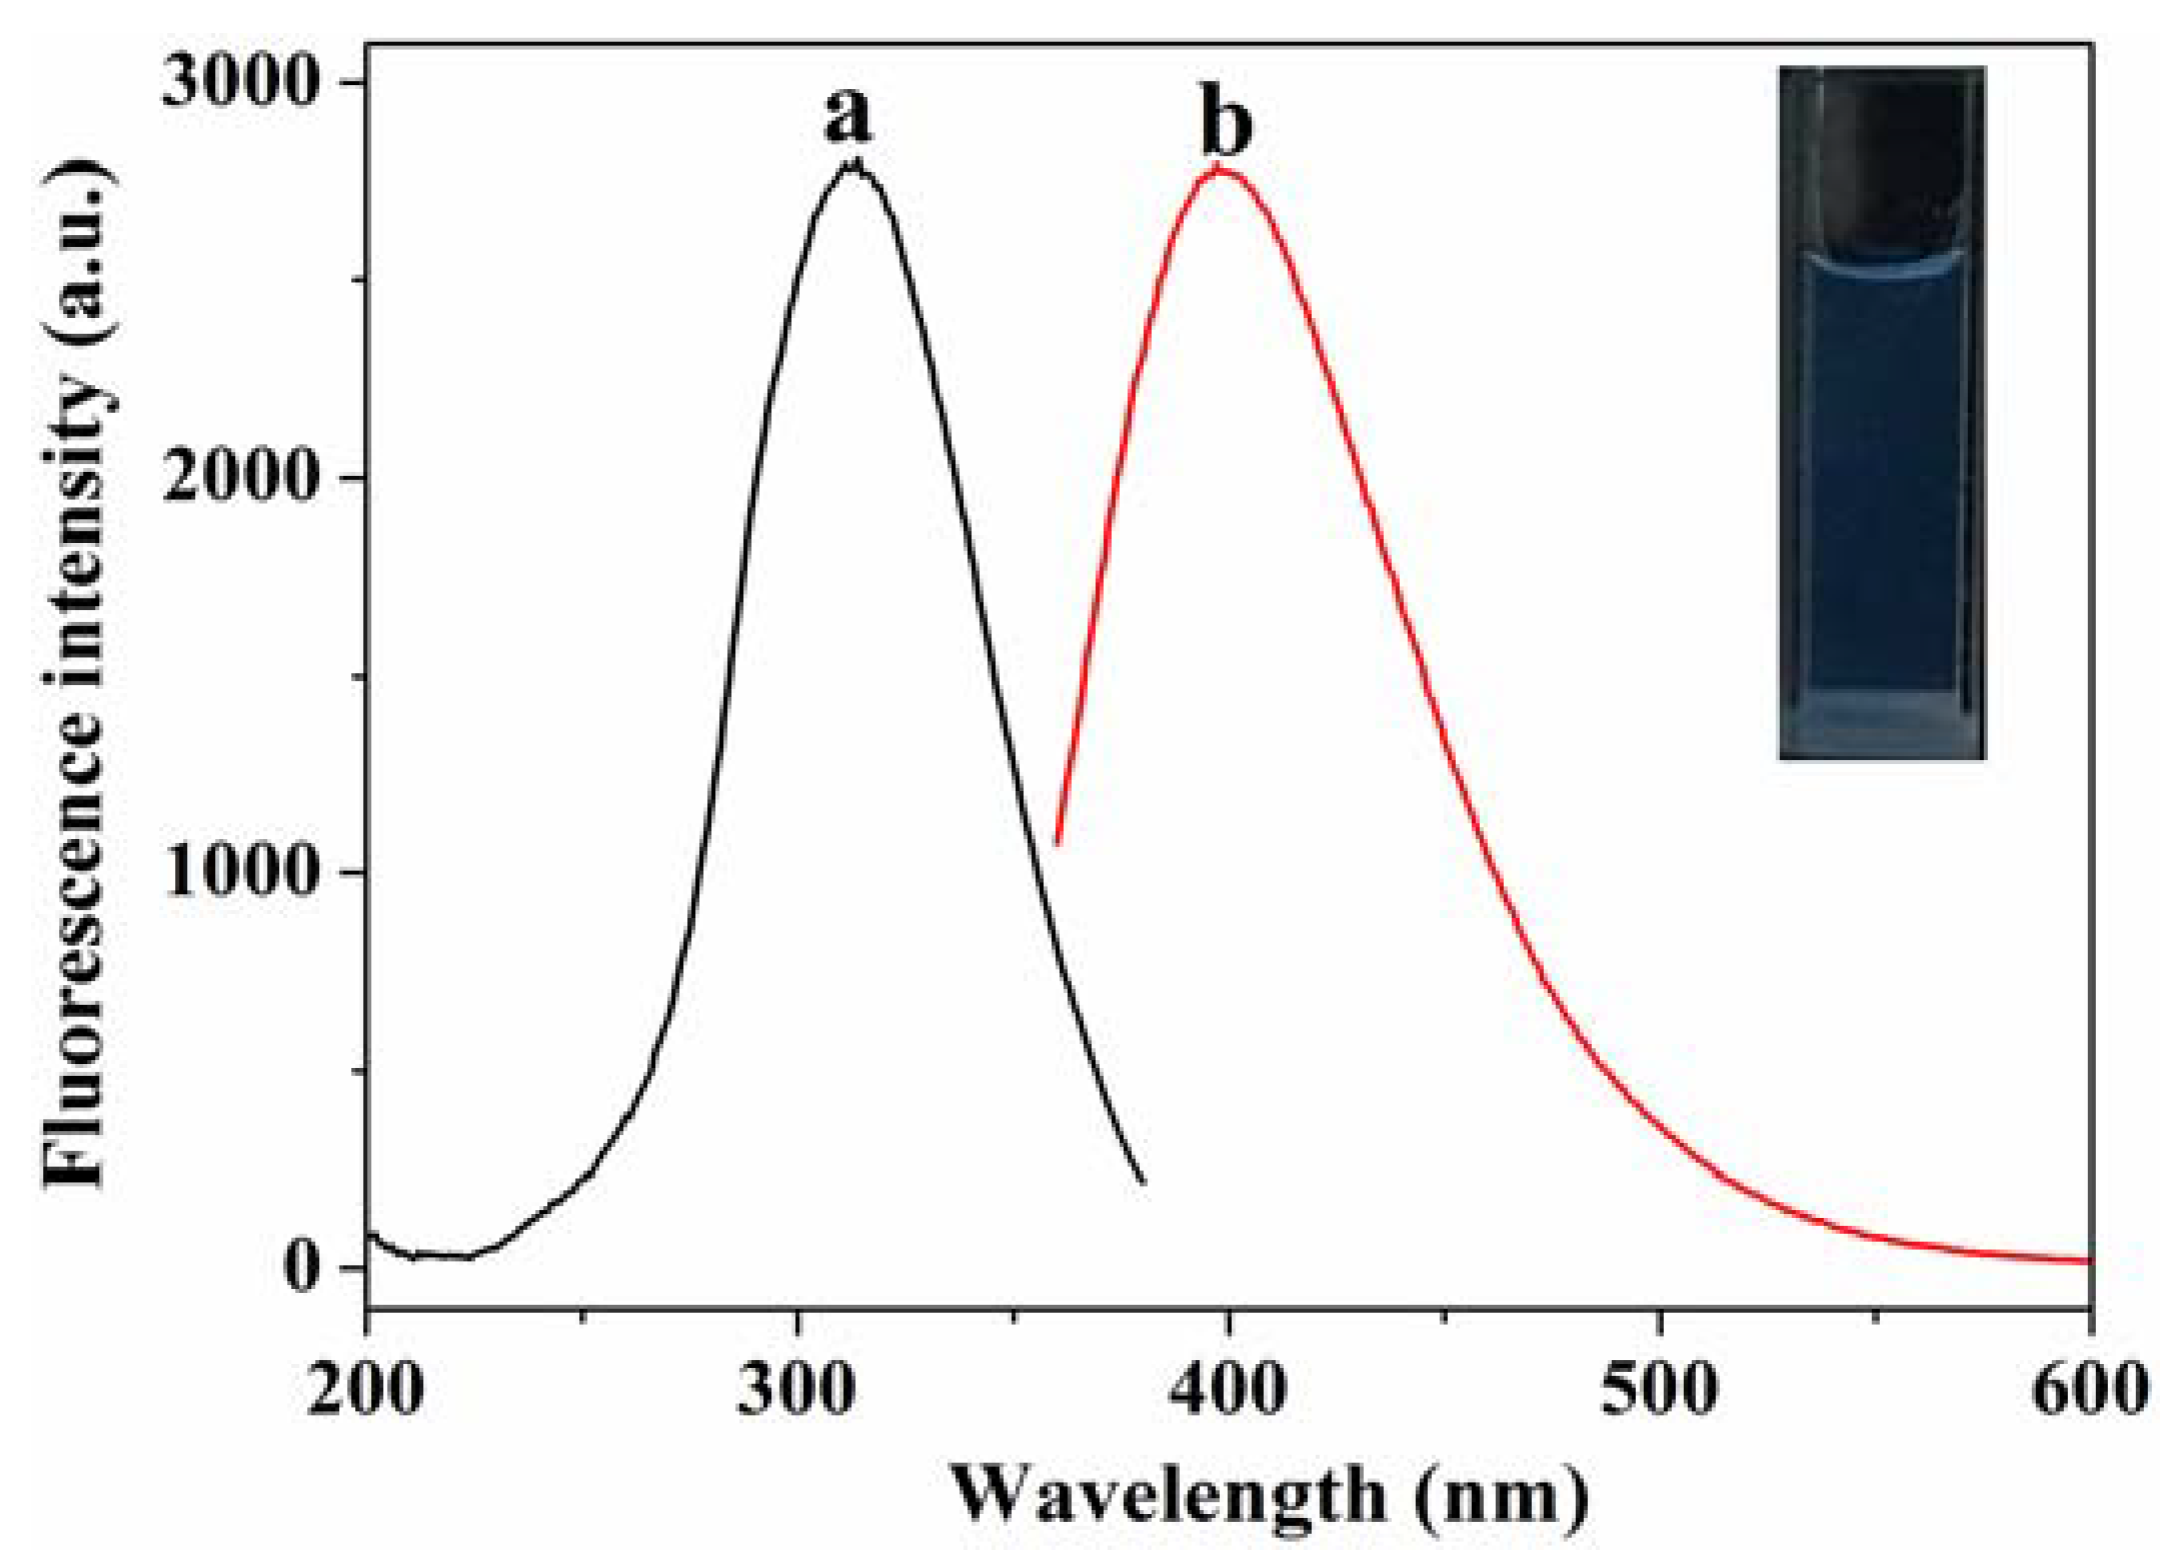
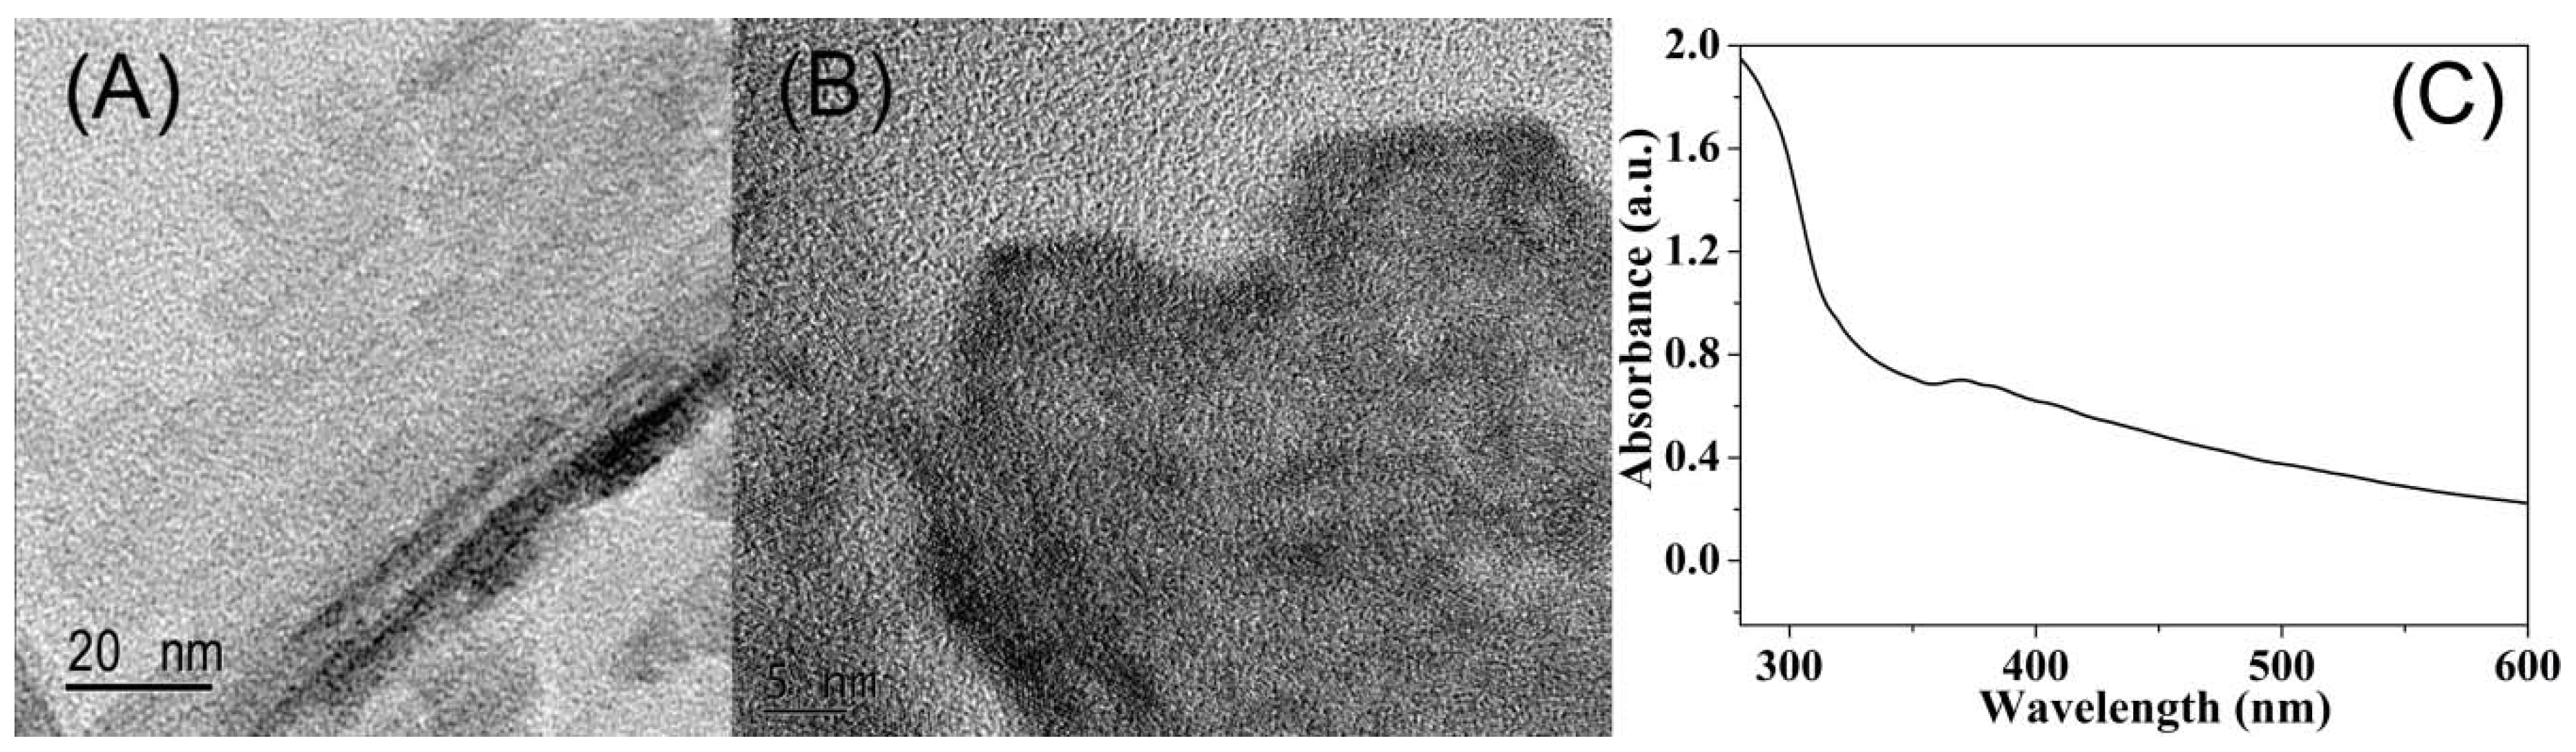
The morphologies of MoS2 QDs and MnO2 NSs were characterized by transmission electron microscopy (TEM). TEM (Figure 1A) and DLS (Figure 1C) analysis results show that the synthesized MoS2 QDs are well dispersed with the particle size of about 3 nm. The HRTEM image shows that the MoS2 QDs has obvious lattice fringes (Figure 1B). Figure 1D is the XRD spectrum of MoS2 QDs. Three major diffraction peaks attributed to (100), (102), and (103) planes of MoS2 can be observed [34]. The fluorescence properties of the MoS2 QDs were further investigated. From Figure 2, it was clearly observed that the most intense peak of MoS2 QDs appeared at 320 nm in the excitation spectrum (curve a). Under this excitation light, a well distinguishable peak with maximum emission intensity at 400 nm appeared (curve b). The MoS2 QDs solution emitted blue fluorescence when exposure to a 365 nm UV lamp (inset Figure 2). As shown in Figure 3A, an ultrathin lamellar structure with an irregular edge of MnO2 NSs was observed. Figure 3B shows the HRTEM image of MnO2 NSs with the diffraction pattern. The UV-Vis spectrum shows that the prepared MnO2 NSs possessed a broad absorption in the range 200–600 nm (Figure 3C).
3.3. Feasibility Analysis of GSH Detection
To investigate the ability of GSH to dissolve MnO2 NSs, different concentrations of GSH were added into the MnO2 NSs, and then the solutions were analyzed by UV-Vis spectrophotometer. As shown in Figure 4, the MnO2 NSs has a characteristic absorption peak at about 380 nm (curve a), which is consistent with the literature [35]. With the increase of GSH concentration, the absorption intensity decreased (curve b–e) and the color of the solution became gradually shallower (inset Figure 4). These results indicated that the MnO2 NSs can be decomposed by GSH through the redox reaction [36]. According to the Beer-Lambert law (A = kbc, k = 9.6 × 10³ M−1 cm−1, b = 1 cm), the concentration of the synthetic MnO2 NSs was calculated to be about 1 mM.
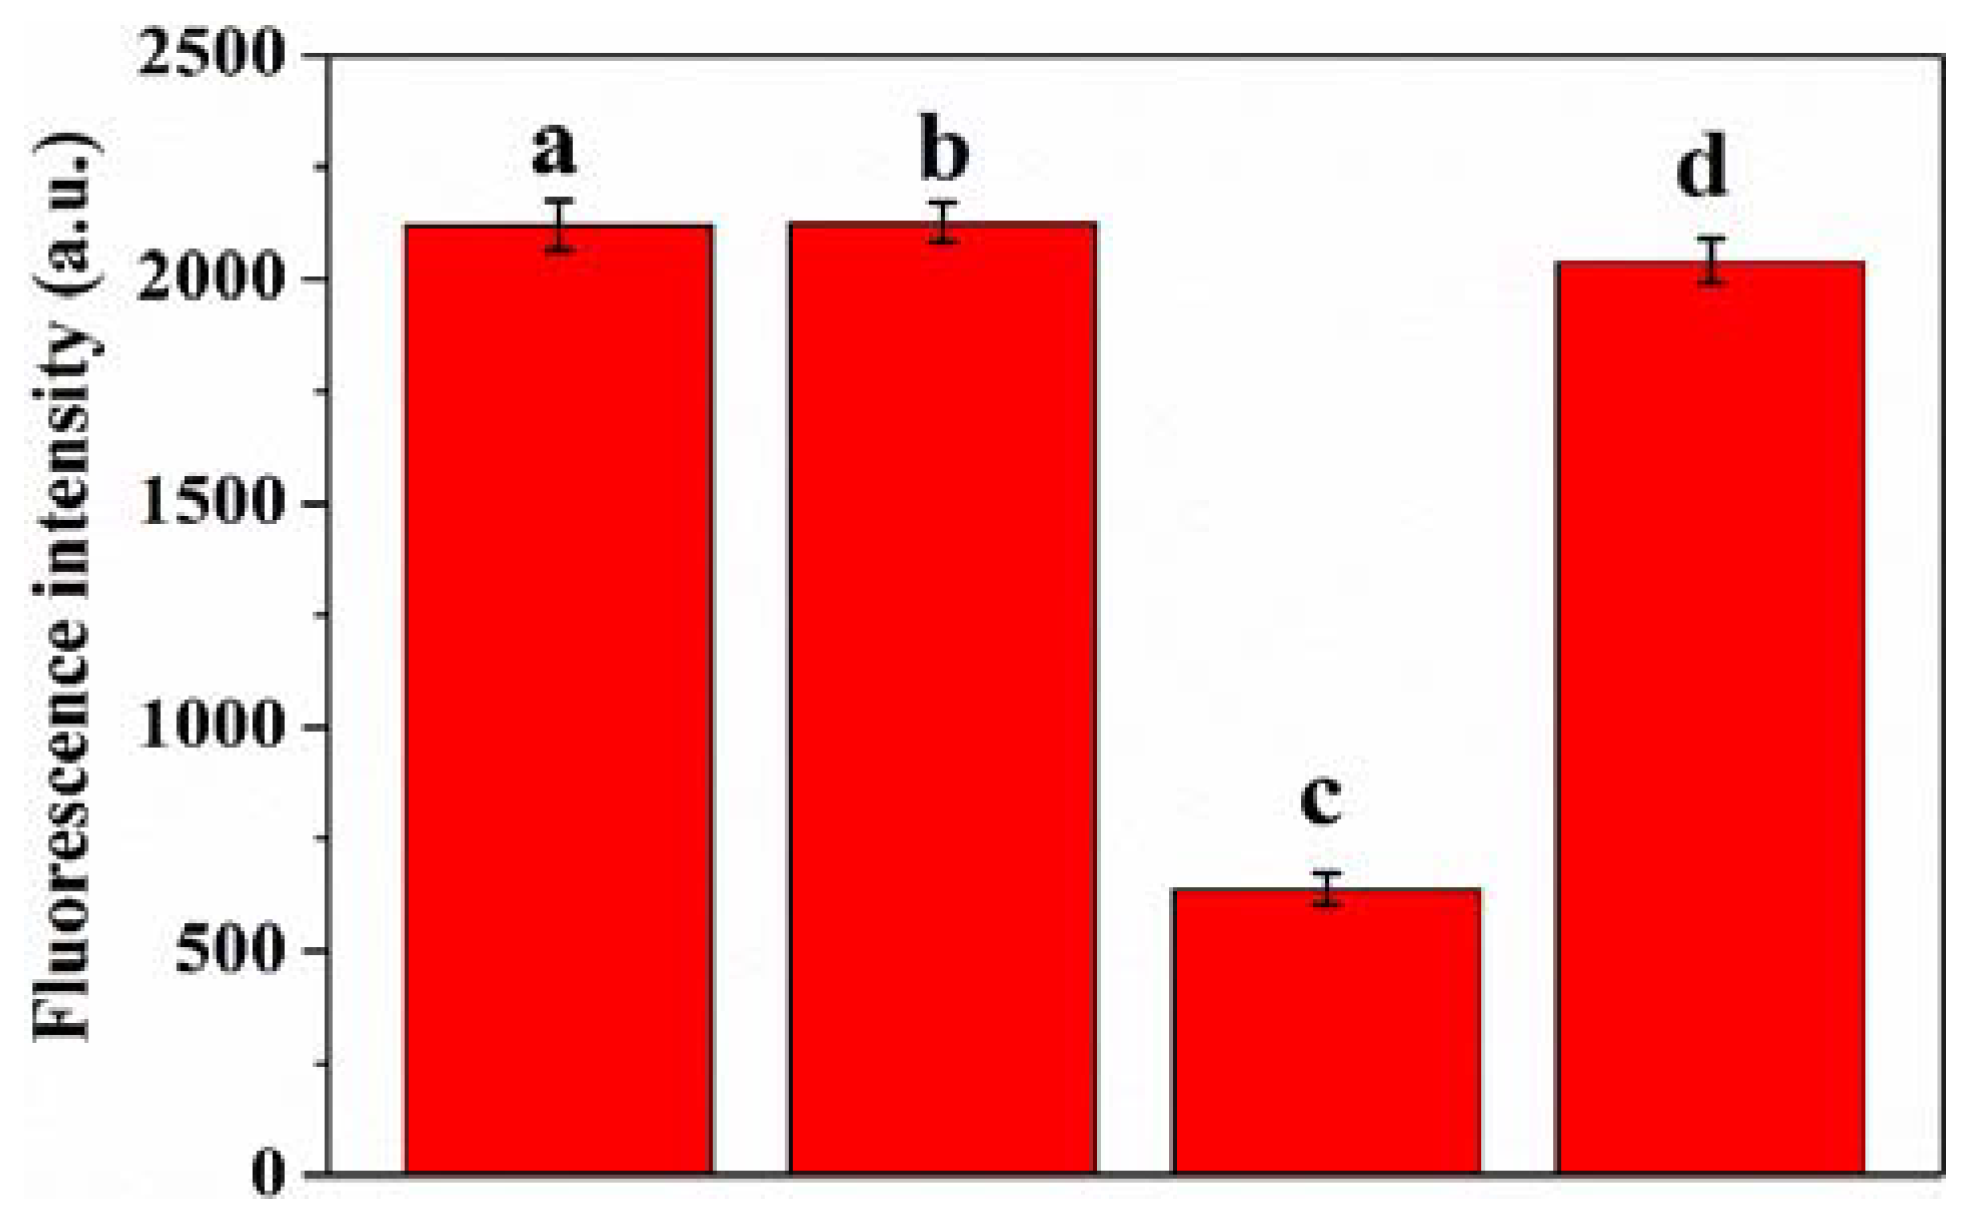
In order to verify the fluorescence sensing feasibility of GSH based on the probe of MoS2 QDs and MnO2 NSs, serials experiments were performed (Figure 5). It can be seen that MoS2 QDs emitted strong fluorescence (bar graph a). The added GSH did not greatly change the fluorescence intensity of MoS2 QDs (bar graph b). After addition of MnO2 NSs, the fluorescence of MoS2 QDs was significantly quenched (bar graph c). In the presence of GSH, the MnO2 NSs was dissolved and thus recovered the fluorescence (bar graph d). Therefore, it can be proved that the proposed fluorescence assay was feasible for the “turn-on” detection of GSH. The QY of the MoS2 QDs probe and for the restored fluorescence in the presence of GSH were measured to be 2.13% and 2.39% by the absolute quantum yield measurement method, respectively.
3.4. Optimization of Experimental Conditions
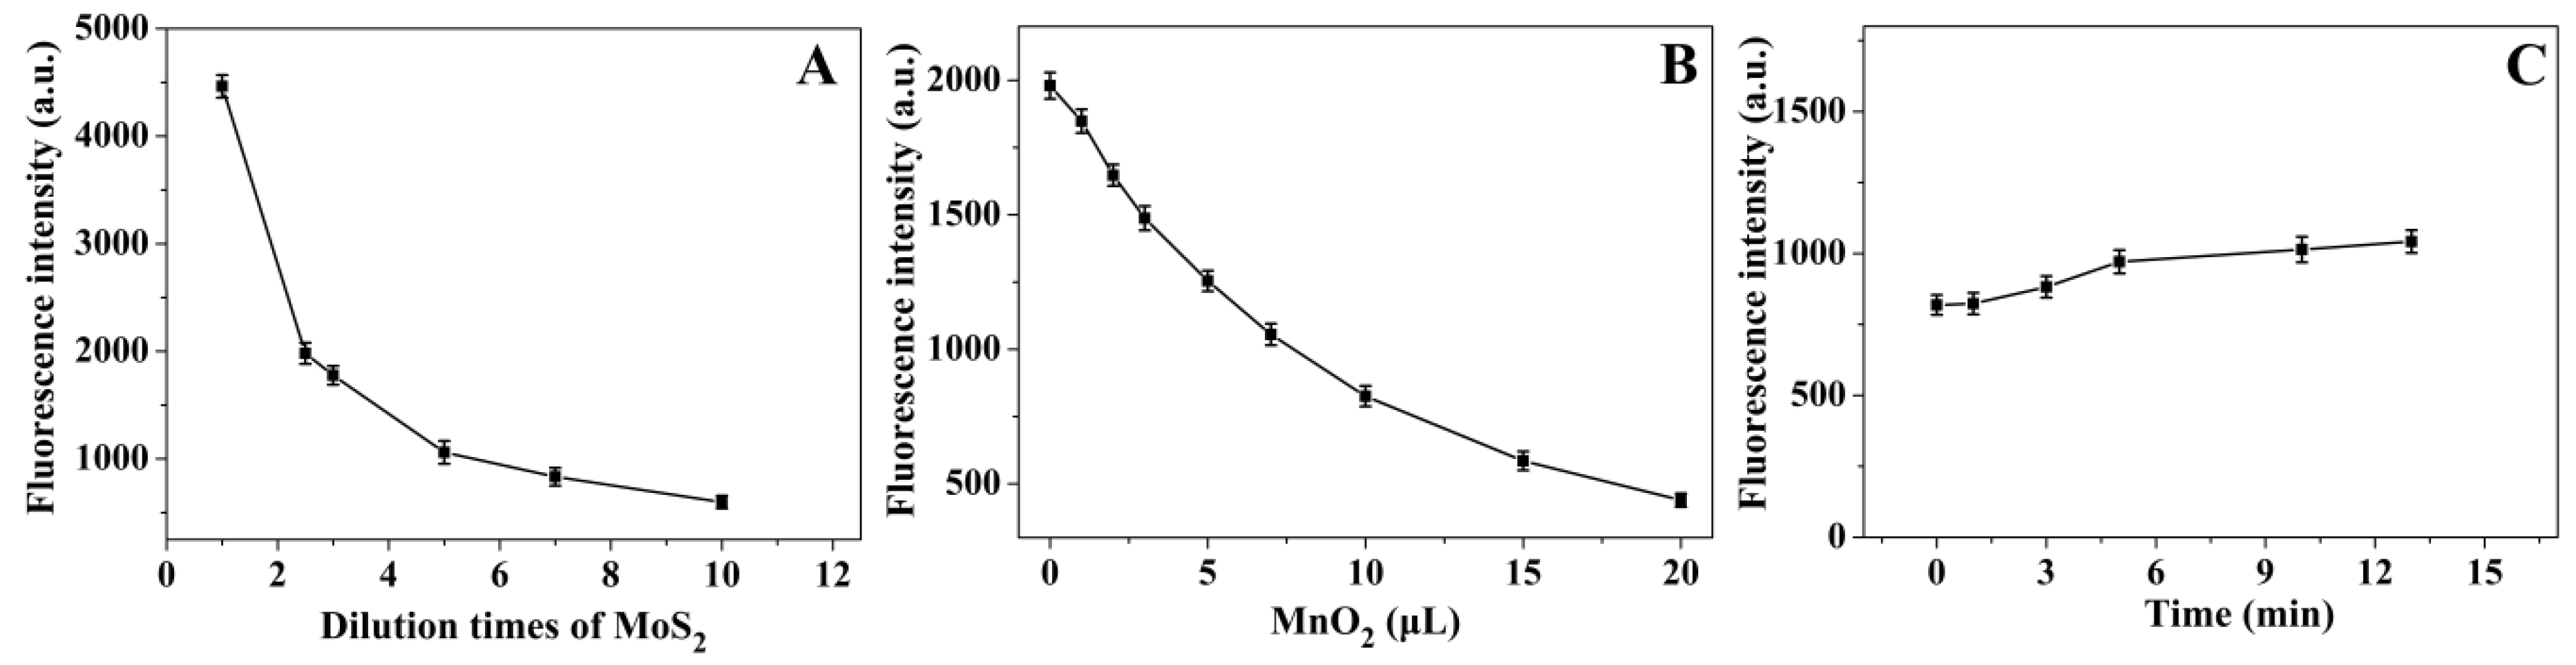
The concentration of MoS2 QDs and MnO2 NSs, used as the fluorescence and quencher probe, respectively, have a great effect on the detection sensitivity. The fluorescence intensities of different concentrations of MoS2 QDs solutions were determined. As shown in Figure 6A, the fluorescence intensity decreased as the dilution multiple of the MoS2 QDs increased, then the decreasing trend gradually tended to be gentle. Considering the sensitivity and fluorescence intensity, the final concentration of 2.5-fold diluted MoS2 QDs solution was used in the following experiments. As the amount of MnO2 NSs increased, the fluorescence of MoS2 QDs sharply decreased (Figure 6B). Excessive MnO2 NSs reduces the GSH detection sensitivity. After a comprehensive analysis of the fluorescence inhibition degree and sensitivity, 15 µL of MnO2 NSs was finally selected. The reaction time between GSH and MnO2 NSs was also investigated. The fluorescence intensity increased gradually with the time prolonging from 0 to 10 min, then it tended to be stable (Figure 6C). Therefore, the reaction time was selected to be 10 min.
3.5. GSH Detection Sensitivity
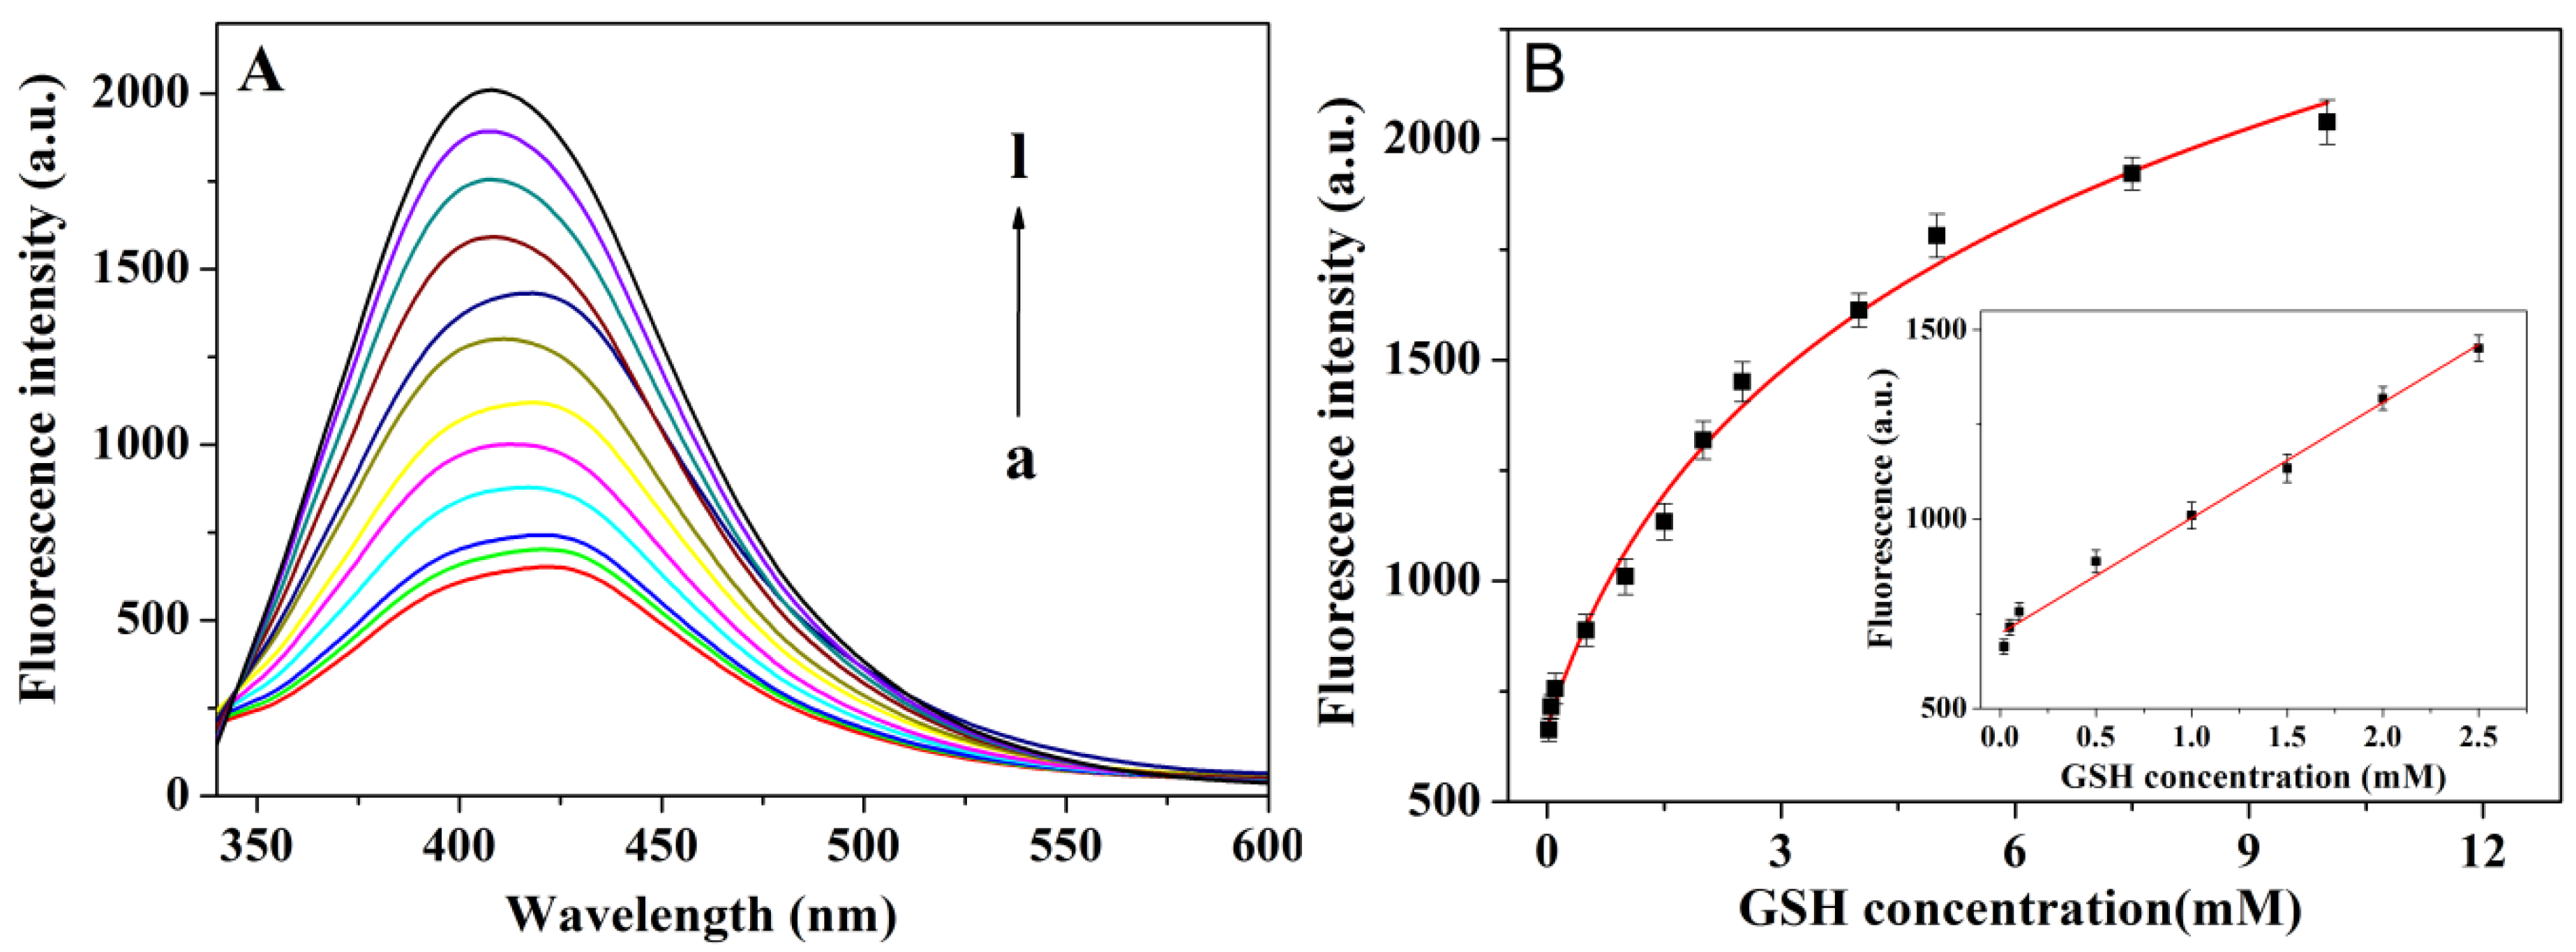
To investigate the capability of the fluorescence assay for quantitative measurement of GSH, different concentrations of GSH were added to the system and the fluorescence responses were recorded under optimal conditions. The fluorescence of MoS2 QDs was found to be gradually restored with an increasing concentration of GSH (Figure 7A). The more GSH added, the more MnO2 NSs decomposition, which resulted in a restoration of the fluorescence. The standard curve was obtained between the fluorescence intensity and the GSH concentration (Figure 7B). The inset in Figure 7B shows that the fluorescence intensity was linearly related to the GSH concentration in a range from 0.02 to 2.5 mM with a correlation coefficient of 0.996. The linear equation is Y = 301.94X + 702.72, where Y is the fluorescence intensity and X is the concentration of GSH (mM). The detection limit was calculated to be 1.0 μM according to the three-fold standard deviation of the blank signal (3σ). As shown in Table 1, the detection sensitivity was comparable to that of some reported methods and could meet the requirement of GSH detection in biological and clinical applications (mM levels) [7].
3.6. Interference Detection Results
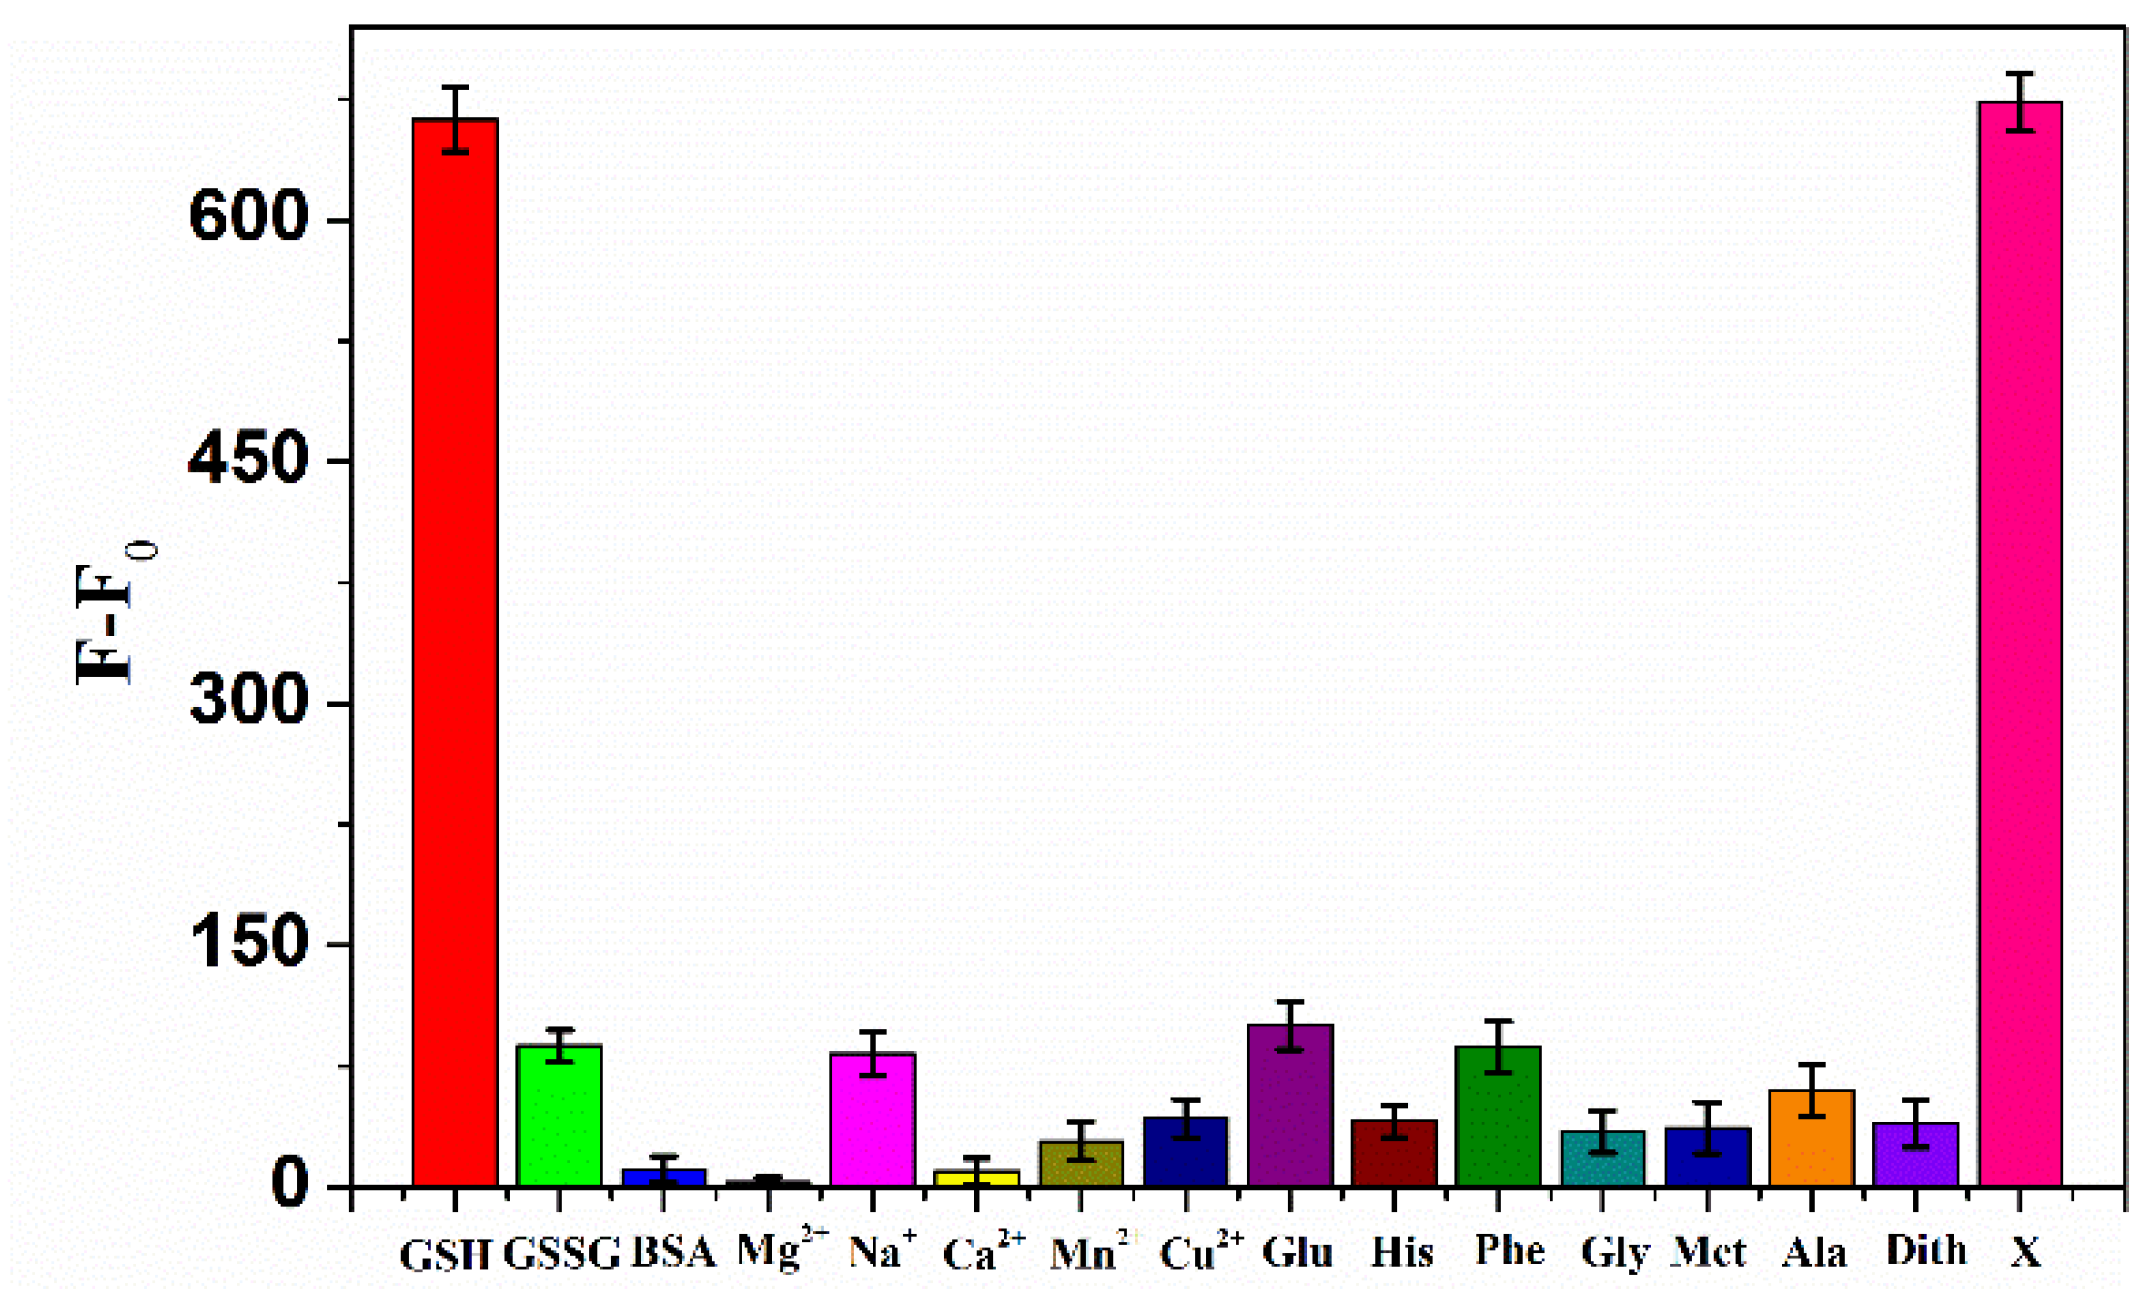
To assess the selectivity of GSH detection based on the MoS2 QDs-MnO2 NSs system, the influence of some amino acids, metal ions, and proteins which possibly exist in human serum was studied. As shown in Figure 8, the system exhibited a remarkable increase in fluorescence in the presence of GSH. On the contrary, there were no obvious changes in fluorescence intensity with the other molecules. It was also found that when GSH was mixed with some other amino acids, the fluorescent intensity was similar to GSH alone. Although a high concentration of cysteine (Cys) and homo-cysteine (H-Cys) can cause a measurable fluorescence response to this system, their contents (μM levels) are much lower than that of GSH (mM levels) in biological systems [41,42]. These results show that the system displays a highly selective response of fluorescence enhancement towards GSH over other molecules.
3.7. GSH Detection in Human Serum
Human serum experiments were further performed to investigate the feasibility of the MoS2 QDs-MnO2 NSs system in the analysis of GSH in actual samples. Different concentrations of standard GSH were spiked in the human serum and the samples were measured in parallel three times. As shown in Table 2, the recovery rate of the method was found to be 99.2–104%, and the RSD was within 10%. It is shown that this method can be used for the detection of GSH in human serum with acceptable reproducibility and accuracy.
3.8. Reaction Mechanism Discussion
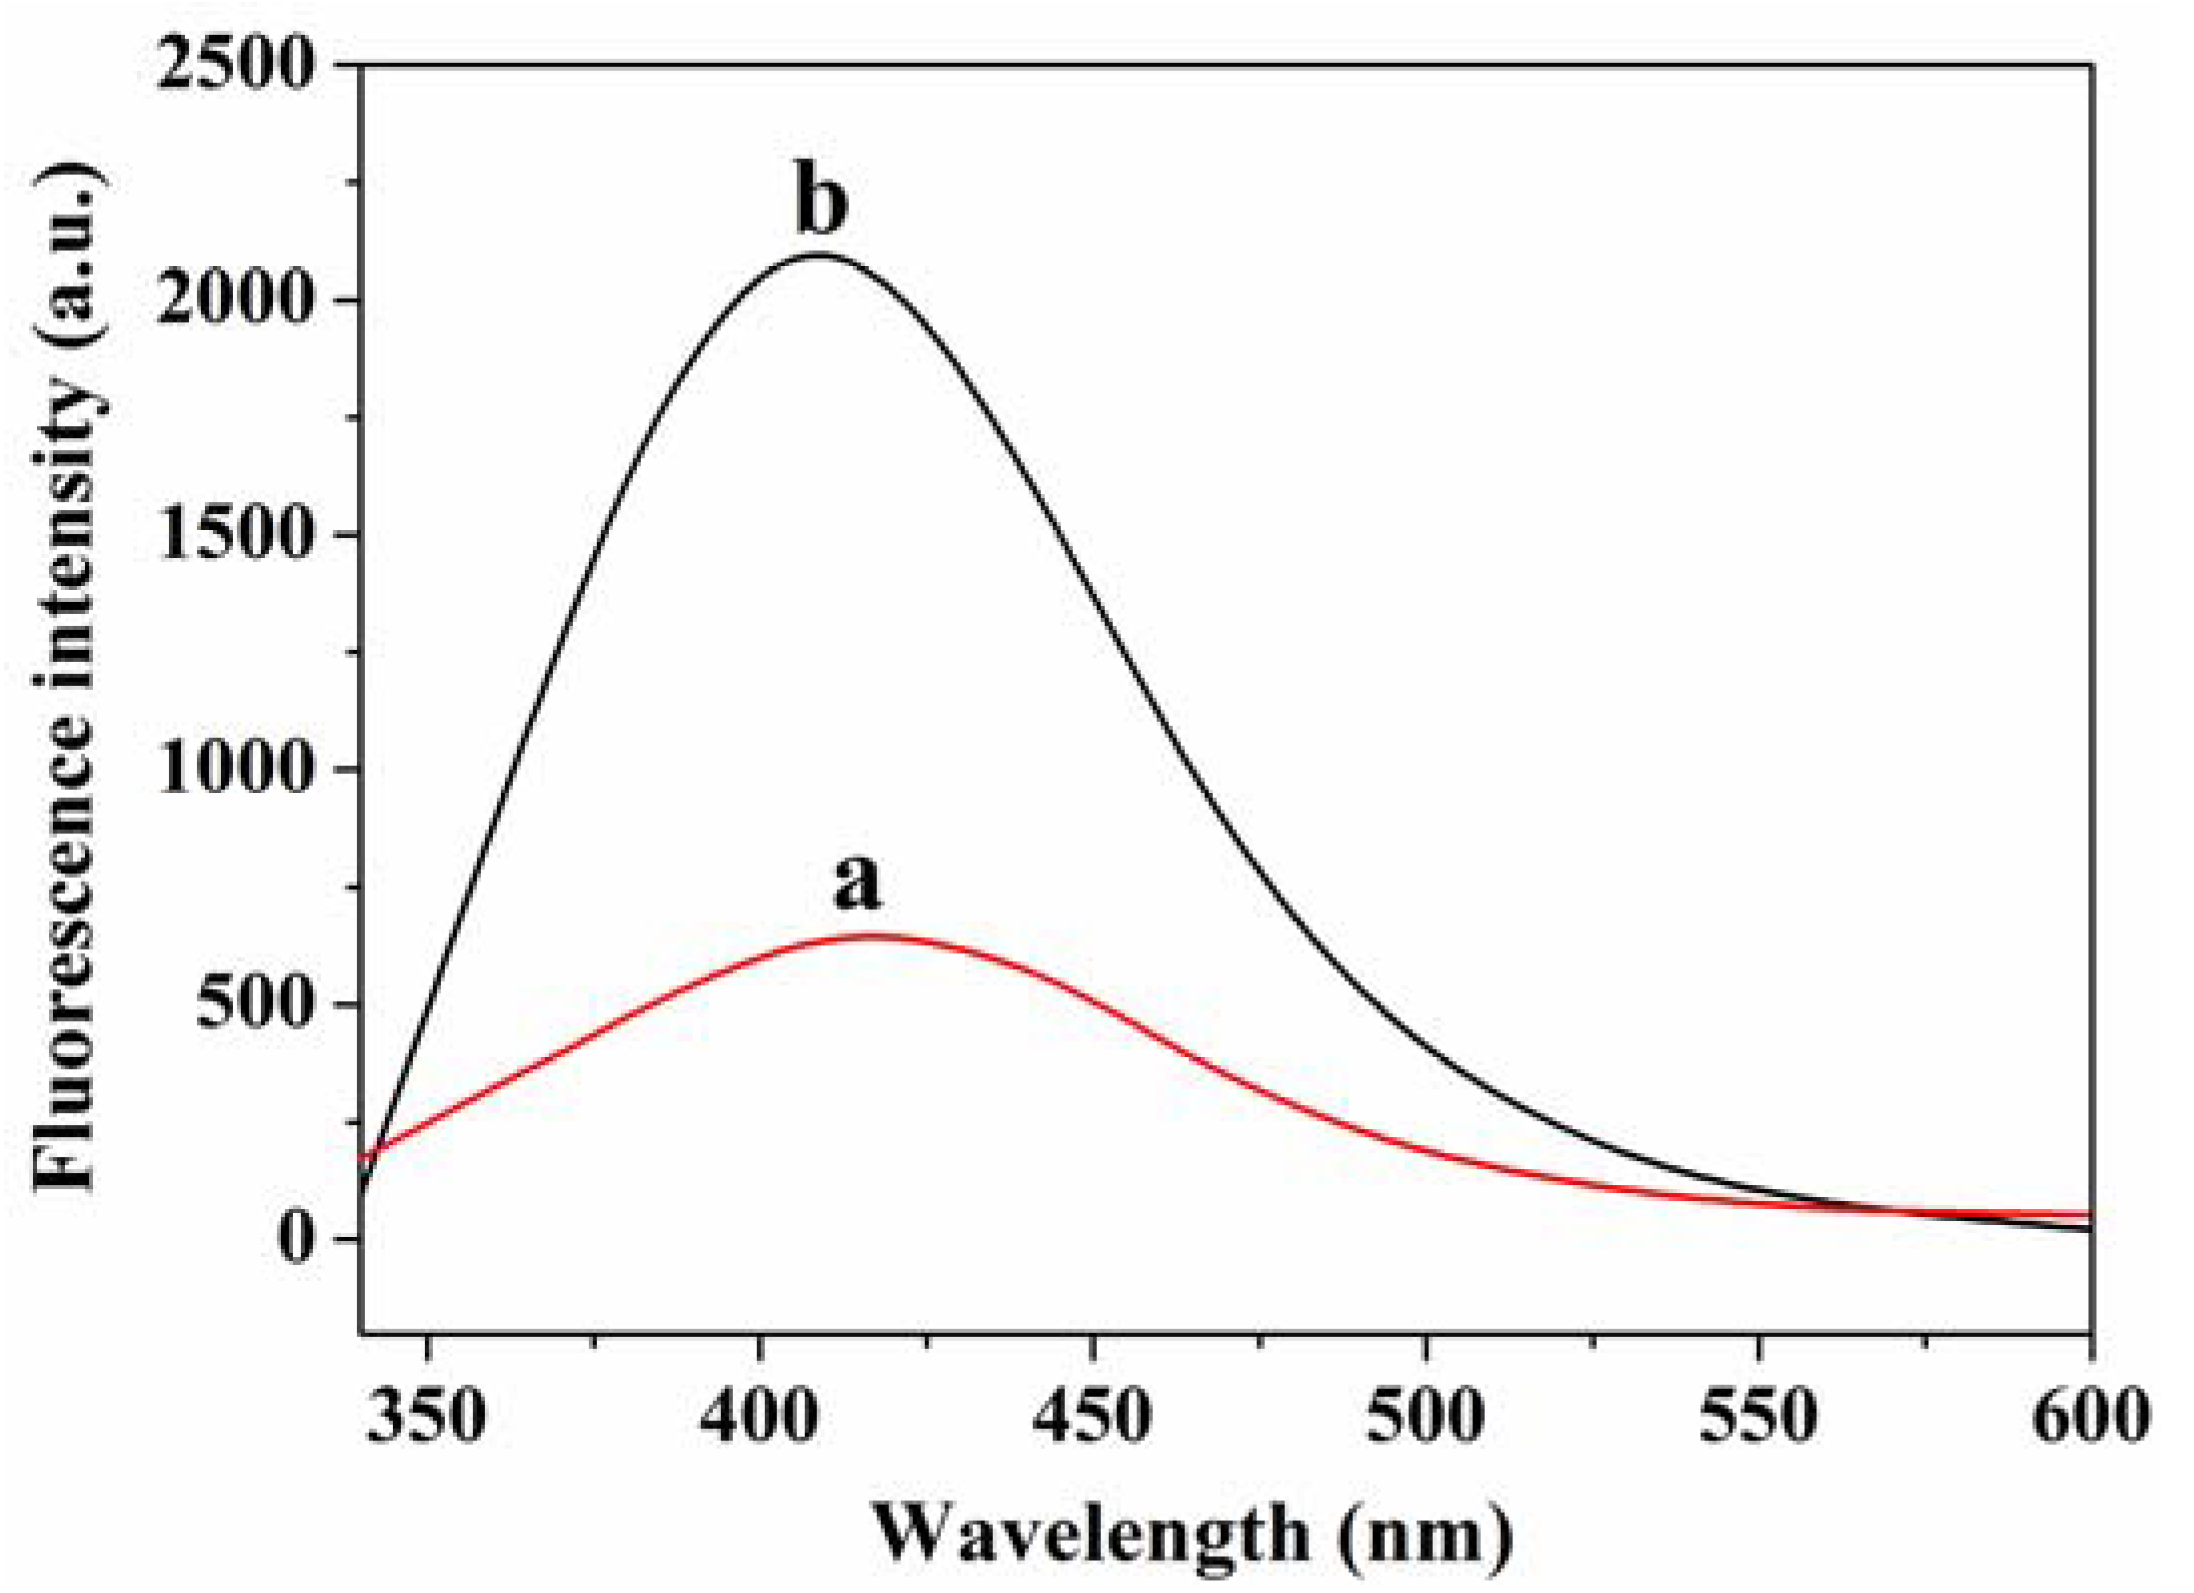
The fluorescence internal filter effect refers to the phenomenon that occurs when the fluorophor coexists with other absorbents, and the fluorescence is weakened due to the absorption of the excitation or emission light by the absorbent. The broad absorption of MnO2 NSs possesses a peak at about 380 nm (Figure 3C), which overlaps both with the emission and excitation wavelength of MoS2 QDs. Therefore, when both of them exist in the system, the fluorescence of MoS2 QDs will be quenched due to the IFE (Figure 9, curve a). Interestingly, we found that after high-speed centrifugation of the reaction solution, the fluorescence of the supernatant was restored (Figure 9, curve b), possibly as a result of the suspended MnO2 NSs in the solution being separated from the MoS2 QDs and precipitated in the bottom of the centrifuge tube. Thus, the fluorescence of MoS2 QDs in the supernatant cannot be quenched by MnO2 NSs through the IFE. The experimental results confirmed that the detection of GSH was based on the IFE, which is different from the reported FRET mechanism of single-layer MnO2 nanosheets [36,43].
3.9. Stability Investigation
The stability of the prepared MoS2 QDs with and without dialysis was investigated. We found that after being placed at room temperature for 42 days, the synthesized MoS2 QDs after dialysis retained about 96% of their original fluorescence intensity. However, the fluorescence of MoS2 QDs decreased sharply without dialysis, being only 61% of the previous measurement. It shows that the stability of MoS2 QDs is greatly improved by dialysis treatment, which is a benefit for practical applications.
4. Conclusions
In summary, a signal enhanced fluorescence assay was developed for the rapid detection of GSH in human serum. The fluorescence of MoS2 QDs can be effectively quenched by MnO2 NSs as a result of the IFE. Interestingly, the quenched fluorescence was restored when reductive GSH was introduced to dissolve MnO2 NSs through the redox reaction. The final fluorescence intensity was linearly correlated with the concentration of GSH. The whole detection process can be completed within 15 min. Notably, the fluorescence response was selective toward GSH without interference from other substances in human serum. Thus, the assay was successfully used for the analysis of GSH in human serum samples. We anticipate that this simple, stable, selective, and cost-effective “turn-on” fluorescent assay has a good prospect of application for GSH analysis in biomedical fields.
Author Contributions
S.T. and X.Y. conceived and designed the experiments; Q.F. and X.L. performed the experiments; X.Y. and G.L. have helped analyze the results of the measured data; S.T. wrote the paper. W.C. and J.C. have proposed valuable suggestions on the revise of the manuscript. All coauthors reviewed and revised the paper.
Funding
This research was funded by the National Natural Science Foundation of China (21874019, 21675024), and the Natural Science Foundation of Fujian Province (2017J01575, 2017J07001, 2016J01049, 2016Y9056).
Conflicts of Interest
The authors declare no conflict of interest.
References
- Forman, H.J.; Zhang, H.; Rinna, A. Glutathione: Overview of its protective roles, measurement, and biosynthesis. Mol. Asp. Med. 2009, 30, 1–12. [Google Scholar] [CrossRef] [PubMed] [Green Version]
- Lu, S.C. Regulation of glutathione synthesis. Mol. Asp. Med. 2009, 30, 42–59. [Google Scholar] [CrossRef] [PubMed] [Green Version]
- Pocernich, C.B.; Butterfield, D.A. Elevation of glutathione as a therapeutic strategy in Alzheimer disease. Biochim. Biophys. Acta 2012, 1822, 625–630. [Google Scholar] [CrossRef] [PubMed] [Green Version]
- Guo, Y.; Wang, H.; Sun, Y.S.; Qu, B. A disulfide bound-molecular beacon as a fluorescent probe for the detection of reduced glutathione and its application in cells. Chem. Commun. 2012, 48, 3221–3223. [Google Scholar] [CrossRef] [PubMed]
- Childs, S.; Haroune, N.; Williams, L.; Gronow, M. Determination of cellular glutathione: Glutathione disulfide ratio in prostate cancer cells by high performance liquid chromatography with electrochemical detection. J. Chromatogr. A 2016, 1437, 67–73. [Google Scholar] [CrossRef] [PubMed]
- Huang, Y.-F.; Chang, H.-T. Analysis of adenosine triphosphate and glutathione through gold nanoparticles assisted laser desorption/ionization mass spectrometry. Anal. Chem. 2007, 79, 4852–4859. [Google Scholar] [CrossRef]
- Saha, A.; Jana, N.R. Detection of cellular glutathione and oxidized glutathione using magnetic–plasmonic nanocomposite-based “Turn-Off” surface enhanced raman scattering. Anal. Chem. 2013, 85, 9221–9228. [Google Scholar] [CrossRef]
- Wawegama, N.K.; Browning, G.F.; Kanci, A.; Marenda, M.S.; Markham, P.F. Development of a recombinant protein-based enzyme-linked immunosorbent assay for diagnosis of Mycoplasma bovis infection in cattle. Clin. Vaccine Immunol. 2014, 21, 196–202. [Google Scholar] [CrossRef]
- Zhu, W.; Jiang, G.; Xu, L.; Li, B.; Cai, Q.; Jiang, H.; Zhou, X. Facile and controllable one-step fabrication of molecularly imprinted polymer membrane by magnetic field directed self-assembly for electrochemical sensing of glutathione. Anal. Chim. Acta 2015, 886, 37–47. [Google Scholar] [CrossRef]
- Yoon, S.A.; Kim, W.; Sharma, A.; Verwilst, P.; Won, M.; Lee, M.H. A fluorescent Cy7-mercaptopyridine for the selective detection of glutathione over homocysteine and cysteine. Sensors 2018, 18, 2897. [Google Scholar] [CrossRef]
- Niu, L.Y.; Guan, Y.S.; Chen, Y.Z.; Wu, L.Z.; Tung, C.H.; Yang, Q.Z. BODIPY-based ratiometric fluorescent sensor for highly selective detection of glutathione over cysteine and homocysteine. J. Am. Chem. Soc. 2012, 134, 18928–18931. [Google Scholar] [CrossRef] [PubMed]
- Yuan, L.; Lin, W.; Zheng, K.; Zhu, S. FRET-based small-molecule fluorescent probes: Rational design and bioimaging applications. Acc. Chem. Res. 2013, 46, 1462–1473. [Google Scholar] [CrossRef] [PubMed]
- Niu, L.Y.; Chen, Y.Z.; Zheng, H.R.; Wu, L.Z.; Tung, C.H.; Yang, Q.Z. Design strategies of fluorescent probes for selective detection among biothiols. Chem. Soc. Rev. 2015, 44, 6143–6160. [Google Scholar] [CrossRef] [PubMed]
- Xu, H.; Hepel, M. “Molecular beacon”-based fluorescent assay for selective detection of glutathione and cysteine. Anal. Chem. 2011, 83, 813–819. [Google Scholar] [CrossRef] [PubMed]
- Pan, J.; Zheng, Z.; Yang, J.; Wu, Y.; Lu, F.; Chen, Y.; Gao, W. A novel and sensitive fluorescence sensor for glutathione detection by controlling the surface passivation degree of carbon quantum dots. Talanta 2017, 166, 1–7. [Google Scholar] [CrossRef] [PubMed]
- Chen, J.; Huang, Z.; Meng, H.; Zhang, L.; Ji, D.; Liu, J.; Yu, F.; Qu, L.; Li, Z. A facile fluorescence lateral flow biosensor for glutathione detection based on quantum dots-MnO2 nanocomposites. Sens. Actuators B Chem. 2018, 260, 770–777. [Google Scholar]
- Dai, C.; Yang, C.; Yan, X. Self-quenched gold nanoclusters for turn-on fluorescence imaging of intracellular glutathione. Nano Res. 2018, 11, 2488–2497. [Google Scholar] [CrossRef]
- Li, Y.; Deng, Y.; Zhou, X.; Hu, J. A label-free turn-on-off fluorescent sensor for the sensitive detection of cysteine via blocking the Ag+-enhancing glutathione-capped gold nanoclusters. Talanta 2018, 179, 742–752. [Google Scholar] [CrossRef]
- Iqbal, A.; Iqbal, K.; Xu, L.; Li, B.; Gong, D.; Liu, X.; Guo, Y.; Liu, W.; Qin, W.; Guo, H. Heterogeneous synthesis of nitrogen-doped carbon dots prepared via anhydrous citric acid and melamine for selective and sensitive turn on-off-on detection of Hg (II), glutathione and its cellular imaging. Sens. Actuators B Chem. 2018, 255, 1130–1138. [Google Scholar]
- Wu, D.; Li, G.; Chen, X.; Qiu, N.; Shi, X.; Chen, G.; Sun, Z.; You, J.; Wu, Y. Fluorometric determination and imaging of glutathione based on a thiol-triggered inner filter effect on the fluorescence of carbon dots. Microchim. Acta 2017, 184, 1923–1931. [Google Scholar] [CrossRef]
- Gogoi, S.; Khan, R. NIR upconversion characteristics of carbon dots for selective detection of glutathione. New J. Chem. 2018, 42, 6399–6407. [Google Scholar] [CrossRef]
- Qian, Z.; Ma, J.; Shan, X.; Feng, H.; Shao, L.; Chen, J. Highly luminescent N-doped carbon quantum dots as an effective multifunctional fluorescence sensing platform. Chem. Eur. J. 2014, 20, 2254–2263. [Google Scholar] [CrossRef] [PubMed]
- Sheng, Z.; Chen, L. Switch-on fluorescent strategy based on crystal violet-functionalized CdTe quantum dots for detecting L-cysteine and glutathione in water and urine. Anal. Bioanal. Chem. 2017, 409, 6081–6090. [Google Scholar] [CrossRef] [PubMed]
- Tian, D.; Qian, Z.; Xia, Y.; Zhu, C. Gold nanocluster-based fluorescent probes for near-infrared and turn-on sensing of glutathione in living cells. Langmuir 2012, 28, 3945–3951. [Google Scholar] [CrossRef] [PubMed]
- Gu, W.; Yan, Y.; Cao, X.; Zhang, C.; Ding, C.; Xian, Y. A facile and one-step ethanol-thermal synthesis of MoS2 quantum dots for two-photon fluorescence imaging. J. Mater. Chem. B 2016, 4, 27–31. [Google Scholar] [CrossRef]
- Zhao, M.; Chen, A.Y.; Huang, D.; Chai, Y.Q.; Zhuo, Y.; Yuan, R. MoS2 quantum dots as new electrochemiluminescence emitters for ultrasensitive bioanalysis of lipopolysaccharide. Anal. Chem. 2017, 89, 8335–8342. [Google Scholar] [CrossRef] [PubMed]
- Wu, D.; Wang, Y.; Wang, F.; Wang, H.; An, Y.; Gao, Z.; Xu, F.; Jiang, K. Oxygen-incorporated few-layer MoS2 vertically aligned on three-dimensional graphene matrix for enhanced catalytic performances in quantum dot sensitized solar cells. Carbon 2017, 123, 756–766. [Google Scholar] [CrossRef]
- Yuan, P.; Walt, D.R. Calculation for fluorescence modulation by absorbing species and its application to measurements using optical fibers. Anal. Chem. 1987, 59, 2391–2394. [Google Scholar] [CrossRef]
- Shao, N.; Zhang, Y.; Cheung, S.M.; Yang, R.H.; Chan, W.H.; Mo, T.; Li, K.; Liu, F. Copper ion-selective fluorescent sensor based on the inner filter effect using a spiropyran derivative. Anal. Chem. 2005, 77, 7294–7303. [Google Scholar] [CrossRef]
- Zhai, W.Y.; Wang, C.X.; Yu, P.; Wang, Y.X.; Mao, L.Q. Single-layer MnO2 nanosheets suppressed fluorescence of 7-hydroxycoumarin: Mechanistic study and application for sensitive sensing of ascorbic acid in vivo. Anal. Chem. 2014, 86, 12206–12213. [Google Scholar] [CrossRef]
- Liu, J.; Meng, L.; Fei, Z.; Dyson, P.J.; Jing, X.; Liu, X. MnO2 nanosheets as an artificial enzyme to mimic oxidase for rapid and sensitive detection of glutathione. Biosens. Bioelectron. 2017, 90, 69–74. [Google Scholar] [CrossRef] [PubMed]
- Kai, K.; Yoshida, Y.; Kageyama, H.; Saito, G.; Ishigaki, T.; Yu, F.; Kawamata, J. Room-temperature synthesis of manganese oxide monosheets. J. Am. Chem. Soc. 2008, 130, 15938–15943. [Google Scholar] [CrossRef] [PubMed]
- Guan, G.J.; Zhang, S.; Liu, S.; Cai, Y.; Low, M.; Teng, C.P.; Phang, I.Y.; Cheng, Y.; Duei, K.L.; Srinivasan, B.M.; et al. Protein induces layer-by-layer exfoliation of transition metal dichalcogenides. J. Am. Chem. Soc. 2015, 137, 6152–6155. [Google Scholar] [CrossRef] [PubMed]
- Wang, Y.; Ni, Y. Molybdenum disulfide quantum dots as a photoluminescence sensing platform for 2,4,6-trinitrophenol detection. Anal. Chem. 2014, 86, 7463–7470. [Google Scholar] [CrossRef] [PubMed]
- Zhang, X.-L.; Zheng, C.; Guo, S.-S.; Li, J.; Yang, H.-H.; Chen, G. Turn-on fluorescence sensor for intracellular imaging of glutathione using g-C3N4 nanosheet–MnO2 sandwich nanocomposite. Anal. Chem. 2014, 86, 3426–3434. [Google Scholar] [CrossRef] [PubMed]
- Deng, R.; Xie, X.; Vendrell, M.; Chang, Y.T.; Liu, X. Intracellular glutathione detection using MnO2-nanosheet-modified upconversion nanoparticles. J. Am. Chem. Soc. 2011, 133, 20168–20171. [Google Scholar] [CrossRef] [PubMed]
- Xu, Y.; Chen, X.; Chai, R.; Xing, C.; Li, H.; Yin, X. A magnetic/fluorometric bimodal sensor based on carbon dots MnO2 platform for glutathione detection. Nanoscale 2016, 8, 13414–13421. [Google Scholar] [CrossRef]
- Liu, Z.; Cai, X.; Lin, X.; Zheng, Y.; Wu, Y.; Chen, P.; Weng, S.; Lin, L.; Lin, X. Signal-on fluorescent sensor based on GQDs–MnO2 composite for glutathione. Anal. Methods 2016, 8, 2366–2374. [Google Scholar] [CrossRef]
- Feng, J.; Huang, P.; Shi, S.; Deng, K.; Wu, F. Colorimetric detection of glutathione in cells based on peroxidase-like activity of gold nanoclusters: A promising powerful tool for identifying cancer cells. Anal. Chim. Acta 2017, 967, 64–69. [Google Scholar] [CrossRef]
- Wang, Y.; Lu, J.; Tang, L.; Chang, H.; Li, J. Graphene oxide amplified electrogenerated chemiluminescence of quantum dots and its selective sensing for glutathione from thiol-containing compounds. Anal. Chem. 2009, 81, 9710–9715. [Google Scholar] [CrossRef]
- Michelet, F.; Gueguen, R.; Leroy, P.; Wellman, M.; Nicolas, A.; Siest, G. Blood and plasma glutathione measured in healthy subjects by HPLC: Relation to sex, aging, biological variables, and life habits. Clin. Chem. 1995, 41, 1509–1517. [Google Scholar] [PubMed]
- Yu, F.; Li, P.; Wang, B.; Han, K. Reversible near-infrared fluorescent probe introducing tellurium to mimetic glutathione peroxidase for monitoring the redox cycles between peroxynitrite and glutathione in vivo. J. Am. Chem. Soc. 2013, 135, 7674–7680. [Google Scholar] [CrossRef] [PubMed]
- Yuan, Y.; Wu, S.; Shu, F.; Liu, Z. An MnO2 nanosheet as a label-free nanoplatform for homogeneous biosensing. Chem. Commun. 2014, 50, 1095–1097. [Google Scholar] [CrossRef] [PubMed]
Scheme 1.
Schematic diagram of the fluorescence assay for GSH detection.

Figure 1.
(A) TEM; (B) high-resolution transmission electron microscopic (HRTEM) image; (C) dynamic light scattering (DLS) analysis; and (D) XRD pattern of MoS2 quantum dots (QDs).
Figure 1.
(A) TEM; (B) high-resolution transmission electron microscopic (HRTEM) image; (C) dynamic light scattering (DLS) analysis; and (D) XRD pattern of MoS2 quantum dots (QDs).

Figure 2.
Fluorescence excitation (a) and emission (b) spectra of MoS2 QDs (Inset: The photo of MoS2 QDs solution under UV irradiation). Detection parameters: Ex slit, 5.0 nm; Em slit, 10.0 nm; Scan speed, 1200 nm/min; PMT, 700 V.
Figure 2.
Fluorescence excitation (a) and emission (b) spectra of MoS2 QDs (Inset: The photo of MoS2 QDs solution under UV irradiation). Detection parameters: Ex slit, 5.0 nm; Em slit, 10.0 nm; Scan speed, 1200 nm/min; PMT, 700 V.

Figure 3.
(A) TEM; (B) HRTEM image; and (C) UV-Vis spectrum of manganese dioxide nanosheets (MnO2 NSs).
Figure 3.
(A) TEM; (B) HRTEM image; and (C) UV-Vis spectrum of manganese dioxide nanosheets (MnO2 NSs).

Figure 4.
UV-Vis spectra of MnO2 NSs solution (0.075 mM) after the addition of different concentrations of GSH (a: 0, b: 100, c: 500, d: 2000, e: 5000 µM) (Inset: The corresponding photographs of the above solutions).
Figure 4.
UV-Vis spectra of MnO2 NSs solution (0.075 mM) after the addition of different concentrations of GSH (a: 0, b: 100, c: 500, d: 2000, e: 5000 µM) (Inset: The corresponding photographs of the above solutions).

Figure 5.
The effect of MnO2 NSs and glutathione (GSH) on the fluorescence intensity of MoS2 QDs. (bar graph a: MoS2 QDs (0.64 mg/mL), bar graph b: MoS2 QDs + 5 μL 400 mM GSH, bar graph c: MoS2 QDs + 15 μL 1.0 mM MnO2 NSs, bar graph d: MoS2 QDs + 15 μL 1.0 mM MnO2 NSs + 5 μL 400 mM GSH).
Figure 5.
The effect of MnO2 NSs and glutathione (GSH) on the fluorescence intensity of MoS2 QDs. (bar graph a: MoS2 QDs (0.64 mg/mL), bar graph b: MoS2 QDs + 5 μL 400 mM GSH, bar graph c: MoS2 QDs + 15 μL 1.0 mM MnO2 NSs, bar graph d: MoS2 QDs + 15 μL 1.0 mM MnO2 NSs + 5 μL 400 mM GSH).

Figure 6.
(A) The effect of MoS2 QDs dilution time (initial concentration 1.6 mg/mL); (B) MnO2 NSs concentration (1.0 mM); (C) and the reaction time between GSH and MnO2 NSs on the fluorescence intensity.
Figure 6.
(A) The effect of MoS2 QDs dilution time (initial concentration 1.6 mg/mL); (B) MnO2 NSs concentration (1.0 mM); (C) and the reaction time between GSH and MnO2 NSs on the fluorescence intensity.

Figure 7.
(A) Fluorescence spectra of the system at different GSH concentrations (From a to l: 0.02, 0.05, 0.1, 0.5, 1, 1.5, 2, 2.5, 4, 5, 7.5, and 10 mM; MoS2 QDs 0.64 mg/mL, MnO2 NSs 0.075 mM); (B) the relationship between GSH concentration and the fluorescence intensity (Inset: The calibration plot of fluorescence intensity against the concentrations of GSH).

Figure 8.
Selectivity investigation of the system for GSH detection. The concentration of GSH, oxidized glutathione (GSSG), and other amino acid solutions were 2 mM, bovine serum albumin (BSA) was 1 mg/mL, and the metal ions concentration was 5 mM. Bar graph “X” was the fluorescent recovery of the mixture of several amino acids (Glu, His, Phe, Gly, Met, Ala, and Dith with a concentration of 2 mM) with 2 mM GSH.

Figure 9.
Fluorescence spectra of the solution containing MoS2 QDs and MnO2 NSs before (a) or after (b) centrifuge treatment.
Figure 9.
Fluorescence spectra of the solution containing MoS2 QDs and MnO2 NSs before (a) or after (b) centrifuge treatment.


Table 1.
Comparison of our present work with other methods for GSH detection.
| Methods | Probes | Linear Range | LOD | References |
|---|---|---|---|---|
| Fluorescence | MnO2-UCNPs | - | 0.9 μM | [36] |
| Fluorescence | CdSe@ZnS QDs-MnO2 | 0.05~1.5 mM | 16.3 μM | [16] |
| Fluorescence | CDs-MnO2 NPs | 1~200 μM | 0.6 μM | [37] |
| Fluorescence | GQDs–MnO2 composite | 1~1000 μM | 0.45 μM | [38] |
| Colorimetric | MnO2NSs-TMB | 1~25 μM | 0.3 μM | [31] |
| Colorimetric | GSH-AuNCs-TMB | 2~25 μM | 0.42 μM | [39] |
| Electrochemistry | CdTe QDs | 24~214 μM | 8.3 μM | [40] |
| Fluorescence | MoS2 QDs-MnO2 NSs | 20~2500 μM | 1.0 μM | This work |
Table 2.
Analysis of GSH in human serum samples (n = 3).
| Sample | Add/mM | Found/mM | Recovery/% | RSD/% |
|---|---|---|---|---|
| 1 | 0 | 0.193 | - | 9.6 |
| 2 | 0.1 | 0.104 | 104 | 2.1 |
| 3 | 1.0 | 0.992 | 99.2 | 2.6 |
© 2019 by the authors. Licensee MDPI, Basel, Switzerland. This article is an open access article distributed under the terms and conditions of the Creative Commons Attribution (CC BY) license (http://creativecommons.org/licenses/by/4.0/).
Share and Cite
MDPI and ACS Style
Tang, S.; You, X.; Fang, Q.; Li, X.; Li, G.; Chen, J.; Chen, W. A Fluorescence Inner-Filter Effect Based Sensing Platform for Turn-On Detection of Glutathione in Human Serum. Sensors 2019, 19, 228. https://doi.org/10.3390/s19020228
AMA Style
Tang S, You X, Fang Q, Li X, Li G, Chen J, Chen W. A Fluorescence Inner-Filter Effect Based Sensing Platform for Turn-On Detection of Glutathione in Human Serum. Sensors. 2019; 19(2):228. https://doi.org/10.3390/s19020228
Chicago/Turabian StyleTang, Shurong, Xiuhua You, Quanhui Fang, Xin Li, Guangwen Li, Jinghua Chen, and Wei Chen. 2019. "A Fluorescence Inner-Filter Effect Based Sensing Platform for Turn-On Detection of Glutathione in Human Serum" Sensors 19, no. 2: 228. https://doi.org/10.3390/s19020228
Note that from the first issue of 2016, this journal uses article numbers instead of page numbers. See further details here.