Optical Fibre-Based Pulse Oximetry Sensor with Contact Force Detection
by
 , , , and
Chong Liu
 ,
,
Ricardo Correia
,
Hattan Khaled Ballaji
,
Serhiy Korposh
 ,
,
Barrie R. Hayes-Gill
and
Stephen P. Morgan
* Optics and Photonics Group, Faculty of Engineering, University Park, Nottingham NG7 2RD, UK
*
Author to whom correspondence should be addressed.
Sensors 2018, 18(11), 3632; https://doi.org/10.3390/s18113632
Submission received: 20 September 2018
/
Revised: 16 October 2018
/
Accepted: 22 October 2018
/
Published: 26 October 2018
(This article belongs to the Section Biosensors)
Abstract
:A novel optical sensor probe combining monitoring of blood oxygen saturation (SpO2) with contact pressure is presented. This is beneficial as contact pressure is known to affect SpO2 measurement. The sensor consists of three plastic optical fibres (POF) used to deliver and collect light for pulse oximetry, and a fibre Bragg grating (FBG) sensor to measure contact pressure. All optical fibres are housed in a biocompatible epoxy patch which serves two purposes: (i) to reduce motion artefacts in the photoplethysmogram (PPG), and (ii) to transduce transverse loading into an axial strain in the FBG. Test results show that using a combination of pressure measuring FBG with a reference FBG, reliable results are possible with low hysteresis which are relatively immune to the effects of temperature. The sensor is used to measure the SpO2 of ten volunteers under different contact pressures with perfusion and skewness indices applied to assess the quality of the PPG. The study revealed that the contact force ranging from 5 to 15 kPa provides errors of <2%. The combined probe has the potential to improve the reliability of reflectance oximeters. In particular, in wearable technology, the probe should find use in optimising the fitting of garments incorporating this technology.
1. Introduction
The blood oxygen saturation level (SpO2) indicates the percentage of oxygenated haemoglobin molecules in the arterial blood, which has been identified as an indicator of risk in chronic disease of the circulatory and respiratory system and is required to be continuously monitored during for example anaesthesia [1]. Pulse oximetry is a non-invasive method to detect SpO2 which was first introduced in 1983 and accepted as a standard procedure in administrating general anaesthetic in the US in 1987 [2]. The SpO2 measured by pulse oximetry is defined as the ratio between the oxygenated haemoglobin (HbO2) and the total haemoglobin (HbO2 + Hb):
Since the absorption spectra of HbO2 and Hb are different, pulse oximetry uses photoplethysmography (PPG) at two different wavelengths (usually red and near-infrared) to obtain the SpO2 value [3,4]. The PPG signal is the intensity of the light penetrating or reflected by body tissues, which consists of a small pulsatile component (AC) and a large static component (DC). The light absorption of arterial blood causes the pulsatile component in PPG signals whilst the light absorption of steady component (due to venous blood, bone, skin, hair and tissue) gives rise to the DC component [5]. Pulse oximetry calculates SpO2 from the absorbance ratio (R) which is derived from the ratios of pulsatile components of PPG signals (Iac) to static components of PPG signals (Idc).
Pulse oximetry can be performed in transmission and reflectance geometries [6]. Transmission mode is limited to extremities such as the finger, toe or earlobe whereas reflectance mode provides greater flexibility of body site. Unobtrusive wearable reflectance pulse oximetry has attracted a lot of research attention [7] with optical fibres providing a convenient method of delivering light to and from the body [8,9]. This is useful in magnetic resonance imaging (MRI) where metallic parts should be avoided [10]. In recent years, there has also been interest in integrating optical fibres into fabrics to make wearable photonic textiles for comfortable and continuous monitoring of the subjects’ SpO2 [7,11,12].
However, there are challenges in using photonic textiles for pulse oximetry. Inefficient light coupling at the tissue interface means that many optical fibres are required [13,14]. Motion artefacts also occur when the fibres move relative to the tissue surface and so the sensor needs to be in contact with the skin which requires tight fitting garments or straps making it impractical for long-term use. It is also known that the contact force between tissue and sensor will affect the accuracy of SpO2 values in both transmission and reflectance modes [15,16,17]. Insufficient contact pressure can cause a weak PPG signal whilst too high pressure will block the blood circulation and deform the PPG [18]. A range of contact force exists to generate optimal PPG signals with salient pulsatile components [15,17,19].
It would therefore be advantageous to develop an optical fibre sensor that could monitor both the PPG and the contact pressure. This would enable indication of when the probe is in contact with the tissue and when it is in the appropriate contact pressure range to enable reliable SpO2 measurement. An optical fibre sensing method of monitoring contact pressure can be obtained using a Fibre Bragg Grating (FBG). An FBG consists of a periodic variation of the refractive index of the core [20]. For a particular effective refractive index (ne) modulation, light will be reflected by the grating at a specific wavelength (the Bragg wavelength λB) which is dependent on the grating period (Λ).
The variation of the grating period and the refractive index caused by vertical transverse loading, axial strain or temperature will shift the Bragg wavelength. However, the bare FBG sensor is not very sensitive to the vertical transverse load and in order to increase its sensitivity the bare FBG sensor can be encased in an epoxy-based UV-cured rectangular block or patch [21]. In this case, the vertical transverse load, the result of the applied pressure is transduced into a horizontal axial strain and hence small transverse pressure variations (~100 Pa) can cause a measurable Bragg wavelength shift.
This paper demonstrates a novel optical fibre sensor probe for simultaneously monitoring the PPG and contact pressure in order to provide reliable SpO2 monitoring. The probe is encased in an epoxy patch which serves to fix the SpO2 measurement fibres in place and to transduce a transverse load into an axial strain at the FBG. The next section describes the sensing system and the experiments conducted. Calibration and human volunteer results and discussion are shown Section 3 followed by conclusions in Section 4.
2. Materials and Methodology
2.1. Probe Design
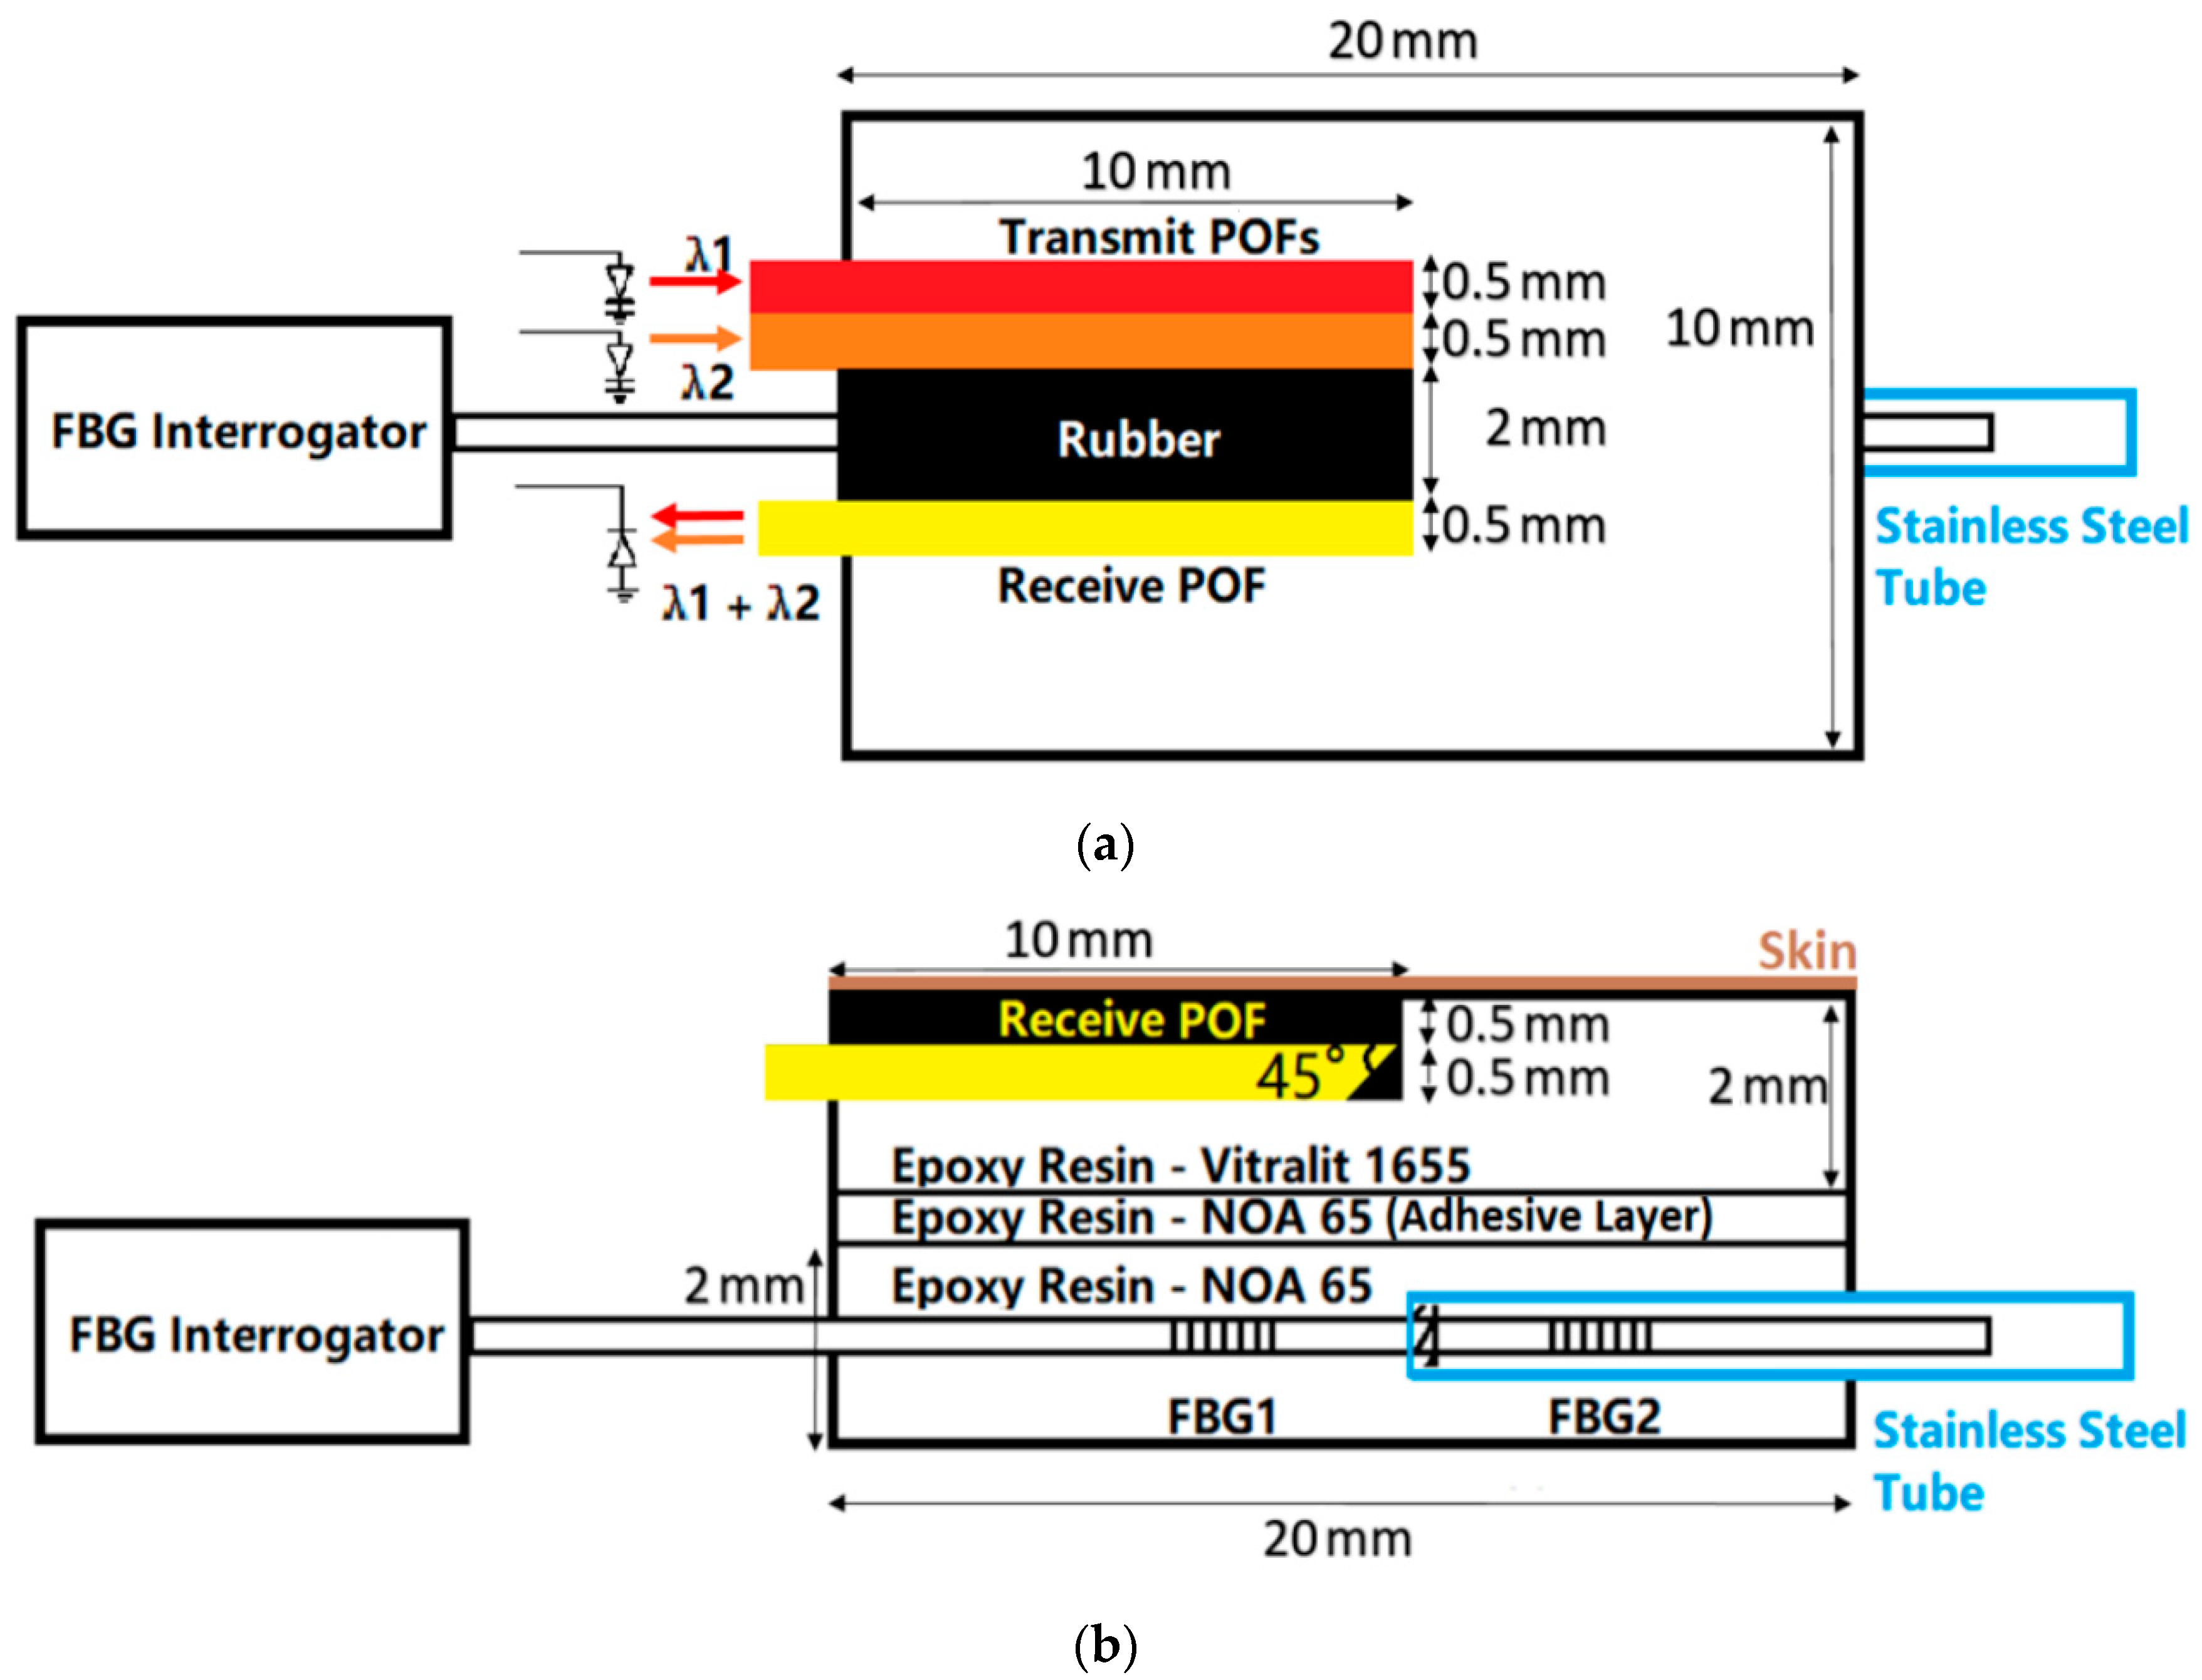
Figure 1 shows the probe design. The designed probe is composed of two patches which are a pulse oximeter (the top patch) and an FBG pressure sensor (the bottom patch). Two patches are glued together using epoxy resin (NOA-65, Norland Products, NJ, USA). The pulse oximeter consists of three 500 µm diameter POFs (DB-500, Asahi Kasei, Tokyo, Japan) to deliver/receive light from/to the opto-electronic system. The end of each POF embedded in the epoxy patch is 45° cleaved using a sharp blade to increase the light reflecting from the side of the angled optical fibre, which allows for sensing away from the axis of the fibre [22]. This has been previously demonstrated using micro-prisms to be an efficient method of delivering light to tissue for pulse oximetry [23]. Although a 45° cleaved fibre was reported to be able to achieve high optical coupling efficiency in low-height and low-cost optical interconnect modules [24], to our knowledge, this has not been widely adopted to increase the coupling efficiency of POF pulse oximeters.
The bottom substance of the pulse oximeter patch is made of epoxy resin (Vitralit 1655, Panacol-Elosol GmbH, Steinbach, Germany) which is a biocompatible material. Exposing to UV light with a maximum absorption within the wavelength range of 350–380 nm for 15 min, the epoxy resin is cured in a mould into a 20 × 10 × 2 mm cube. There is one 3.5 × 10 × 1 mm slot on the top surface of the epoxy cube generated by polishing. Three POFs with 45° cleaved and polished ends are set into this slot and then fixed by filling and curing the epoxy resin. Black rubber (2 mm thick) on the surface of the epoxy patch between transmit and receive POFs is present to prevent light passing directly from the source to the detector as this would affect Idc and hence the SpO2 value (Equation (2)).
For contact pressure sensing, two FBGs, separated by 6 mm are written into a 125 µm diameter photosensitive silica optical fibre (PS1250, Fibercore Ltd., Southampton, UK) using a UV inscription method previously described [21]. Encasing an FBG in epoxy transduces a transverse load into an axial strain. However, temperature changes will cause shifts to the Bragg wavelength and therefore a reference FBG is required to compensate. The reference FBG is shielded in a stainless-steel tube (outer diameter: 0.56 mm, inner diameter: 0.305 mm, Coopers Needle Works Ltd., Birmingham, UK) to make it sensitive to only temperature. Figure 1 shows the schematic of the FBG pressure sensor. FBG1 is covered by the epoxy rectangular cube to measure the pressure whilst FBG2 is protected by a stainless-steel tube enabling measurement of temperature and insensitivity to pressure. The patch is made of epoxy resin NOA-65 which has lower Young’s modulus (137.9 MPa) and cured in the same mould as the pulse oximeter patch into a 20 × 10 × 2 mm after exposure to UV light.
2.2. Opto-Electronic System
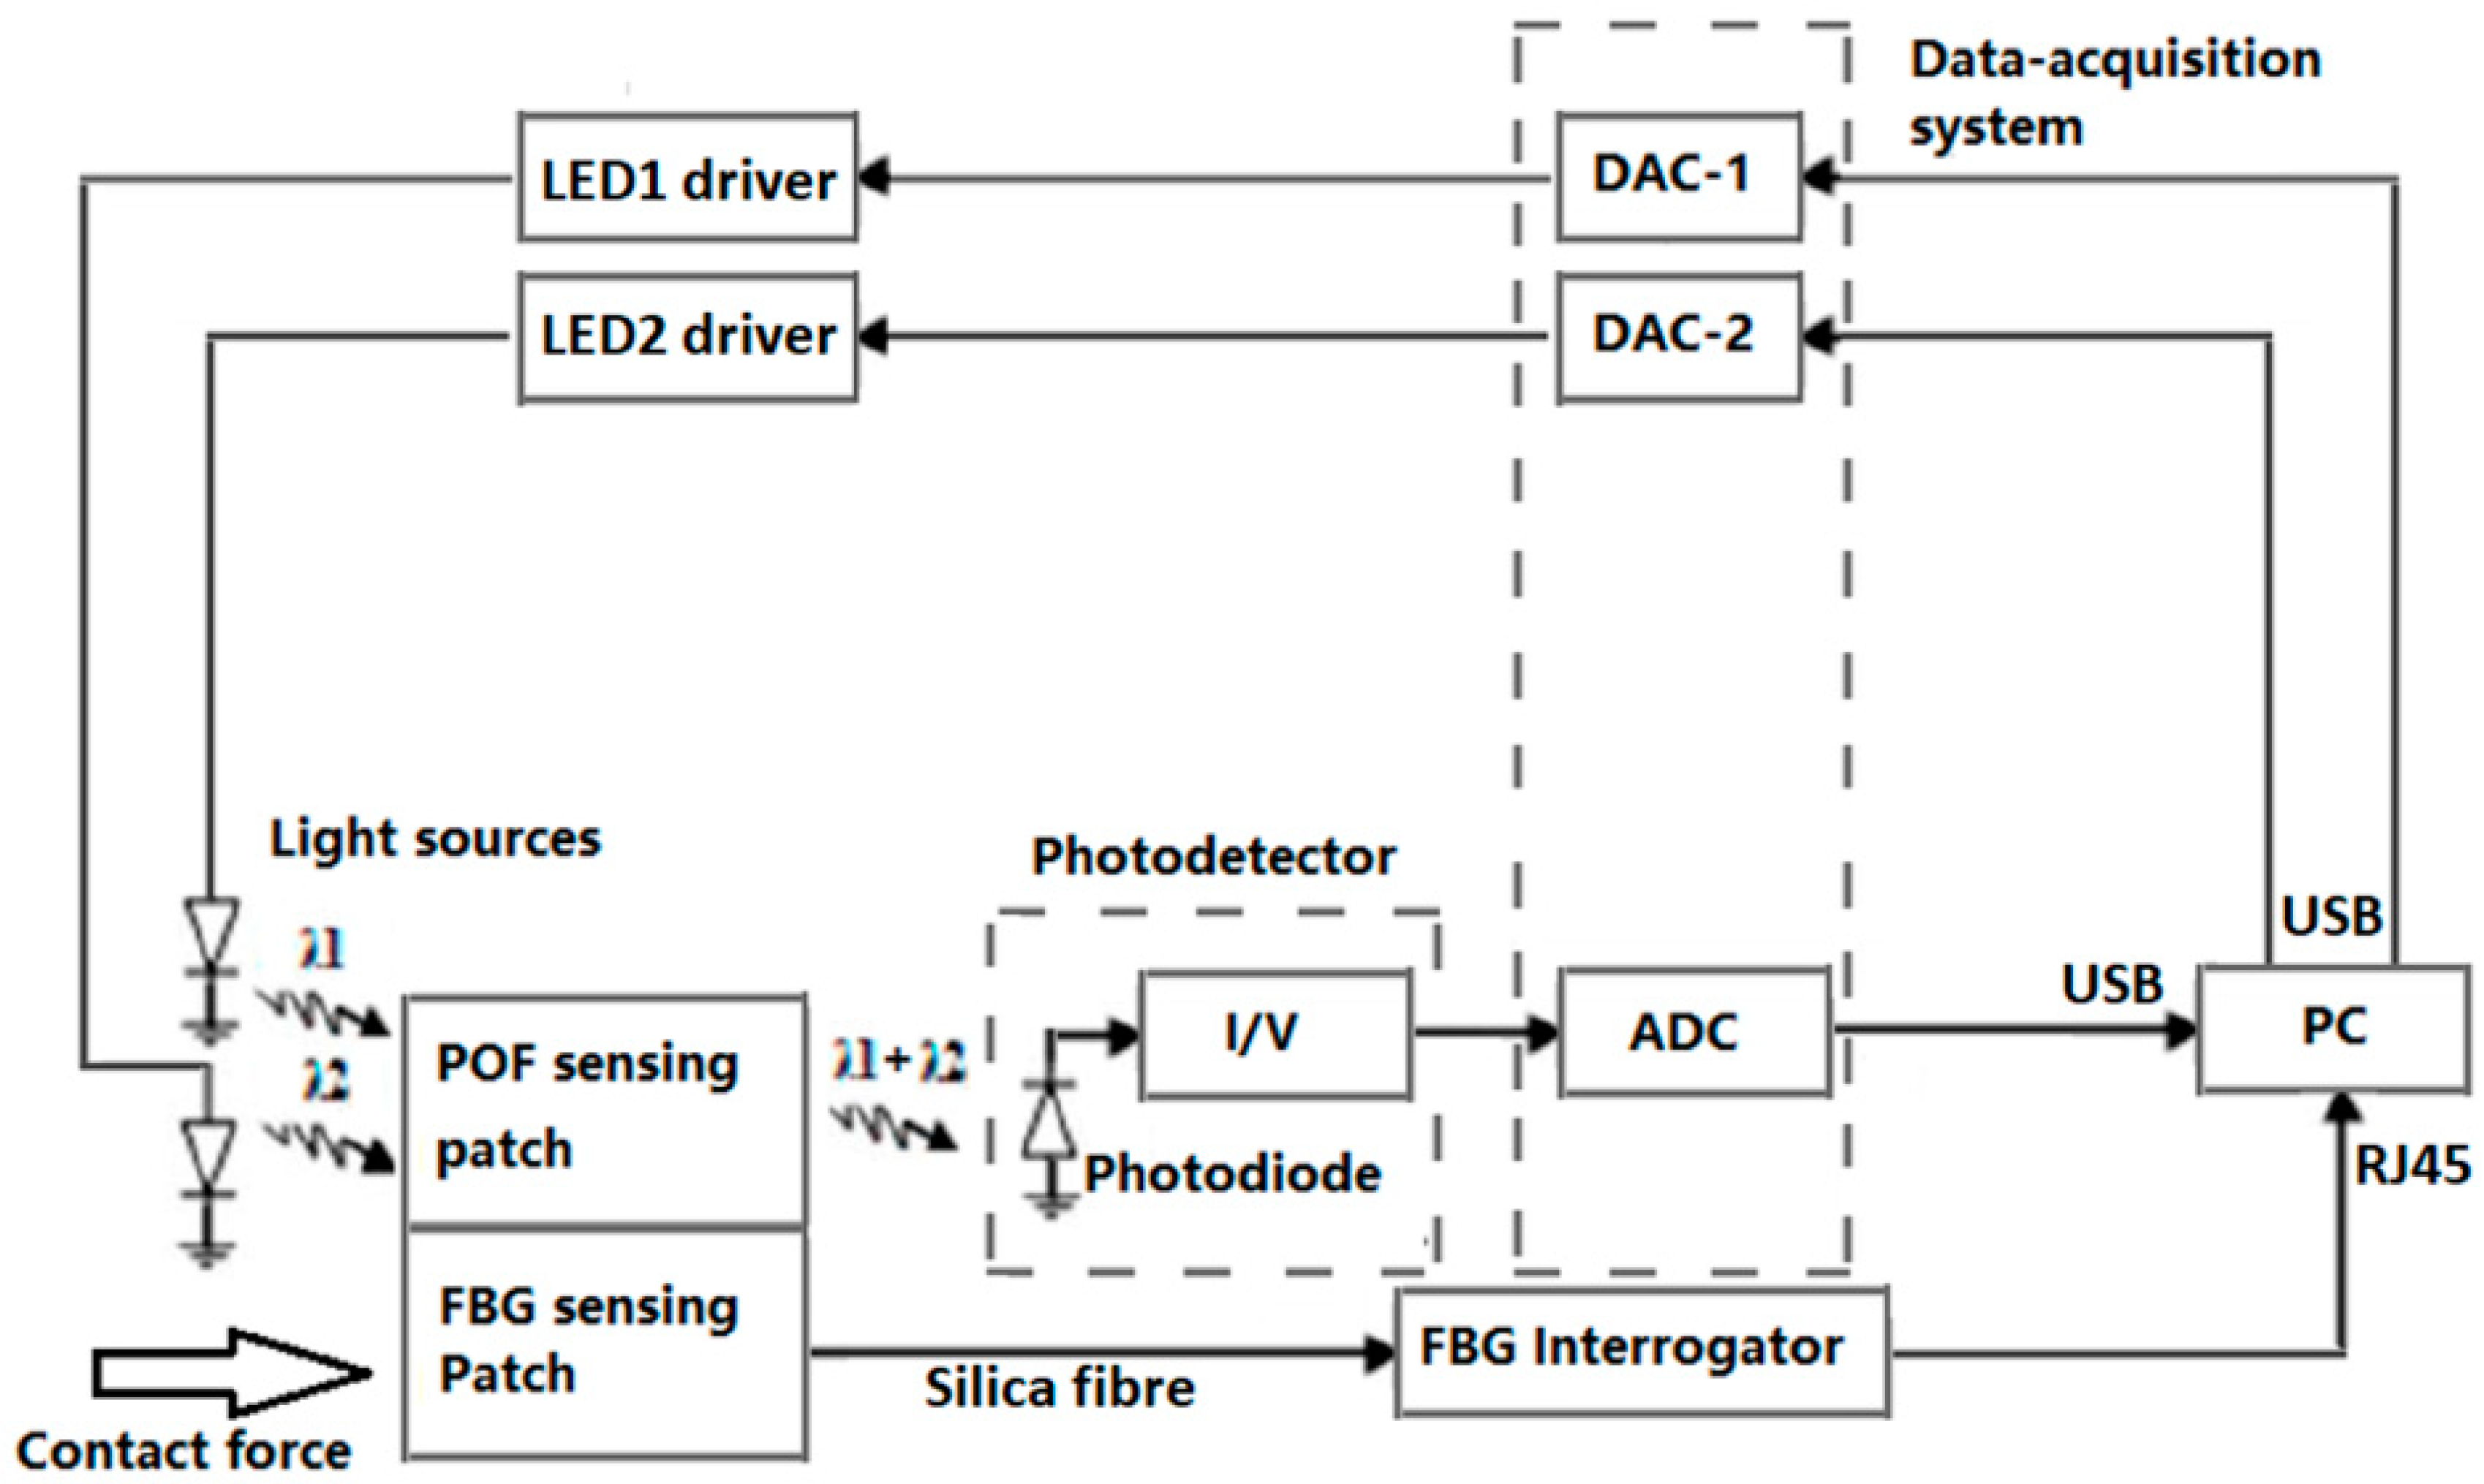
Figure 2 shows a block diagram of the opto-electronics system. The reflectance pulse oximetry sensor part consists of two LEDs operating at different wavelength: one at λ = 660 nm (fibre-coupled LED M00408143, Thorlabs, NJ, USA); and the other at λ = 850 nm (fibre-coupled LED M00290109, Thorlabs, NJ, USA). Two LED drivers (LEDD1B, Thorlabs, NJ, USA) control the light level and modulation. The photodetector (PDA36A-EC 350–1000 nm, Thorlabs, NJ, USA) has an amplifier with switchable gain that is set to 2.38 × 10⁶ V/A in this study. All components use SubMiniature version A (SMA) connectors. The data acquisition system (myDAQ, National Instruments, Berkshire, UK) has two analogue-to-digital converter (ADC) channels and two digital to analogue (DAC) channels. Only one ADC channel is used to read the output of the photodetector whilst two DAC channels are used to control the LEDs. The overall system is controlled by Labview (National Instruments, version 2015 SP1). Time-division multiple access (TDMA) is used to read both PPG signals using a single photodetector. Two 500 Hz square wave (25% duty cycle, 180° phase difference) are used to drive the two LEDs whilst the output of the photodetector is sampled at a frequency of 20 kHz.
The FBG response is measured using a SmartScan FBG interrogator (SmartScan, Smartfibres, UK) also illustrated in Figure 2. This is a high-speed interrogator with 4 channels that is capable of scanning at a frequency of 2.5 kHz for the entire wavelength range from 1528–1568 nm (i.e., over 40 nm with a resolution of 16 pm). The maximum scan frequency of the FBG interrogator with reduced wavelength range is 25 kHz.
2.3. Signal Processing
For the pulse oximeter, motion artefacts will affect the quality of the PPG signals collected [25]. Thus, before using the obtained PPG signals to calculate the SpO2, it is beneficial to assess the quality of these obtained PPG signals so that signals falling below a predefined quality threshold can be excluded from the analysis. There are several signal quality indices (SQIs) utilised in verifying the quality of PPG signals [22]. Two are considered here to accept or reject signals for further analysis: Perfusion Index (PI) is the most widely used [26], and skewness index (SI) which is associated with corrupted PPG signals reveals more detailed morphology of the pulse waveform [27].
PI is the ratio of the pulsatile to non-pulsatile blood volume in peripheral tissue [28]. A small PI indicates a weak pulsatile signal:
Y is the low-pass filtered PPG signal with a cut off frequency of 5 Hz. is the absolute statistical mean of the raw PPG signal.
SI is a measure of the symmetry (or lack of it) of a probability distribution. If the pulsatile PPG signal is strong and clear, SI is positive and verse versa:
N is the number of samples in the PPG signal. µx and σ are the mean and standard deviation of xi respectively.
To calculate the SpO2 value, it is necessary to extract the R ratio (Equation (2)) and then use the following empirical Equation (6) [29]:
Although a more accurate relationship could be obtained by comparison with blood gas analysis, taking blood samples was beyond the scope of the ethical approval.
All PPG signal processing is carried out in MATLAB, version R2016a. The FBG signals are processed using the software SmartScan V3.2.0. The Bragg peaks of two FBGs in the reflection spectrum are detected using the peak detection function of the SmartScan V3.2.0.
2.4. FBG Calibration and Validation
In order to test the temperature response of both FBGs and the ability of FBG2 to compensate for temperature, they were both placed in an oven (ED53, Binder GmbH, Tuttlingen, Germany) and tested by heating the oven from room temperature to 49 °C. Cooling of the oven was achieved by allowing the oven, with the door open, to naturally reduce in temperature back to the laboratory ambient temperature.
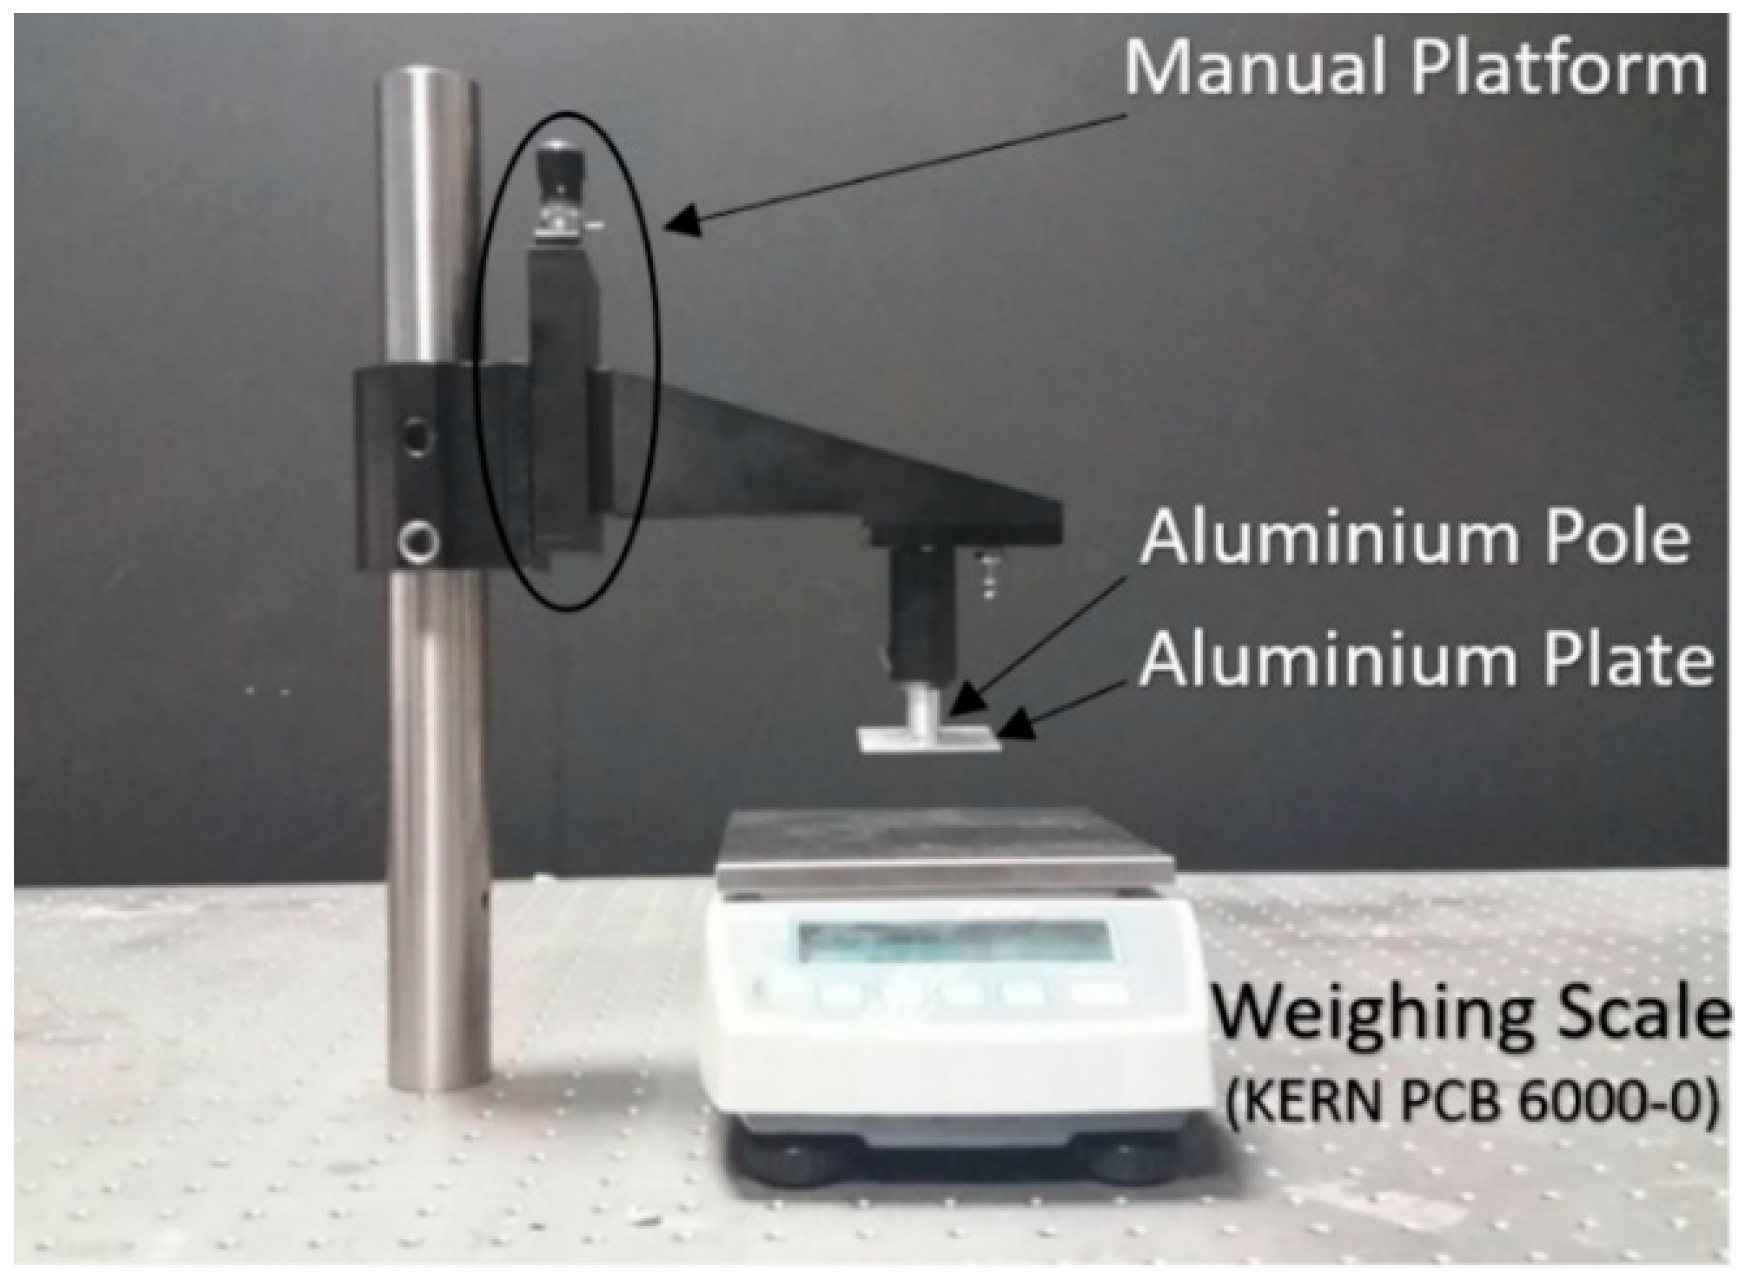
The contact pressure response is demonstrated using the set up shown in Figure 3. By screwing the manual plate to lift/lower the aluminium pole and plate the pressure on the FBG patch can be adjusted. The weighing scale (PCB 6000-0, KERN & SOHN GmbH, Balingen, Germany) beneath records the force loaded on the patch and is used for calibration of the FBG sensor.
2.5. In Vivo Pulse Oximetry Experiments and Comparison with Commercial Devices
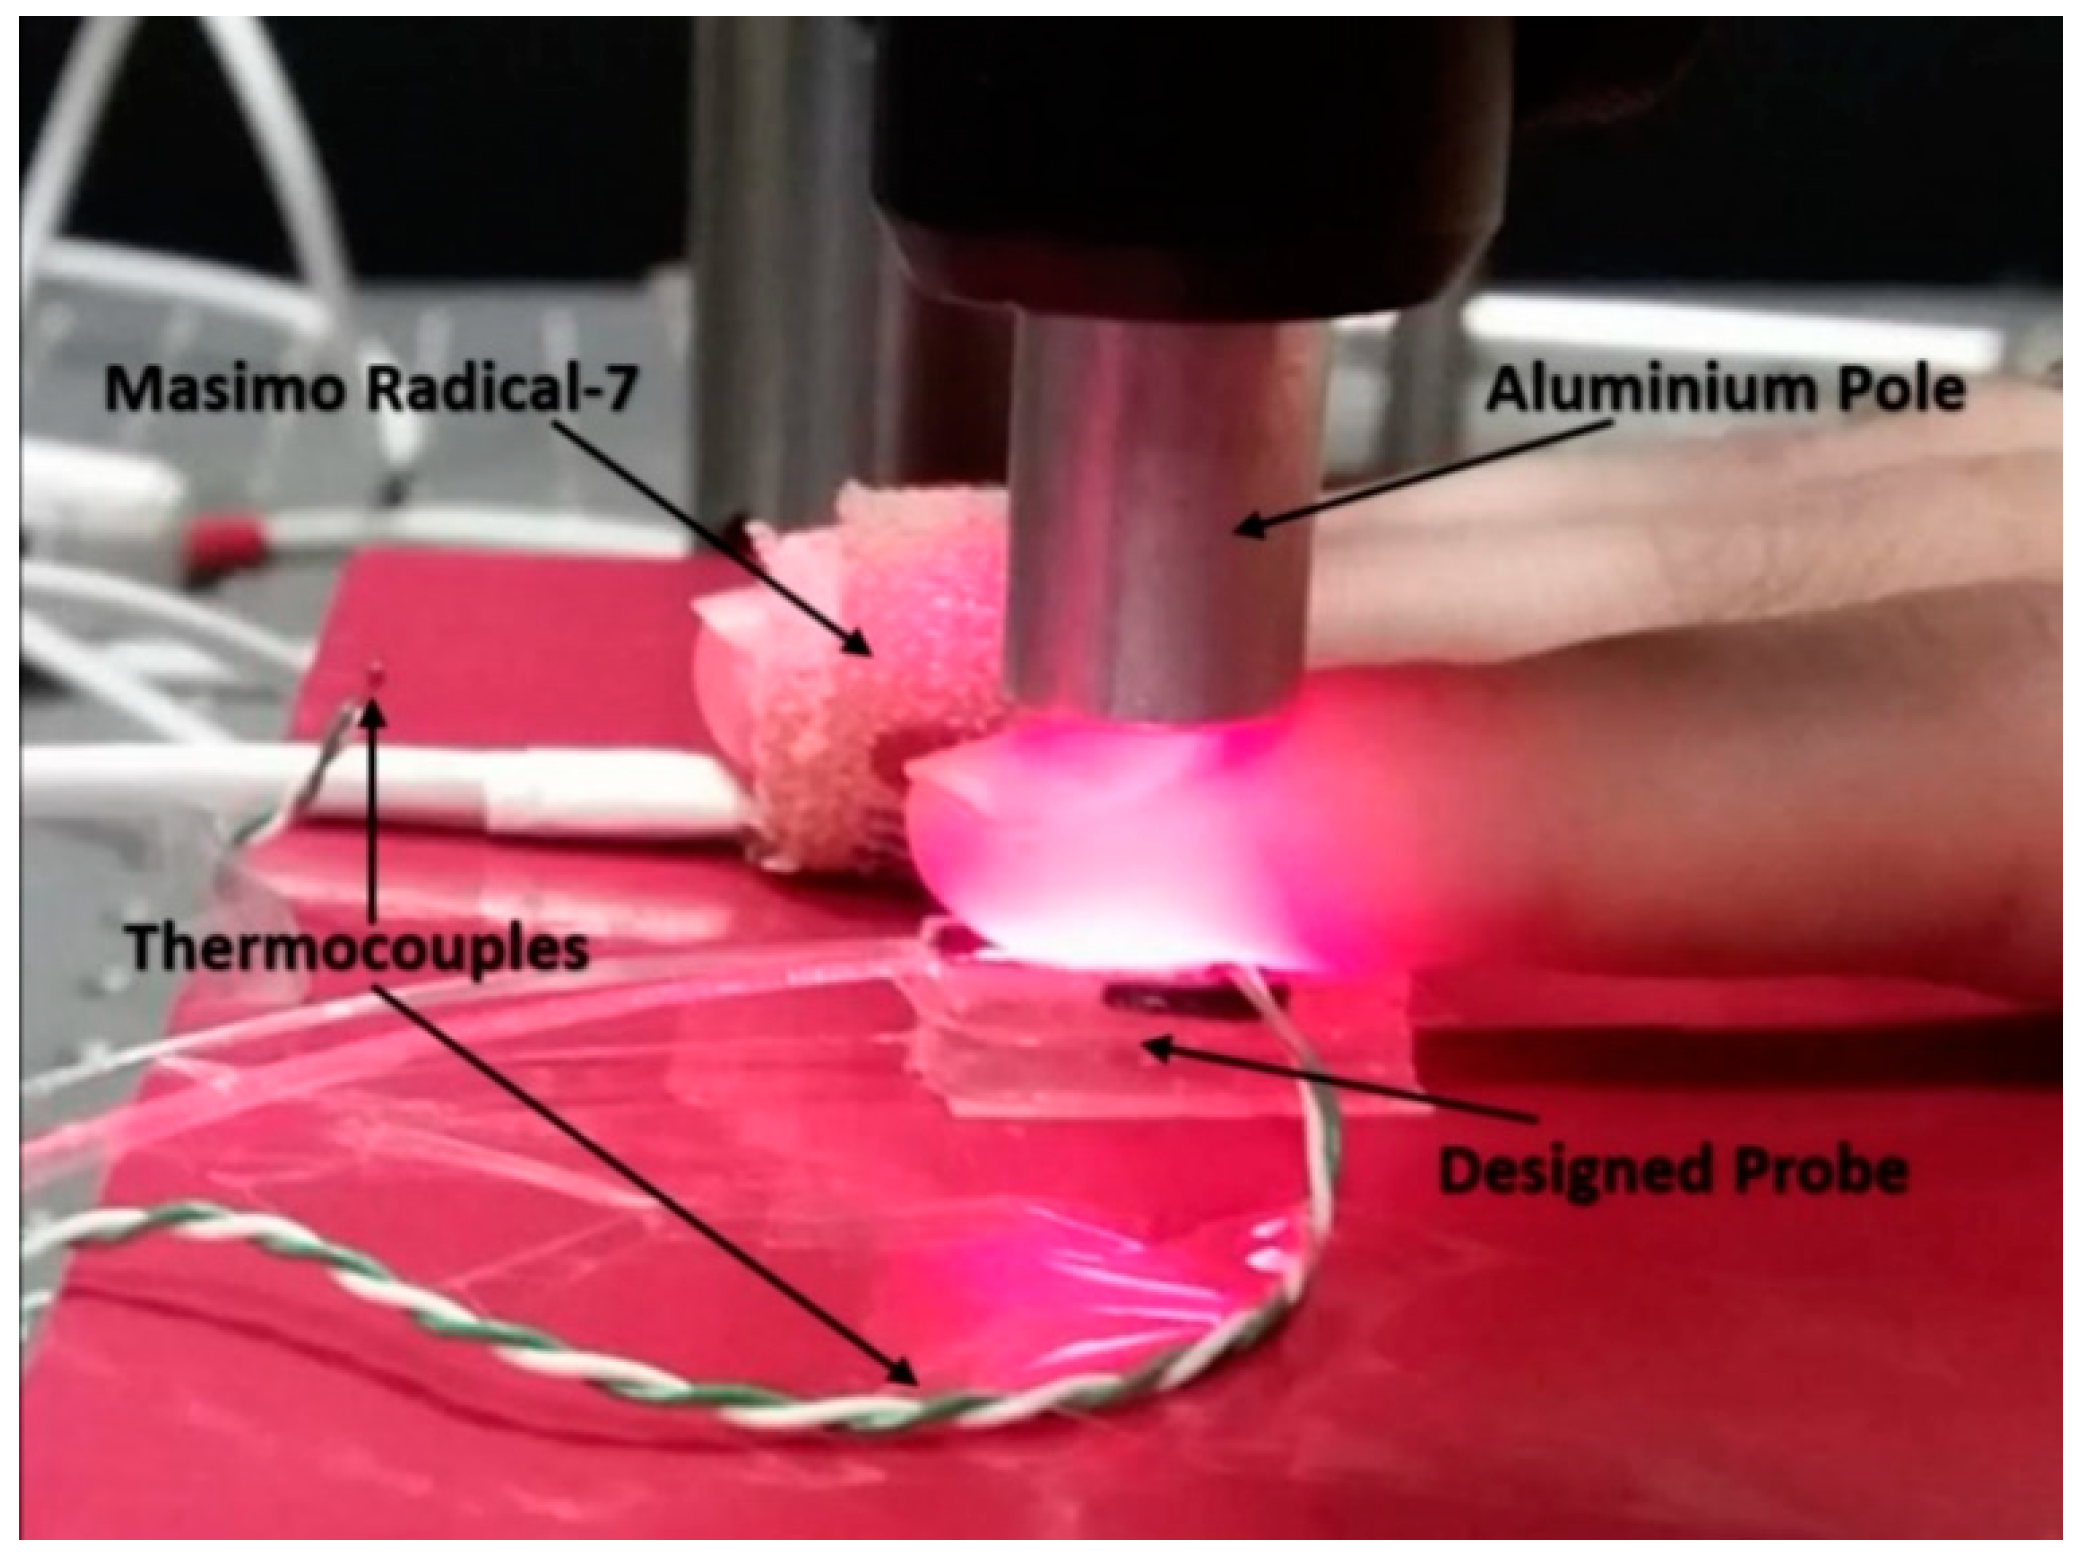
The designed pulse oximeter patch and a commercial transmission mode Pulse Oximeter (PO) (Radical-7, Masimo, CA, USA) simultaneously measure the SpO2 level of the index finger and the middle finger respectively. Preliminary results were obtained from a single volunteer to assess signal return and quality. A desaturation event was generated by requiring a seated volunteer to first breathe normally to obtain a baseline; then breathe out for 10–15 s; then hold breath for 20–30 s and then finally breathe normally again.
Human volunteer studies were approved by the Faculty of Engineering Ethics Committee at the University of Nottingham. Figure 4 shows the setup for experiments. The pulse oximeter and the commercial PO recorded the SpO2 value of ten volunteers’ index fingers and middle fingers. The FBG recorded the contact forces at the same time. Pressure was applied in steps (approximately 7 kPa) to the finger using the aluminium pole shown in Figure 3 and Figure 4 using the manual screw plate until the PI is too low and the pulsatile PPG component from the reflected light can no longer be observed. The pole was then gradually lifted to reduce the pressure exerted on the index finger. Each volunteer repeated the experiment three times.
Apart from the contact pressure, temperature is also an important factor. In this study, the room temperature was higher than 26 °C during experiments. This results in the temperature of the volunteers’ index fingers being higher than 30 °C (measured by PICO Technology SE000 thermocouple (Pico Technology, Saint Neots, UK)). The body temperature will affect the blood circulation and cause unwanted grating period variations. Thus, the future version of the sensor is recommended to add FBG sensors to detect the environment and subject’s temperature.
3. Results and Discussion
3.1. Preliminary SpO2 Measurement
Preliminary data showing the effectiveness and operational functionality of the system in correctly multiplexing the red and infrared channels; reducing the effects of stray light; recording PPGs and examples of the application of the signal quality indices are shown in the supporting data.
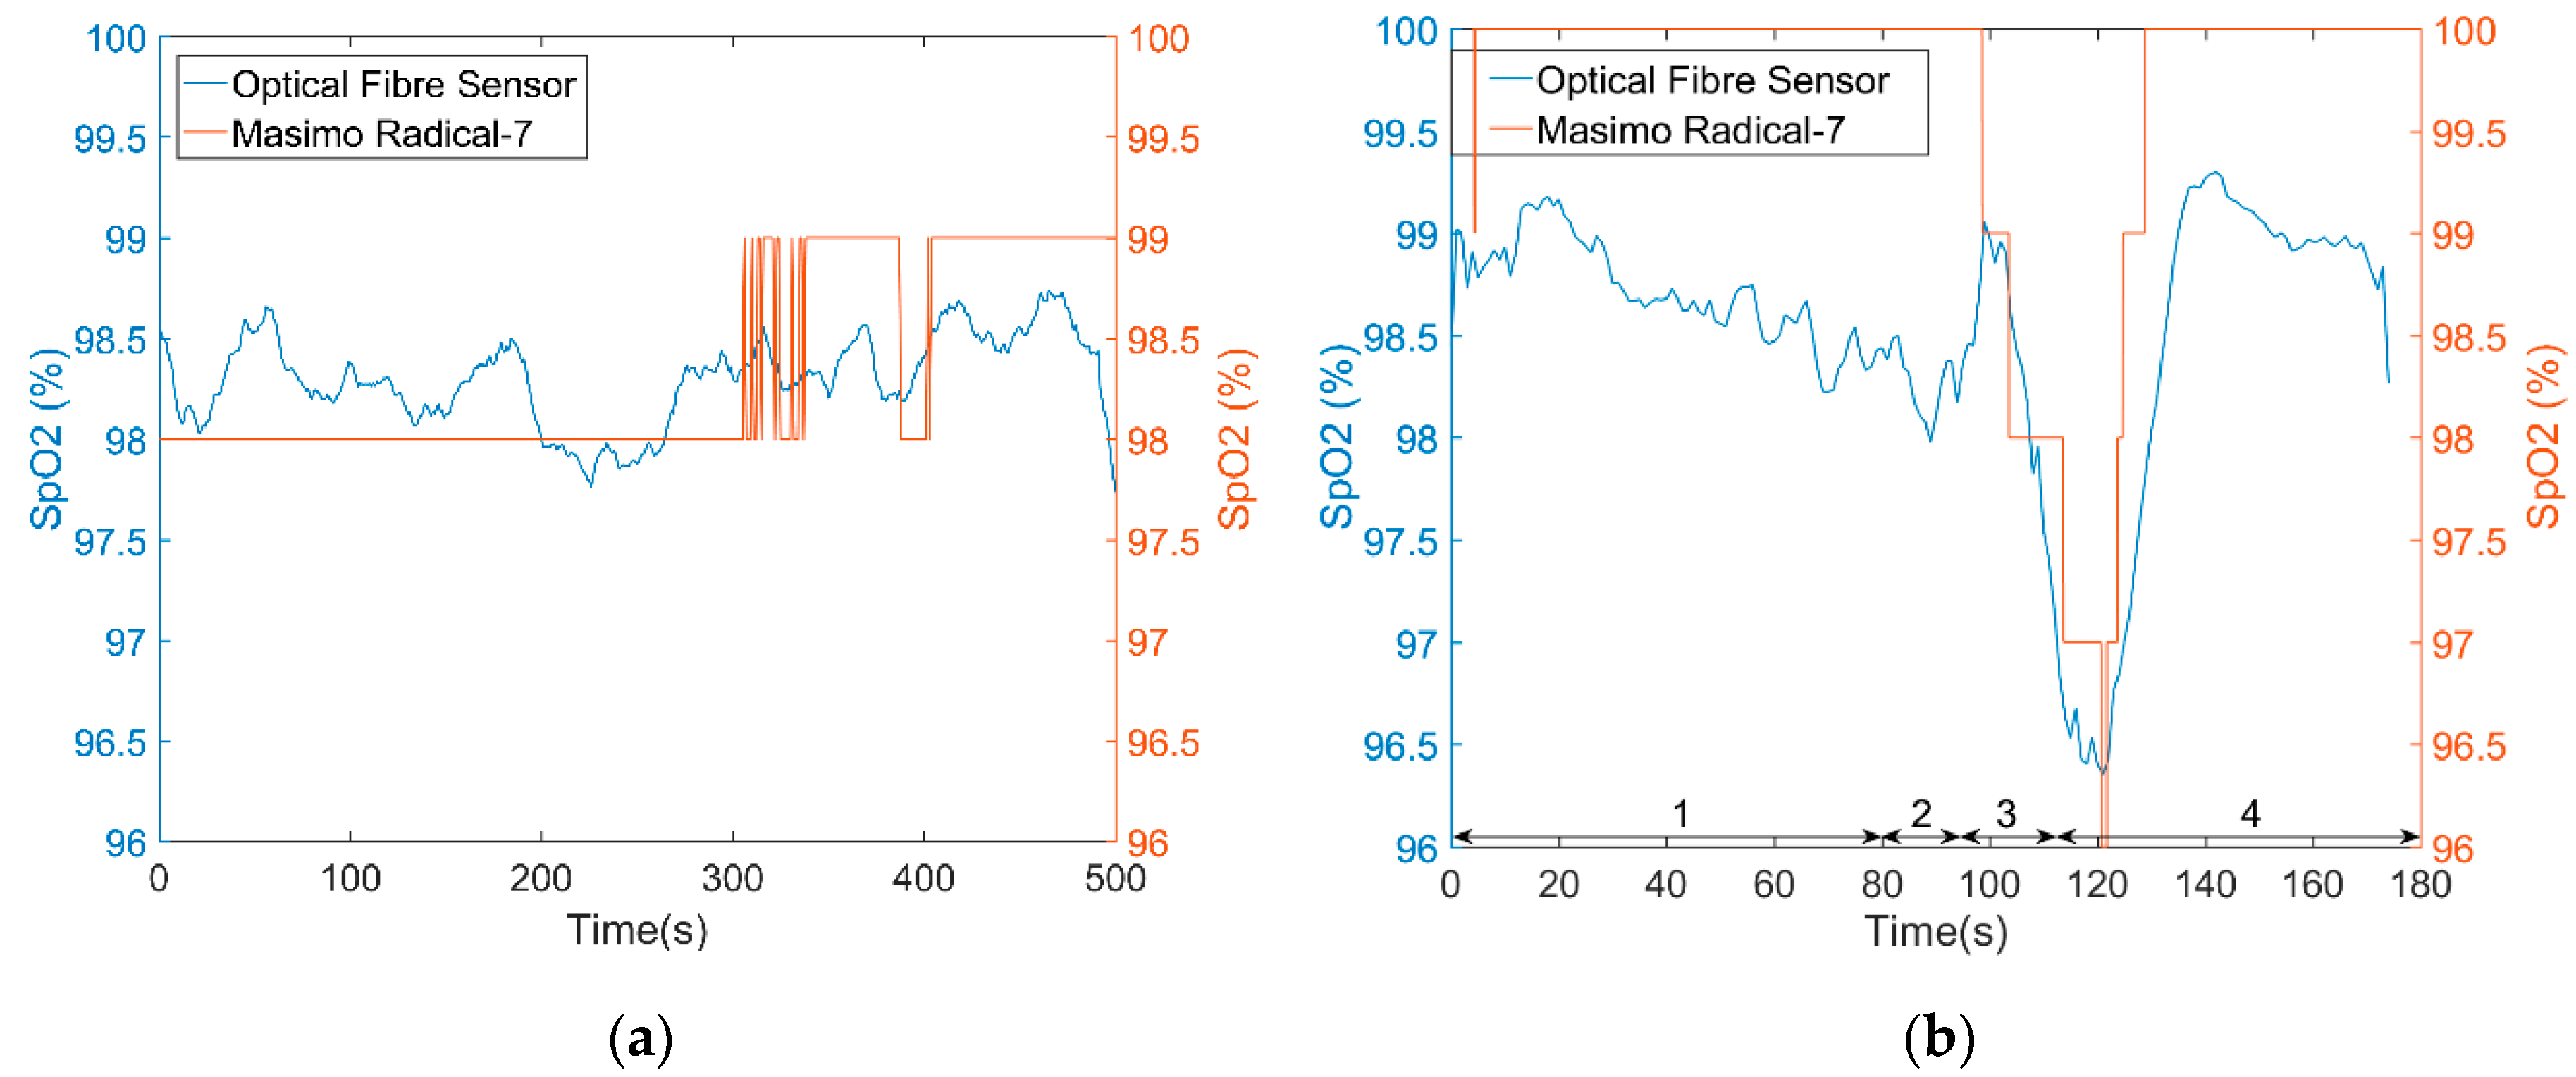
Figure 5a is a SpO2 test result on one volunteer’s index finger for a period of 500 s. During the whole test, the volunteer was seated and breathed normally. A commercial pulse oximeter recorded the SpO2 value (simultaneously) of the middle finger in transmission mode and provides values to the nearest 1%. The test result of the optical fibre sensor is close to the commercial device (absolute error 0.443 ± 0.466%). Figure 5b shows a desaturation event (absolute error 1.16 ± 0.423%), although the stationary values are ~1% lower than the commercial device, the desaturation event can be easily identified.
3.2. FBG Pressure Sensor
Results demonstrating the effect of temperature on the FBGs and the effectiveness of the temperature reference calibration are shown in the supporting data. In this experiment, the FBG silica fibre is fixed on the optical table using tape to avoid manually straining the fibre. In future versions of the design, an additional FBG is recommended for compensating the axial strain interference.
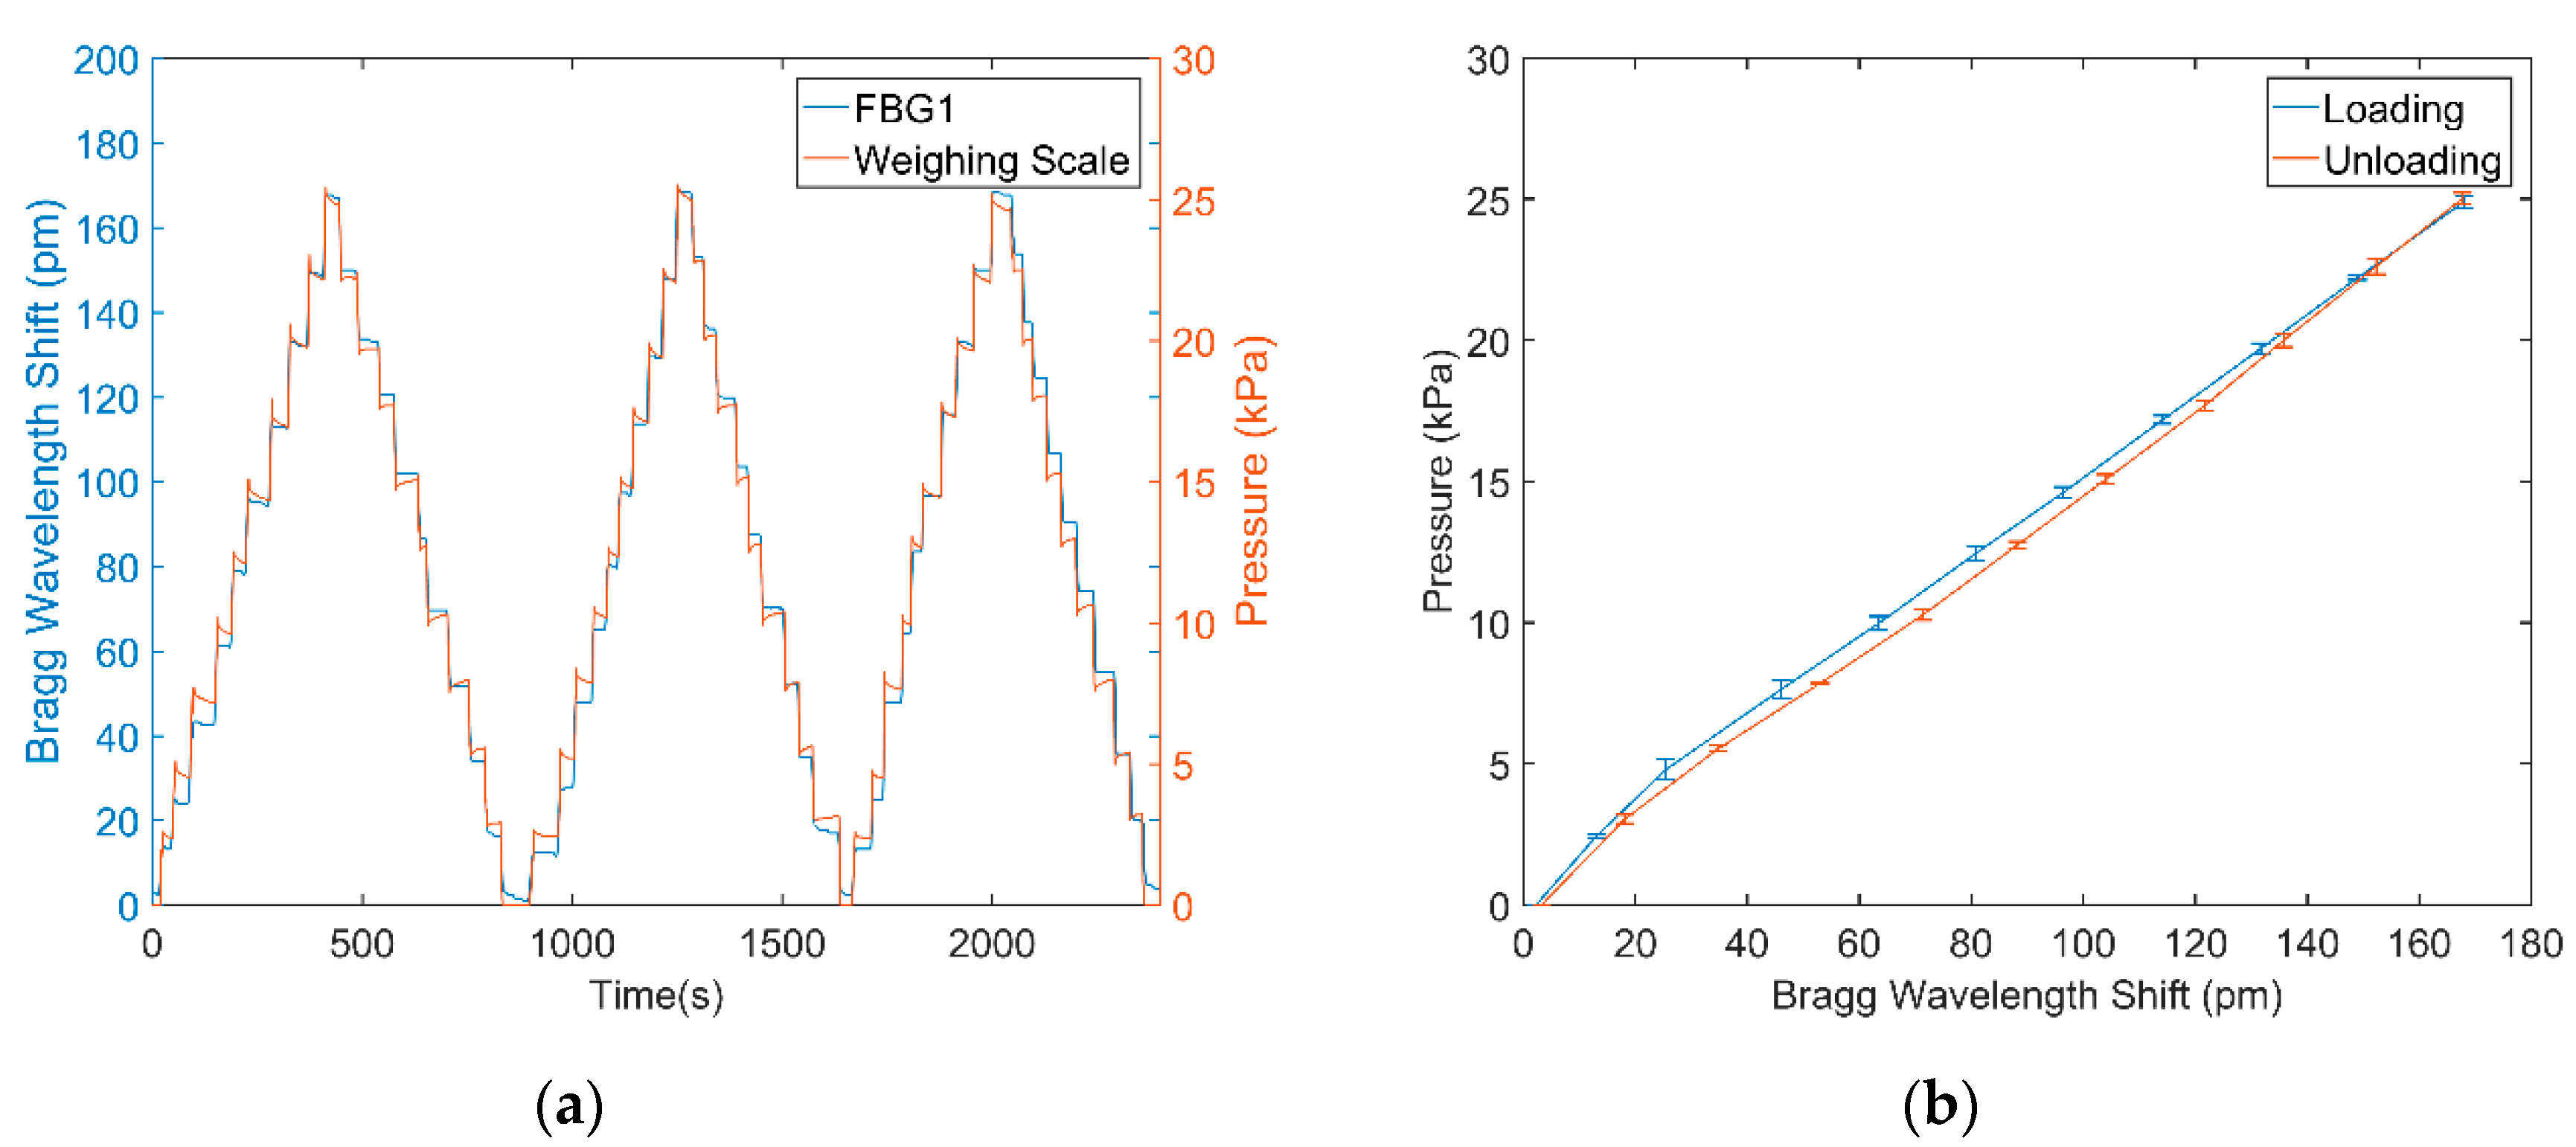
Figure 6a shows the Bragg wavelength changes ΔλFBG1 in the FBG1 caused by pressure loading and unloading using the system shown in Figure 3. The FBG response follows that of the applied pressure. Using the data in Figure 6a the relationship between applied pressure and wavelength can be obtained by plotting a calibration curve as shown in Figure 6b. This indicates that the FBG patch is both reliable and repeatable for pressure monitoring with low hysteresis. Based on Figure 6b, the empirical equation of pressure calculation can be deduced:
3.3. In Vivo Pulse Oximetry and Pressure Monitoring
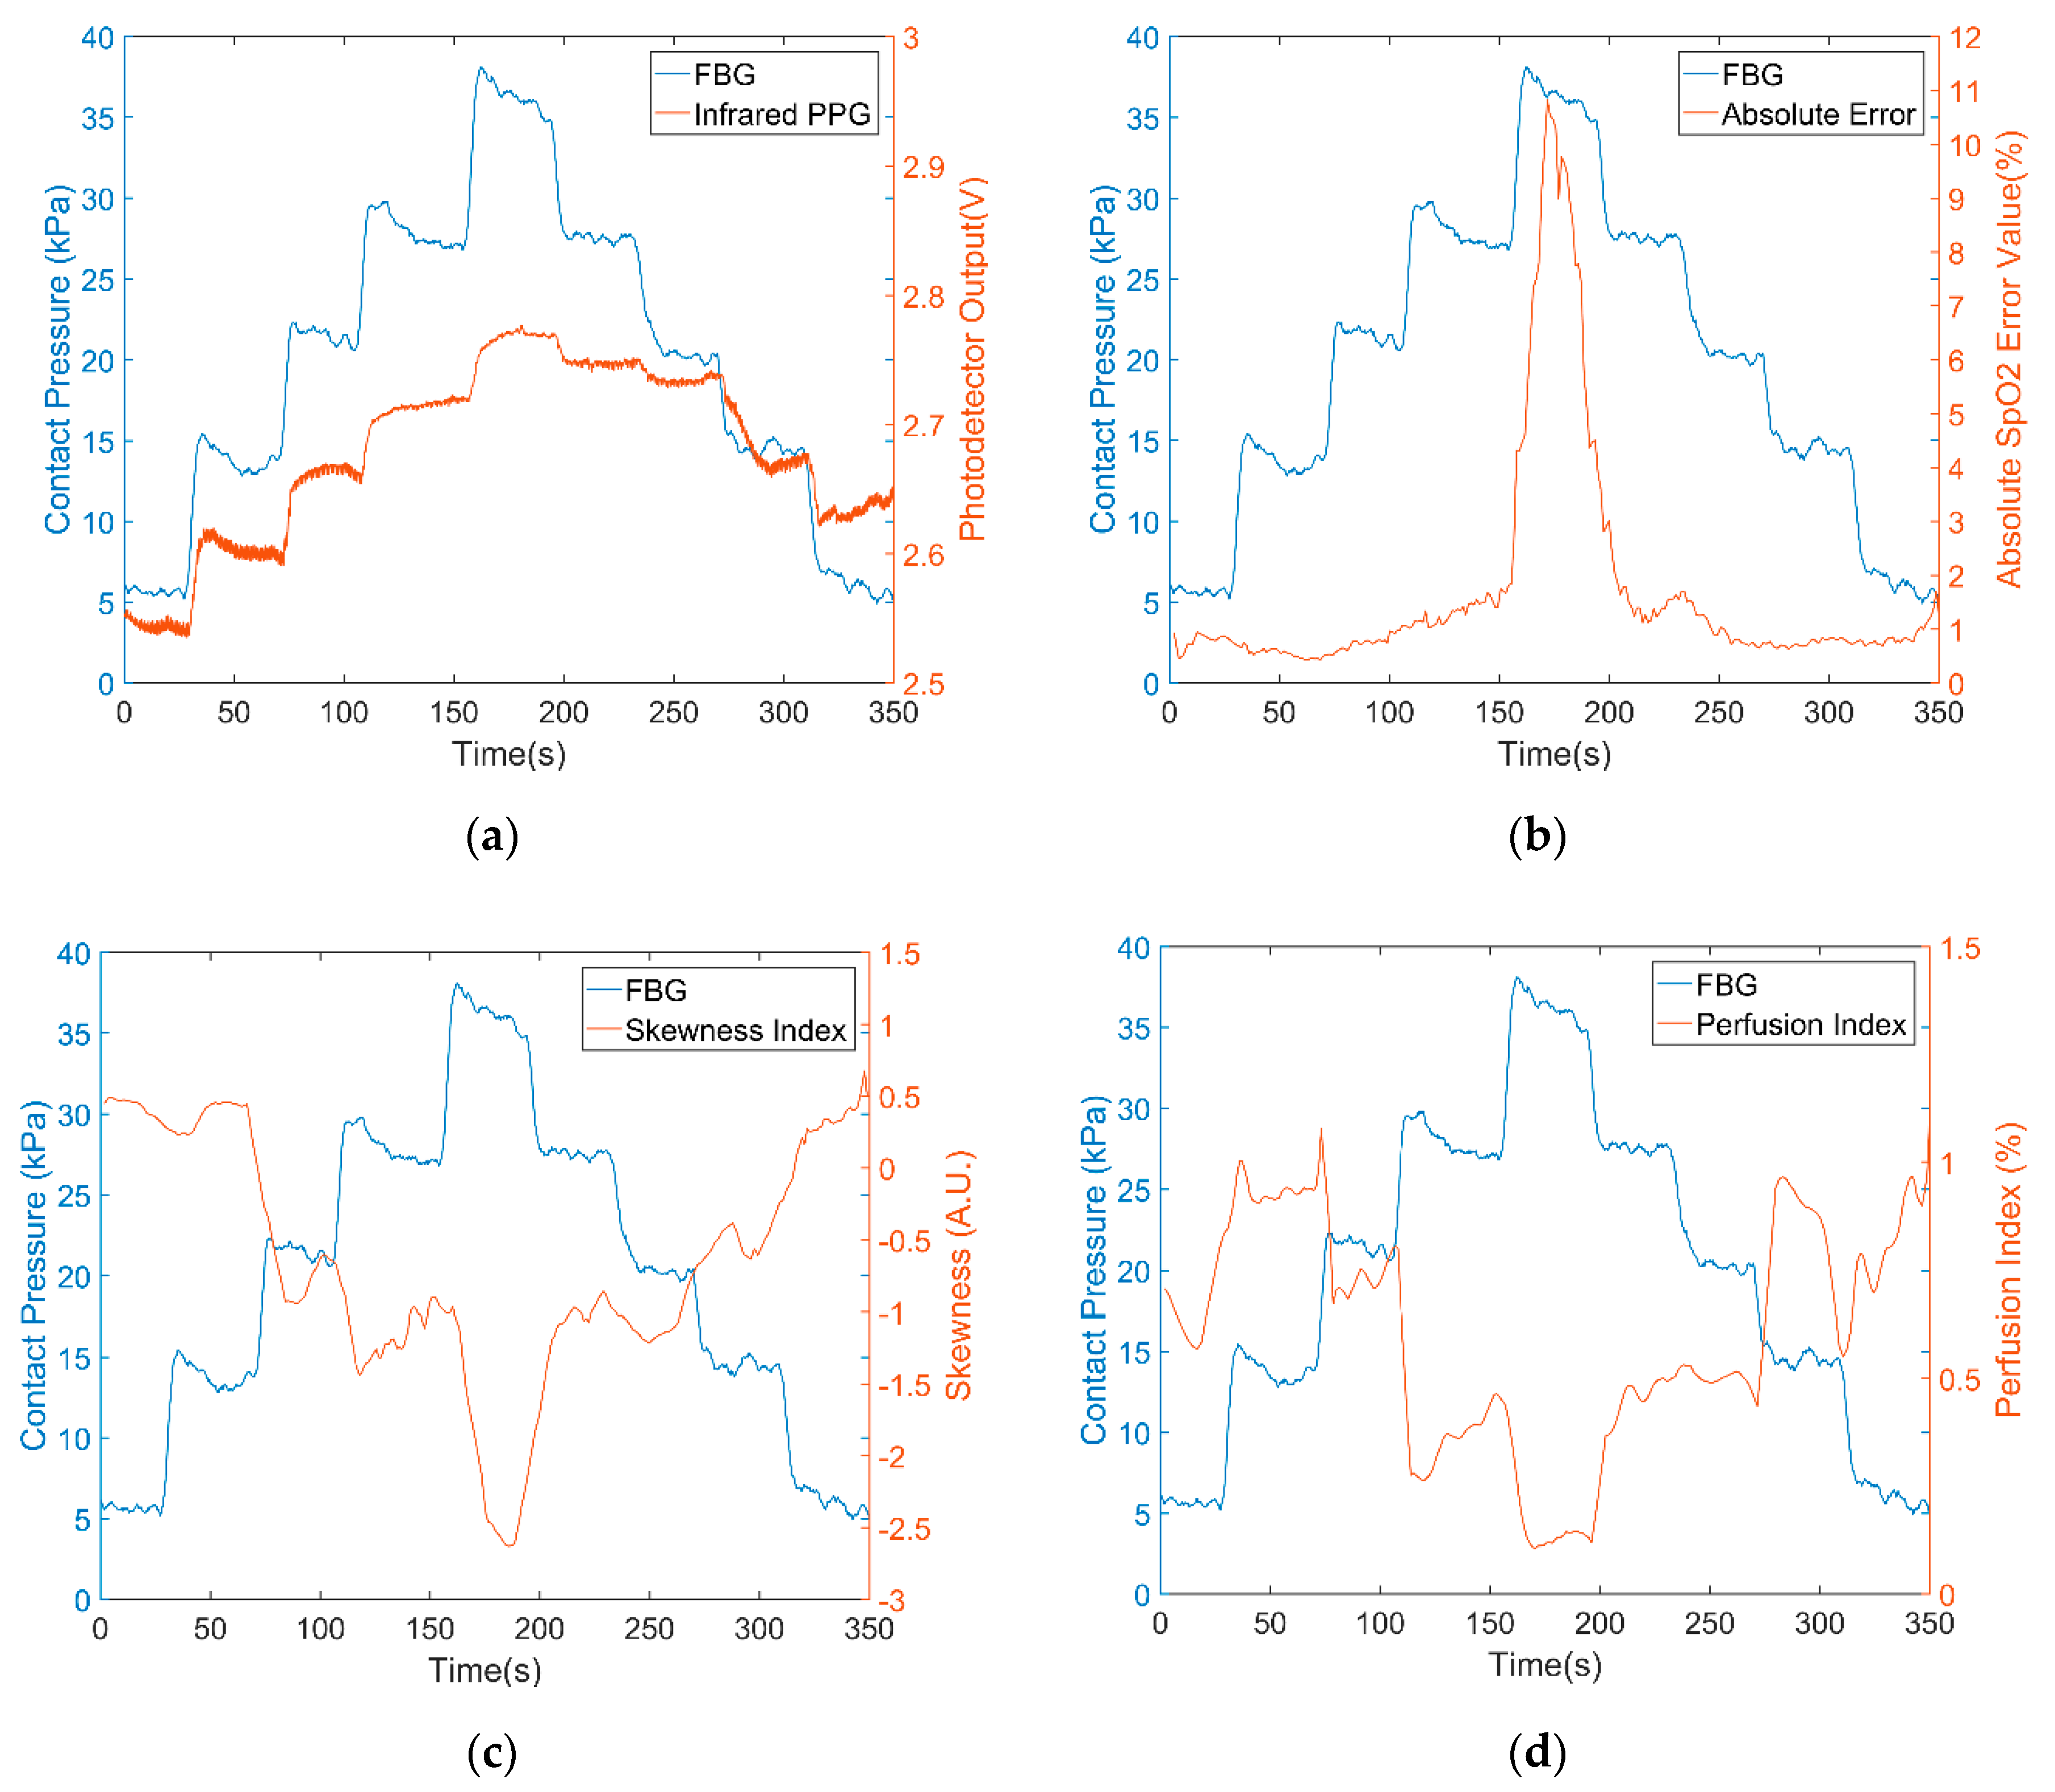
Typical results for a single volunteer are presented to demonstrate the fibres pulse oximetry response to applied pressure, followed by a summary of the errors due to applied pressure for all volunteers. The figures of all 30 experimental results are illustrated in the supporting file (Figures S6–S35). Figure 7a shows the infrared PPG signal (red curve) and the contact pressure (blue curve). As contact pressure increases the AC component of the PPG signal decreases (i.e., a thinner red line) and the DC light level increases. This is to be expected as the blood flow is occluded and the tissue blanches.
Figure 7b shows the absolute SpO2 error between the optical fibre sensor and the commercial device. The initial pressure generated by the weight of the index finger was around 4 to 6 kPa. For pressures higher than 15 kPa, the reliability and accuracy of the sensor for SpO2 determination are degraded. Figure 7c,d reinforce this degradation by illustrating the PI and SI of the infrared PPG signals falling. When the contact pressure was increased higher than 15 kPa, both PI and SI sharply decrease but recover when the pressure returns below 15 kPa.
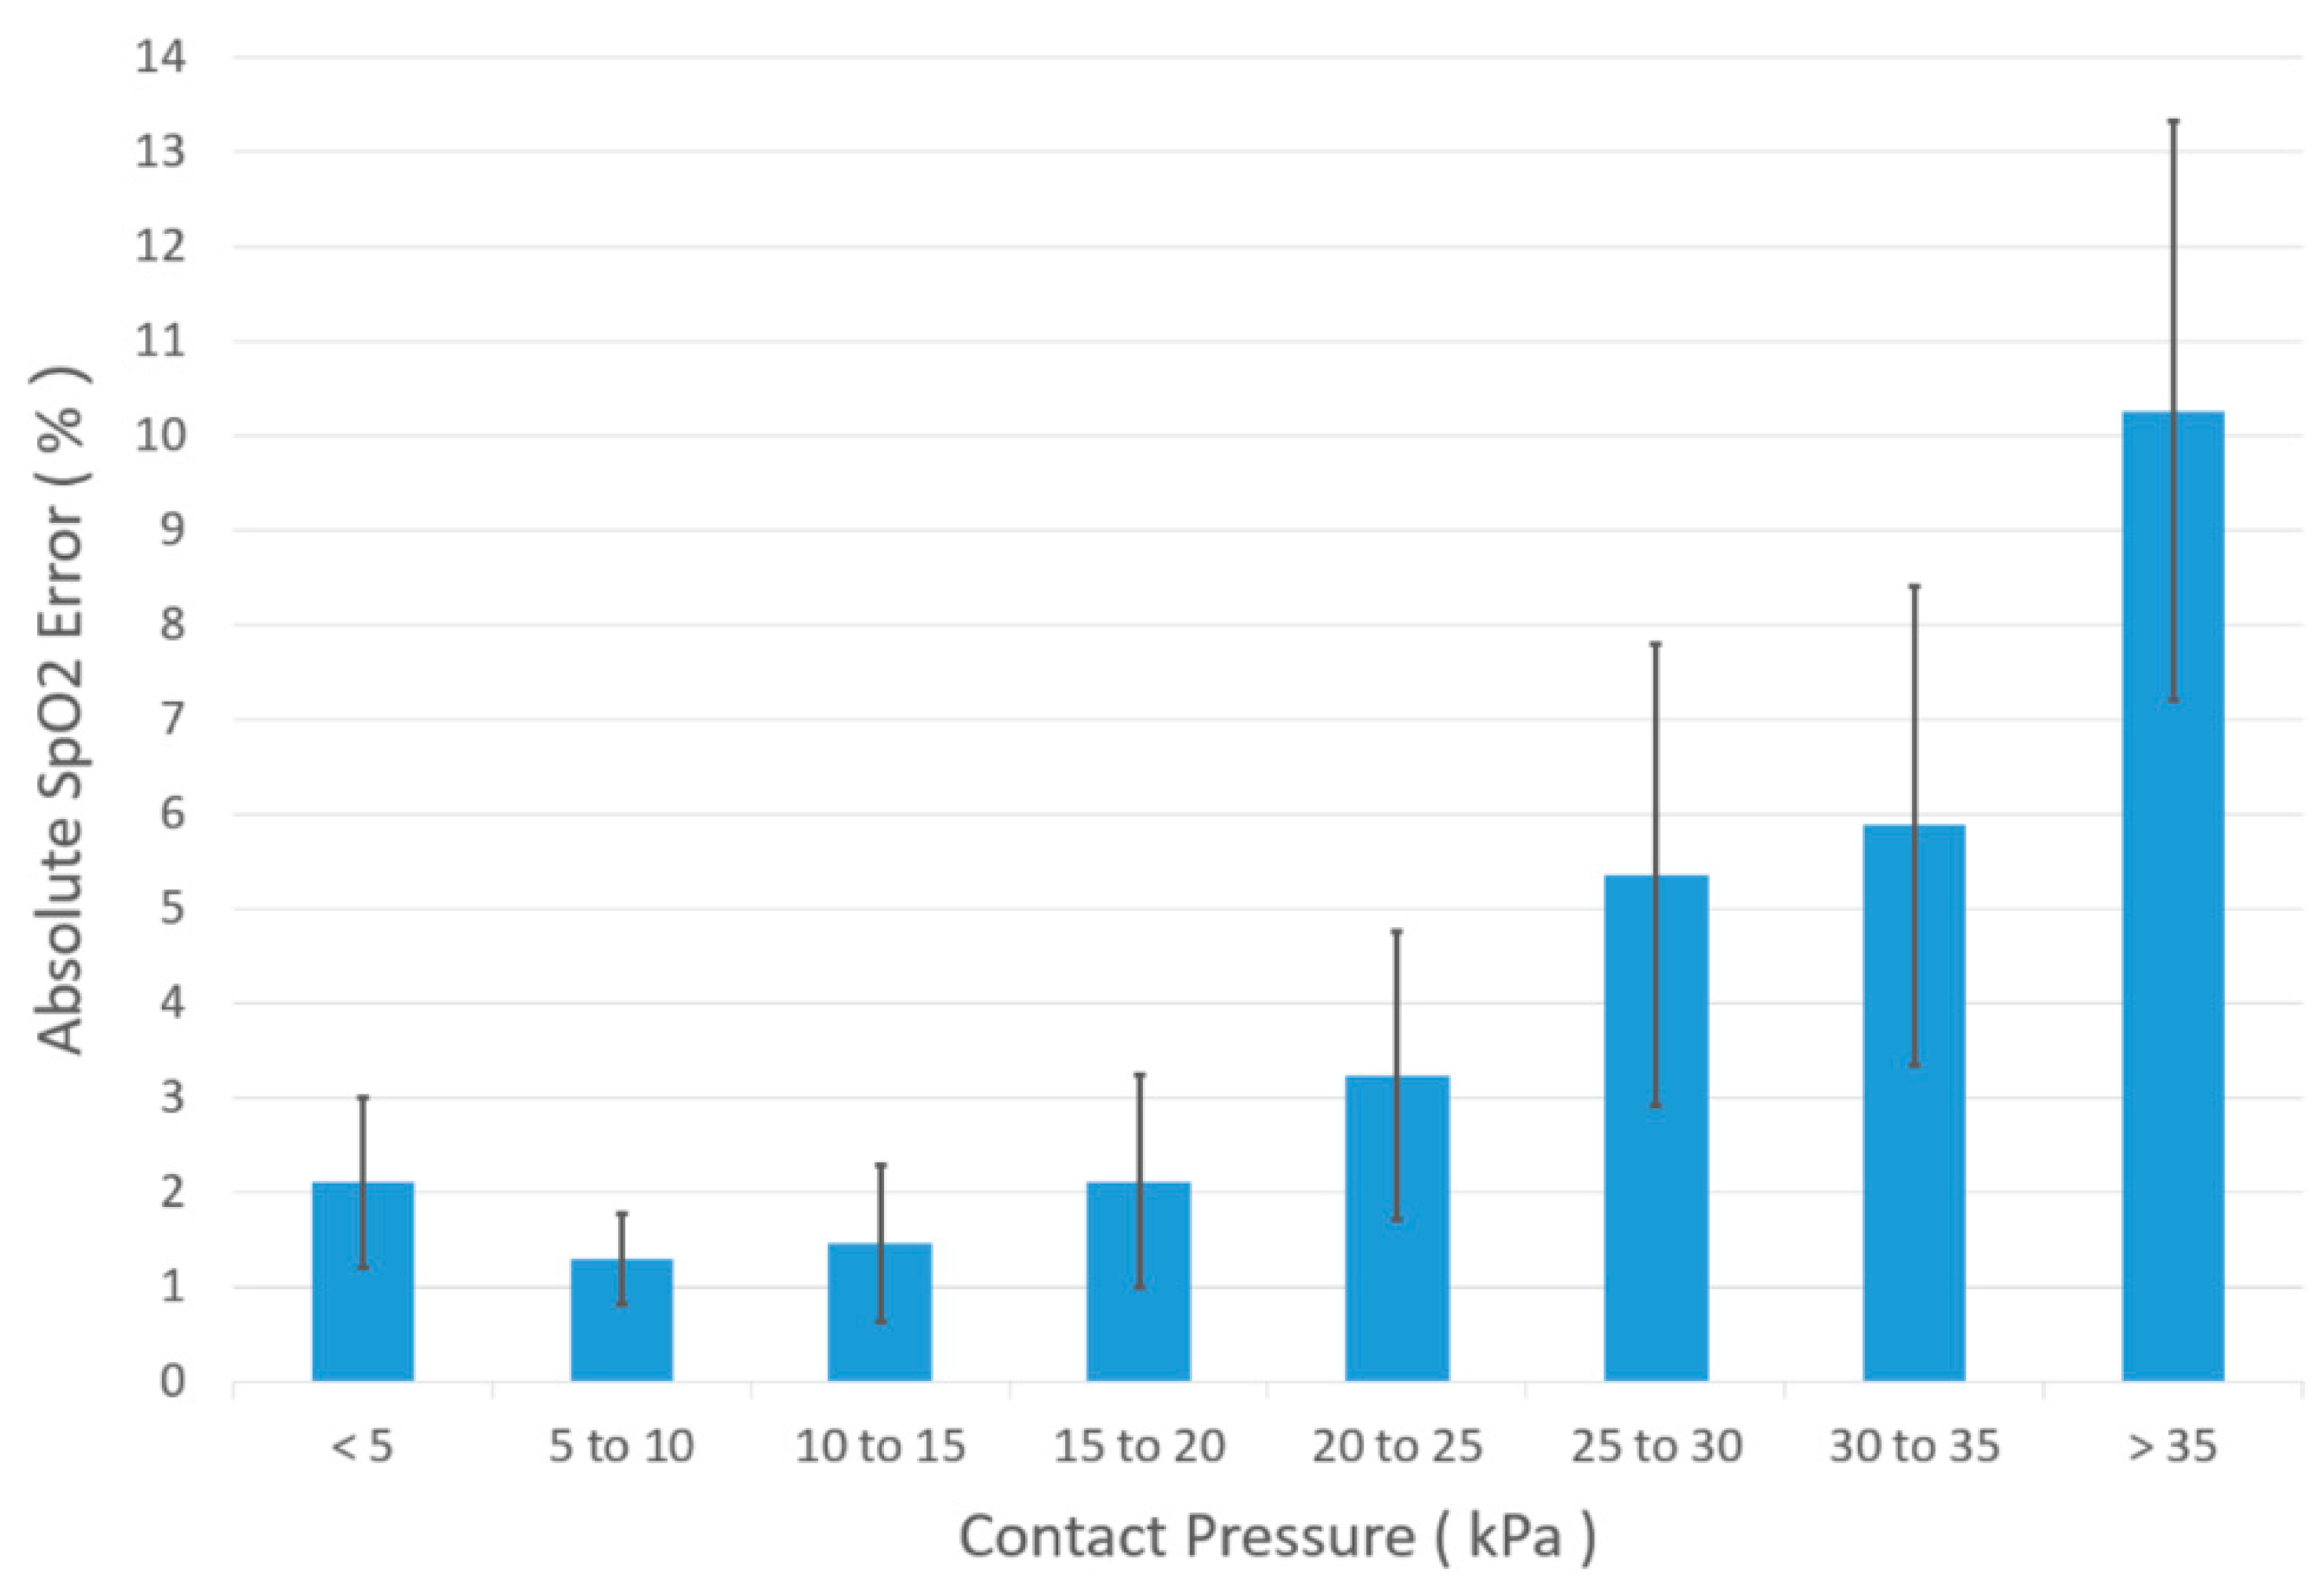
For each of the ten volunteers, this experiment was repeated three times to provide 30 datasets, all of which were similar to those shown in Figure 7a–d. By averaging three measurements from the ten volunteers, a bar chart was established (see Figure 8) which shows the contact pressure effects on SpO2 measurement. Here, we can see that the pressure range from 5 to 15 kPa is the most suitable for SpO2 monitoring. This pressure range is close to the largest PPG amplitude obtained pressure range (8 to 12 kPa) for a reflectance sensor attached to the forehead region above the eye [30,31,32]. Thus, in future studies, it is suggested to apply the designed sensor to measure the forehead SpO2 value.
Since the different modes of two pulse oximeters applied (reflectance/transmission mode) contributes to the SpO2 error as well, in future studies, the algorithm chosen for calculating SpO2 should be modified to reduce the error between the designed sensor and the commercial pulse oximeter.
4. Conclusions
A novel integrated optical fibre sensor probe combining a reflectance pulse oximeter with a fibre Bragg grating contact pressure sensor has been demonstrated. To maximise light delivery and collection to and from the tissue, each plastic optical fibre used in the pulse oximeter is cleaved at 45° at its distal end. All optical fibres are housed in a biocompatible epoxy patch which serves two purposes: (i) to reduce motion artefacts in the photoplethysmogram; and (ii) to transduce transverse loading into an axial strain in the FBG. Test results show that using a combination of pressure measuring FBG with a reference FBG, reliable results are possible with low hysteresis.
In vivo pulse oximetry experiments on 10 healthy volunteers demonstrated the effect of contact pressure on SpO2 monitoring. Based on the SpO2 error between a commercial pulse oximeter and the designed sensor along with two signal quality indices, the optimum pressure range for SpO2 detection was found to lie between 5 kPa and 15 kPa.
The combined probe has the potential to improve the reliability of reflectance oximeters. In particular in wearable technology the probe should find use in optimising the fitting of garments incorporating this technology. Often garments worn are tightly fitting which can limit user adherence and applying the optimum pressure without being too tight could be beneficial. The probe also has the potential to be used in loosely fitting garments where measurements are only recorded when the appropriate pressure is applied.
Supplementary Materials
The following are available online at https://www.mdpi.com/1424-8220/18/11/3632/s1: Figure S1: TDMA system time slot; Figure S2: The immunity of the POF patch to stray light interference; Figure S3: Reflected PPG signals obtained by the POF patch; Figure S4: SQIs of high, medium and low quality PPG signals; Figure S5: Temperature performance of FBG 1 and 2; Figures S6–S35: 30 groups of experiments data recorded.
Author Contributions
Conceptualization, R.C., S.P.M., S.K. and B.R.H.-G.; Methodology, C.L. and R.C.; Software, C.L. and R.C.; Validation, C.L., H.B. and R.C.; Formal Analysis, C.L. and H.B.; Investigation, C.L., S.K., B.R.H.-G. and S.P.M.; Resources, B.R.H.-G. and S.P.M.; Data curation, C.L.; Writing—Original Draft Preparation, C.L.; Writing—Review and Editing, C.L., R.C., S.K., B.R.H.-G. and S.P.M.; Visualization, C.L., R.C. and S.P.M.; Supervision, R.C., S.K., B.R.H.-G. and S.P.M.; Project administration, S.P.M.
Funding
This work was partially funded by EPSRC Impact Acceleration Award (EP/K503800/1), a Hermes Innovation award. CL was funded by a studentship from the University of Nottingham, HB was funded by a stipend from the Electronic and Computer Engineering, University of Umm Al-Qura, Al-Abdiah, Makkah, Saudi Arabia.
Ethical Statements
All subjects gave their informed consent for inclusion before they participated in the study. The study was conducted in accordance with the Declaration of Helsinki, and the protocol was approved by the Faculty of Engineering Research Ethics Committee, the University of Nottingham (ethics approved date: 15/11/2017, study revision approved date: 02/07/2018).
Conflicts of Interest
The authors declare no conflict of interest.
References
- Taillefer, M.-C.; Denault, A.Y. Cerebral near-infrared spectroscopy in adult heart surgery: Systematic review of its clinical efficacy. Can. J. Anesthesia 2005, 52, 79. [Google Scholar] [CrossRef] [PubMed]
- Webster, J.G. Design of Pulse Qximeters; CRC Press: Boca Raton, FL, USA, 1997. [Google Scholar]
- Strojnik, M.; Paez, G. Spectral dependence of absorption sensitivity on concentration of oxygenated hemoglobin: Pulse oximetry implications. J. Biomed. Opt. 2013, 18, 108001. [Google Scholar] [CrossRef] [PubMed]
- Babikir, S.F.; Ismail, R.A. Oxygen Level Measurement Techniques: Pulse Oximetry. J. Sci. Technol. 2015, 16, 1–5. [Google Scholar]
- Allen, J. Photoplethysmography and its application in clinical physiological measurement. Physiol. Meas. 2007, 28, R1. [Google Scholar] [CrossRef] [PubMed]
- Lee, H.; Ko, H.; Lee, J. Reflectance pulse oximetry: Practical issues and limitations. ICT Express 2016, 2, 195–198. [Google Scholar] [CrossRef]
- Pola, T.; Vanhala, J. Textile Electrodes in ECG Measurement. In Proceedings of the 3rd International Conference on Intelligent Sensors, Sensor Networks and Information, Melbourne, Australia, 3–6 December 2007; pp. 635–639. [Google Scholar]
- Morley, A.; Davenport, J.J.; Hickey, M.; Phillips, J.P. Development and optimization of a miniaturized fiber-optic photoplethysmographic sensor. Opt. Eng. 2017, 56, 117111. [Google Scholar] [CrossRef]
- Hickey, M.; Samuels, N.; Randive, N.; Langford, R.; Kyriacou, P.A. A new fibre optic pulse oximeter probe for monitoring splanchnic organ arterial blood oxygen saturation. Comput. Methods Program. Biomed. 2012, 108, 883–888. [Google Scholar] [CrossRef] [PubMed]
- Pietryga, J.; Fonder, M.; Rogg, J.; North, D.; Bercovitch, L. Invisible metallic microfiber in clothing presents unrecognized MRI risk for cutaneous burn. Am. J. Neuroradiol. 2013, 34, E47–E50. [Google Scholar] [CrossRef] [PubMed]
- Scanaill, C.N.; Carew, S.; Barralon, P.; Noury, N.; Lyons, D.; Lyons, G.M. A review of approaches to mobility telemonitoring of the elderly in their living environment. Ann. Biomed. Eng. 2006, 34, 547–563. [Google Scholar] [CrossRef] [PubMed]
- Selm, B.; Gürel, E.A.; Rothmaier, M.; Rossi, R.M.; Scherer, L.J. Polymeric optical fiber fabrics for illumination and sensorial applications in textiles. J. Intell. Mater. Syst. Struct. 2010, 21, 1061–1071. [Google Scholar] [CrossRef]
- Krehel, M.; Wolf, M.; Boesel, L.F.; Rossi, R.M.; Bona, G.-L.; Scherer, L.J. Development of a luminous textile for reflective pulse oximetry measurements. Biomed. Opt. Express 2014, 5, 2537–2547. [Google Scholar] [CrossRef] [PubMed]
- Post, E.R.; Orth, M.; Russo, P.; Gershenfeld, N. E-broidery: Design and fabrication of textile-based computing. IBM Syst. J. 2000, 39, 840–860. [Google Scholar] [CrossRef]
- Teng, X.; Zhang, Y.-T. The effect of contacting force on photoplethysmographic signals. Physiol. Meas. 2004, 25, 1323. [Google Scholar] [CrossRef] [PubMed]
- Kong, L.; Zhao, Y.; Dong, L.; Jian, Y.; Jin, X.; Li, B.; Feng, Y.; Liu, M.; Liu, X.; Wu, H. Non-contact detection of oxygen saturation based on visible light imaging device using ambient light. Opt. Express 2013, 21, 17464–17471. [Google Scholar] [CrossRef] [PubMed]
- Dresher, R.; Mendelson, Y. Attachment of a Wearable Skin Reflectance Pulse Oximeter. In Proceedings of the 2005 BMES Annual Fall Meeting, Baltimore, MD, USA, 28 September 2005. [Google Scholar]
- Gardosi, J.O.; Damianou, D.; Schram, C.M. Artifacts in fetal pulse oximetry: Incomplete sensor-to-skin contact. Am. J. Obs. Gynecol. 1994, 170, 1169–1173. [Google Scholar] [CrossRef]
- Dassel, A.; Graaff, R.; Sikkema, M.; Meijer, A.; Zijlstra, W.; Aarnoudse, J. Reflectance pulse oximetry at the forehead improves by pressure on the probe. J. Clin. Monit. 1995, 11, 237–244. [Google Scholar] [CrossRef] [PubMed]
- Zhang, J.; Korposh, S.; Correia, R.; Zhang, Y. FBG Contact Pressure Sensitivity Enhancement Technology. In Proceedings of the 19th International Conference on Transparent Optical Networks (ICTON), Girona, Spain, 2–6 July 2017; pp. 1–4. [Google Scholar]
- Correia, R.; Blackman, O.R.; Hernandez, F.U.; Korposh, S.; Morgan, S.P.; Hayes-Gill, B.R.; James, S.W.; Evans, D.; Norris, A. Highly sensitive contact pressure measurements using FBG patch in endotracheal tube cuff. Proc. SPIE 2016, 9916, 99161F. [Google Scholar] [Green Version]
- Davenport, J.J.; Hickey, M.; Phillips, J.P.; Kyriacou, P. Method for producing angled optical fiber tips in the laboratory. Opt. Eng. 2016, 55, 026120. [Google Scholar] [CrossRef] [Green Version]
- Phillips, J.P.; Langford, R.M.; Chang, S.H.; Kyriacou, P.A.; Jones, D.P. Photoplethysmographic measurements from the esophagus using a new fiber-optic reflectance sensor. J. Biomed. Opt. 2011, 16, 077005. [Google Scholar] [CrossRef] [PubMed]
- Suzuki, A.; Wakazono, Y.; Suzuki, S.; Tamura, M.; Masuda, H.; Ishikawa, T.; Hashimoto, Y.; Suzuki, T.; Kikuchi, K.; Nakagawa, H.; et al. High optical coupling efficiency using 45°-ended fibre for low-height and low-cost optical interconnect modules. Electron. Lett. 2008, 44, 724–725. [Google Scholar] [CrossRef]
- Ram, M.R.; Madhav, K.V.; Krishna, E.H.; Komalla, N.R.; Reddy, K.A. A novel approach for motion artifact reduction in PPG signals based on AS-LMS adaptive filter. IEEE Trans. Instrum. Meas. 2012, 61, 1445–1457. [Google Scholar] [CrossRef]
- Colquhoun, D.A.; Forkin, K.T.; Durieux, M.E.; Thiele, R.H. Ability of the Masimo pulse CO-Oximeter to detect changes in hemoglobin. J. Clin. Monit. Comput. 2012, 26, 69–73. [Google Scholar] [CrossRef] [PubMed]
- Elgendi, M. Optimal Signal Quality Index for Photoplethysmogram Signals. Bioengineering 2016, 3, 21. [Google Scholar] [CrossRef] [PubMed]
- Krishnan, R.; Natarajan, B.; Warren, S. Two-stage approach for detection and reduction of motion artifacts in photoplethysmographic data. IEEE Trans. Biomed. Eng. 2010, 57, 1867–1876. [Google Scholar] [CrossRef] [PubMed]
- He, D.; Morgan, S.P.; Trachanis, D.; Hese, J.V.; Drogoudis, D.; Fummi, F.; Stefanni, F.; Guarnieri, V.; Hayes-Gill, B.R. A single-chip CMOS pulse oximeter with on-chip lock-in detection. Sensors 2015, 15, 17076–17088. [Google Scholar] [CrossRef] [PubMed]
- Tamura, T.; Chen, W. Seamless Healthcare Monitoring: Advancements in Wearable, Attachable, and Invisible Devices; Springer: Berlin, Germany, 2017. [Google Scholar]
- Tamura, T.; Maeda, Y.; Sekine, M.; Yoshida, M. Wearable photoplethysmographic sensors—Past and present. Electronics 2014, 3, 282–302. [Google Scholar] [CrossRef]
- Dresher, R.P.; Mendelson, Y. Reflectance Forehead Pulse Oximetry: Effects of Contact Pressure During Walking. In Proceedings of the International Conference of the IEEE Engineering in Medicine and Biology Society, New York, NY, USA, 30 August–3 September 2006; pp. 3529–3532. [Google Scholar]
Figure 1.
(a) Plan view of the probe. Red and orange frames represent transmit POFs connected to two LEDs (660 nm and 850 nm). The yellow frame represents the receiver POF connected to the photo-diode. (b) Side view of the probe. The probe consists of two epoxy rectangular patches which are connected using epoxy resin. The top patch is the pulse oximeter whilst the bottom is the FBG pressure sensor. Two FBGs are fabricated in the core of the silica fibre which are connected to the FBG interrogator (see Section 2.2). The brown line represents the skin surface where the POFs are located.

Figure 2.
Opto-electronics system for the designed sensor. Light sources are two different wavelength Thorlabs fibre-coupled LEDs (660 nm and 850 nm). The photodetector is a Thorlabs PDA36AEC. The data-acquisition system is a National Instruments myDAQ at 16 bits and 20 kHz sampling frequency. The FBG interrogator is a Smart Fibres SmartScan FBG interrogator with 0.8 pm resolution. (I/V—current to voltage converter, DAC—digital-to-analogue converter, ADC—analogue-to-digital converter and PC—personal computer).

Figure 3.
Set up for loading pressure.

Figure 4.
The patch beneath the index finger is the designed epoxy probe. The commercial sensor is taped on the middle finger. Two thermocouples are used to measure the environment and the index finger temperatures.
Figure 4.
The patch beneath the index finger is the designed epoxy probe. The commercial sensor is taped on the middle finger. Two thermocouples are used to measure the environment and the index finger temperatures.

Figure 5.
Comparison of optical fibre sensor with commercial pulse oximeter (a) During normal breathing both devices record stable values with the absolute error 0.443 ± 0.466%. (b) SpO2 test result with a desaturation event. Phase 1: Breathe normally (80 s). Phase 2: Breathe out (14 s). Phase 3: Hold breath (19 s). Phase 4: Breathe normally (66 s). Both devices identify the desaturation event with the absolute error 1.16 ± 0.423% across the trace.

Figure 6.
Step pressure increasing/decreasing experiment. (a) Increase the pressure step by step until 25 kPa. Then, the pressure decreased step by step to 0 kPa. This process was repeated three times. (b) Resulting FBG peak wavelength shift versus loaded pressures from Figure 6a demonstrating a linear relationship, repeatable results and low hysteresis.

Figure 7.
(a) Infrared PPG signals (red) under different contact pressures (blue). (b) Absolute SPO2 error (red) compared to an unloaded commercial device (c) skewness index of infrared PPG (red) (d) Perfusion index of infrared PPG (red).
Figure 7.
(a) Infrared PPG signals (red) under different contact pressures (blue). (b) Absolute SPO2 error (red) compared to an unloaded commercial device (c) skewness index of infrared PPG (red) (d) Perfusion index of infrared PPG (red).

Figure 8.
Effect of contact pressure on SpO2 error between optical fibre sensor and a commercial pulse oximeter. When the contact pressure is higher than 25 kPa, the SpO2 error is >10%. When the contact pressure is lower than 15 kPa, the SpO2 error is lower than 2%. The SpO2 error reached the lowest value while the contact pressure is in the range from 5 to 15 kPa.

© 2018 by the authors. Licensee MDPI, Basel, Switzerland. This article is an open access article distributed under the terms and conditions of the Creative Commons Attribution (CC BY) license (http://creativecommons.org/licenses/by/4.0/).
Share and Cite
MDPI and ACS Style
Liu, C.; Correia, R.; Ballaji, H.K.; Korposh, S.; Hayes-Gill, B.R.; Morgan, S.P. Optical Fibre-Based Pulse Oximetry Sensor with Contact Force Detection. Sensors 2018, 18, 3632. https://doi.org/10.3390/s18113632
AMA Style
Liu C, Correia R, Ballaji HK, Korposh S, Hayes-Gill BR, Morgan SP. Optical Fibre-Based Pulse Oximetry Sensor with Contact Force Detection. Sensors. 2018; 18(11):3632. https://doi.org/10.3390/s18113632
Chicago/Turabian StyleLiu, Chong, Ricardo Correia, Hattan Khaled Ballaji, Serhiy Korposh, Barrie R. Hayes-Gill, and Stephen P. Morgan. 2018. "Optical Fibre-Based Pulse Oximetry Sensor with Contact Force Detection" Sensors 18, no. 11: 3632. https://doi.org/10.3390/s18113632
Note that from the first issue of 2016, this journal uses article numbers instead of page numbers. See further details here.