Article

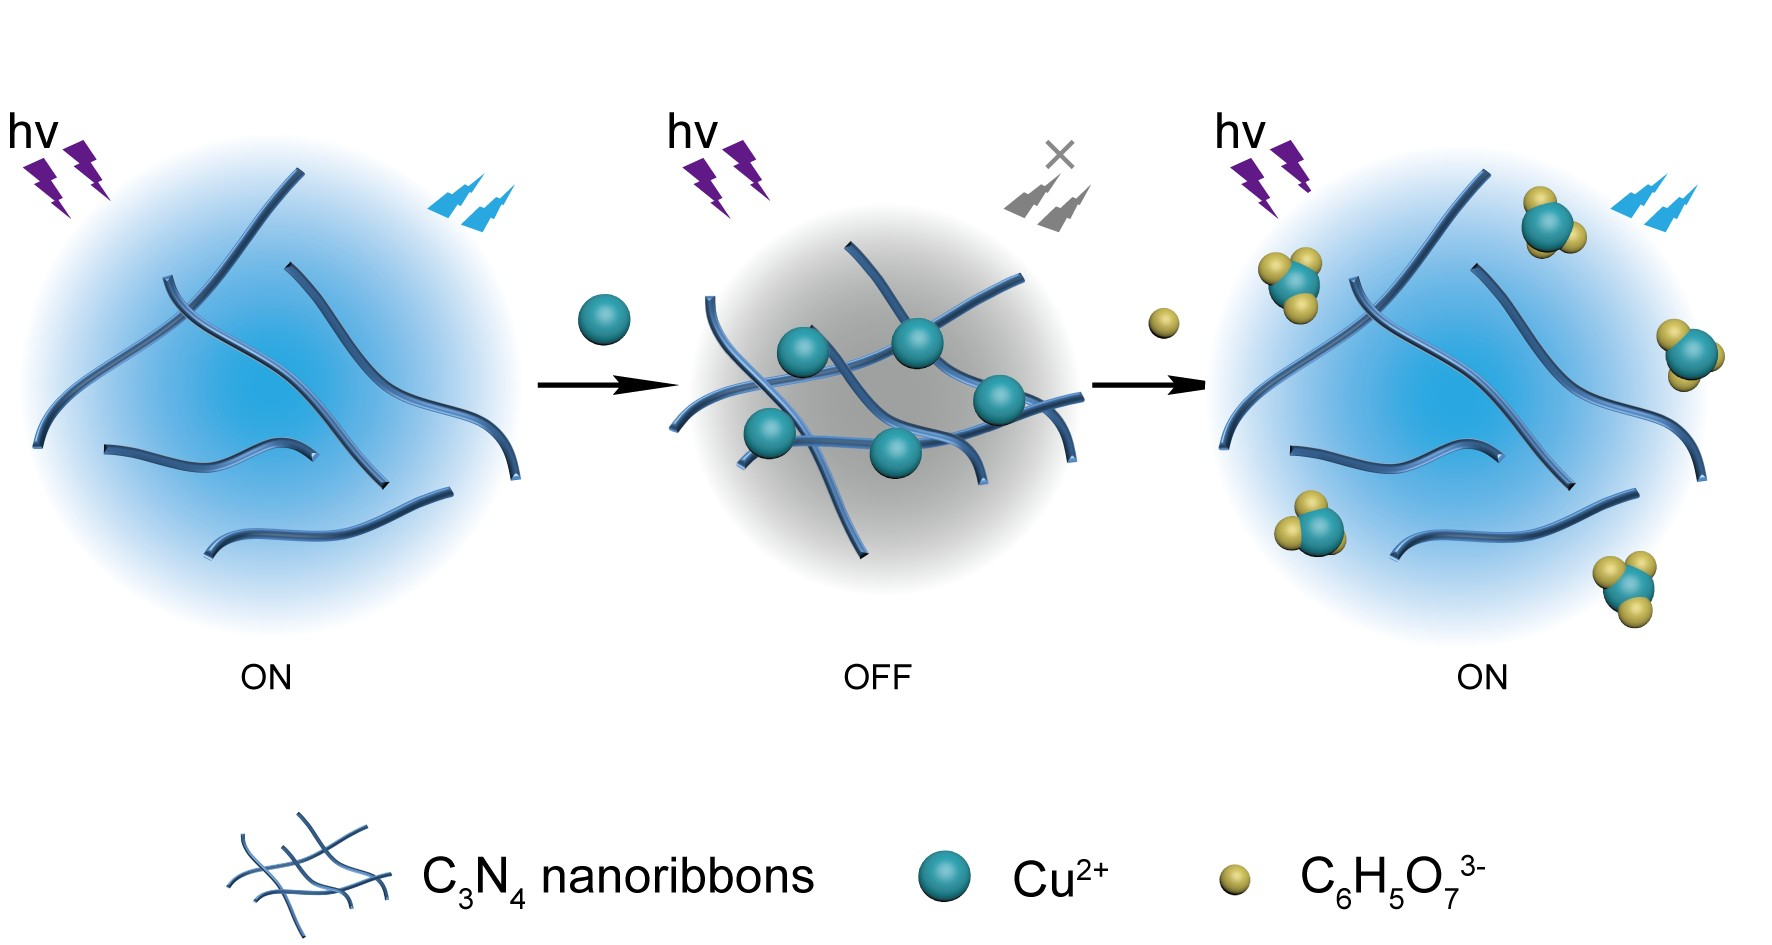
A Novel “Off-On” Fluorescent Probe Based on Carbon Nitride Nanoribbons for the Detection of Citrate Anion and Live Cell Imaging

1
Key Laboratory for Organic Electronics & Information Displays (KLOEID) and Jiangsu Key Laboratory for Biosensors, Institute of Advanced Materials (IAM), Nanjing University of Posts and Telecommunications, 9 Wenyuan Road, Nanjing 210023, China
2
College of Geography and Biological Information, Nanjing University of Posts and Telecommunications, 9 Wenyuan Road, Nanjing 210023, China
*
Author to whom correspondence should be addressed.
Sensors 2018, 18(4), 1163; https://doi.org/10.3390/s18041163
Submission received: 9 March 2018 / Revised: 30 March 2018 / Accepted: 6 April 2018 / Published: 11 April 2018
(This article belongs to the Section Chemical Sensors)

Abstract

:
A novel fluorescent “off-on” probe based on carbon nitride (C3N4) nanoribbons was developed for citrate anion (C6H5O73−) detection. The fluorescence of C3N4 nanoribbons can be quenched by Cu2+ and then recovered by the addition of C6H5O73−, because the chelation between C6H5O73− and Cu2+ blocks the electron transfer between Cu2+ and C3N4 nanoribbons. The turn-on fluorescent sensor using this fluorescent “off-on” probe can detect C6H5O73− rapidly and selectively, showing a wide detection linear range (1~400 μM) and a low detection limit (0.78 μM) in aqueous solutions. Importantly, this C3N4 nanoribbon-based “off-on” probe exhibits good biocompatibility and can be used as fluorescent visualizer for exogenous C6H5O73− in HeLa cells.

Graphical Abstract

1. Introduction

Citrate is a critical metabolite that is involved in various biological systems, such as mitochondrial energy generation, cytosolic biomacromolecular synthesis, inflammatory response, blood coagulation, and the regulation of the size of apatite crystals in bone [1,2,3,4,5]. Citrate deficiency is the main reason for kidney dysfunction such as nephrocalcinosis and nephrolithiasis [6]. Recent medical research has shown that the tracking of citrate levels has become an effective method for the identification of prostate cancer [2,7]. Therefore, monitoring citrate content is of great importance in biomedical and analytical sciences. To date, many analytical methods have been used for citrate detection including electrochemistry [8], capillary electrophoresis [9], polarography [10], gas or liquid chromatography [11,12], UV-vis spectrophotometry [6,13], and spectrofluorimetry [14,15]. The spectrofluorimetry method has attracted great attention owing to its easy operation, high sensitivity, and lower equipment requirements [6,13,16].
Carbon nitride (C3N4) is a metal-free polymeric semi-conductor with a narrow bandgap of about 2.7 eV. Due to its special photoluminescence (PL), facile synthesis, and good biocompatibility [17,18], C3N4 has been applied for environmental decontamination, artificial photosynthesis, biotherapy, bioimaging, and sensors [17,18,19,20,21,22,23,24]. So far, some fluorescent sensing platforms based on C3N4 have been designed for the detection of various ions and molecules, including Cu2+, Fe3+, Ag+, acetylthiocholine, biothiols, and cyanide [18,23,25,26]. However, to the best of our knowledge, there is no report of fluorescent sensors based on C3N4 nanoribbons for citrate anion detection.
In this work, blue fluorescent C3N4 nanoribbons were prepared by alkali-catalyzed hydrolysis from bulk C3N4 [27]. Furthermore, we demonstrated that the obtained C3N4 nanoribbons can serve as a novel “off-on” fluorescent probe for the detection of citrate anion (C6H5O73−) with excellent sensitivity and selectivity based on fluorescence quenching by Cu2+ through a photoinduced electron transfer [28,29] and fluorescence recovery by the addition of C6H5O73−. We hypothesized that the interaction of Cu2+ and C3N4 nanoribbons is inhibited by the strong chelation between Cu2+ and C6H5O73− [30,31,32]. This is the first time that C3N4 nanoribbons have been applied for C6H5O73− detection. Importantly, the turn-on fluorescent sensor using this fluorescent “off-on” probe exhibits low cytotoxicity and can be applied for C6H5O73− detection in living cells. Scheme 1 illustrates the sensing principle of the C3N4 nanoribbon-based fluorescent sensor.

2. Materials and Methods

2.1. Materials and Reagents

Dulbecco’s modified Eagle’s medium (DMEM), fetal bovine serum, and 3-(4,5-dimethyl-thiazol-2-yl)-2,5-diphenyltetrazolium bromide (MTT) were purchased from Hyclone. HeLa cells were supplied by KeyGen Biotech Co., Ltd. (Nanjing, China). All inorganic salts were of analytical grade and obtained from Aladdin reagent (Shanghai, China). Formic acid, sodium acetate, and propionic acid were purchased from Sinopharm Chemical Reagent Co., Ltd. (Beijing, China). Ultrapure water (Milli-Q system, Millipore Corp., Billerica, MA, USA) was used throughout this study.

2.2. Characterization

UV–vis spectroscopy measurements were performed on a Shimadzu UV-3600 spectrophotometer. Fluorescence spectra were recorded on an RF-5301PC spectrofluorophotometer. The Fourier transform infrared (FTIR) spectrum of C3N4 nanoribbons was measured on a Nexus 870 FTIR spectrometer. A JEOL 2010 transmission electron microscope (TEM) was used for the characterization of C3N4 nanoribbons. The X-ray diffraction (XRD) pattern of C3N4 nanoribbons was recorded on an X-ray powder diffractometer with graphite monochromatized Cu Kα radiation (D8 Advance; Bruker, Karlsruhe, Germany). The X-ray photoelectron spectroscopy (XPS) investigation was carried out on PHI 5000 VersaProbe system with Al cathode as the X-ray source. The C3N4 nanoribbons was dropped on silicon slices for XPS characterization. Dynamic light scattering (DLS) and zeta potential measurements were conducted on a zeta potential analyzer (Zeta PALS, Brookhaven Instruments Corp., Brookhaven, NY, USA). Cell fluorescent images were recorded by confocal laser scanning microscopy (Olympus FV1000, Tokyo, Japan).

2.3. Preparation of C3N4 Nanoribbons

The bulk C3N4 was prepared by the calcination of melamine at 600 °C (5.0 °C min−1) for 4 h under an Ar atmosphere [33]. The C3N4 nanoribbons were prepared via the alkali-catalyzed hydrolysis of bulk C3N4 [27]. In brief, 10 mg of bulk C3N4 was dispersed in 10 mL of sodium hydroxide solution (8.0 M) and sonicated for 2 h at 60 °C. After cooling to room temperature, this solution was centrifuged and washed five times with ultrapure water. The product was collected and dialyzed (the molecular weight cutoff of the dialysis bag was 1000 kDa) for further experiments.

2.4. Synthesis of Cu2+-C3N4 Nanoribbon Complex

One hundred microliters of CuCl2 (10 mM) was added to 9.9 mL of C3N4 nanoribbons aqueous solution (1 mg mL−1). Then, the mixture was stirred for 10 min at room temperature. After that, the mixture was centrifuged and washed with ultrapure water to remove excessive copper ions. Finally, the obtained precipitate was dispersed in ultrapure water to obtain a Cu2+-C3N4 nanoribbon solution.

2.5. Fluorescent Detection of C6H5O73−

Forty microliters of Cu2+-C3N4 nanoribbon complex (C3N4: 1 mg mL−1) was added to 960 μL ultrapure water, and then C6H5O73− solution with various concentrations was added to the Cu2+-C3N4 nanoribbon complex. After standing for 20 s, the fluorescence spectra were monitored at the excitation of 360 nm.

2.6. Selectivity of Cu2+-C3N4 Nanoribbon-Based Probe for C6H5O73− Detection

To explore the possible interference of other anions, formic acid, sodium acetate, propionic acid and the following anionic sodium/potassium salts were used in this study: 1 mM anion solutions, including Br, C6H5O73−, Cl, CN, F, H2PO4, HCO3, I, NO3, OH, CH3COO, and SO42− were added to the solution of the Cu2+-C3N4 nanoribbon complex, respectively. After thoroughly mixing and standing for 20 s, the fluorescence measurements were carried out to investigate the selectivity of the proposed fluorescent sensor.

2.7. Cell Imaging and Cytotoxicity Assay

Human cervical cancer (HeLa) cells used in this study were cultured at 37 °C in a 5% CO2 incubator in DMEM medium, which contains fetal bovine serum (10%), streptomycin (100 mg mL−1), and penicillin (100 U mL−1). When the cells had grown to 80% confluency, the cells were digested with trypsin, collected and seeded in a confocal dish, and cultured overnight. Then the cells were pretreated with C6H5O7Na3 (1 mM). After 12 h incubation, the cells were gently washed with phosphate-buffered saline (PBS) solution (10 mM, pH = 7.4) and treated with Cu2+-C3N4 nanoribbon complex for another 4 h. Finally, the resulting cells were washed with PBS solution (10 mM, pH = 7.4) and then fluorescence images were taken on a confocal microscope under UV excitation.
For cytotoxicity assay, 100 μL of cells suspension (105 cells mL−1) was seeded to each well of 96-well plates. Then the medium was replaced by different concentrations of C3N4 nanoribbons or Cu2+-C3N4 nanoribbon complex and culture for 24 h. Following this, the cells were washed with PBS solution. After that, the standard MTT assay was carried out for the determination of cell viabilities relative to the untreated cells.

3. Results and Discussion

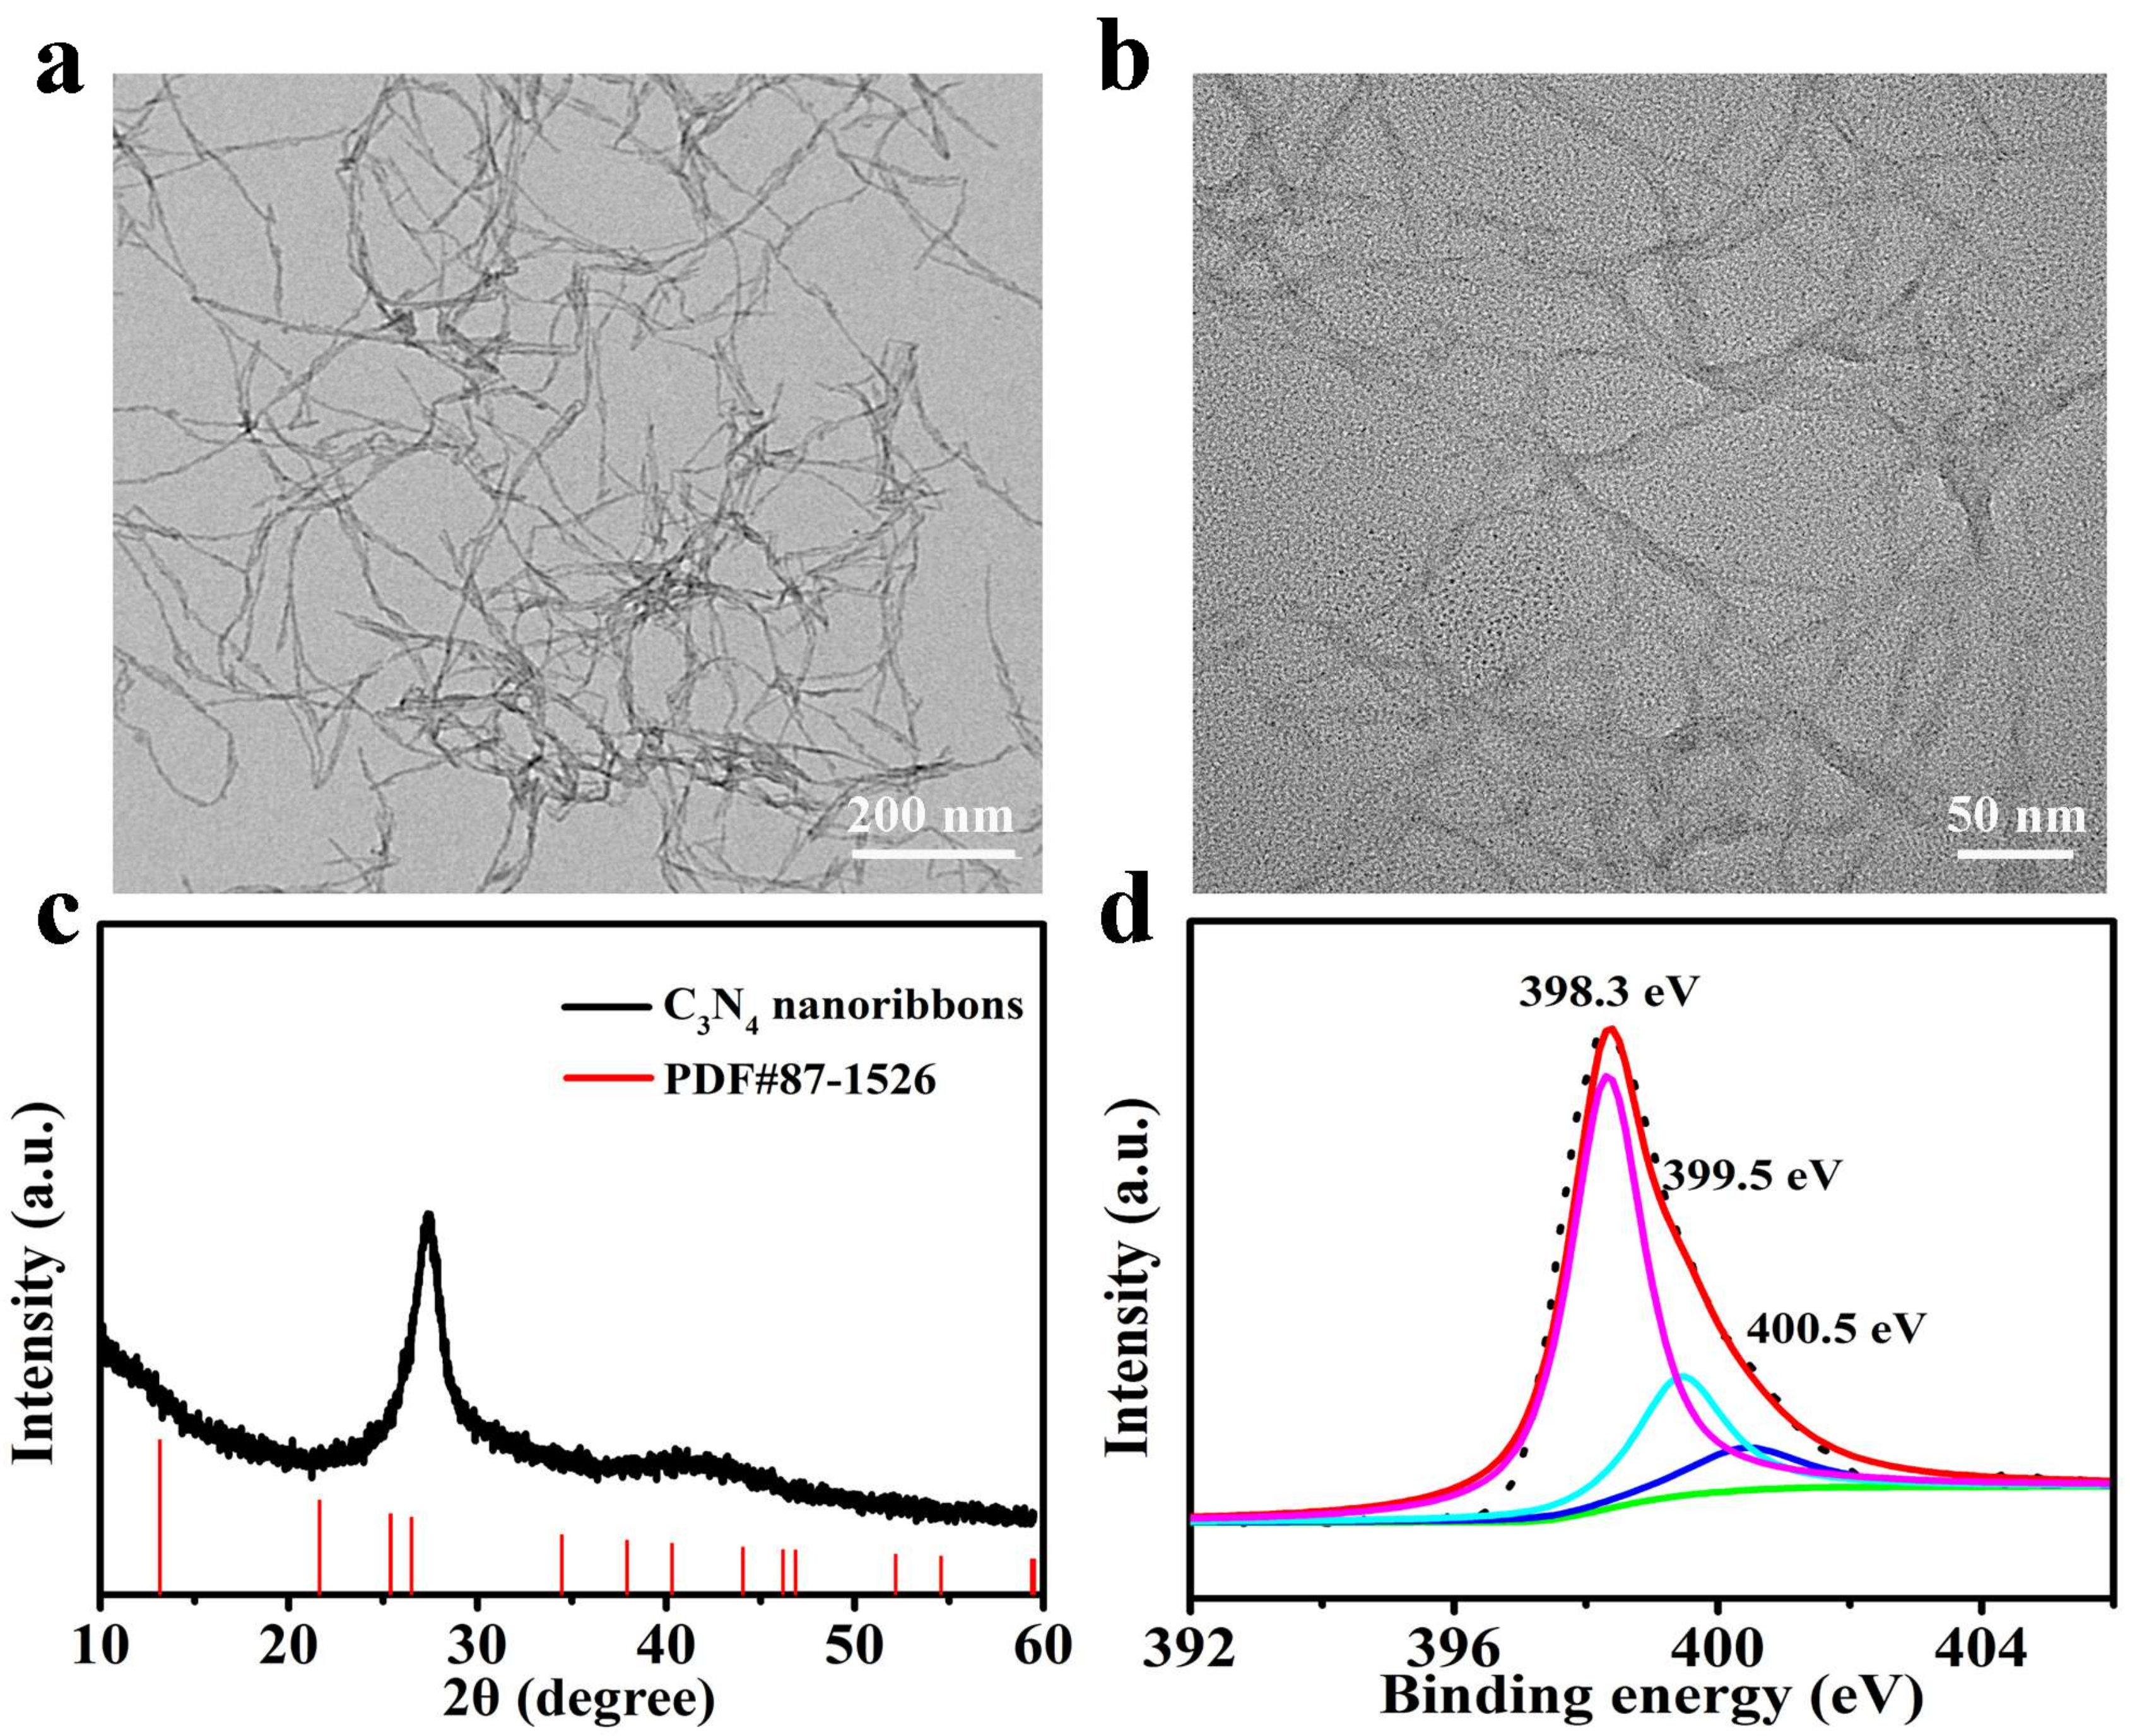
3.1. Characterization of C3N4 Nanoribbons

The C3N4 nanoribbons were prepared by ultrasonic exfoliation of bulk C3N4 in an alkaline solution. The related characterizations of bulk C3N4 are shown in Figure S1. TEM images display the morphology and size distribution of the C3N4 nanoribbons. As shown Figure 1a, C3N4 nanoribbons present an average diameter of approximately 5 nm and a length of up to 200 nm. High-resolution transmission electron microscopy (HRTEM) image clearly shows that single and few-layer C3N4 nanoribbons were obtained (Figure 1b). The XRD pattern of C3N4 nanoribbons (Figure 1c) showed a broad distinct diffraction peak at 27.2°, which can be ascribed to the strong π-conjugated layers characteristic (002) of C3N4 [17,34].
The composition and structure of C3N4 nanoribbons were confirmed by XPS and FTIR measurements. The XPS survey spectrum of C3N4 nanoribbons (Figure S2) displays binding energies of C (283 eV) and N (397 eV). The C 1s XPS spectrum of C3N4 nanoribbons (Figure S3) can be fitted into three peaks centering at 284.6, 285.4, and 287.8 eV, which can be attributed to C-C, sp2C=N, and sp3C-N of C3N4, respectively [35,36,37,38,39]. The XPS spectrum of the N 1s spectrum (Figure 1d) can be fitted into three different peaks at 398.3, 399.5, and 400.5 eV, being assigned to C=N-C, (N-(C)3), and -NH2, respectively [36,40]. The FTIR spectrum of C3N4 nanoribbons is presented in Figure S4. The broad peaks at 3330 and 3182 cm−1 are ascribed to the stretching vibrations of NH2 and N-H groups, respectively [39]. The peaks centered at 1637, 1577, 1420, 1334, and 1284 cm−1 indicated the typical stretching modes of CN heterocycles [41,42,43]. Beside the peaks mentioned above, the peak at 810 cm−1 indicated the vibration of the s-triazine ring [34,44].
The photophysical properties of C3N4 nanoribbons were investigated by UV-vis and PL spectra (Figure 2a). The prepared C3N4 nanoribbons present two strong absorption peaks at 216 and 278 nm. Meanwhile, a fluorescent emission at 415 nm can be seen from fluorescence spectrum at the excitation of 360 nm (Figure 2a). The PL intensity of C3N4 nanoribbons increases dramatically with the increasing pH of solution ranging from 9 to 12, and displays slight changes under acid conditions (Figure S5).

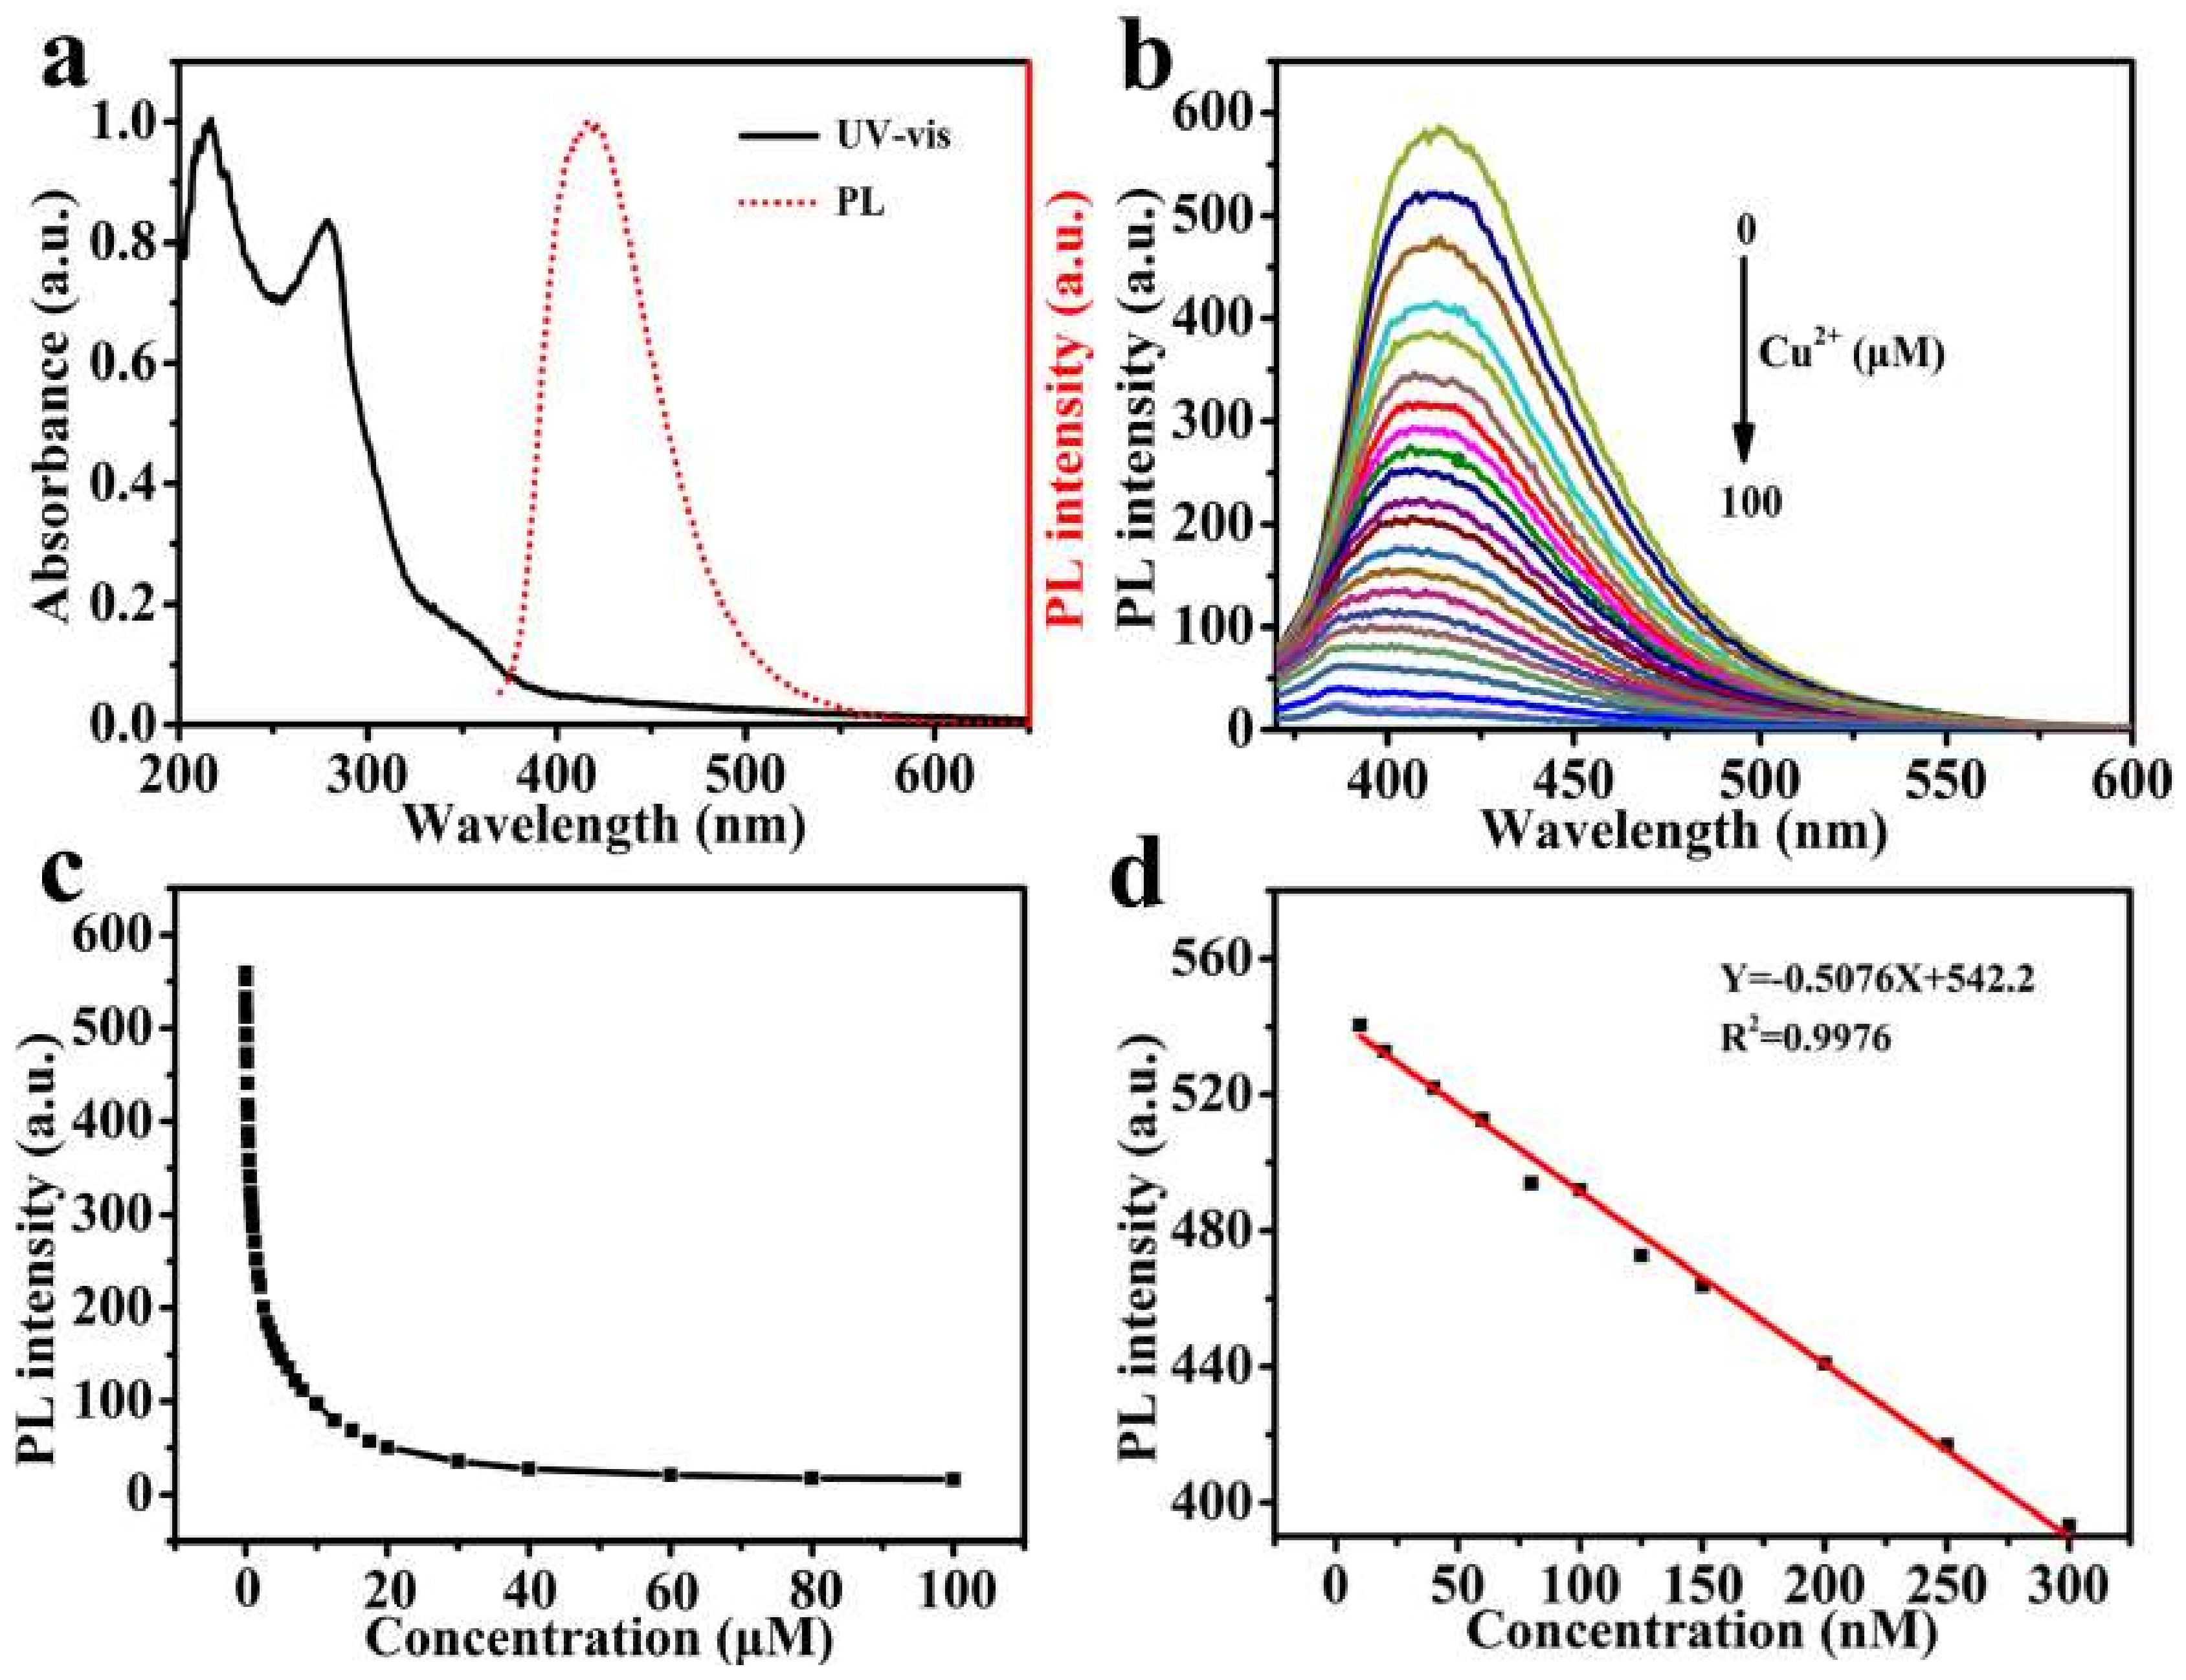
3.2. The Influence of Metal Ions on the Fluorescence of C3N4 Nanoribbons

A previous study indicated that Cu2+, Fe3+, and Ag+ can quench the fluorescence of C3N4 due to the photoinduced electron transfer from C3N4 to metal ions [23,25,45]. In this experiment, the fluorescent responses of C3N4 nanoribbons towards different metal ions were investigated. As shown in Figure S6, C3N4 nanoribbons display a slight change of the PL intensity in the presence of Al3+, Ba2+, K+, Li+, Mg2+, Na+, Pb2+, Sn2+, and Zn2+ (100 μM). However, the PL intensity of C3N4 nanoribbons dramatically decreases with the addition of Cu2+, Ag+, Fe3+, Co2+, Mn2+, and Ni2+, especially for Cu2+ and Ag+. Cu2+ was chosen as the quencher in this work [36]. A decrease of PL intensity of C3N4 nanoribbons is observed as the concentration of Cu2+ increases (Figure 2b,c), and it is almost completely quenched after the addition of 40 μM Cu2+. Figure 2d shows that the PL intensity of C3N4 at 415 nm versus the concentrations of Cu2+ exhibits a linear relationship ranging from 10 to 300 nM (R2 = 0.9976).

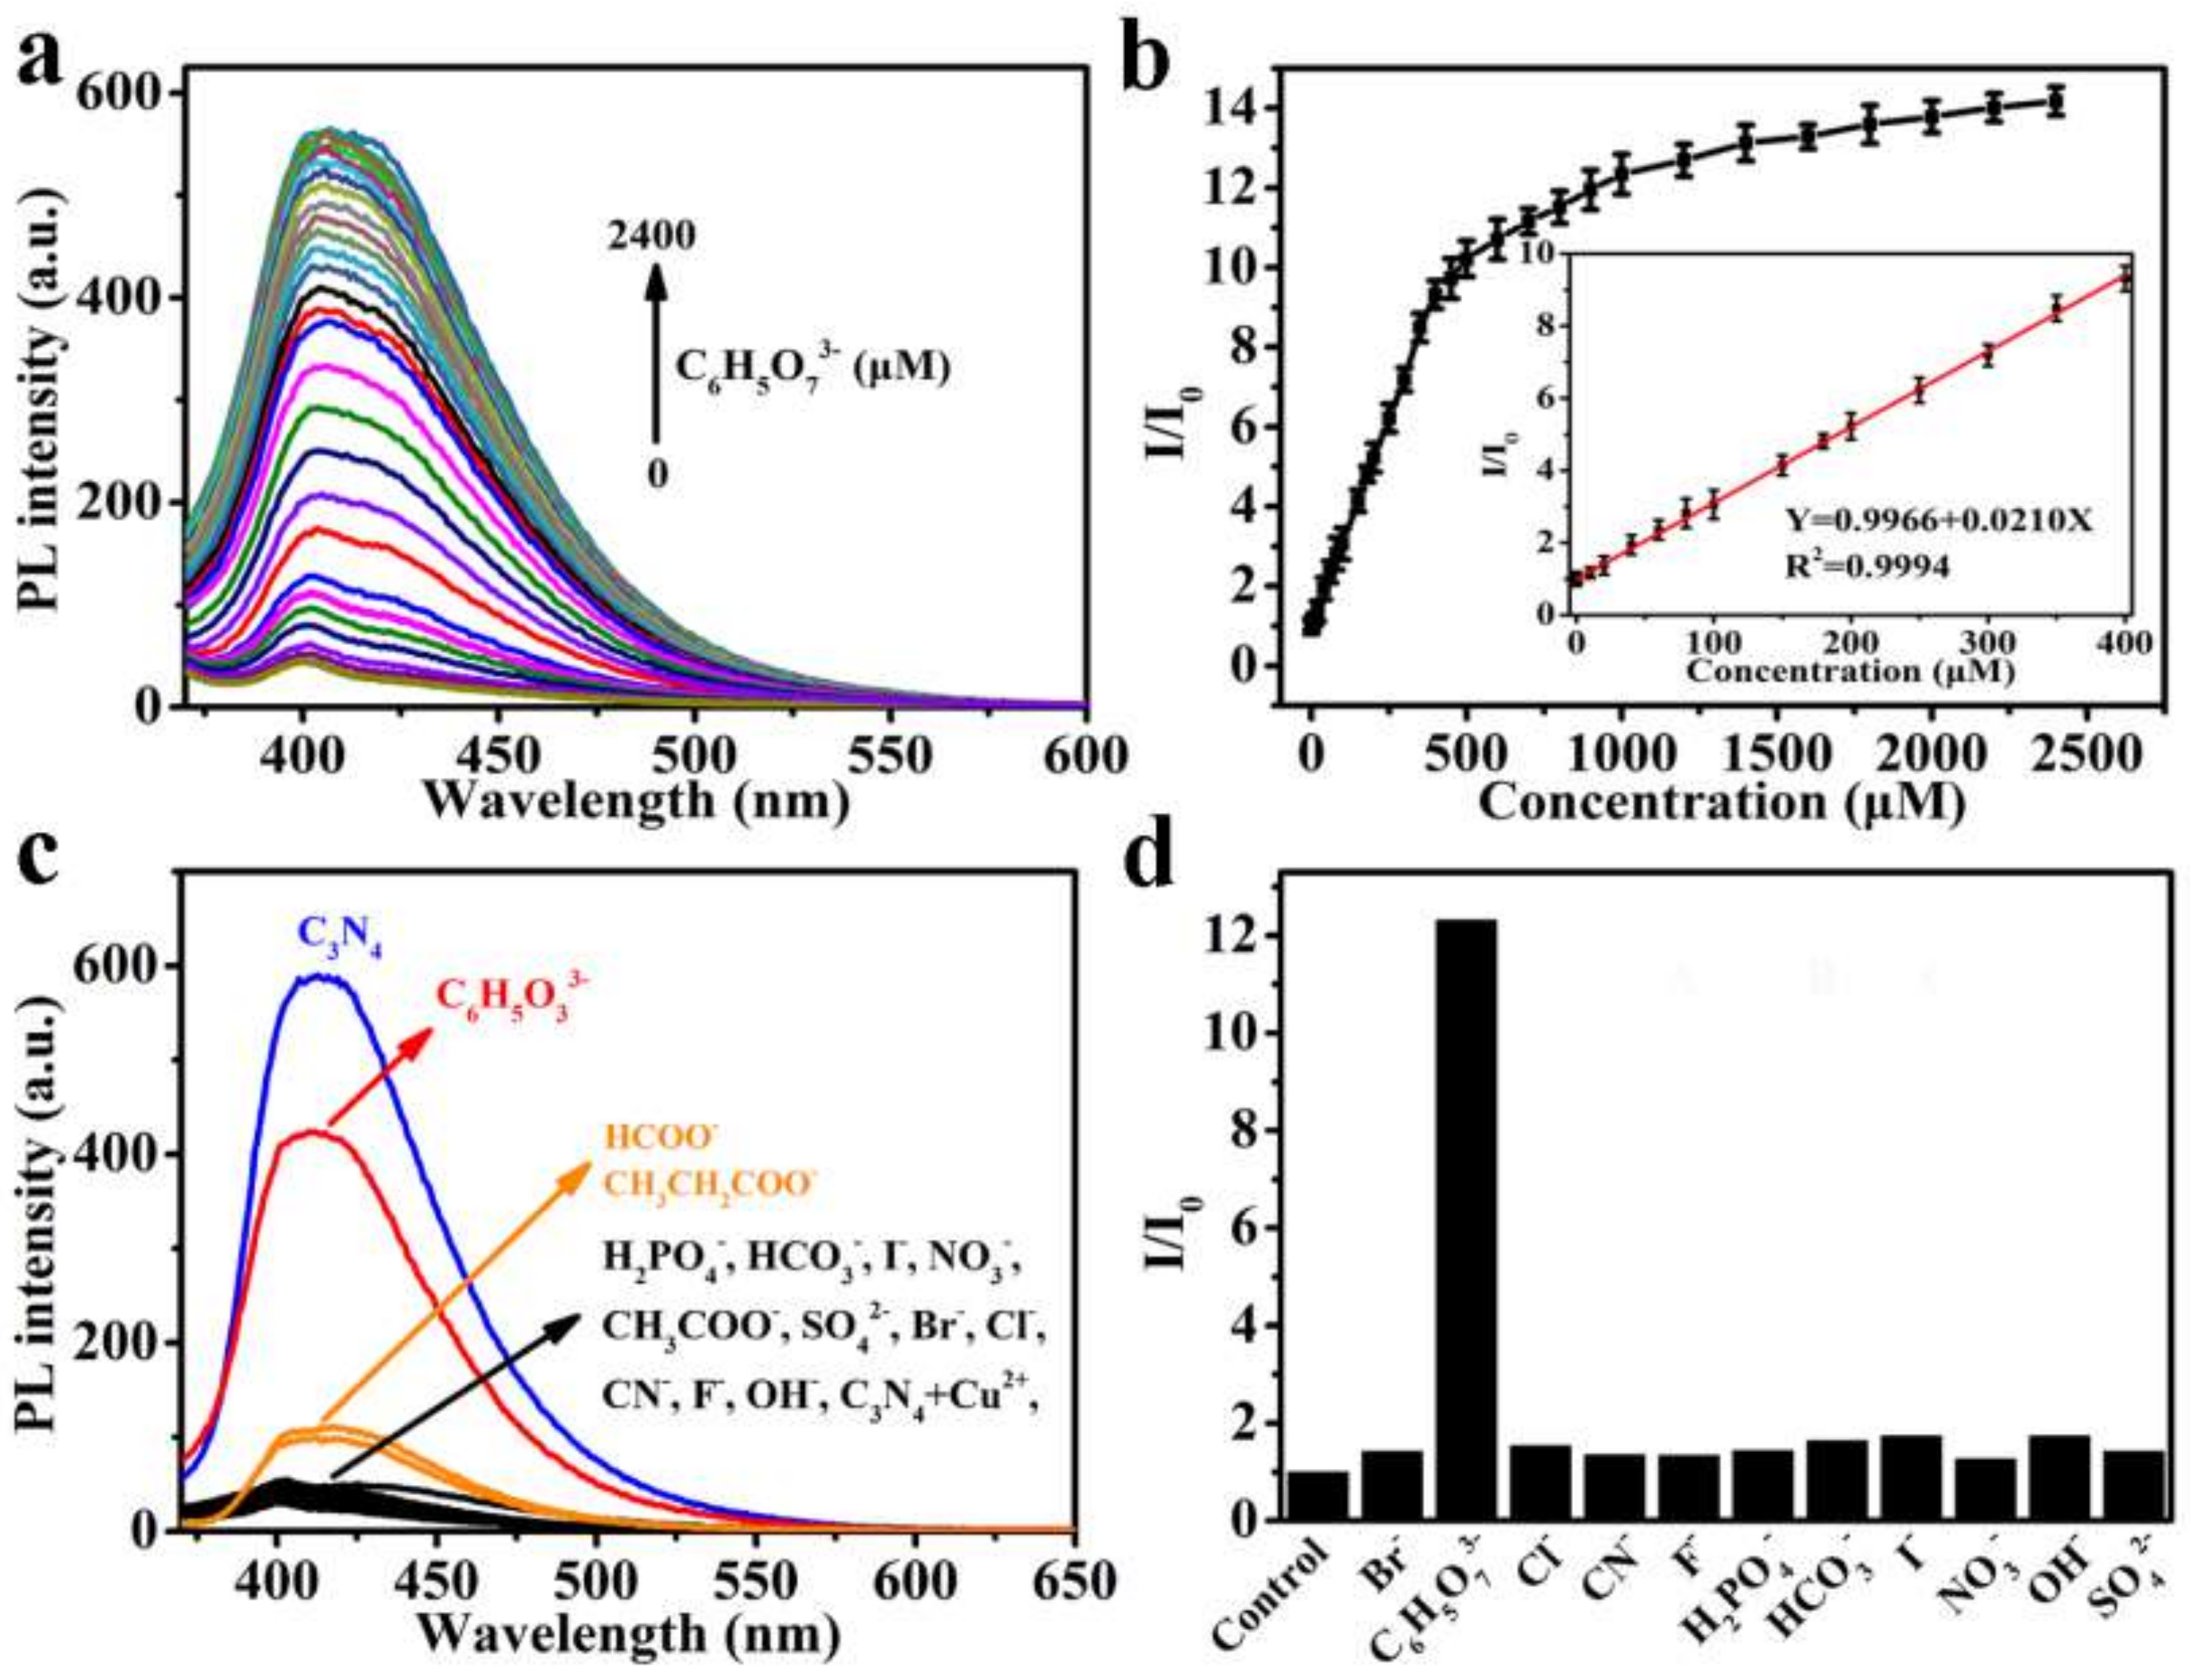
3.3. Sensitivity and Selectivity of the Fluorescent “Off-On” Probe Based on C3N4 Nanoribbons for C6H5O73− Detection

The influence of incubation time on the fluorescence recovery of C3N4 nanoribbons was measured. As Figure S7 displayed, the PL intensity of Cu2+-C3N4 nanoribbon complex increases rapidly with the time after the addition of C6H5O73−, and maintains a plateau after 20 s. Therefore, an incubation time of 20 s was selected for subsequent experiments.
As is well known, sensitivity is a critical parameter to assess the sensing performance [46,47]. The sensitivity of the fluorescent sensor using the C3N4 nanoribbon-based “off-on” probe was evaluated. The PL intensity of the Cu2+-C3N4 nanoribbon complex with different concentrations of C6H5O73− was recorded. As illustrated in Figure 3a,b, the PL intensity of the Cu2+-C3N4 nanoribbon complex was obviously recovered as the concentration of C6H5O73− increased. The PL intensity of the Cu2+-C3N4 nanoribbon complex was completely recovered with the addition of C6H5O73− (2.25 mM). The fluorescent sensor using the C3N4 nanoribbon-based “off-on” probe shows a linear range from 1 to 400 μM and the calculated detection limit is 0.78 μM (S/N = 3) (inset in Figure 3b). Compared with previously reported fluorescent probes, such as coumarin [6], rhodamine [13], diketoprrrolopyrrole [15], TPIOP-boronate [48], and CdTe quantum dots [14], the fluorescent sensor using the C3N4 nanoribbon-based “off-on” probe exhibits better sensing performance for C6H5O73− detection with a broader linear range and faster response time (Table S1) [6,14,15,49].
To investigate the selectivity of the Cu2+-C3N4 nanoribbon-based probe towards C6H5O73−, the fluorescence responses of the Cu2+-C3N4 nanoribbon complex towards other anions (Br, Cl, CN, F, H2PO4, HCO3, I, NO3, OH, and SO42−) was measured. As shown in Figure 3c,d, most of the tested anions almost do not affect the PL intensity of the Cu2+-C3N4 nanoribbon complex, while C6H5O73− can recover the fluorescence of C3N4 nanoribbons effectively. Moreover, formic acid, sodium acetate, and propionic acid were also applied for the selectivity analysis of the proposed detection method (Figure S8), showing that the fluorescence presented the highest recovery in the presence of C6H5O73−. Furthermore, the PL responses of the Cu2+-C3N4 nanoribbon-based probe towards C6H5O73− were also investigated under different pH levels and metal ions environments. As shown in Figure S9a, the fluorescence intensity of the Cu2+-C3N4 nanoribbon-based probe with or without C6H5O73− did not show obvious change in the pH range from 4 to 8. More importantly, almost all of the cations (10 μM) did not affect the fluorescence response of the Cu2+-C3N4 nanoribbon-based probe, except for Ag+ (Figure S9b). Further, cell lysate (1 × 10⁶ cell mL−1) and biological molecules (10 μM), including glutamic acid, ascorbic acid, glutathione, and DNA, were introduced to examine the probe’s stability. As Figure S9c shows, except for glutathione, the Cu2+-C3N4 nanoribbon-base probe exhibited no obvious fluorescence change upon the addition of C6H5O73− and a biological molecule (10 μM) mixture, even in cell lysate. These results indicate that the Cu2+-C3N4 nanoribbon-based probe can be used for C6H5O73− detection in more complex environments.
The mechanism of the fluorescence quenching and recovering process were studied by DLS and zeta-potential for this system (Figure S10). The average hydrodynamic size of C3N4 nanoribbons increased from 230 to 1523 nm in the presence of Cu2+ along with fluorescence quenching. A change of the zeta-potential from −20.6 mV to −10.4 mV was observed after the C3N4 nanoribbons interacted with Cu2+. This result indicates that a non-fluorescent complex (Cu2+-C3N4 nanoribbon) was formed [50]. With the addition of C6H5O73−, the hydrodynamic size decreased because of the chelation between Cu2+ and C6H5O73−, indicating the release of Cu2+ from C3N4 nanoribbons and resulting in the restoration of the fluorescence of C3N4 nanoribbons [18,19,40]. In order to rule out the effect of nonspecific binding, the PL intensity of the C3N4 nanoribbons was monitored after the addition of different anion solutions. The result shows that, except for OH, the other anions did not dramatically affect the PL intensity of the C3N4 nanoribbons (Figure S11).

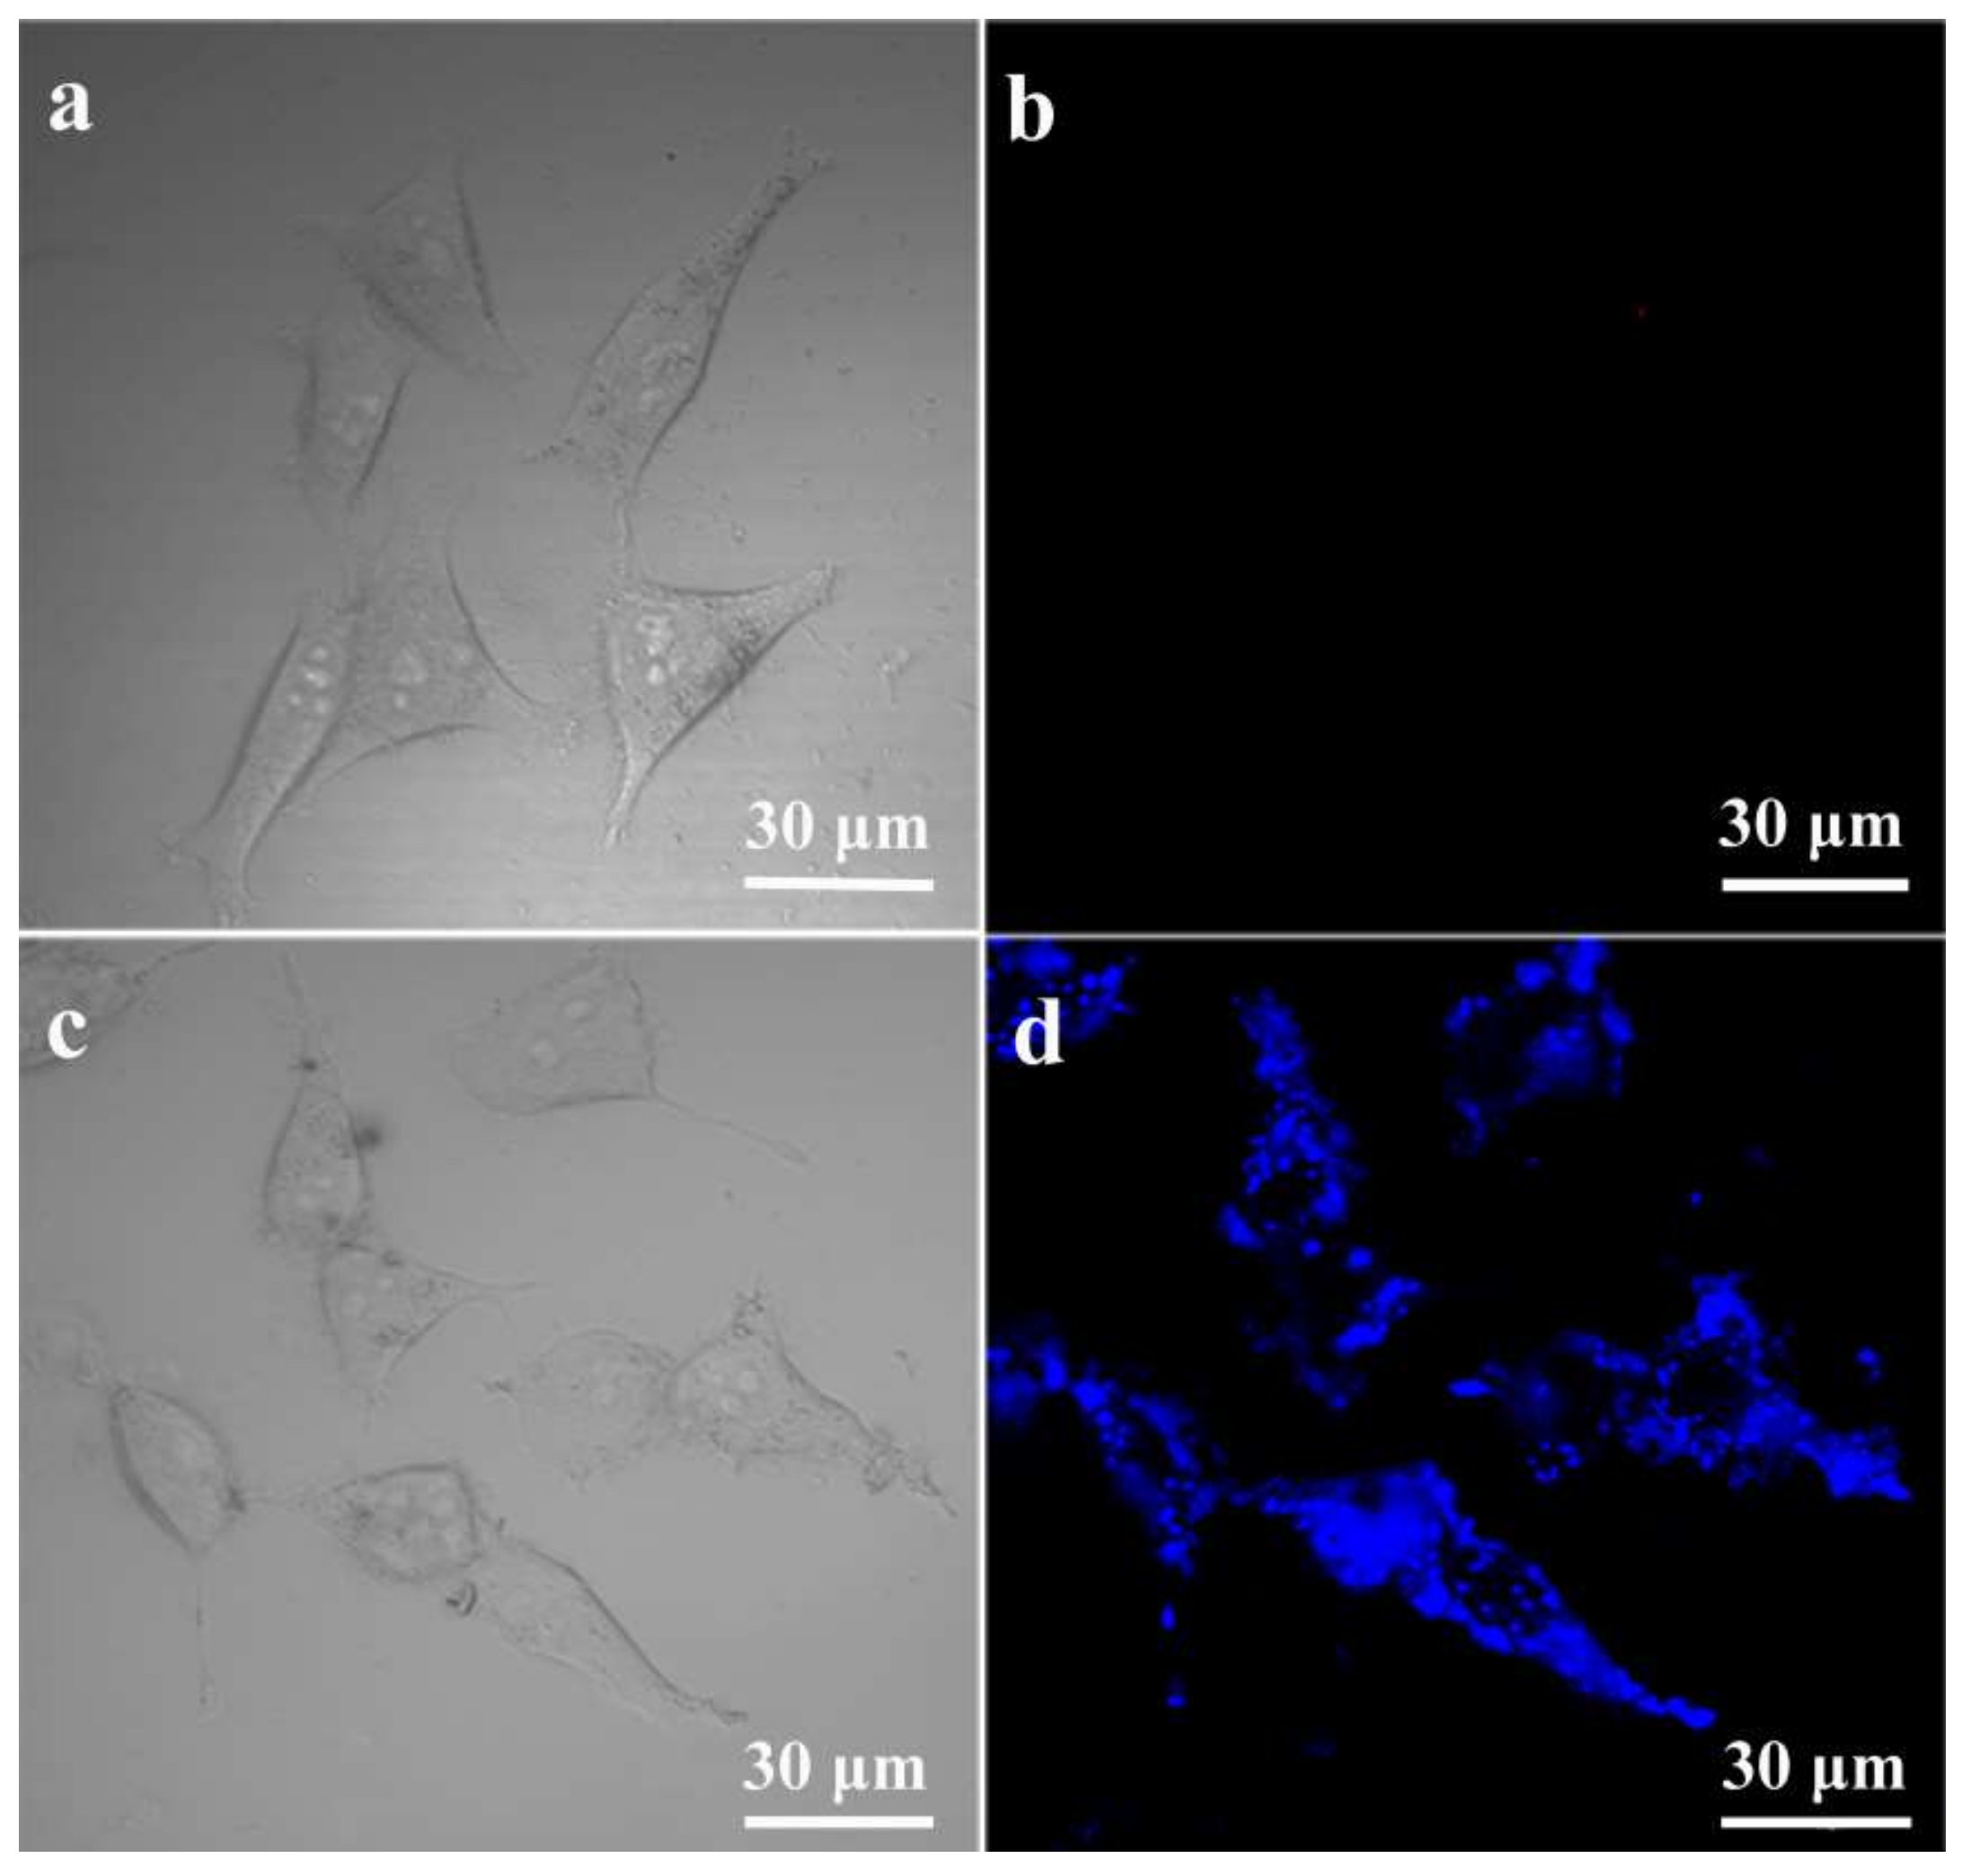
3.4. Intracellular Imaging of C6H5O73−

For further biological applications, the cytotoxicity of the C3N4 nanoribbons and Cu2+-C3N4 nanoribbon complex to HeLa cells was assessed through MTT assays. As shown in Figure S12, the viability of HeLa cells showed no obvious change after incubation with the C3N4 nanoribbons or Cu2+-C3N4 nanoribbon complex for 24 h, indicating their good biocompatibility. Since the Cu2+-C3N4 nanoribbon complex showed a highly selective and sensitive response towards C6H5O73−, this novel fluorescent “off-on” probe based on C3N4 nanoribbons might be potentially applied for the intracellular detection of C6H5O73−. As shown in Figure 4, bright blue fluorescence was observed in C6H5O73−-overloaded HeLa cells incubated with the Cu2+-C3N4 nanoribbon complex, whereas no fluorescence was detected in the control HeLa cells incubated with the Cu2+-C3N4 nanoribbon complex. Besides, Z-scan fluorescent images of living HeLa cells further confirmed that the Cu2+-C3N4 nanoribbon-based probe can be taken up by the cells (Figure S9d). These results demonstrate that the Cu2+-C3N4 nanoribbon complex is membrane permeable and could be used as a fluorescent visualizer for the intracellular imaging of C6H5O73−.

4. Conclusions

In summary, a novel fluorescent “off-on” probe based on C3N4 nanoribbons was developed for C6H5O73− detection. The fluorescence of C3N4 nanoribbons can be quenched by Cu2+ and then recovered by the addition of C6H5O73−. The sensor using this fluorescent “off-on” probe showed a good detection linear range (1~400 μM) with a low detection limit (0.78 μM) as well as high selectivity in aqueous solutions. More importantly, this “off-on” probe based on C3N4 nanoribbons exhibited good biocompatibility and low cytotoxicity in cell environments and can be utilized for intracellular imaging of C6H5O73−.

Supplementary Materials

The following are available online at https://www.mdpi.com/1424-8220/18/4/1163/s1. Figure S1: (a) SEM image, (b) XPS survey spectrum, (c) XRD pattern and (d) FTIR spectrum of the bulk C3N4. Figure S2: XPS survey spectrum of C3N4 nanoribbons. Figure S3: C 1s XPS spectrum of C3N4 nanoribbons. Figure S4: FTIR spectrum of C3N4 nanoribbons. Figure S5: Effect of the pH value on the PL intensity of C3N4 nanoribbons. Figure S6: The fluorescence responses of C3N4 nanoribbons to various metal ions (Cu2+, Al3+, Ba2+, Co2+, Ag+, Fe3+, K+, Li+, Mg2+, Mn2+, Na+, Ni2+, Pb2+, Sn2+, and Zn2+) at a concentration of 100 μM in an aqueous solution. Figure S7: The fluorescent changes of Cu2+-C3N4 nanoribbon complex as a function of interaction time after the addition of C6H5O73− (1 mM). Figure S8: The value of the fluorescent enhancement (I/I0) of Cu2+-C3N4 nanoribbon complex after the addition of C6H5O73−, formic acid, sodium acetate, and propionic acid. I0 and I are the fluorescence intensities of the Cu2+-C3N4 nanoribbon complex at 415 nm in the absence and presence of different anions, respectively. Figure S9: (a) Effect of the pH value on the fluorescence responses of the Cu2+-C3N4 nanoribbon complex after the addition of C6H5O73− (1 mM). (b) Fluorescence responses of the Cu2+-C3N4 nanoribbon complex upon the addition of C6H5O73− and metal ions (10 μM) mixture. (c) Fluorescence responses of the Cu2+-C3N4 nanoribbon complex upon the addition of C6H5O73− and biological molecule (10 μM) mixture. (d) Z-scan images of living HeLa cells that were preincubated with 1 mM C6H5O73− for 12 h and then stained with the Cu2+-C3N4 nanoribbon complex for 4 h. Figure S10: (a) Hydrodynamic size of C3N4 nanoribbons. (b) Hydrodynamic size of the Cu2+-C3N4 nanoribbon complex. (c) Hydrodynamic size of C3N4 nanoribbons after the C6H5O73− was added into the Cu2+-C3N4 nanoribbon solution. Figure S11: The fluorescence responses of C3N4 nanoribbons in an aqueous solution upon the addition of different anions (Br, C6H5O73−, Cl, CN, F, H2PO4, HCO3, I, NO3, OH, CH3COO, and SO42−) (final concentration: 1 mM). Figure S12: Cell viability of HeLa cells incubated with various concentrations of C3N4 nanoribbons (grey) or Cu2+-C3N4 nanoribbon complex (black) for 24 h. Table S1. Comparison of fluorescent citrate sensors.

Acknowledgments

This work was financially supported by the National Key Basic Research Program of China (2017YFA0205300), the National Natural Science Foundation of China (21475064), the Program for Changjiang Scholars and Innovative Research Team in University (IRT_15R37), and the Priority Academic Program Development of Jiangsu Higher Education Institutions (YX03002).

Author Contributions

Y.L.H. and D.L.Y. conceived and designed the experiments; C.Y., N.F., Z.W.S., and X.D.W. synthesized carbon nitride nanoribbons and performed the characterizations. Y.L.H. and D.L.Y. performed all the rest of the experiments; Y.L.H., D.L.Y., Z.M.L., and L.Z. analyzed the data; L.X.W. and L.H.W. contributed reagents/materials/analysis tools; Y.L.H. and D.L.Y. wrote the paper.

Conflicts of Interest

The authors declare no conflict of interest.

References

  1. Wise, D.R.; Ward, P.S.; Shay, J.E.S.; Cross, J.R.; Gruber, J.J.; Sachdeva, U.M.; Platt, J.M.; DeMatteo, R.G.; Simon, M.C.; Thompson, C.B. Hypoxia promotes isocitrate dehydrogenase-dependent carboxylation of alpha-ketoglutarate to citrate to support cell growth and viability. Proc. Natl. Acad. Sci. USA 2011, 108, 19611–19616. [Google Scholar] [CrossRef] [PubMed]
  2. Costello, L.C.; Franklin, R.B. Concepts of citrate production and secretion by prostate 1. Metab. Relatsh. Prostate 1991, 18, 25–46. [Google Scholar] [CrossRef]
  3. Akram, M. Citric acid cycle and role of its intermediates in metabolism. Cell Biochem. Biophys. 2014, 68, 475–478. [Google Scholar] [CrossRef] [PubMed]
  4. Ashbrook, M.J.; McDonough, K.L.; Pituch, J.J.; Christopherson, P.L.; Cornell, T.T.; Selewski, D.T.; Shanley, T.P.; Blatt, N.B. Citrate modulates lipopolysaccharide-induced monocyte inflammatory responses. Clin. Exp. Immunol. 2015, 180, 520–530. [Google Scholar] [CrossRef] [PubMed]
  5. Hu, Y.Y.; Rawal, A.; Schmidt-Rohr, K. Strongly bound citrate stabilizes the apatite nanocrystals in bone. Proc. Natl. Acad. Sci. USA 2010, 107, 22425–22429. [Google Scholar] [CrossRef] [PubMed]
  6. Liu, Z.; Devaraj, S.; Yang, C.; Yen, Y. A new selective chromogenic and fluorogenic sensor for citrate ion. Sens. Actuators B 2012, 174, 555–562. [Google Scholar] [CrossRef]
  7. Costello, L.; Franklin, R.; Narayan, P. Citrate in the diagnosis of prostate cancer. Prostate 1999, 38, 237–245. [Google Scholar] [CrossRef]
  8. Hikima, S.; Hasebe, K.; Taga, M. New amperometric biosensor for citrate with mercury film electrode. Electroanalysis 1992, 4, 801–803. [Google Scholar] [CrossRef]
  9. Peres, R.G.; Moraes, E.P.; Micke, G.A.; Tonin, F.G.; Tavares, M.F.M.; Rodriguez-Amaya, D.B. Rapid method for the determination of organic acids in wine by capillary electrophoresis with indirect UV detection. Food Control 2009, 20, 548–552. [Google Scholar] [CrossRef]
  10. Hasebe, K.; Hikama, S.; Yoshida, H. Determinations of citric acid by differential pulse polarography with immobilized enzymes. Fresenius J. Anal. Chem. 1990, 336, 232–234. [Google Scholar] [CrossRef]
  11. Miyakoshi, K.; Komoda, M. Determination of citric acid and its decomposed products in edible oils by gas liquid chromatography. J. Am. Oil Chem. Soc. 1977, 54, 331–333. [Google Scholar] [CrossRef]
  12. Kelebek, H.; Selli, S.; Canbas, A.; Cabaroglu, T. HPLC determination of organic acids, sugars, phenolic compositions and antioxidant capacity of orange juice and orange wine made from a turkish cv. Kozan. Microchem. J. 2009, 91, 187–192. [Google Scholar] [CrossRef]
  13. Li, C.; Zhou, Y.; Li, Y.; Kong, X.; Zou, C.; Weng, C. Colorimetric and fluorescent chemosensor for citrate based on a rhodamine and Pb2+ complex in aqueous solution. Anal. Chim. Acta 2013, 774, 79–84. [Google Scholar] [CrossRef] [PubMed]
  14. Zhuo, S.; Gong, J.; Zhang, P.; Zhu, C. High-throughput and rapid fluorescent visualization sensor of urinary citrate by CdTe quantum dots. Talanta 2015, 141, 21–25. [Google Scholar] [CrossRef] [PubMed]
  15. Hang, Y.; Wang, J.; Jiang, T.; Lu, N.; Hua, J. Diketopyrrolopyrrole-based ratiometric/turn-on fluorescent chemosensors for citrate detection in the near-infrared region by an aggregation-induced emission mechanism. Anal. Chem. 2016, 88, 1696–1703. [Google Scholar] [CrossRef] [PubMed]
  16. Yang, D.; Li, F.; Luo, Z.; Bao, B.; Hu, Y.; Weng, L.; Cheng, Y.; Wang, L. Conjugated polymer nanoparticles with aggregation induced emission characteristics for intracellular Fe3+ sensing. J. Polym. Sci. Part A: Polym. Chem. 2016, 54, 1686–1693. [Google Scholar] [CrossRef]
  17. Ong, W.J.; Tan, L.L.; Ng, Y.H.; Yong, S.T.; Chai, S.P. Graphitic carbon nitride (g-C3N4)-based photocatalysts for artificial photosynthesis and environmental remediation: Are we a step closer to achieving sustainability? Chem. Rev. 2016, 116, 7159–7329. [Google Scholar] [CrossRef] [PubMed]
  18. Dong, Y.; Wang, Q.; Wu, H.; Chen, Y.; Lu, C.H.; Chi, Y.; Yang, H.H. Graphitic carbon nitride materials: Sensing, imaging and therapy. Small 2016, 12, 5376–5393. [Google Scholar] [CrossRef] [PubMed]
  19. Lee, E.Z.; Lee, S.U.; Heo, N.S.; Stucky, G.D.; Jun, Y.S.; Hong, W.H. A fluorescent sensor for selective detection of cyanide using mesoporous graphitic carbon(IV) nitride. Chem. Commun. 2012, 48, 3942–3944. [Google Scholar] [CrossRef] [PubMed]
  20. Zhang, X.; Wang, H.; Wang, H.; Zhang, Q.; Xie, J.; Tian, Y.; Wang, J.; Xie, Y. Single-layered graphitic-C3N4 quantum dots for two-photon fluorescence imaging of cellular nucleus. Adv. Mater. 2014, 26, 4438–4443. [Google Scholar] [CrossRef] [PubMed]
  21. Li, Y.; Ouyang, S.; Xu, H.; Wang, X.; Bi, Y.; Zhang, Y.; Ye, J. Constructing solid-gas-interfacial fnton reaction over alkalinized-C3N4 photocatalyst to achieve apparent quantum yield of 49% at 420 nm. J. Am. Chem. Soc. 2016, 138, 13289–13297. [Google Scholar] [CrossRef] [PubMed]
  22. Yang, Z.; Zhang, Y.; Schnepp, Z. Soft and hard templating of graphitic carbon nitride. J. Mater. Chem. A 2015, 3, 14081–14092. [Google Scholar] [CrossRef]
  23. Huang, H.; Chen, R.; Ma, J.; Yan, L.; Zhao, Y.; Wang, Y.; Zhang, W.; Fan, J.; Chen, X. Graphitic carbon nitride solid nanofilms for selective and recyclable sensing of Cu2+ and Ag+ in water and serum. Chem. Commun. 2014, 50, 15415–15418. [Google Scholar] [CrossRef] [PubMed]
  24. Wang, A.; Wang, C.; Fu, L.; Wong-Ng, W.; Lan, Y. Recent advances of graphitic carbon nitride-based structures and applications in catalyst, sensing, imaging, and leds. Nano-Micro Lett. 2017, 9, 47. [Google Scholar] [CrossRef]
  25. Zhang, S.; Li, J.; Zeng, M.; Xu, J.; Wang, X.; Hu, W. Polymer nanodots of graphitic carbon nitride as effective fluorescent probes for the detection of Fe3+ and Cu2+ ions. Nanoscale 2014, 6, 4157–4162. [Google Scholar] [CrossRef] [PubMed]
  26. Zhang, X.L.; Zheng, C.; Guo, S.S.; Li, J.; Yang, H.H.; Chen, G. Turn-on fluorescence sensor for intracellular imaging of glutathione using g-C3N4 nanosheet—MnO2 sandwich nanocomposite. Anal. Chem. 2014, 86, 3426–3434. [Google Scholar] [CrossRef] [PubMed]
  27. Tian, J.; Liu, Q.; Asiri, A.M.; Sun, X.; He, Y. Ultrathin graphitic C3N4 nanofibers: Hydrolysis-driven top-down rapid synthesis and application as a novel fluorosensor for rapid, sensitive, and selective detection of Fe3+. Sens. Actuators B 2015, 216, 453–460. [Google Scholar] [CrossRef]
  28. Lee, E.Z.; Jun, Y.S.; Hong, W.H.; Thomas, A.; Jin, M.M. Cubic mesoporous graphitic carbon(IV) nitride: An all-in-one chemosensor for selective optical sensing of metal ions. Angew. Chem. Int. Ed. 2010, 49, 9706–9710. [Google Scholar] [CrossRef] [PubMed]
  29. Tian, J.; Liu, Q.; Asiri, A.M.; Al-Youbi, A.O.; Sun, X. Ultrathin graphitic carbon nitride nanosheet: A highly efficient fluorosensor for rapid, ultrasensitive detection of Cu2+. Anal. Chem. 2013, 85, 5595–5599. [Google Scholar] [CrossRef] [PubMed]
  30. Field, T.B.; McCourt, J.L.; McBryde, W. Composition and stability of iron and copper citrate complexes in aqueous solution. Can. J. Chem. 1974, 52, 3119–3124. [Google Scholar] [CrossRef]
  31. Still, E.R.; Wikberg, P. Solution studies of systems with polynuclear complex formation. 1. The copper(II) citrate system. Inorg. Chim. Acta 1980, 46, 147–152. [Google Scholar] [CrossRef]
  32. Parry, R.; Dubois, F. Citrate complexes of copper in acid solutions. J. Am. Chem. Soc. 1952, 74, 3749–3753. [Google Scholar] [CrossRef]
  33. Zhang, Y.; Pan, Q.; Chai, G.; Liang, M.; Dong, G.; Zhang, Q.; Qiu, J. Synthesis and luminescence mechanism of multicolor-emitting g-C3N4 nanopowders by low temperature thermal condensation of melamine. Sci. Rep. 2013, 3, 1943. [Google Scholar] [CrossRef] [PubMed]
  34. Zhang, X.; Xie, X.; Wang, H.; Zhang, J.; Pan, B.; Xie, Y. Enhanced photoresponsive ultrathin graphitic-phase C3N4 nanosheets for bioimaging. J. Am. Chem. Soc. 2013, 135, 18–21. [Google Scholar] [CrossRef] [PubMed]
  35. Yang, J.; Wu, X.; Li, X.; Liu, Y.; Gao, M.; Liu, X.; Kong, L.; Yang, S. Synthesis and characterization of nitrogen-rich carbon nitride nanobelts by pyrolysis of melamine. Appl. Phys. A Mater. Sci. Process. 2011, 105, 161–166. [Google Scholar] [CrossRef]
  36. Rong, M.; Song, X.; Zhao, T.; Yao, Q.; Wang, Y.; Chen, X. Synthesis of highly fluorescent P,O-g-C3N4 nanodots for the label-free detection of Cu2+ and acetylcholinesterase activity. J. Mater. Chem. C 2015, 3, 10916–10924. [Google Scholar] [CrossRef]
  37. Bai, X.; Cao, C.; Xu, X.; Yu, Q. Synthesis and characterization of crystalline carbon nitride nanowires. Solid State Commun. 2010, 150, 2148–2153. [Google Scholar] [CrossRef]
  38. Dementjev, A.P.; de Graaf, A.; van de Sanden, M.C.M.; Maslakov, K.I.; Naumkin, A.V.; Serov, A.A. X-ray photoelectron spectroscopy reference data for identification of the C3N4 phase in carbon-nitrogen films. Diam. Relat. Mater. 2000, 9, 1904–1907. [Google Scholar] [CrossRef]
  39. Lu, X.; Gai, L.; Cui, D.; Wang, Q.; Zhao, X.; Tao, X. Synthesis and characterization of C3N4 nanowires and pseudocubic C3N4 polycrystalline nanoparticles. Mater. Lett. 2007, 61, 4255–4258. [Google Scholar] [CrossRef]
  40. Tang, Y.; Song, H.; Su, Y.; Lv, Y. Turn-on persistent luminescence probe based on graphitic carbon nitride for imaging detection of biothiols in biological fluids. Anal. Chem. 2013, 85, 11876–11884. [Google Scholar] [CrossRef] [PubMed]
  41. Gunasekaran, S.; Sailatha, E.; Seshadri, S.; Kumaresan, S. FTIR, FT raman spectra and molecular structural confirmation of isoniazid. Indian J. Pure Appl. Phys. 2009, 47, 12–18. [Google Scholar]
  42. Gunasekaran, S.; Seshadri, S.; Muthu, S. Vibrational spectra and normal coordinate analysis of flucytosine. Indian J. Pure Appl. Phys. 2006, 44, 581–586. [Google Scholar]
  43. Urbaniak-Domagala, W. The use of the spectrometric technique FTIR-ATR to examine the polymers surface. In Advances Aspects Spectroscopy; Farrukh, M.A., Ed.; InTech: London, UK, 2012; pp. 85–104. ISBN 978-953-51-0715-6. [Google Scholar]
  44. Lin, T.; Zhong, L.; Wang, J.; Guo, L.; Wu, H.; Guo, Q.; Fu, F.; Chen, G. Graphite-like carbon nitrides as peroxidase mimetics and their applications to glucose detection. Biosens. Bioelectron. 2014, 59, 89–93. [Google Scholar] [CrossRef] [PubMed]
  45. Barman, S.; Sadhukhan, M. Facile bulk production of highly blue fluorescent graphitic carbon nitride quantum dots and their application as highly selective and sensitive sensors for the detection of mercuric and iodide ions in aqueous media. J. Mater. Chem. 2012, 22, 21832–21837. [Google Scholar] [CrossRef]
  46. Yang, D.; Dai, C.; Hu, Y.; Liu, S.; Weng, L.; Luo, Z.; Cheng, Y.; Wang, L. A new polymer-based fluorescent chemosensor incorporating propane-1,3-dione and 2,5-diethynylbenzene moieties for detection of copper(II) and iron(III). Polymers 2017, 9, 267. [Google Scholar] [CrossRef]
  47. Hu, Y.; Huang, Y.; Tan, C.; Zhang, X.; Lu, Q.; Sindoro, M.; Huang, X.; Huang, W.; Wang, L.; Zhang, H. Two-dimensional transition metal dichalcogenide nanomaterials for biosensing applications. Mater. Chem. Front. 2016, 1, 24–36. [Google Scholar] [CrossRef]
  48. Rajalakshmi, K.; Nam, Y.S.; Selvaraj, M.; Lee, Y.; Lee, K.B. Metal free bioimaging reagent for intracellular citrate in prostate cancer cells using aryl boronate derivative. Sens. Actuators B 2018, 259, 90–96. [Google Scholar] [CrossRef]
  49. Parker, D.; Yu, J. A pH-insensitive, ratiometric chemosensor for citrate using europium luminescence. Chem. Commun. 2005, 25, 3141–3143. [Google Scholar] [CrossRef] [PubMed]
  50. Zhang, Q.; Song, C.; Zhao, T.; Fu, H.W.; Wang, H.Z.; Wang, Y.J.; Kong, D.M. Photoluminescent sensing for acidic amino acids based on the disruption of graphene quantum dots/europium ions aggregates. Biosens. Bioelectron. 2015, 65, 204–210. [Google Scholar] [CrossRef] [PubMed]
Scheme 1. Schematic illustration of the C3N4 nanoribbon-based fluorescent citrate sensor.
Sensors 18 01163 sch001
Figure 1. (a) TEM image, (b) HRTEM image, (c) X-ray diffraction (XRD) pattern and (d) N 1s X-ray photoelectron spectroscopy (XPS) spectrum of C3N4 nanoribbons.
Sensors 18 01163 g001
Figure 2. (a) UV-vis and photoluminescence (PL) spectra of C3N4 nanoribbons. (b) The PL spectra of C3N4 nanoribbons (40 μg mL−1) in the presence of different concentrations of Cu2+. (c) PL intensity responses of C3N4 nanoribbons with varying concentrations of Cu2+ in an aqueous solution. (d) The linear calibration of PL intensity versus the concentrations of Cu2+.
Sensors 18 01163 g002
Figure 3. (a) Fluorescence spectra of Cu2+-C3N4 nanoribbon complex with increasing concentrations of C6H5O73−. (b) Plot of the fluorescence enhancement (I/I0) of the Cu2+-C3N4 nanoribbon complex after the addition of different concentrations of C6H5O73−. The linear calibration range from 1 to 400 μM is shown as an inset. (c) Fluorescence spectra of the Cu2+-C3N4 nanoribbon complex in the presence of Br, C6H5O73−, Cl, CN, F, H2PO4, HCO3, I, NO3, OH, SO42−, HCOO, CH3COO, and CH3CH2COO (1 mM). (d) The value of fluorescent enhancement (I/I0) of the Cu2+-C3N4 nanoribbon complex after the addition of Br, C6H5O73−, Cl, CN, F, H2PO4, HCO3, I, NO3, OH, and SO42− (1 mM). I0 and I stand for the fluorescence intensities of Cu2+-C3N4 nanoribbon complex at 415 nm in the absence and presence of different anions, respectively.
Sensors 18 01163 g003
Figure 4. (a) Bright field and (b) fluorescent images of HeLa cells incubated with the Cu2+-C3N4 nanoribbon complex for 4 h. (c) Bright field and (d) fluorescent images of HeLa cells pretreated with C6H5O7Na3 (1 mM) for 12 h and then incubated with the Cu2+-C3N4 nanoribbon complex for 4 h.
Sensors 18 01163 g004

