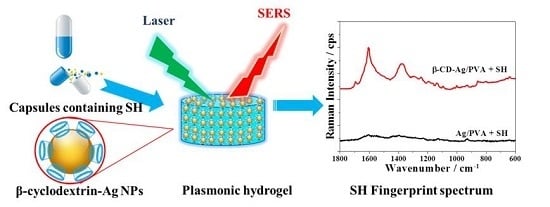
Rapid Surface Enhanced Raman Scattering (SERS) Detection of Sibutramine Hydrochloride in Pharmaceutical Capsules with a β-Cyclodextrin- Ag/Polyvivnyl Alcohol Hydrogel Substrate

Abstract
:
1. Introduction
2. Experimental
2.1. Materials
2.2. Preparation of β-CD-Ag Sol
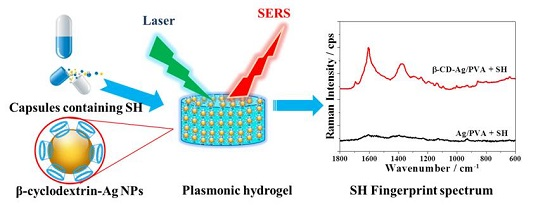
2.3. Preparation of β-CD-Ag/PVA Gel Substrate
2.4. Characterization
2.5. Preparation of Standard and Sample Solutions
2.6. Adsorption Capacity Evaluation
2.7. SERS Analysis
2.8. HPLC Analysis
2.9. Theoretical Calculations
3. Result and Discussion
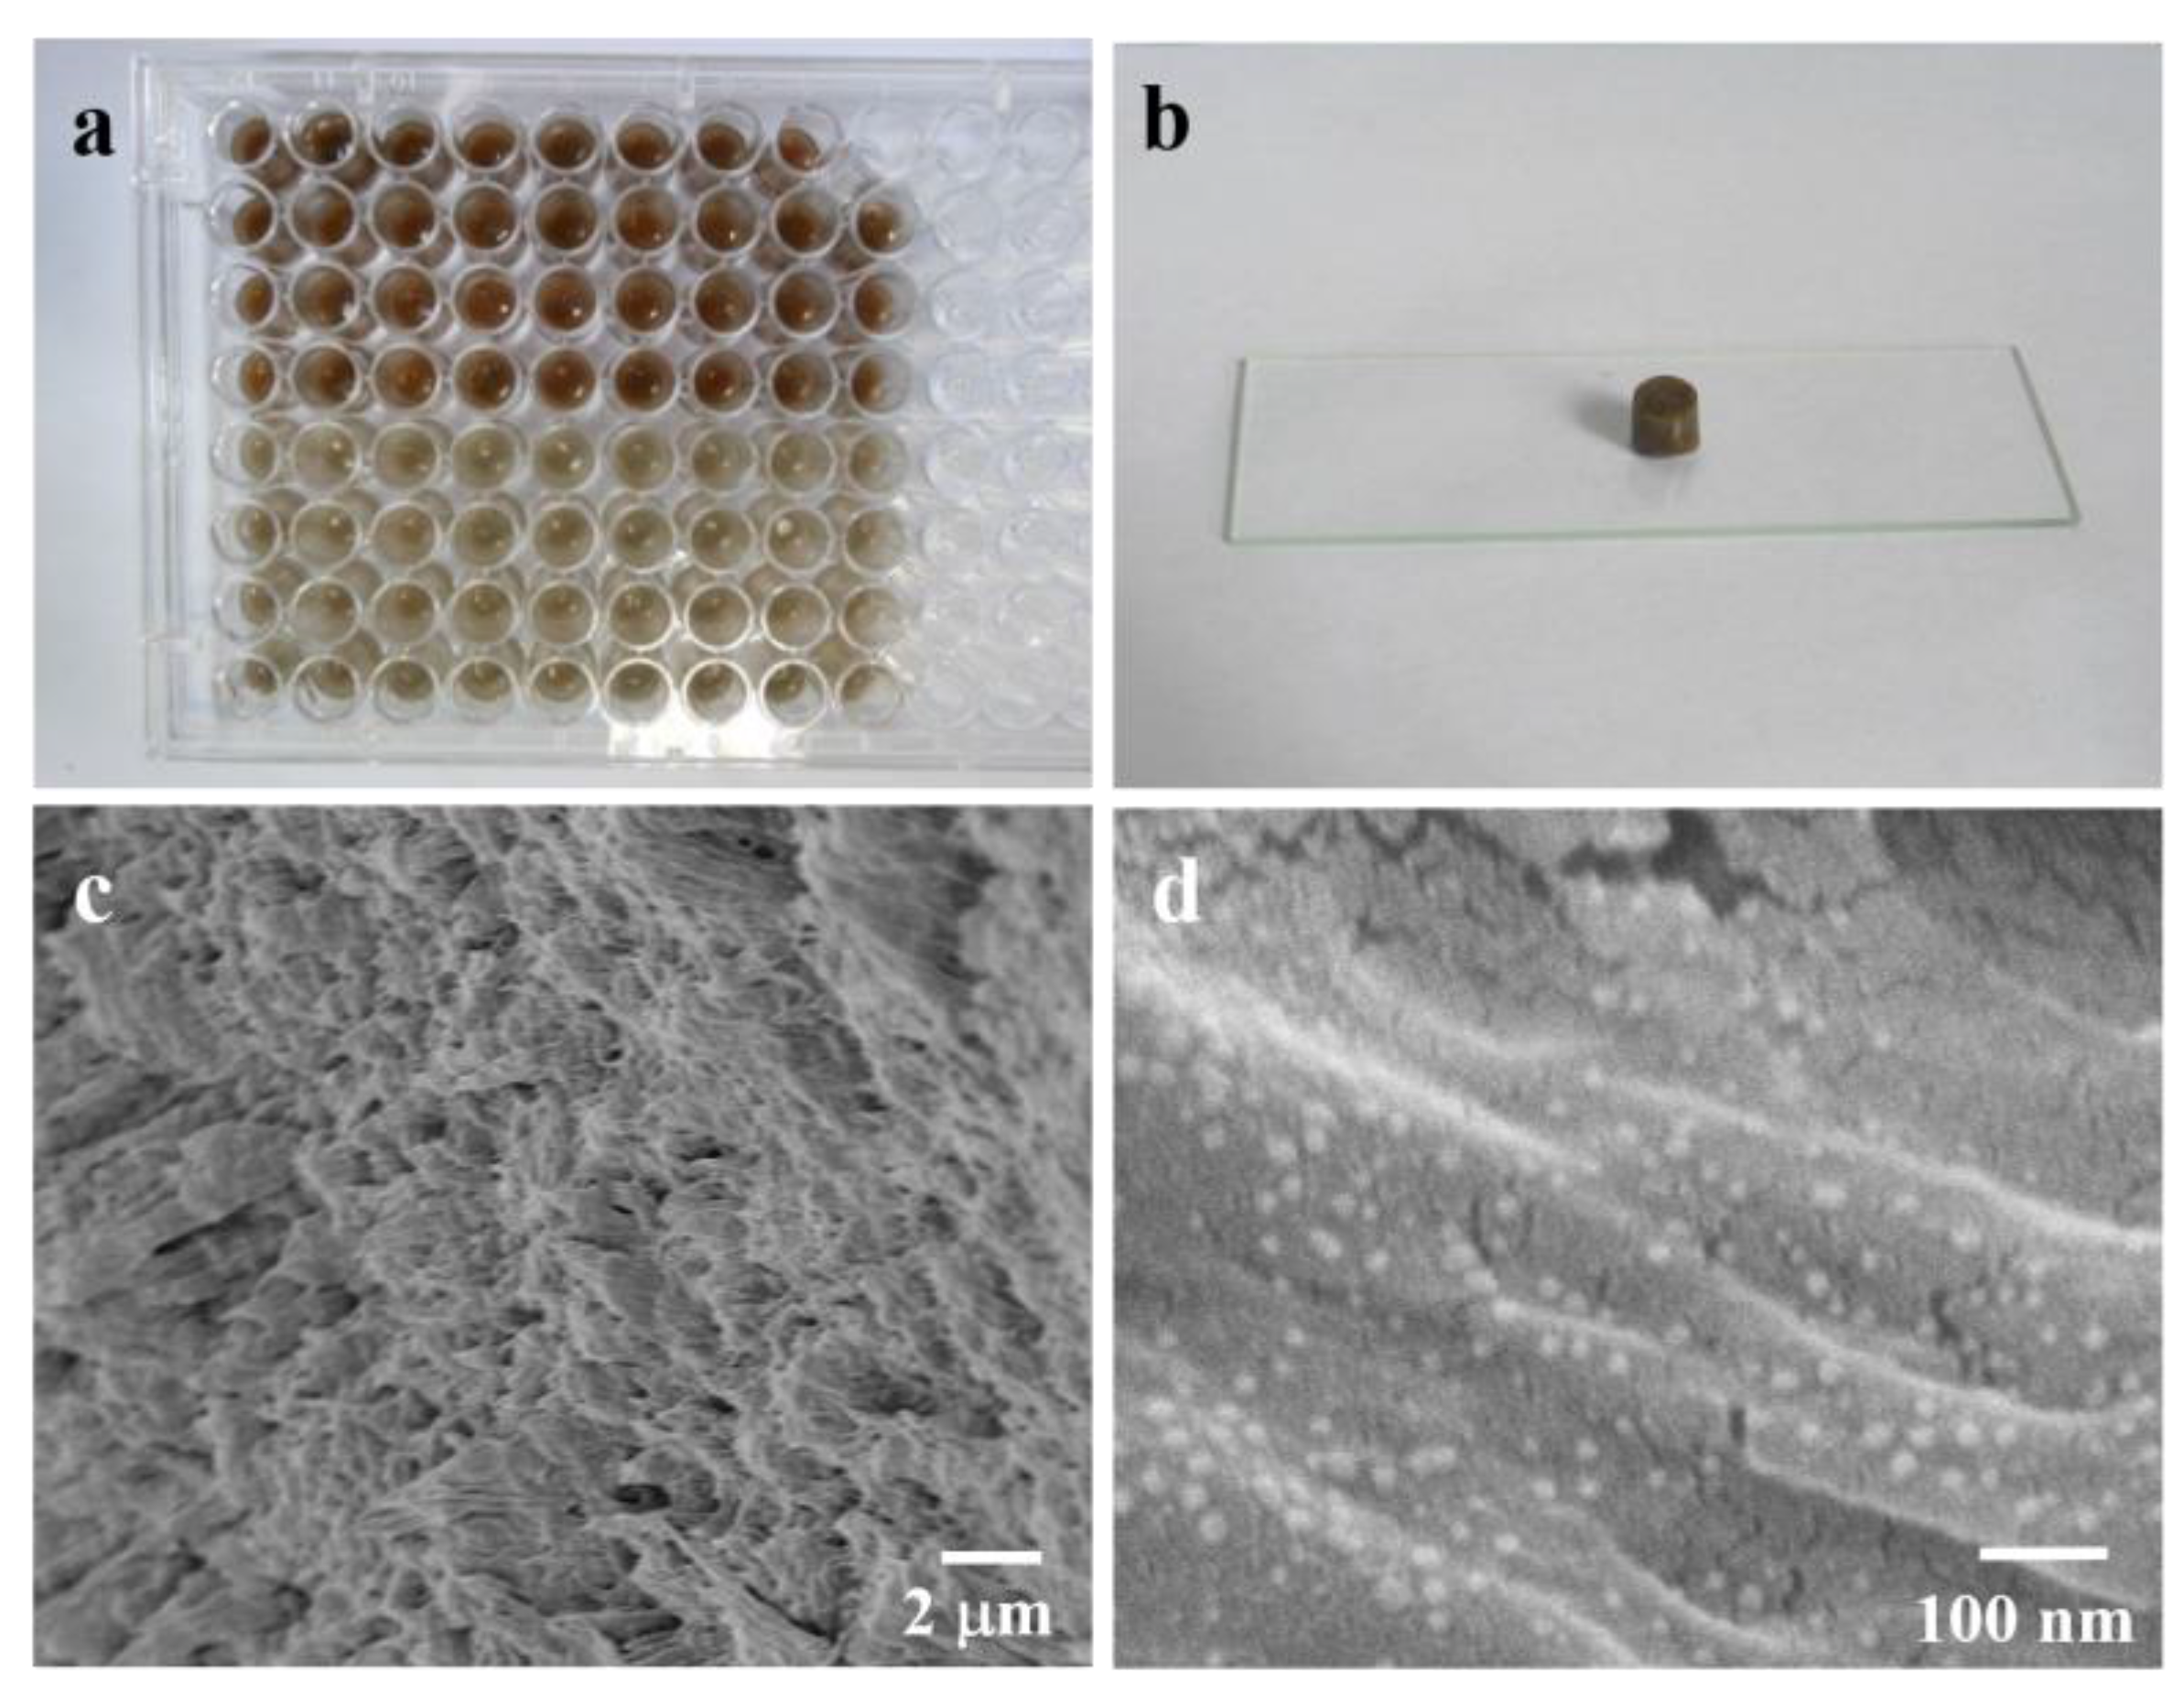
3.1. SERS Detection of SH by β-CD-Ag/PVA Substrate
3.2. Optimization of Substrate Synthesis Conditions
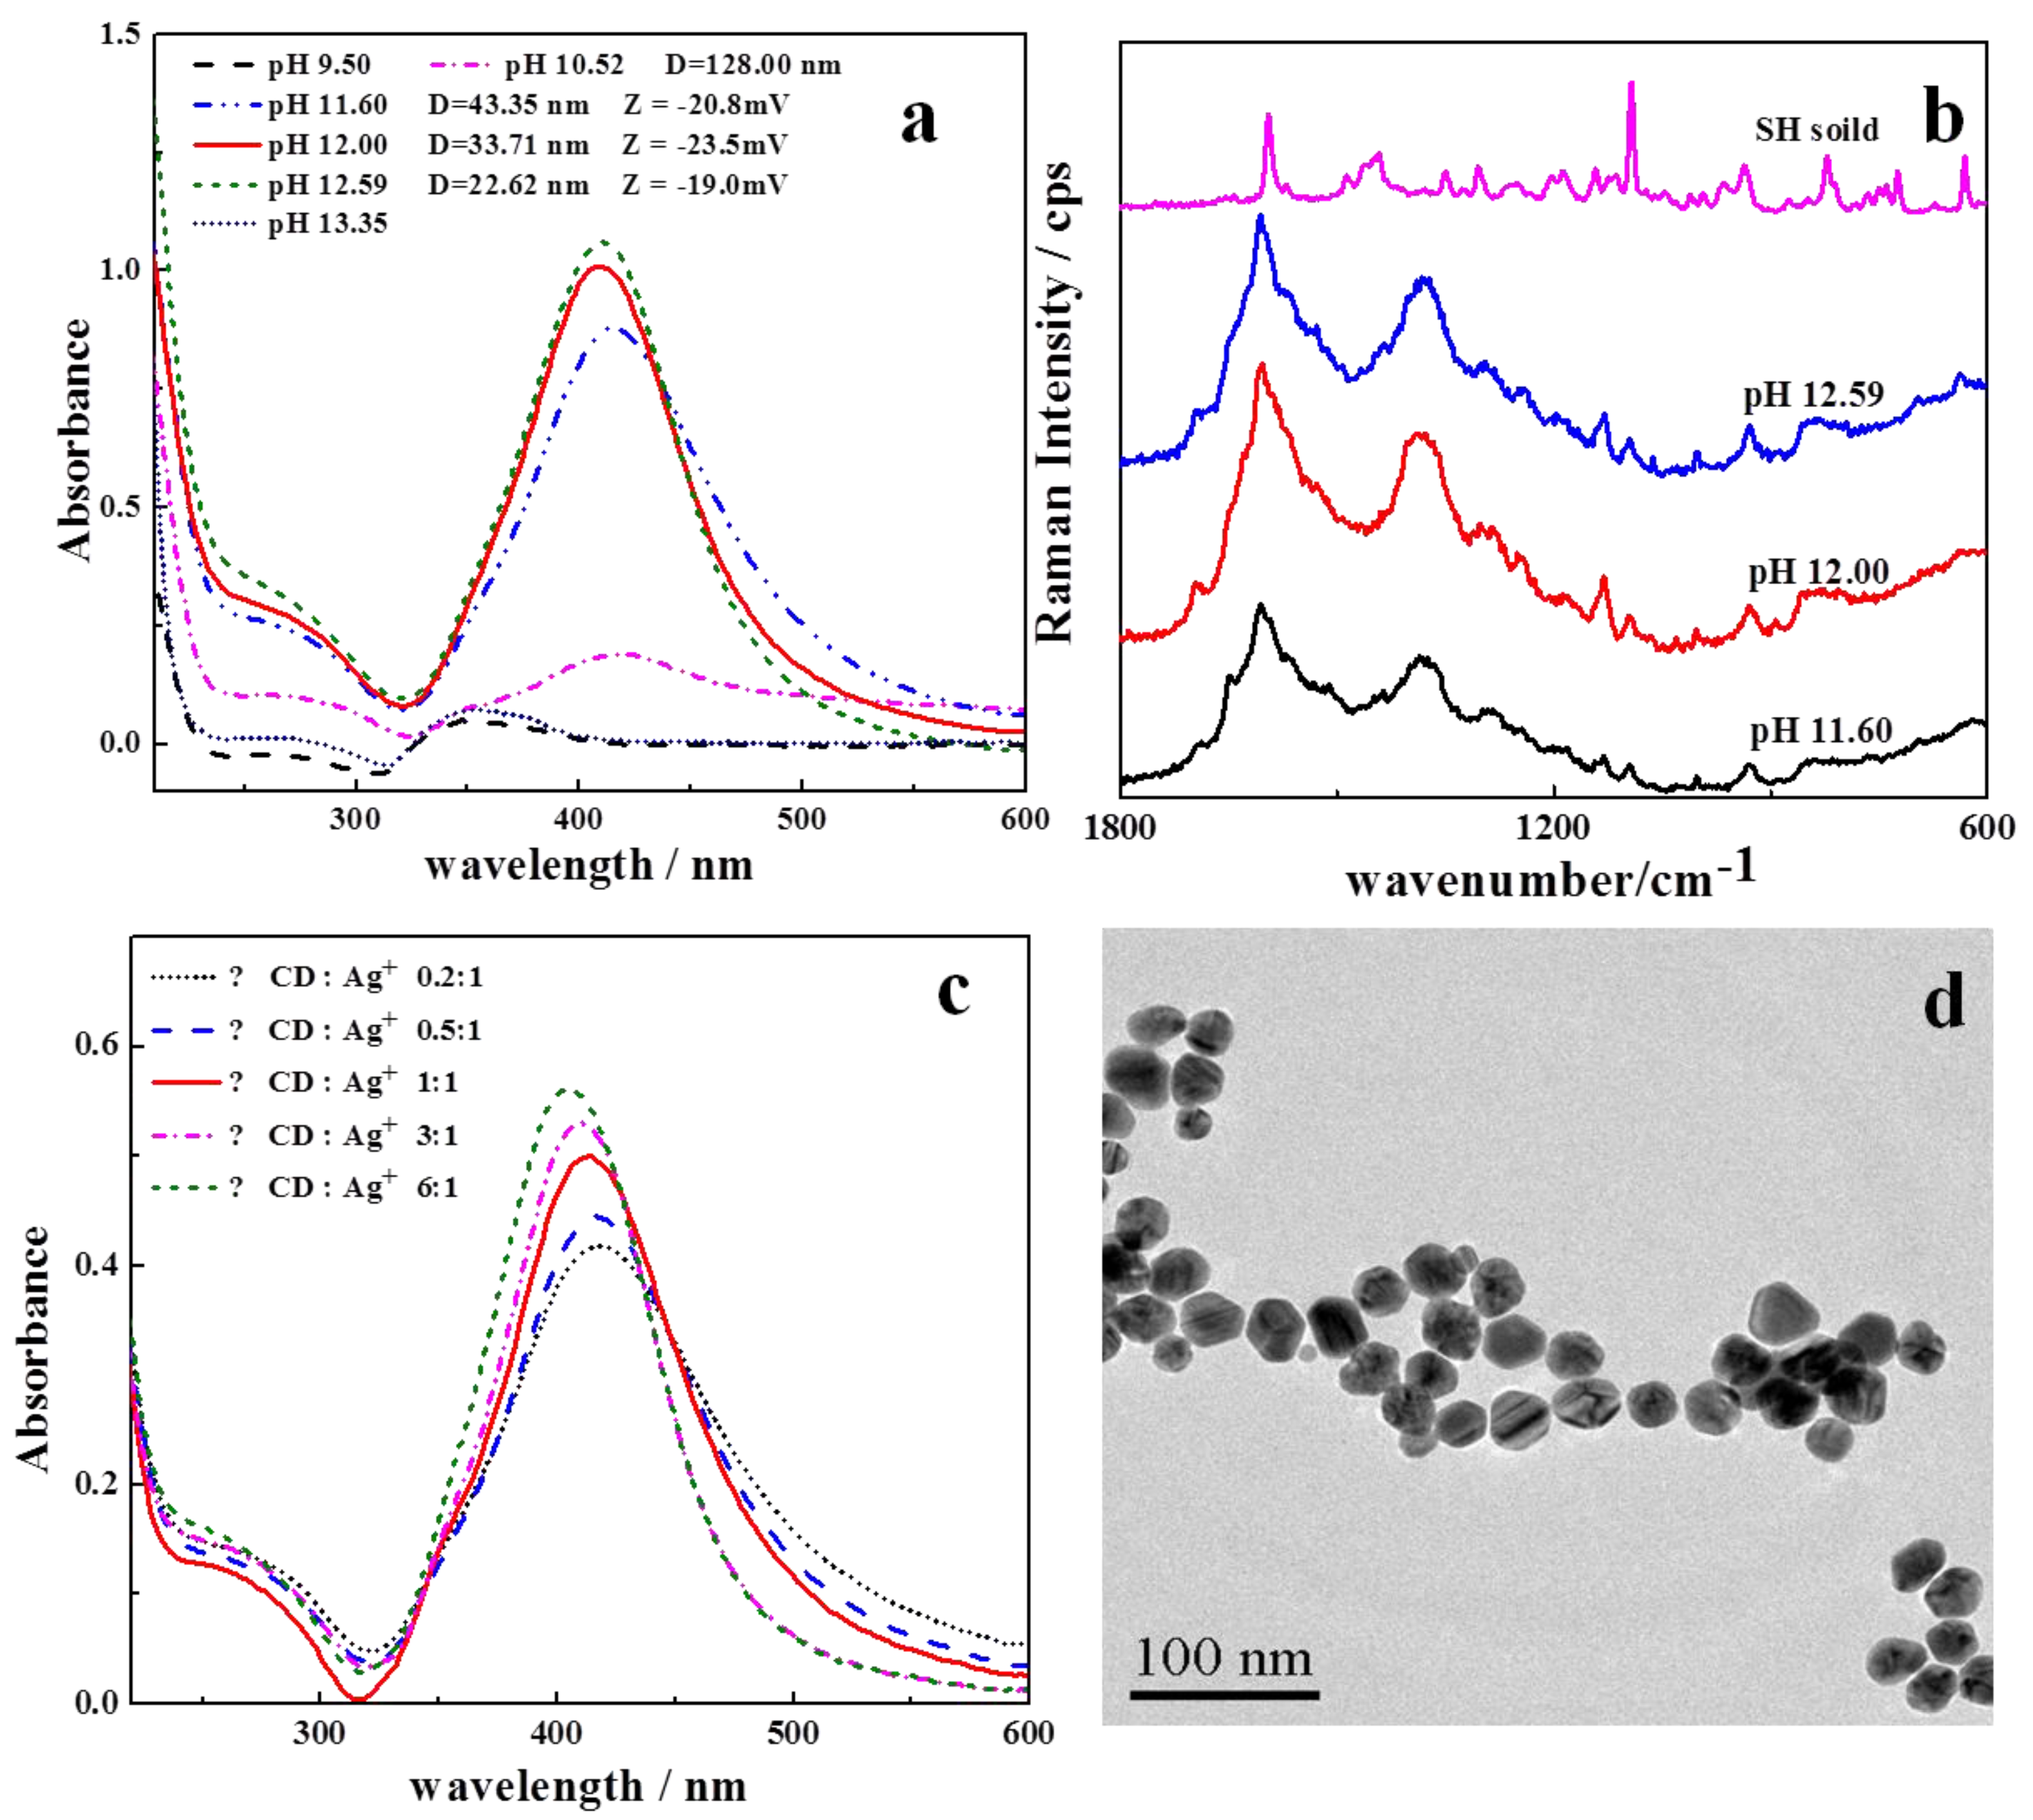
3.2.1. Reaction pH and β-CD Concentration for β-CD-Ag NPs
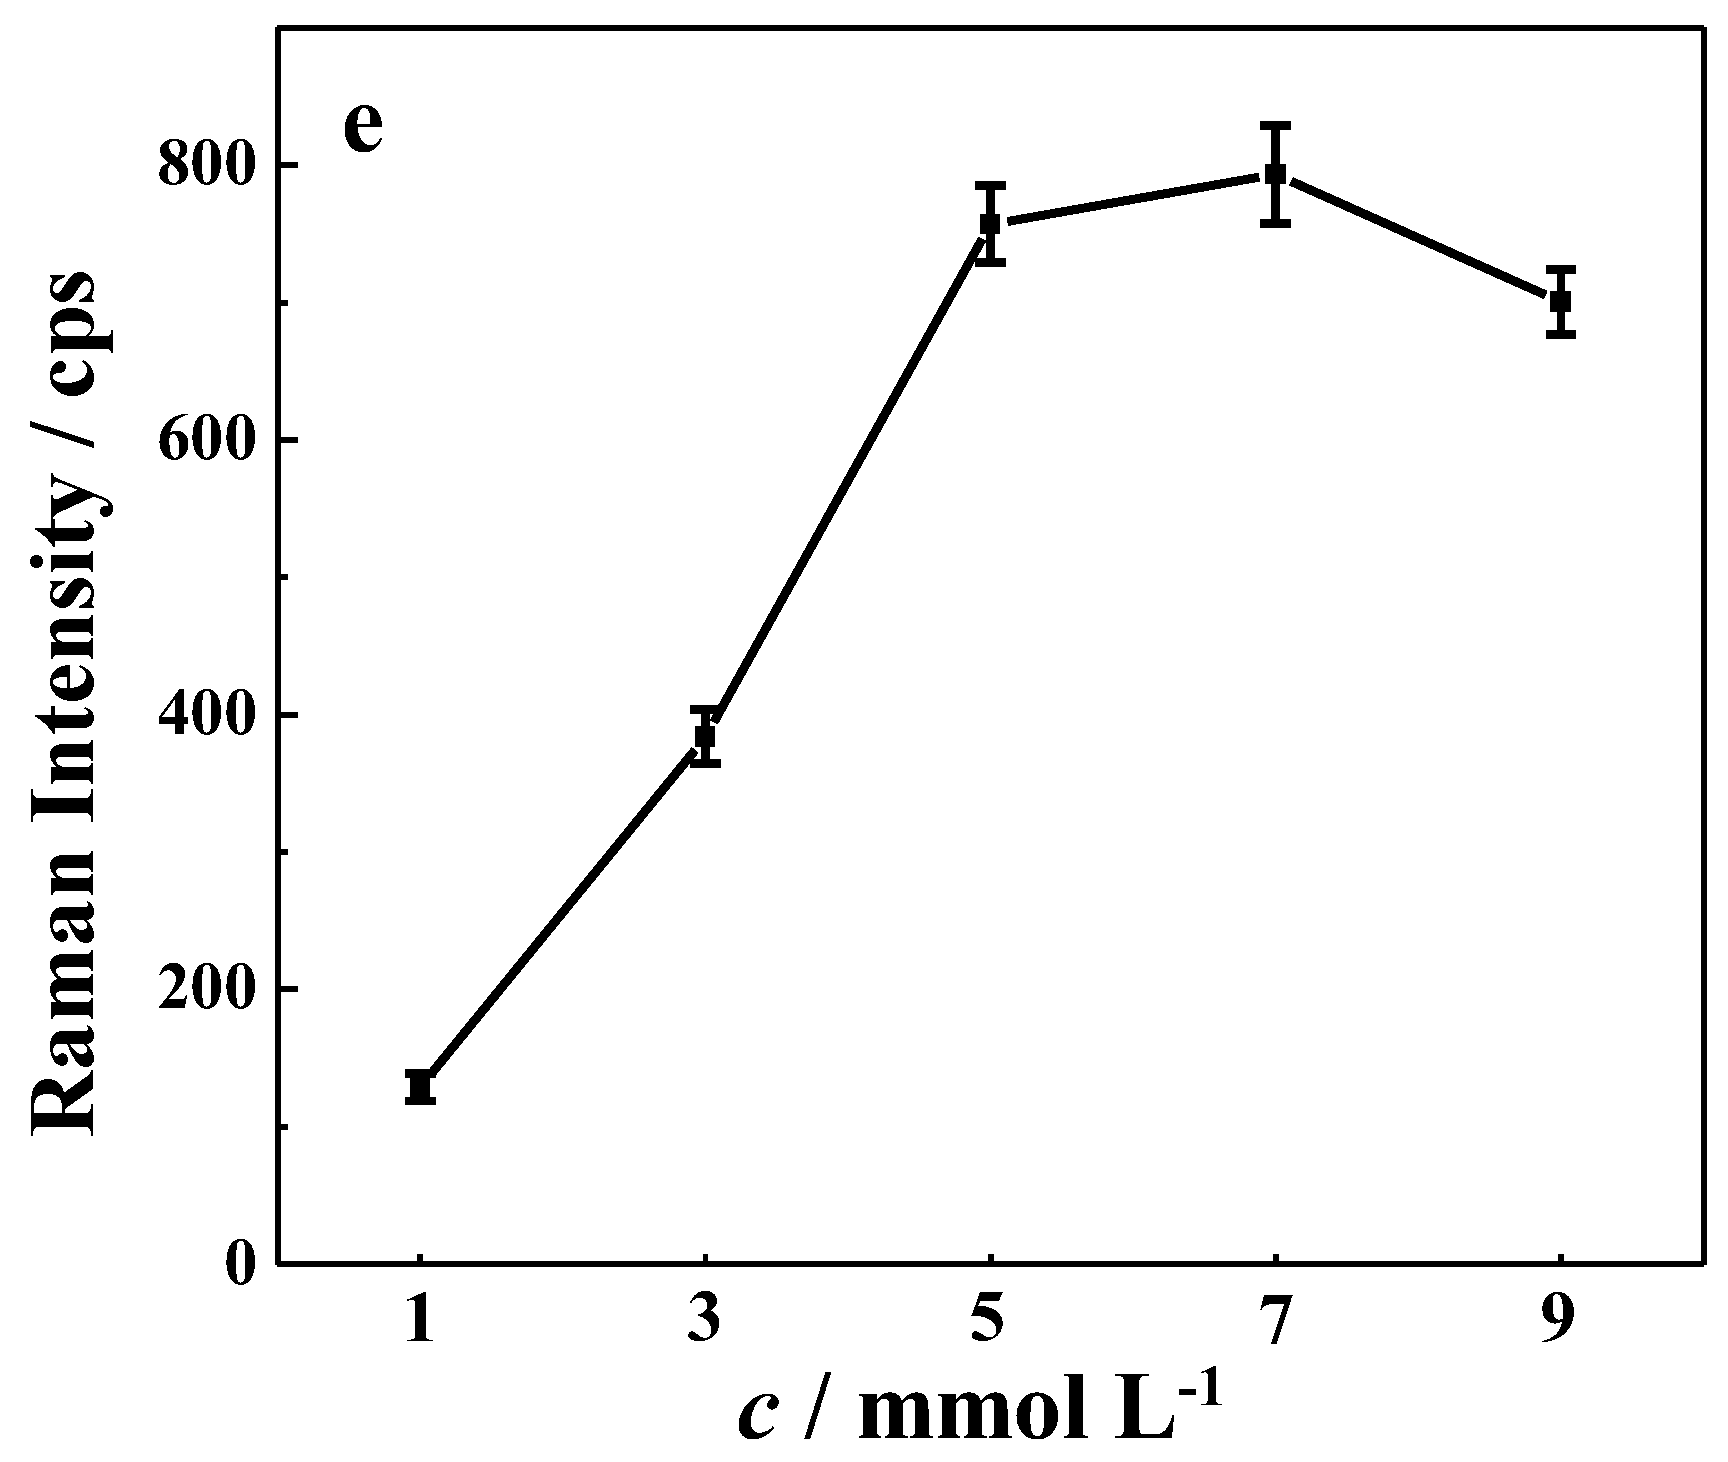
3.2.2. Ag NPs Content in β-CD-Ag/PVA Hydrogel
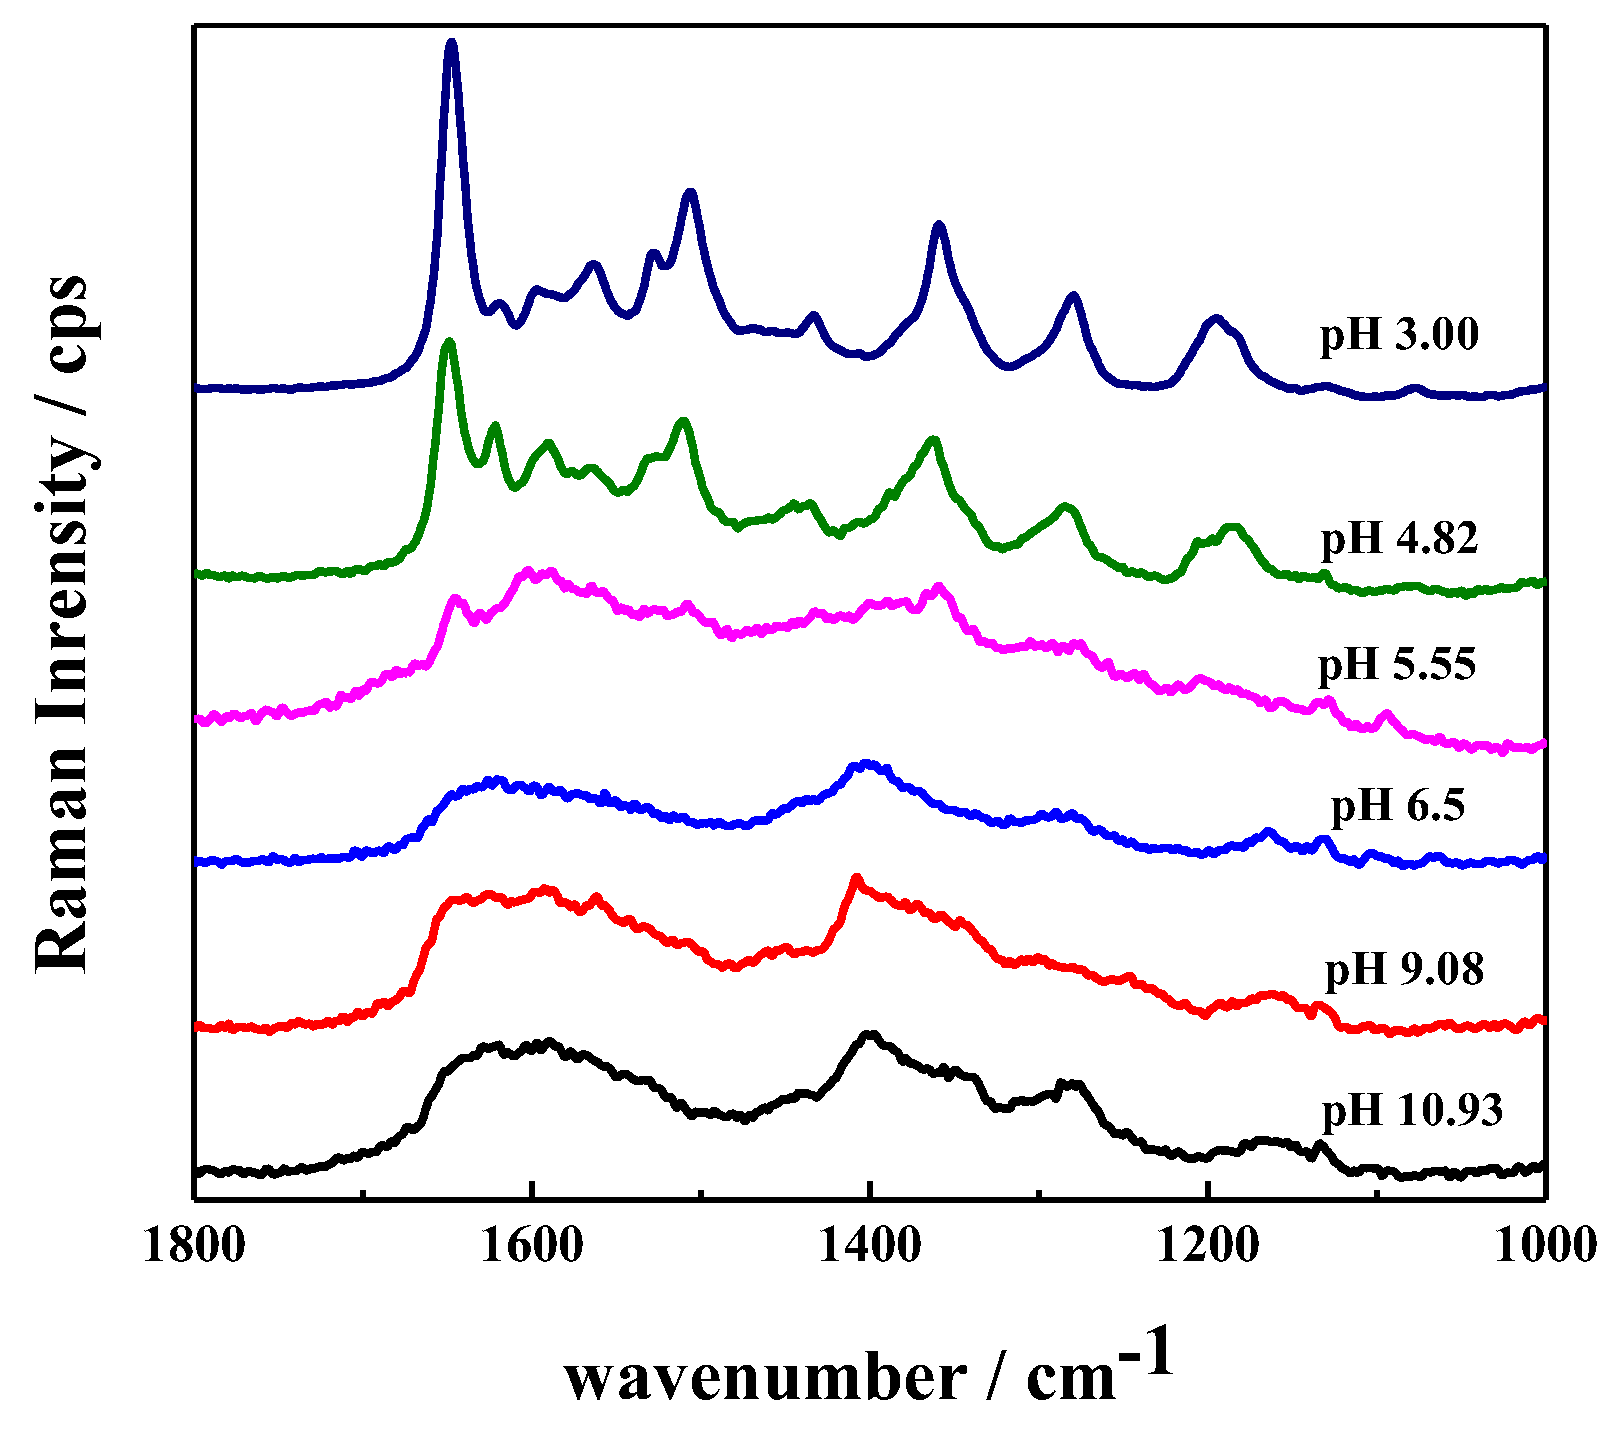
3.2.3. Optimization of the Detection pH for SH
3.3. Analytical Performance for SERS Detection for SH
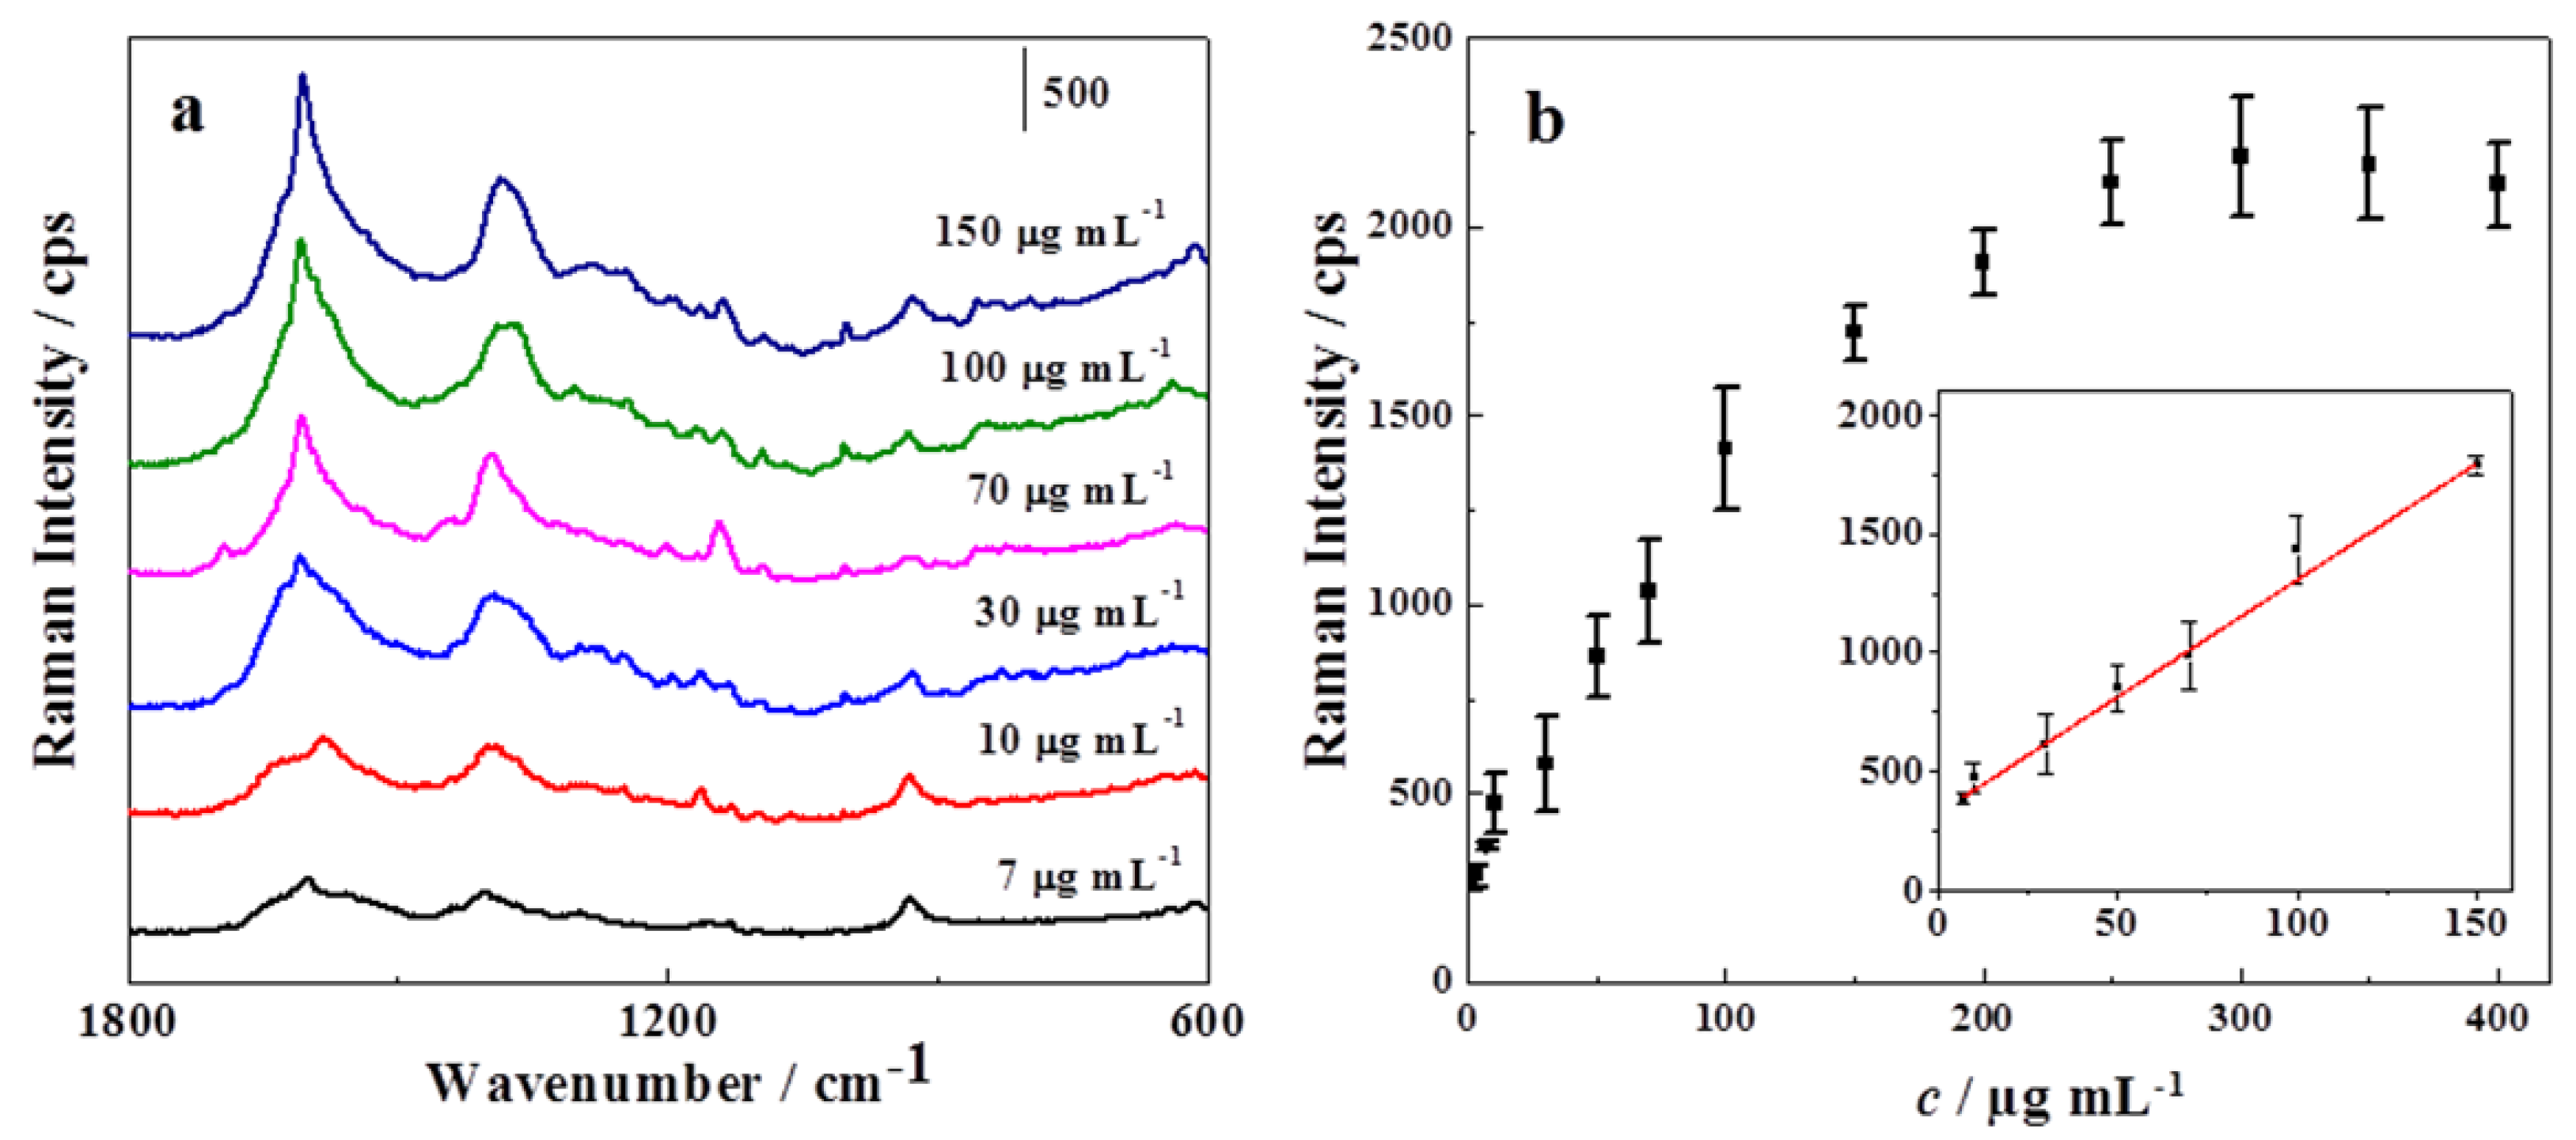
3.3.1. Linearity
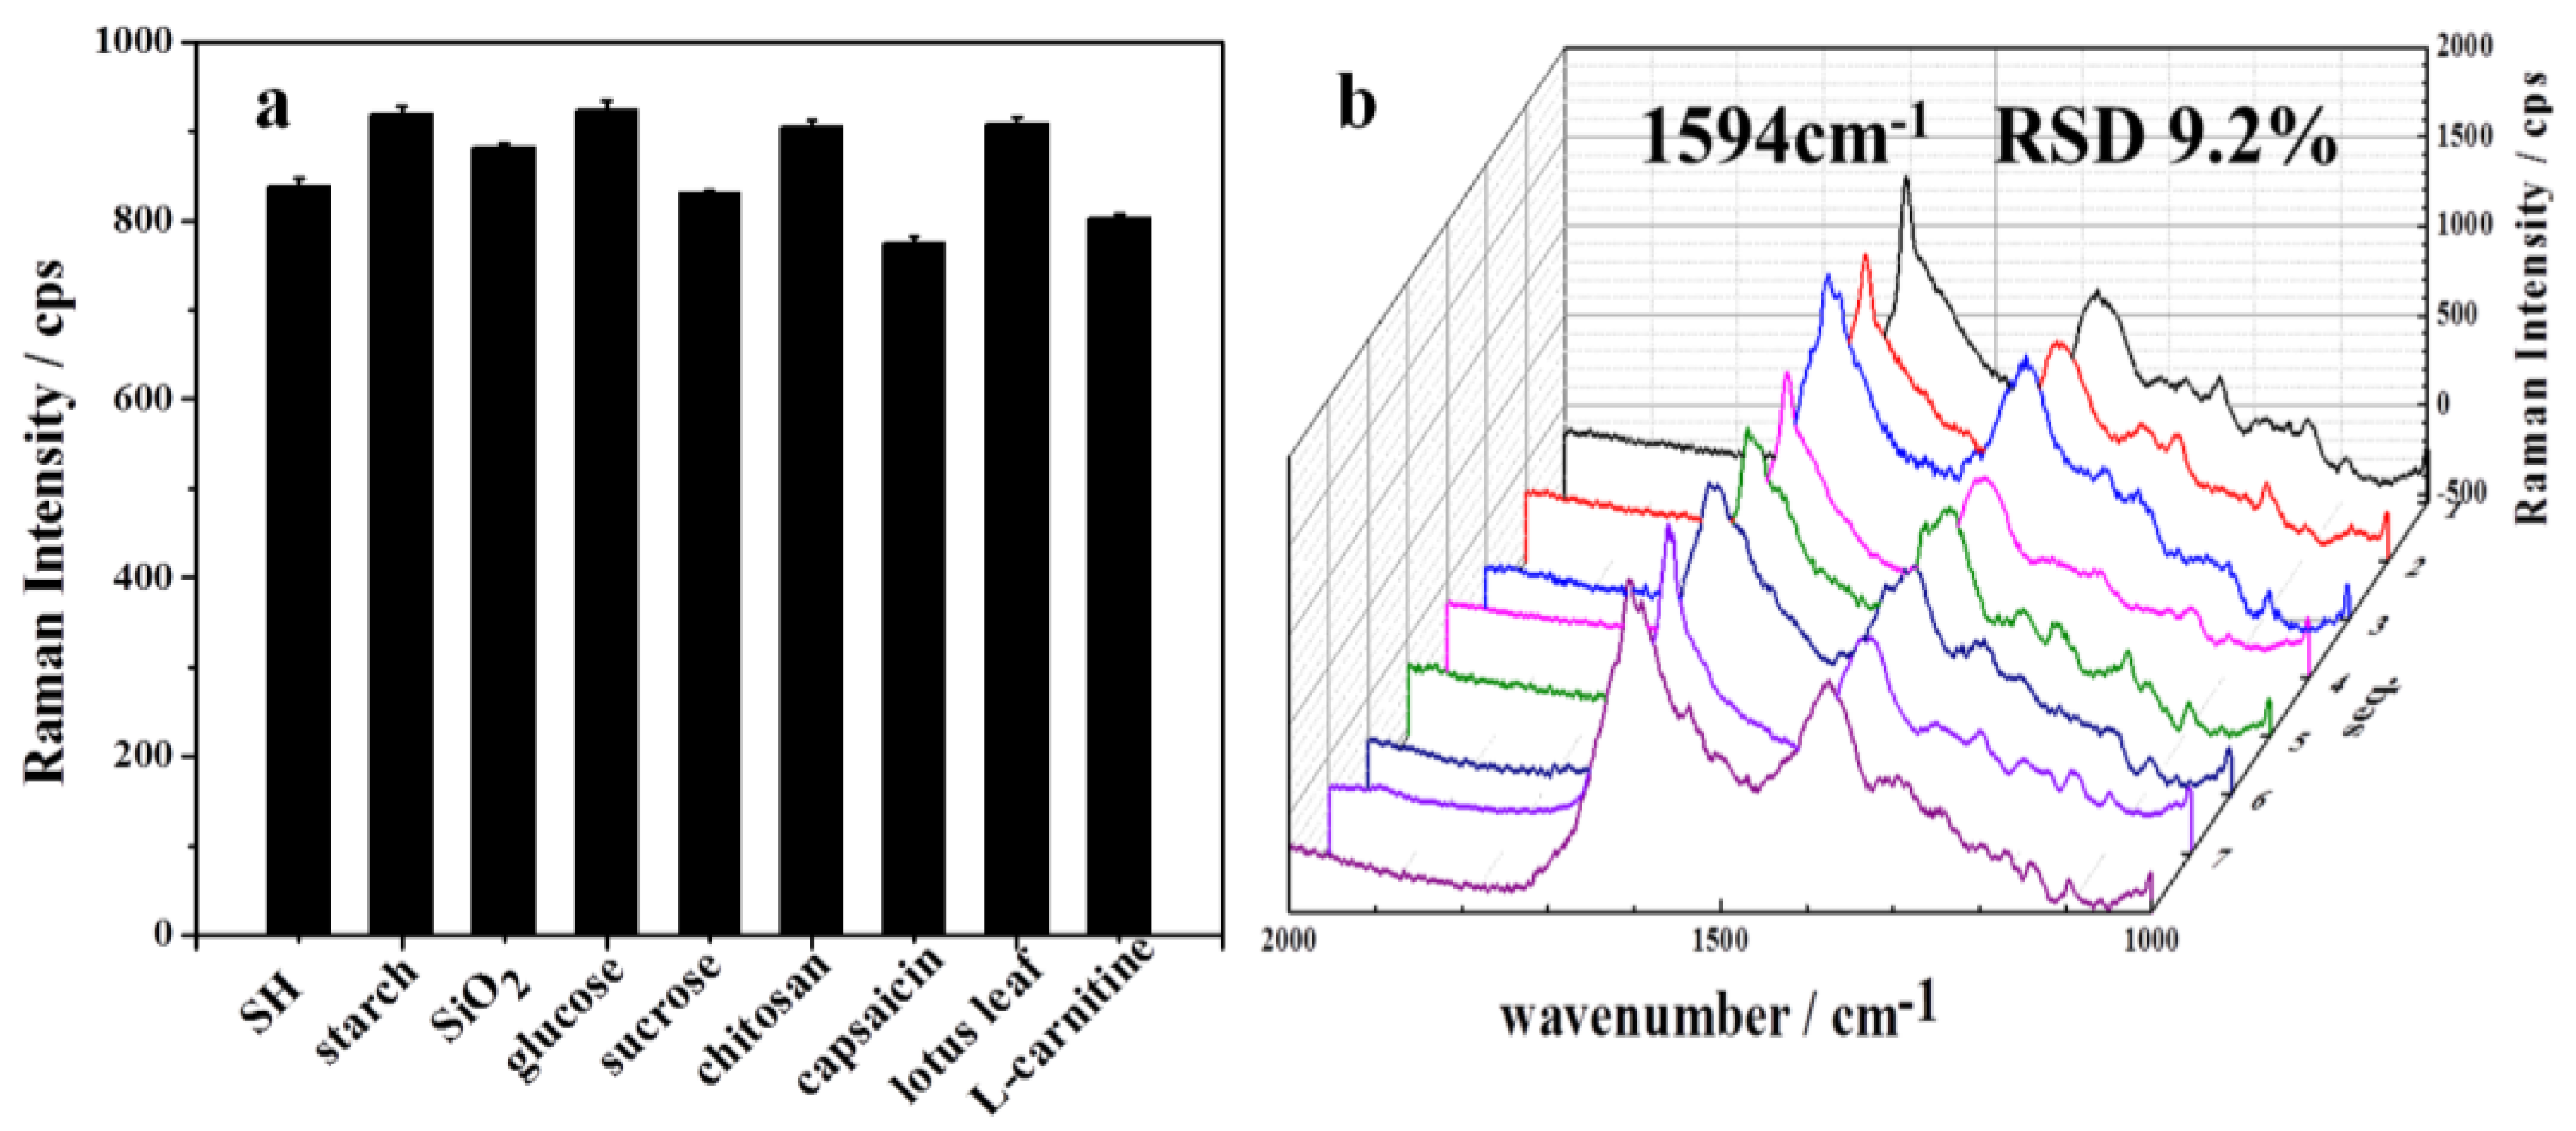
3.3.2. Selectivity
3.3.3. Reproducibility between Different Batches
3.3.4. Precision
3.3.5. Accuracy
3.3.6. Real Samples Detection
4. Conclusions
Acknowledgments
Author Contributions
Conflicts of Interest
References
- Radhakrishna, T.; Narayana, C.L.; Rao, D.S.; Vyas, K.; Reddy, G.O. LC method for the determination of assay and purity of sibutramine hydrochloride and its enantiomers by chiral chromatography. J. Pharm. Biomed. Anal. 2000, 22, 627–639. [Google Scholar] [CrossRef]
- Park, J.-Y.; Kim, K.-A.; Park, P.-W.; Suh, K.-H.; Lee, G.S. Relative bioavailability and pharmacokinetics of a new sibutramine formulation in healthy male subjects: A randomized, open-label, two-period, comparative crossover study. Clin. Ther. 2004, 26, 2092–2101. [Google Scholar] [CrossRef] [PubMed]
- Halpern, A.; Leite, C.C.; Herszkowicz, N.; Barbato, A.; Costa, A.P.A. Evaluation of efficacy, reliability, and tolerability of sibutramine in obese patients, with an echocardiographic study. Rev. Hosp. Clin. 2002, 57, 98–102. [Google Scholar] [CrossRef] [PubMed]
- Buckett, W.R.; Thomas, P.C.; Luscombe, G.P. The pharmacology of sibutramine hydrochloride (BTS 54 524), a new antidepressant which induces rapid noradrenergic down-regulation. Prog. Neuro-Psychopharm. Biol. Psychiatry 1988, 12, 575–584. [Google Scholar] [CrossRef]
- Elfhag, K.; Rössner, S.; Barkeling, B.; Rooth, P. Sibutramine treatment in obesity: Initial eating behaviour in relation to weight loss results and changes in mood. Pharmacol. Res. 2005, 51, 159–163. [Google Scholar] [CrossRef] [PubMed]
- Chen, S.P.; Tang, M.H.; Ng, S.W.; Poon, W.T.; Chan, A.Y.; Mak, T.W. Psychosis associated with usage of herbal slimming products adulterated with sibutramine: A case series. Clin. Toxicol. 2010, 48, 832–838. [Google Scholar] [CrossRef] [PubMed]
- Luque, C.A.; Rey, J.A. The discovery and status of sibutramine as an anti-obesity drug. Eur. J. Pharmacol. 2002, 440, 119–128. [Google Scholar] [CrossRef]
- Hind, I.; Mangham, J.; Ghani, S.; Haddock, R.; Garratt, C.; Jones, R. Sibutramine pharmacokinetics in young and elderly healthy subjects. Eur. J. Clin. Pharmacol. 1999, 54, 847–849. [Google Scholar] [CrossRef] [PubMed]
- Caterson, I.; Finer, N.; Coutinho, W.; Van Gaal, L.; Maggioni, A.; Torp-Pedersen, C.; Sharma, A.; Legler, U.; Shepherd, G.; Rode, R.; et al. Maintained intentional weight loss reduces cardiovascular outcomes: Results from the Sibutramine Cardiovascular OUTcomes (SCOUT) trial. Diabetes Obes. Metab. 2012, 14, 523–530. [Google Scholar] [CrossRef] [PubMed]
- Maluf, D.F.; Farago, P.V.; Barreira, S.M.; Pedroso, C.F.; Pontarolo, R. Validation of an analytical method for determination of sibutramine hydrochloride monohydrate in capsules by UV-vis spectrophotometry. Lat. Am. J. Pharm. 2007, 26, 909. [Google Scholar]
- Phattanawasin, P.; Sotanaphun, U.; Sukwattanasinit, T.; Akkarawaranthorn, J.; Kitchaiya, S. Quantitative determination of sibutramine in adulterated herbal slimming formulations by TLC-image analysis method. Forensic Sci. Int. 2012, 219, 96–100. [Google Scholar] [CrossRef] [PubMed]
- Chorilli, M.; Bonfilio, R.; da Silva Chicarelli, R.; Salgado, H.R.N. Development and validation of an analytical method by RP-HPLC for quantification of sibutramine hydrochloride in pharmaceutical capsules. Anal. Methods 2011, 3, 985–990. [Google Scholar] [CrossRef]
- Chen, J.; Lu, W.; Zhang, Q.; Jiang, X. Determination of the active metabolite of sibutramine by liquid chromatography–electrospray ionization tandem mass spectrometry. J. Chromatogr. B 2003, 785, 197–203. [Google Scholar] [CrossRef]
- Ding, L.; Hao, X.; Huang, X.; Zhang, S. Simultaneous determination of sibutramine and its N-desmethyl metabolites in human plasma by liquid chromatography–electrospray ionization–mass spectrometry: Method and clinical applications. Anal. Chim. Acta 2003, 492, 241–248. [Google Scholar] [CrossRef]
- Strano-Rossi, S.; Colamonici, C.; Botrè, F. Detection of sibutramine administration: A gas chromatography/mass spectrometry study of the main urinary metabolites. Rapid Commun. Mass Spectrom. 2007, 21, 79–88. [Google Scholar] [CrossRef] [PubMed]
- Sardela, V.; Motta, M.; Padilha, M.; Pereira, H.; Neto, F.A. Analysis of sibutramine metabolites as N-trifluoroacetamide and O-trimethylsilyl derivatives by gas chromatography–mass spectrometry in urine. J. Chromatogr. B 2009, 877, 3003–3011. [Google Scholar] [CrossRef] [PubMed]
- Müller, C.; David, L.; Chiş, V.; Pînzaru, S.C. Detection of thiabendazole applied on citrus fruits and bananas using surface enhanced Raman scattering. Food Chem. 2014, 145, 814–820. [Google Scholar] [CrossRef] [PubMed]
- Giovannozzi, A.M.; Rolle, F.; Sega, M.; Abete, M.C.; Marchis, D.; Rossi, A.M. Rapid and sensitive detection of melamine in milk with gold nanoparticles by Surface Enhanced Raman Scattering. Food Chem. 2014, 159, 250–256. [Google Scholar] [CrossRef] [PubMed]
- Lv, D.; Cao, Y.; Lou, Z.; Li, S.; Chen, X.; Chai, Y.; Lu, F. Rapid on-site detection of ephedrine and its analogues used as adulterants in slimming dietary supplements by TLC-SERS. Anal. Bioanal. Chem. 2015, 407, 1313–1325. [Google Scholar] [CrossRef] [PubMed]
- Zhang, Y.; Huang, X.; Liu, W.; Cheng, Z.; Chen, C.; Yin, L. Analysis of drugs illegally added into Chinese traditional patent medicine using surface-enhanced Raman scattering. Anal. Sci. 2013, 29, 985–990. [Google Scholar] [CrossRef] [PubMed]
- Li, J.-L.; Sun, D.-W.; Pu, H.; Jayas, D.S. Determination of trace thiophanate-methyl and its metabolite carbendazim with teratogenic risk in red bell pepper (Capsicumannuum L.) by surface-enhanced Raman imaging technique. Food Chem. 2017, 218, 543–552. [Google Scholar] [CrossRef] [PubMed]
- Ye, J.; Wen, F.; Sobhani, H.; Lassiter, J.B.; Dorpe, P.V.; Nordlander, P.; Halas, N.J. Plasmonic nanoclusters: Near field properties of the Fano resonance interrogated with SERS. Nano Lett. 2012, 12, 1660–1667. [Google Scholar] [CrossRef] [PubMed]
- Yao, Y.; Zhou, Y.; Dai, J.; Yue, S.; Xue, M. Host–guest recognition-induced color change of water-soluble pillar[5]arene modified silver nanoparticles for visual detection of spermine analogues. Chem. Commun. 2014, 50, 869–871. [Google Scholar] [CrossRef] [PubMed]
- Huang, J.; Zhang, L.; Chen, B.; Ji, N.; Chen, F.; Zhang, Y.; Zhang, Z. Nanocomposites of size-controlled gold nanoparticles and graphene oxide: Formation and applications in SERS and catalysis. Nanoscale 2010, 2, 2733–2738. [Google Scholar] [CrossRef] [PubMed]
- Vigderman, L.; Zubarev, E.R. Starfruit-shaped gold nanorods and nanowires: Synthesis and SERS characterization. Langmuir 2012, 28, 9034–9040. [Google Scholar] [CrossRef] [PubMed]
- Polavarapu, L.; Liz-Marzán, L.M. Towards low-cost flexible substrates for nanoplasmonic sensing. Phys. Chem. Chem. Phys. 2013, 15, 5288–5300. [Google Scholar] [CrossRef] [PubMed]
- Chirumamilla, M.; Toma, A.; Gopalakrishnan, A.; Das, G.; Zaccaria, R.P.; Krahne, R.; Rondanina, E.; Leoncini, M.; Liberale, C.; De Angelis, F.; et al. 3D Nanostar Dimers with a Sub-10-nm Gap for Single-/Few-Molecule Surface-Enhanced Raman Scattering. Adv. Mater. 2014, 26, 2353–2358. [Google Scholar] [CrossRef] [PubMed]
- Ouyang, L.; Zhu, L.; Jiang, J.; Xie, W.; Tang, H. Three-dimensional plasmonic hydrogel architecture: Facile synthesis and its macroscale effective space. RSC Adv. 2015, 5, 2231–2238. [Google Scholar] [CrossRef]
- Zheng, H.; Ni, D.; Yu, Z.; Liang, P. Preparation of SERS-active substrates based on graphene oxide/silver nanocomposites for rapid zdetection of l-Theanine. Food Chem. 2017, 217, 511–516. [Google Scholar] [CrossRef] [PubMed]
- Hwang, Y.Y.; Shin, D.C.; Nam, Y.S.; Cho, B.-K. Characterization, stability, and pharmacokinetics of sibutramine/β-cyclodextrin inclusion complex. J. Ind. Eng. Chem. 2012, 18, 1412–1417. [Google Scholar] [CrossRef]
- Lee, Y.-J.; Choi, S.; Lee, J.; Nguyen, N.T.; Lee, K.; Kang, J.S.; Mar, W.; Kim, K.H. Chiral discrimination of sibutramine enantiomers by capillary electrophoresis and proton nuclear magnetic resonance spectroscopy. Arch. Pharm. Res. 2012, 35, 671–681. [Google Scholar] [CrossRef] [PubMed]
- Wang, J.; Kong, L.; Guo, Z.; Xu, J.; Liu, J. Synthesis of novel decorated one-dimensional gold nanoparticle and its application in ultrasensitive detection of insecticide. J. Mater. Chem. 2010, 20, 5271–5279. [Google Scholar] [CrossRef]
- Kochkar, H.; Aouine, M.; Ghorbel, A.; Berhault, G. Shape-controlled synthesis of silver and palladium nanoparticles using β-cyclodextrin. J. Phys. Chem. C 2011, 115, 11364–11373. [Google Scholar] [CrossRef]
- Maluf, D.F.; Farago, P.V.; Barreira, S.M.; Pontarolo, R. Comparative Study on Dissolution Profiles of Sibutramine Hydrochloride Monohydrate from Commercial Capsules. Lat. Am. J. Pharm. 2009, 28, 723–727. [Google Scholar]
- Ouyang, L.; Zhu, L.; Ruan, Y.; Tang, H. Preparation of a native β-cyclodextrin modified plasmonic hydrogel substrate and its use as a surface-enhanced Raman scattering scaffold for antibiotics identification. J. Mater. Chem. C 2015, 3, 7575–7582. [Google Scholar] [CrossRef]
- Kelly, K.L.; Coronado, E.; Zhao, L.L.; Schatz, G.C. The optical properties of metal nanoparticles: The influence of size, shape, and dielectric environment. J. Phys. Chem. B 2003, 107, 668–677. [Google Scholar] [CrossRef]
- Stamplecoskie, K.G.; Scaiano, J.C.; Tiwari, V.S.; Anis, H. Optimal size of silver nanoparticles for surface-enhanced Raman spectroscopy. J. Phys. Chem. C 2011, 115, 1403–1409. [Google Scholar] [CrossRef]
- Huang, T.; Meng, F.; Qi, L. Facile synthesis and one-dimensional assembly of cyclodextrin-capped gold nanoparticles and their applications in catalysis and surface-enhanced Raman scattering. J. Phys. Chem. C 2009, 113, 13636–13642. [Google Scholar] [CrossRef]
- Pande, S.; Ghosh, S.K.; Praharaj, S.; Panigrahi, S.; Basu, S.; Jana, S.; Pal, A.; Tsukuda, T.; Pal, T. Synthesis of normal and inverted gold-silver core-shell architectures in β-Cyclodextrin and their applications in SERS. J. Phys. Chem. C 2007, 111, 10806–10813. [Google Scholar] [CrossRef]
- Vaitkus, R.; Grincienė, G.; Norkus, E. Peculiarities of β-cyclodextrin acid hydrolysis. Chemija 2008, 19, 48–51. [Google Scholar]


| ms/mg | ma/mg | md/mg | ω%/SERS | ϖ%/SERS | RSD% | ϖ%/HPLC |
|---|---|---|---|---|---|---|
| 0.504 | 0.400 | 0.885 | 97.9 | 96.7 | 4.1 | 99.3 |
| 0.502 | 0.400 | 0.860 | 95.4 | |||
| 0.523 | 0.500 | 1.119 | 109.4 | 103.7 | 98.9 | |
| 0.582 | 0.500 | 1.060 | 98.0 | |||
| 0.528 | 0.600 | 1.089 | 96.6 | 104.2 | 100.2 | |
| 0.471 | 0.600 | 1.196 | 111.7 |
| Samples | Theoretical/mg | Detection/mg | ω%/SERS | ϖ%/SERS |
|---|---|---|---|---|
| 1 | 0.500 | 0.473 | 94.9 | 99.5 |
| 0.500 | 0.548 | 109.6 | ||
| 0.500 | 0.470 | 94.1 | ||
| 2 | 0.500 | 0.467 | 93.3 | 93.8 |
| 0.500 | 0.489 | 97.9 | ||
| 0.500 | 0.452 | 90.3 | ||
| 3 | 0.500 | 0.471 | 94.1 | 96.3 |
| 0.500 | 0.468 | 93.5 | ||
| 0.500 | 0.507 | 101.3 | ||
| 4 | 0.500 | 0.483 | 96.6 | 101.1 |
| 0.500 | 0.483 | 96.7 | ||
| 0.500 | 0.548 | 109.5 | ||
| 5 | 0.500 | 0.549 | 109.8 | 104.8 |
| 0.500 | 0.507 | 101.3 | ||
| 0.500 | 0.516 | 103.1 | ||
| 6 | 0.500 | 0.484 | 96.8 | 95.6 |
| 0.500 | 0.486 | 97.1 | ||
| 0.500 | 0.466 | 93.1 |
© 2017 by the authors. Licensee MDPI, Basel, Switzerland. This article is an open access article distributed under the terms and conditions of the Creative Commons Attribution (CC BY) license (http://creativecommons.org/licenses/by/4.0/).
Share and Cite
Ouyang, L.; Jiang, Z.; Wang, N.; Zhu, L.; Tang, H. Rapid Surface Enhanced Raman Scattering (SERS) Detection of Sibutramine Hydrochloride in Pharmaceutical Capsules with a β-Cyclodextrin- Ag/Polyvivnyl Alcohol Hydrogel Substrate. Sensors 2017, 17, 1601. https://doi.org/10.3390/s17071601
Ouyang L, Jiang Z, Wang N, Zhu L, Tang H. Rapid Surface Enhanced Raman Scattering (SERS) Detection of Sibutramine Hydrochloride in Pharmaceutical Capsules with a β-Cyclodextrin- Ag/Polyvivnyl Alcohol Hydrogel Substrate. Sensors. 2017; 17(7):1601. https://doi.org/10.3390/s17071601
Chicago/Turabian StyleOuyang, Lei, Zuyan Jiang, Nan Wang, Lihua Zhu, and Heqing Tang. 2017. "Rapid Surface Enhanced Raman Scattering (SERS) Detection of Sibutramine Hydrochloride in Pharmaceutical Capsules with a β-Cyclodextrin- Ag/Polyvivnyl Alcohol Hydrogel Substrate" Sensors 17, no. 7: 1601. https://doi.org/10.3390/s17071601