Article

Seasonal Mass Changes and Crustal Vertical Deformations Constrained by GPS and GRACE in Northeastern Tibet

1
School of Geodesy and Geomatics, Wuhan University, Wuhan 430079, China
2
State Key Laboratory of Information Engineering in Surveying, Mapping and Remote Sensing, Wuhan University, Wuhan 430079, China
3
Department of Civil Engineering, National Chiao Tung University, Hsinchu 300, Taiwan
4
School of Land Resources and Surveying, Guangxi Teachers Education University, Nanning 530001, China
*
Author to whom correspondence should be addressed.
Sensors 2016, 16(8), 1211; https://doi.org/10.3390/s16081211
Submission received: 30 May 2016 / Revised: 9 July 2016 / Accepted: 28 July 2016 / Published: 2 August 2016
(This article belongs to the Section Remote Sensors)

Abstract

:
Surface vertical deformation includes the Earth’s elastic response to mass loading on or near the surface. Continuous Global Positioning System (CGPS) stations record such deformations to estimate seasonal and secular mass changes. We used 41 CGPS stations to construct a time series of coordinate changes, which are decomposed by empirical orthogonal functions (EOFs), in northeastern Tibet. The first common mode shows clear seasonal changes, indicating seasonal surface mass re-distribution around northeastern Tibet. The GPS-derived result is then assessed in terms of the mass changes observed in northeastern Tibet. The GPS-derived common mode vertical change and the stacked Gravity Recovery and Climate Experiment (GRACE) mass change are consistent, suggesting that the seasonal surface mass variation is caused by changes in the hydrological, atmospheric and non-tidal ocean loads. The annual peak-to-peak surface mass changes derived from GPS and GRACE results show seasonal oscillations in mass loads, and the corresponding amplitudes are between 3 and 35 mm/year. There is an apparent gradually increasing gravity between 0.1 and 0.9 μGal/year in northeast Tibet. Crustal vertical deformation is determined after eliminating the surface load effects from GRACE, without considering Glacial Isostatic Adjustment (GIA) contribution. It reveals crustal uplift around northeastern Tibet from the corrected GPS vertical velocity. The unusual uplift of the Longmen Shan fault indicates tectonically sophisticated processes in northeastern Tibet.

Graphical Abstract

1. Introduction

Mass changes in and around the Tibet Plateau represent a hot researched and complicated issue in the geophysical and Earth science communities because of the crustal motion, geological structures, and seasonal fluctuations of surface deformation. The ongoing underthrusting of the Indian plate beneath the Eurasian plate not only uplifted the Himalayas, the highest mountains in the world, but also produced hundreds of fault zones in and around the boundaries of the Tibetan Plateau [1,2]. These rapid tectonic movements could be related to the current orogenesis caused by India–Eurasia collision or flow in the asthenosphere related to the absolute motion of Eurasia [3]. Evidence suggests that the Indian crust retains its strength as it underthrusts the plateau [4]. However, how the crustal vertical deformation varies and the mechanism of underlying material changes in and around the Tibetan Plateau remains unclear.
Present-day Global Positioning System (GPS)-derived horizontal velocities indicate that the Asian mainland plate is rotating clockwise and that the Indian plate is pushing the Eurasian plate along the Himalayas in the NNE direction, causing the Eastern Himalayan Syntaxis to rotate clockwise and resulting in a fan-like front at the southeast corner of the plateau [2,5,6,7,8]. Most studies have focused on the horizontal crustal motion in and around Tibet. However, due to the limited resolutions and accuracies in the geophysical corrections of GPS-derived vertical deformation, GPS vertical velocity estimations can still be improved. Moreover, vertical deformation determination from satellite observations, such as GPS, the Gravity Recovery and Climate Experiment (GRACE) and other types of measurements, remains challenging.
In addition, seasonal mass cycles are evident around the high mountains of Tibet. In the past few years, strong seasonal fluctuations were observed by GPS and GRACE in the southern Tibetan Plateau and Nepal [9,10,11], with peak-to-peak hydrological mass variations on or near the Earth’s surface. In this study, we focus on the crustal vertical deformation in northeastern Tibet and combine GPS and GRACE observations. Comparing the annual and semi-annual amplitudes of GPS-observed and GRACE-derived seasonal displacements reveals consistent correlations. The strong seasonal consistency between GPS and GRACE will help to revise the GPS processing strategies and determine the causes of the increasing mass in northeastern Tibet.

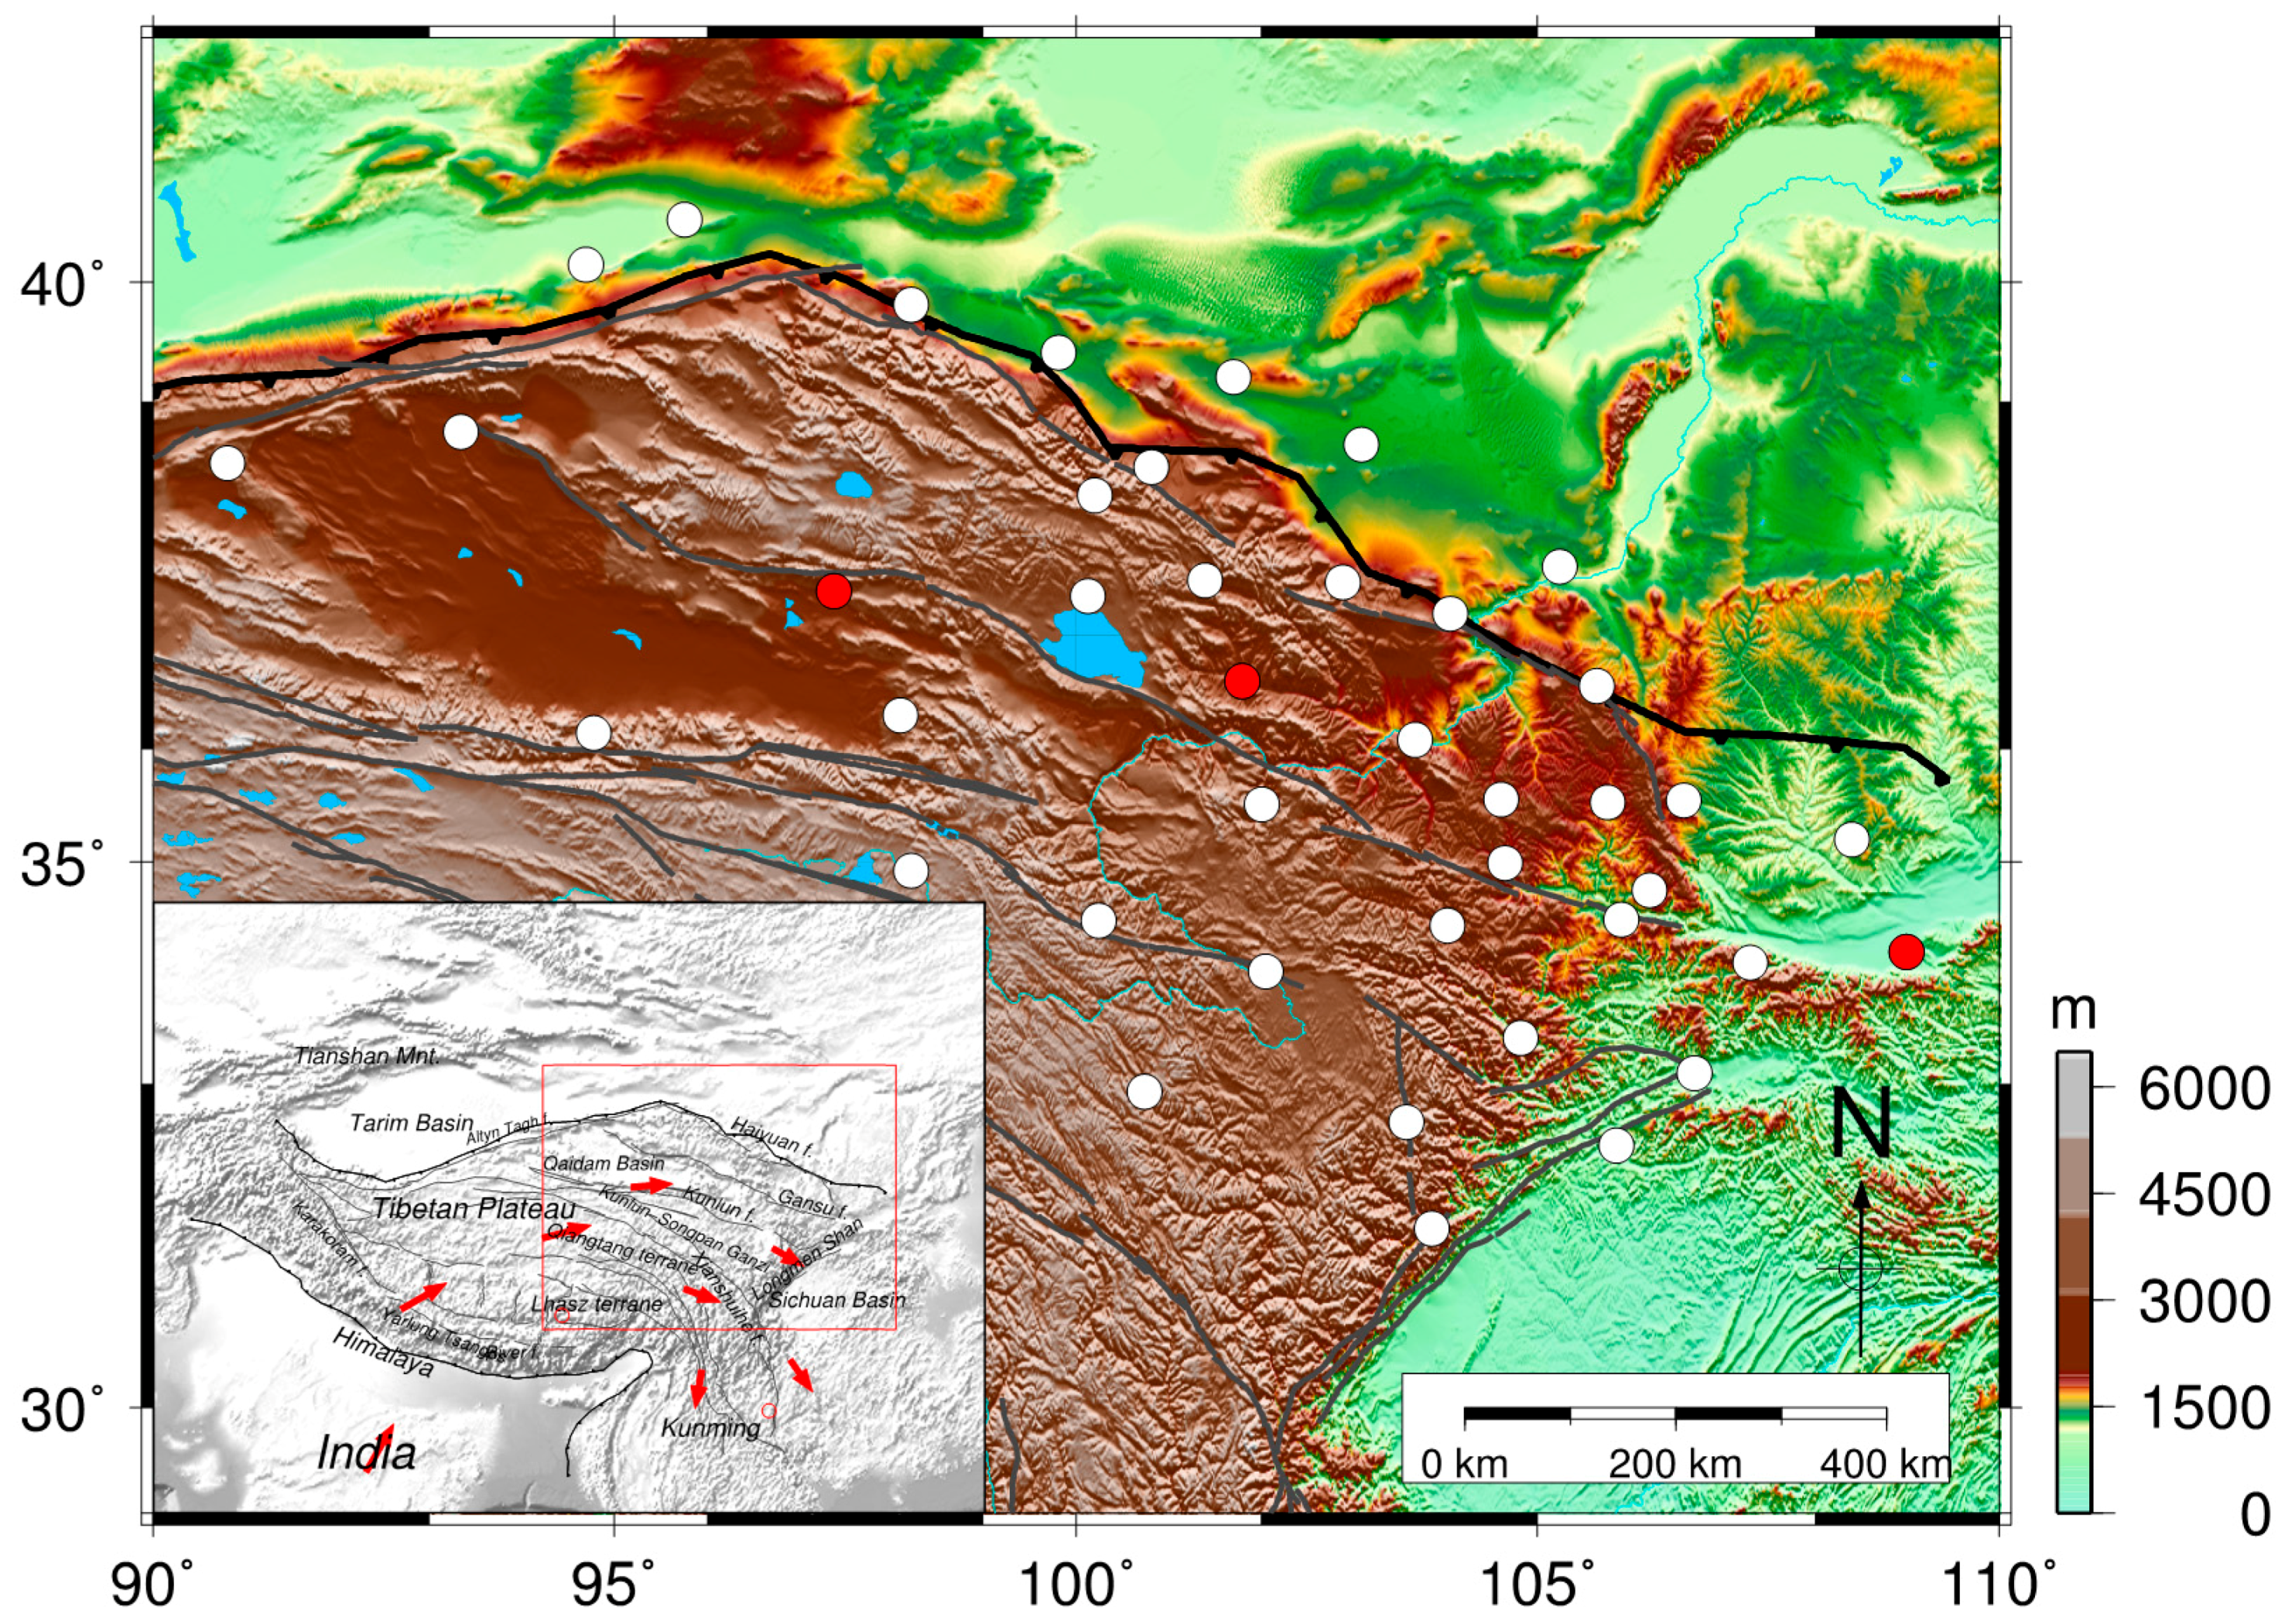
2. GPS and GRACE Observations

GPS observes the 3D velocity in northeast Tibet. Nevertheless, crustal deformation should be corrected by surface loading effects, especially the vertical deformation. As a remote sensing technique, GRACE satellite gravimetry can observe the large-scale earth surface mass changes reported as equivalent water height [12,13]. Here, GRACE-derived surface mass loads will be used for GPS loading effects correction. Data processing procedures of GPS and GRACE are as shown in Figure 1, and detailed procedures can be found in the following sections.

2.1. GPS Dataset and Data Processing

We used data from 41 continuous GPS (CGPS) stations (Figure 2) in the Crustal Movement Observation Network of China (CMONOC) to determine the crustal vertical deformations. Among the 41 stations, 38 have daily records for 2010–present, and three have records for 1999–present. For all CGPS stations, the record lengths exceed three years. Table 1 lists the names, geodetic latitudes and longitudes of these stations. The three-dimensional (3D) velocities derived from GPS are also given in Table 1 and will be discussed below.
We processed data from the 41 CGPSs using GAMIT/GLOBK software (version 10.40, Manufacturer, Cambridge, MA, US) [14,15] following the GPS-processing procedure described by Dong et al. [16]. The network of stations involved in this study was analyzed by tying the Earth orientation parameter (EOP) to the International Global Navigation Satellite System (GNSS) Service (IGS) orbit via phase ambiguity resolution. The Global Mapping Function (GMF) was chosen for the tropospheric mapping function and tropospheric gradients, and we used a prior dry tropospheric delay value from the Global Pressure and Temperature (GPT) model. The finite element solutions 2004 (FES2004) model with elastic Green’s Functions [17] in the reference frame of the center of mass (CM) of the whole Earth system was used to correct for ocean tides and ocean tide loading. We applied International Earth Rotation and Reference Systems (IERS) 2010 conventions to correct the tidal solid Earth and pole tides.
Loose constraints were assigned to the coordinates of each station included in the processing and to the model terms. Once the individual network solutions were obtained, the daily solutions were combined with the GLOBK software [15]. The loosely constrained solution of the complete network was then aligned by a weighted six-parameter transformation (three translation and three rotation parameters) into the 2008 International Terrestrial Reference System (ITRF2008) reference frame [18] using the coordinates and velocities of six nearby IGS stations (URUM, SHAO, LHAZ, HYDE, BJFS and KUMN), the IGS service website, and the Scripps Orbital and Position Analysis Center (SOPAC). The daily position time series of each station in the ITRF2008 reference frame was subsequently analyzed to estimate the three components of the velocity vector, the associated uncertainties and the characteristics of the time series.
The time series of all GPS sites were preprocessed to estimate the vertical velocity field. Regional GPS network common mode errors (CMEs) were removed from the GPS time series analysis using the Quali-Observation Combination Analysis (QOCA) principal component analysis (PCA) program [19,20,21]. The final slope rates were estimated by a maximum likelihood estimation (MLE) using CATS software (version, Manufacturer, Liverpool, UK) to maximize the likelihood of the observed data, including the annual and semi-annual rates, and other noises [22,23]. We use the MLE to estimate the flicker and white noise in each time series and assess their vertical velocities and uncertainties, and the final corrected rates are achieved by the GPS-derived vertical velocities subtracting the GRACE-derived uplift rates. The results are listed in Table 1.

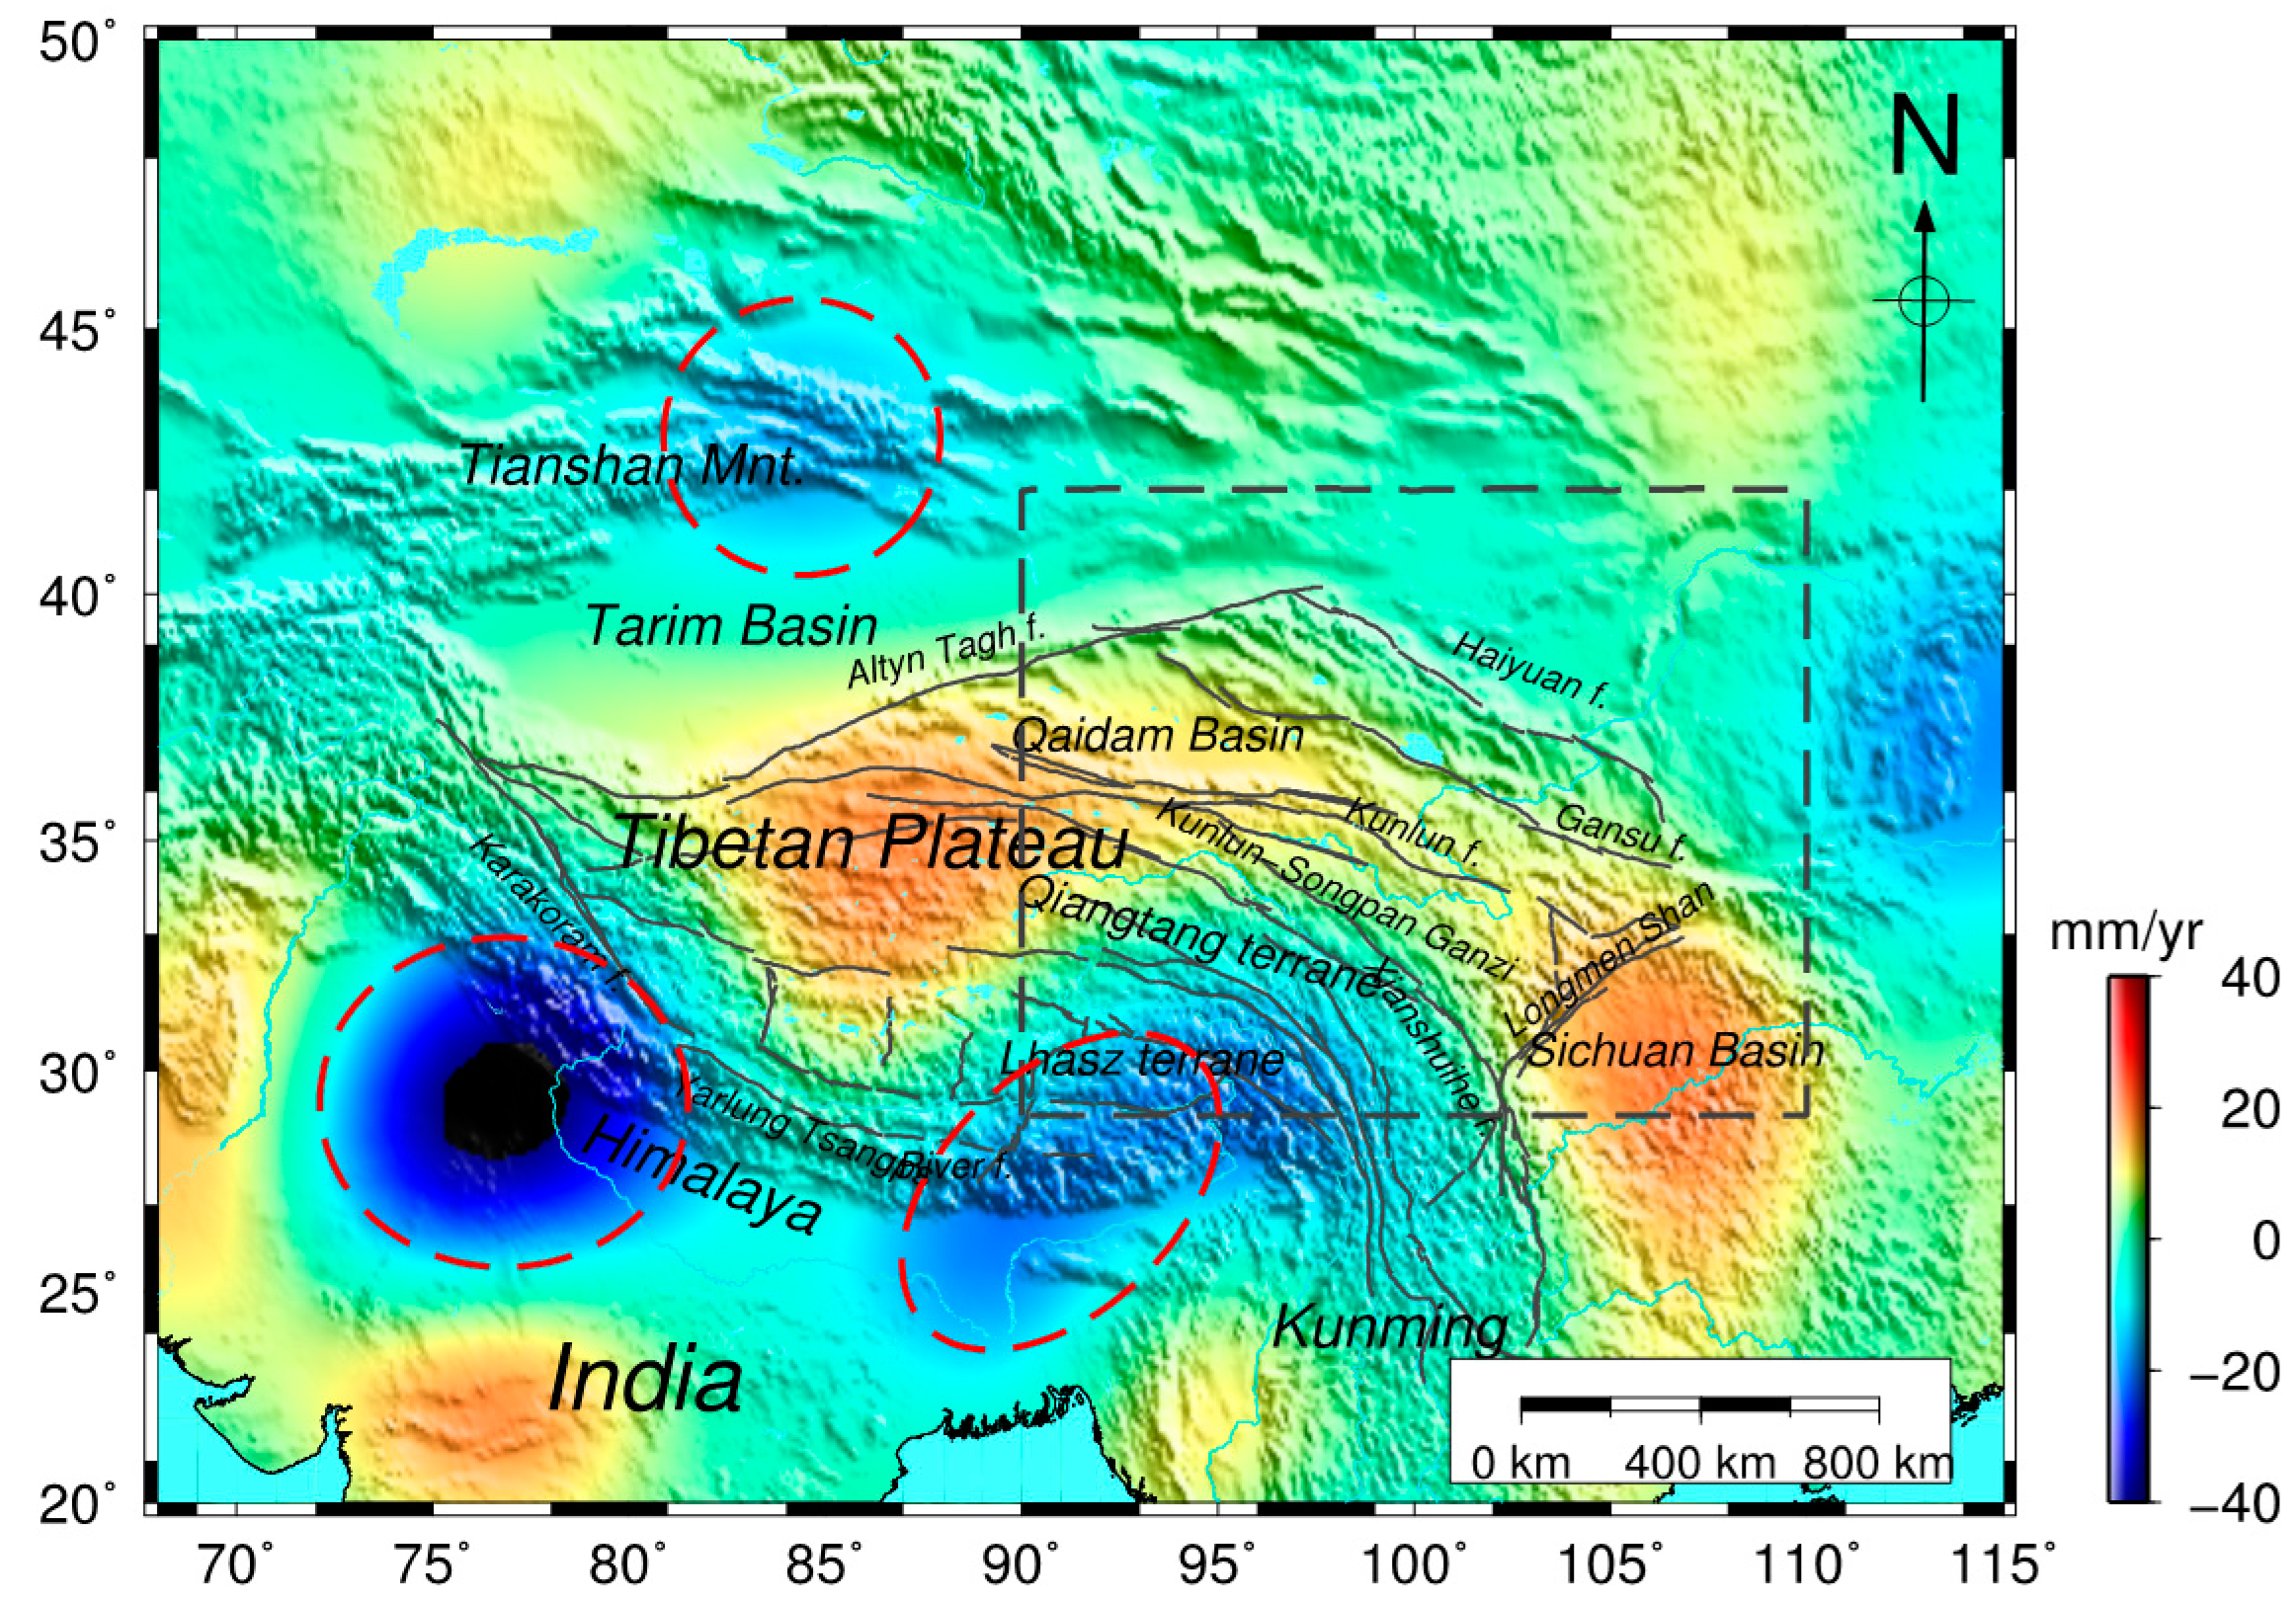
2.2. GRACE Data for Mass Changes around Tibet

Mass changes deform the Earth’s surface because the Earth is an elastic body [24]. Hydrology, the atmosphere and non-tidal ocean loads contribute to this deformation, especially the vertical elastic deformation. Here, we chose the new GRACE products Level-2 Release 05 (RL5) from the Center for Space Research (CSR) of the University of Texas for the mass change and gravity computations [25]. Spherical harmonic coefficients up to degree and order 60 for the gravity field are provided monthly from April 2002 to November 2014. Because lower degree coefficients have large uncertainty, we use the result of C20 (the gravity harmonic coefficients in the degree 2 order 0), which is well constrained by the new Satellite Laser Ranging (SLR) observations [26] and the degree-1 coefficients given by Swenson et al. [27].
According to previous research works, the surface equivalent water height (EWH) can be expressed in terms of the Stokes coefficients as [28,29]:
Δ σ ( ϕ , θ ) = a ρ e 3 ρ w n = 0 ( 2 n + 1 1 + k n ) m = 0 n { [ Δ C n m cos ( m ϕ ) + Δ S n m sin ( m ϕ ) ] P ¯ n m ( cos θ ) }
where ρe and ρw are the average density of the whole Earth and the density of water (1 g/cm3), respectively; a is the equatorial radius; Kn is load Love number of degree n; ϕ is the latitude; θ is the colatitude; and Δ C n m and Δ S n m are monthly Stokes coefficients. P ¯ n m ( cos θ ) is the fully normalized Legendre function of degree n and order m.
The results of EWH secular variations in and around the Tibetan Plateau and the seasonal changes in northeastern Tibet are given in Section 3.1 based on the GRACE-derived time series processing.

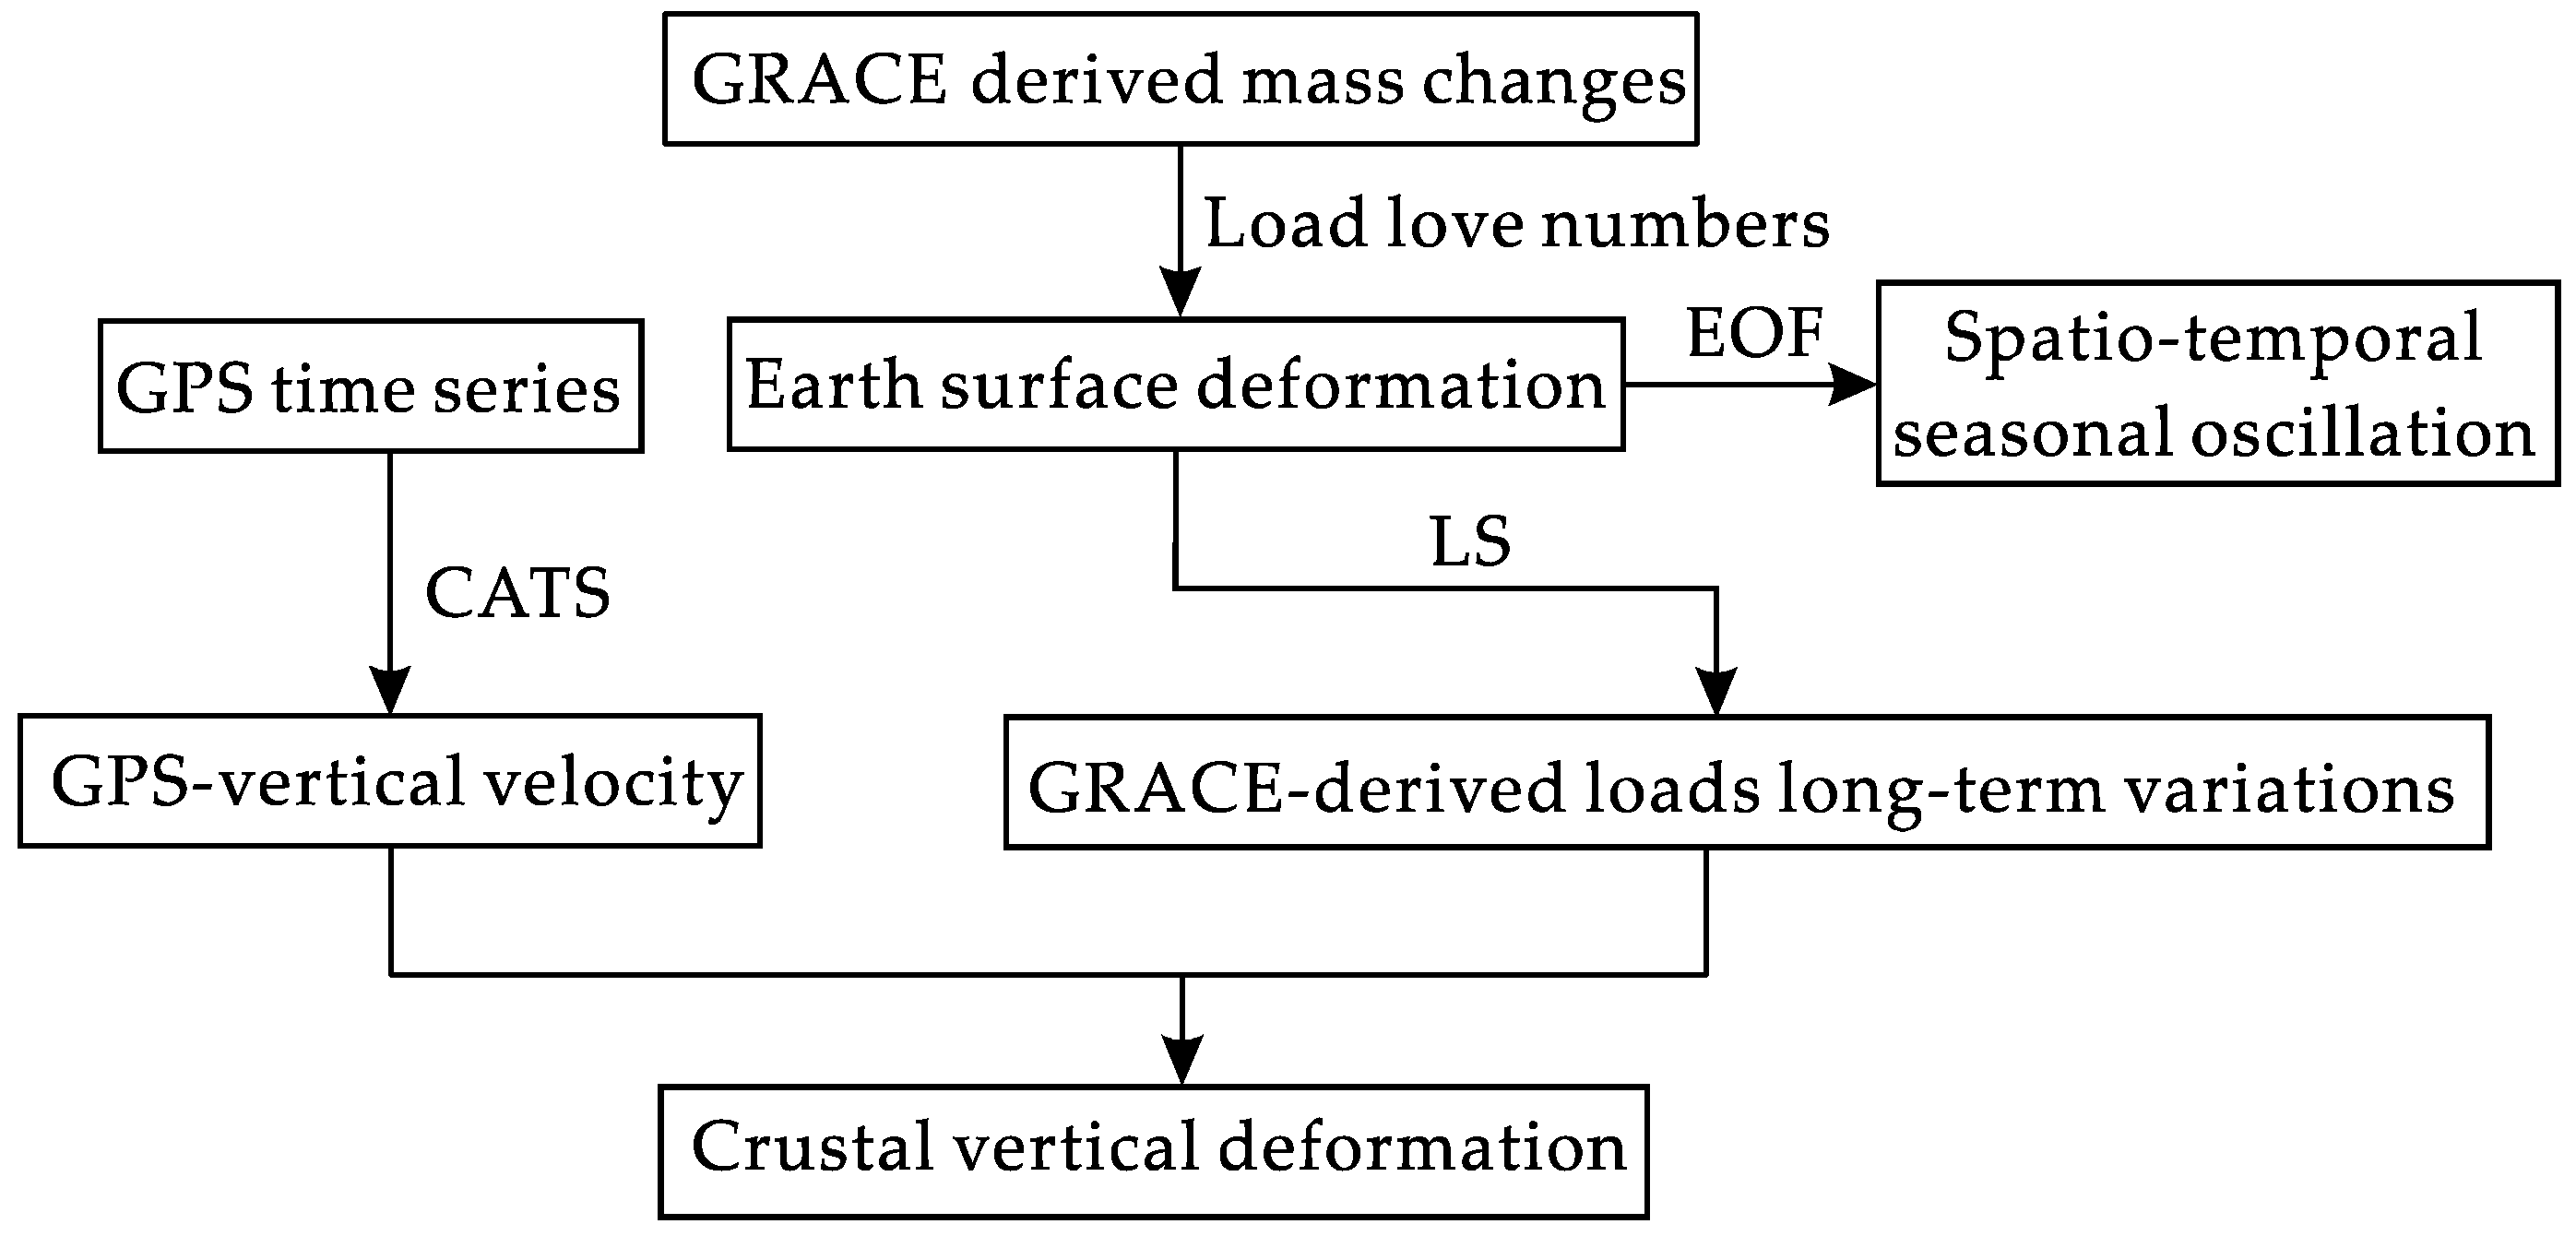
3. Data Analysis Methods

3.1. GRACE-Derived Mass Change Time Series Processing

A 350-km Gaussian smoothing and P4M6 (degree 4 polynomial for order 6 of SH coefficients) de-correlation were performed to de-stripe the noise [30]. We employed a global forward modeling for removing the leakage bias in GRACE-estimated mass changes, and restoring the true magnitudes of the signal, at least on regional average basis due to truncation and spatial filtering [30,31]. GRACE products may be regarded as error free when considering the secular mass change. Further improvement of the floating mass changes could be obtained if the effect of S2 aliasing errors were excluded from the computations from GRACE data. Considering the annual and semi-annual terms and the S2 (tidal aliasing effect) 161-day period, we used least square (LS) analysis to estimate GRACE seasonal signals and trends. The LS model is as follows:
Δ g ˜ = A + B t + i = 1 3 C i cos ( ω i t + φ i )
where A and B are the constant and linear trend terms; and Ci, ωi and φ i (i = 1, 2, 3) are the amplitude, frequency and phase of annual, semi-annual and S2 signals, respectively.
The mass changes, including soil, snow/ice and lakes are the main contributions to the GRACE-derived hydrology variations. The background shows the mass change of the EWH secular trend obtained from CSR RL05 in and around Tibet, as shown in Figure 3. The GRACE-derived mass change consists mainly of four strong signals in Tibet. The two secular variations south of Tibet show mass loss because of water resource depletion and ice melt in northern India and the Eastern Himalayas, as suggested by previous studies [10,32,33,34]. Additionally, the mass loss in Tianshan indicates that the area experiences ice melting [11]. However, few studies have focused on the mass change in northeastern Tibet using GRACE observations. Our results, as shown in Figure 3, suggest strong secular mass increase in the northeast region of Tibet.
We focus on the mass changes and crustal deformation in northeastern Tibet and divide the northeast region into elements for analysis. The amplitudes of seasonal oscillations observed by GRACE show peak-to-peak mass variations, and the corresponding signal magnitudes are between 3 and 35 mm/year in northeastern Tibet (Figure 4). These hydrological mass changes give rise to the seasonal oscillations of the Earth’s surface.

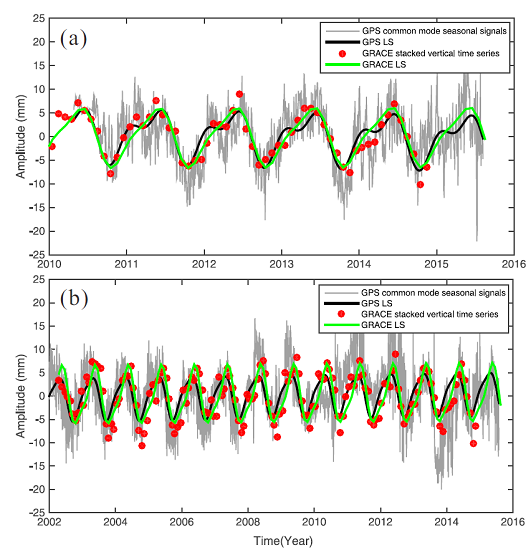
3.2. Empirical Orthogonal Function (EOF) Analysis of GPS Common Mode Seasonal Signals

The seasonal coordinate oscillations derived from GPS observations are largely due to surface loadings of hydrological, atmospheric and non-tidal oceanic origins [24,35,36,37]. When estimating the vertical crustal deformations by GPS, the coherence between the seasonal oscillations derived from GPS and GRACE must be evaluated. Here, this evaluation was based on the EOF, which detects the common mode seasonal oscillations in three coordinate components at the CGPS stations. As a PCA (Principal Component Analysis), the EOF analysis decomposes the coherent spatio-temporal variability of a time-variable field into a linear combination of orthogonal “modes” of standing oscillation [21,38]. The detailed theory and procedure of the EOF algorithm are described in Dong et al. [21]. Here, we briefly summarize the main procedures as follows:
  • Construct a data matrix, D, containing all of the GPS time series data in the selected region and time span targeted for seasonal signals.
  • Compute the covariance matrix, R, based on R = 1 N 1 D D T , where N is the number of observations.
  • Diagonalize the eigenvalues and eigenvectors of R, RK = , where Λ is a diagonal matrix containing the eigenvalues λi of R, and K consists of the eigenvectors ki of R in the form of column vectors.
  • Decompose the data matrix into different orthogonal “modes of variability” by arranging the eigenvectors in descending order of eigenvalues.
  • Obtain the principal components (PCs).
The PCs represent the dominant time-variations, and the eigenvectors represent the corresponding spatial responses to the PCs of all CGPS sites. The variance is defined by the eigenvalue of each mode. The eigenvalues indicate the amounts of variance explained by each eigenvector. The sum of all of the eigenvalues equals the total variance in the original data. The first EOF is defined as that accounting for the maximum amount of variance in the dataset [39].
Higher-order PCs are usually related to local or individual site effects. That is, the first few PCs represent the dominant contributors to the variability in all time series in the network and usually arise from the same origins. Figure 5 shows the common seasonal signals from the EOF at all of the GPS sites. The EOF results are described and analyzed in Section 4.1. The first few PCs represent the largest contributors to the variance in the network residual time series and are usually related to the common source time function.

4. Results and Discussion

4.1. Seasonal Oscillations around Northeastern Tibet

Continental water-storage changes alter the surface loading and lead to surface deformations dominated by annual oscillations [40]. GPS may detect strong seasonal surface deformations in northeastern Tibet (Figure 5). To estimate the seasonal surface deformation due to the mass load effect, we use the CSR-provided De-aliasing Level-1B (AOD1B) solution (GAC products) and the monthly Stokes coefficient GSM (GRACE Satellite only Model) to compute the whole surface vertical loads, including the hydrological, atmospheric and non-tidal ocean loads. The products were applied to the elastic displacement caused by the changing surface mass loads [41]:
Δ h ( θ , ϕ ) = R l = 1 m = 0 l P ¯ l m ( cos θ ) [ C l m cos ( m ϕ ) + S l m sin ( m ϕ ) ] h l ' 1 + k l '
where R is the Earth’s radius; P ¯ l m is the fully normalized Legendre function for degree l and order m; C l m and S l m are the spherical harmonic coefficients of the gravity field; h l ' and k l ' are adopted load Love numbers provided by Farrell [17] and computed relative to the CM of solid Earth [9]. In Figure 5, the red dots are the GRACE-derived mass loads (including the hydrological, atmospheric and non-tidal ocean loads) causing surface deformation, which constitute de-trended stacked average loading deformation time series corresponding to GPS site locations.
The GPS and GRACE data series clearly display very similar and consistent seasonal patterns in terms of both the magnitude and the phase. We compute the GPS seasonal variations by LS fitting with annual and semiannual periodic terms and then compare them with the seasonal variations observed by GRACE, as shown in Figure 5. The GPS common mode time series in northeastern Tibet shows significant seasonal variations in which the peak-to-peak amplitude can exceed one centimeter.
Here, we compare the consistency between GPS common mode seasonal signals and GRACE stacked-average seasonal signals. First, we removed the GRACE-derived seasonal vertical deformations from the GPS-observed, de-trended height time series and computed the reductions in the weighted root-mean-squares (WRMS) as follows [9,36,42]:
W R M S r e d u c t i o n = W R M S G P S _ L S W R M S G P S _ L S G R A C E _ L S W R M S G P S _ L S
W R M S = n n 1 i = 1 n ( P i P ) 2 σ i 2 i = 1 n 1 σ i 2
where n is the number of days, P i is the estimate of the component on the i-th day, P is the weighted average of the component estimate over all days, and σ i is the formal error. W R M S r e d u c t i o n = 1.0 indicates perfect agreement between GPS-observed and GRACE-modeled annual plus semiannual displacements.
The WRMS Reduction Ratio of common mode seasonal signals was 0.90 for 38 GPS stations and 0.81 for three long-term GPS stations. The consistency between the GPS common mode signals and GRACE stacked average seasonal signals demonstrates that the seasonal position oscillations in northeastern Tibet are mainly caused by mass loading changes, including the hydrological, atmospheric and non-tidal ocean loads.

4.2. Vertical Crustal Deformation

As an elastic body, the Earth’s surface moves upward in response to a loss in loading and downward as the loading increases. In addition to the evident seasonal oscillations described in Section 4.1, a general subsiding trend was also predicted in northeastern Tibet by the least squares method. It is assumed that Glacial Isostatic Adjustment (GIA) is absent and that all tectonic motions maintain isostatic equilibrium. The secular change in the gravity field is due to the present-day surface mass changes [10], without considering GIA or tectonic processes, such as crustal thickening.
As shown in Figure 6, we compute the GRACE-derived long-term loadings using the trend from the CSR solutions corresponding to all CGPS sites used in this paper. The least squares method is used to estimate the trend rates of all of the sites, while considering the annual and semi-annual signals in calculation. The surface deformation shows a subsidence rate of approximately −0.1 to −0.4 mm/year because of the increased loadings in northeast Tibet. As the mass increases southeastward, the inner rates of the load slopes gradually decrease with increasing mass. However, outside of this region, deformation exerts a weaker effect on the load. The maximum load-induced vertical deformation is approximately −0.4 mm/year in the Longmen Shan fault zone. This is caused by the compression between the Sichuan Basin and the northwest region of Tibet that is increasing in mass.
After removing the GRACE-derived loading effects, we obtained the vertical crustal velocities from GPS that represent the vertical crustal motions of the northeast region of the Tibetan Plateau, as shown in Figure 7a. The corrected vertical crustal deformations show that northeastern Tibet undergoes uplift because of the compression of the bilateral crustal blocks. The active subduction of the north China craton is responsible for crustal depression [43]. The crustal uplift and subsidence are anisotropic in northeastern Tibet. Some regional sites show both uplift and subsidence because of internal tectonic deformation. For example, the northern margin of the Qaidam Basin, which is at the edge of the subduction zone, is uplifted due to the oblique push from the Tarim massif to Tibet. In contrast, the southern boundary undergoes crustal subsidence attributed to the asthenosphere in the basin boundary.
Active faults are often accompanied by complex tectonic movements. The vertical deformation rate in the Longmen Shan active fault zone is 9.468 mm/year, which is the maximum in northeastern Tibet. In Figure 7b, we can quantitatively see the unusual uplift of the Longmen Shan fault zone. From the crustal structure image, Yangtze (e.g., the Sichuan basin) sub-continent crust extends beneath the eastern Tibetan Plateau and it implies the uplift of the Longmen Shan range [44]. The AB profile shows that the terrain height increases dramatically from 1200 m to 4000 m. The Kunlun strike–slip fault shows the negative uplift rates, which indicate that the block is sinking with the movement of internal material of the northeast Tibetan Plateau [45].

4.3. Contribution of Non-Tectonic Processes to Vertical Crustal Deformation

GRACE observations of mass change are limited by poor spatial resolution. The regional mass change will contribute to the earth surface deformation due to mass loading effects. The loading effects (including the atmosphere, non-tidal and hydrology) in northeast Tibet are about −0.1 mm/year to −0.4 mm/year due to the continuous mass increase. Here, we use the interpolation method to obtain the variation of loads deformation in northeast Tibet corresponding to the GPS locations by using GRACE observation. However, the consistency of spatio-temporal GPS and GRACE time series in northeast Tibet indicating the seasonal oscillation is mainly caused by earth surface loading effects.
Scientists have paid close attention to whether the observed crustal uplift may potentially affect the GRACE gravity measurement. Previous studies have reported that the tectonic uplift of the Tibetan Plateau is too slow to severely interrupt the isostatic equilibrium process, and thus, it may exert only a small effect on the gravity change [9,10,46]. GRACE observations indicate that the gravity changes in the northeast region of the Tibetan Plateau are mainly attributable to increasing surface hydrological mass and that those changes can be safely interpreted in terms of surface mass loads [47,48]. However, a likely scenario might be that any broad-scale tectonic uplift would be isostatically compensated by an increasing mass deficiency at depth, with little net effect on gravity and consequently without noticeable contribution to the GRACE results [48]. Therefore, we can ignore the uplifting tectonic impacts on gravity changes in the GRACE measurements.
Royden et al. [49] reported that eastern Tibet has undergone rapid surface uplift and crustal thickening. In this study, Figure 6 and Figure 7a suggest that the mass is increasing gradually, whereas the crust is uplifting in northeastern Tibet. Nevertheless, we obtained the vertical crustal deformation without considering possible effects of GIA, which could contribute to both gravity changes and vertical motion [9]. Whether the loss of the ice sheet of Tibet will lead to significant crustal uplift in this area remains controversial [10,50]. The GIA effect in Xiang et al. [34] was computed based on the ICE-6G_C (VM5a) model [51,52] which was constrained by space geodesy, such as GPS data. Though it is reliable and useful in America and Antarctica, there were no sufficient GPS data in Tibet when they established the ice-age terminal deglaciation. Additionally, the long-term gravity change related to tectonic isostatic equilibrium should be of little consequence to the cryospheric effect. Therefore, we ignored the effect of GIA on gravity changes when we used GRACE data to obtain the mass change. The corrected vertical velocity determined using the GPS and GRACE measurements was solely caused by tectonic movement.
The rapid changes in polar motion since 2005 have resulted in large-scale elastic radial deformations of the Earth in some local regions. Vertical velocities derived from geodetic techniques are affected by rapid changes in polar motions [53,54], which affect the periodic terms rather than the trends of the deformation derived from GPS.

5. Conclusions

Mass changes in Tibet are highly complex. GRACE observations indicate strong seasonal hydrological oscillations of the Earth surface in and around the Tibetan region. The seasonal mass changes will contribute to surface load deformation resulting from redistributions of the fluid mass loads, as observed by CGPS measurements in northeastern Tibet. Comparing the EOF-decomposed common mode seasonal signals and GRACE-derived load stacked average series revealed strong consistency, indicating that the surface mass loads are the main contributors to the surface deformation.
In addition to the dominating seasonal signals, trends in GRACE-derived mass changes are evident and can be attributed to gradual accumulations of crustal materials caused by plate collisions (Figure 6). The subduction of the Indian plate beneath the Eurasian plate and the pushing of the Eurasian Plate along the Himalayas in the NNE direction may have caused the Indian plate to rotate clockwise around the Eastern Himalayan Syntaxis, resulting in a fan-like front at the southeast corner of the Tibet plateau. The GRACE-derived mass changes confirm this clockwise rotation with an increasing mass anomaly towards the southeast (Figure 3). This interesting pattern in the GRACE data warrants thorough investigation, but this is beyond the scope of this study.
The uplift of northeastern Tibet, indicated by GPS after removing the GRACE-derived long-term rate, is due to secular changes in loading of tectonic origin (Figure 7). This uplift might have resulted from the compression of the surrounding crustal blocks, which also causes mass accumulation, as seen in the GRACE-derived mass change. By contrast, sites undergoing subsidence are located along the Qaidam basin boundary, which could be caused by the active subduction of the North China craton. The northeast Tibetan Plateau is still in a growing process due to the Asian lithosphere underthrusting beneath the northeastern Tibetan Plateau.

Acknowledgments

The GPS data used in this paper are primarily from the National Key Scientific Projects “Tectonic and Environmental Observation Network of Mainland China” (CMONOC II). We express our gratitude and thanks to all our Chinese participants in constructing the network and making the GPS measurements. We are grateful to IGS for providing global GPS observations and products and to MIT for providing the GAMIT/GLOBK software. We thank Benjamin Fong Chao for fruitful discussions, which improved the manuscript. We also thank Mengkui Li and Bin Zhao for their guidance regarding GPS data processing and discussion of the results. We also thank Tom G. Farr and two anonymous reviewers for their valuable comments and suggestions, which greatly improved this manuscript. This study is supported by the National 973 Project China (grant Nos. 2013CB733302 and 2013CB733305), the National Natural Science Foundation of China (grant Nos. 41174011, 41429401, 41210006, 41128003, and 41021061) and the Open Research Fund Program of the Key Laboratory of Geospace Environment and Geodesy, Ministry of Education, China (No. 14-02-08).

Author Contributions

All authors contributed significantly to the manuscript. Yuanjin Pan performed all data processing and analyses and contributed to the manuscript draft. Wen-Bin Shen is the main author and initiated the idea, provided critical comments and contributed to the final revision of the paper. Cheinway Hwang and Chaoming Liao provided critical comments about and modification to the manuscript. Tengxu Zhang modified the paper format and performed GPS data processing. Guoqing Zhang provided technical guidance regarding GRACE data processing.

Conflicts of Interest

The authors declare no conflict of interest.

References

  1. Avouac, J.P.; Tapponnier, P. Kinematic model of active deformation in Asia. Geophys. Res. Lett. 1993, 20, 895–898. [Google Scholar] [CrossRef]
  2. Gan, W.; Zhang, P.; Shen, Z.K.; Niu, Z.; Wang, M.; Wan, Y.; Zhou, D.; Cheng, J. Present-day crustal motion within the Tibetan Plateau inferred from GPS measurements. J. Geophys. Res. 2007, 112. [Google Scholar] [CrossRef]
  3. Li, Y.; Wu, Q.; Zhang, F.; Feng, Q.; Zhang, R. Seismic anisotropy of the Northeastern Tibetan Plateau from shear wave splitting analysis. Earth Planet. Sci. Lett. 2011, 304, 147–157. [Google Scholar] [CrossRef]
  4. Copley, A.; Avouac, J.P.; Wernicke, B.P. Evidence for mechanical coupling and strong Indian lower crust beneath southern Tibet. Nature 2011, 472, 79–81. [Google Scholar] [CrossRef] [PubMed]
  5. Wang, Q.; Zhang, P.Z.; Freymueller, J.T.; Bilham, R.; Larson, K.M.; Lai, X.; You, X.; Niu, Z.; Wu, J.; Li, Y.; et al. Present-day crustal deformation in China constrained by Global Positioning System measurements. Science 2001, 294, 574–577. [Google Scholar] [CrossRef] [PubMed]
  6. Zhang, P.Z.; Shen, Z.; Wang, M.; Gan, W.; Burgmann, R.; Molnar, P.; Wang, Q.; Niu, Z.; Sun, J.; Wu, J.; et al. Continuous deformation of the Tibetan Plateau from Global Positioning System data. Geology 2004, 32, 809–812. [Google Scholar] [CrossRef]
  7. Shen, Z.K.; Lu, J.; Wang, M.; Burgmann, R. Contemporary crustal deformation around the southeast borderland of the Tibetan Plateau. J. Geophys. Res. 2005, 110. [Google Scholar] [CrossRef]
  8. Liang, S.; Gan, W.; Shen, C.; Xiao, G.; Liu, J.; Chen, W.; Ding, X.; Zhou, D. Three-dimensional velocity field of present-day crustal motion of the Tibetan Plateau derived from GPS measurements. J. Geophys. Res. Solid Earth 2013, 118, 5722–5732. [Google Scholar] [CrossRef]
  9. Fu, Y.; Freymueller, J. Seasonal and long-term vertical deformation in the Nepal Himalaya constrained by GPS and GRACE measurements. J. Geophys. Res. 2012, 117. [Google Scholar] [CrossRef]
  10. Matsuo, K.; Heki, K. Time-variable ice loss in Asian high mountains from satellite gravimetry. Earth Planet. Sci. Lett. 2010, 290, 30–36. [Google Scholar] [CrossRef]
  11. Yi, S.; Sun, W. Evaluation of glacier changes in high-mountain Asia based on 10 year GRACE RL05 models. J. Geophys. Res. Solid Earth 2014, 119. [Google Scholar] [CrossRef]
  12. Yeh, P.J.F.; Swenson, S.C.; Famiglietti, J.S.; Rodell, M. Remote sensing of groundwater storage changes in Illinois using the gravity recovery and climate experiment (GRACE). Water Resour. Res. 2006, 42. [Google Scholar] [CrossRef]
  13. Swenson, S.; Wahr, J. Post-processing removal of correlated errors in GRACE data. Geophys. Res. Lett. 2006, 33. [Google Scholar] [CrossRef]
  14. Herring, T.; King, R.; McClusky, S. GAMIT/GLOBK Reference Manuals, Release 10.4; Massachussetts Institute of Technology: Cambridge, MA, USA, 2010. [Google Scholar]
  15. Herring, T.; King, R.; McClusky, S. GLOBK Reference Manual. Global Kalman Filter VLBI and GPS Analysis Program. Release 10.4; Massachussetts Institute of Technology: Cambridge, MA, USA, 2010. [Google Scholar]
  16. Dong, D.; Herring, T.A.; King, R.W. Estimating regional deformation from a combination of space and terrestrial geodetic data. J. Geod. 1998, 72, 200–214. [Google Scholar] [CrossRef]
  17. Farrell, W.E. Deformation of the earth by surface loads. Rev. Geophys. 1972, 10, 761–797. [Google Scholar] [CrossRef]
  18. Altamimi, Z.; Collilieux, X.; Métivier, L. ITRF2008: An improved solution of the international terrestrial reference frame. J. Geod. 2011, 85, 457–473. [Google Scholar] [CrossRef] [Green Version]
  19. Mao, A.; Harrison, C.G.A.; Dixon, T.H. Noise in GPS coordinate time series. J. Geophys. Res. 1999, 104, 2797–2816. [Google Scholar] [CrossRef]
  20. Wdowinski, S.; Bock, Y.; Zhang, J.; Fang, P.; Genrich, J. Southern California permanent GPS geodetic array: Spatial filtering of daily positions for estimating coseismic and postseismic displacements induced by the 1992 Landers earthquake. J. Geophys. Res. 1997, 102, 18057–18070. [Google Scholar] [CrossRef]
  21. Dong, D.; Fang, P.; Bock, Y.; Webb, F.; Prawirodirdjo, L.; Kedar, S.; Jamason, P. Spatiotemporal filtering using principal component analysis and Karhunen-Loeve expansion approaches for regional GPS network analysis. J. Geophys. Res. Solid Earth 2006, 111, 1978–2012. [Google Scholar] [CrossRef]
  22. Williams, S.D.P. The effect of coloured noise on the uncertainties of rates estimated from geodetic time series. J. Geod. 2003, 76, 483–494. [Google Scholar] [CrossRef]
  23. Williams, S.D.P.; Bock, Y.; Fang, P.; Jamason, P.; Nikolaidis, R.M.; Prawirodirdjo, L.; Miller, M.; Johnson, D.J. Error analysis of continuous GPS position time series. J. Geophys. Res. 2004, 109. [Google Scholar] [CrossRef]
  24. Blewitt, G.; Lavalle, D.; Clarke, P.; Nurudinov, K. A new global model of Earth deformation: Seasonal cycle detected. Science 2001, 294, 2342–2345. [Google Scholar] [CrossRef] [PubMed]
  25. Bettadpur, S. Insights into the earth system mass variability from CSR-RL05 GRACE gravity fields. In Proceedings of the EGU General Assembly 2012, Vienna, Austria, 22–27 April 2012.
  26. Cheng, M.K.; Tapley, B.D.; Ries, J.C. Deceleration in the Earth’s oblateness. J. Geophys. Res. 2013, 118, 1–8. [Google Scholar] [CrossRef]
  27. Swenson, S.; Chambers, D.; Wahr, J. Estimating geocenter variations from a combination of GRACE and ocean model output. J. Geophys. Res. 2008, 113. [Google Scholar] [CrossRef]
  28. Wahr, J.; Molenaar, M.; Bryan, F. Time variability of the Earth’s gravity field: Hydrological and oceanic effects and their possible detection using GRACE. J. Geophys. Res. 1998, 103, 30205–30229. [Google Scholar] [CrossRef]
  29. Swenson, S.; Wahr, J. Methods for inferring regional surface-mass anomalies from Gravity Recovery and Climate Experiment (GRACE) measurements of time-variable gravity. J. Geophys. Res. Solid Earth 2002, 107. [Google Scholar] [CrossRef]
  30. Chen, J.L.; Li, J.; Zhang, Z.Z.; Ni, S.N. Long-term groundwater variations in northwest India from satellite gravity measurements. Glob. Planet. Chang. 2014, 116, 130–138. [Google Scholar] [CrossRef]
  31. Chen, J.L.; Wilson, C.R.; Li, J.; Zhang, Z.Z. Reducing leakage error in GRACE-observed long-term ice mass change: A case study in West Antarctica. J. Geod. 2015, 89, 925–940. [Google Scholar] [CrossRef]
  32. Rodell, M.; Velicogna, I.; Famiglietti, J.S. Satellite-based estimates of groundwater depletion in India. Nature 2009, 460, 999–1002. [Google Scholar] [CrossRef] [PubMed]
  33. Jacob, T.; Wahr, J.; Pfeffer, W.T.; Swenson, S. Recent contributions of glaciers and ice caps to sea level rise. Nature 2012, 482, 514–518. [Google Scholar] [CrossRef] [PubMed]
  34. Xiang, L.; Wang, H.; Steffen, H.; Wu, P.; Jia, L.; Jiang, L.; Shen, Q. Groundwater storage changes in the Tibetan Plateau and adjacent areas revealed from GRACE satellite gravity data. Earth Planet. Sci. Lett. 2016, 449, 228–239. [Google Scholar] [CrossRef] [Green Version]
  35. Blewitt, G.; Lavallée, D. Effect of annual signals on geodetic velocity. J. Geophys. Res. 2002, 107. [Google Scholar] [CrossRef]
  36. Pan, Y.J.; Shen, W.B.; Ding, H.; Hwang, C.; Li, J.; Zhang, T.X. The quasi-biennial vertical oscillations at global GPS stations: identification by ensemble empirical mode decomposition. Sensors 2015, 15, 26096–26114. [Google Scholar] [CrossRef] [PubMed]
  37. Dong, D.; Fang, P.; Bock, Y.; Cheng, M.K.; Miyazaki, S. Anatomy of apparent seasonal variations from GPS-derived site position time series. J. Geophys. Res. Solid Earth 2002, 107. [Google Scholar] [CrossRef]
  38. Chang, E.T.Y.; Chao, B.F. Analysis of coseismic deformation using EOF method on dense, continuous GPS data in Taiwan. Tectonophysics 2014, 637, 106–115. [Google Scholar] [CrossRef]
  39. Fiore, A.M.; Jacob, D.J.; Rohit, M.; Martin, R.V. Application of empirical orthogonal functions to evaluate ozone simulations with regional and global models. J. Geophys. Res. Atmos. 2003, 108. [Google Scholar] [CrossRef]
  40. Van Dam, T.; Wahr, J.; Milly, P.C.D.; Shmakin, A.B.; Blewitt, G.; Lavallée, D.; Larson, K.M. Crustal displacements due to continental water loading. Geophys. Res. Lett. 2001, 28, 651–654. [Google Scholar] [CrossRef]
  41. Kusche, J.; Schrama, E.J.O. Surface mass redistribution inversion from global GPS deformation and Gravity Recovery and Climate Experiment (GRACE) gravity data. J. Geophys. Res. 2005, 110. [Google Scholar] [CrossRef]
  42. Van Dam, T.; Wahr, J.; Lavallée, D. A comparison of annual vertical crustal displacements from GPS and Gravity Recovery and Climate Experiment (GRACE) over Europe. J. Geophys. Res. 2007, 112. [Google Scholar] [CrossRef]
  43. Ye, Z.; Gao, R.; Li, Q.; Zhang, H.; Shen, X.; Liu, X.; Gong, C. Seismic evidence for the North China plate underthrusting beneath northeastern Tibet and its implications for plateau growth. Earth Planet. Sci. Lett. 2015, 426, 109–117. [Google Scholar] [CrossRef]
  44. Guo, X.; Gao, R.; Keller, G.R.; Xu, X.; Wang, H.; Li, W. Imaging the crustal structure beneath the eastern Tibetan Plateau and implications for the uplift of the Longmen Shan range. Earth Planet. Sci. Lett. 2013, 379, 72–80. [Google Scholar] [CrossRef]
  45. Guo, X.; Gao, R.; Wang, H.; Li, W.; Keller, G.R.; Xu, X.; Li, H.; Encarnacion, J. Crustal architecture beneath the Tibet-Ordos transition zone, NE Tibet, and the implications for plateau expansion. Geophys. Res. Lett. 2015, 42, 10631–10639. [Google Scholar] [CrossRef]
  46. Sun, W.; Wang, Q.; Li, H.; Wang, Y.; Okubo, S.; Shao, D.; Liu, D.; Fu, G. Gravity and GPS measurements reveal mass loss beneath the Tibetan Plateau: Geodetic evidence of increasing crustal thickness. Geophys. Res. Lett. 2009, 36. [Google Scholar] [CrossRef]
  47. Zhang, G.; Yao, T.; Xie, H.; Kang, S.; Lei, Y. Increased mass over the Tibetan Plateau: From lakes or glaciers? Geophys. Res. Lett. 2013, 40, 2125–2130. [Google Scholar] [CrossRef]
  48. Hao, M.; Freymueller, J.T.; Wang, Q.; Cui, D.; Qin, S. Vertical crustal movement around the southeastern Tibetan Plateau constrained by GPS and GRACE data. Earth Planet. Sci. Lett. 2016, 437, 1–8. [Google Scholar] [CrossRef]
  49. Royden, L.H.; Burchfiel, B.C.; van der Hilst, R.D. The geological evolution of the Tibetan Plateau. Science 2008, 321, 1054–1058. [Google Scholar] [CrossRef] [PubMed]
  50. Kaufmann, G.; Lambeck, K. Implications of Late Pleistocene glaciation of the Tibetan Plateau for present-day uplift rates and gravity anomalies. Quat. Res. 1997, 48, 267–279. [Google Scholar] [CrossRef]
  51. Argus, D.F.; Peltier, W.R.; Drummond, R.; Moore, A.W. The Antarctica component of postglacial rebound model ICE-6G_C (VM5a) based upon GPS positioning, exposure age dating of ice thicknesses, and relative sea level histories. Geophys. J. Int. 2014, 198, 537–563. [Google Scholar] [CrossRef]
  52. Peltier, W.R.; Argus, D.F.; Drummond, R. Space geodesy constrains ice-age terminal deglaciation: The global ICE-6G_C (VM5a) model. J. Geophys. Res. Solid Earth 2015, 120, 450–487. [Google Scholar] [CrossRef]
  53. Wahr, J. Deformation induced by polar motion. J. Geophys. Res. 1985, 90, 9363–9368. [Google Scholar] [CrossRef]
  54. King, M.A.; Watson, C.S. Geodetic vertical velocities affected by recent rapid changes in polar motion. Geophys. J. Int. 2014, 199, 1161–1165. [Google Scholar] [CrossRef]
Figure 1. Five steps represent the brief procedures from GRACE, GPS to final crustal vertical deformation. EOF, Empirical Orthogonal Function; CATS, Create and Analyse Time Series software; LS, least squares.
Sensors 16 01211 g001
Figure 2. Locations of the CGPS stations in northeastern Tibet. The white circles are the CGPS stations with records spanning from March 2010 to July 2015, and the red circles denote the three stations with records spanning from January 1999 to July 2015. The map in the inset shows the geological tectonic background and crustal motions with the collision and post-collisional intra-continental deformation of the Indian and Eurasian plates. The red arrows indicate direction of large-scale block motions, and faults and subduction belts are indicated by the gray and black lines, respectively.
Sensors 16 01211 g002
Figure 3. The CSR RL05 GRACE-derived mass change (equivalent water thickness) in Tibet, time spanning from April 2002 to November 2014. The mass change (kg/year) in unit square volume is expressed as equivalent water thickness (mm/year). The inset gray rectangle is our study area, mainly focusing on northeast Tibet. The India, Eastern Himalayas and Tianshan mass changes are shown in the area circled in red.
Sensors 16 01211 g003
Figure 4. Amplitudes of seasonal signals showing peak-to-peak surface mass variations (water-equivalent height) derived from GRACE in northeastern Tibet, which is shown as the box in Figure 3. The gray solid lines indicate active major strike-slip faults.
Sensors 16 01211 g004
Figure 5. The first common mode from the EOF corresponding to the seasonal signals based on (a) the records from 2010 to 2015 of 38 GPS stations, and (b) the three CGPS sites records are from 1999 to 2015. In order to compare with GRACE data (data records from 2002 to 2015), we just selected GPS data from 2002 to 2015. GRACE monthly measurements span from April 2002 to November 2014. Gray lines (daily solutions) and red dots (monthly solutions) correspond to the GPS and GRACE results, which are LS fitted by the expression in Equation (2) (i.e., the black and green lines, respectively).
Sensors 16 01211 g005
Figure 6. GRACE mass change in Tibet. The CSR RL5 was used to estimate the gravity in northeastern Tibet, spanning from April 2002 to November 2014. The dots denote the vertical deformations caused by surface loads corresponding to the GPS sites. The color bars internal and external denote the rates of the GRACE derived loading and gravity variations, respectively.
Sensors 16 01211 g006
Figure 7. (a) the vertical crustal deformation rates in northeastern Tibet without the loading effect (from GRACE). Blue vectors denote uplift, and red vectors denote subsidence. The active faults in Tibet are marked by gray lines, and the black lines with triangles show two subduction belts in the northern and southern boundaries of Tibet; (b) profile charts showing the terrain height and uplift rate of the northeast Tibetan Plateau, the magenta dotted line from A to B in (a). The blue dots with error bars denote GPS sites with positive uplift rates and the red dots denote negative rates. The error bars represent one standard deviation on either side of the plotted points.
Sensors 16 01211 g007
Table 1. GPS stations with their vertical velocities, and GRACE-derived uplift rates.
SiteLatitude (°)Longitude (°)DurationsGPS-Derived Velocity (mm/year)GRACE-Derived Uplift (mm/year)Corrected Vertical Rate (mm/year)
DLHA37.3897.371999–20150.55 ± 0.15−0.26 ± 0.040.81 ± 0.16
GSAX40.5195.762010–2015−0.61 ± 0.60−0.12 ± 0.04−0.49 ± 0.60
GSDH40.1494.682010–2015−0.48 ± 0.54−0.11 ± 0.04−0.37 ± 0.54
GSJY39.8098.212010–20150.99 ± 0.46−0.18 ± 0.041.18 ± 0.46
GSGL37.45102.882010–20152.73 ± 0.65−0.22 ± 0.042.95 ± 0.65
GSGT39.4199.812010–20150.67 ± 0.49−0.19 ± 0.040.86 ± 0.49
GSML38.44100.812010–20150.42 ± 0.41−0.22 ± 0.040.63 ± 0.41
GSMQ38.63103.082010–2015−2.42 ± 0.54−0.18 ± 0.04−2.24 ± 0.54
GSGL37.45102.882010–20152.73 ± 0.65−0.22 ± 0.042.95 ± 0.65
GSJT37.18104.052010–20150.67 ± 0.49−0.21 ± 0.040.87 ± 0.49
GSDX35.55104.602010–20150.03 ± 0.30−0.27 ± 0.050.31 ± 0.30
GSJN35.52105.752010–20150.50 ± 0.41−0.25 ± 0.050.75 ± 0.41
GSPL35.54106.582010–20150.00 ± 0.44−0.23 ± 0.050.22 ± 0.44
GSLX34.99104.642010–20150.64 ± 0.40−0.30 ± 0.0510.94 ± 0.40
GSMX34.43104.022010–2015−0.43 ± 0.47−0.31 ± 0.05−0.10 ± 0.47
GSMA34.01102.052010–20150.30 ± 0.42−0.29 ± 0.040.60 ± 0.42
GSWD33.42104.812010–2015−0.95 ± 0.44−0.37 ± 0.05−0.58 ± 0.44
GSTS34.48105.912010–2015−0.74 ± 1.19−0.32 ± 0.05−0.42 ± 1.19
GSQS34.74106.212010–20150.31 ± 0.37−0.29 ± 0.050.60 ± 0.37
NMAY39.20101.702011–20151.13 ± 0.40−0.18 ± 0.041.32 ± 0.40
NXZW37.58105.242010–20150.82 ± 0.30−0.16 ± 0.040.98 ± 0.30
NXHY36.55105.642010–2015−1.60 ± 0.29−0.19 ± 0.05−1.41 ± 0.29
QHLH38.7493.332010–20152.99 ± 0.50−0.17 ± 0.043.16 ± 0.50
QHMY38.4790.802011–20150.94 ± 0.67−0.16 ± 0.041.10 ± 0.67
QHQL38.20100.202011–20151.85 ± 0.61−0.23 ± 0.042.08 ± 0.61
QHGE36.1494.772010–2015−0.91 ± 0.50−0.24 ± 0.04−0.68 ± 0.50
QHDL36.2998.092010–2015−0.53 ± 0.49−0.27 ± 0.04−0.26 ± 0.49
QHME37.47101.402010–20151.09 ± 0.56−0.24 ± 0.041.34 ± 0.56
QHGC37.33100.132010–20150.137 ± 0.37−0.26 ± 0.040.40 ± 0.37
QHMD34.9298.202010–20150.91 ± 0.41−0.21 ± 0.041.12 ± 0.41
QHMQ34.47100.242010–20150.13 ± 0.42−0.25 ± 0.040.37 ± 0.42
QHTR35.51102.012010–20152.38 ± 1.03−0.29 ± 0.042.67 ± 1.03
QHBM32.93100.742010–20150.29 ± 0.33−0.17 ± 0.040.46 ± 0.33
SCMX31.67103.852010–20159.11 ± 0.49−0.36 ± 0.059.47 ± 0.49
SCSP32.64103.582010–20151.50 ± 0.64−0.35 ± 0.051.84 ± 0.64
SCGY32.43105.852010–20150.11 ± 0.47−0.44 ± 0.050.55 ± 0.47
SNMX33.10106.702011–2015−2.49 ± 0.61−0.41 ± 0.05−2.08 ± 0.61
SNXY35.20108.402010–20151.15 ± 0.48−0.18 ± 0.051.33 ± 0.48
SNTB34.10107.302011–20150.49 ± 0.54−0.32 ± 0.050.81 ± 0.54
XIAA34.20109.001999–2015−6.29 ± 0.41−0.24 ± 0.05−6.05 ± 0.41
XNIN36.60101.801999–20151.03 ± 0.17−0.27 ± 0.041.30 ± 0.17

