Article

In Situ Representation of Soil/Sediment Conductivity Using Electrochemical Impedance Spectroscopy

1
Agro-Environmental Protection Institute, Ministry of Agriculture, Tianjin 300191, China
2
MOE Key Laboratory of Pollution Processes and Environmental Criteria, Tianjin Key Laboratory of Environmental Remediation and Pollution Control, College of Environmental Science and Engineering, Nankai University, Tianjin 300071, China
*
Authors to whom correspondence should be addressed.
Sensors 2016, 16(5), 625; https://doi.org/10.3390/s16050625
Submission received: 14 February 2016 / Revised: 26 March 2016 / Accepted: 9 April 2016 / Published: 30 April 2016
(This article belongs to the Special Issue Sensors for Environmental Monitoring 2016)

Abstract

:
The electrical conductivity (EC) of soil is generally measured after soil extraction, so this method cannot represent the in situ EC of soil (e.g., EC of soils with different moisture contents) and therefore lacks comparability in some cases. Using a resistance measurement apparatus converted from a configuration of soil microbial fuel cell, the in situ soil EC was evaluated according to the Ohmic resistance (Rs) measured using electrochemical impedance spectroscopy. The EC of soils with moisture content from 9.1% to 37.5% was calculated according to Rs. A significant positive correlation (R2 = 0.896, p < 0.01) between the soil EC and the moisture content was observed, which demonstrated the feasibility of the approach. This new method can not only represent the actual soil EC, but also does not need any pretreatment. Thus it may be used widely in the measurement of the EC for soils and sediments.

Graphical Abstract

1. Introduction

The soil electrical conductivity (EC), associated with soil salinity [1], is measured as one of main soil characteristics in agricultural production and environmental protection. It is influenced by soil moisture content, salts, and amount and type of clays and other factors [2]. Generally, the soil EC is determined by measuring the EC of extracted soil samples [1,3]. In this case, the ratios of soil to water must be ascertained, including 1:2.5, 1:5 and 1:10 [2,3,4,5]. The ECs obtained for different soil to water ratios indicate poor comparability. Although the ratios are equivalent, the comparability is doubtful due to the differences in the amount and type of ions, the time of extraction or the water temperature [6,7].
The use of electrochemical impedance spectroscopy (EIS) has been employed frequently in the evaluation of the electrochemical performance of microbial fuel cells (MFCs), especially the measurement of cell internal resistance [3,8,9]. The electrochemical properties related to resistances, including a charge transfer resistance (Rct), a solution resistance (Rs, soil Ohmic resistance in this study) and a capacitance (C), are determined by simulating the measured impedance data according to an equivalent circuit [10]. In this study, a configuration of soil MFC (addressed as resistance measurement apparatus in this study) was designed to obtain the soil resistance by measuring electrochemical impedance. The in situ soil EC was simply determined from the slope of resistance-distance plot in a resistance measurement apparatus. So far as we know, there’s no other literature describing how to measure soil EC using EIS. This method is new and does not need any pretreatment compared to the conventional method. Since no dehydration process is needed before the measurement, it is possible to obtain soil EC for different moisture contents.
Electrochemical technologies, for instance MFC and the electrokinetic technique, are promising remediation approaches for soil/sediment contamination [11,12]. The performance of remediation is mainly determined by the system resistance [5,13]. Thus the representation of contaminated soil/sediment EC is an important aspect in electrochemical remediation. Generally, the soil/sediment EC is evaluated by analyzing their extraction solutions, which does not represent the real-time conductivity of the soil/sediment. In this study, an in situ representation method of EC was devised using the EIS that can continuously monitor the soil/sediment EC, which is a very important index to evaluate the soil characteristics for plant growth and soil organisms.

2. Materials and Methods

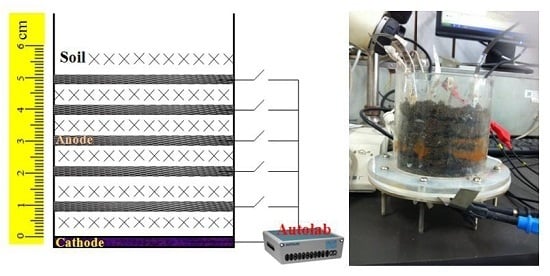
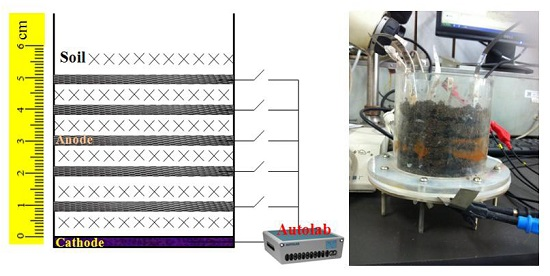
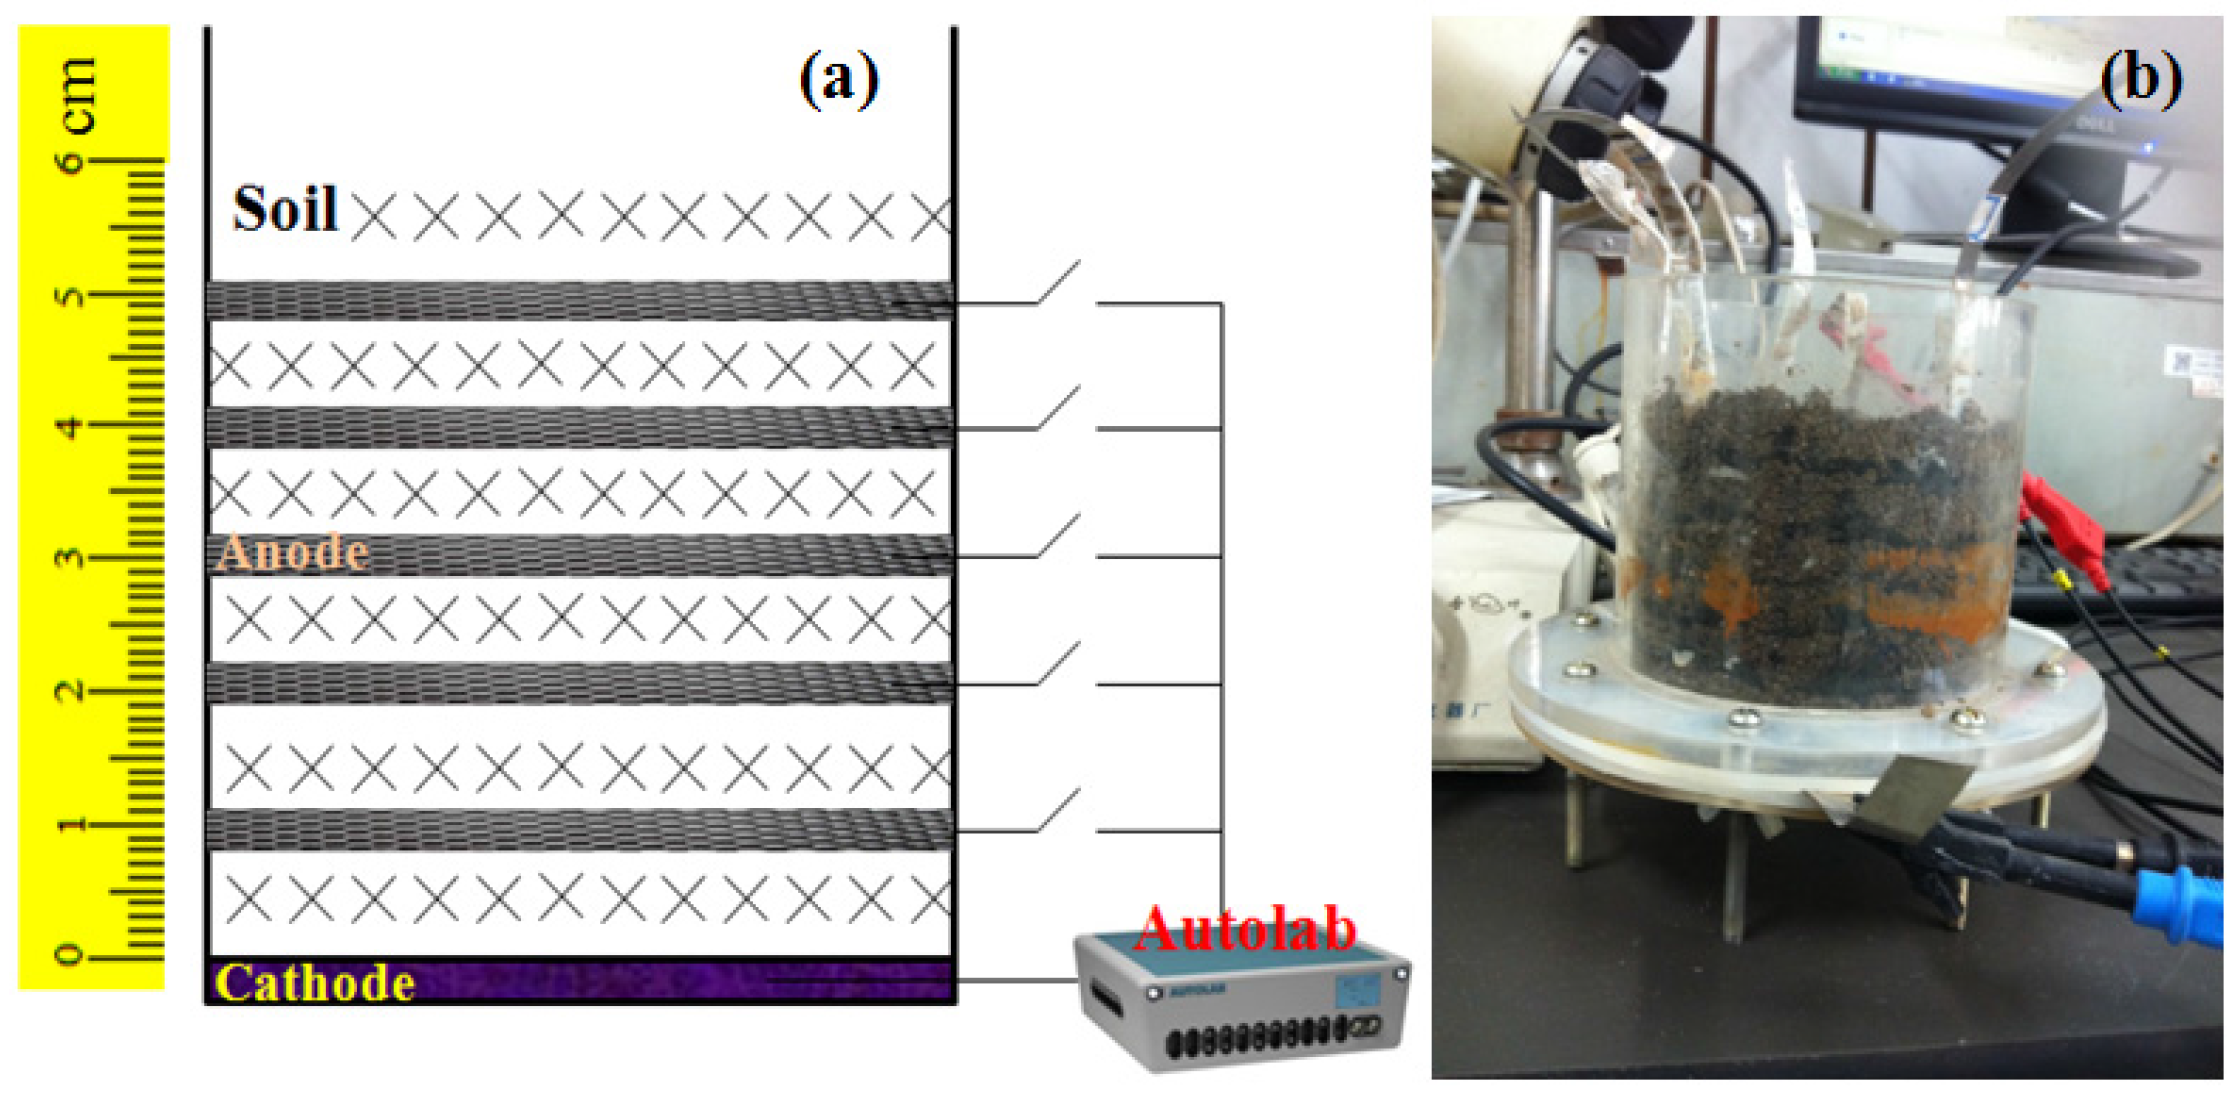
2.1. Apparatus Configuration

A resistance measurement apparatus (RMA) was assembled with five layers of carbon mesh anodes and an activated carbon air-cathode (Figure 1). The soil RMA was column-type, with 10 cm of diameter and 10 cm of height. The carbon meshes (diameter of 10 cm, Jilin Carbon Factory, Jilin, China) were soaked in acetone overnight prior to use [14]. The air-cathode (diameter of 10 cm) was produced by a rolling-press method and consisted of a 60 mesh of stainless steel mesh (type 304, Detiannuo Commercial Trade Co. Ltd., Tianjin, China) with a catalyst layer (CL) rolled on the soil facing side and a gas diffusion layer (GDL) rolled on the air facing side [10]. The GDL was made of carbon black (Jinqiushi Chemical Co. Ltd., Tianjin, China) and PTFE emulsion (60 wt%, Hesen, Shanghai, China) with a mass ratio of 3:7, followed by heating at 340 °C for 20 min. The CL was made of activated carbon (Xinsen Carbon Co. Ltd., Fujian, China) and PTFE emulsion with a mass ratio of 6:1. The air-cathodes sheets were dried at room temperature for least 24 h before installed in RMA. The air-cathode was supported by a porous Plexiglas plate (0.5 cm of pore diameter and 1 cm of pore spacing between two pores) at the bottom of the RMA. Anodes were parallelly inserted in soil with distance of 1, 2, 3, 4 and 5 cm from the air-cathode (Figure 1). A titanium sheet (1 mm of thickness and 1 cm of wide) was used as the wire.

2.2. Tested Soil and Electrochemical Measurements

The soil was collected in a suburb of Dagang district of Tianjin, China. After being air-dried, the soil was passed through a 2 mm sieve. Next 600 g of dried soil was mixed with different amounts of distilled water to obtain test soil swith certain water contents. Since the saturated water content of the original soil is 37.5%, soils with different moisture contents of 9.1%, 16.7%, 23.1%, 28.6%, 33.3% and 37.5% were prepared by addition of distilled water (electrical conductivity of 28 μS·cm−1). The homogeneous test soil was divided into six parts and each part was filled in between two electrodes (anode or cathode). Each treatment had a duplicate. EIS was performed at a frequency range from 100 kHz to 10 mHz with a amplitude of 10 mV using a potentiostat (Autolab PGSTAT 302N, Metrohm, Herisau, Switzerland) at the open circuit potential. The carbon mesh anode was the working electrode, and the air-cathode was used as the counter and reference electrode (two electrodes system). Nyquist plots were used to interpret the spectra and simulated using a software program (ZsimpWin 3.10, Bruno Yeum, EChem Software, Ann Arbor, MI, USA).

2.3. Characteristics Analysis

The main properties of the soil are summarized in Table 1. The soil density (ρb) was measured from soil dry weight/isometric water weight, and the porosity was calculated as (1-ρb/2.65) × 100% [15]. The pH was determined in a mixture with distilled water to soil mixture of 5:1 (v/w) [5]. The soluble salt content was extracted as described in a previous report [16]. In brief, 10 g of soil was mixed with 50 mL of CO2-free water and shaken 3 min. 20 mL of supernatant was evaporated at 105 °C and then H2O2 (10% of mass fraction) was used to remove organic matter. In order to make a comparison with EC measured using the conventional method, ECs of soil were evaluated with soil to distilled water ratios (v/w) of 1:2.5, 1:5 and 1:10 using a EC meter (SFENGCI, DDS-11A, Shanghai, China) [3,4]. The soil particle size distribution was obtained by using Mastersizer2000particle size analyzer (Malvern Instruments Ltd., Malvern, UK).

2.4. Calculation

The soil Ohmic resistance (Rs) is the mean resistance of two duplicates by using the RMA. The definition of Rs is expressed as follows:
R S =   ρ   ×   L S
where ρ is the soil resistivity (Ω·cm), L is the length of a sample (in this study, it represents the distance from anode to cathode, cm) and S is the cross sectional area (geometric parameter of a reactor, cm2).
The soil EC (κ, mS·cm−1) is the reciprocal of the soil resistivity, and can be calculated as follows:
κ =   1 ρ

3. Results

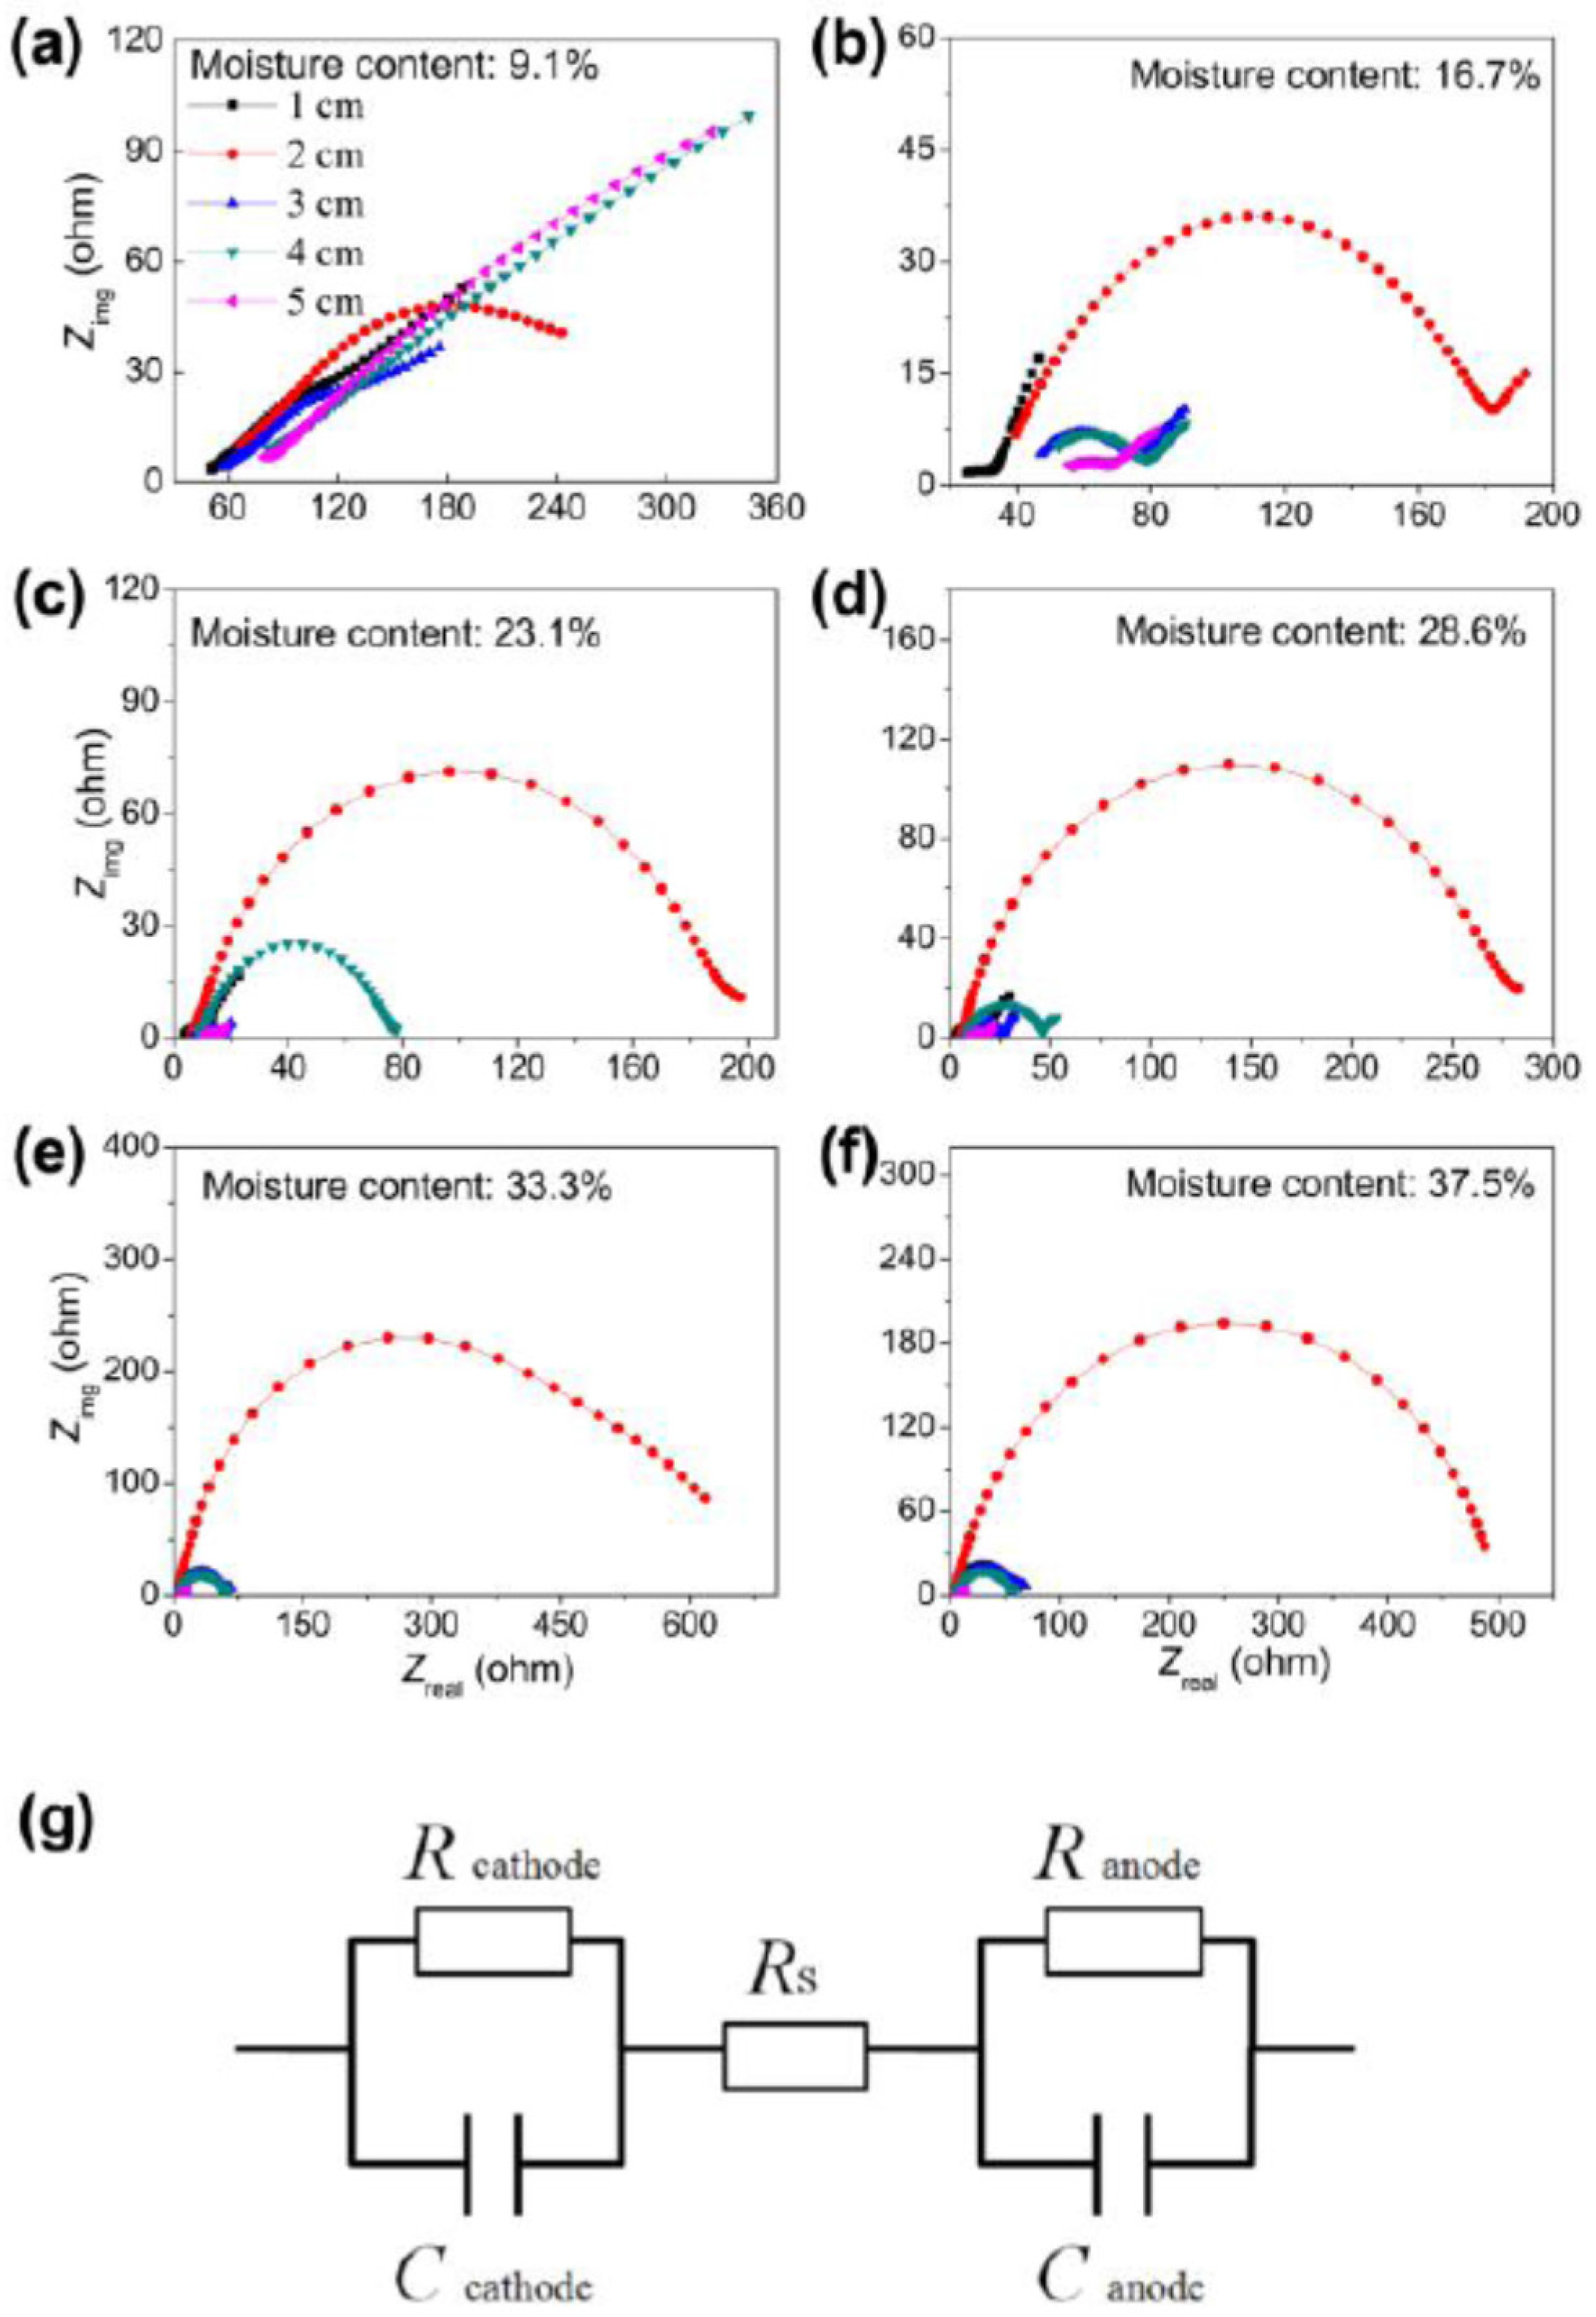
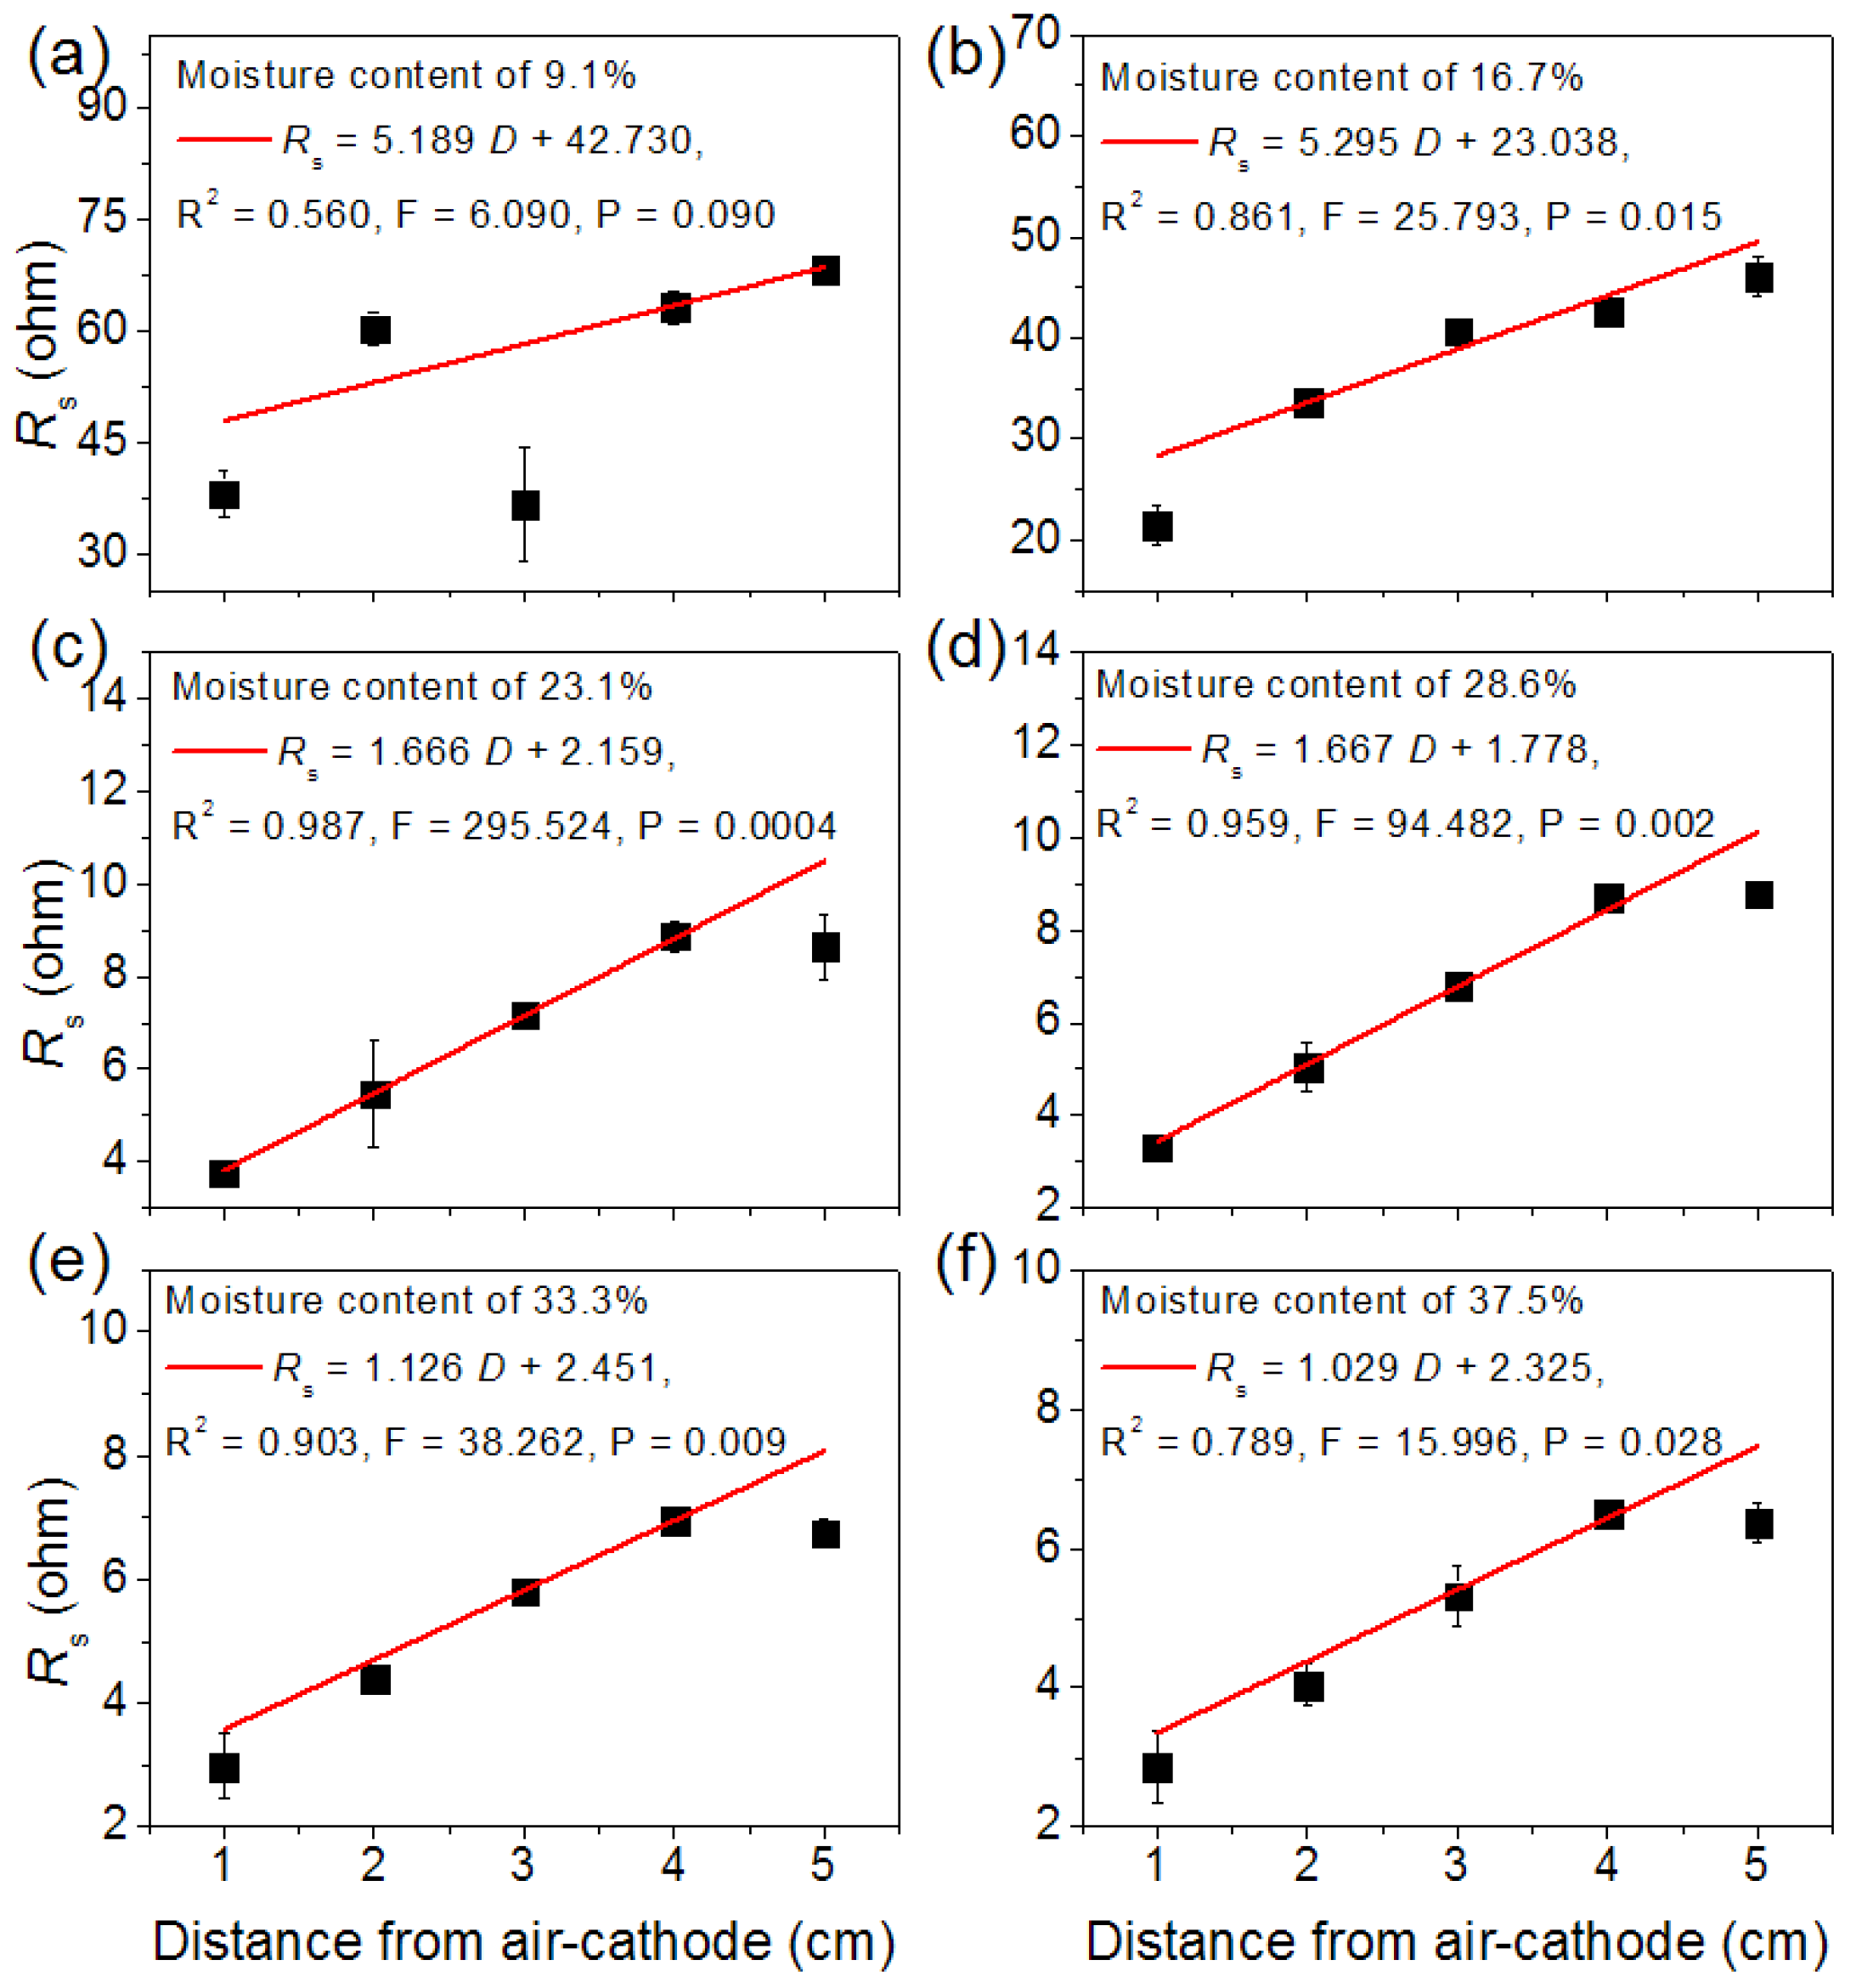
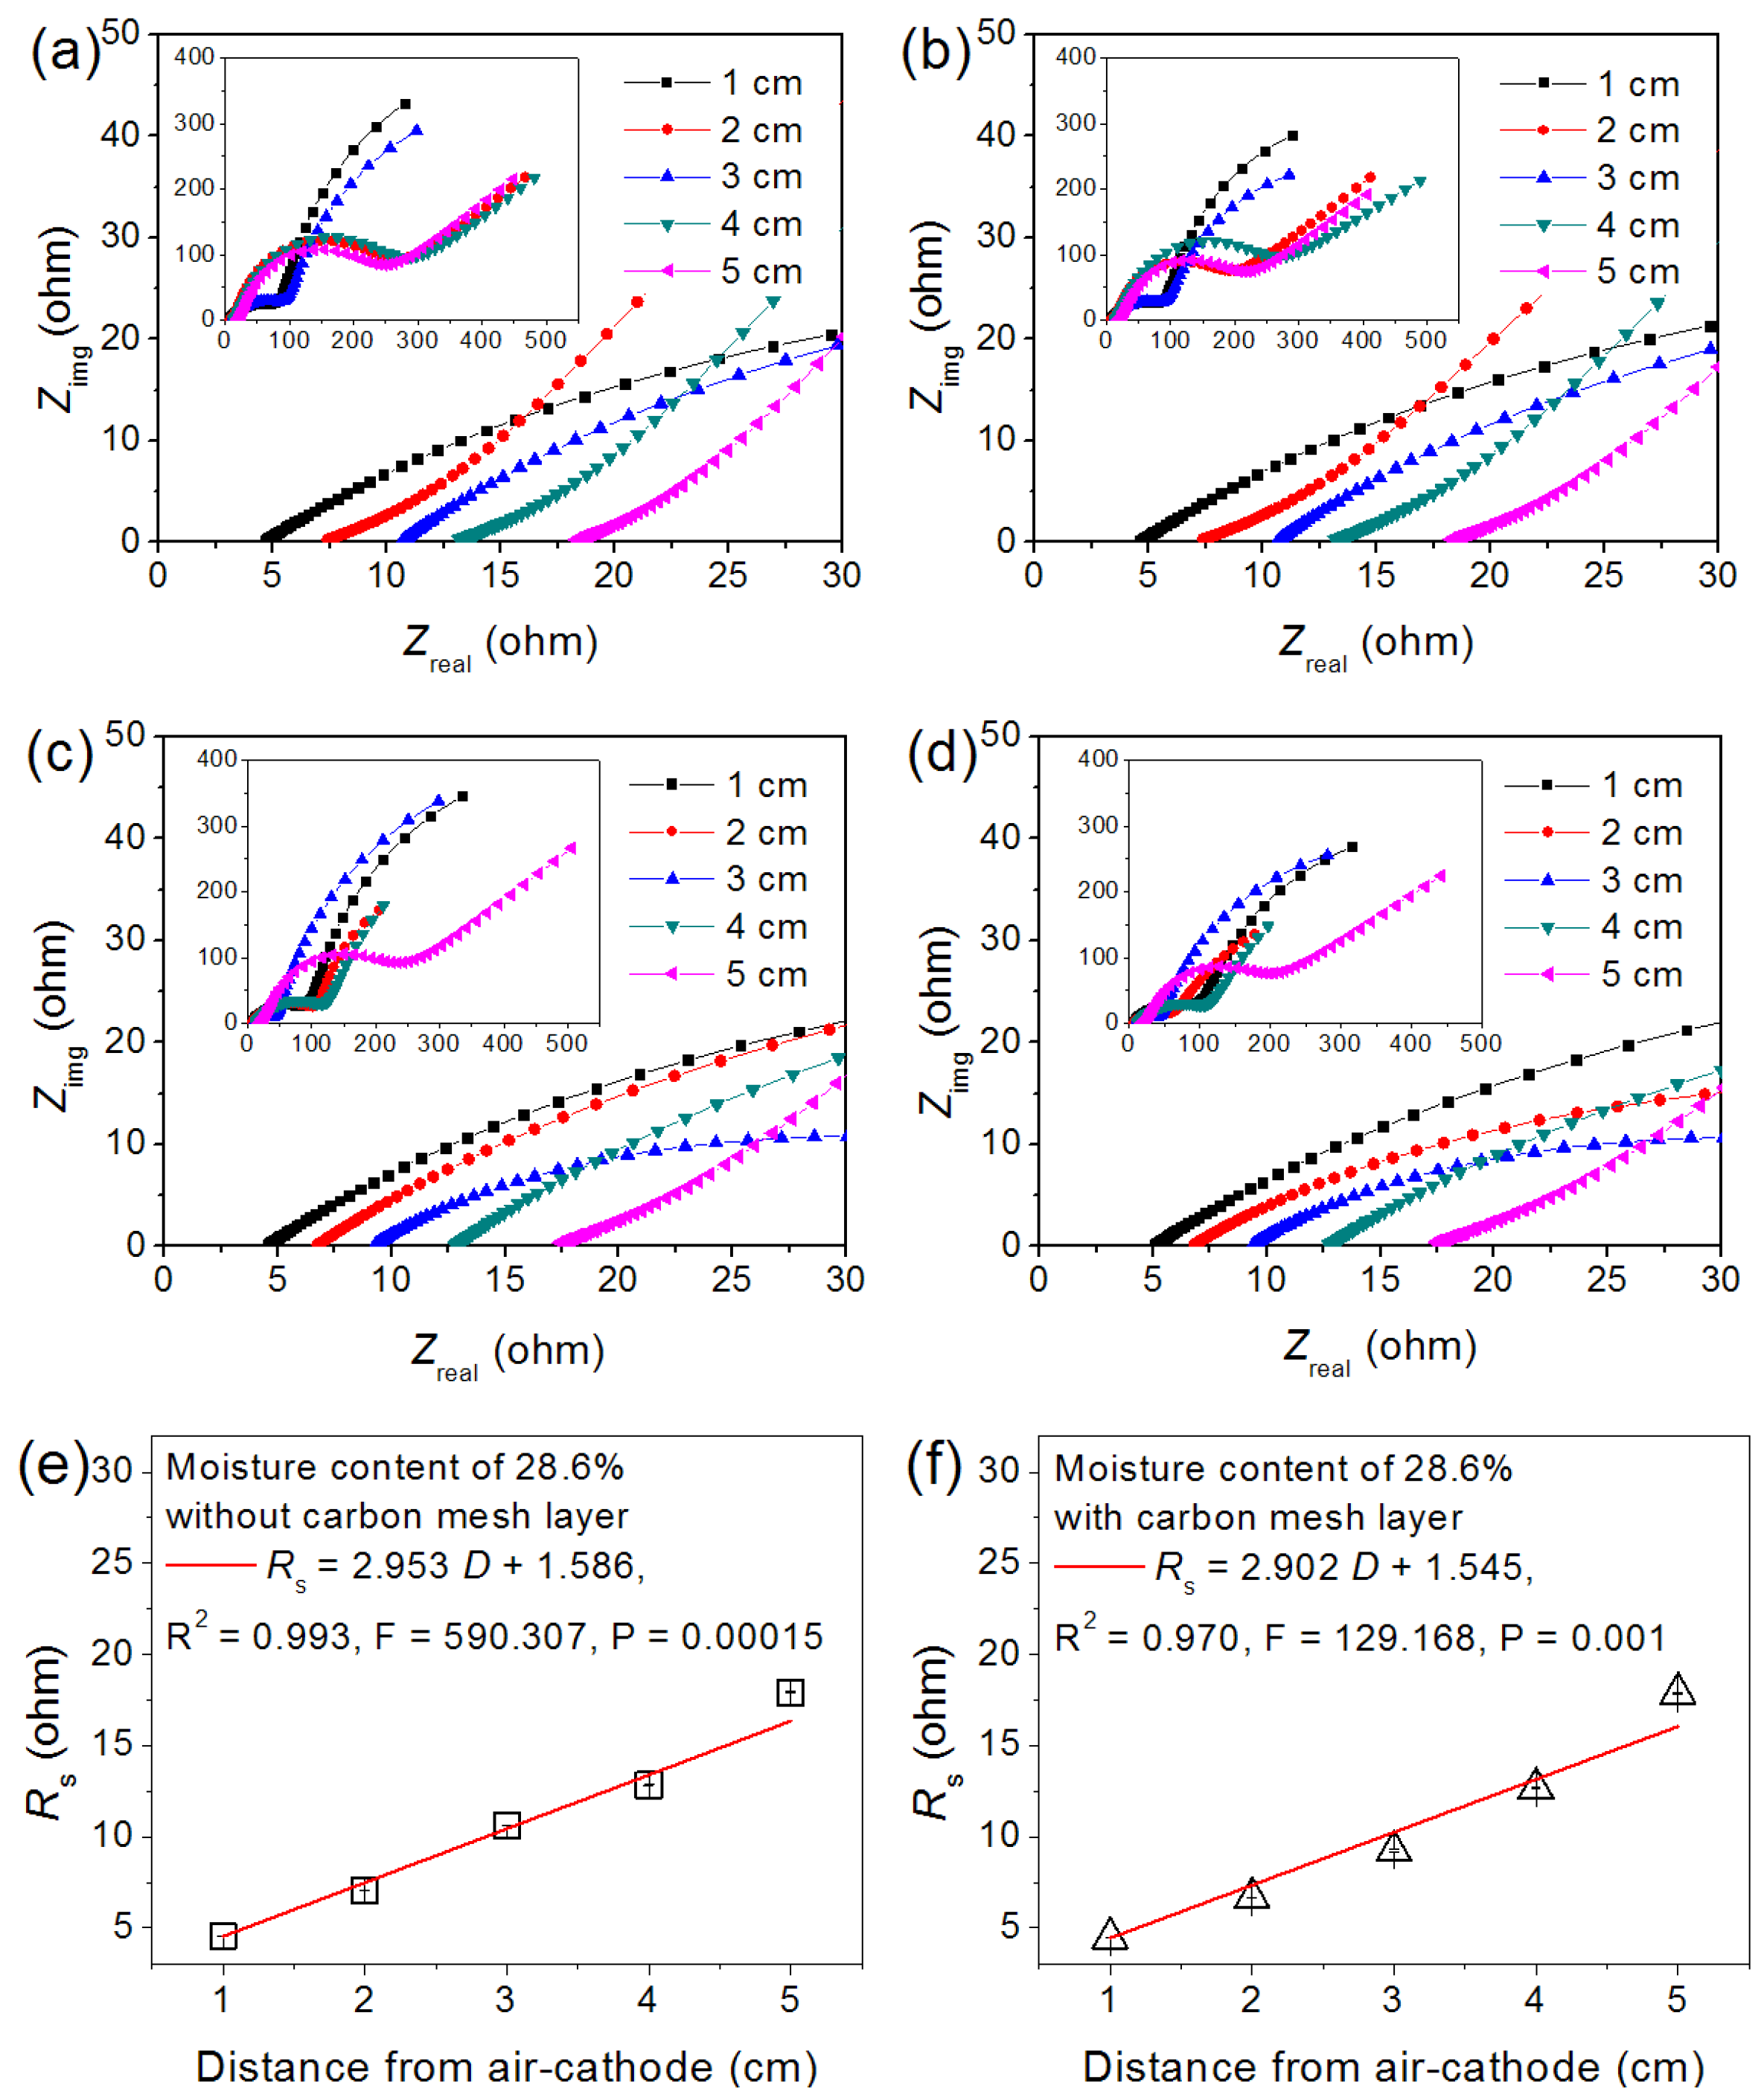
3.1. Nyquist Plots Represent Rs

The soils with different moisture contents were filled into the RMA and were stabilized for at least 1 h prior to measurement. The Nyquist plots simulated according to an equivalent circuit are shown in Figure 2 and Figure S1. Fitting results showed that the Ohmic resistance (Rs) of the soil decreased with the soil moisture content. A sharp Rs decrease was observed when the moisture content of the soil increased from 16.7% to 23.1%, for example from 21.4 ± 1.9 to 3.8 ± 0.1 Ω for 1 cm of distance. It was expected that the Rs increased with the distance from the air-cathode (Table 2 and Table S1). For all RMAs, the charge transfer resistance (Rct) at the distance of 2 cm between anode and cathode showed a larger value than any other. The Rct denotes the electron transfer capacity and thus exerted no effect on the inherent Ohmic resistance of RMA.

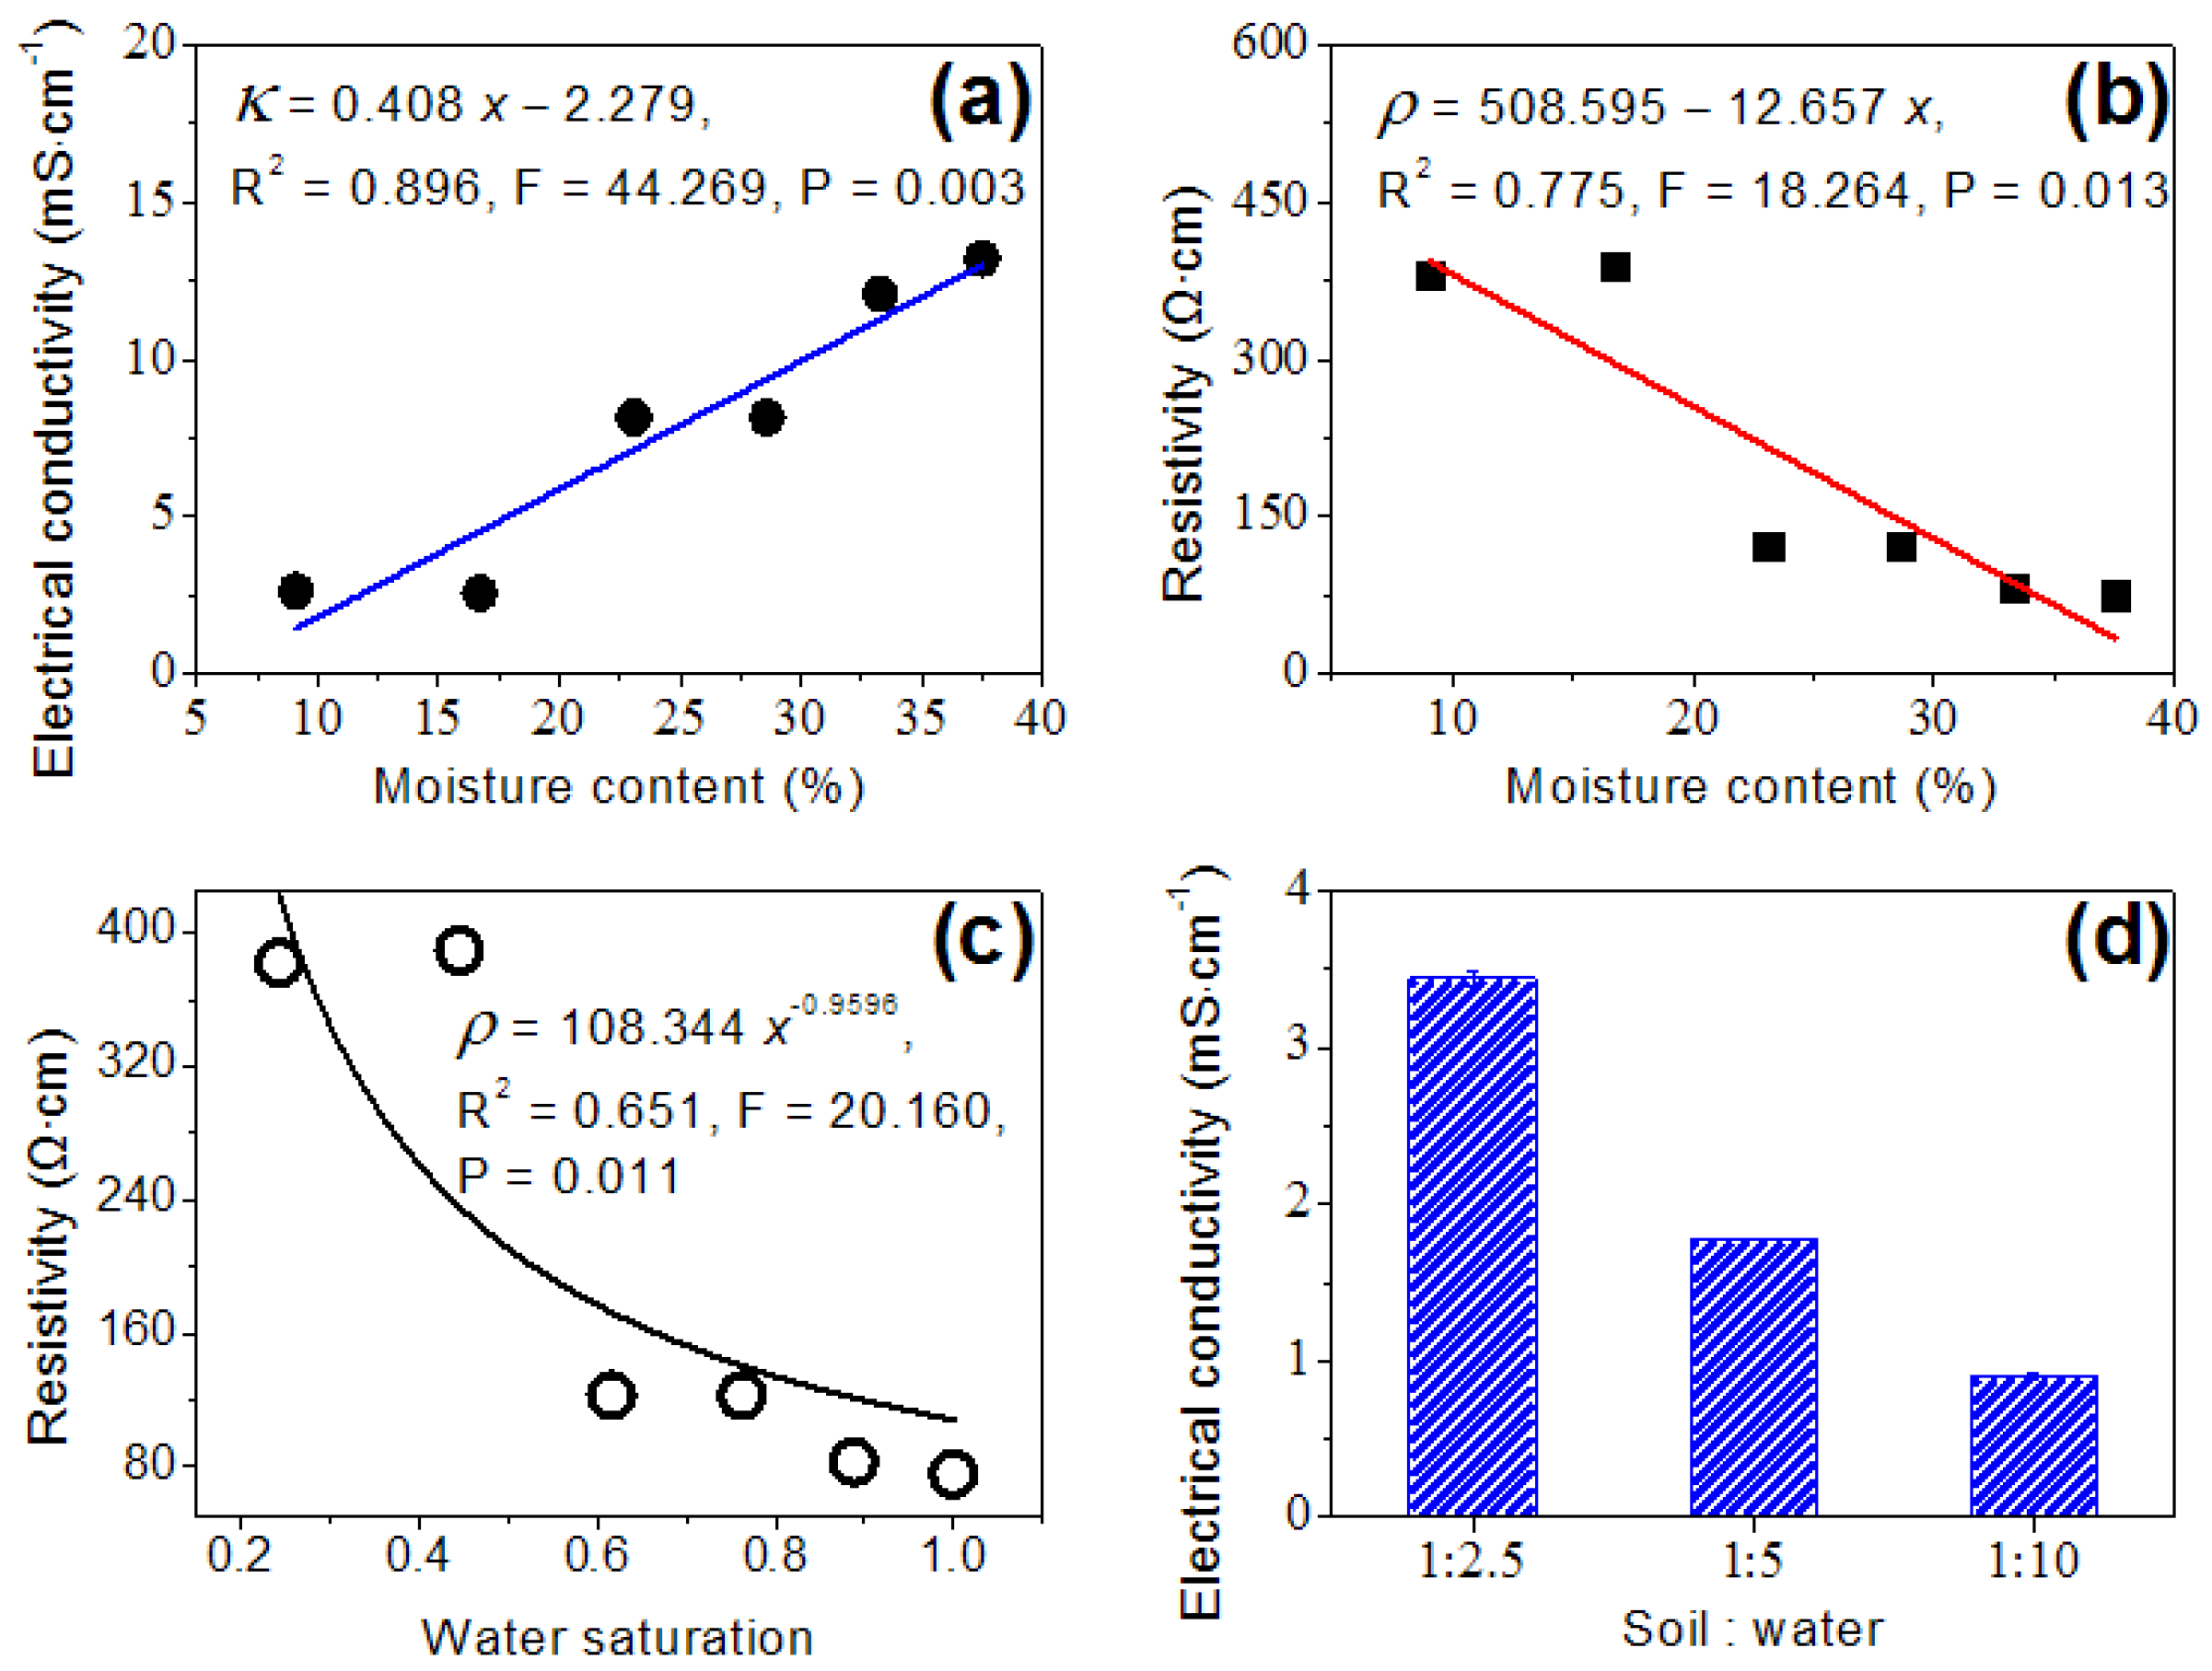
3.2. Resistivity and EC

The Ohmic resistance (Rs) is theoretically proportional to the distance (D) between anode and cathode. According to Equation (1), the soil resistivity (ρ) can be calculated from the slope of the Rs-D profile. As shown in Figure 3, the relationship between Rs and D for different soil moisture contents exhibited a good linear correspondence except for the soil with the lowest moisture content (9.1%). Because this sample did not contain enough water, poor contact between electrode and soil resulted in the relatively insignificant linear relationship. It was likely that this method is unsuitable for soils with <9.1% of water content. However, it was utterly applicable for sediment, which held enough water. The soil resistivity was calculated as ρ = slope × S, where S was the cross sectional area of the reactor (78.5 cm2). Therefore, the soil EC was calculated according to Equation (2) (Table 3). With the increase of water contents, the soil resistivity decreased while the soil EC increased, indicating that this method provided a good representation of soil conductivity.

3.3. Carbon Mesh Layers Inside Soil

In order to evaluate the effect of multiple layers of carbon mesh on the soil EC measurements, an anode/soil/cathode assembly (only one layer of carbon mesh in soil) was tested at a soil moisture content of 28.6% (the median value used as a typical sample). It was confirmed that the addition of carbon mesh did not result in a significant increase in Ohmic resistance. For example, the Rs values with electrode spacing of 4 cm were 12.7 ± 0.04 and 12.83 ± 0.02 Ω for single and multiple anode measurements. As shown in Figure 4 and Table 4, the soil ECs measured using single and multiple carbon mesh anodes were 4.312 and 4.387 mS·cm−1, with no significant difference between them, showing that the possible resistance caused by multiple carbon mesh layers was ignorable. Notably, the soil EC here was smaller than the previous result (7.638 mS·cm−1) due to the fact this measurement was conducted in winter (~15 °C) while the previous was in summer (~35 °C), showing that the temperature had an important effect on the soil EC. However, compared to the multiple anodes system, the use of a single anode required reconstructing this system many more times than multiple anodes to obtain Rs values at different electrode spacings. That was to say, the RMA with multiple carbon mesh layers was a simple and efficient representation for the soil EC.

4. Discussion

The soil EC, derived from the soil resistivity, was obtained by EIS in this study. According to a previous report [3], the soil EC < 1 cm to the anode was enhanced from 8.91 to 13.4 mS·cm−1 when the soil moisture content increased from 23% to 33%. A similar trend was also found in this study. In addition, there was a significant linear correlation between the soil ECs and the moisture contents (R2 = 0.896, p = 0.003, Figure 5a). Likewise, a significant linear correlation between the soil resistivities and the moisture contents (R2 = 0.775, p = 0.013, Figure 5b) was also observed. The trend of resistivity with the water saturation accorded with Archie formula, and the coefficient of determination and the exponent of water saturation were 0.651 and −0.9596 (F = 0.011, Figure 5c).
The soil EC, measured according to the conventional method [3,5], is a cursory response for the water soluble salt. The principle is that the water soluble salt content of soil is positively correlated with the soil EC under certain conditions. Thus, different soil moisture contents resulted in obviously different soil ECs as shown in Figure 5d. In this case, poor comparability was found between the soil ECs measured using different water to soil ratios. Meanwhile, it did not represent the actual soil EC. By contrast, the new representation method of soil EC using EIS in this study denoted the real-time soil conductivity without any pretreatment. Though this study confirmed that the soil EC was representative of a certain soil type, some further verification needs to be done in other soil types. However, the new representation method put forward in this study represents a new methodology for the measurement of in situ soil/sediment EC.
The environmental monitoring of polluted underground media is a focus issue for environmental geophysics. The conductivity of soils/sediments invaded by pollutants (e.g., oils or heavy metals) will change. Using the resistivity of polluted soil/sediment to probe the polluted zone is an important contamination survey approach [17]. Furthermore, the resistivity detected by the conventional method shows poor pragmaticality in contaminated site remediation and is time-consuming [18]. A new representation of soil resistance based on EIS in soil RMA was constructed from the viewpoint of the reasons mentioned above and is here named resistance measurement apparatus (RMA). The in situ soil resistivity as well as EC can be determined using RMA, which could indicate the soil EC for a variety of actual moisture contents. Moreover, this method was easy to carry out without complex pretreatments such as soil desiccation, mixture oscillation or centrifugation. In addition to soil, the in situ sediment EC also can be evaluated. For sediments, the EC measured using RMA could exhibit a greater advantage due to the use of actual water above the sediment. Additionally, the RMA also can be developed for remote and real-time sensing in situ monitoring. For example, 3~5 anodes were inserted into the sediment at different depths, while the air-cathode was placed in the superficial water. Each pair of electrodes (anode and cathode) were connected with the electrochemical workstation to measure the EIS at astated time. Then the sediment EC was obtained using the approach put forward in this study. It is well known that the Wenner-Schlumberger array is a good method for determining the EC of soils/sediments. RMA has some advantages in this study. For example, it is feasible to analyze the in situ and real-time change of EC in soil applications as sediment microbial remediating cells, or plant MFCs, and so on. Certainly, this new method needs to be further optimized in the future. Furthermore, the effect of insoluble conductive amendments (e.g., metal powders or carbon fibers) on the EC of soil or sediment can be investigated by using RMA rather than the common method (soil extraction). However, the RMA was only verified for a certain moisture content range from 9.1% to 37.5% (common water content of soil). Therefore, further verification need be done in subsequent tests.

Supplementary Materials

The following are available online at www.mdpi.com/1424-8220/16/5/625/s1, Figure S1: Duplicate measurement of samples showed in Figure 2, Table S1: Rs, Rct and capacitance of duplicate measurements shown in Table 2.

Acknowledgments

This research work was financially supported by the MOE Innovative Research Team in University (IRT13024), the Ministry of Science and Technology as an 863 major project (No. 2013AA06A205), the National Natural Science Foundation of China (No. 21577068), the Special Scientific Research Fund of Agricultural Public Welfare Profession of China (No. 201503107-7), and the Ph.D. Candidate Research Innovation Fund of Nankai University (No. 68140001).

Author Contributions

Xiaojing Li and Xin Wang conceived and designed the experiments; Xiaojing Li and Yueyong Zhang performed the experiments; Xiaojing Li and Qian Zhao analyzed the data; Qixing Zhou contributed reagents/materials/analysis tools; Xiaojing Li wrote the paper.

Conflicts of Interest

The authors declare no conflict of interest.

Abbreviations

The following abbreviations are used in this manuscript:
MFCsMicrobial fuel cells
ECElectrical conductivity
EISElectrochemical impedance spectroscopy
RMAResistance measurement apparatus
RsOhmic resistance
RctCharge transfer resistance
CCapacitance
CLCatalyst layer
GDLGas diffusion layer

References

  1. Santini, T.C.; Fey, M.V.; Smirk, M.N. Evaluation of soil analytical methods for the characterization of alkaline technosols: I. Moisture content, pH, and electrical conductivity. J. Soils Sediments 2013, 13, 1141–1149. [Google Scholar] [CrossRef]
  2. Eigenberg, R.A.; Doran, J.W.; Nienaber, J.A.; Ferguson, R.B.; Woodbury, B.L. Electrical conductivity monitoring of soil condition and available n with animal manure and a cover crop. Agric. Ecosyst. Environ. 2002, 88, 183–193. [Google Scholar] [CrossRef]
  3. Wang, X.; Cai, Z.; Zhou, Q.; Zhang, Z.; Chen, C. Bioelectrochemical stimulation of petroleum hydrocarbon degradation in saline soil using u-tube microbial fuel cells. Biotechnol. Bioeng. 2012, 109, 426–433. [Google Scholar] [CrossRef] [PubMed]
  4. Domínguez-Garay, A.; Berná, A.; Ortiz-Bernad, I.; Esteve-Núñez, A. Silica colloid formation enhances performance of sediment microbial fuel cells in a low conductivity soil. Environ. Sci. Technol. 2013, 47, 2117–2122. [Google Scholar] [CrossRef] [PubMed]
  5. Lu, L.; Huggins, T.; Jin, S.; Zuo, Y.; Ren, Z.J. Microbial metabolism and community structure in response to bioelectrochemically enhanced remediation of petroleum hydrocarbon-contaminated soil. Environ. Sci. Technol. 2014, 48, 4021–4029. [Google Scholar] [CrossRef] [PubMed]
  6. Heimovaara, T.; Focke, A.; Bouten, W.; Verstraten, J. Assessing temporal variations in soil water composition with time domain reflectometry. Soil Sci. Soc. Am. J. 1995, 59, 689–698. [Google Scholar] [CrossRef]
  7. Corwin, D.; Lesch, S. Application of soil electrical conductivity to precision agriculture. Agron. J. 2003, 95, 455–471. [Google Scholar] [CrossRef]
  8. Manohar, A.K.; Bretschger, O.; Nealson, K.H.; Mansfeld, F. The use of electrochemical impedance spectroscopy (eis) in the evaluation of the electrochemical properties of a microbial fuel cell. Bioelectrochemistry 2008, 72, 149–154. [Google Scholar] [CrossRef] [PubMed]
  9. Zhao, F.; Slade, R.C.; Varcoe, J.R. Techniques for the study and development of microbial fuel cells: An electrochemical perspective. Chem. Soc. Rev. 2009, 38, 1926–1939. [Google Scholar] [CrossRef] [PubMed] [Green Version]
  10. Li, X.; Wang, X.; Zhang, Y.; Ding, N.; Zhou, Q. Opening size optimization of metal matrix in rolling-pressed activated carbon air-cathode for microbial fuel cells. Appl. Energy 2014, 123, 13–18. [Google Scholar] [CrossRef]
  11. Hamdan, S.H.; Molelekwa, G.F.; Van der Bruggen, B. Electrokinetic remediation technique: An integrated approach to finding new strategies for restoration of saline soil and to control seawater intrusion. ChemElectroChem 2014, 1, 1104–1117. [Google Scholar] [CrossRef]
  12. Li, W.; Yu, H. Stimulating sediment bioremediation with benthic microbial fuel cells. Biotechnol. Adv. 2015, 33, 1–12. [Google Scholar] [CrossRef] [PubMed]
  13. Li, X.; Wang, X.; Ren, Z.J.; Zhang, Y.; Li, N.; Zhou, Q. Sand amendment enhances bioelectrochemical remediation of petroleum hydrocarbon contaminated soil. Chemosphere 2015, 141, 62–70. [Google Scholar] [CrossRef] [PubMed]
  14. Wang, X.; Cheng, S.; Feng, Y.; Merrill, M.D.; Saito, T.; Logan, B.E. Use of carbon mesh anodes and the effect of different pretreatment methods on power production in microbial fuel cells. Environ. Sci. Technol. 2009, 43, 6870–6874. [Google Scholar] [CrossRef] [PubMed]
  15. Liu, G. Soil Physical and Chemical Analysis and Description of Soil Profiles; China Standard Press: Beijing, China, 1996. [Google Scholar]
  16. Qin, X.; Li, D.; Tang, J.; Zhang, Q.; Gao, J. Effect of the salt contentin soil on bioremediation of soil by contaminated petroleum. Lett. Appl. Microbiol. 2012, 55, 210–217. [Google Scholar] [CrossRef] [PubMed]
  17. Guo, X.; Wu, R.; Jia, Y.; Li, H. The study of electrical resistivity change of different saturation soils contaminated with oil sewage and the contaminated area detecting. Prog. Geophys. 2005, 20, 402–406. [Google Scholar]
  18. Sun, Y.; Nai, C.; Liu, Y.; Dong, L. Investigation on the electrical resistivity of chromium contaminated soil. Acta Sci. Circumst. 2005, 31, 1992–1998. [Google Scholar]
Figure 1. Schematic (a) and photograph (b) of the resistance measurement design.
Sensors 16 00625 g001
Figure 2. Nyquist plots (af) of soils of different moisture contents at open circuit potential and the equivalent circuit (g) for simulating electrochemical impedance spectroscopy.
Sensors 16 00625 g002
Figure 3. Linear fitting between Rs and distance from air-cathode at different moisture contents of soil samples: (a) moisture content of 9.1%; (b) moisture content of 16.7%; (c) moisture content of 23.1%; (d) moisture content of 28.6%; (e) moisture content of 33.3%; (f) moisture content of 37.5%.
Sensors 16 00625 g003
Figure 4. Nyquist plots measured with multiple (a,b; duplicated values) and single (c,d; duplicated values) layer of carbon mesh. Linear fittings of multiple (e) and single layer (f) of carbon mesh between mean values of Rs and electrode distance (28.6% of soil moisture content).
Sensors 16 00625 g004
Figure 5. Electrical conductivity (a); resistivity (b,c) as the function of soil moisture contents and water saturation (water content/saturated water content); and the soil electrical conductivity (d) measured by using conductivity meter at different ratios of soil to water.
Sensors 16 00625 g005
Table 1. Characteristics of tested soil.
IndexValue
Soil density (g·cm−3)1.47
Soil total porosity (%)45%
pH8.26
Conductivity (ms·cm−1)1.99
Salt content (%)2.86
Sand 30%
Coarse 23%
Fine 25%
Table 2. Rs, Rct and capacitance at different moisture contents of soil samples. Rct is the sum of Rcathode and Ranode. C is the sum of Ccathode and Canode.
MoistureContentDistance from Air-Cathode1 cm2 cm3 cm4 cm5 cm
9.1%Rs (Ω)34.8258.2329.0261.0469.77
Rct (Ω)72.99246.4105.2-1229
C−1·sn)0.0064090.0005750.0064060.003680.003364
16.7%Rs (Ω)23.3733.8139.9241.544.16
Rct (Ω)8.651150.739.5440.06104.2
C−1·sn)0.0011980.0002110.0008340.0006160.003778
23.1%Rs (Ω)3.8966.6077.2339.1997.938
Rct (Ω)6.378189.99.00567.747.238
C−1·sn)0.0001880.0001990.000660.0002590.005059
28.6%Rs (Ω)3.3885.5826.8538.7628.656
Rct (Ω)13.9727718.2836.428.126
C−1·sn)0.0003180.0002040.0004970.0002730.003022
33.3%Rs (Ω)3.5024.6145.746.9636.518
Rct (Ω)55.93602.255.7257.718.201
C−1∙sn)0.0004640.0002110.0005260.0003690.004052
37.5%Rs (Ω)3.3734.3375.7586.566.075
Rct (Ω)55.03498.156.8948.997.79
C−1·sn)0.0004570.0002430.0007370.0004480.005716
Table 3. Conductivity and resistivity calculated from the linear fitting slope of Rs and distance from air-cathode at different moisture contents of soil samples.
Moisture Content (%)Slope of FittingResistivity (Ω·cm)Conductivity (mS·cm−1)
9.15.189407.5432.454
16.75.295415.8682.405
23.11.666130.8477.642
28.61.667130.9267.638
33.31.12688.43611.308
37.51.02980.81712.374
Table 4. Conductivity and resistivity calculated from the linear fitting slope of Rs and distance from air-cathode in Figure 5.
Carbon Mesh LayerMoisture Content (%)Slope of FittingResistivity (Ω·cm)Conductivity (mS·cm−1)
Single28.62.95308231.9344.312
Multiple28.62.90248227.9604.387

