Investigation into Alternative Sample Preparation Techniques for the Determination of Heavy Metals in Stationary Source Emission Samples Collected on Quartz Filters

Abstract
: Monitoring stationary source emissions for heavy metals generally requires the use of quartz filters to collect samples because of the high temperature and high moisture sampling environment. The documentary standard method sample preparation technique in Europe, EN 14385, uses digestion in hydrofluoric acid and nitric acid (HF/HNO3) followed by complexing with boric acid (H3BO3) prior to analysis. However, the use of this method presents a number of problems, including significant instrumental drift during analysis caused by the matrix components, often leading to instrument breakdown and downtime for repairs, as well as posing significant health and safety risks. The aim of this work was to develop an alternative sample preparation technique for emissions samples on quartz filters. The alternative techniques considered were: (i) acid digestion in a fluoroboric acid (HBF4) and HNO3 mixture and (ii) acid extraction in an aqua regia (AR) mixture (HCl and HNO3). Assessment of the effectiveness of these options included determination of interferences and signal drift, as well as validating the different methods by measurement of matrix certified reference materials (CRMs), and comparing the results obtained from real test samples and sample blanks to determine limits of detection. The results showed that the HBF4/HNO3 mixture provides the most viable alternative to the documentary standard preparation technique.1. Introduction
Over recent decades, the worldwide requirement for environmental monitoring of industrial pollutant emissions, including for heavy metals, has been increasing prompted by ever tighter legislation governing emissions. Heavy metals are naturally occurring in the environment, but human activities such as mining, metal smelting and refining, and combustion of fossil fuels have significantly increased emissions, and thus population exposure. Studies by the World Health Organisation (WHO) have shown heavy metals to be harmful to human health [1], with long term exposure resulting in neurotoxic and carcinogenic effects. The majority of airborne metals emissions are bound to particulate matter (PM), which has been shown by epidemiological and toxicological studies to have various inflammatory, cytotoxic, mutagenic and carcinogenic effects on the lungs, dependent on the PM size fraction and composition [2]. Airborne PM is also considered a contributing factor in increasing the risk of heart ailments and heart attacks [3].
Industrial pollution control in EU member states is currently governed by the European Industrial Emissions Directive (IED) [4]. The IED covers industrial activities with major pollution potential, including large combustion plants (defined as those whose rated thermal input is equal to or greater than 50 MW), waste incineration/co-incineration plants, metal production and processing facilities, and installations using organic solvents or producing titanium dioxide [4]. The IED sets emission limit values and monitoring requirements for pollutants to air from these processes. In England and Wales the monitoring of stationary source emissions (from sample collection to analysis) must also comply with the quality requirements of the Monitoring Certification Scheme (MCERTS) [5] established by the Environment Agency (EA). In relation to air monitoring, to be eligible to perform sample analysis a testing laboratory must be accredited to ISO 17025 for the relevant standards, as verified by the United Kingdom Accreditation Service (UKAS), and any additional requirements imposed by the MCERTS scheme [6].
To perform heavy metals analysis of stack emissions in Europe, the analytical procedures of the testing laboratory must follow standard method EN 14385, Stationary source emissions—Determination of the total emission of As, Cd, Cr, Co, Cu, Mn, Ni, Pb, Sb, Tl and V [7] which has been designated as the European reference method. EN 14385 stipulates that quartz filters must be used to sample the stationary source emissions. These filters and the corresponding solutions used to rinse the sampling probes and filter housing shall be initially digested in a matrix of HF, HNO3 and then complexed with H3BO3 prior to analysis. No alternative preparation methods are currently considered appropriate to provide results compliant with these standards, and furthermore no alternatives are allowed by the UK Environment Agency's Method Implementation Document [8] (which applies the additional requirements of the MCERTS scheme).
EN 14385 does not mandate any single analytical method, instead it provides a small number of performance requirements for the analysis; however, it does list atomic absorption spectroscopy (AAS), inductively coupled plasma optical emission spectrometry (ICP-OES), and inductively coupled plasma-mass spectrometry (ICP-MS) as appropriate exemplar techniques. At NPL, analysis of the digested samples is performed by ICP-MS. ICP-OES is significantly less sensitive than ICP-MS for most metals, and AAS, the predecessor to ICP techniques, is limited in the number of metals that can be determined in any one analysis because it requires the use of an individual radiation source, usually a hollow cathode lamp, for each separate analyte [9].
To reduce cost and minimise time on site, sampling tests from stationary sources are often conducted for closer to the minimum allowed 30 min than the maximum 8 h period. As a result very small total masses of metals are collected during sampling. This makes the ICP-MS the preferred technique to analyse these samples because of the high sensitivity previously mentioned. However the post digestion sample matrix as specified in the standard has proved problematic for the ICP-MS to process. Components of this matrix typically precipitate out of solution inside the instrument, leaving deposits on the cones and ion lens that cause significant signal drift and reduced sensitivity. Consequently, the data produced shows relatively high standard deviations, resulting in higher associated analytical uncertainties. Additionally, there is regular instrument downtime for cleaning, and often complete breakdowns requiring expensive engineer support and replacement parts. Some improvements to the methodology have already been implemented [10] to deal with the symptoms of the problem, but these changes were insufficient to deal with the root cause of the problem: the sample matrix.
The purpose of this study is to assess the suitability of alternative sample preparation techniques in order to improve the quality of data produced, reduce the need for extensive instrument maintenance and breakdown support, and risks to health and safety for scientists. Previous attempts have been made to introduce methods that avoid direct handling of HF [11], however this approach required the use of NaF and H3BO3, both of which would contribute significant extra salt precursors to the matrix. This is not ideal, as this increases the likelihood of matrix-induced interferences and signal drift for ICP-MS analysis. The alternatives investigated here are: (i) acid digestion in a HBF4/HNO3 mixture and (ii) acid extraction in an AR matrix. Fluoroboric acid has been shown to be effective in digestion of peat and plant matrices for the determination of rare earth elements, an analysis which also needs to dissolve siliceous material [12]. Aqua regia is also considered suitable for extracting trace elements from soil samples [13,14], although more conventionally as a preparation for AAS or ICP-OES determinations, so was also investigated. Analytical challenges associated with the matrices including interferences and drift were assessed and, where possible, mitigated. The analytical methods were optimised for the use of these new acid mixtures. Verification of the suitability of these matrices took the form of extraction efficiency tests on certified reference materials (CRMs) recommended in EN 14385 [7], comparing test sample results and monitoring detection limits. It is hoped that if sufficient evidence of a viable alternative is presented, these options may be included in future revisions of the standards.
2. Experimental Section
Sub-samples of the recommended certified reference material BCR-038 (fly ash from pulverized coal) [7] (supplied by the European Commission Joint Research Centre Institute for Reference Materials and Measurements) were accurately weighed on a calibrated balance (Sartorius LA230S, resolution 0.1 mg). Filter samples were cut into accurate portions using a template and ceramic scissors. The sub-samples were then transferred to microwave vessels and the acid mixtures added:
- (i)
0.2 mL HBF4/9.8 mL HNO3, or
- (ii)
7.5 mL HCl/2.5 mL HNO3
The samples were then heated under pressure using a microwave (Anton Paar Multiwave 3000, Graz, Austria). The temperature program, which meets the requirements of EN 14385 [7], heats the samples initially to 180 °C, holds for 15 min at this temperature, then continues to heat to 220 °C and holds for a further 35 min, with power used up to 1400 W. The HCl and HNO3 used were concentrated trace analysis grade (Fisher). The HBF4 was supplied as a 50% aqueous solution (Apollo Scientific, Stockport, UK). The extracted solutions were diluted in deionised water (18.2 MΩ·cm−3, Millipore RiOs/Milli-Q).
An observation during the preparation stages was that the sub-samples of CRM dust material prepared in aqua regia did not fully dissolve following the microwave extraction. Therefore the extracted solutions were filtered to remove solids prior to ICP-MS analysis (using Fisherbrand cellulose filter paper). This was necessary to prevent particulates and other undissolved material from clogging in the nebuliser and forming deposits on the cones and lens that would contribute to signal drift. Additionally, it was noted that after digestion of quartz filters with the HBF4/HNO3 matrix, some filter material remained undigested in the solution. These solutions were also filtered to remove solids prior to ICP-MS analysis as above.
Sample data for the European standard HF/HNO3/H3BO3 matrix were obtained by preparation as detailed in EN 14385 [7]. The samples were digested in a mixture of 2 mL HF (40% analytical reagent grade, Fisher, Loughborough, UK) and 3 mL HNO3 (concentrated trace analysis grade, Fisher) in a microwave (CEM MARS, Buckingham, UK). The temperature program meets the requirements of EN 14385 [7], involved a 15 min ramp, heating the samples to 210 °C, followed by a hold time at this temperature for 20 min. The power used was up to 800 W.
After the first digestion the vessels were removed from the microwave and allowed to cool. The vessels were then opened, and 20 mL saturated H3BO3 (55 g powder dissolved in 1 L deionised water) and 20 mL deionised water were added. The vessels were re-sealed and the digestion program repeated. After this second digestion, the extracted solutions were diluted in deionised water.
The extracted, diluted and filtered sample solutions were analysed for heavy metals as specified in standard EN 14385 [7] using a PerkinElmer Elan DRC II ICP-MS (Seer Green, UK). The ICP-MS was optimised prior to analysis to ensure a combination of sufficient signal and low oxide formation criteria were met. An example of typical optimization parameters are set out in Table 1.
Drift correction was performed by plotting the responses from repeat analyses of a quality assurance (QA) solution containing mid-range concentrations of the analytes under test throughout the analytical sequence. The equation of the fourth order polynomial line fitted though the QA responses was used to correct the responses of the calibration standards and samples, as in previous work [10]. Initial tests also utilised an internal standard solution containing elements other than those specifically under test, and the ratios of each analyte to its relevant internal standard were plotted. However this proved to increase the standard deviation and reduce the accuracy of responses, possibly because these stationary source emissions samples contained significant quantities of the elements used as internal standards. As a result this practice was not used in the analyses detailed here.
The ICP-MS was calibrated by direct analysis of external calibration standards containing known concentrations of the analytes, traceable to the NIST SRM 3100 series of mono-elemental solutions. Calibration curves were generated from the measured responses of the calibration standards and used to interpolate the sample concentrations using NPL's XLGenline software which performs generalised least squares regression [15]. The calibration range encompassed the measured sample concentrations. The calibration standards were prepared in a matrix of 6.9% HNO3/3.7% HCl for mercury and 11.2% HNO3/1.2% H2O2 for all other metals. All measurements were blank corrected with the appropriate matrix blank. Sample data for the standard HF/HNO3/H3BO3 matrix were obtained by analysis as detailed in EN 14385 [7]. The ICP-MS was optimised, corrected for drift (also without internal standard) and calibrated as above. The calibration standards were prepared in a matrix of 1.6% HF, 4.2% HNO3, 2% H3BO3 for all metals.
3. Results and Discussion
3.1. Analytical Challenges
3.1.1. Chloride Interferences
Chloride was present in both proposed matrices: at residual levels in HBF4 (from the production process) and as a major component (HCl) in the AR extraction matrix. This introduced chloride-forming polyatomic interferences during ICP-MS determination. Two such interferences are relevant for the analyses described here:
[ClO]+ interfered with vanadium at m/z 51
[ArCl]+ interfered with arsenic at m/z 75 (Ar is used to generate the plasma)
The effects of these interferences may be observed as non-linear calibrations, high reagent blank values and high standard deviations from replicate analyses. [ClO]+ would also be expected to potentially interfere with determination of Cr, m/z 52, from the combination of 35Cl17O. However, the effects as detailed above were less apparent for Cr compared to V and As, probably because the relative natural isotopic abundance (RA) of 17O is only 0.038%, so it was decided to focus on corrections for those more significantly affected elements. Mitigation measures included both sourcing reagents with low chloride content and performing mathematical interference corrections.
Sourcing reagents with a lower chloride content, or reducing the volume of the reagent used in sample preparation, minimises the potential for the formation of polyatomic interferences in the ICP-MS plasma.
Stocks of HBF4 from three independent suppliers were tested. The 50% HBF4 in aqueous solution supplied by Apollo Scientific was found to give the best combination of minimised standard deviations associated with CRM measurements, matrix blank concentrations and detection limits. In addition, a range of HBF4: HNO3 proportions were tested in order to establish the minimum proportion of HBF4 required to produce acceptable CRM recoveries (see Sample preparation, above, for optimised matrix proportions). These optimisations were not performed for the AR matrix, because the chloride content constitutes a much more significant proportion of that particular matrix and as such would show insignificant benefits from such measures.
Mathematical correction of responses based on known RAs of the relevant elements can be an effective tool to remove the influence of some interferences, and resolve potential biases between sample and calibration matrices. It can be simply incorporated as part of the ICP-MS analysis method. The suitability of applying such corrections for V and As was investigated for the AR matrix as this has the highest contribution from chloride interference.
The most abundant naturally occurring V isotope (99.75% RA) has a mass of 51 amu [16]. [ClO]+ interferes with the determination of V because the most abundant isotopes of chlorine (35Cl) and oxygen (16O) combine to give a compound mass of 51 amu. A correction equation was established that compared the ICP-MS signal, factored for differences in RA, from mass 51 to mass 53 (from 37Cl16O) and accounted for any 53Cr by reference to 52Cr:
Mathematical corrections of this type are of most use when the proportion of the total signal accounted for by interfering ions is relatively low. When the quantity of interfering ions is too high, there may be inconsistent and variable formation rates of the interfering polyatomic compounds. In this eventuality, the contribution to the signal from the interference will be variable, even within the timespan required for replicate readings of the same determination, thereby increasing the uncertainty in the corrected result. Clearly, this would also result in reduced precision between repeat determinations.
As this test showed that employing an interference correction equation did not improve the data quality for V analysis in this reagent matrix, and the proportion of signal attributable to the interferent should be comparable between calibration standards and samples, it was decided to proceed without this measure for subsequent analyses.
The only naturally occurring isotope of As is 75As [16]. [ArCl]+ interferes with the determination of As because the most abundant isotopes of Ar (mass 40), and Cl (mass 35) combine to give a compound mass of 75. Similarly to the V correction, the As correction is based on the two Cl isotopes. [ArCl]+ can be measured at mass 77 because 40Ar can combine with both 35Cl and 37Cl. Again, due to the lower RA of 37Cl, the [ArCl]+ signal at mass 77 would be a factor of 3.127 lower than the signal at mass 75. So the signal at mass 77 should be multiplied by a factor of 3.127, then this value should be subtracted from the mass 75 signal:
However selenium has a 7.63% RA isotope at mass 77 which interferes with 40Ar37Cl. The signal from 82Se (8.73% RA) can be used to establish the proportion of signal at mass 77 attributable to 77Se:
Furthermore, krypton also has an isotope at mass 82 (11.6% RA) [16]. However, tests on the matrix blank showed no significant difference between omission or inclusion of the additional correction factor for Kr, suggesting the signal was negligible in this matrix. So the final correction equation for As is:
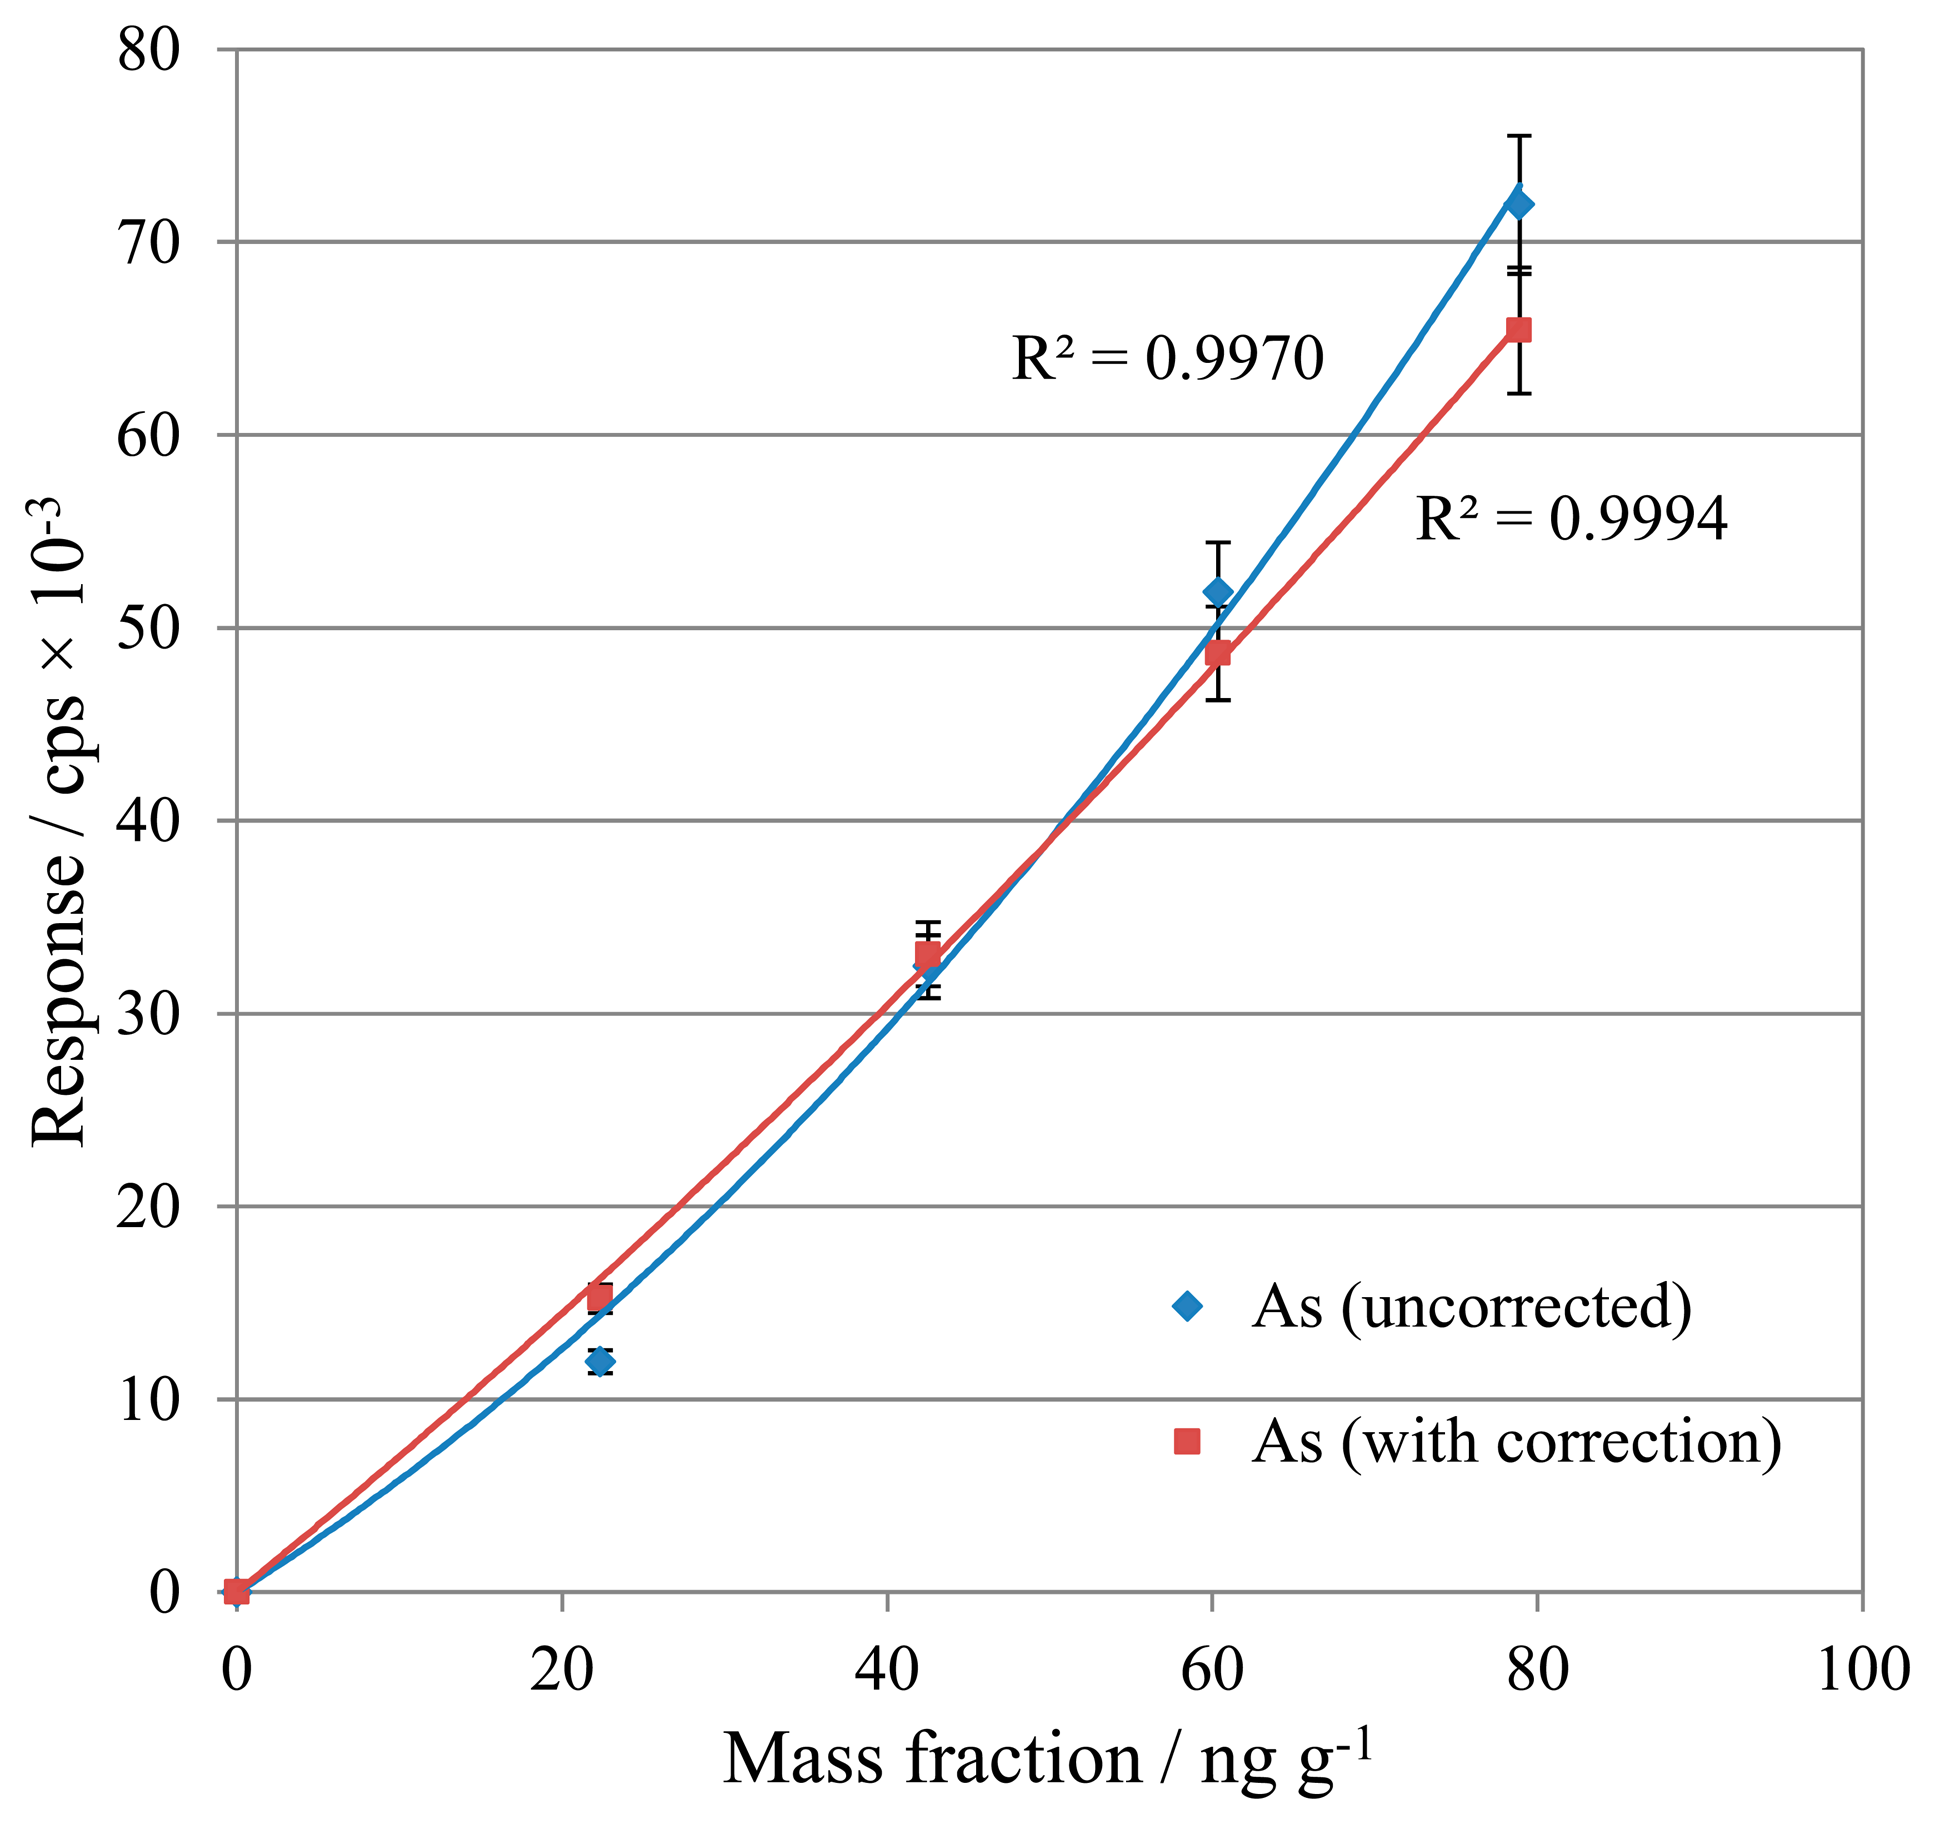
Calibration standards and samples were analysed for As, initially without any correction, then with correction Equation (4). The two sets of data are compared in Figure 1.
In contrast to V, the As calibration demonstrated an improvement in linearity with the application of the interference correction. This suggests that the relatively low reactivity of Ar resulted in minimal [ArCl]+ formation, for which the interference correction was able to compensate successfully. From these tests, interference correction is demonstrated to provide a beneficial method addition for the processing of As results, so this correction equation was retained for future work.
3.1.2. Signal Drift
Drift in analytical sensitivity not only suggests that the measurement is not under full control; additionally, EN 14385 specifies a maximum of 10% drift within an analytical run [7], otherwise the problem causing the drift needs correcting before the samples can be re-analysed. The sample matrix can introduce or exacerbate the potential for signal drift. This can impose limits on the maximum length of analytical runs, making the overall analytical process lengthier and more costly. For these reasons the use of acid mixtures which limit analytical drift is highly desirable.
In an analysis where signal drift is understood and under control, sample responses can still be corrected for drift by regular measurements of a QA standard solution [10]. Significant signal drift is a known problem for the standard HF/HNO3 mixture and potentially a problem for the two new digestion mixtures proposed, due to the various combinations of salt precursors and relatively high ionic content.
- (1)
Standard matrix: HF/HNO3/H3BO3
The standard preparation of HF/HNO3 requires addition of H3BO3 to complex with insoluble complex fluorides forming soluble fluoroborates [17], making the resulting solution safer to handle and reducing the risk of damage to analytical instrumentation. With a stoichiometric amount ratio of at least 4:1 HF: H3BO3, the result is formation of HBF4 over a two-stage exothermic reaction [18]:
In the initial digestion, 2 mL concentrated HF and 3 mL concentrated HNO3 equates to 9.28 M HF. Subsequent addition of 20 mL 5% H3BO3 and 20 mL deionised water gives 1.03 M HF + 0.50 M H3BO3, so the amount ratio is 2:1 HF: H3BO3. Therefore 0.26 M HBF4 is produced in the final sample matrix. As the H3BO3 is added in stoichiometric excess to ensure all the fluoride ions are complexed, the resulting sample matrix has a high total dissolved solids content that tends to precipitate out of solution inside the ICP-MS [19], causing drift.
This sample matrix also requires additional heating (following addition of the H3BO3 and water) above 130 °C (boiling point of HBF4) to decompose the transition metal fluoroborates formed with the metal analytes [20]. Such salt complexes would also be liable to precipitate out of solution [19], contributing both to drift and interferences, as well as reduction in the analyte signal if the analyte ions have formed salt compounds and thus are not detected at their elemental ionic mass. The acid blank solution used to prepare the calibration standards also requires heating. Non-linear calibration curves are obtained if the acid solution is not heated before it is used for standard preparation.
- (2)
Alternative matrix: HBF4/HNO3
In the alternative matrix of HBF4/HNO3, 0.2 mL concentrated HBF4 is used in the digest. Once diluted, the result is only 0.03 M HBF4 in the sample matrix, so a much reduced salt-producing capacity in comparison to the standard preparation. Production of the 50% in aqueous solution HBF4 stock does incorporate up to a few percent excess H3BO3 to prevent risk of HF formation over time as HBF4 hydrolyses [20], so this will contribute to some additional salt formation. Linear calibrations have been obtained without heating the acid matrix prior to calibration standard preparation, supporting the supposition that the lower content of salt-forming compounds results in fewer interferences. However, the accuracy has not yet been cross-verified with CRMs measured with matrix-matched calibration standards. Independent measurement of CRMs has yielded good recoveries, and linear calibrations have been obtained separately with matrix-matched standards.
- (3)
Alternative matrix: AR
The AR matrix seems to have the least potential for salt precipitation of the three matrices considered. However the chloride does form significant polyatomic interferences with the Ar carrier gas and with oxygen in the aqueous sample solution as discussed above. The [ClO]+ interference does not seem to adversely impact the V drift, but the [ArCl]+ is a problem for As drift correction. Despite the use of corrections for these interferences the standard deviation of the responses remains high in absolute terms which in turn has an adverse effect on the limits of detection for As and V when using the AR mixture.
- (4)
Matrix drift comparison
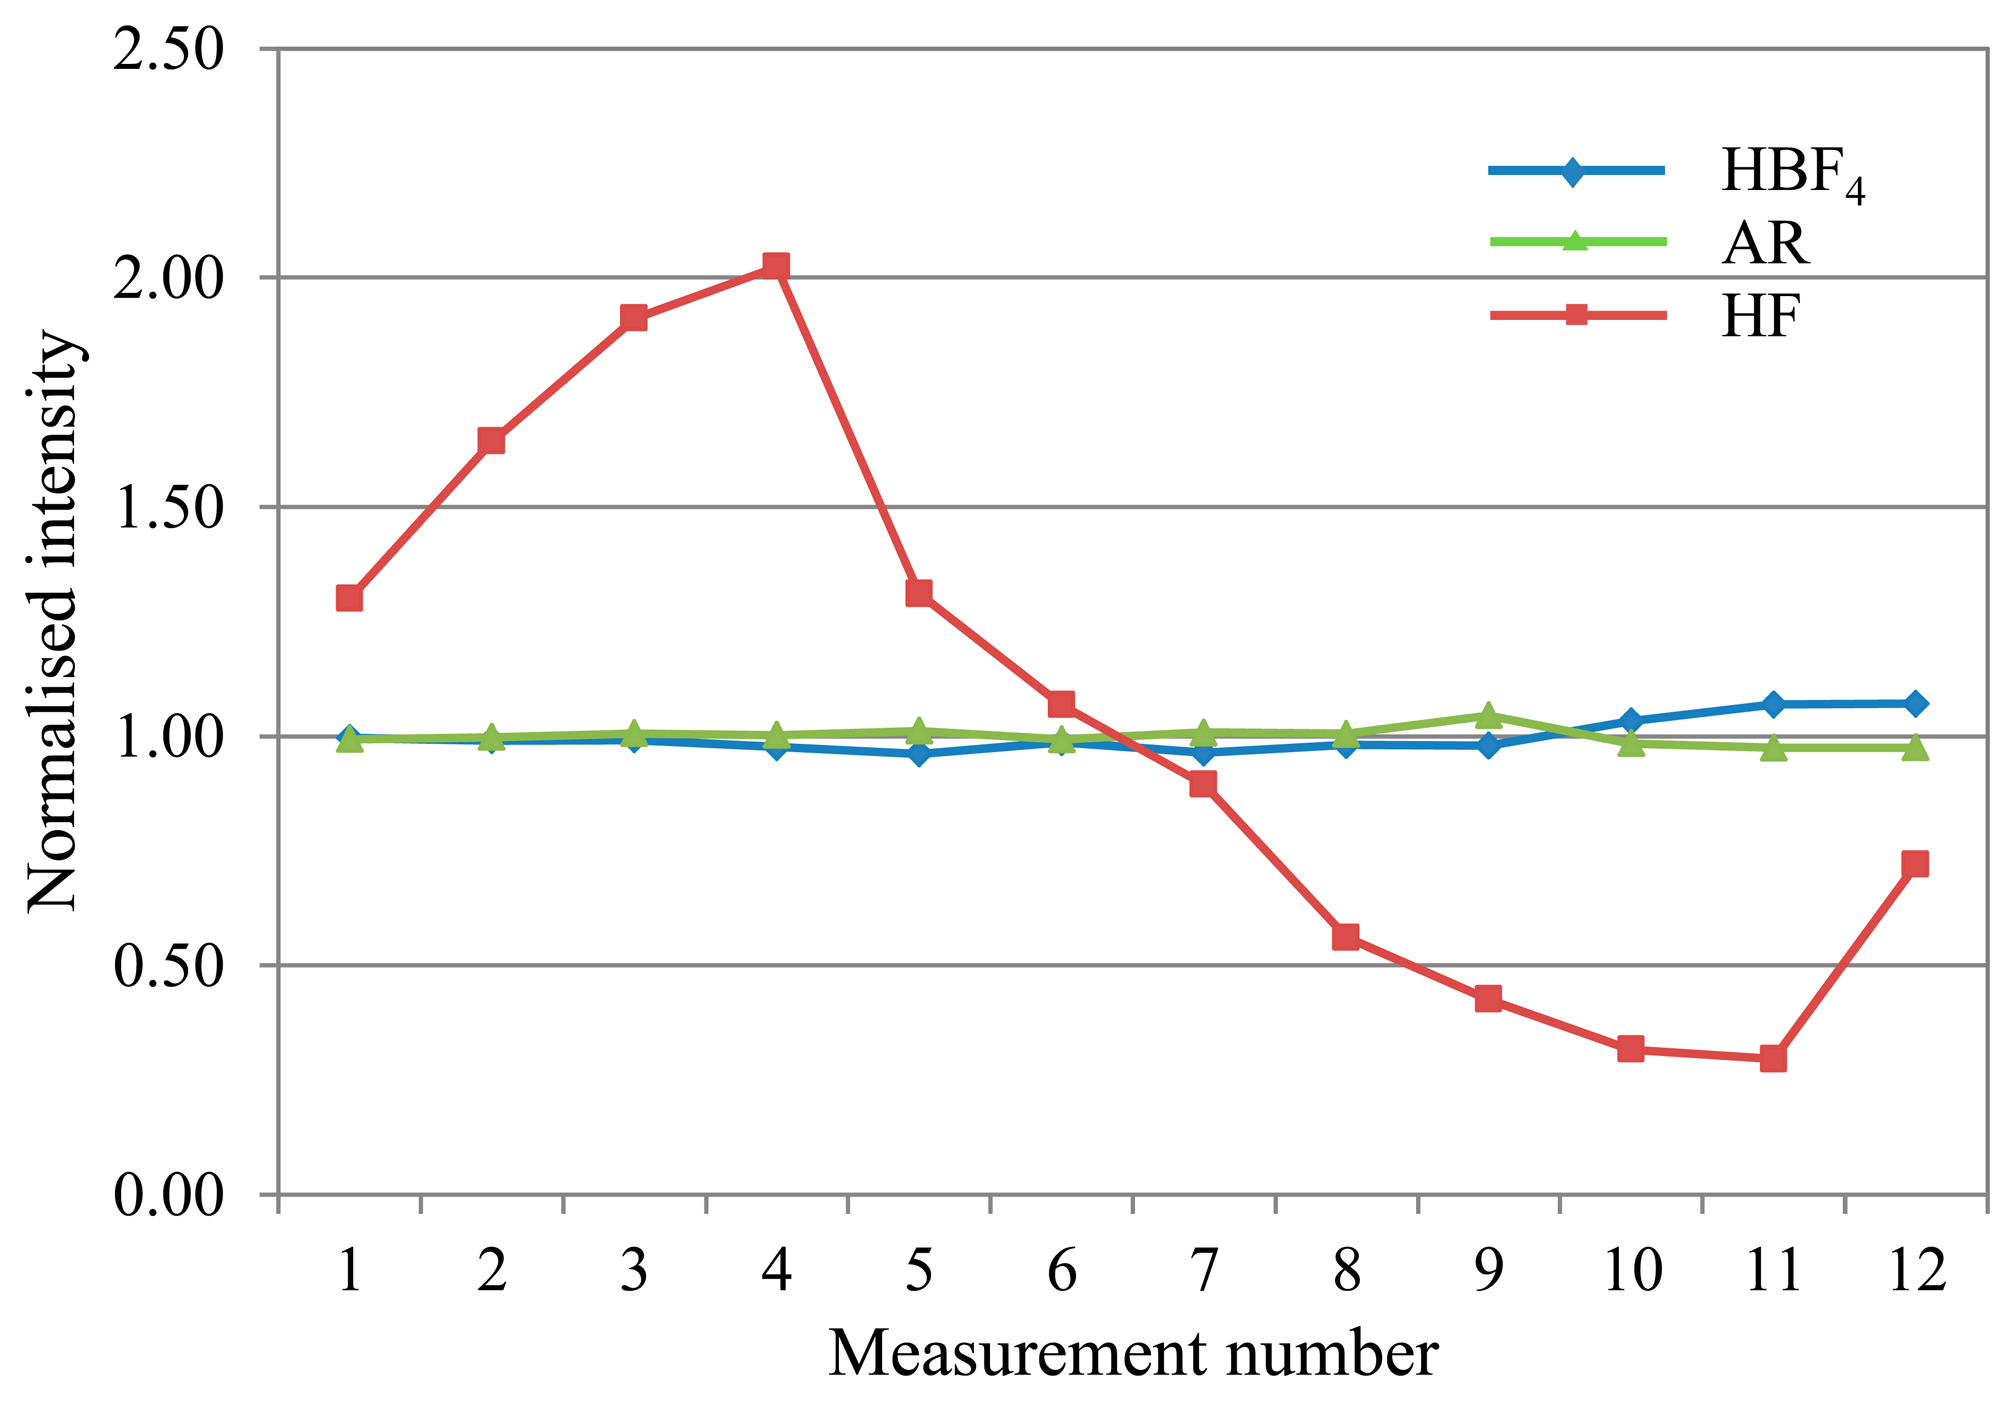
In comparing drift for the three mixtures during a 4.5 h analysis, the majority of analytes showed manageable drift in the range of approximately 0.85–1.15 (normalised to the average intensity for the run) for the proposed alternative matrices. In contrast, the standard HF matrix exhibited significant drift for most analytes, with intensity ratios typically ranging from a peak over 2 early on in the run, before falling away to less than 0.5 by the end. Figure 2 shows typical deviation trends for each of the three matrices as observed with V.
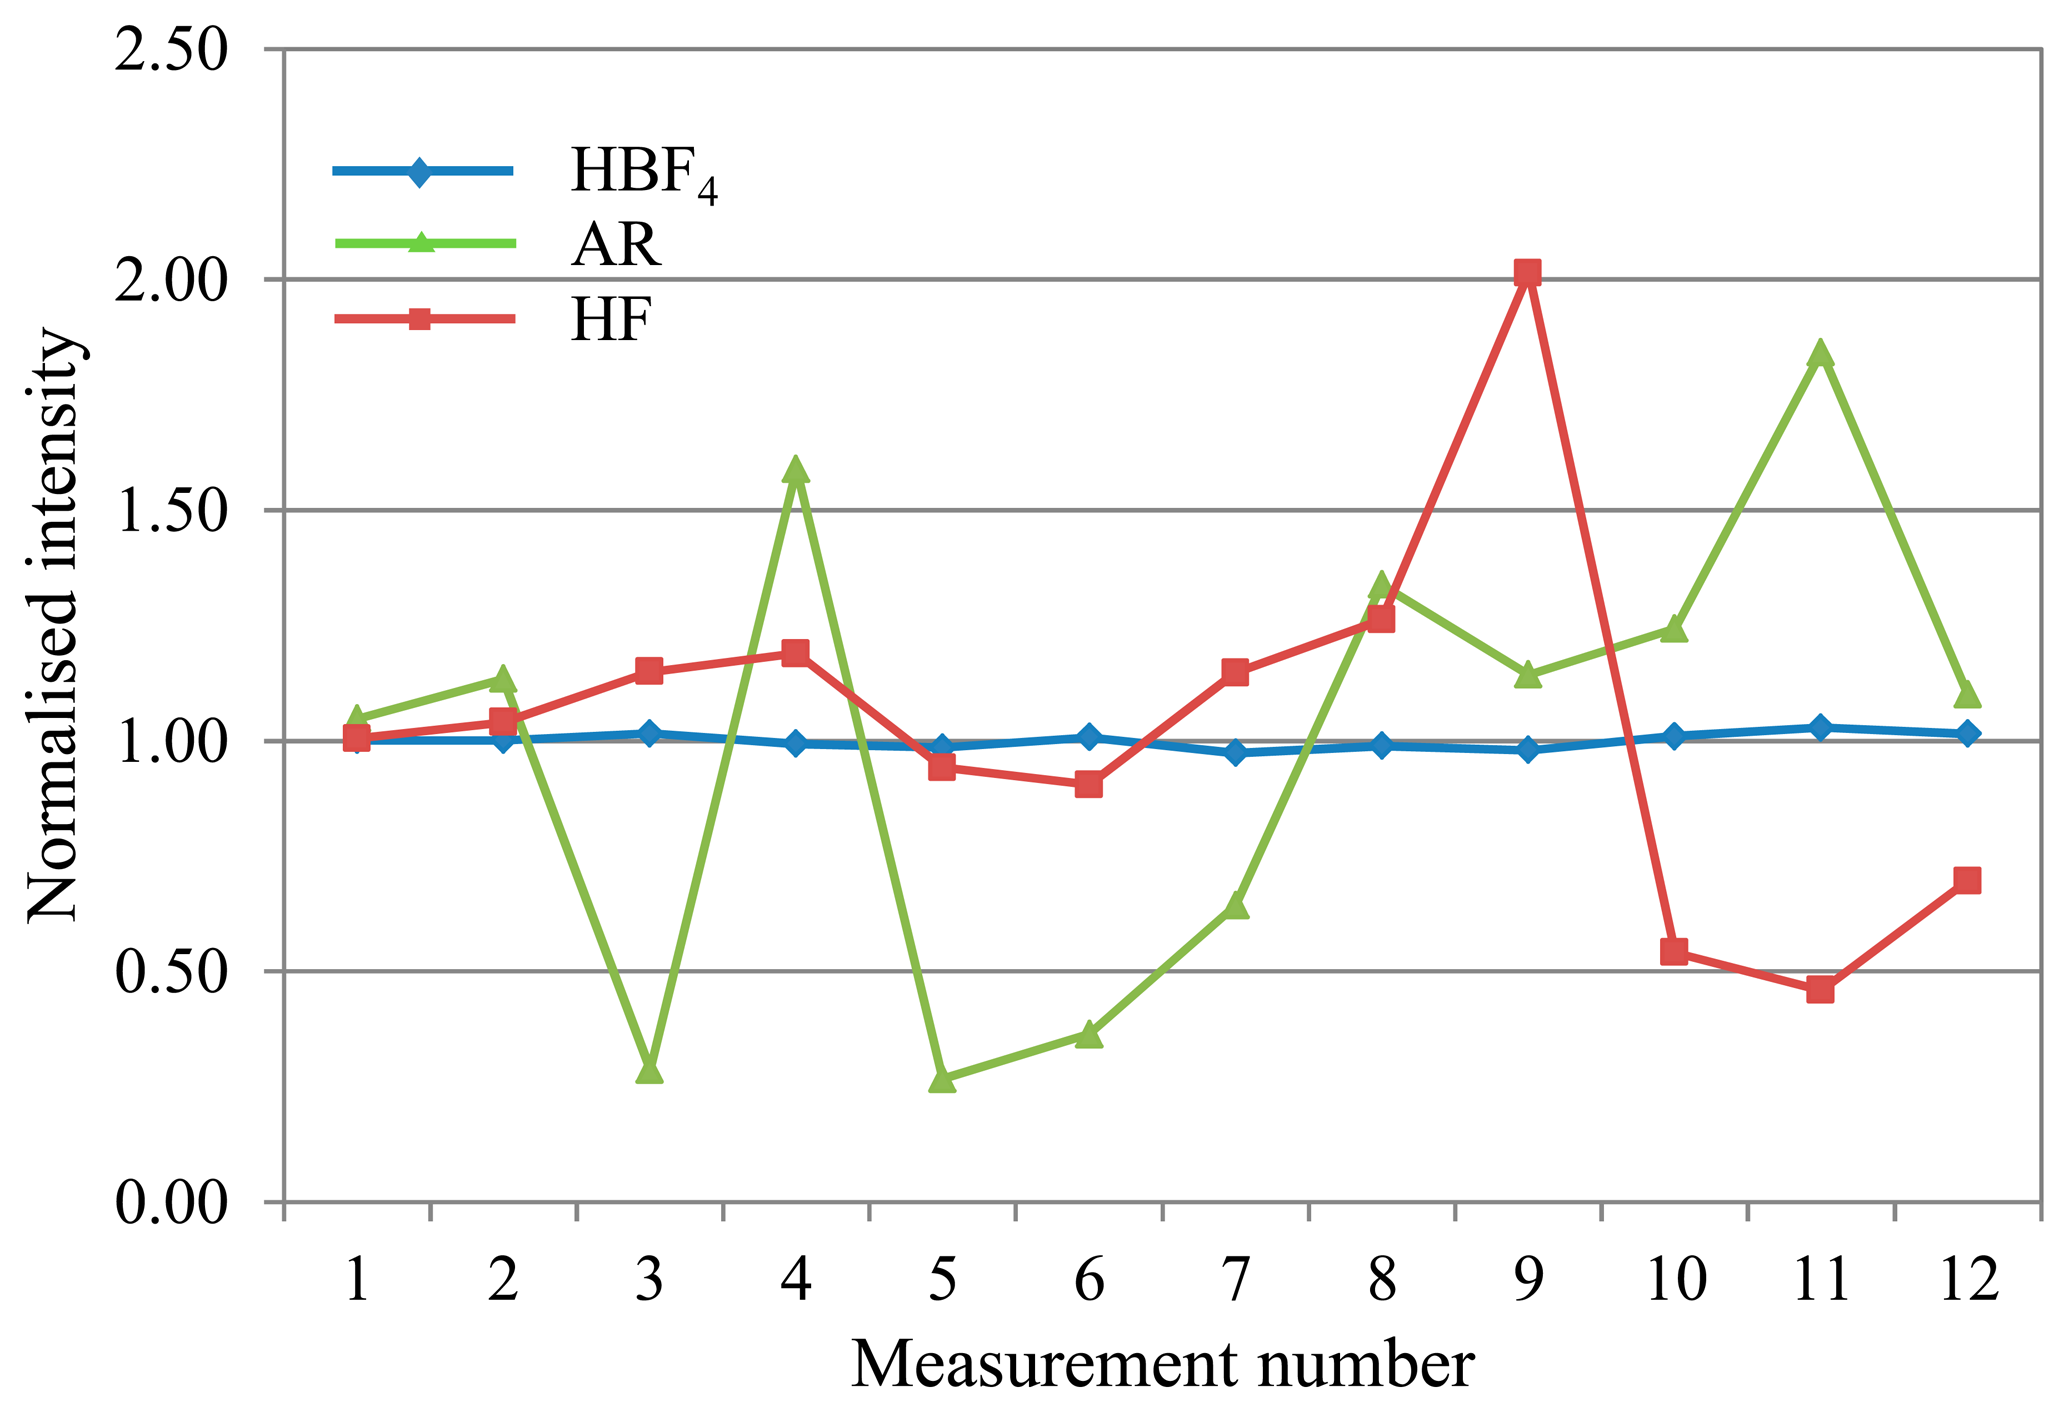
Arsenic (see Figure 3), displayed significant variability in the range 0.20–1.85 with the AR matrix, as explained above. The HF matrix showed a similar deviation range to the AR, in a change from its characteristic drift pattern as seen in Figure 2.
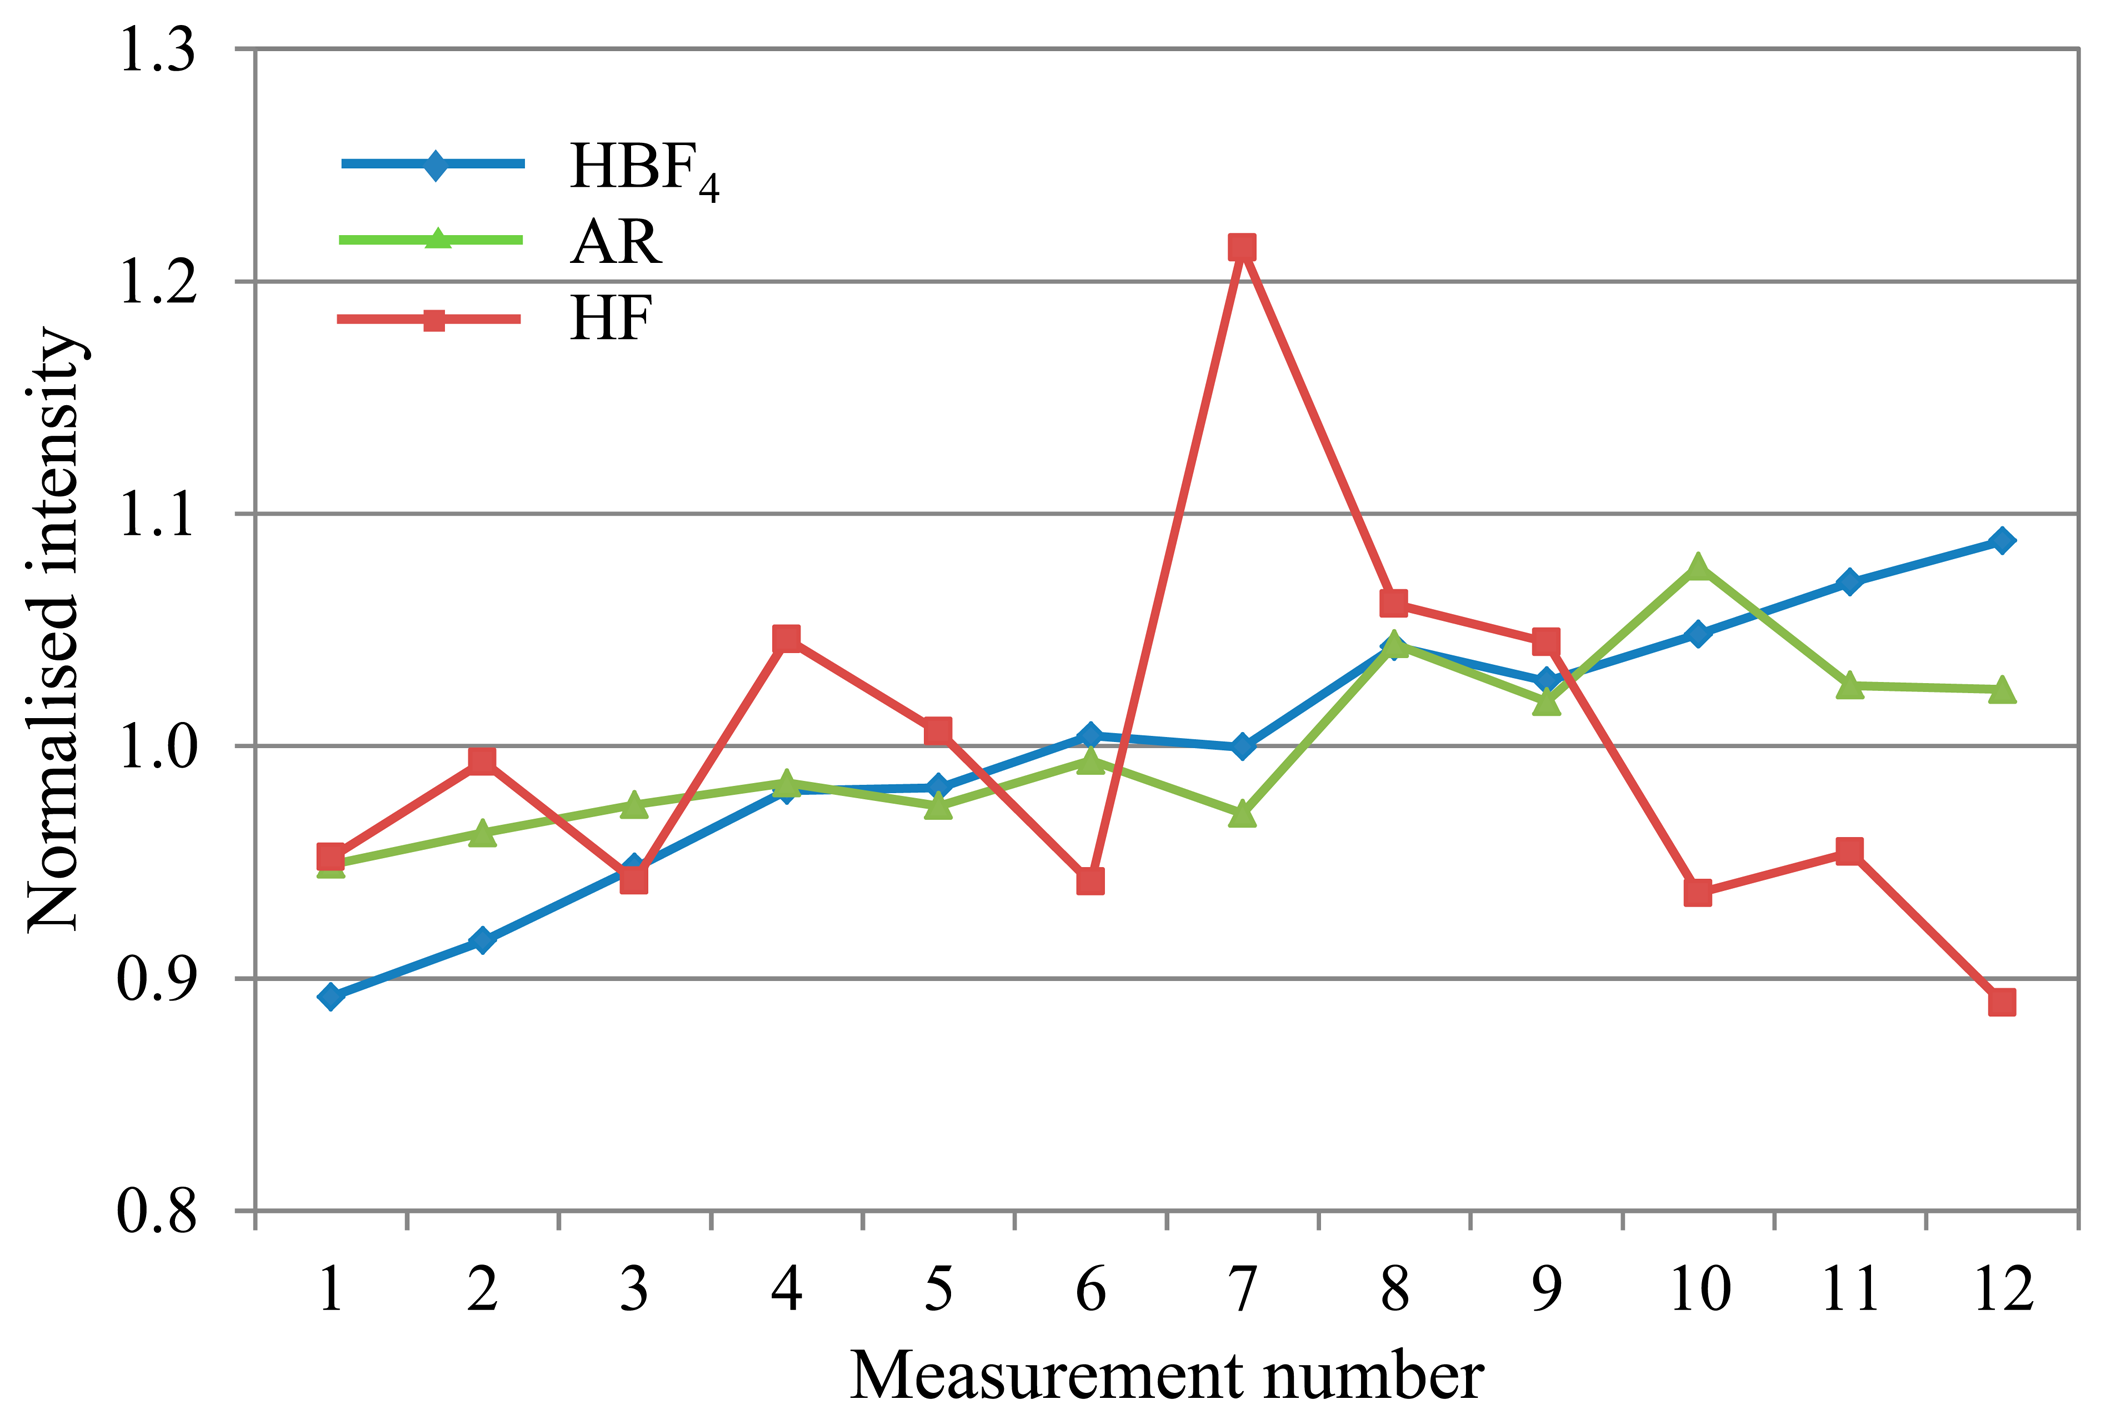
Mercury (see Figure 4), also showed short-term variability with the standard HF matrix.
Overall, the HBF4/HNO3 matrix shows the least and most predictable, and therefore correctable, deviation across an analytical run for most analytes.
3.2. CRM Recoveries
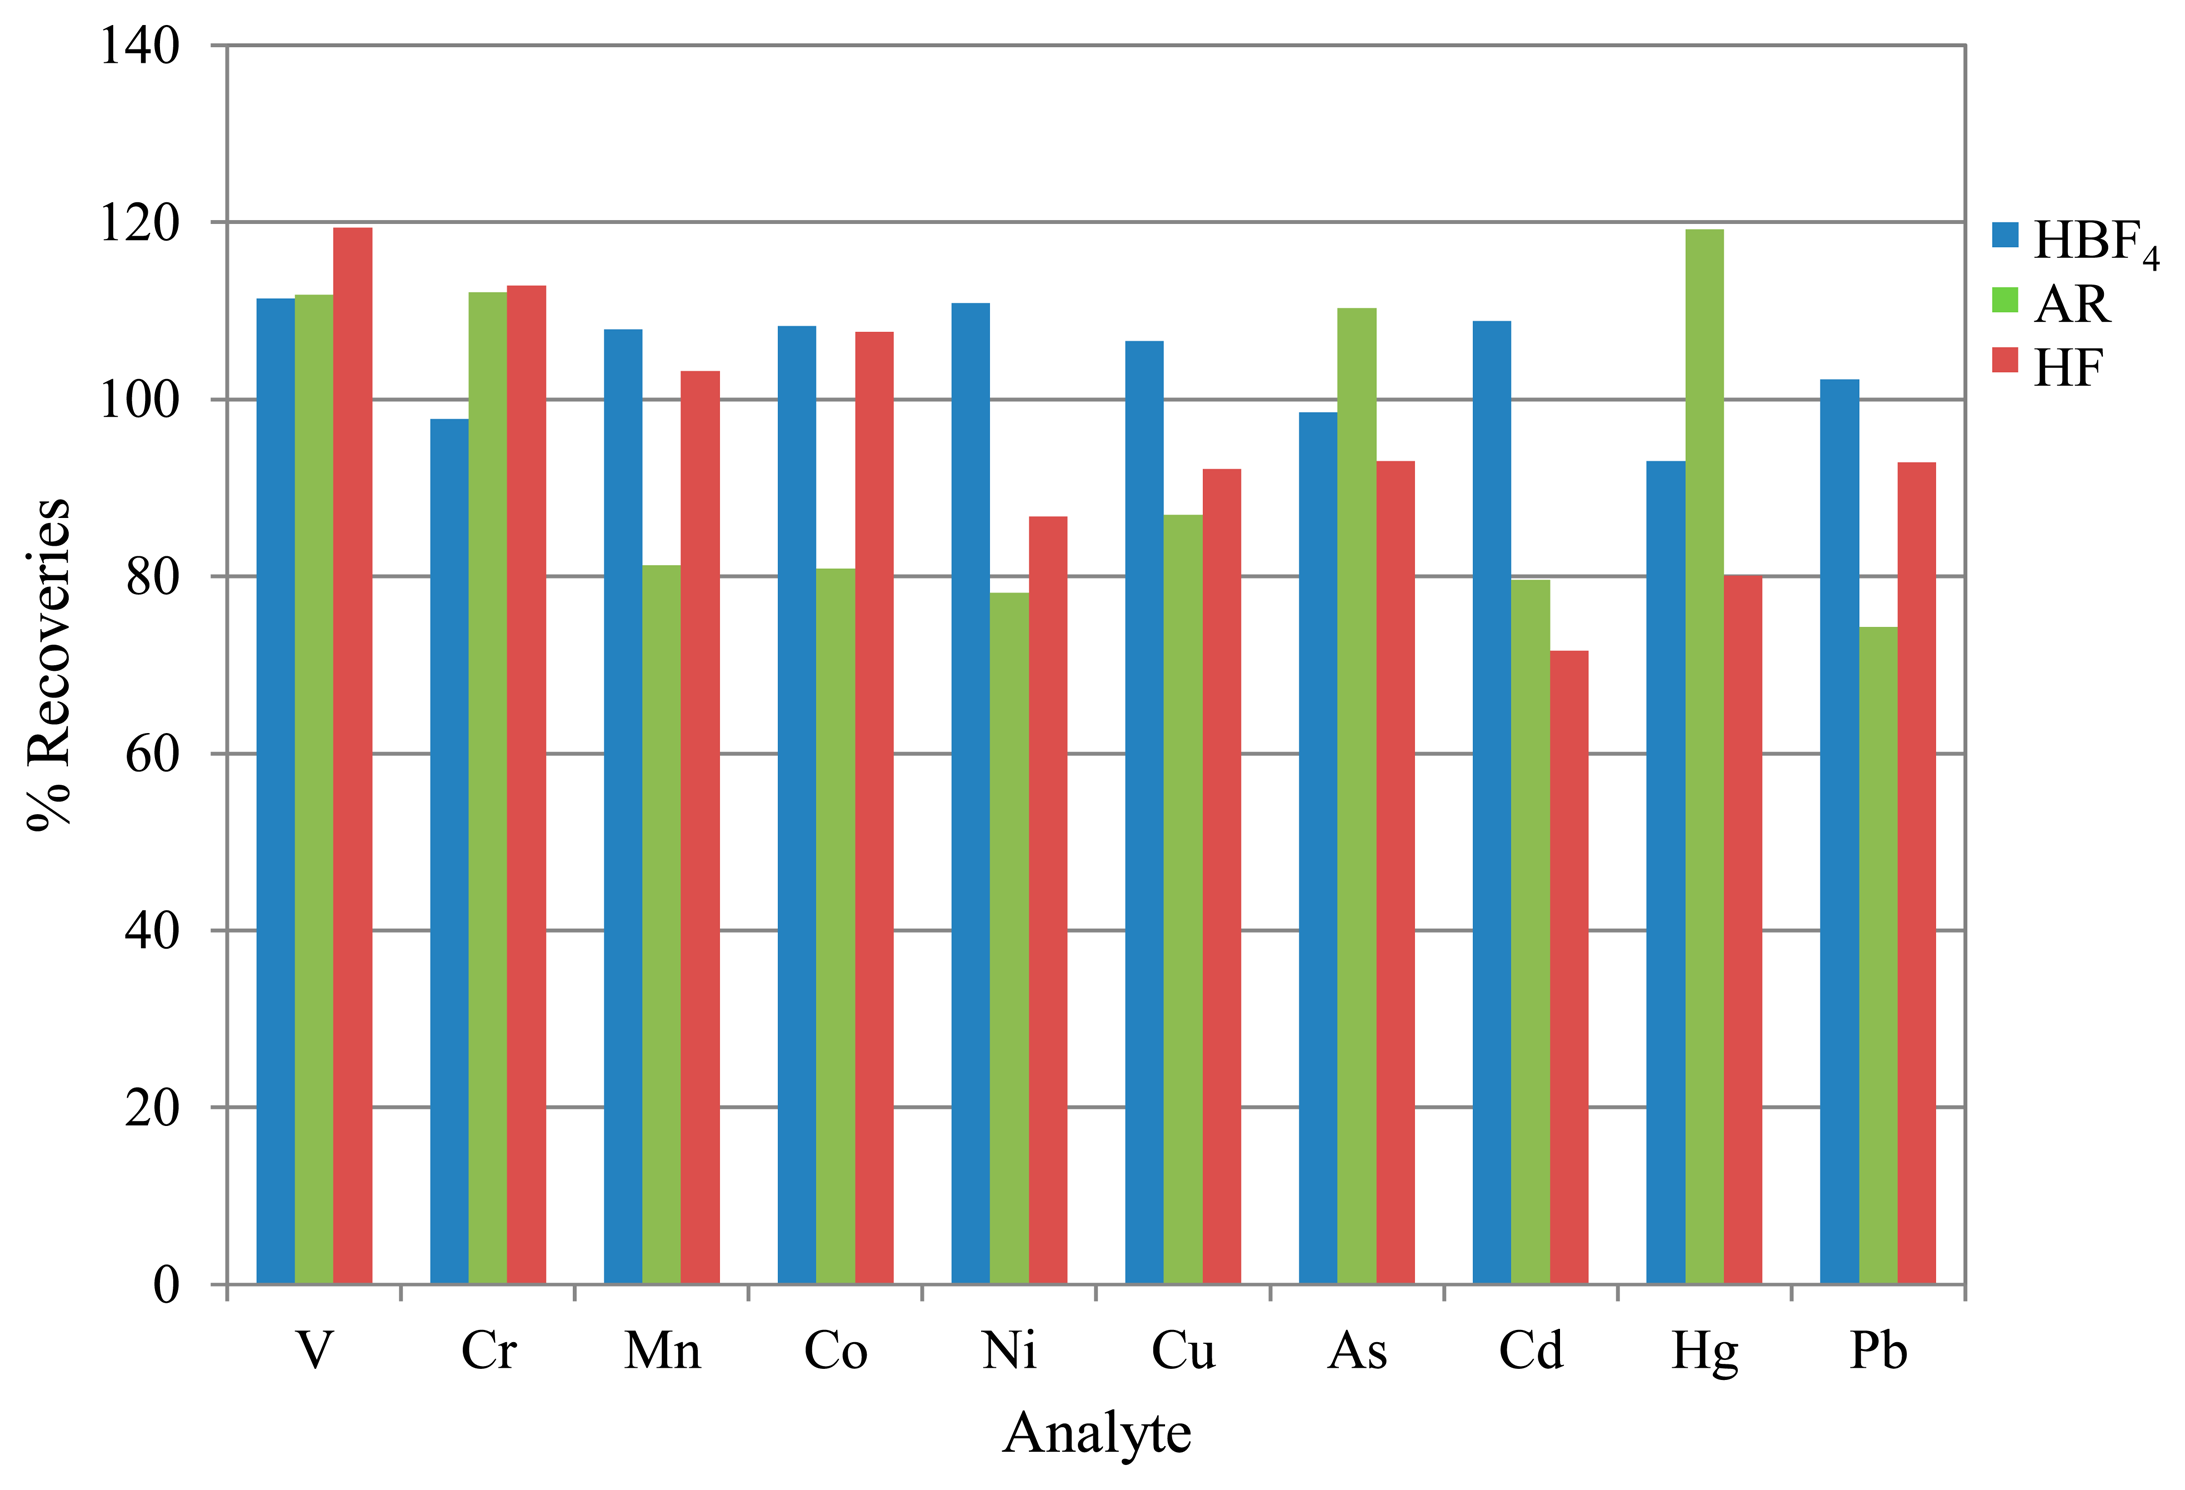
Portions of the CRM recommended in standard EN 14385, BCR-038, were prepared and analysed as specified in the Experimental section. A summary of the results is shown in Figure 5.
The resulting recoveries were within acceptable parameters and comparable to typical recoveries obtained using the standard method of HF digestion or better, showing that both alternative preparation techniques can be considered efficient extraction matrices. However, it can be seen that recoveries are lower for the majority of analytes using the AR extraction. In addition, the high uncertainties associated with V and As suggest a significant interference effect from the HCl (see Table 2 above).
Overall, the HBF4 digestion gives the most accurate average results, with both HF and AR techniques showing reduced recoveries from the mid to high mass range. Additionally, it should be noted that uncertainties associated with the V and As recoveries for the AR matrix were in the region of 100% (k = 2), based on standard deviations of replicate determinations in combination with calibration standard preparation uncertainties. This is attributable to the chloride interferences.
3.3. Test Samples
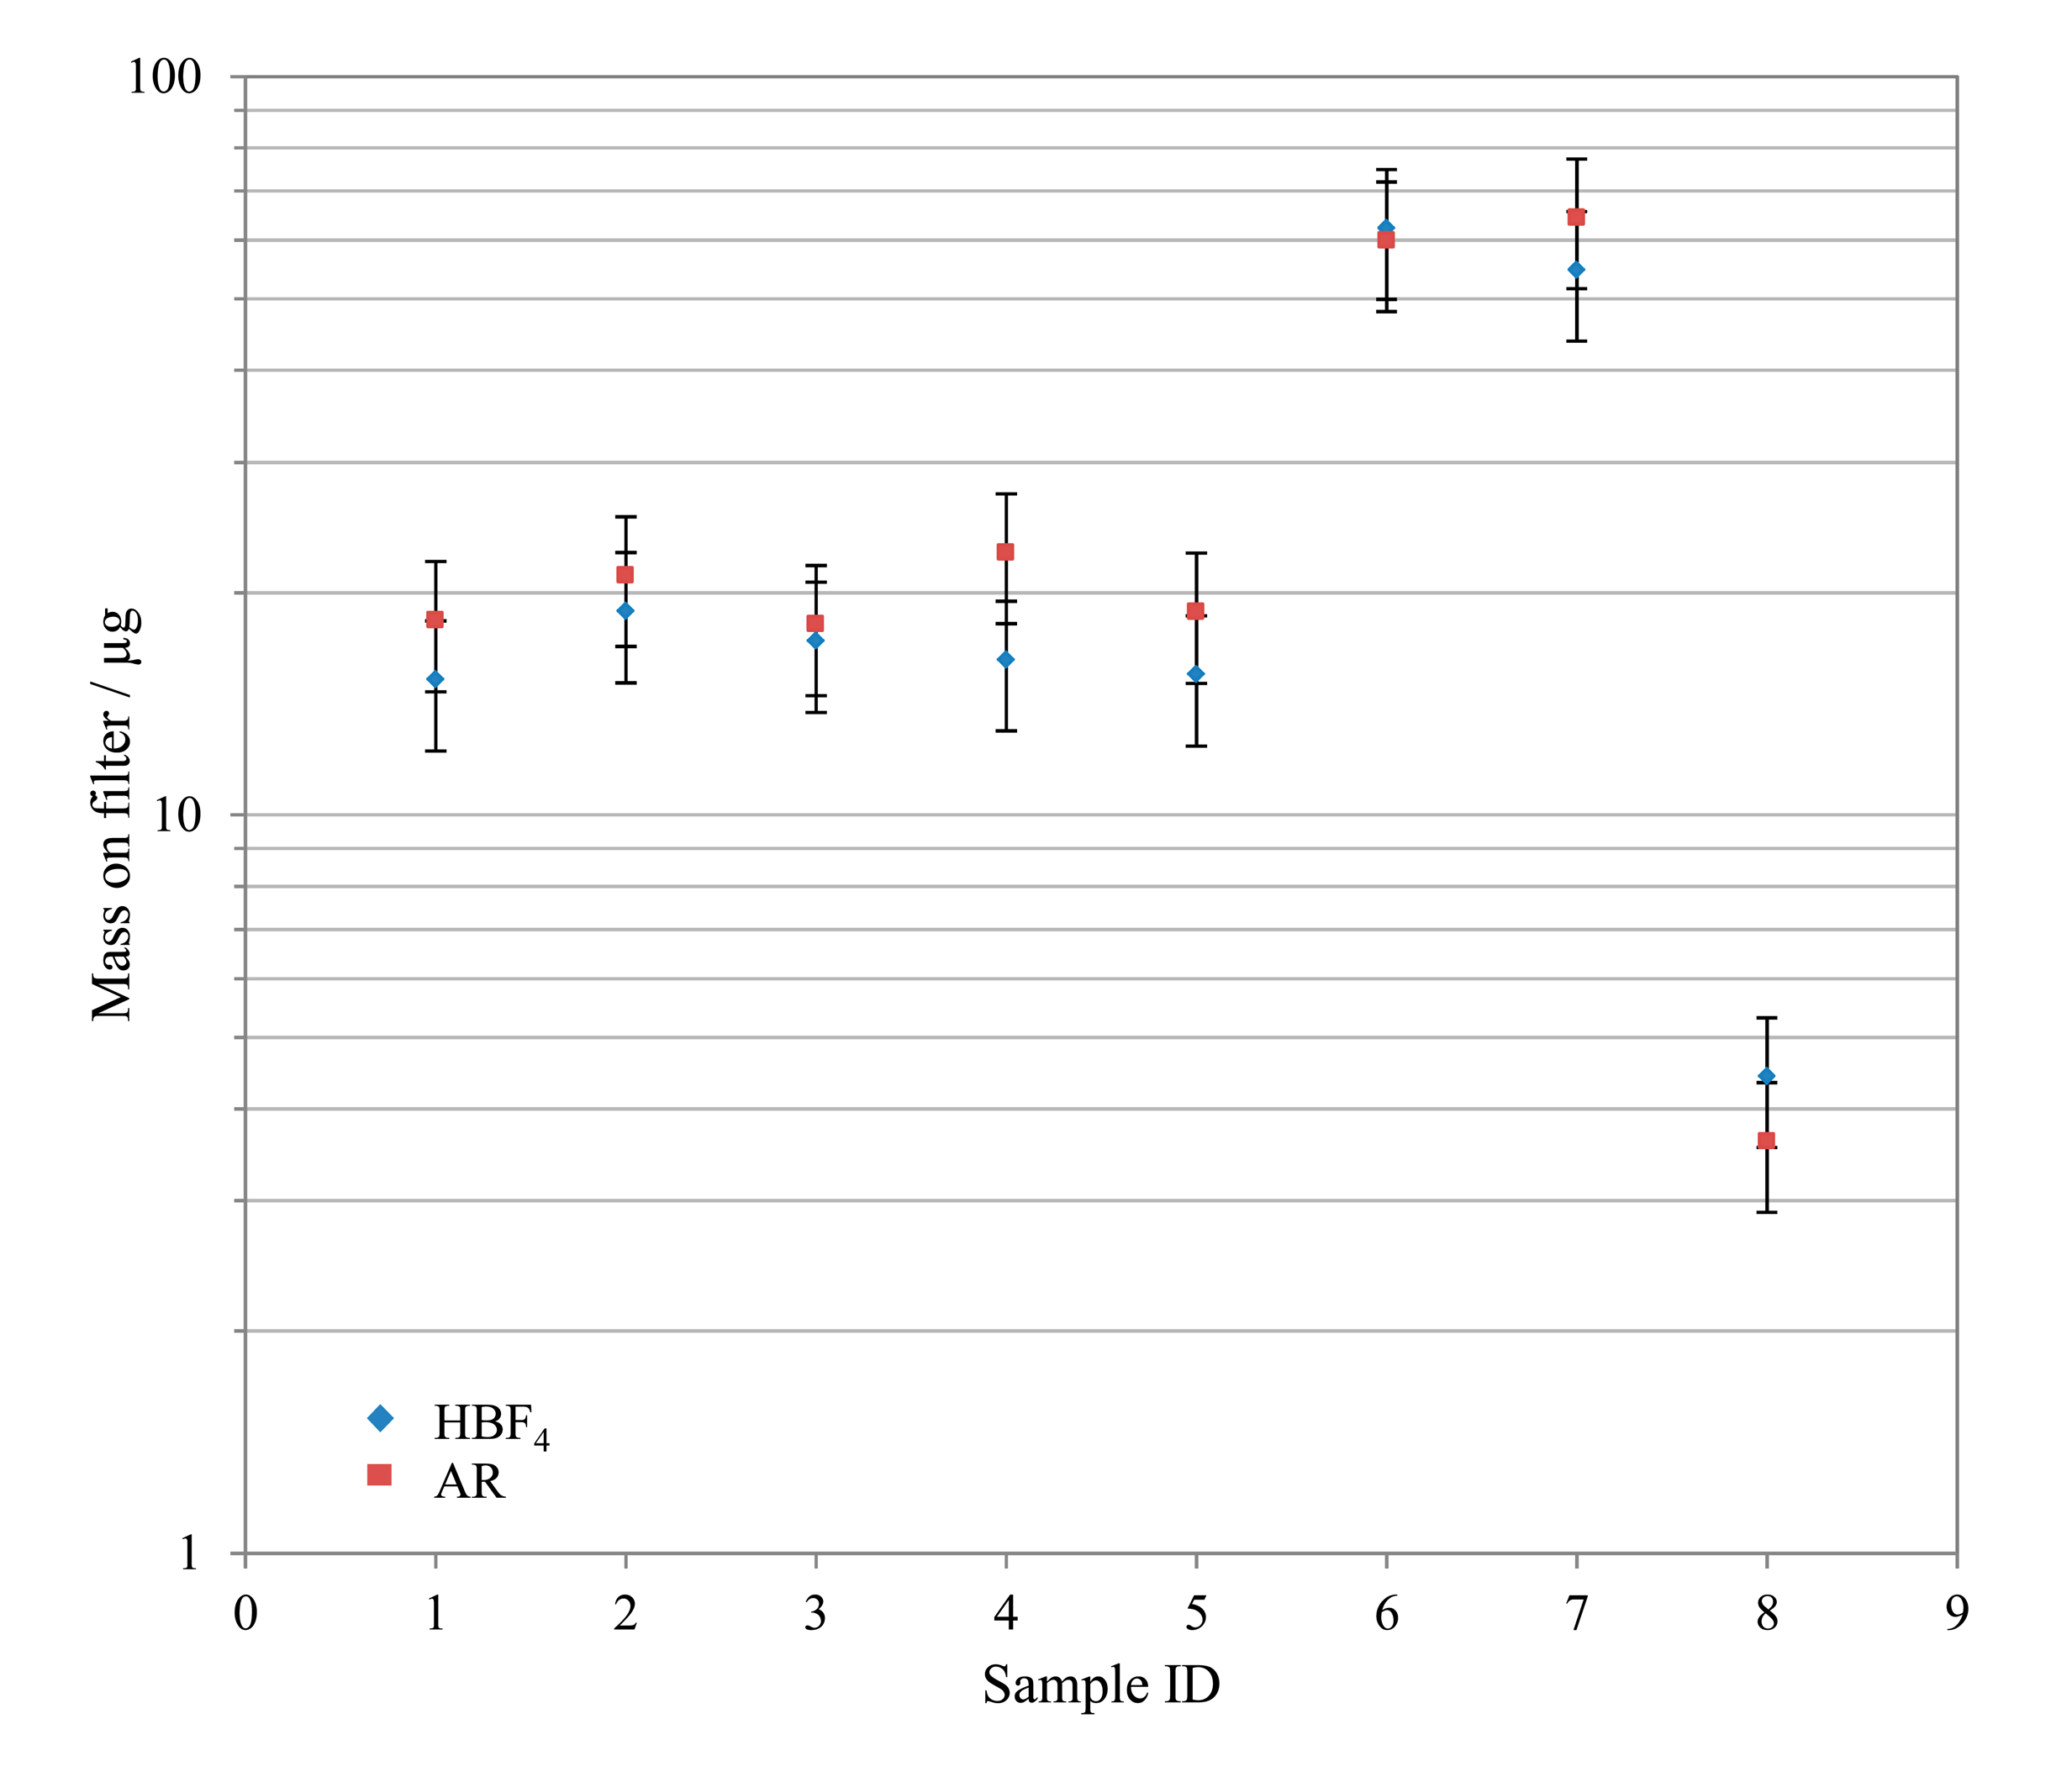
A number of real quartz filter samples taken from a waste incinerator in south east England were prepared according to both alternative preparation techniques. In general, the observed mass on filter results for both preparations agreed to within ±20%, with the exception of levels approaching the detection limit. Figure 6 shows an example of this good comparability for Pb.
3.4. Limits of Detection
The method detection limit for each analyte is based on multiple analyses of the blank matrix solution calculated as specified in EN 14902 [21].
As can be seen in Table 3, the limits of detection for V and As are significantly higher with the AR matrix due to the chloride interference. The HBF4/HNO3 matrix has higher V, Cr, Mn, Hg and Pb detection limits than both the AR and HF matrices. With these exceptions, detection limits for both the alternative matrices are either comparable to or better than those achieved with the standard method (HF). Both show significant improvements for Ni, Cd and Tl over the standard method.
For reporting purposes, the limits of detection (LODs) are based on multiple analyses of blank filters (quarter or half portions of specified diameter quartz filters). However the filter LODs listed in Tables 4 and 5 below should only be considered as indicative, as they are averaged from sub-samples of varying size. Stack emissions can be sampled onto filters of various diameters, from which different portions are sub-sampled thereof (considering what area of filter can reasonably be expected to be extracted by 10 mL acid). The results were normalised for the total and sub-sampled filter areas, but ideally, further tests should be performed to verify separate LODs for all the different permutations of filter and sub-sample portion sizes that could be used.
The filter sub-sample is digested in the appropriate acid matrix, then corrected to account for the sub-sampling and any dilutions to which the samples were subjected in the preparation stage. To be fit for purpose, the dilution-corrected limits of detection, when converted to a concentration in air, need to be below the IED limit values (0.05 mg·m−3 (standardised for temperature and pressure) for Cd and Tl combined, 0.05 mg·m−3 for Hg, and 0.5 mg·m−3 for the sum of Sb, As, Pb, Cr, Co, Cu, Mn, Ni, V) [4]. To ensure that any result at or above the IED limit values would be detected, the dilution-corrected method limits of detection were converted to their maximum theoretical concentration in emissions, based on a minimum sampling time of 30 min at a minimum flow rate of 1 m3·hr−1:
| LODm is the method detection limit (dilution corrected)/μg·g−1 |
| m is the mass of diluted sample/g |
| v is the minimum volume of air sampled/m3 |
In EN 14385 [7], the maximum permissible detection limit for each element from the entire sampling train is 5 μg·m−3. As the HF digestion preparation has been shown to meet this criterion, and the LODs obtained with the alternative methods will also meet this limit given that they show very similar values.
Table 5 shows that the theoretical maximum limit of detection values for all analytes, summed as specified in the IED Directive, were significantly less than their corresponding limit values—at least two orders of magnitude in most cases. Therefore it may be confidently accepted that any sample of a concentration at or above the IED limit value, prepared with either of the proposed techniques, will be detected and reported.
4. Conclusions
This report has proposed two alternative sample preparation techniques (HBF4/HNO3 digestion and extraction with AR) to the technique described in EN 14385 [7] (digestion with HF) for the preparation of stationary source emission samples.
All the matrices being considered have particular analytical challenges associated with them, including the EN 14385 standard HF method. The advantages and disadvantages of each were identified and assessed in terms of their impact on the quality of analytical results. A summary of the comparison of the three acid mixtures for sample preparation is shown in Table 6.
The AR preparation introduces spectral interferences that arise from the chloride in the matrix and significantly affect the measurement of V and As. Mitigation measures including application of an interference correction calculation on the As measurement and reducing the nebuliser flow rate have been shown to reduce the impact of these interferences. However this interference has a significantly detrimental effect on the signal stability of As, such that the drift correction as described would provide insufficient compensation.
Salt formation was a problem experienced with both the standard method (HF/HNO3/H3BO3) and the HBF4/HNO3 matrix. The fluoride and H3BO3 components had a tendency to bond with the metal analytes to form salts [20], which would precipitate out of solution when subjected to the high temperatures in the Ar plasma of the ICP-MS [19]. These salts would then coat the ICP-MS cones, resulting in increased signal drift and the potential for interferences. An additional consequence would be a reduction in the analyte signal, assuming some of the analyte ions had formed salt compounds, so would not be detected at their mass to charge ratio. Since the HBF4/HNO3 matrix contained much lower levels of salt precursors, it was found to be the least affected in terms of signal drift. Even with this matrix it is worth keeping run times to a minimum, and cleaning the cones after every run in order to curtail salt accumulation. Linear calibrations have been achieved with standards prepared in the HBF4/HNO3 matrix, suggesting that heating the matrix solution is not necessary in order to hydrolyse the fluoroboric ions to prevent interference formation, as it is with the standard preparation.
It has been established that both alternative preparation methods can achieve quantitative recoveries of the CRM recommended in EN 14385 [7], comparable or better to those obtained by the standard method of HF digestion. Recoveries with the HBF4/HNO3 matrix were the most consistently accurate across the mass range.
Testing of real filter samples showed good agreement between the HBF4/HNO3 digestion and AR extraction methods. Due to insufficient sample availability, test filter sample results were only compared between the two alternative methods, so future work should ideally include a comparison of sample results obtained with the standard method as well. Also, no filter rinsing solutions were tested with the new methods, so further tests should be conducted to ensure comparability of results can be achieved for this sample type.
Limits of detection have been determined and assessed as likely to be fit-for-purpose by comparison with the IED limit values [4] for both alternative matrices, subject to a thorough investigation of concentrations in the various sub-sampling portions.
Overall, this work has shown that the proposed preparation technique of HBF4/HNO3 digestion currently offers the most viable alternative to the standard method of digestion with HF, while offering a much reduced health and safety risk to scientists. We propose that this alternative sample preparation method should be considered for inclusion when the current EN14385 standard is revised.
Acknowledgments
The funding, by the UK Department for Business, Innovation and Skills, of the National Measurement System's Chemical and Biological Metrology Programme is gratefully acknowledged. The authors thank K. C. Blakley, M. R. Ellison and M. J. Clack for useful discussions during preparation of the manuscript.
Author Contributions
S.L.G. and R.J.C.B. conceived the idea and planned the experiments. S.L.G. carried out the experimental analyses. S.L.G. and R.J.C.B. interpreted the results and produced the manuscript.
Conflicts of Interest
The authors declare no conflict of interest.
References
- World Health Organization. Inorganic Lead. (Environmental Health Criteria 165); World Health Organization: Geneva, Switzerland, 1995. [Google Scholar]
- Valavanidis, A.; Fiotakis, K.; Vlachogianni, T. Airborne particulate matter and human health: Toxicological assessment and importance of size and composition of particles for oxidative damage and carcinogenic mechanisms. J. Environ. Sci. Health C Environ. Carcinog. Ecotoxicol. Rev. 2008, 26, 339–362. [Google Scholar]
- Davidson, C.I.; Phalen, R.F.; Solomon, P.A. Airborne particulate matter and human health: A review. Aerosol Sci. Technol. 2005, 39, 737–749. [Google Scholar]
- European Union. Directive 2010/75/EU of the European Parliament and of the Council of 24 November 2010 on Industrial Emissions (Integrated Pollution Prevention and Control). Off. J. Eur. Union 2010, L334, 17–119. [Google Scholar]
- Environment Agency. Monitoring emissions to air, land and water (MCERTS). Available online: https://www.gov.uk/government/collections/monitoring-emissions-to-air-land-and-water-mcerts (accessed on 2 September 2014).
- Environment Agency. RM-QG8 Selecting a MCERTS Accredited Laboratory for Stack Emissions Monitoring or EN 14181. Available online: https://www.gov.uk/government/uploads/system/uploads/attachment_data/file/301020/RM-QG08.pdf (accessed on 13 November 2014).
- EN 14385-2004. In Stationary Source Emissions—Determination of the Total Emission of As, Cd, Cr, Co, Cu. Mn, Ni, Pb, Sb, Tl and V; CEN: Brussels, Belgium, 2004.
- Environment Agency. Method Implementation Document for EN 14385. Available online: www.s-t-a.org/Files%20Public%20Area/MCERTS-MIDs/MID14385%20metals.pdf (accessed on 13 November 2014).
- Perkin Elmer. Atomic Spectroscopy: A Guide to Selecting the Appropriate Technique and System. Available online: http://www.perkinelmer.co.uk/PDFS/downloads/bro_worldleaderaaicpmsicpms.pdf (accessed on 2 September 2014).
- Brown, R.J.C.; Goddard, S.L.; Blakley, K.C.; Brown, A.S. Improvements to standard methodologies for the analytical determination of metals in stationary-source emissions samples. J. Air Waste Manag. 2011, 61, 764–770. [Google Scholar]
- Kulkarni, P.; Chellam, S.; Ghurye, G.; Fraser, M.P. In Situ Generation of Hydrofluoric Acid during Microwave Digestion of Atmospheric Particulate Matter Prior to Trace Element Analysis Using Inductively Coupled Plasma Mass Spectrometry. Environ. Eng. Sci. 2003, 20, 517–531. [Google Scholar]
- Krachler, M.; Mohl, C.; Emons, H.; Shotyk, W. Influence of digestion procedures on the determination of rare earth elements in peat and plant samples by USN-ICP-MS. J. Anal. Atom. Spectrom. 2002, 17, 844–851. [Google Scholar]
- ISO 11466: 1995. In Soil Quality—Extraction of Trace Elements Soluble in Aqua Regia; ISO: Geneva, Switzerland, 1995.
- Chen, M.; Ma, L.Q. Comparison of Three Aqua Regia Digestion Methods for Twenty Florida Soils. Soil Sci. Soc. Am. J. 2001, 65, 491–499. [Google Scholar]
- Smith, I.M. Software for Determining Polynomial Calibration Functions by Generalised Least Squares: User Manual; NPL: Teddington, UK, 2010. [Google Scholar]
- Berglund, M.; Wieser, M. Isotopic Compositions of the Elements 2009 (IUPAC Technical Report). Pure Appl. Chem. 2011, 83, 397–410. [Google Scholar]
- Sparks, D.L. Methods of Soil Analysis Part 3: Chemical Method; Soil Society of America/American Society of Agronomy: Madison, WI, USA, 1996. [Google Scholar]
- Ryss, I.G. The Chemistry of Fluorine and Its Inorganic Compounds; U.S. Atomic Energy Commission, Technical Information Service: Germantown, MD, USA, 1960. [Google Scholar]
- Robinson, C.D.; Devalla, S. Fisheries Research Services Internal Report No. 09/05: An Improved Method for Total Digestion and ICP-MS Determination of Metals in Sediment; Fisheries Research Services: Aberdeen, UK, 2005. [Google Scholar]
- Papcun, J.R. Fluorine Compounds, Inorganic, Fluoroboric Acid and Fluoroborates; Kirk-Othmer Encyclopedia of Chemical Technology; Wiley: London, UK, 2000. [Google Scholar]
- EN 14902-2005. In Ambient Air Quality—Standard Method for the Measurement of Pb, Cd, As and Ni in the PM10 Fraction of Suspended Particulate Matter; CEN: Brussels, Belgium, 2005.


| Optimisation Parameter | Setting |
|---|---|
| Nebuliser Flow (L/min) | 0.87–0.93 |
| Lens Voltage (V) | Mg 4.25–5.75, U 7.25–9.25 |
| Power (W) | 1250 |
| Auxiliary Gas Flow (L/min) | 1.20 |
| Plasma Gas Flow (L/min) | 15.00 |
| Analog Stage Voltage (V) | −1950 |
| Pulse Stage Voltage (V) | 1100 |
| Quadrupole Rod Offset Std [QRO] (V) | 0.00 |
| Cell Rod Offset Std [CRO] (V) | −12.00 |
| Cell Path Voltage Std [CPV] (V) | −11.00 |
| Discriminator Threshold (V) | 25.00 |
| Analyte | Mean Recovery / % | Acceptable Range / % | ||
|---|---|---|---|---|
| HBF4 Matrix | AR Matrix | HF Matrix (EN 14385) | ||
| V | 111 | 112 | 119 | N/A * |
| Cr | 98 | 112 | 113 | 90–110 |
| Mn | 108 | 81 | 103 | 90–110 |
| Co | 108 | 81 | 108 | 90–110 |
| Ni | 111 | 78 | 87 | N/A * |
| Cu | 107 | 87 | 92 | 90–110 |
| As | 99 | 110 | 93 | 90–110 |
| Cd | 109 | 80 | 72 | 87–113 |
| Hg | 93 | 119 | 80 | 86–114 |
| Pb | 102 | 74 | 93 | 90–110 |
| Analyte | LOD/ng·g−1 | ||
|---|---|---|---|
| HBF4 Matrix | AR Matrix | HF Matrix (EN 14385) | |
| V | 2.08 | 60.7 | 1.26 |
| Cr | 9.79 | 5.60 | 0.349 |
| Mn | 7.85 | 0.152 | 4.57 |
| Co | 0.373 | 0.002 | 0.357 |
| Ni | 0.353 | 0.141 | 1.74 |
| Cu | 1.10 | 0.045 | 2.92 |
| As | 0.430 | 2.28 | 0.296 |
| Cd | 0.018 | 0.001 | 0.037 |
| Sb | 0.243 | 0.018 | 0.136 |
| Hg | 0.204 | 0.018 | 0.060 |
| Tl | 0.001 | 0.004 | 0.014 |
| Pb | 5.39 | 0.013 | 0.432 |
| Analyte | Concentration of Analyte in Emissions / μg·m−3 | ||
|---|---|---|---|
| HBF4 Digestion | AR Extraction | HF Digestion (EN 14385) | |
| V | 0.555 | 3.453 | 0.662 |
| Cr | 3.764 | 1.955 | 1.661 |
| Mn | 2.838 | 0.475 | 0.409 |
| Co | 0.170 | 0.055 | 0.032 |
| Ni | 1.260 | 0.618 | 2.140 |
| Cu | 3.008 | 1.982 | 3.044 |
| As | 0.315 | 0.539 | 0.759 |
| Cd | 0.128 | 0.004 | 0.017 |
| Sb | 1.457 | 0.030 | 0.052 |
| Hg | 0.073 | 0.008 | 0.056 |
| Tl | 0.020 | 0.004 | 0.004 |
| Pb | 1.057 | 0.222 | 1.033 |
| Concentration of Analyte in Emissions/μg·m−3 | ||||
|---|---|---|---|---|
| HBF4 Digestion | AR Extraction | HF Digestion (EN 14385) | IED Limit Values [4] | |
| Sum V-Pb | 14.42 | 9.33 | 9.792 | 500 |
| Sum Cd, Tl | 0.148 | 0.008 | 0.021 | 50 |
| Hg | 0.073 | 0.008 | 0.056 | 50 |
| Acid Mixture | Drift | CRM Recovery | LOD |
|---|---|---|---|
| HBF4 digestion | 1 | 1 | 2 |
| AR extraction | 2 | 3 | 3 |
| HF digestion (EN 14385) | 3 | 2 | 1 |
© 2014 by the authors; licensee MDPI, Basel, Switzerland. This article is an open access article distributed under the terms and conditions of the Creative Commons Attribution license ( http://creativecommons.org/licenses/by/3.0/).
Share and Cite
Goddard, S.L.; Brown, R.J.C. Investigation into Alternative Sample Preparation Techniques for the Determination of Heavy Metals in Stationary Source Emission Samples Collected on Quartz Filters. Sensors 2014, 14, 21676-21692. https://doi.org/10.3390/s141121676
Goddard SL, Brown RJC. Investigation into Alternative Sample Preparation Techniques for the Determination of Heavy Metals in Stationary Source Emission Samples Collected on Quartz Filters. Sensors. 2014; 14(11):21676-21692. https://doi.org/10.3390/s141121676
Chicago/Turabian StyleGoddard, Sharon L., and Richard J. C. Brown. 2014. "Investigation into Alternative Sample Preparation Techniques for the Determination of Heavy Metals in Stationary Source Emission Samples Collected on Quartz Filters" Sensors 14, no. 11: 21676-21692. https://doi.org/10.3390/s141121676