Mycobacterium tuberculosis DNA Detection Using Surface Plasmon Resonance Modulated by Telecommunication Wavelength

Abstract
: A surface plasmon resonance sensor for Mycobacterium tuberculosis (MTB) deoxyribonucleic acid (DNA) is developed using repeatable telecommunication wavelength modulation based on optical fiber communications laser wavelength and stability. MTB DNA concentrations of 1 μg/mL and 10 μg/mL were successfully demonstrated to have the same spectral half-width in the dip for optimum coupling. The sensitivity was shown to be −0.087 dB/(μg/mL) at all applied telecommunication wavelengths and the highest sensitivity achieved was 115 ng/mL without thiolated DNA immobilization onto a gold plate, which is better than the sensor limit of 400 ng/mL possible with commercial biosensor equipment.1. Introduction
Mycobacterium tuberculosis (MTB) is the causative agent of human tuberculosis, a disease that causes millions of deaths every year. Most MTB-related deaths could be prevented by early diagnosis and treatment. MTB diagnosis is traditionally conducted using smear microscopy and culture methods. However, the former has lower sensitivity and the latter requires about six to eight weeks to process preliminary test reports [1]. MTB deoxyribonucleic acid (DNA) detection in clinical specimens such as the sputum and blood from patients suffering from acute pulmonary tuberculosis [2] is reliable because of the stability of DNA. In addition, the long half-life of the DNA pattern, such as insertion sequence (IS) 6110, a DNA sequence specific for MTB was typically used to identify the reactivation and track MTB transmission [3]. Specific DNA sequence amplification using polymerase chain reaction (PCR) is a sensitive method for mycobacterial detection, but false-positive results could be generated due to amplified DNA contamination from the PCR laboratory [4]. Moreover, this technique requires expensive reagents, testing devices and well-trained personnel. It is necessary to search for more efficient diagnostic methods. Surface plasmon resonance (SPR) sensors have made significant progress in both technical and application aspects mainly because of their instant detection and label-free features. The analyzed analyte and its corresponding binding reaction with the receptor could be instantly detected [5,6].
SPR applications included bacteria, viruses, toxins, allergens, and biomedical analytes besides environmental pollutants [7,8]. Because the infrared light has a longer penetration depth of the surface plasmon than visible light, SPR has been utilized to study living cells and the analyses of cholesterol penetration into membrane and transferin-induced clathrin-mediated endocytosis were demonstrated [9,10]. The relatively large penetration depth of the surface plasmon into a dielectric medium, a few microns in the infrared range, is of the order of the cell height and beneficial in studying cell cultures. The long-wavelength surface plasmon penetration even possibly senses the whole cell volume. SPR penetration depth and propagation length showed around 1 μm and 30 μm, respectively, for the interfaces of Au/water and ZnS/Au/water at a 1,550-nm wavelength [9]. The ability to detect SPR at varying wavelengths and/or varying angles allows “tuning” the surface plasmon resonance to any desired spectral range in order to achieve the highest sensitivity. Since the moving angle repeatability was limited by the optical or mechanical encoder, the telecommunication wavelengths own the wavelength accuracy and will be applied to the SPR for precise wavelength tuning control.
2. Design and Simulation
The spectral SPR incident angle is typically set above the critical angle to achieve total internal reflection (TIR). For sharper reflectance from SPR wavelength modulation the minimum reflectance [11], occurring near the resonance angle from SPR angular modulation, was demonstrated as the maximum sensing sensitivity for wavelength variation under constant surrounding analyte.
The angle modulation characterization is not distinguished enough for MTB DNA compared with DI water for a small amount of μg/mL due to the existing stepper motor resolution. Therefore, the spectral SPR was characterized at the deionized (DI) water resonance angle of 61.9° for the wavelength modulation.
The Kretschmann structure [11] was utilized for the SPR simulation carried out using the commercial software Matlab to detect MTB DNA. The theoretical calculation demonstrated that longer wavelengths will sharpen the reflectance curves in angled modulation for lower SPR sensing sensitivity [12,13]. However, this recent development in fiber optics dramatically increases the transmission capacity and also permits small footprint integrated photonic components/subsystems. Therefore, a 1,550-nm telecommunication wavelength was chosen to detect DI water, acting as the simulation basis for MTB DNA biosensing. The real and imaginary parts of complex refractive substance indices are listed in Table 1 at 1,550-nm wavelength [14]. The gold characteristics on complex refractive indices increase with longer wavelengths in the telecommunication range [15].
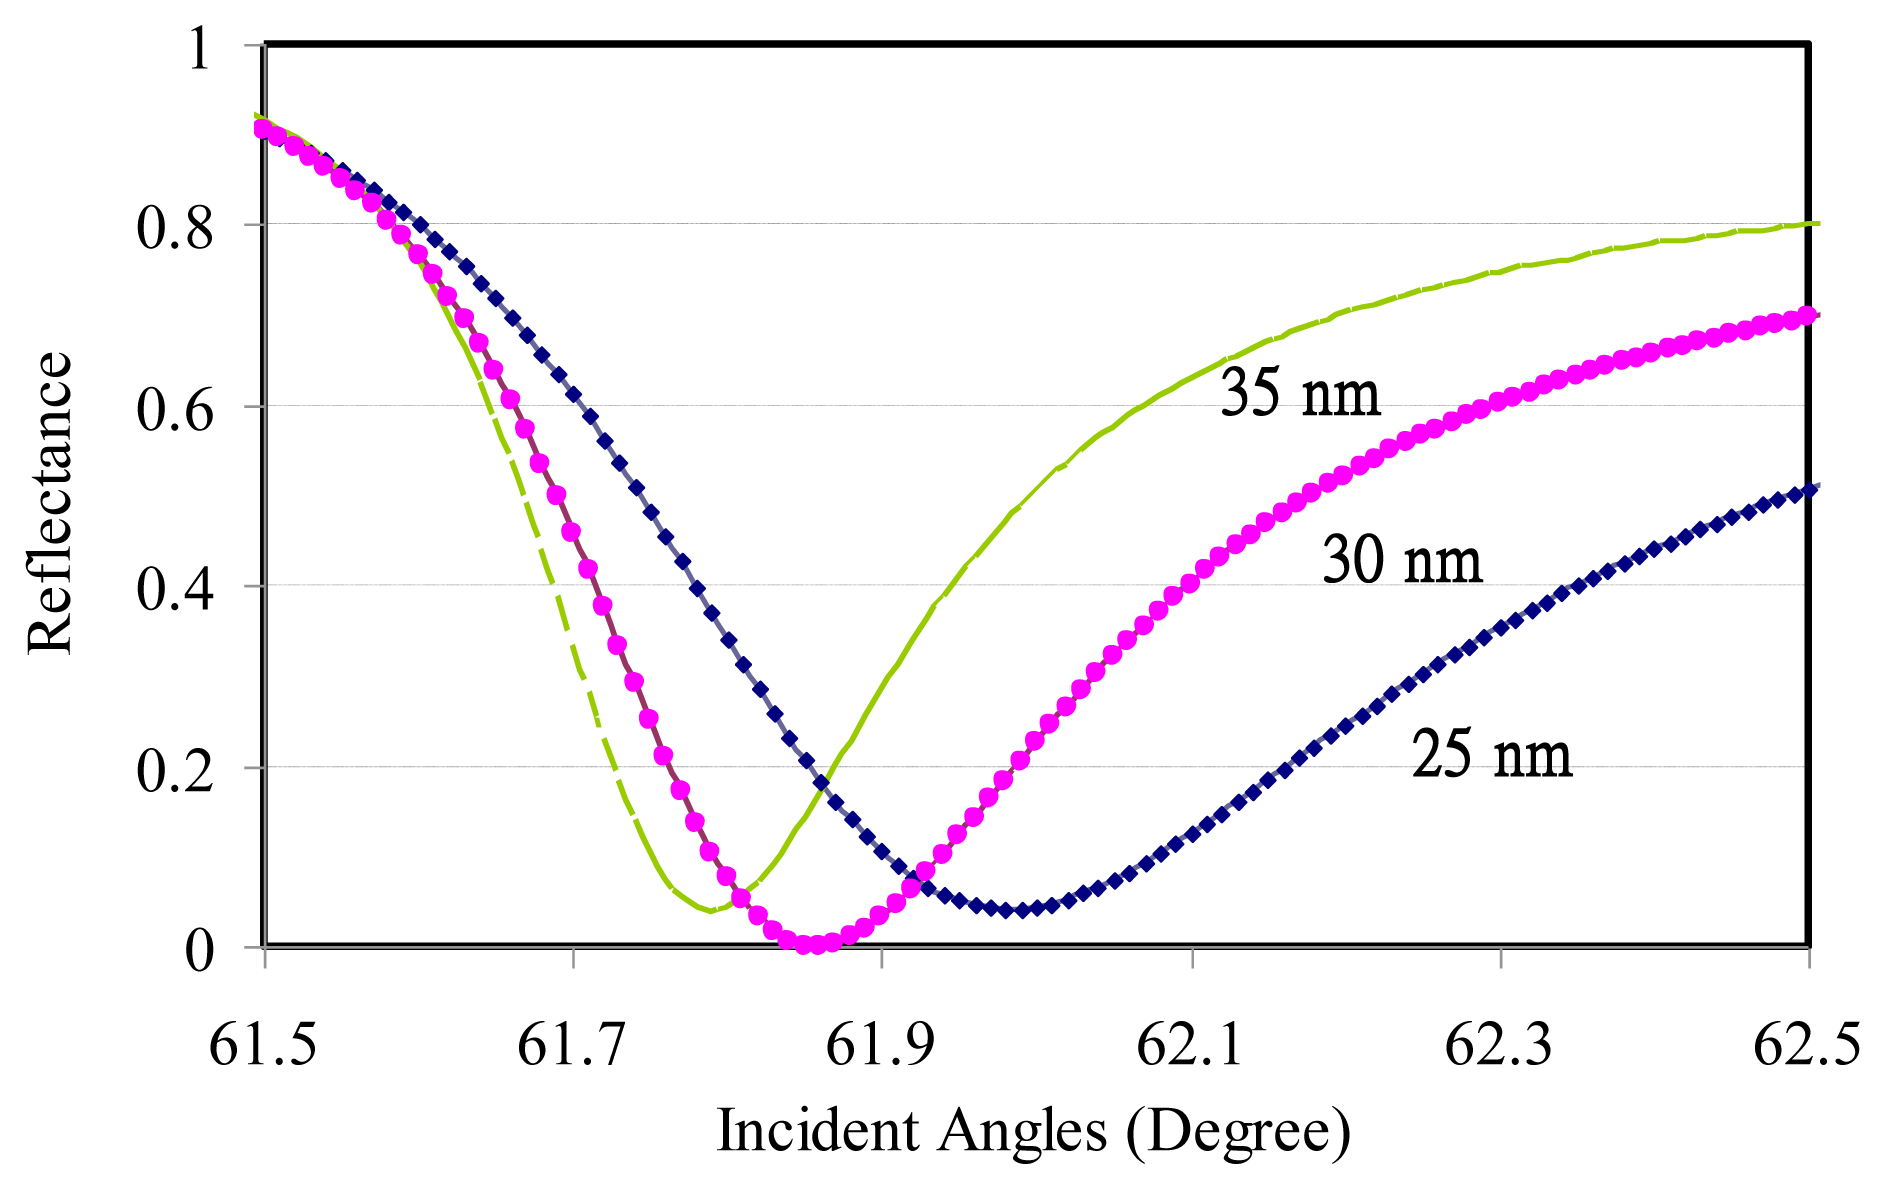
Due to the limited information regarding the analyte refractive index variation with the operating wavelengths, only the SPR reflectance sensing of DI water was calculated in the angled modulation to reinforce the test setup. Three different gold film thicknesses were modulated using the incident angles at a 1,550-nm transverse-magnetic (TM) operating wavelength. The dip angles were increased with thinner gold thickness, as shown in Figure 1. The related simulation parameters are listed in Table 2.
The SPR performance is heavily related to the surface plasmon effective index, which is severely affected by the immobilization between the analyte and gold metal layer. Therefore numerous strategies for the immobilization were developed for different types of recognition elements including the proteins, peptides, DNA and more complex natural products [16]. The 5′-thiol end DNA prepared in autoclaved DI water was immobilized onto the pre-cleaned gold surface for 8,500 s at 25 °C and the binding of these molecules was successfully monitored using SPR technology [17]. Glucose biosensing was intentionally used for comparison with the MTB DNA on the surface plasmon wave. However, the typical protocol involves utilizing the biomolecule to immobilize a desired surface for analyte sensing, such as glucose oxidase (GOD) for glucose. Here, we planned to utilize the telecommunication wavelength modulation to repeatedly demonstrate the highest sensitivity for MTB DNA and glucose without immobilization onto the gold plate.
3. Experiment and Results
3.1. Reagents and Oligonucleotides
MTB DNA was prepared by constructing five representative MTB genes (IS6110, 16S ribosomal RNA, 85B, Rv3130c and Rv3133c) into a pUC57 vector. The MTB DNA length was 3,133 base pairs. The recombinant MTB plasmids were purified using the Qiagen plasmid purification kit (Qiagen, Valencia, CA, USA) according to the manufacturer's instructions and quantitated using NanoDrop™ 2000c (Thermo Fisher Scientific, Wilmington, DE, USA). Chemicals were taken at analytical reagent grade. Distilled water (18.2 MΩ) was used throughout these experiments.
3.2. Apparatus
It is necessary to clean the prism before metal deposition. The prism is first placed into an ultrasonic cleaning machine where acetone and 70% ethanol are utilized separately for a period of 10 min. To ensure that the prism surface is free from impurities, residual water and solvents, a nitrogen gun was then used to carefully blow-dry the water vapor off of the prism. Right after cleaning was completed, the prism was sent into the e-beam evaporator for Cr and Au deposition, at thicknesses of 3 nm and 30 nm, respectively. Cr metal was supposed to serve as an adhesive layer. The deposited prism surface was adjusted to an appropriate angle in the deposition chamber so that the metal coverage could be uniform. The experimental resonance angle for DI water was 61.9°, virtually identical with the theoretical calculation, 61.86°, at 30-nm thick gold layer. More glucose concentrations of 100 mg/mL and 200 mg/mL were characterized on the angular modulation.
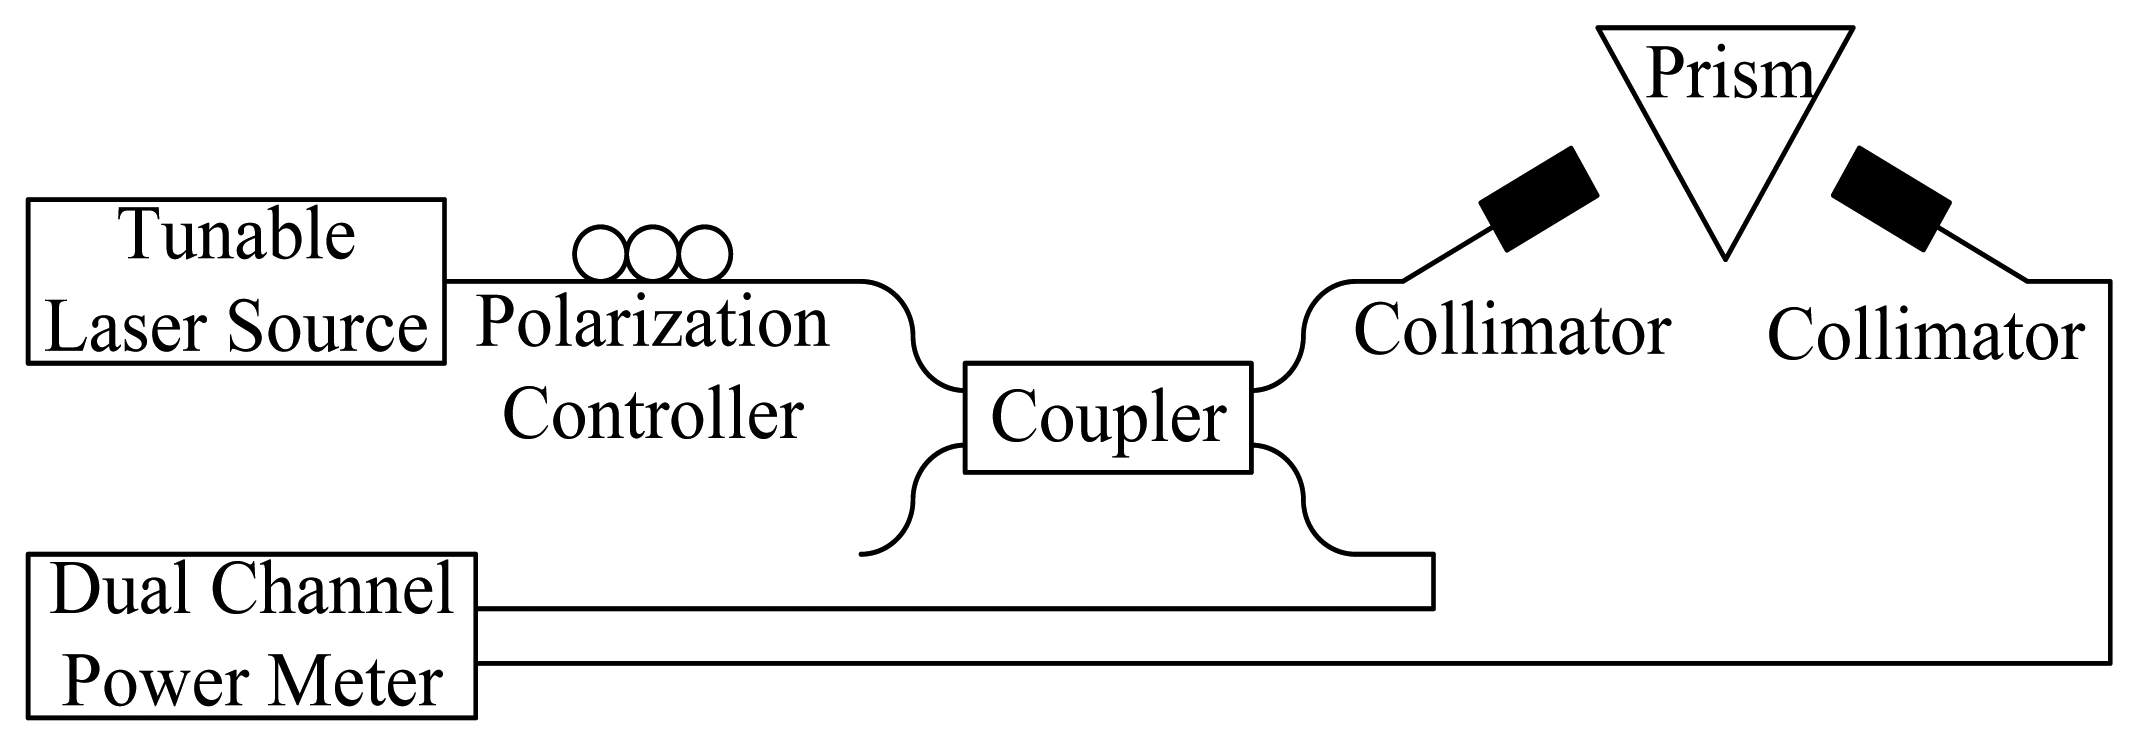
Since the Santec ECL-210 tunable laser source (TLS) could achieve a wavelength repeatability of 0.01 nm, the wavelength modulation was utilized to improve the SPR characterization accuracy. After the incident angle was fixed at 61.9° from the angle modulated SPR, the telecommunication wavelengths were executed using the TLS and modulated at a 10-nm increase from 1,510-nm to 1,590-nm wavelengths. The coupling strength between the analytes and surface plasmon could be observed by adjusting the wavelengths. To ensure the experimental accuracy couplers should be used to monitor the input and output power using a dual-channel power meter, as shown in Figure 2.
An experiment conducted with wavelength modulation was also utilized to detect different glucose concentrations. The TLS wavelength was still tuned from 1,510 nm to 1,590 nm with a 10-nm increase at a resonance angle of 61.9°. The experimental data showed that the resonance wavelengths increased with higher glucose concentrations. The resonance wavelengths occurred at 1,560 nm and 1,580 nm for DI water and 1 mg/mL, milligrams per deciliter (100 mg/dL ≈ 0.1%), concentration, respectively. The resonance wavelength for 10 mg/mL (1,000 mg/dL ≈ 1%) glucose concentration could not be observed due to the TLS wavelength limitation and was expected to be more than 1,590 nm, as shown in Figure 3. Due to the strong surface plasmon guidance the optical power from SPR reflectance increased with a higher glucose concentration.
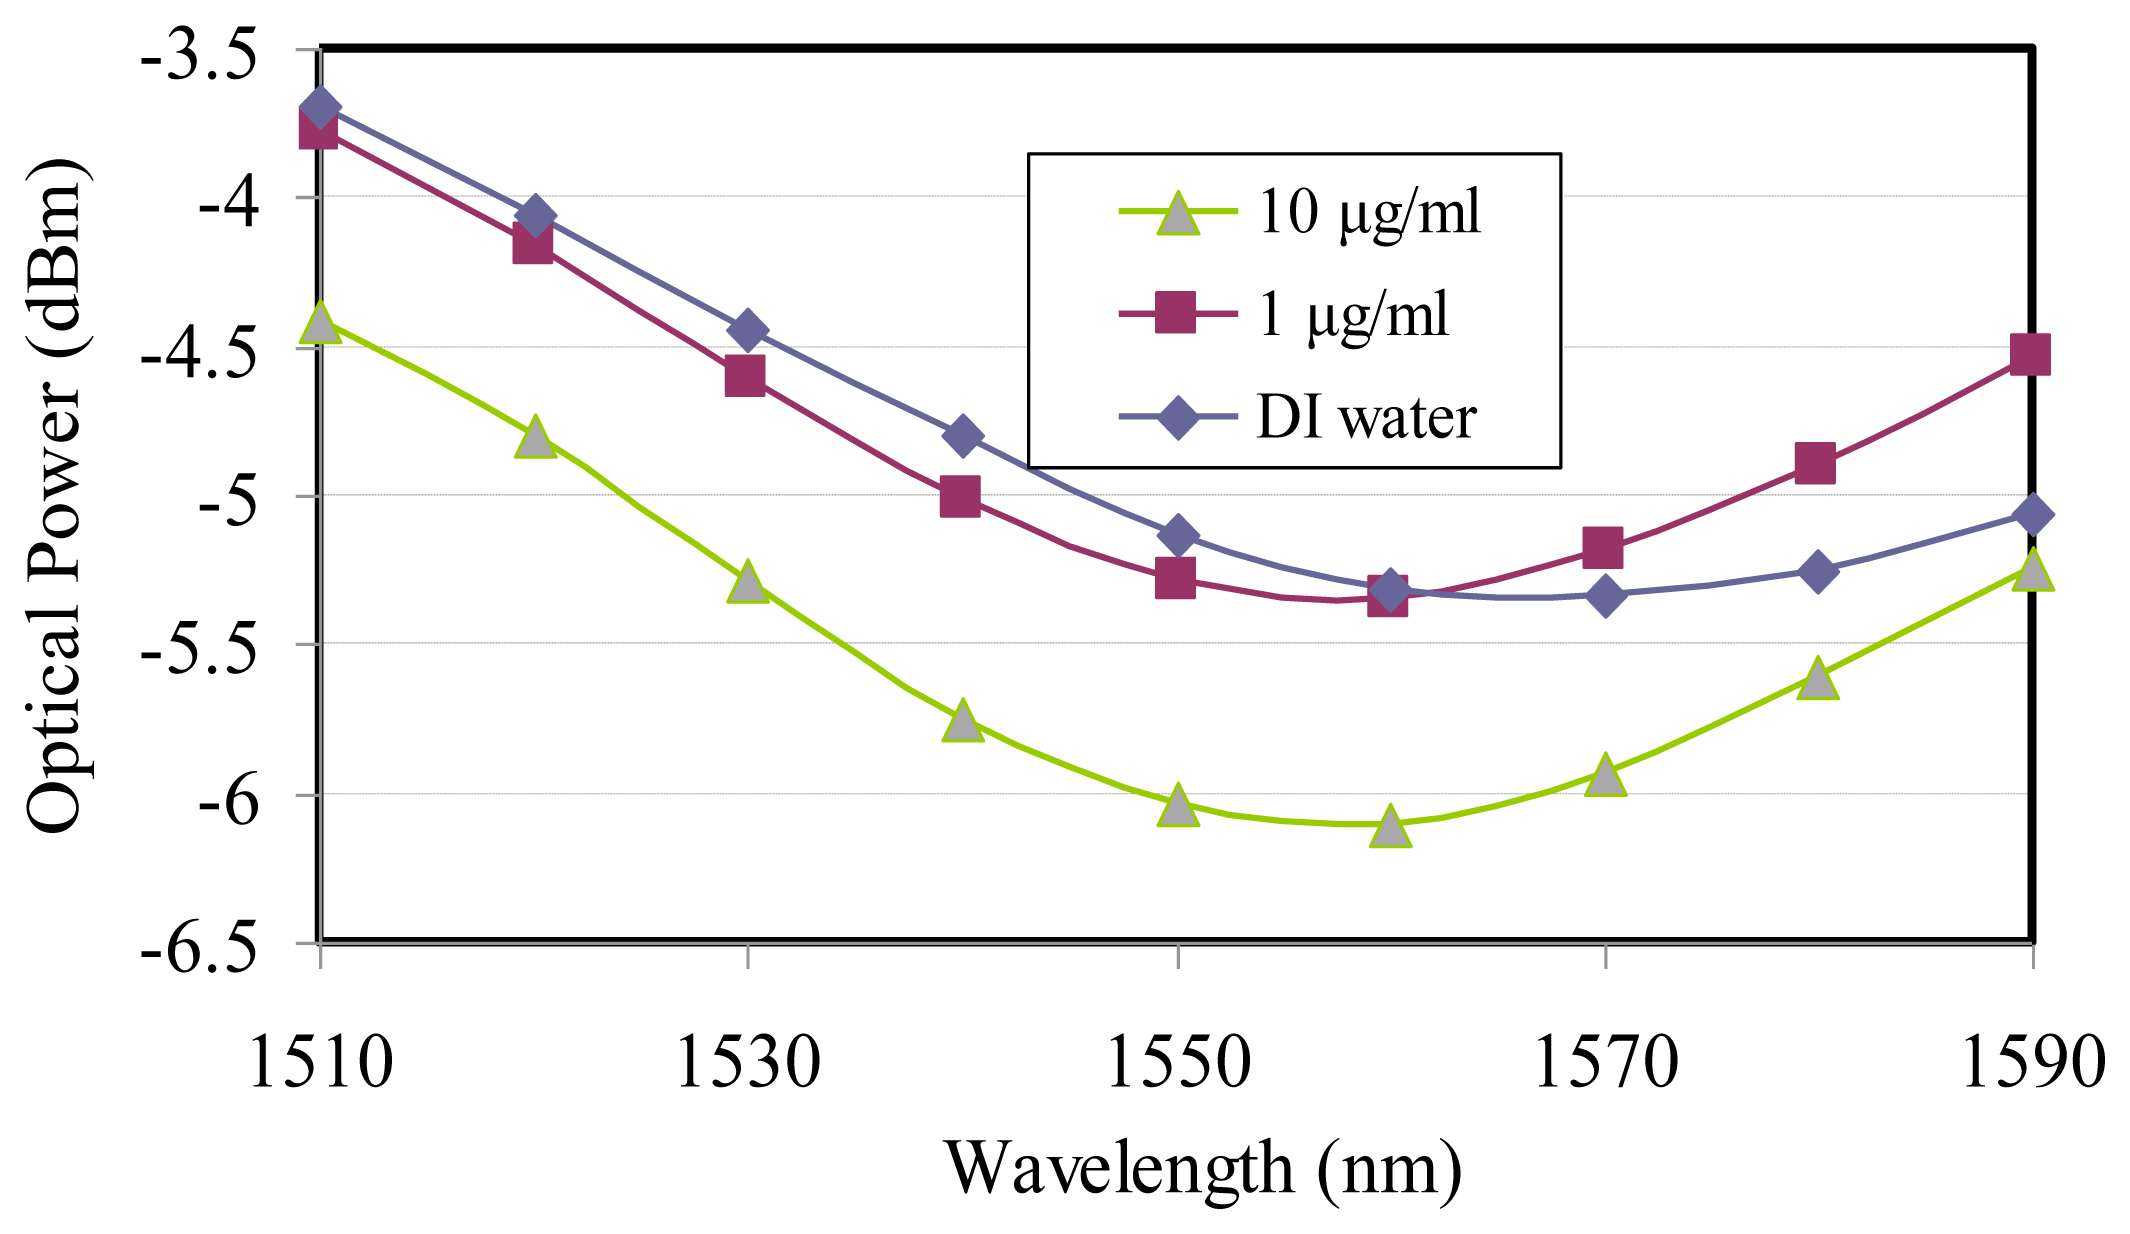
Additionally, the SPR biosensor modulated using the telecommunication wavelength, the same as the glucose characterization, also successfully detected 1-μg/mL and 10-μg/mL concentrations of the MTB DNA, which can be transferred to 0.319 and 3.19 μM, respectively, and were more sensitive than the piezoelectric TB DNA-based biosensor [18], as shown in Figure 4. The data demonstrated that the resonance wavelength of 1,560 nm was applied to two different MTB DNA concentrations besides sharing the same spectral half-width of the wavelength dip for the optimum coupling. The optical power from SPR reflectance decreased with higher MTB DNA concentration because of the strong surface plasmon guidance.
Due to the limited supply of MTB DNA a few data points were demonstrated on the wavelength modulation. In the spectral SPR for MTB DNA, the optical power variation was chosen as 1,550-nm instead of the resonance wavelength of 1,560 nm, in which the DI water crossed over 1 μg/mL MTB DNA. A similar situation could be applied to the glucose sensitivity characterization.
4. Discussion
As for the DI water curve variation with the wavelength modulation for the glucose and MTB DNA concentrations, the pH value might be the main reason causing the resonant wavelength shift. DI water is not a good buffer because it does not withstand pH changes. In Figures 3 and 4 the reflective optical power for DI water was different and came from TLS input power adjustment. However, the modulation depths from DI water were all around 2 dB for glucose and MTB DNA, which means that the pH variation only has an effect on the resonance wavelengths instead of the reflective SPR curve.
The resonance locations from the wavelength modulation varied with different glucose concentrations, as shown in Figure 3. The longer wavelength is accompanied by higher glucose concentrations. On the other hand the wavelength modulation on MTB DNA demonstrated that the resonance wavelengths would not shift when the MTB DNA concentration varied, as shown in Figure 4.
Through the theoretical and experimental approaches the SPR reactions on glucose and MTB DNA with different detected analytes were investigated. For glucose without immobilization the optical power at a 1,550-nm wavelength was taken for sensitivity analyses on both refractive index [19] and concentration for DI water, 1 mg/mL, and 10 mg/mL. The experimental data demonstrated the glucose refractive index sensitivity and sensing limitation were 1,786 dB/RIU and 5.6 × 10⁻⁶ RIU, respectively, while 0.01-dBm resolution and accuracy from the optical power meter was achievable. In a similar way the glucose concentration sensitivity was 0.26 dB/(μg/mL) and sensing limitation was 38 μg/mL at a 1,550-nm wavelength, as shown in Figure 5.
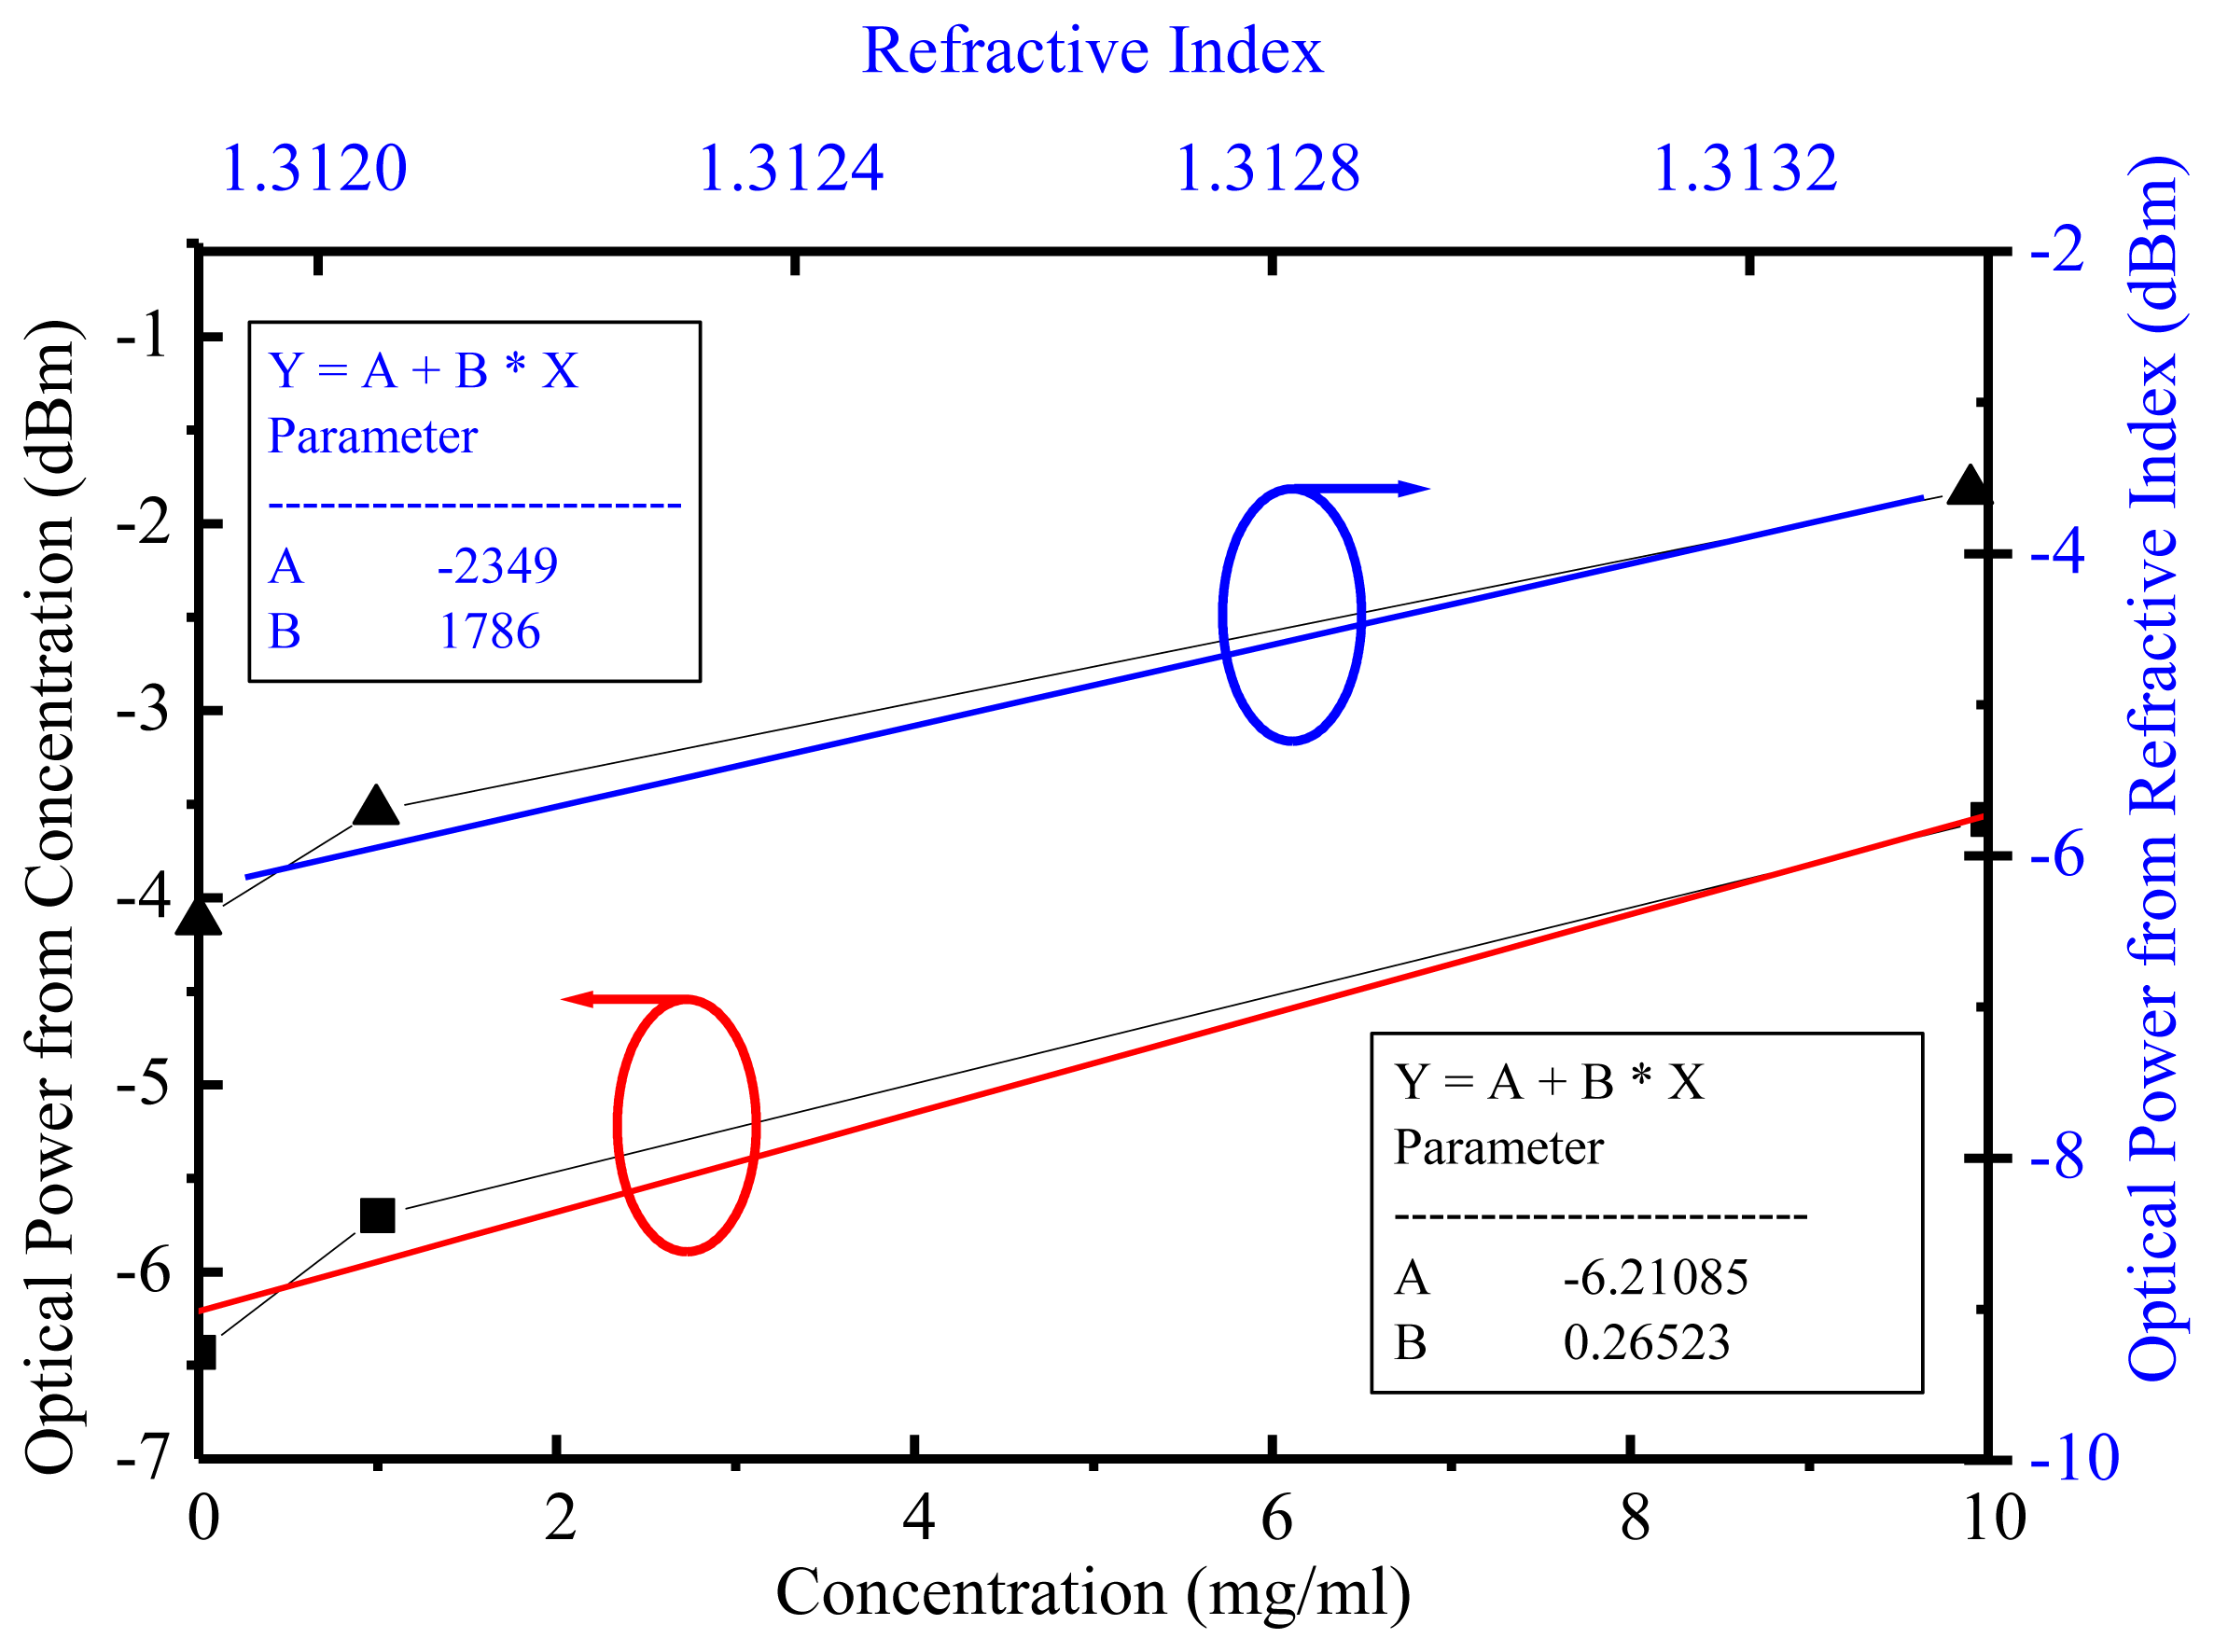
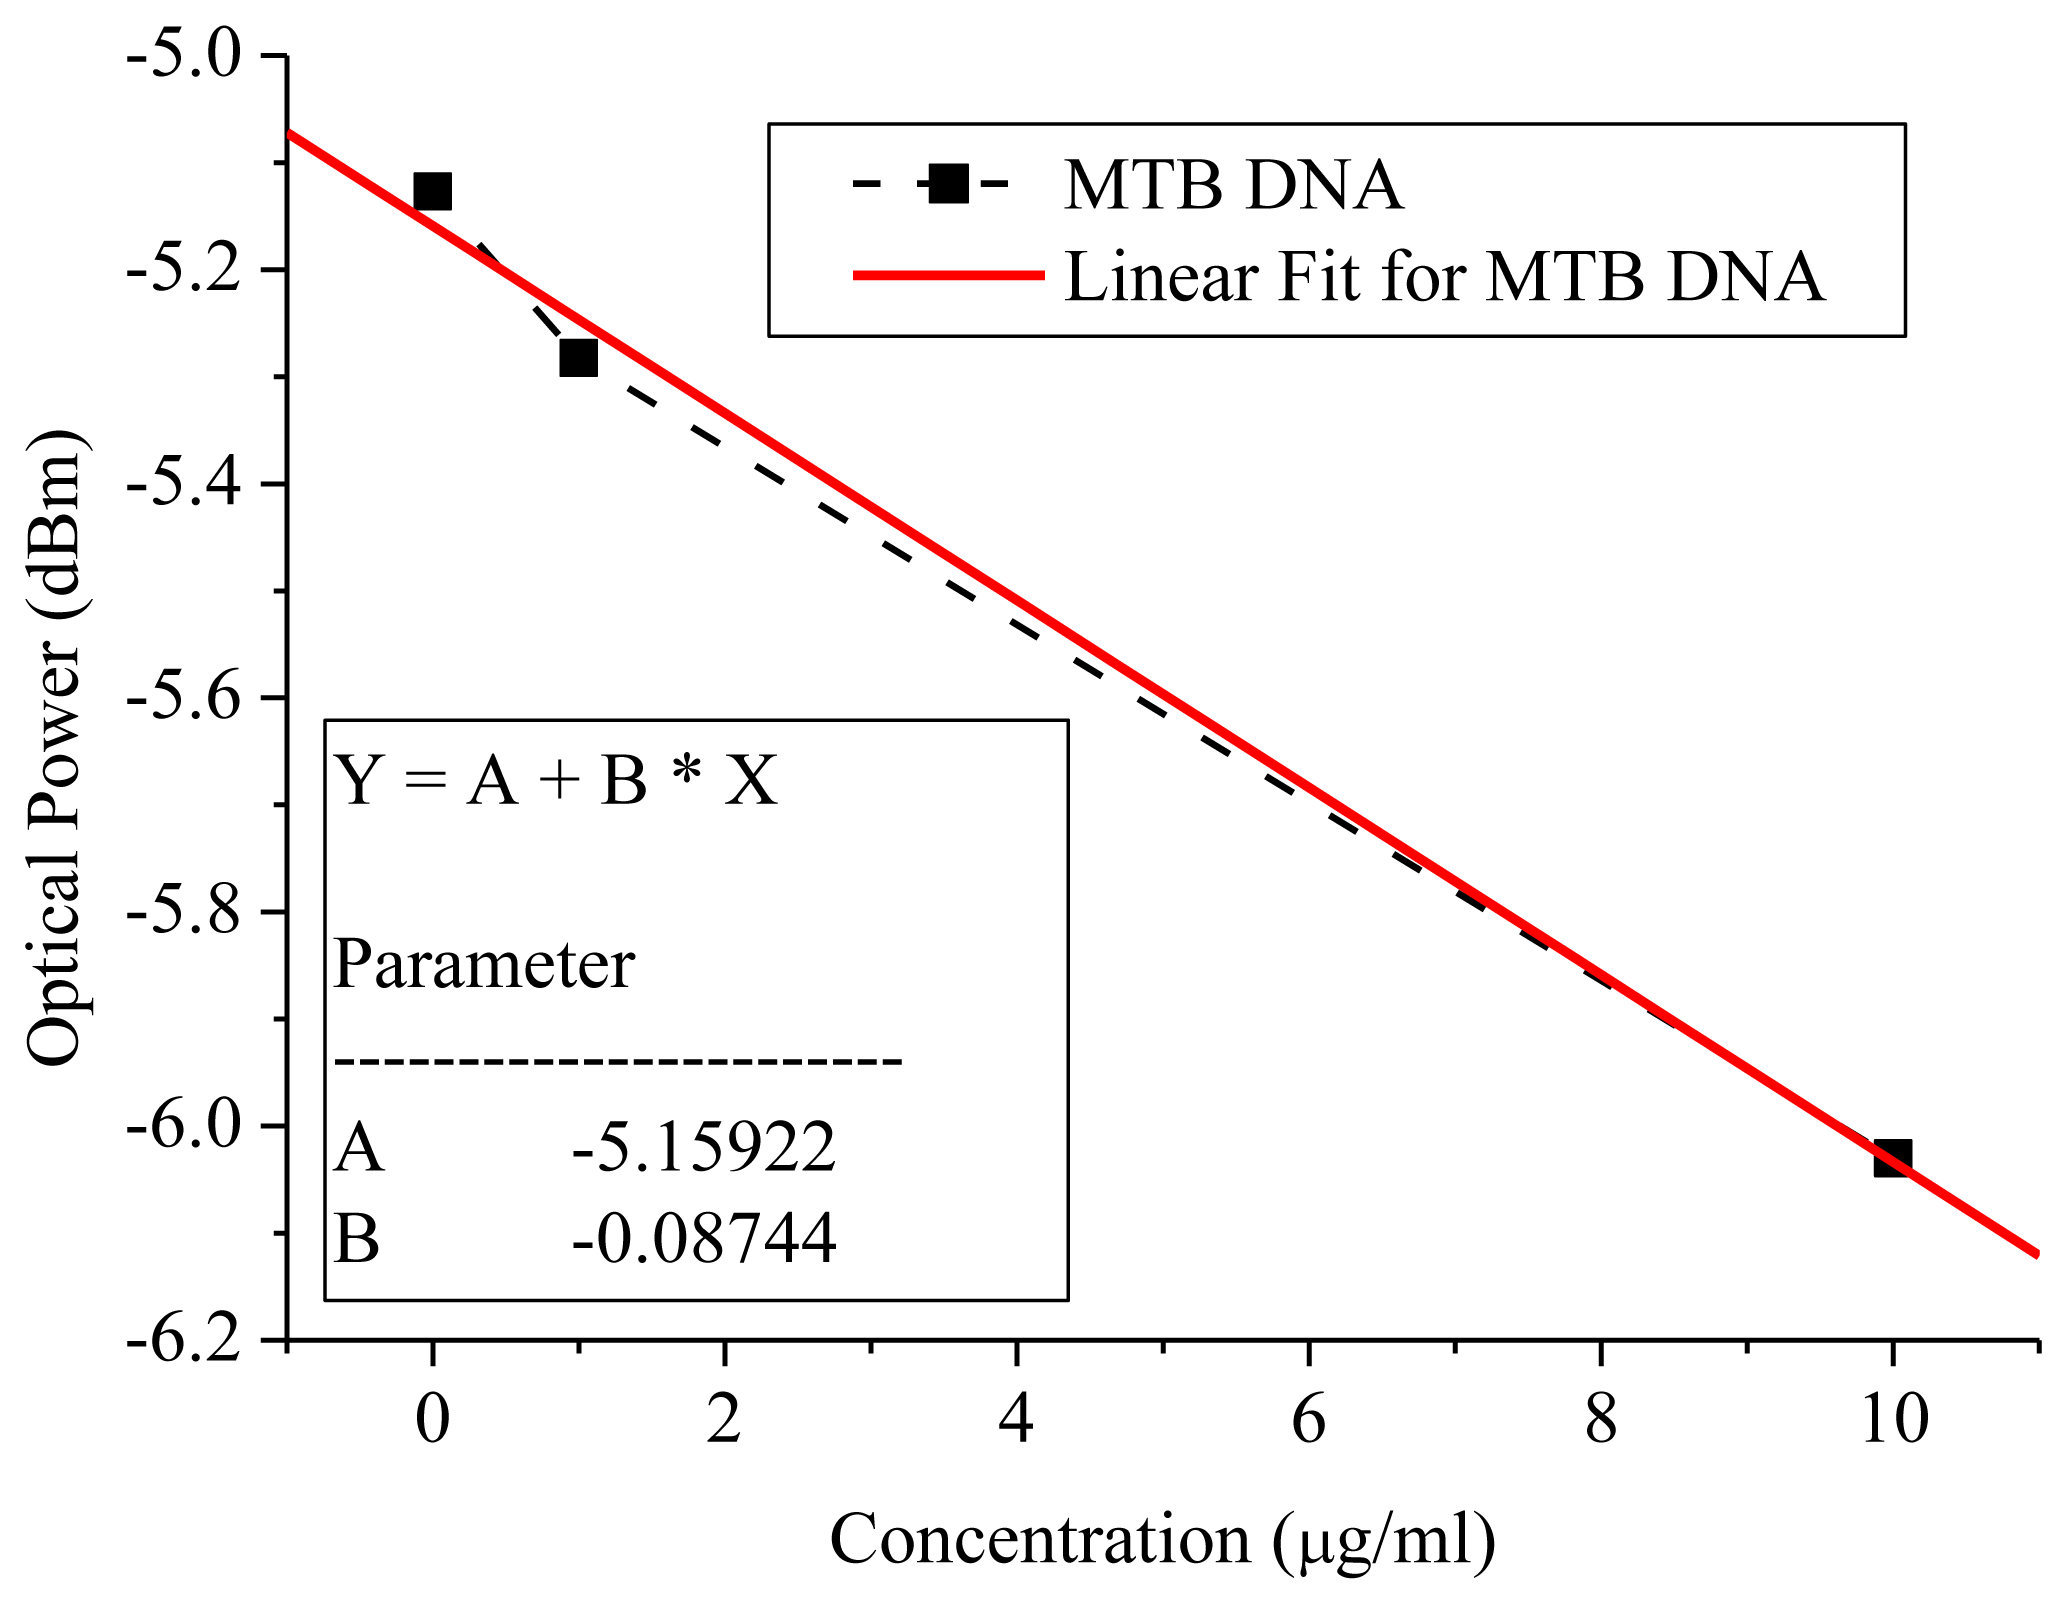
For MTB DNA without immobilization the same spectral line width shown in Figure 4 implied a linear slope between the concentration and reflective power were the same for all applied telecommunication wavelengths because the surface plasmon effective index did not disperse with the wavelength and the attenuation coefficient (γ) will get a constant value at the longer wavelength, as shown in the following equation [16]:
The linear slope at a 1,550-nm wavelength was demonstrated to be −0.087 dB/(μg/mL), which was the same in the remaining wavelengths, as shown in Figure 6. The 0.01-dBm resolution from the optical power meter is typical. Therefore the MTB DNA concentration sensing limitation could achieve 115 ng/mL better than the sensor limit of 400 ng/mL from the commercial Thermo Fisher Scientific Nanodrop 2000c micro-volume spectrophotometer equipment with a price of around 10,000 US dollars, as shown in Figure 6.
The highest sensitivity difference between MTB DNA and glucose shows that the surface plasmon confinement is analyte related. Because of the surface plasmon guidance, the sensitivity with a negative sign represents the surface plasmon will suffer a higher optical loss in lower MTB DNA concentrations and the positive sensitivity in glucose shows a higher optical loss in higher concentrations. After the immobilization was applied the surface plasmon wave propagation would be more efficient and a higher sensing limit than ng/mL was expected [17].
5. Conclusions
Because the telecommunication wavelength possesses high precision and stability control in optical fiber communications, the SPR was then modulated using 1,550-nm range wavelengths and MTB DNA and glucose analytes were successfully detected without immobilization. These experiments illustrate that a difference exists for surface plasmon waves between MTB DNA and glucose. The MTB DNA with lower concentrations suffered higher optical loss with the surface plasmon wave, which was applied to glucose with higher concentrations. The highest sensitivity was 5.6 × 10⁻⁶ RIU for glucose and 115 ng/mL for MTB DNA, which is better than the sensor limit of 400 ng/mL obtained from the commercial Thermal Fisher Scientific equipment, the NanoDrop 2000c spectrometer.
Acknowledgments
The authors would like to thank Shao-Chiang Hung and Chih-An Wei for their technical assistance and discussions. This paper was supported by the Joint Research Program from National Taiwan University of Science and Technology and Mackay Memorial Hospital under the contract MMH-NTUST-102-06.
References
- Hsieh, S.C.; Chang, C.C.; Lu, C.C.; Wei, C.F.; Lin, C.S.; Lai, H.C.; Lin, C.W. Rapid identification of Mycobacterium tuberculosis infection by a new array format-based surface plasmon resonance method. Nanoscale Res. Lett. 2012, 7, 1–6. [Google Scholar]
- Condos, R.; McClune, A.; Rom, W.N.; Schluger, N.W. Peripheral-blood-based PCR assay to identify patients with active pulmonary. tuberculosis. Lancet 1996, 347, 1082–1085. [Google Scholar]
- Lillebaek, T.; Dirksen, A.; Vynnycky, E.; Baess, I.; Thomsen, V.Ø.; Andersen, A.B. Stability of DNA patterns and evidence of Mycobacterium tuberculosis reactivation occurring decades after the initial infection. J. Infect. Dis. 2003, 188, 1032–1039. [Google Scholar]
- Noordhoek, G.T.; Kolk, A.H.; Bjune, G.; Catty, D.; Dale, J.W.; Fine, P.E.; Godfrey-Faussett, P.; Cho, S.N.; Shinnick, T.; Svenson, S.B.; et al. Sensitivity and specificity of PCR for detection of Mycobacterium tuberculosis: A blind comparison study among seven laboratories. J. Clin. Microbiol. 1994, 32, 277–284. [Google Scholar]
- Debackere, P.; Scheerlinck, S.; Bienstman, P.; Baets, R. Surface plasmon interferometer in silicon-on-insulator: Novel concept for an integrated biosensor. Opt. Express 2006, 14, 7063–7072. [Google Scholar]
- Kihm, K.D.; Cheon, S.; Park, J.S.; Kim, H.J.; Lee, J.S.; Kim, I.T.; Yi, H.J. Surface plasmon resonance (SPR) reflectance imaging: Far-field recognition of near-field phenomena. Opt. Laser Eng. 2012, 50, 64–73. [Google Scholar]
- Abdulhalim, I.; Zourob, M.; Lakhtakia, A. Surface plasmon resonance sensors—A mini review. J. Electromagn 2008, 28, 213–242. [Google Scholar]
- Kim, S.A.; Kim, S.J.; Lee, S.H.; Park, T.H.; Byun, K.M.; Kim, S.G.; Shuler, M.L. Detection of avian influenza-DNA hybridization using wavelength-scanning surface plasmon resonance biosensor. J. Opt. Soc. Korea 2009, 13, 392–397. [Google Scholar]
- Golosovsky, M.; Lirtsman, V.; Yashunsky, V.; Davidov, D. Midinfrared surface-plasmon resonance—A novel biophysical tool for studying living cell. J. Appl. Phys. 2009, 105. [Google Scholar] [CrossRef]
- Lirtsman, V.; Golosovsky, M.; Davidov, D. Infrared surface plasmon resonance technique for biological studies. J. Appl. Phys. 2008, 103. [Google Scholar] [CrossRef]
- Gwon, H.R.; Lee, S.H. Spectral and angular responses of surface plasmon resonance based on the Kretschmann prism configuration. Mater. Trans. 2010, 51, 1150–1155. [Google Scholar]
- Shalabney, A.; Abdulhalim, I. Sensitivity enhancement methods for surface plasmon sensors. Lasers Photon. Rev. 2011, 5, 571–606. [Google Scholar]
- Shalabney, A.; Abdulhalim, I. Electromagnetic fields distribution in multilayer thin film structures and the origin of sensitivity enhancement in surface plasmon resonance sensors. Sens. Actuators A. 2010, 159, 24–32. [Google Scholar]
- Hale, G.M.; Querry, M.R. Optical constants of water in the 200-nm to 200-μm wavelength region. Appl. Opt. 1973, 12, 555–563. [Google Scholar]
- Palik, E.D. Handbook of Optical Constants of Solids; Academic Press: Boston, MA, USA, 1985. [Google Scholar]
- Homola, J. Surface Plasmon Resonance Based Sensors; Springer: Berlin/Heidelberg, Germany, 2006; Part I&II. [Google Scholar]
- Prabhakar, N.; Arora, K.; Arya, S.K.; Solanki, P.R.; Iwamoto, M.; Singh, H.; Malhotra, B.D. Nucleic acid sensor for M. tuberculosis detection based on surface plasmon resonance. Analyst 2008, 133, 1587–1592. [Google Scholar]
- Kaewphinit, T.; Santiwatanakul, S.; Promptmas, C.; Chansiri, K. Detection of non-amplified Mycobacterium tuberculosis genomic DNA using piezoelectric DNA-based biosensor. Sensors 2010, 10, 1846–1858. [Google Scholar]
- Su, H.; Huang, X.G. Fresnel-reflection-based fiber sensor for on-line measurement of solute concentration in solutions. Sens. Actuators B. 2007, 126, 579–582. [Google Scholar]


| Real | Imaginary | |
|---|---|---|
| DI water | 1.318 | 9.8265 × 10⁻⁵ |
| Au | 0.55 | 11.5 |
| Gold Thickness | Dip Angle | Reflectance |
|---|---|---|
| 25 nm | 61.98° | 0.041516 |
| 30 nm | 61.86° | 0.000143 |
| 35 nm | 61.79° | 0.038791 |
© 2014 by the authors; licensee MDPI, Basel, Switzerland. This article is an open access article distributed under the terms and conditions of the Creative Commons Attribution license (http://creativecommons.org/licenses/by/3.0/).
Share and Cite
Hsu, S.-H.; Lin, Y.-Y.; Lu, S.-H.; Tsai, I.-F.; Lu, Y.-T.; Ho, H.-T. Mycobacterium tuberculosis DNA Detection Using Surface Plasmon Resonance Modulated by Telecommunication Wavelength. Sensors 2014, 14, 458-467. https://doi.org/10.3390/s140100458
Hsu S-H, Lin Y-Y, Lu S-H, Tsai I-F, Lu Y-T, Ho H-T. Mycobacterium tuberculosis DNA Detection Using Surface Plasmon Resonance Modulated by Telecommunication Wavelength. Sensors. 2014; 14(1):458-467. https://doi.org/10.3390/s140100458
Chicago/Turabian StyleHsu, Shih-Hsiang, Yan-Yu Lin, Shao-Hsi Lu, I-Fang Tsai, Yen-Ta Lu, and Hsin-Tsung Ho. 2014. "Mycobacterium tuberculosis DNA Detection Using Surface Plasmon Resonance Modulated by Telecommunication Wavelength" Sensors 14, no. 1: 458-467. https://doi.org/10.3390/s140100458