Dental Optical Coherence Tomography

Abstract
: This review paper describes the applications of dental optical coherence tomography (OCT) in oral tissue images, caries, periodontal disease and oral cancer. The background of OCT, including basic theory, system setup, light sources, spatial resolution and system limitations, is provided. The comparisons between OCT and other clinical oral diagnostic methods are also discussed.1. Introduction
Optical coherence tomography (OCT) was first reported by Fujimoto et al. in 1991 [1]. OCT has been widely used in numerous clinical applications, including gastroenterology [2–4], ophthalmology [5–7], dermatology [8,9], and dentistry [10,11]. OCT is a non-invasive, non-radiative optical diagnostic tool based on interferometers. By using a low-coherence broadband near-infrared light source, it is possible to obtain excellent spatial resolution (∼20 μm) and real-time images [12,13]. OCT was first applied in vitro in human retina and in atherosclerotic plaque [1,14]. It is an optical imaging technique that enables cross-sectional imaging of microstructures of tissue in situ. OCT can provide “optical biopsy” without the need for excision and processing of specimens as in conventional biopsy and histopathology. With improvement of optical specifications and system capabilities, OCT demonstrates great potentials in research topics and clinical applications to date.
Over the past decade, many functional OCT systems, such as Doppler OCT (DOCT) [15,16], polarization sensitive OCT (PS-OCT) [17–19], endoscopic OCT [20,21] and acoustic OCT [22,23], were reported for new biomedical research applications These functional systems provide not only structure images but also the specific optical characteristics, including blood flow velocity and tissue orientation. Moreover, deeper transmission depth is achieved with combination of fluorescence [24,25]. Indeed, these optional functions promote the efficiency of diagnosis of OCT.
Application of OCT in dentistry has become very popular. The first in vitro images of dental hard and soft tissues in a porcine model were reported in 1998 [26]. Later, the in vivo imaging of human dental tissue was presented [27]. The oral cavity consists of three main parts: (1) hard tissue, including tooth and alveolar bone, (2) soft tissue, including mucosa and gingiva tissues, and (3) periodontal tissues [28]. The traditional diagnosis of caries is based on examination using dental exploration and radiographs. The diagnosis of periodontal disease needs the examination of periodontal probes. The poor sensitivity and reliability of periodontal probing make it difficult for dentists to monitor the progression of periodontal destruction and the treatment outcome [29]. Radiography may be the most popular diagnostic tool recently. However, radiography provides only two-dimensional images. The caries or bone structure on the buccal and lingual sides of teeth may be superimposed with tooth structures or normal anatomic structures. The radiation exposure of radiographic techniques is also a great concern. Furthermore, early detection of caries, periodontal disease and oral cancer is quite difficult with clinical examination or radiographs.
OCT may provide a solution to these problems. Dental OCT detects qualitative and quantitative morphological changes of dental hard and soft tissues in vivo. Furthermore, OCT can also be used for early diagnosis of dental diseases, including caries, periodontal disease and oral cancer, because of the excellent spatial resolution. Early detection and treatment can increase the survival rates of teeth and patients. Three-dimensional imaging ability is another advantage of dental OCT. It helps clinicians to locate problems in soft and hard tissues more accurately and rapidly.
This review paper discusses the development of dental OCT. The applications of OCT in oral tissue images, tooth decay, periodontal disease and oral cancer are also reviewed. A systematic comparison between dental OCT and other diagnostic methods, including periodontal probing, radiography, fluorescence and Raman spectroscopy, is also presented.
2. Systems
2.1. OCT System and Important Specifications
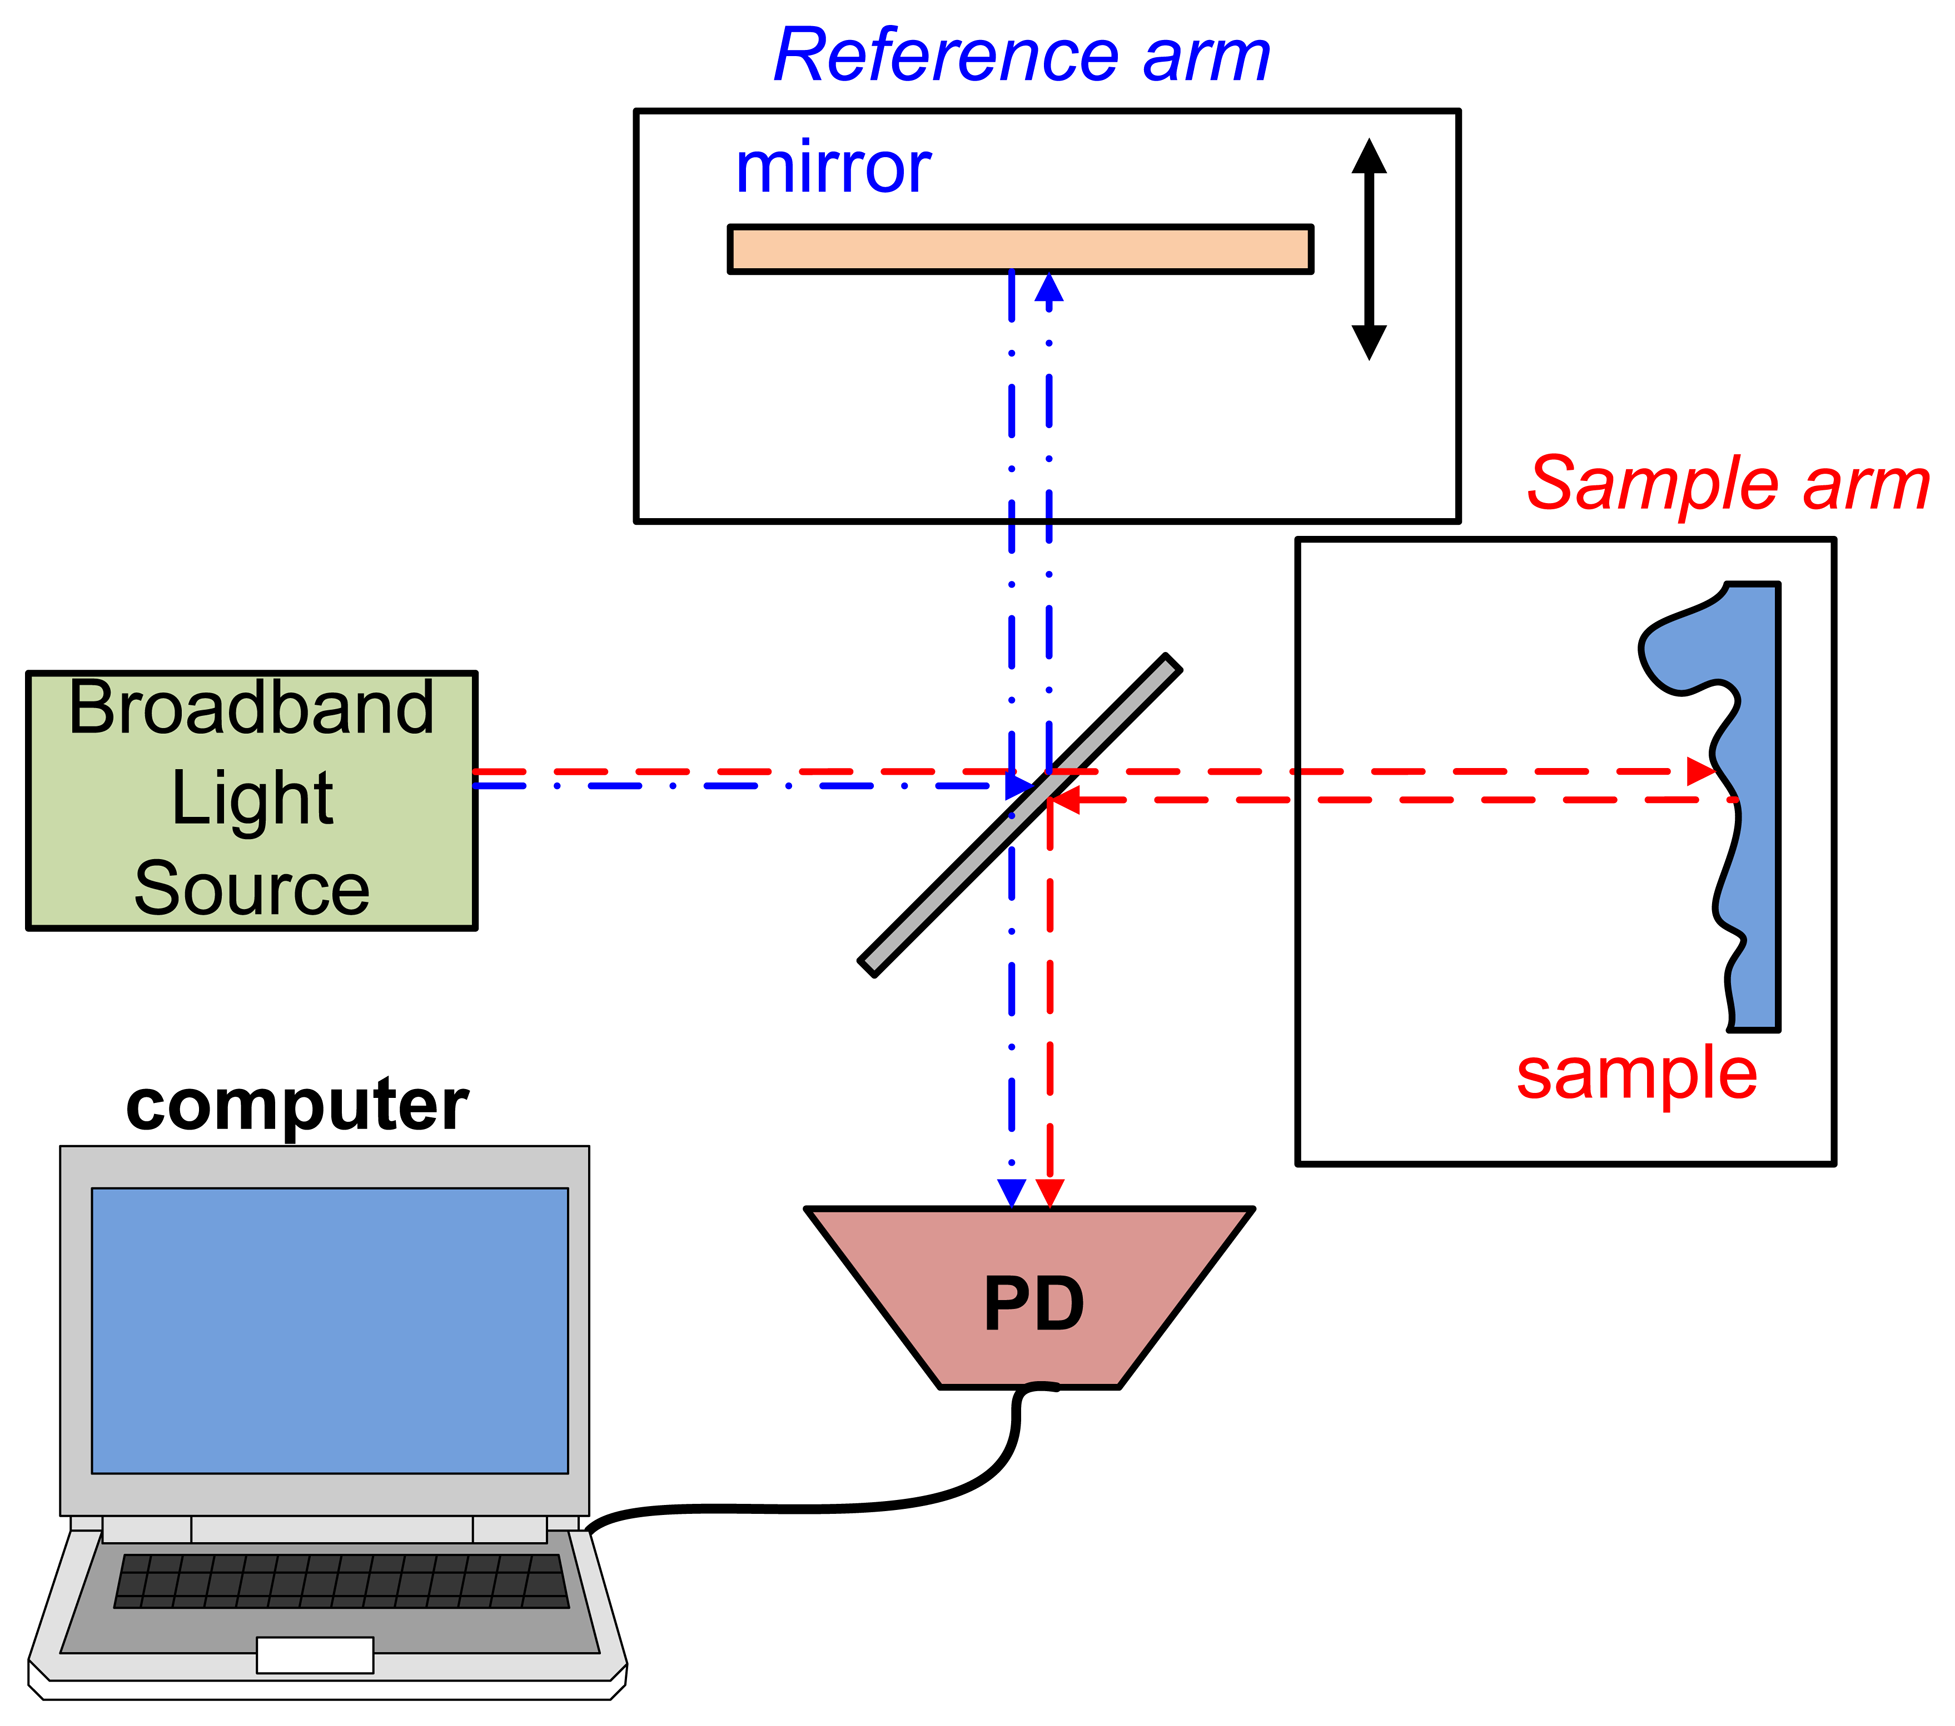
OCT is an interferometer-based system with a low coherence length broadband light source. The lights reflect from the sample and reference arms interference within a Michelson or Mach-Zehnder interferometer. This interference signal is acquired by a photodiode (PD) or charge-coupled device (CCD) that is dependent on the type of OCT. Figure 1 shows the first OCT type, time domain OCT (TD-OCT). TD-OCT acquires various optical path lengths (OPLs) by moving a reference reflector [30]. The light interference occurs when the OPL of the reference and of lights reflected by samples are the same. Furthermore, the constructive interference (bright lines) arises when the optical path difference (OPD) between two lights is an integer multiple of the wavelength. Therefore, a low coherence length light source is usually used for observing only one interference envelope from a selected depth. The relationship between OPL and OPD is described as Equation (1):
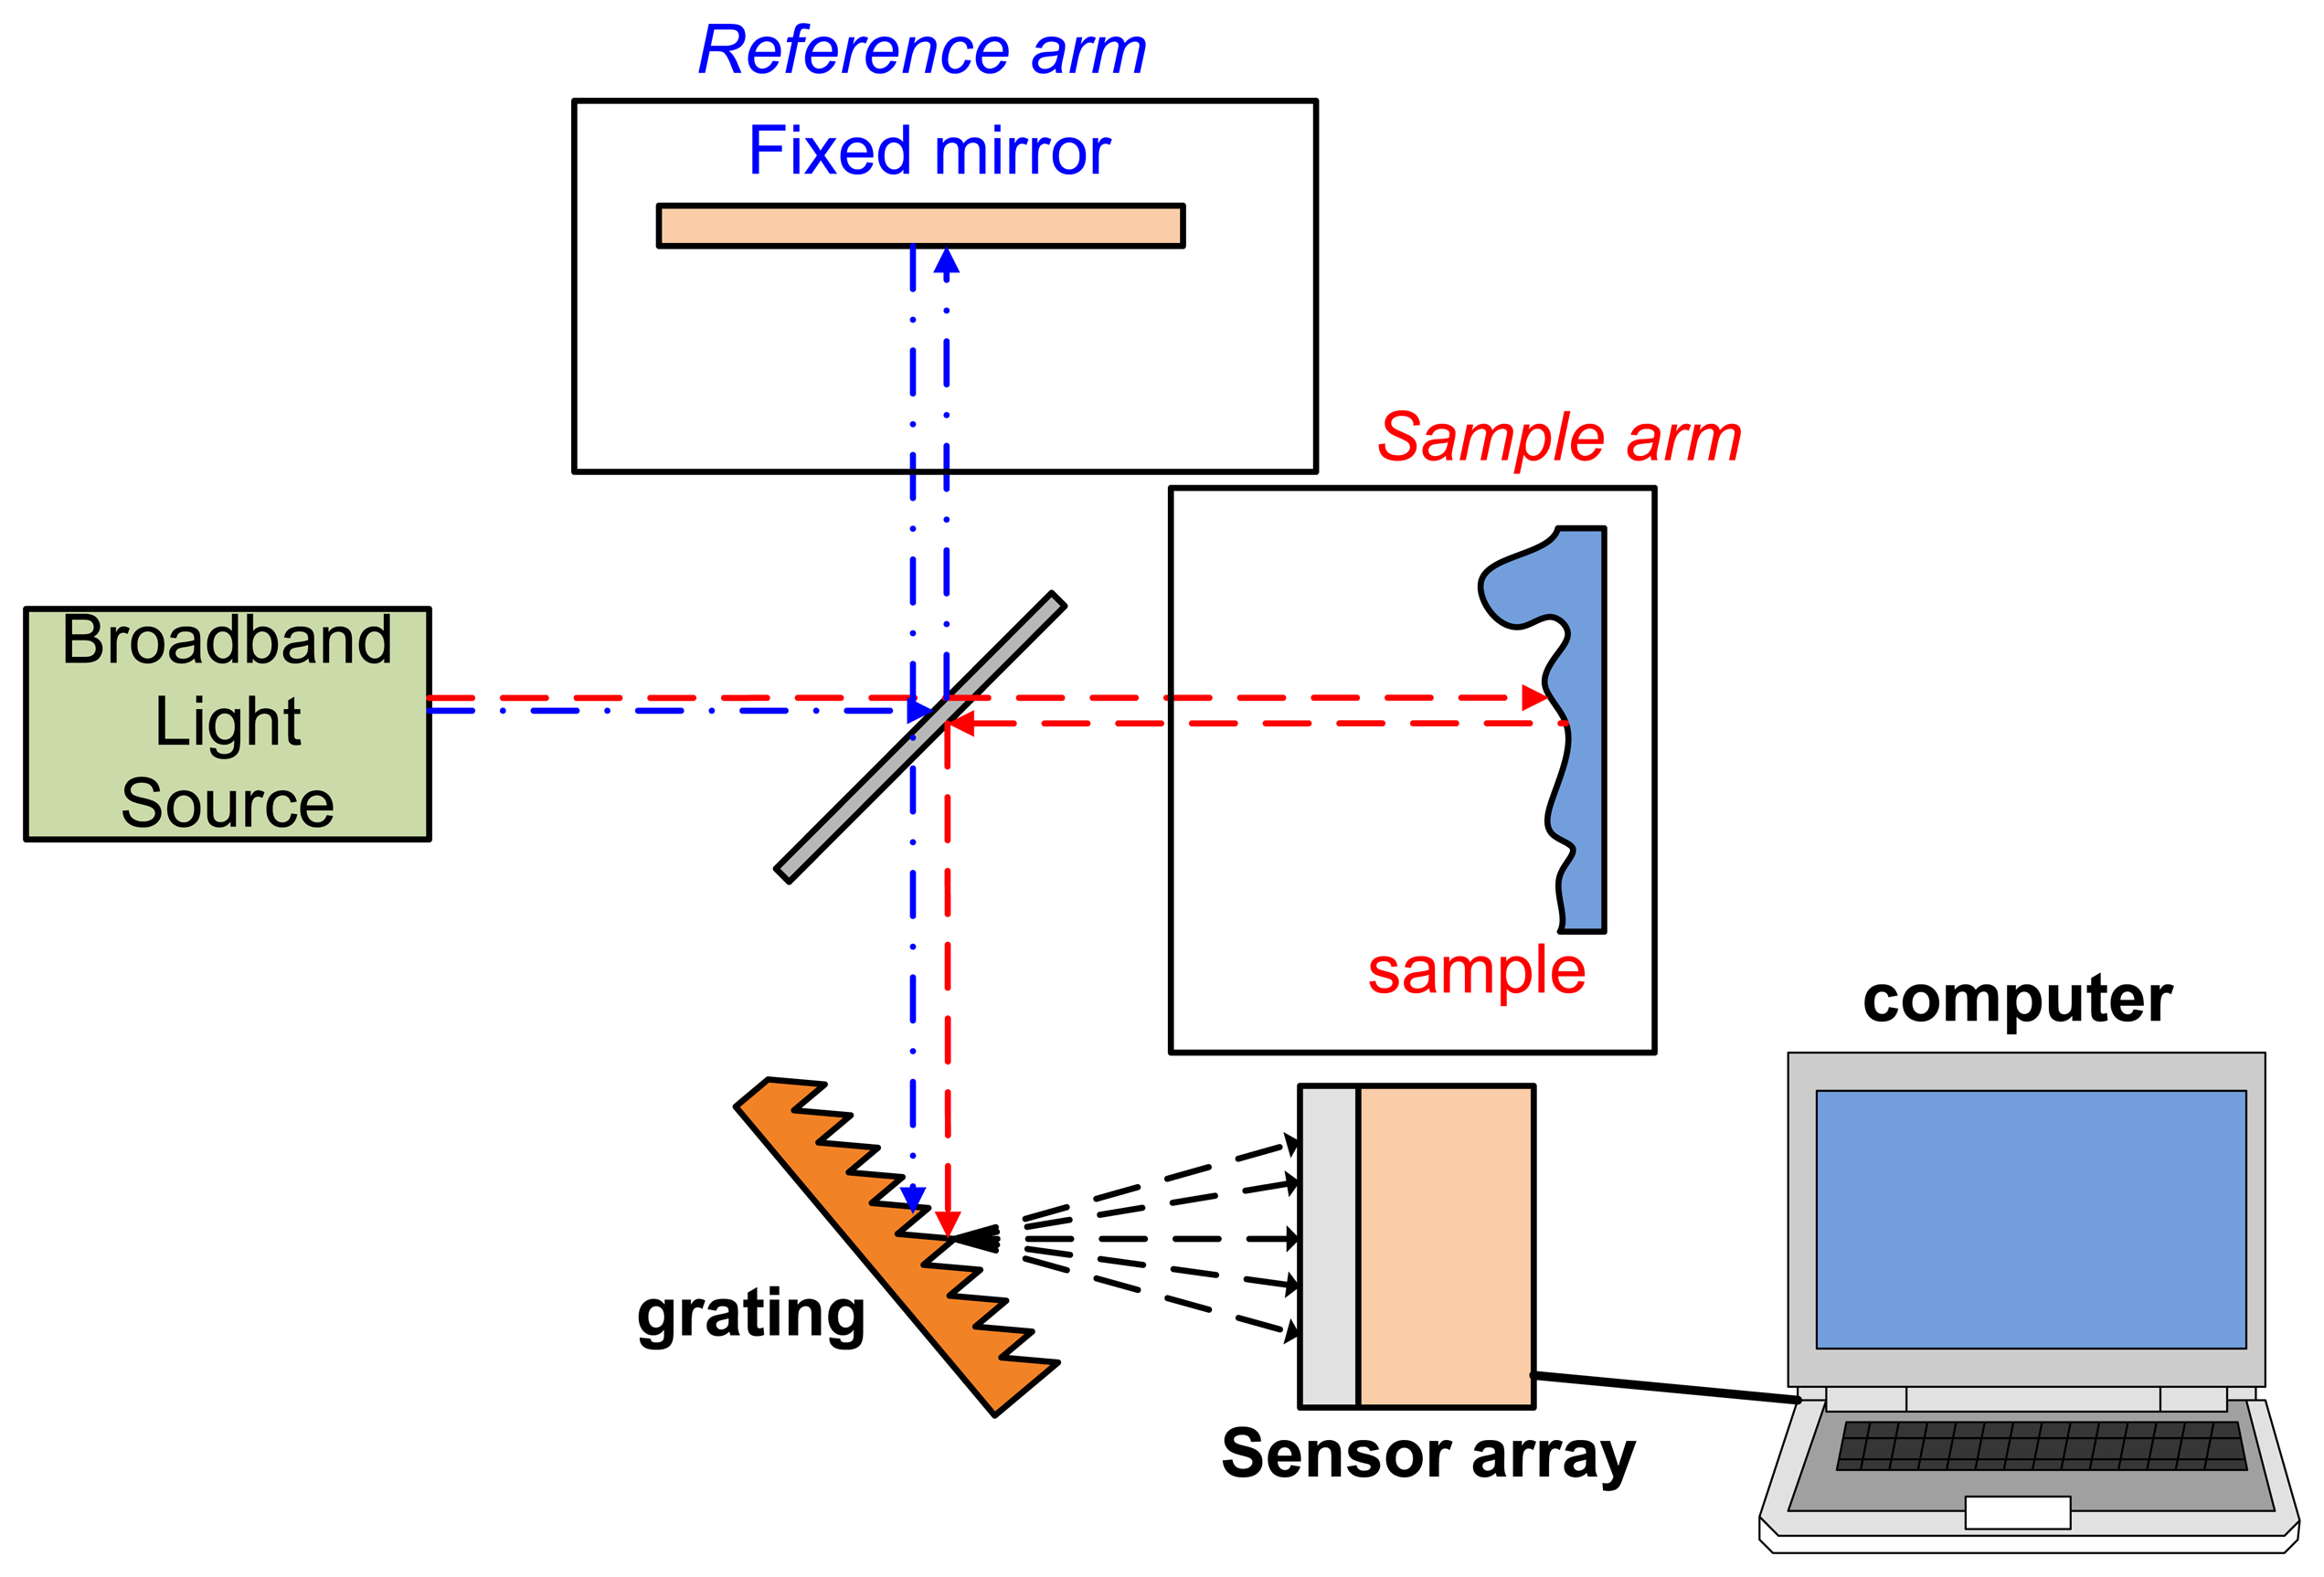
Another common type of OCT is the spectral domain OCT (SD-OCT) or Fourier domain OCT (FD-OCT). Unlike TD-OCT, the OPL in SD-OCT is decided from different wavelengths [30] and no moving reflection mirror is necessary. A SD-OCT system is setup with almost same components as TD-OCT but with an additional grating (for spatial Fourier transform), sensor array (usually CCD array) or spectrometer. A SD-OCT system setup is shown in Figure 2.
The OCT axial resolution is related to the light source coherence length lc, which is a function of the light source bandwidth (Δλ). The light source coherence length can be described by Equation (2) [31]:
OCT systems with appropriate broadband light sources usually demonstrate excellent axial resolution <20 μm [12,13]. The transverse resolution is decided by the final spot size on the sample. Higher transverse resolution may be achieved with a focused light. The dispersion and phase compensation are also important to an OCT system. Detailed reviews of these advanced technologies can be found in the references [1,7,9,18].
Functional OCT can also provide sample functional information such as blood velocity (by DOCT [16,32]), the organization of tissue structural (by PS-OCT [33,34]). Clinicians may select a suitable type of OCT according to their requirements.
2.2. Comparison with Other Dental Diagnostic Methods
Traditionally, the presence of dental disease is assessed using visualization and probing. However, their sensitivity and reliability are questionable. Radiography and dental computed tomography (dental CT) have become the most popular diagnostic methods today. Dental CT could provide three-dimensional images for better diagnosis. Nevertheless, the harmful ionizing radiation of radiography and dental CT limit their usage. Very early diagnosis of disease by radiography is difficult. Recently, several novel techniques have been developed for diagnosis of dental disease, such as a smart ultrasonic devices [29,35–37], LED-based dental optical probes [38], and laser fluorescence [39,40]. Raman and laser fluorescence spectrometers may also be applied in the detection of dental disease but are still under investigation. Raman spectrometers can measure the mineral and chemical content of tissues in vitro. The laser fluorescence spectrometer is reported as a tool to detect and quantify caries. Lack of diagnostic consistency would be a problem. The presence of bacteria, electrolytic solutions, and blood considerably influence the intensity of fluorescence [39,40]. Table 1 shows a comparison between dental OCT and other dental diagnostic methods used today. In conclusion, OCT is an effective diagnostic tool because it is a noninvasive, nondestructive, non-radiated, and real-time monitoring method.
3. Applications of Dental OCT
Early OCT studies focused mainly on the topics of dental soft and hard tissue morphology because of the limitation of system size and light source manufacture technology [45–47]. Nowadays, with well-developed components, this powerful tool could be applied in last decade in advanced diagnosis problems such as tooth decay and periodontal disease. OCT is not only an “imaging tool” but also an important and non-invasive method for early detection of oral disease. The important clinical applications of dental OCT, including tooth decay, periodontal disease and oral cancer, will be reviewed.
3.1. Tissue Images
Figure 3 illustrates a tooth structure. Colson et al. first reported the 1,310 nm TD-OCT image of teeth and compared them with a photomicrograph under 17 μm resolution [26]. They only examined the characteristics of the oral structure surface because of the insufficient penetrating depth. The in vitro images of enamel-cementum and gingiva-tooth interfaces in a porcine model were shown. Otis et al. presented the first in vivo OCT images of human dental tissues [47]. The axial resolution was 12 μm with 1,310 nm center wavelength. They obtained a smaller but deeper (3 mm) tooth image. Their OCT images provided visual recording of the dentin-enamel junction (DEJ) and periodontal structures. Feldchteine et al. demonstrated that hard palate mucosa and gingiva mucosa could be visualized [45]. The OCT images showed the hard palate mucosa. The squamous epithelium appears as the 170 mm top layer above the 200 mm thick lamina propria. OCT images also displayed gingiva mucosa to a depth of 500 μm, although the epithelium and lamina propria were not well differentiated in their scans. Moreover, they also presented the polarization imaging of normal dental hard tissue. OCT images in normal polarization scan mode showed that enamel, dentin, and DEJ were clearly visible. Warren et al. provided more detail tooth structure along the vertical axis [48]. The axial structure from enamel to dentin and cementum to dentin was revealed.
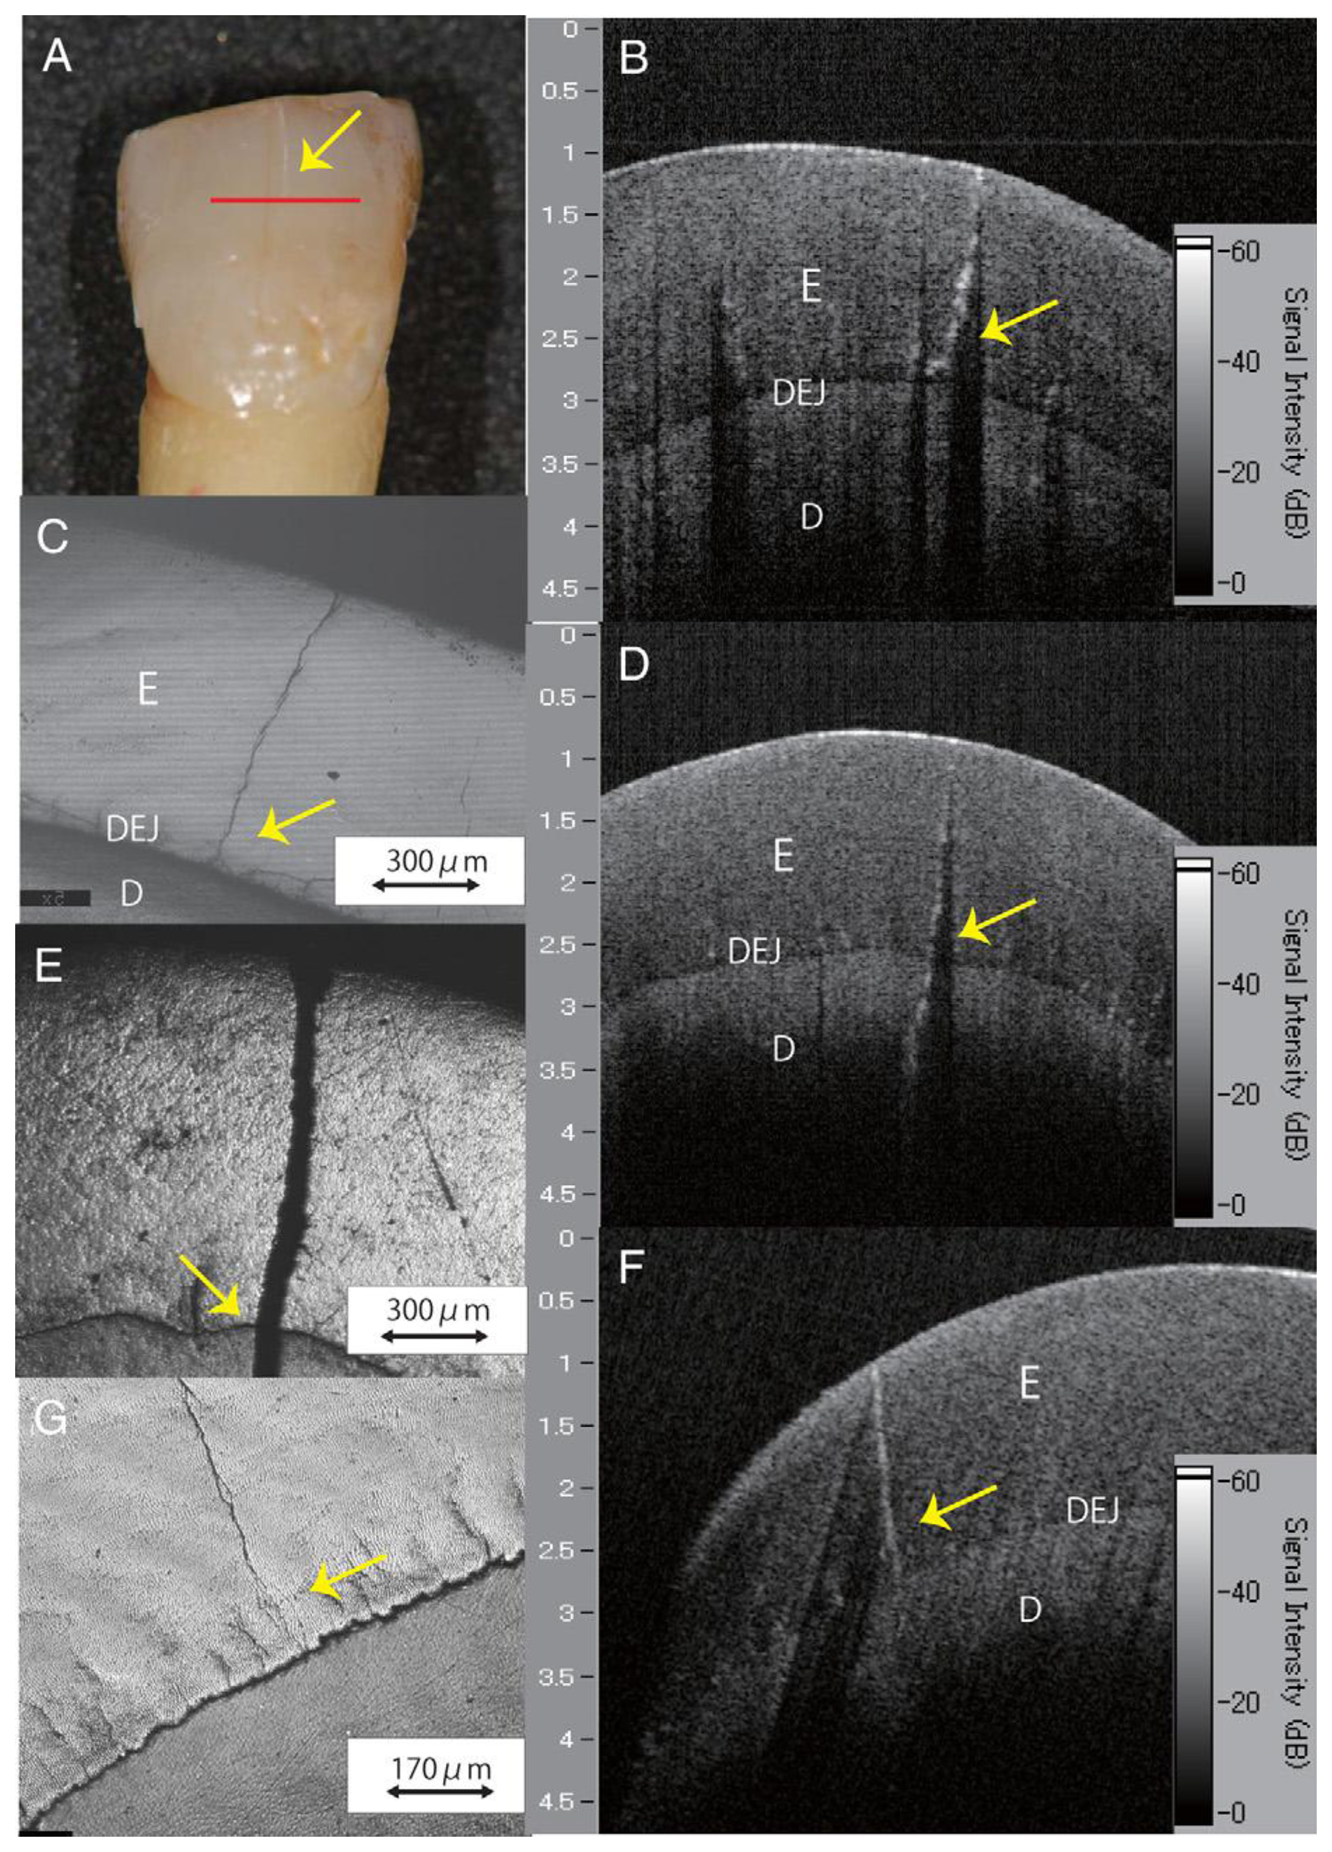
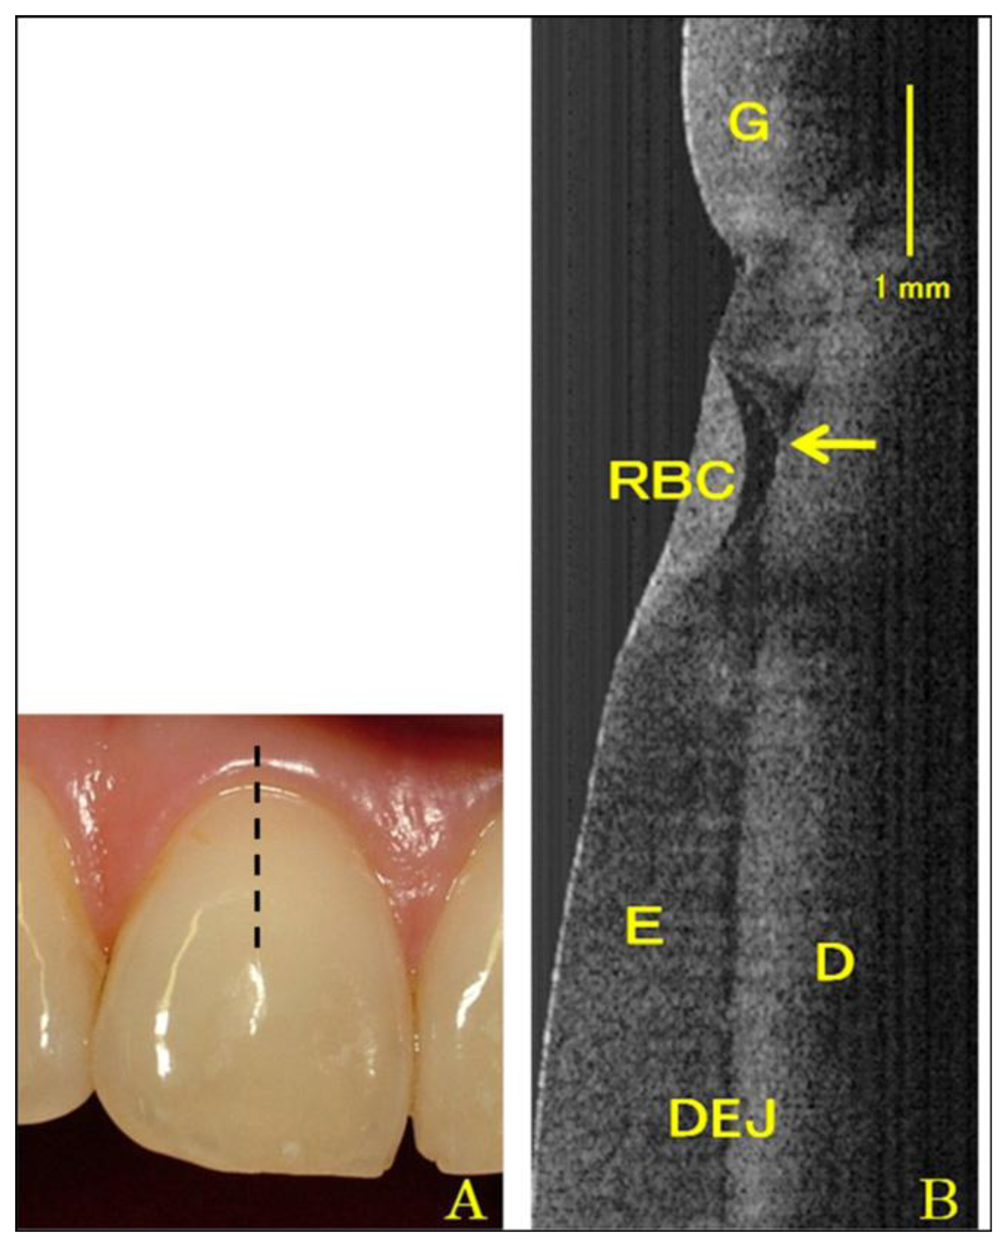
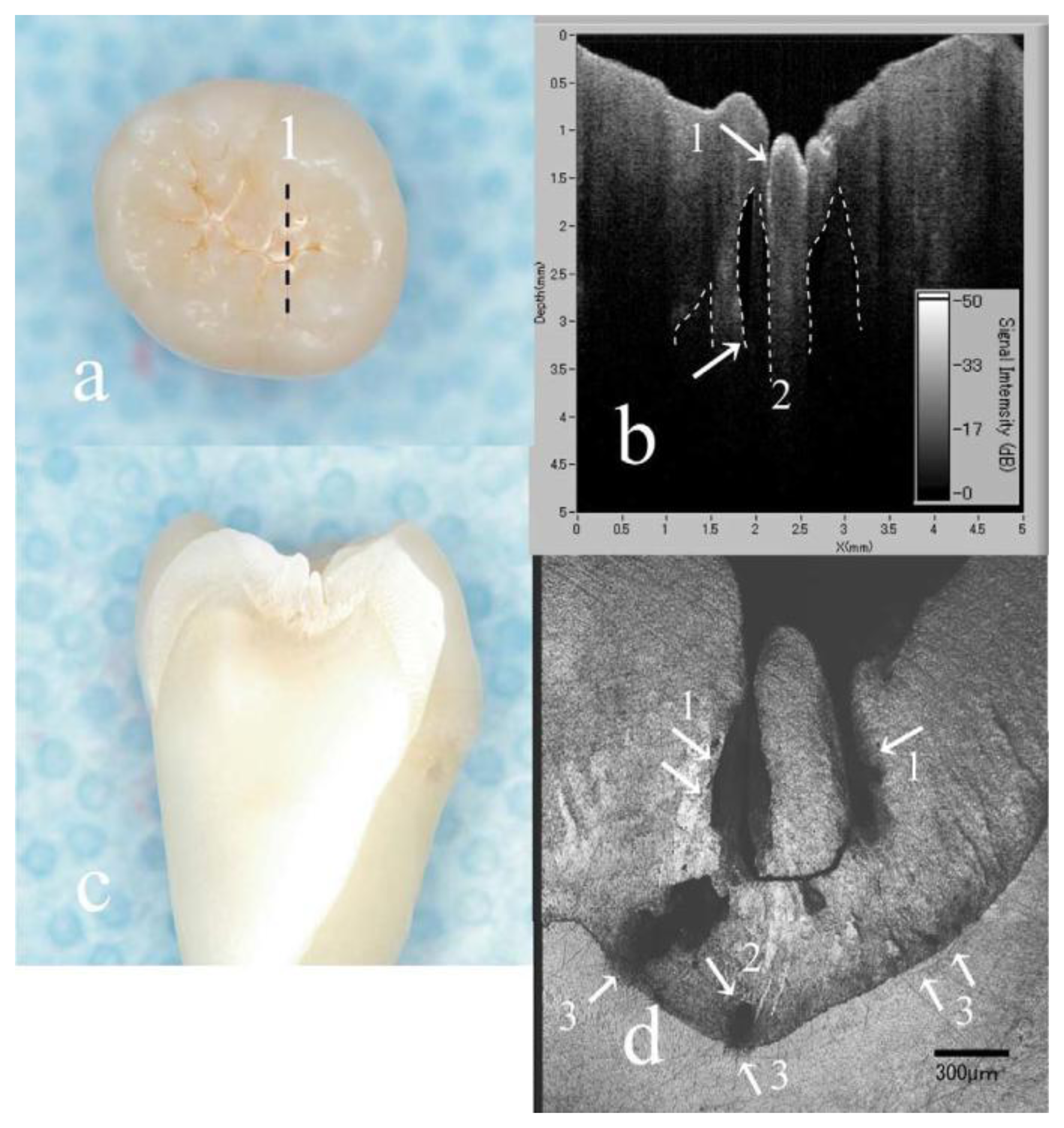
In addition to structure image measurement, OCT is also applied for crack (fracture) [49–51] and microleakage [52–55] detection. The definition of cracks is the “gaps” in the tooth surface, such as enamel cracks. Cracked teeth may lead to extraction if there is no treatment intervention. Imai et al. represented the extension of enamel cracks beyond DEJ (Figure 4) [49]. Microleakage means the “gap” between tooth and restorative materials (Figure 5) [52–55]. Ishibashi et al. demonstrated the microleakage beneath composite resin restorative material (Figure 6) [54]. Hsieh et al. also detected in vivo microleakage in OCT images with a custom-made dental optical probe (Figure 7) [55]. They also measured the microleakage at approximately 401 μm × 148 μm in size, which is very close to the real size.
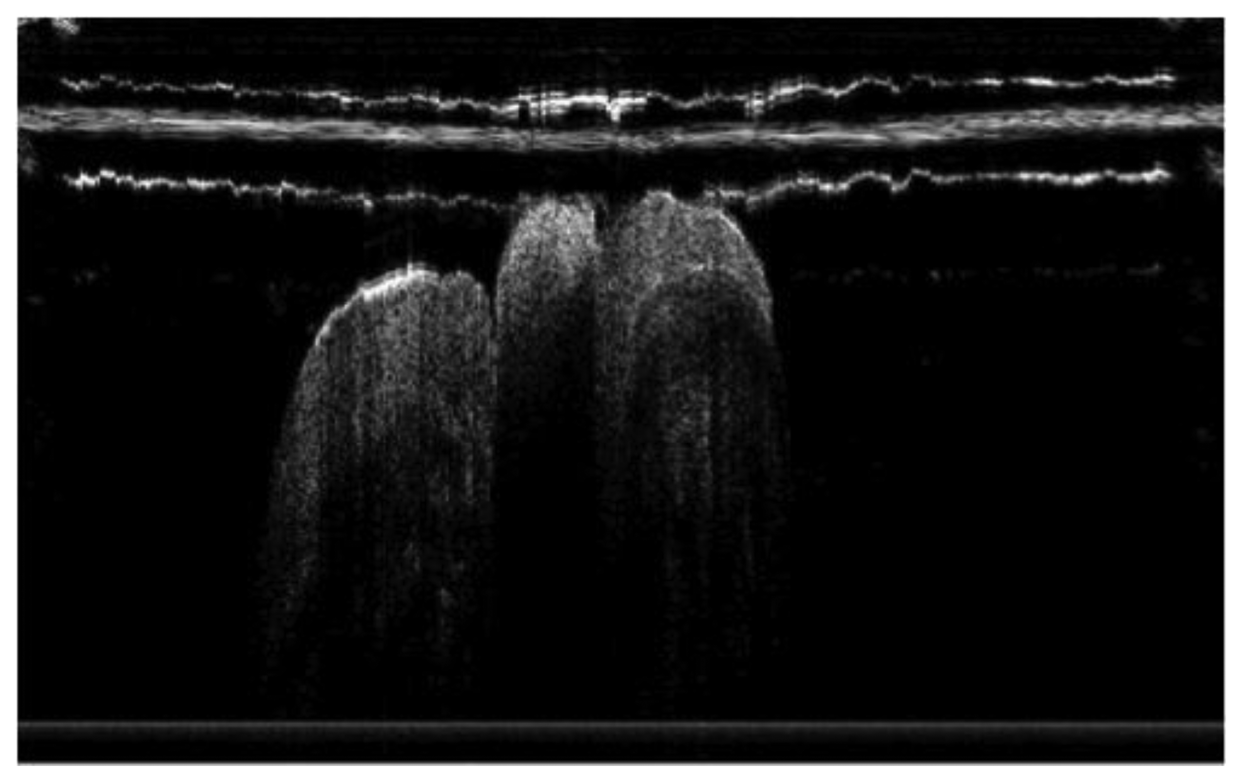
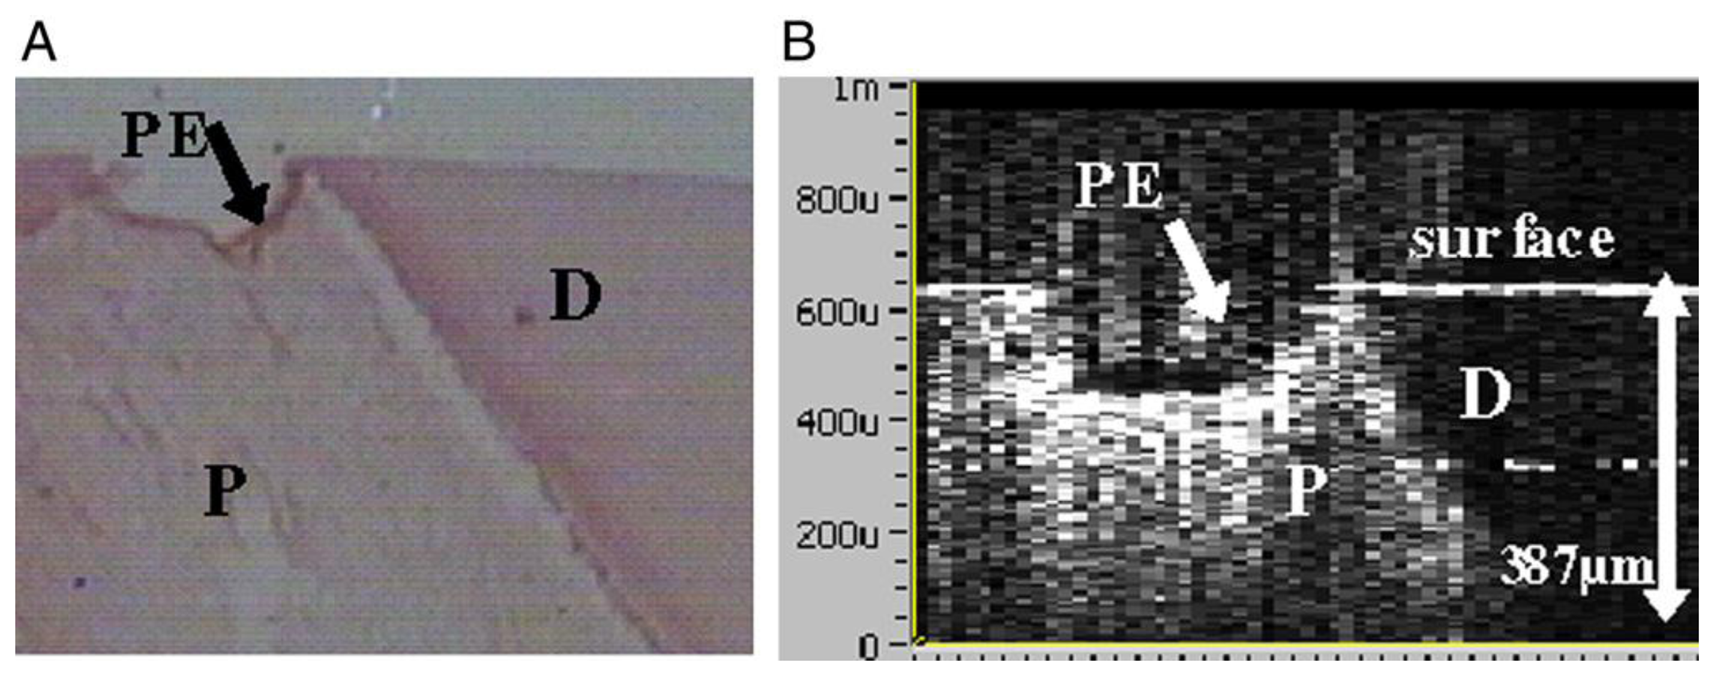
Recently, OCT was also used in imaging of the pulp-dentin complex [56]. The result of this study showed the capacity of OCT to distinguish pulp from dentin (Figure 8). OCT can be used to predict remaining dentin thickness above pulp, and will permit more predictive prognosis of dental treatment.
3.2. Tooth Decay: Caries, Attrition and Abrasion
Caries is an important dental care issue. Caries has high prevalence and wide distribution among ages. The World Health Organization (WHO) revealed that dental caries is still a major public health problem globally and major public health problem in most high-income countries. This disease affected 60%–90% of school-aged children and the vast majority of adults in 2009 [57]. Studies also showed that poor oral hygiene and dental caries may correlate with various systemic diseases, such as systemic infection, kidney inflammation and septicemia [58–61]. The mechanical tooth wear due to attrition and abrasion may also cause the loss of tooth structures. OCT provides the capability for early detection of caries (Figure 9) [62–65]. Because strong birefringence in enamel and anisotropic light propagation through dentinal tubules was observed, many research projects are focused on the application of PS-OCT in caries detection [66–76]. Baumgartner et al. presented the first polarization resolved images of dental caries [66–68]. Wang et al. measured the birefringence in dentin and enamel and suggested that the enamel rods acted as waveguides [46]. PS-OCT is suitable for the detection of secondary caries, because the scattering properties of restorative materials and dental hard tissue have marked differences [70,71].
Nowadays, PS-OCT is often used for very early caries diagnosis, because it can determine the level of demineralization for early detection of caries (Figure 10) [72–75]. Moreover, recent researches showed that an OCT system with an integrated micromechanical system (MEMS) scanner could obtain a 3D OCT image [76]. This could lead to rapid detection of both early demineralization and more severe lesions.
3.3. Periodontal Diseases
Periodontitis is one of the major chronic infectious diseases in the oral cavity. The prevalence of periodontitis is more than 50% among the population [77,78]. The WHO revealed that tooth loss resulting from severe periodontitis was found in 5%–15% of most worldwide populations in 2003 [79]. Additionally, recent studies have indicated that certain correlations between periodontitis and various systemic diseases exist [80–82]. Colston et al. were the first group to apply OCT in the diagnosis of periodontal disease [83,84]. They took in vitro images of dental and periodontal tissues from a young porcine model and compared these images to histological sections. Feldchteine et al. demonstrated epithelium and lamina propria of gingival mucosa [45]. However, the epithelium and lamina propria were not well differentiated because of the physical limitation. Baek et al. represented OCT images of periodontal ligaments during orthodontic movement of rat (Figure 11) [85]. Hsieh et al. demonstrated subgingival calculus in vitro. Tooth with subgingival calculus covered with 0.8 mm porcine gingiva was measured (Figure 12). Subgingival calculus is one of the pathogenetic factors of periodontal disease, so it is important to remove the residual subgingival calculus [28]. The refractive indices of enamel, dentin, cementum, and calculus were also measured as 1.625 ± 0.024, 1.534 ± 0.029, 1.570 ± 0.021, and 2.097 ± 0.094, respectively. The refractive indices help clinicians to distinguish calculus from normal tissues rapidly and correctly. With the aid of OCT, early detection of periodontal disease and monitoring of periodontal treatment could be very helpful.
3.4. Oral Cancer
Oral cancer has become the fourth leading cause of cancer death in males in Taiwan [86]. An estimated 263,900 new cases and 128,000 deaths from oral cavity cancer (including lip cancer) occurred in 2008 worldwide [87]. Oral cancer occurs with an annual incidence of approximately 29,370 cases in the United States [88]. Treatment of oral cancer and the survival rates are directly related to the stage of cancer diagnosed. Early diagnosis permits minimally invasive treatment and greatly improves long-term survival. Wilder-Smith et al. reported that OCT could detect neoplasia-related epithelial, sub-epithelial changes throughout carcinogenesis [89]. Jung et al. also obtained similar results with better resolution [90]. Moreover, they incorporated three-dimensional images and applied Doppler OCT for better diagnosis. Tsai et al. demonstrated swept-source OCT (SS-OCT) had better image qualities than SD-OCT [91,92]. Moreover, by utilizing nanoparticles, OCT could obtain better contrast images at early stage of oral cancer [93,94]. OCT OCT is a good tool for early diagnosis of oral cancer, providing better understanding of pathological mechanisms, predictors of malignant change, risk of tumor recurrence, and predictors of tumor response to therapy [89].
Tsai et al. utilized SS-OCT to differentiate different oral carcinogenesis stages, including mild dysplasia (MiD), moderate dysplasia (MoD), early-stage squamous cell carcinoma (ES-SCC), and well-developed SCC (WD-SCC) [95]. Figure 13 shows histological images of normal, MiD, MoD, ES-SCC and WD-SCC. In the normal sample, the epithelium (EP) and lamina propria (LP) layers could be clearly differentiated. Vessels could also be observed in the LP layer. In the MiD stage, the EP layer was thickened, dysplastic cells were found in the lower one-third of EP, and there was an increase in collagen deposition in the LP layer. A thick stratum corneum (SC) layer can be found on EP surface in MoD stage and EP become thicker than in MiD stage. At ES-SCC and WD-SCC stages, the EP/LP boundary disappeared. On the basis of SS-OCT images, oral precancer lesion (MiD and MoD) and oral cancer (ES-SCC and WD-SCC) could be differentiated using OCT (Figure 14). It is beneficial to diagnose oral precancer patient. Minimally invasive treatment could enhance patient's life quality.
A similar analysis was also used for oral submucous fibrosis (OSF). Lee et al. measured the thickness of EP and SD for OSF diagnosis [96]. The increasing thickness of EP and DS was thickened by the dysplasia collagen.
3.5. Other Dental-Related Diseases
As OCT can delineate changes in epithelium, this imaging tool has potential broad applications in mucosal lesions, including lichen planus, pemphigoid, or vascular lesions. Further research was necessary to provide more detailed images. Studies discussed the OCT image quality with a 1,550 nm light source [97,98]. They revealed the possibility of this application for bone-related disease imaging. Future research should focus on the suitable wavelength of light source of OCT for better observation of oral-related disease.
4. Discussion
There are still some limitations on the popularization of dental OCT applications. The first issue is the insufficient scanning range of OCT. Because the scanning range is usually several millimeters, hundreds or thousands of pictures may be necessary for a whole lesion. A well-developed dental optical probe incorporating OCT may overcome this problem. The convenience of dental optical probes enables clinicians to screen the whole lesion and to focus on the specific area rapidly. Second, the low penetration depth also restricts utility for clinical use. The issue of penetration depth is a physics problem. Choosing a high-quality light source may be a solution, however, a high-quality light source will increase the cost of an OCT system.
Besides, there are some factors affecting the performance of OCT in dental applications. Wavelength choice may be the most important factor in these experiments. Within the near-infrared window in biological tissue, the center wavelength determines the maximum depth of penetration in tissue due to the scattering and absorption properties [99]. When the wavelength is under 1,000 nm, the scattering property is the main effective factor because of the similar size of light and particles in tissue. This phenomenon is often analysed by Mie scattering theory. The absorption effect increases after 1,000 nm and reaches the maximum around 1,400 nm. Water in tissue will decay the input of light energy strongly. Therefore, different wavelengths are employed for a variety of samples. For example, an OCT system with 1,550 nm center wavelength is good for hard tissue measurement but not suitable for soft tissue imaging, because the input light will be absorbed by blood or water. In dental application, this system is more appropriate for hard tissue, such as enamel, dentin and alveolar bone, but not for mucosa or gingiva imaging.
The composition and uniformity of sample is another factor that affects experiment results. Samples with rough surfaces or inhomogeneous composition show lower penetration depth and image contrast because of scattering effects. Another important factor is the index difference between sample and background. Optical scattering occurs due to mismatches in refractive index of the different tissue components. Therefore, materials with similar refractive index will demonstrate similar OCT images. For example, the retina layers are difficult to distinguish because of their similar compositions. Functional OCT, including DOCT and PS-OCT, gathers more information in biological tissues. DOCT can provide the blood velocity and inflamed tissue volume information. On the other hand, PS-OCT can be used for structure orientation due to the polarization property.
For in vivo measurement, some important issues, including dental optical probe design, data acquisition time and scanning range, should be taken into consideration. A well-design dental optical probe is indispensable for clinical oral imaging. Also, dental optical probes enable three-dimensional imaging.
Data acquisition time is another key factor. OCT can obtain images in seconds. However, low image quality will be observed with faster imaging speeds due to insufficient processing time. Users should select a balance between image quality and acquisition time.
5. Conclusions
OCT has become a very important research tool in medical and clinical diagnosis. In dentistry, dental OCT provides the benefits of low cost, non-invasive, non-radiative, and high resolution. Dental OCT demonstrates broad applications in soft and hard tissue imaging and early detection of caries, periodontal disease and oral cancer.
For tissue imaging, OCT can be used for gingiva, periodontal and mucosa imaging. Clinicians can obtain not only the structural images by conventional OCT, but also blood information and structure orientation by functional OCT methods such as DOCT and PS-OCT. With a longer center wavelength, OCT may also apply in bone-related disease imaging.
OCT and PS-OCT represent powerful ability for early diagnosis of caries. Mineral changes at early demineralization stages can be distinguished by PS-OCT. OCT can diagnose periodontal disease and precancerous lesions. Subgingival calculus can also be detected by OCT. Minimum invasive therapy could be performed. Better treatment outcomes and survival rates could be obtained through early detection of oral cancer.
OCT provides images of dental tissue in situ and real-time. OCT imaging allows early detection of many oral diseases, including caries, periodontal disease, and oral cancer. In the future, an OCT system with handheld optical probe and minimized system setup should demonstrate its feasibility for telemedicine with a Picture Archiving and Communication System (PACS). This will be helpful in the home nursing care plan in our aging society.
Acknowledgments
This work was supported in part by the Taiwan National Science Council under Grant NSC 102-2622-E-009-007-CC3, NSC 101-2628-E-009-026-MY3, NSC 101-3011-P-010-003 and NSC 101-2627-E-010-001.
Conflicts of Interest
The author declares no conflict of interest.
References
- Huang, D.; Swanson, E.A.; Lin, C.P.; Schuman, J.S.; Stinson, W.G.; Chang, W.; Hee, M.R.; Flotte, T.; Gregory, K.; Puliafito, C.A.; Fujimoto, J.G. Optical coherence tomography. Science 1991, 254, 1178–1181. [Google Scholar]
- Poneros, J.M.; Brand, S.; Bouma, B.E.; Tearney, G.J.; Compton, C.C.; Nishioka, N.S. Diagnosis of specialized intestinal metaplasia by optical coherence tomography. Gastroenterology 2001, 120, 7–12. [Google Scholar]
- Evans, J.A.; Poneros, J.M.; Bouma, B.E.; Bressner, J.; Halpern, E.F.; Shishkov, M.; Lauwers, G.Y.; Kenudson, M.M.; Nishioka, N.S.; Tearney, G.J. Optical coherence tomography to identify intramucosal carcinoma and high-grade dysplasia in Barrett's esophagus. Clin. Gastroenterol. Hepatol. 2006, 4, 38–43. [Google Scholar]
- Smith, P.W.; Lee, K.; Guo, S.; Zhang, J.; Osann, K.; Chen, Z.; Messadi, D. In vivo diagnosis of oral dysplasia and malignancy using optical coherence tomography: Preliminary studies in 50 patients. Lasers Surg. Med. 2009, 41, 353–357. [Google Scholar]
- Wang, Y.; Bower, B.A.; Izatt, J.A.; Tan, O.; Huang, D. Retinalblood flow measurement by circumpapillary Fourier domain Doppler optical coherence tomography. J. Biomed. Opt. 2008, 13. [Google Scholar] [CrossRef]
- Hangai, M.; Ojima, Y.; Gotoh, N.; Inoue, R.; Yasuno, Y.; Makita, S.; Yamanari, M.; Yatagai, T.; Kita, M.; Yoshimura, N. Three-dimensional imaging of macular holes with high-speed optical coherence tomography. Ophthalmology 2007, 114, 763–773. [Google Scholar]
- Yasuno, Y.; Hong, Y.; Makita, S.; Yamanari, M.; Akiba, M.; Miura, M.; Yatagai, T. In vivo high-contrast imaging of deep posterior eye by 1-μm swept source optical coherence tomography and scattering optical coherence angiography. Opt. Express 2007, 15, 6121–6139. [Google Scholar]
- Pagnoni, A.; Knuettel, A.; Welker, P.; Rist, M.; Stoudemayer, T.; Kolbe, L.; Sadiq, I.; Kligman, A.M. Optical coherence tomography in dermatology. Skin Res. Technol. 1999, 5, 83–87. [Google Scholar]
- Pierce, M.C.; Strasswimmer, J.; Park, B.H.; Cense, B.; de Boer, J.F. Birefringence measurements in human skin using polarization-sensitive optical coherence tomography. J. Biomed. Opt. 2004, 9, 287–291. [Google Scholar]
- Colston, B.W.; Sathyam, U.S., Jr.; DaSilva, L.B.; Everett, M.J.; Stroeve, P.; Otis, L.L. Dental OCT. Opt. Express 1998, 3, 230–238. [Google Scholar]
- Baumgartner, A.; Dichtl, S.; Hitzenberger, C.K.; Sattmann, H.; Robl, B.; Moritz, A.; Fercher, A.F.; Sperr, W. Polarization-sensitive optical coherence tomography of dental structures. Caries Res. 2000, 34, 59–69. [Google Scholar]
- Wojtkowski, M.; Srinivasan, V.; Fujimoto, J.G.; Ko, T.; Schuman, J.S.; Kowalczyk, A.; Duker, J.S. Three-dimensional retinal imaging with high-speed ultrahigh-resolution optical coherence tomography. Ophthalmology 2005, 112, 1734–1746. [Google Scholar]
- Fujimoto, J.G. Optical coherence tomography for ultrahigh resolution in vivo imaging. Nat. Biotechnol. 2003, 21, 1361–1367. [Google Scholar]
- Brezinski, M.E.; Tearney, G.J.; Weissman, N.J.; Boppart, S.A.; Bouma, B.E.; Hee, M.R.; Weyman, A.E.; Swanson, E.A.; Southern, J.F.; Fujimoto, J.G. Assessing atherosclerotic plaque morphology: Comparison of optical coherence tomography and high frequency intravascular ultrasound. Heart. 1997, 77, 397–403. [Google Scholar]
- Zvyagin, A.V.; FitzGerald, J.B.; Silva, K.K.M.B.D.; Sampson, D.D. Real-time detection technique for Doppler optical coherence tomography. Opt. Lett. 2000, 25, 1645–1647. [Google Scholar]
- Yang, X.D.V.; Mao, Y.X.; Munce, N.; Standish, B.; Kucharczyk, W.; Marcon, N.E.; Wilson, B.C.; Vitkin, I.A. Interstitial Doppler optical coherence tomography. Opt. Lett. 2005, 30, 1791–1793. [Google Scholar]
- De Boer, J.F.; Milner, T.E.; van Gemert, M.J.C.; Nelson, J.S. Two-dimensional birefringence imaging in biological tissue by polarization-sensitive optical coherence tomography. Opt. Lett. 1997, 22, 934–936. [Google Scholar]
- Yasuno, Y.; Makita, S.; Sutoh, Y.; Itoh, M.; Yatagai, T. Birefringence imaging of human skin by polarization-sensitive spectral interferometric optical coherence tomography. Opt. Lett. 2002, 27, 1803–1805. [Google Scholar]
- Pircher, M.; Goetzinger, E.; Leitgeb, R.; Hitzenberger, C. Three dimensional polarization sensitive OCT of human skin in vivo. Opt. Express 2004, 12, 3236–3244. [Google Scholar]
- Pan, Y.T.; Xie, H.K.; Fedder, G.K. Endoscopic optical coherence tomography based on a microelectromechanical mirror. Opt. Lett. 2010, 26, 1966–1968. [Google Scholar]
- Herz, P.; Chen, Y.; Aguirre, A.; Fujimoto, J.; Mashimo, H.; Schmitt, J.; Koski, A.; Goodnow, J.; Petersen, C. Ultrahigh resolution optical biopsy with endoscopic optical coherence tomography. Opt. Express 2004, 12, 3532–3542. [Google Scholar]
- Lesaffre, M.; Farahi, S.; Gross, M.; Delaye, P.; Boccara, C.; Ramaz, F. Acousto-optical coherence tomography using random phase jumps on ultrasound and light. Opt. Express 2009, 17, 18211–18218. [Google Scholar]
- Lesaffre, M.; Farahi, S.; Boccara, A.C.; Ramaz, F.; Gross, M. Theoretical study of acousto-optical coherence tomography using random phase jumps on ultrasound and light. J. Opt. Soc. Am. A 2011, 28, 1436–1444. [Google Scholar]
- Iftimia, N.; Iyer, A.K.; Hammer, D.X.; Lue, N.; Mujat, M.; Pitman, M.; Ferguson, R.D.; Amiji, M. Fluorescence-guided optical coherence tomography imaging for colon cancer screening: A preliminary mouse study. Biomed. Opt. Express 2012, 3, 178–191. [Google Scholar]
- Park, J.; Jo, J.A.; Shrestha, S.; Pande, P.; Wan, Q.J.; Applegate, B.E. A dual-modality optical coherence tomography and fluorescence lifetime imaging microscopy system for simultaneous morphological and biochemical tissue characterization. Biomed. Opt. Express 2010, 1, 186–200. [Google Scholar]
- Colston, B.W.; Everett, M.J., Jr.; da Silva, L.B.; Otis, L.L.; Stroeve, P.; Nathel, H. Imaging of hard- and soft-tissue structure in the oral cavity by optical coherence tomography. Appl. Opt. 1998, 37, 3582–3585. [Google Scholar]
- Drexler, W.; Fujimoto, J.G. Optical Coherence Tomography: Technology and Applications; Springer Berlin Heidelberg: New York, NY, USA, 2008. [Google Scholar]
- Hsieh, Y.S.; Ho, Y.C.; Lee, S.Y.; Lu, C.E.; Jiang, C.P.; Chuang, C.C.; Wang, C.Y.; Sun, C.W. Subgingival calculus imaging based on swept-source optical coherence tomography. J. Biomed. Opt. 2011, 16. [Google Scholar] [CrossRef]
- Xiang, X.; Sowa, M.G.; Iacopino, A.M.; Maev, R.G.; Hewko, M.D.; Man, A.; Liu, K.Z. An update on novel non-invasive approaches for periodontal diagnosis. J. Periodontol. 2009, 81, 186–198. [Google Scholar]
- Leitgeb, R.; Hitzenberger, C.K.; Fercher, A.F. Performance of fourier domain vs. time domain optical coherence tomography. Opt. Express 2003, 11, 889–894. [Google Scholar]
- Schmitt, J.M. Optical coherence tomography (OCT): A review. Sel. Top. Quantum Electron. IEEE J. 1999, 5, 1205–1215. [Google Scholar]
- Zhao, Y.; Chen, Z.P.; Saxer, C.; Xiang, S.H.; de Boer, J.F.; Nelson, S, D., J. Phase-resolved optical coherence tomography and optical Doppler tomography for imaging blood flow in human skin with fast scanning speed and high velocity sensitivity. Opt. Letters. 2000, 25, 114–116. [Google Scholar]
- Sakai, S.; Yamanari, M.; Lim, Y.; Nakagawa, N.; Yasuno, Y. In vivo evaluation of human skin anisotropy by polarization-sensitive optical coherence tomography. Biomed. Opt. Express. 2011, 2, 2623–2631. [Google Scholar]
- De Boer, J.F.; Srinivas, S.M.; Park, B.H.; Pham, T.H.; Chen, Z.P.; Milner, T.E.; Nelson, J.S. Polarization effects in optical coherence tomography of various biological tissues. IEEE J. Sel. Top. Quantum Electron. 1999, 5, 1200–1204. [Google Scholar]
- Harry, E.A.R.; Clerehugh, V. Subgingival calculus: Where are we now? A comparative review. J. Dent. 2000, 28, 93–102. [Google Scholar]
- Meissner, G.; Oehme, B.; Strackeljan, J.; Kocher, T. Clinical subgingival calculus detection with a smart ultrasonic device: A pilot study. J. Clin. Periodontol. 2008, 35, 126–132. [Google Scholar]
- Meissner, G.; Oehme, B.; Strackeljan, J.; Kocher, T. A new system to detect residual subgingival calculus: In vitro detection limits. J. Clin. Periodontol. 2006, 33, 195–199. [Google Scholar]
- Krause, F.; Braun, A.; Jepsen, S.; Frentzen, M. Detection of subgingival calculus with a novel LED-based dental optical probe. J. Periodontol. 2005, 76, 1202–1206. [Google Scholar]
- Krause, F.; Braun, A.; Frentzen, M. The possibility of detecting subgingival calculus by laser-fluorescence. in vitro. Lasers Surg. Med. 2003, 18, 32–35. [Google Scholar]
- Thomas, S.S.; Mohanty, S.; Jayanthi, J.L.; Varughese, J.M.; Balan, A.; Subhash, N. Clinical trial for detection of dental caries using laser-induced fluorescence ratio reference standard. J. Biomed. Opt. 2010, 15. [Google Scholar] [CrossRef]
- Tsuda, H.; Arends, J. Raman spectroscopy in human dental calculus. J. Dent. Res. 1993, 72, 1609–1613. [Google Scholar]
- Carmona, P.; Bellanato, J.; Escolar, E. Infrared and Raman spectroscopy of urinary calculi: A review. Biospectroscopy 1997, 3, 331–346. [Google Scholar]
- Tsuda, H.; Arends, J. Raman spectroscopy in dental research: A short review of recent studies. J. Dent. Res. 1997, 11, 539–547. [Google Scholar]
- Kurihara, E.; Koseki, T.; Gohara, K.; Nishihara, T.; Ansai, T.; Takehara, T. Detection of subgingival calculus and dentine caries by laser fluorescence. J. Periodontal Res. 2004, 39, 59–65. [Google Scholar]
- Feldchtein, F.; Gelikonov, V.; Iksanov, R.; Gelikonov, G.; Kuranov, R.; Sergeev, A.; Gladkova, N.; Ourutina, M.; Reitze, D.; Warren, J. In vivo OCT imaging of hard and soft tissue of the oral cavity. Opt. Express 1998, 3, 239–250. [Google Scholar]
- Wang, X.J.; Milner, T.E.; de Boer, J.F.; Zhang, Y.; Pashley, D.H.; Nelson, J.S. Characterization of dentin and enamel by use of optical coherence tomography. Appl. Opt. 1999, 38, 2092–2096. [Google Scholar]
- Otis, L.L.; Matthew, J.E.; Ujwal, S.S.; Colson, B.W., Jr. Optical coherence tomography: A new imaging technology for dentistry. J. Am. Dent. Assoc. 2000, 131, 511–514. [Google Scholar]
- Warren, J.A.; Gainesville, F.L., Jr.; Gelikonov, G.V.; Gelikonov, V.M.; Feldchtein, F.J.; Beach, N.M.; Moores, M.D.; Reitze, D.H. Imaging and Characterization of Dental Structure Using Optical Coherence Tomography. Proceedings of Lasers Electro-Optics, CLEO, San Francisco, CA, USA, 3–8 May 1998.
- Imai, K.; Shimada, Y.; Sadr, A.; Sumi, Y.; Tagami, J. Noninvasive cross-sectional visualization of enamel cracks by optical coherence tomography. in vitro. J. Endod. 2012, 38, 1269–1274. [Google Scholar]
- Braz, A.K.S.; Aguiar, C.M.; Gomes, A.S.L. Evaluation of crack propagation in dental composites by optical coherence tomography. Dent. Mater. 2009, 25, 74–79. [Google Scholar]
- Nakajima, Y.; Shimada, Y.; Miyashin, M.; Takagi, Y.; Tagami, J.; Sumi, Y. Noninvasive cross-sectional imaging of incomplete crown fractures (cracks) using swept-source optical coherence tomography. Int. Endod. J. 2012, 45, 933–941. [Google Scholar]
- Sadr, T.A.B.A.; Shimada, Y.; Tagami, J.; Sumi, Y. Non-invasive quantification of resin-dentin interfacial gaps using optical coherence tomography: Validation against confocal microscopy. Dent. Mater. 2011, 27, 915–925. [Google Scholar]
- Braz, A.K.S.; Aguiar, C.M.; Gomes, A.S.L. Evaluation of the integrity of dental sealants by optical coherence tomography. Dent. Mater. 2011, 27, e60–e64. [Google Scholar]
- Ishibashi, K.; Ozawa, N.; Tagami, J.; Sumi, Y. Swept-source optical coherence tomography as a new tool to evaluate defects of resin-based composite restorations. J. Dent. 2011, 39, 543–548. [Google Scholar]
- Hsieh, Y.S.; Lu, C.W.; Ho, Y.C.; Lee, S.Y.; Chuang, C.C.; Huang, W.C.; Sun, C.W. Microleakage Detection Based on Dental Optical Coherence Tomography. Proc. SPIE. 2013, 8566, 8566–8569. [Google Scholar]
- Braz, A.K.; Kyotoku, B.B.; Gomes, A.S. In vitro tomographic image of human pulp-dentin complex: Optical coherence tomography and histology. J. Endod. 2009, 35, 1218–1221. [Google Scholar]
- Petersen, P.E. Future Use of Materials for Dental Restoration; World Health Organization: Geneva, Switzerland, 2009. [Google Scholar]
- Timonen1, P.; Niskanen1, M.; Taipale, L.S.; Jula, A.; Knuuttila1, M.; Ylöstalo, P. Metabolic syndrome, periodontal infection, and dental caries. J. Dent. Res. 2010, 89, 1068–1073. [Google Scholar]
- Akar, H.; Akar, G.C.; Carrero, J.J.; Stenvinkel, P.; Lindholm, B. Systemic consequences of poor oral health in chronic kidney disease patients. Clin. J. Am. Soc. Nephrol. 2011, 6, 218–226. [Google Scholar]
- Grant, W.B. A review of the role of solar ultravioletB irradiance and vitamin D in reducing risk of dental caries. Dermatoendocrinology 2011, 3, 193–198. [Google Scholar]
- de Cássia Negrini, T.; Duque, C.; Höfling, J.F.; Gonçalves, R.B. Fundamental mechanisms of immune response to oral bacteria and the main perspectives of a vaccine against dental caries: A brief review. J. Dent. Sci. 2009, 124, 198–204. [Google Scholar]
- Holtzman, J.S.; Osann, K.; Pharar, J.; Lee, K.; Ahn, Y.; Tucker, T.; Sabet, S.; Chen, Z.; Gukasyan, R.; Smith, P.W. Ability of optical coherence tomography to detect caries beneath commonly used dental sealants. Lasers Surg. Med. 2010, 42, 752–759. [Google Scholar]
- Amaechi, B.T.; Podoleanu, A.; Higham, S.M.; Jackson, D.A. Correlation of quantitative light-induced fluorescence and optical coherence tomography applied for detection and quantification of early dental caries. J. Biomed. Opt. 2003, 8, 642–647. [Google Scholar]
- Amaechi, B.T.; Higham, S.M.; Podoleanu, A.; Rogers, J.A.; Jackson, D.A. Use of optical coherence tomography for assessment of dental caries: Quantitative procedure. J. Oral Rehabilitation 2001, 28, 1092–1093. [Google Scholar]
- Shimada, Y.; Sadr, A.; Burrow, M.F.; Tagami, J.; Ozawa, N.; Sumi, Y. Validation of swept-source optical coherence tomography (SS-OCT) for the diagnosis of occlusal caries. J. Dent. 2010, 38, 655–665. [Google Scholar]
- Baumgartner, A.; Hitzenberger, C.K.; Dicht, S.; Sattmann, H.; Moritz, A.; Sperr, W.; Fercher, A.F. Optical Coherence Tomography or Dental Structures. Proc. SPIE. 1998, 3248, 130–136. [Google Scholar]
- Baumgartner, A.; Dicht, S.; Hitzenberger, C.K.; Sattmann, H.; Robi, B.; Moritz, A.; Sperr, W.; Fercher, A.F. Polarization-Sensitive Optical Optical Coherence Tomography of Dental Structures. Proc. SPIE. 1999, 3593, 169–176. [Google Scholar]
- Jones, R.S.; Darling, C.L.; Featherstone, J.D.B.; Fried, D. Remineralization of in vitro dental caries assessed with polarization-sensitive optical coherence tomography. J. Biomed. Opt. 2006, 11, 014016. [Google Scholar]
- Everett, M.J.; Colston, B.W.; Sathyam, U.S.; Silva, L.B.D.; Fried, D.; Featherstone, J.D.B. Non-Invasive Diagnosis of Early Caries with Polarization Sensitive Optical Coherence Tomography (PS-OCT). Proc. SPIE 1999, 3593, 177–183. [Google Scholar]
- Fried, D.; Xie, J.; Shafi, S.; Featherstone, J.D.; Breunig, T.M.; Le, C. Imaging caries lesions and lesion progression with polarization sensitive optical coherence tomography. J. Biomed. Opt. 2002, 7, 618–627. [Google Scholar]
- Le, M.H.; Darling, C.L.; Fried, D. Automated analysis of lesion depth and integrated reflectivity in PS-OCT scans of tooth demineralization. Lasers Surg. Med. 2010, 42, 62–68. [Google Scholar]
- Lee, C; Darling, C.L.; Fried, D. Polarization-sensitive optical coherence tomographic imaging of artificial demineralization on exposed surfaces of tooth roots. Dent. Mater. 2009, 25, 721–728. [Google Scholar]
- Wu, J.; Fried, D. High contrast near-infrared polarized reflectance images of demineralization on tooth buccal and occlusal surfaces at λ = 1310-nm. Lasers Surg. Med. 2009, 41, 208–213. [Google Scholar]
- Chen, Y.; Otis, L.; Piao, D.; Zhu, Q. Characterization of dentin, enamel, and carious lesions by a polarization-sensitive optical coherence tomography system. Appl. Opt. 2005, 44, 2041–2048. [Google Scholar]
- Louie, T.; Lee, C; Hsu, D.; Hirasuna, K.; Manesh, S.; Staninec, M.; Darling, C.L.; Fried, D. Clinical assessment of early tooth demineralization using polarization sensitive optical coherence tomography. Lasers Surg. Med. 2010, 42, 738–745. [Google Scholar]
- Fried, D.; Staninec, M.; Darling, C; Kang, H.; Chan, K. Monitoring Tooth Demineralization Using a Cross Polarization Optical Coherence Tomographic System with An Integrated MEMS Scanner. Proc. SPIE 2012, 8208. [Google Scholar] [CrossRef]
- Hugoson, A.; Sjödin, B.; Norderyd, O. Trends over 30 years, 1973-2003, in the prevalence and severity of periodontal disease. J. Clin. Periodontol. 2008, 35, 405–414. [Google Scholar]
- Brown, L.J.; Loe, H. Prevalence, extent, severity and progression of periodontal disease. Periodontology 2000 1993, 2, 57–71. [Google Scholar]
- Petersen, P.E. The World Oral Health Report; World Health Organization: Geneva, Switzerland, 2003. [Google Scholar]
- Khader, Y.S.; Ta'ani, Q. Periodontal diseases and the risk of preterm birth and low birth weight: A meta-analysis. J. Periodontol. 2005, 76, 161–165. [Google Scholar]
- Beck, J.D.; Offenbach, S. Systemic effects of periodontitis: Epidemiology of periodontal disease and cardiovascular disease. J. Periodontol. 2005, 76(11-s), 2089–2100. [Google Scholar]
- Iacopin, A.M.; Cutler, C.W. Pathophysiological relationships between periodontitis and systemic disease: Recent concepts involving serum lipids. J. Periodontol. 2000, 71, 1375–1384. [Google Scholar]
- Colston, B.W.; Everett, M.J.; Silva, L.B.D.; Otis, L.L.; Nathel, H. Optical Coherence Tomography for Diagnosing Periodontal Disease. Proc. SPIE. 1997, 2973, 216–220. [Google Scholar]
- Smith, P.W.; Holtzman, J.; Epstein, J.; Le, A. Optical diagnostics in the oral cavity: An overview. Oral Dis. 2010, 16, 717–728. [Google Scholar]
- Baek, J.H.; Na, J.; Lee, B.H.; Choi, E.; Son, W.S. Optical approach to the periodontal ligament under orthodontic tooth movement: A preliminary study with optical coherence tomography. Am. J. Orthod. Dentofac. Orthop. 2009, 135, 252–259. [Google Scholar]
- Cancer Registration Report; Department of Health; Taiwan, 2003.
- Parkin, D.M.; Bray, F.; Ferlay, J.; Pisani, P. Global cancer statistics, 2002. CA Cancer J. Clin. 2005, 55, 74–108. [Google Scholar]
- Jemal, A.; Murray, T.; Ward, E.; Samuels, A.; Tiwari, R.C.; Ghafoor, A.; Feuer, E.J.; Thun, M.J. Cancer statistics, 2005. CA Cancer J. Clin. 2005, 55, 10–30. [Google Scholar]
- Smith, P.W.; Jung, W.G.; Brenner, M.; Osann, K.; Beydoun, H.; Messadi, D.; Chen, Z. In vivo optical coherence tomography for the diagnosis of oral malignancy. Lasers Surg. Med. 2004, 35, 269–275. [Google Scholar]
- Jung, W.; Zhang, J.; Chung, J.; Smith, P.W.; Brenner, M.; Nelson, J.S.; Chen, Z. Advances in oral cancer detection using optical coherence tomography. Sel. Top. Quantum Electron. IEEE J. 2005, 11, 811–817. [Google Scholar]
- Tsai, M.T.; Lee, H.C.; Lu, C.W.; Wang, Y.N.; Lee, C.K.; Yang, C.C.; Chiang, C.P. Delineation of an oral cancer lesion with swept-source optical coherence tomography. J. Biomed. Opt. 2008, 13. [Google Scholar] [CrossRef]
- Yang, C.C.; Tsai, M.T.; Lee, H.C.; Lee, C.K.; Yu, C.H.; Chen, H.M.; Chiang, C.P.; Chang, C.C.; Wang, Y.M.; Yang, C.C. Effective indicators for diagnosis of oral cancer using optical coherence tomography. Opt. Express 2008, 16, 15847–15862. [Google Scholar]
- Tseng, H.Y.; Lee, C.K.; Wu, S.Y.; Chi, T.T.; Yang, K.M.; Wang, J.Y.; Kiang, Y.W.; Yang, C.C.; Tsai, M.T.; Wu, Y.C.; Chou, H.Y.; Chiang, C.P. Au nanorings for enhancing absorption and backscattering monitored with optical coherence tomography. Nanotechnology. 2010, 21. [Google Scholar] [CrossRef]
- Kim, C.S.; Smith, P.W.; Ahn, Y.C.; Liaw, L.H.L.; Chen, Z.; Kwon, Y.J. Enhanced detection of early-stage oral cancer in vivo by optical coherence tomography using multimodal delivery of gold nanoparticles. J. Biomed. Opt. 2009, 14. [Google Scholar] [CrossRef]
- Tsai, M.T.; Lee, C.K.; Lee, H.C.; Chen, H.M.; Chiang, C.P.; Wang, Y.M.; Yang, C.C. Differentiating oral lesions in different carcinogenesis stages with optical coherence tomography. J. Biomed. Opt. 2009, 14. [Google Scholar] [CrossRef]
- Lee, C.K.; Tsai, M.T.; Lee, H.C.; Chen, H.M.; Chiang, C.P.; Wang, Y.M.; Yang, C.C. Diagnosis of oral submucous fibrosis with optical coherence tomography. J. Biomed. Opt. 2009, 14. [Google Scholar] [CrossRef]
- Klein, T.; Wieser, W.; Biedermann, B.R.; Eigenwillig, C.M.; Palte, G.; Huber, R. Raman-pumped Fourier-domain mode-locked laser: Analysis of operation and application for optical coherence tomography. Opt. Lett. 2008, 33, 2815–2817. [Google Scholar]
- Biedermann, B.R.; Wieser, W.; Eigenwillig, C.M.; Huber, R. Recent developments in Fourier Domain Mode Locked lasers for optical coherence tomography: Imaging at 1310 nm vs. 1550 nm wavelength. J. Biophoton. 2009, 2, 357–363. [Google Scholar]
- Wang, L.V.; Wu, H.I. Biomedical Optics; John Wiley & Sons: Hoboken, NJ, USA, 2007. [Google Scholar]


| Methods | Advantages | Disadvantages |
|---|---|---|
| Radiography [29] |
|
|
| Dental-CT [29] |
|
|
| Intraoral Digital camera |
|
|
| Periodontal probe [29] |
|
|
| OCT |
|
|
| Raman spectroscopy [41–43] |
|
|
| Laser fluorescence spectrometer [39,44] |
|
|
© 2013 by the authors; licensee MDPI, Basel, Switzerland. This article is an open access article distributed under the terms and conditions of the Creative Commons Attribution license (http://creativecommons.org/licenses/by/3.0/).
Share and Cite
Hsieh, Y.-S.; Ho, Y.-C.; Lee, S.-Y.; Chuang, C.-C.; Tsai, J.-c.; Lin, K.-F.; Sun, C.-W. Dental Optical Coherence Tomography. Sensors 2013, 13, 8928-8949. https://doi.org/10.3390/s130708928
Hsieh Y-S, Ho Y-C, Lee S-Y, Chuang C-C, Tsai J-c, Lin K-F, Sun C-W. Dental Optical Coherence Tomography. Sensors. 2013; 13(7):8928-8949. https://doi.org/10.3390/s130708928
Chicago/Turabian StyleHsieh, Yao-Sheng, Yi-Ching Ho, Shyh-Yuan Lee, Ching-Cheng Chuang, Jui-che Tsai, Kun-Feng Lin, and Chia-Wei Sun. 2013. "Dental Optical Coherence Tomography" Sensors 13, no. 7: 8928-8949. https://doi.org/10.3390/s130708928