Article

Preliminary Analysis of Chinese GF-3 SAR Quad-Polarization Measurements to Extract Winds in Each Polarization

1
State Key Laboratory of Satellite Ocean Environment Dynamics, Second Institute of Oceanography, State Oceanic Administration, Hangzhou 310012, China
2
Laboratoire d’Océanographie Physique et Spatiale, Institut Français de Recherche pour l’Exploitation de la 9 Mer, 29280 Brest, France
3
National Ocean Technology Center, State Oceanic Administration, Tianjin 300112, China
*
Author to whom correspondence should be addressed.
Remote Sens. 2017, 9(12), 1215; https://doi.org/10.3390/rs9121215
Submission received: 30 October 2017 / Revised: 18 November 2017 / Accepted: 22 November 2017 / Published: 25 November 2017
(This article belongs to the Section Ocean Remote Sensing)

Abstract

:
This study analyzed the noise equivalent sigma zero (NESZ) and ocean wind sensitivity for Chinese C-band Gaofen-3 (GF-3) quad-polarization synthetic aperture radar (SAR) measurements to facilitate further operational wind extraction from GF-3 data. Data from the GF-3 quad-polarization SAR and collocated winds from both NOAA/NCEP Global Forecast System (GFS) atmospheric model and National Data Buoy Center (NDBC) buoys were used in the analysis. For NESZ, the co-polarization was slightly higher compared to the cross-polarization. Regarding co-polarization and cross-polarization, NESZ was close to RadarSAT-2 and Sentinel-1 A. Wind sensitivity was analyzed by evaluating the dependence on winds in terms of normalized radar cross-sections (NRCS) and polarization combinations. The closest geophysical model function (GMF) and the polarization ratio (PR) model to GF-3 data were determined by comparing data and the model results. The dependence of co-polarized NRCS on wind speed and azimuth angle was consistent with the proposed GMF models. The combination of CMOD5 and CMOD5.N was considered to be the closest GMF in co-polarization. The cross-polarized NRCS exhibited a strong linear relationship with moderate wind speeds higher than 4 m·s−1, but a weak correlation with the azimuth angle. The proposed model was considered as the closest GMF in cross-polarization. For polarization combinations, PR and polarization difference (PD) were considered. PR increased only with the incidence angle, whereas PD increased with wind speed and varied with azimuth angle. There were three very close PR models and each can be considered as the closest. Preliminary results indicate that GF-3 quad-polarization data are valid and have the ability to extract winds in each polarization.

Graphical Abstract

1. Introduction

Spaceborne C-band synthetic aperture radar (SAR) can measure high-resolution sea surface normalized radar cross-sections (NRCS). The SAR-derived NRCS originate from Bragg scattering, which arose from the resonant interaction between radar transmitting magnetic waves and centimeter-scale short waves [1]. Through this interaction, the NRCS can be related to radar geometry and sea surface characteristics (wind and waves). This relationship is usually described by an empirical geophysical model function (GMF), facilitating the observations of ocean winds and other oceanic parameters. With the development of polarimetric SAR technology, an increasing number of polarization configurations have been attempted on SAR. This polarization diversity will inevitably deliver new features to the SAR data or the GMF.
Vertical (VV) polarization was first applied on C-band SAR satellites, such as ERS-1/2. For this polarization, the most frequently used GMF is the CMOD suite, such as CMOD4 [2], CMOD_IFR2 [3], CMOD5 [4], and CMOD5.N [5]. They relate the NRCS to the incidence angle, wind speed, and azimuth angle with respect to wind direction. Although these CMOD suites were developed using the C-band scatterometer data, they apply very well to SAR data for retrieving wind speed and direction.
After VV polarization, horizontal (HH) polarization was extended to SAR, including RadarSAT-1 and ENVISAT ASAR. As expected, the HH data were different from the VV data; the HH NRCS was significantly lower than the VV NRCS. In general, their correlation is described using a polarization ratio (PR) model. Currently, most proposed PR models are incidence angle-dependent only [6,7,8,9], while the other models are also a function of wind speed or azimuth angle [10,11]. Using a PR model, the HH data can be transformed to match the VV data. Thus, a hybrid model function of CMOD and a PR model is frequently used as the HH GMF. With the accumulation of SAR data, a co-polarization (VV or HH) GMF, named C-SARMOD [12], has been proposed using complete SAR data, including Envisat, RADARSAT-2 (RS-2), and Sentinel-1 (S-1A), and the collocated ASCAT and ECMWF winds. C-SARMOD can directly describe the HH data without the help of PR models.
In the last ten years, cross-polarization (VH or HV) technology was attempted on C-band SAR, such as RS-2 and S-1A. As one of the encouraging achievements of these cross-polarization attempts, the RS-2 SAR cross-polarization NRCS first exhibited a strong linear sensitivity to extreme wind speeds [13,14], when the NRCS saturation was observed in co-polarization. This unique sensitivity for cross-polarization data is mainly attributed to the contribution of breaking waves [15,16]. Some cross-polarization GMFs have been developed based on this sensitivity [13,14,15,16,17,18,19,20]. These models are simple and considered more suitable for high wind conditions.
The first Chinese C-band multi-polarization civil SAR, named Gaofen-3 (GF-3), was launched on 10 August 2016. The characteristics of a large coverage, fine scale, and quad-polarization are gathered on GF-3 by 12 imaging modes [21]. Some preliminary assessments have been carried out on the retrieval of ocean winds [22,23] and waves [23,24]. However, no holistic analysis for GF-3 quad-polarization SAR measurements has yet been performed. To prepare for operational wind extraction using GF-3 data, we further analyze the noise equivalent sigma zero (NESZ) and wind sensitivity using additional quad-polarization data to determine the closest model. This analysis will help to identify the distinction between GF-3 data and the reported GMFs and to further promote model selections and developments suitable for GF-3 data.

2. Materials and Methods
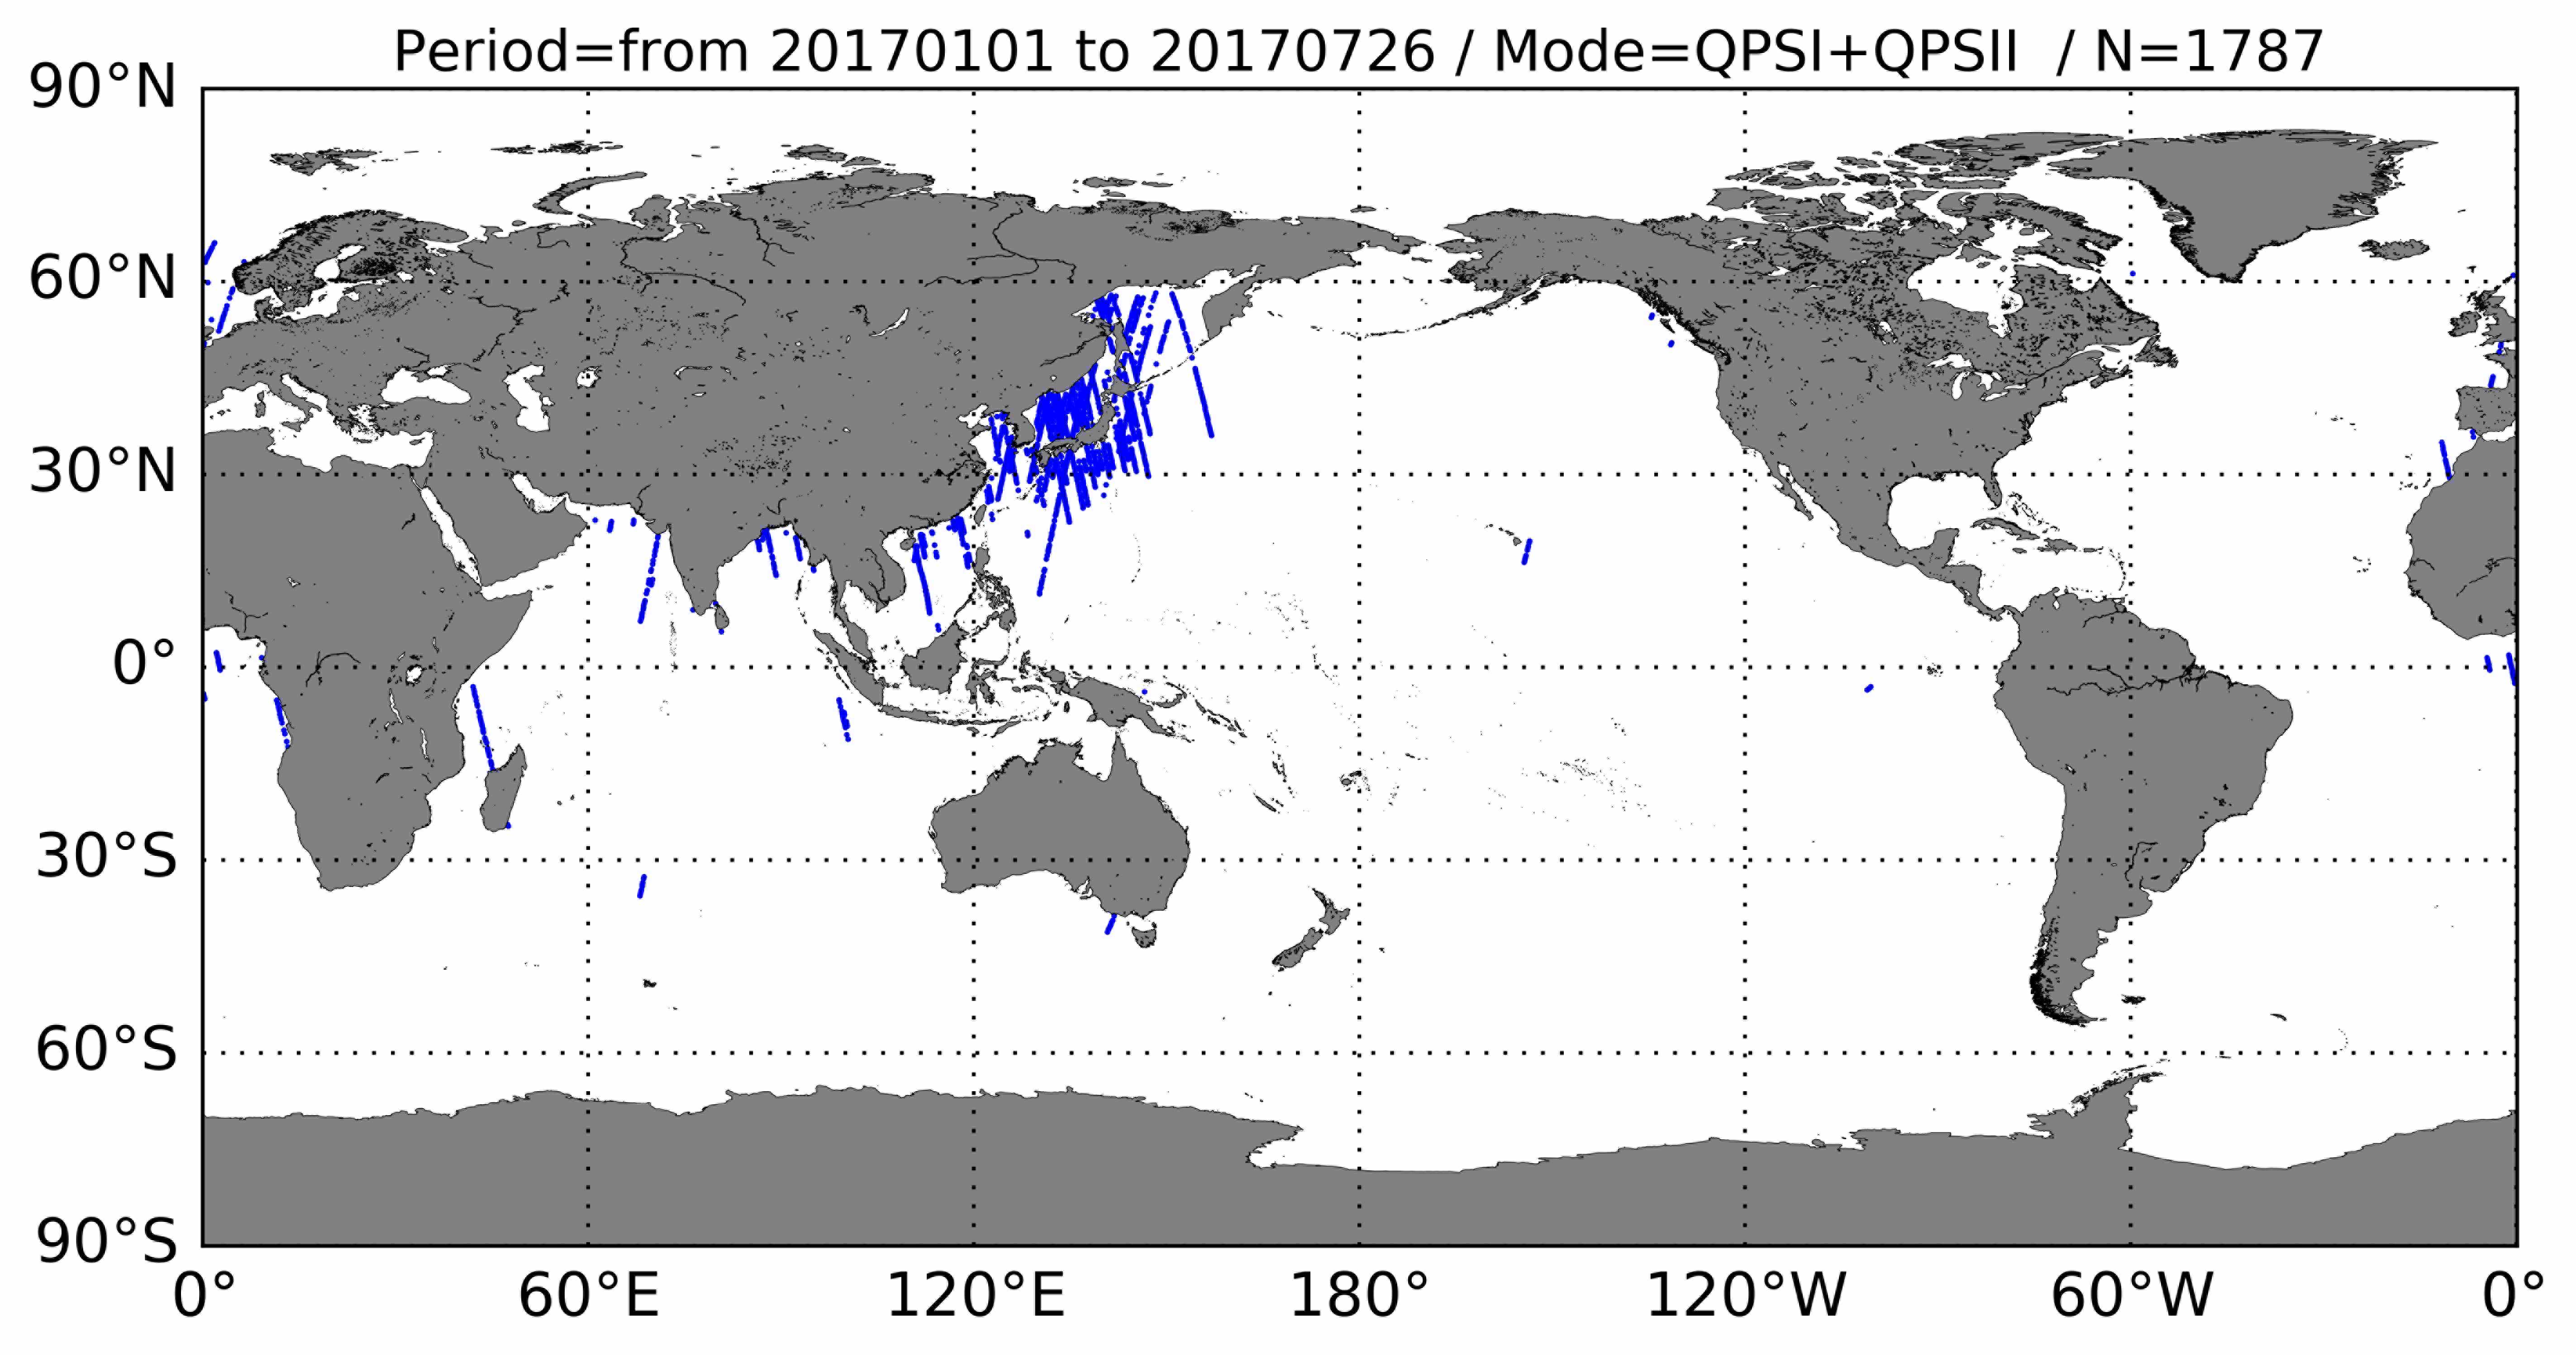
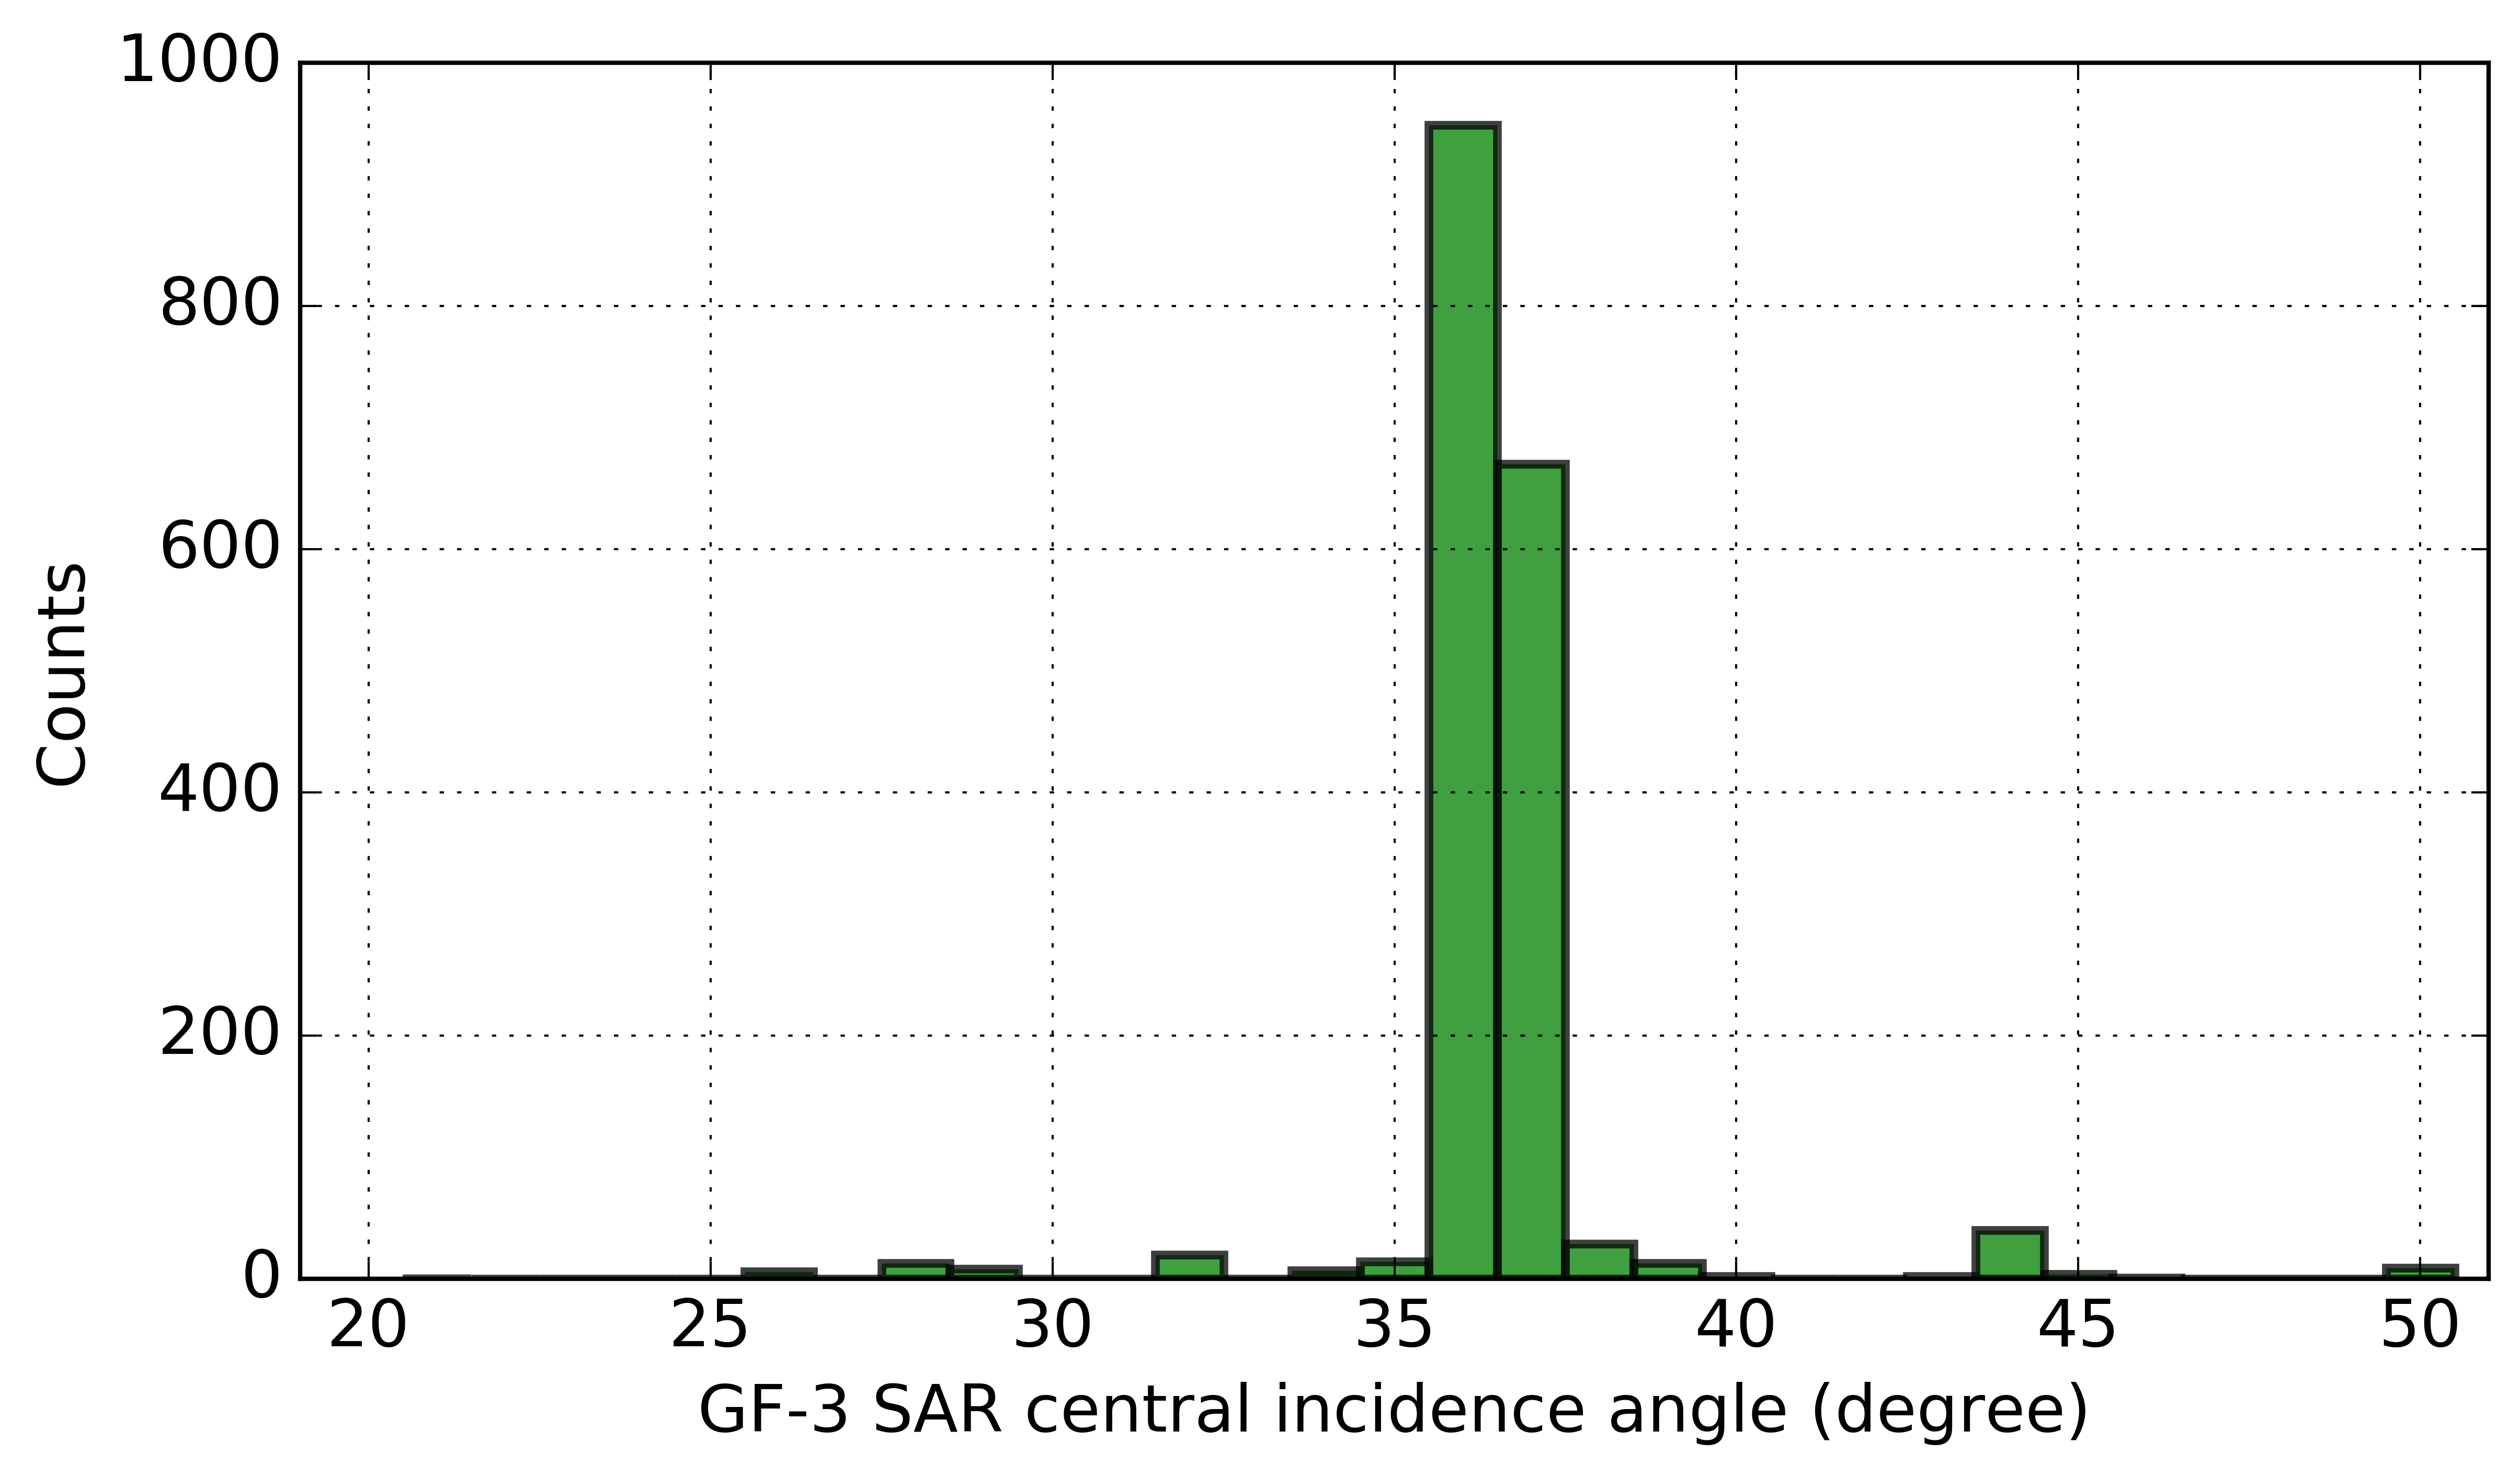
2.1. Materials

In this study, 1787 GF-3 SAR products acquired in Quad-Polarization Strip I (QPSI) and Quad-Polarization Strip II (QPSII) mode, processed up to level-1A SLC, between 1 January 2017 and 26 July 2017 were collected. Both modes can provide quad-polarization data. Details of the two modes are listed in Table 1. The locations of the collected GF-3 SAR data are shown in Figure 1 and it is clear that most of the data are from the coastal areas of East Asia. Figure 2 shows the central incidence angle distribution of the SAR data shown in Figure 1. Most incidence angles of the GF-3 data concentrate in a narrow range, between 35.5° and 37.5°, although the entire incidence angle range is between 20° and 50°. Considering the nonuniformity of the distribution of the incidence angle, data within this range are the focus of our analysis.
The globally-gridded ocean surface 10 m wind speeds and directions are provided by the NOAA/NCEP Global Forecast System (GFS) atmospheric model. GFS winds are given at 0.5° every 3 h. The GF-3 calibrated NRCS, incidence angles, and track angles are derived at a cell resolution of 10 km. The NRCS are, thus, collocated with GFS wind speed and direction by spatial and temporal interpolation.
The collocated in situ buoy wind speeds and directions are collected from the National Data Buoy Center (NDBC) of NOAA. The distances between GF-3 cell center and the collocated buoy location are less than 5 km. The time interval between them is 30 min. These criteria yield 10 collocations. The buoy wind speeds are converted into 10-m winds [25,26] prior to use for analysis. The details of the collocation of GF-3 quad-polarization data and NDBC buoy observations are listed in Table 2.
Figure 3 shows an example of GF-3 QPSI mode quad-polarization SAR data acquired on 3 July 2017 at 01:51:53 UTC. The recorded spatial resolution is 5.55 m (azimuth direction) × 2.25 m (range direction). It has a central incidence angle of 36.2° and an incidence angle range of 1.8° corresponding to a swath of 30 km. The NESZ and wind sensitivity are analyzed using similar quad-polarization data presented in Section 3.

2.2. Methods

The NESZ is an important parameter of instrument noise. The existence of noise makes the SAR NRCS higher than the true one. This is especially true for weak SAR signals, such as those with low winds, large incidence angles, and cross-polarization, which makes them more vulnerable to the noise effect. SAR with low NESZ can observe the NRCS better. Prior to the launch, SAR NESZ was estimated in the laboratory. To track the changes in NESZ after the launch, an empirical estimation of NESZ was used [12]. This estimation uses massive ocean surface NRCS at a resolution of 1 km as a function of the incidence angle. Then, the envelope of the lowest NRCS values is considered to be the NESZ. Here, we use the same method to estimate and analyze GF-3 data NESZ in each polarization with a 10-km resolution instead of a 1 km resolution.
The analysis on wind sensitivity is expected to answer two questions on the GF-3 data: (1) Are the trends in the data reasonable? If they are, the GF-3 data are valid; if not, the dataset is unqualified. (2) Which model is the closest one to the GF-3 data? The determined model can be used to predict or retrieve GF-3 data.
To answer the first question, data trends are first explored in terms of normalized radar cross-sections (NRCS) and polarization combinations. We analyze the dependence of NRCS on wind speed and azimuth direction for each polarization and the dependence of the polarization combination on the additional incidence angle. These dependencies are then compared with some proposed models. The azimuth angle φazimuth is defined as φazimuth = φwindφSAR, where φwind is the GFS wind direction and φSAR is the GF-3 across-track direction. Both φwind and φSAR are the angles measured from the true north. φazimuth = 0° and φazimuth = 180° represent upwind (the wind is blowing toward the radar antenna beam) and downwind directions, respectively, while φazimuth = 90° and φazimuth = 270° represent crosswinds. To better determine the trends, wind speed dependence is fitted using a second-order polynomial regression formula, while the azimuth angle dependence is fitted using a second-order Fourier series as follows:
σ 0 pp = A 0 pp + A 1 pp cos ( ϕ azimuth ) + A 2 pp cos ( 2 ϕ azimuth )
where pp stands for polarization, σ 0 pp is the NRCS, A 0 pp is the constant coefficient, A 1 pp is the first-order coefficient, and A 2 pp is the second-order coefficient. The A 1 pp and A 2 pp coefficients represent the asymmetries for upwind-downwind and upwind-crosswind, respectively.
The wind sensitivity of the GF-3 polarization combination is studied in terms of polarization ratio (PR) and polarization difference (PD). The PR analysis is useful for determining an appropriate GF-3 HH GMF with the help of CMOD GMF, while the PD analysis aims to exploit new wind-related parameters. Usually, PR is defined as:
PR = σ 0 VV σ 0 HH
and PD is defined as:
PD = σ 0 VV σ 0 HH
where σ 0 VV and σ 0 HH are the NRCS in linear units for VV and HH polarization, respectively.
Using the analysis on the GF-3 data trends, a cross-polarization GMF model and a PR model were developed by fitting the collocations.
To answer the second question, we compare the GF-3 data with both GMF and PR models to find the closest model. In particular, two models proposed in this study are also used in the comparisons. For the GMF model, the collocated GFS winds are used as inputs. Then, the root mean square error (RMSE) is estimated for different GMFs. The GMF with the lowest RMSE is considered the closest model to the GF-3 data. Furthermore, the determined GMF is validated using in situ NDBC buoy winds instead of GFS winds. The PR model uses the same comparison as GMF, but does not include the application of buoy data.

3. Results

3.1. Noise Equivalent Sigma Zero

Figure 4 presents the GF-3 NRCS as a function of the incidence angle for four different polarizations. At the envelope bottom, the NESZ of VV, HH, VH, and HV polarization data are approximately −33 dB, −33 dB, −37 dB, and −37 dB, respectively. The NESZ values are estimated near the 36° incidence angle. Two co-polarization and two cross-polarization data points have the same NESZ. The copolarization NESZ is slightly higher than the cross-polarization NESZ with an increment of 4 dB. Previous studies showed that the co-polarization NESZ for RS-2 was approximately −34 dB at a 36° incidence angle [13]. The cross-polarization NESZ for both RS-2 and S1-A SAR were approximately −35 dB [12,13]. This provides a preliminary indication that GF-3 data have an NESZ level comparable with S-1A and RS-2 in each polarization within this incidence angle range.

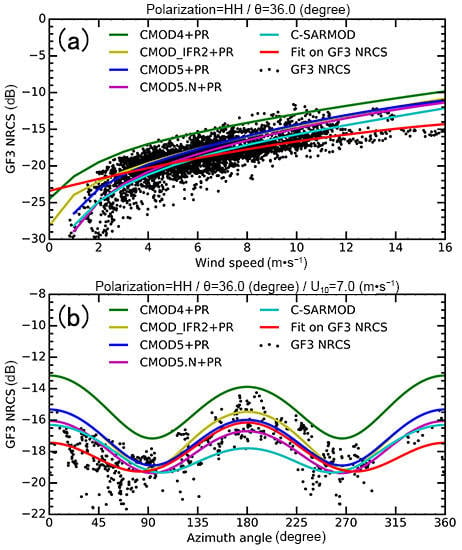
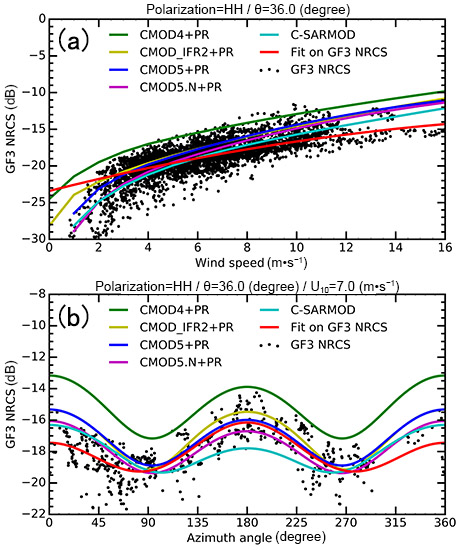
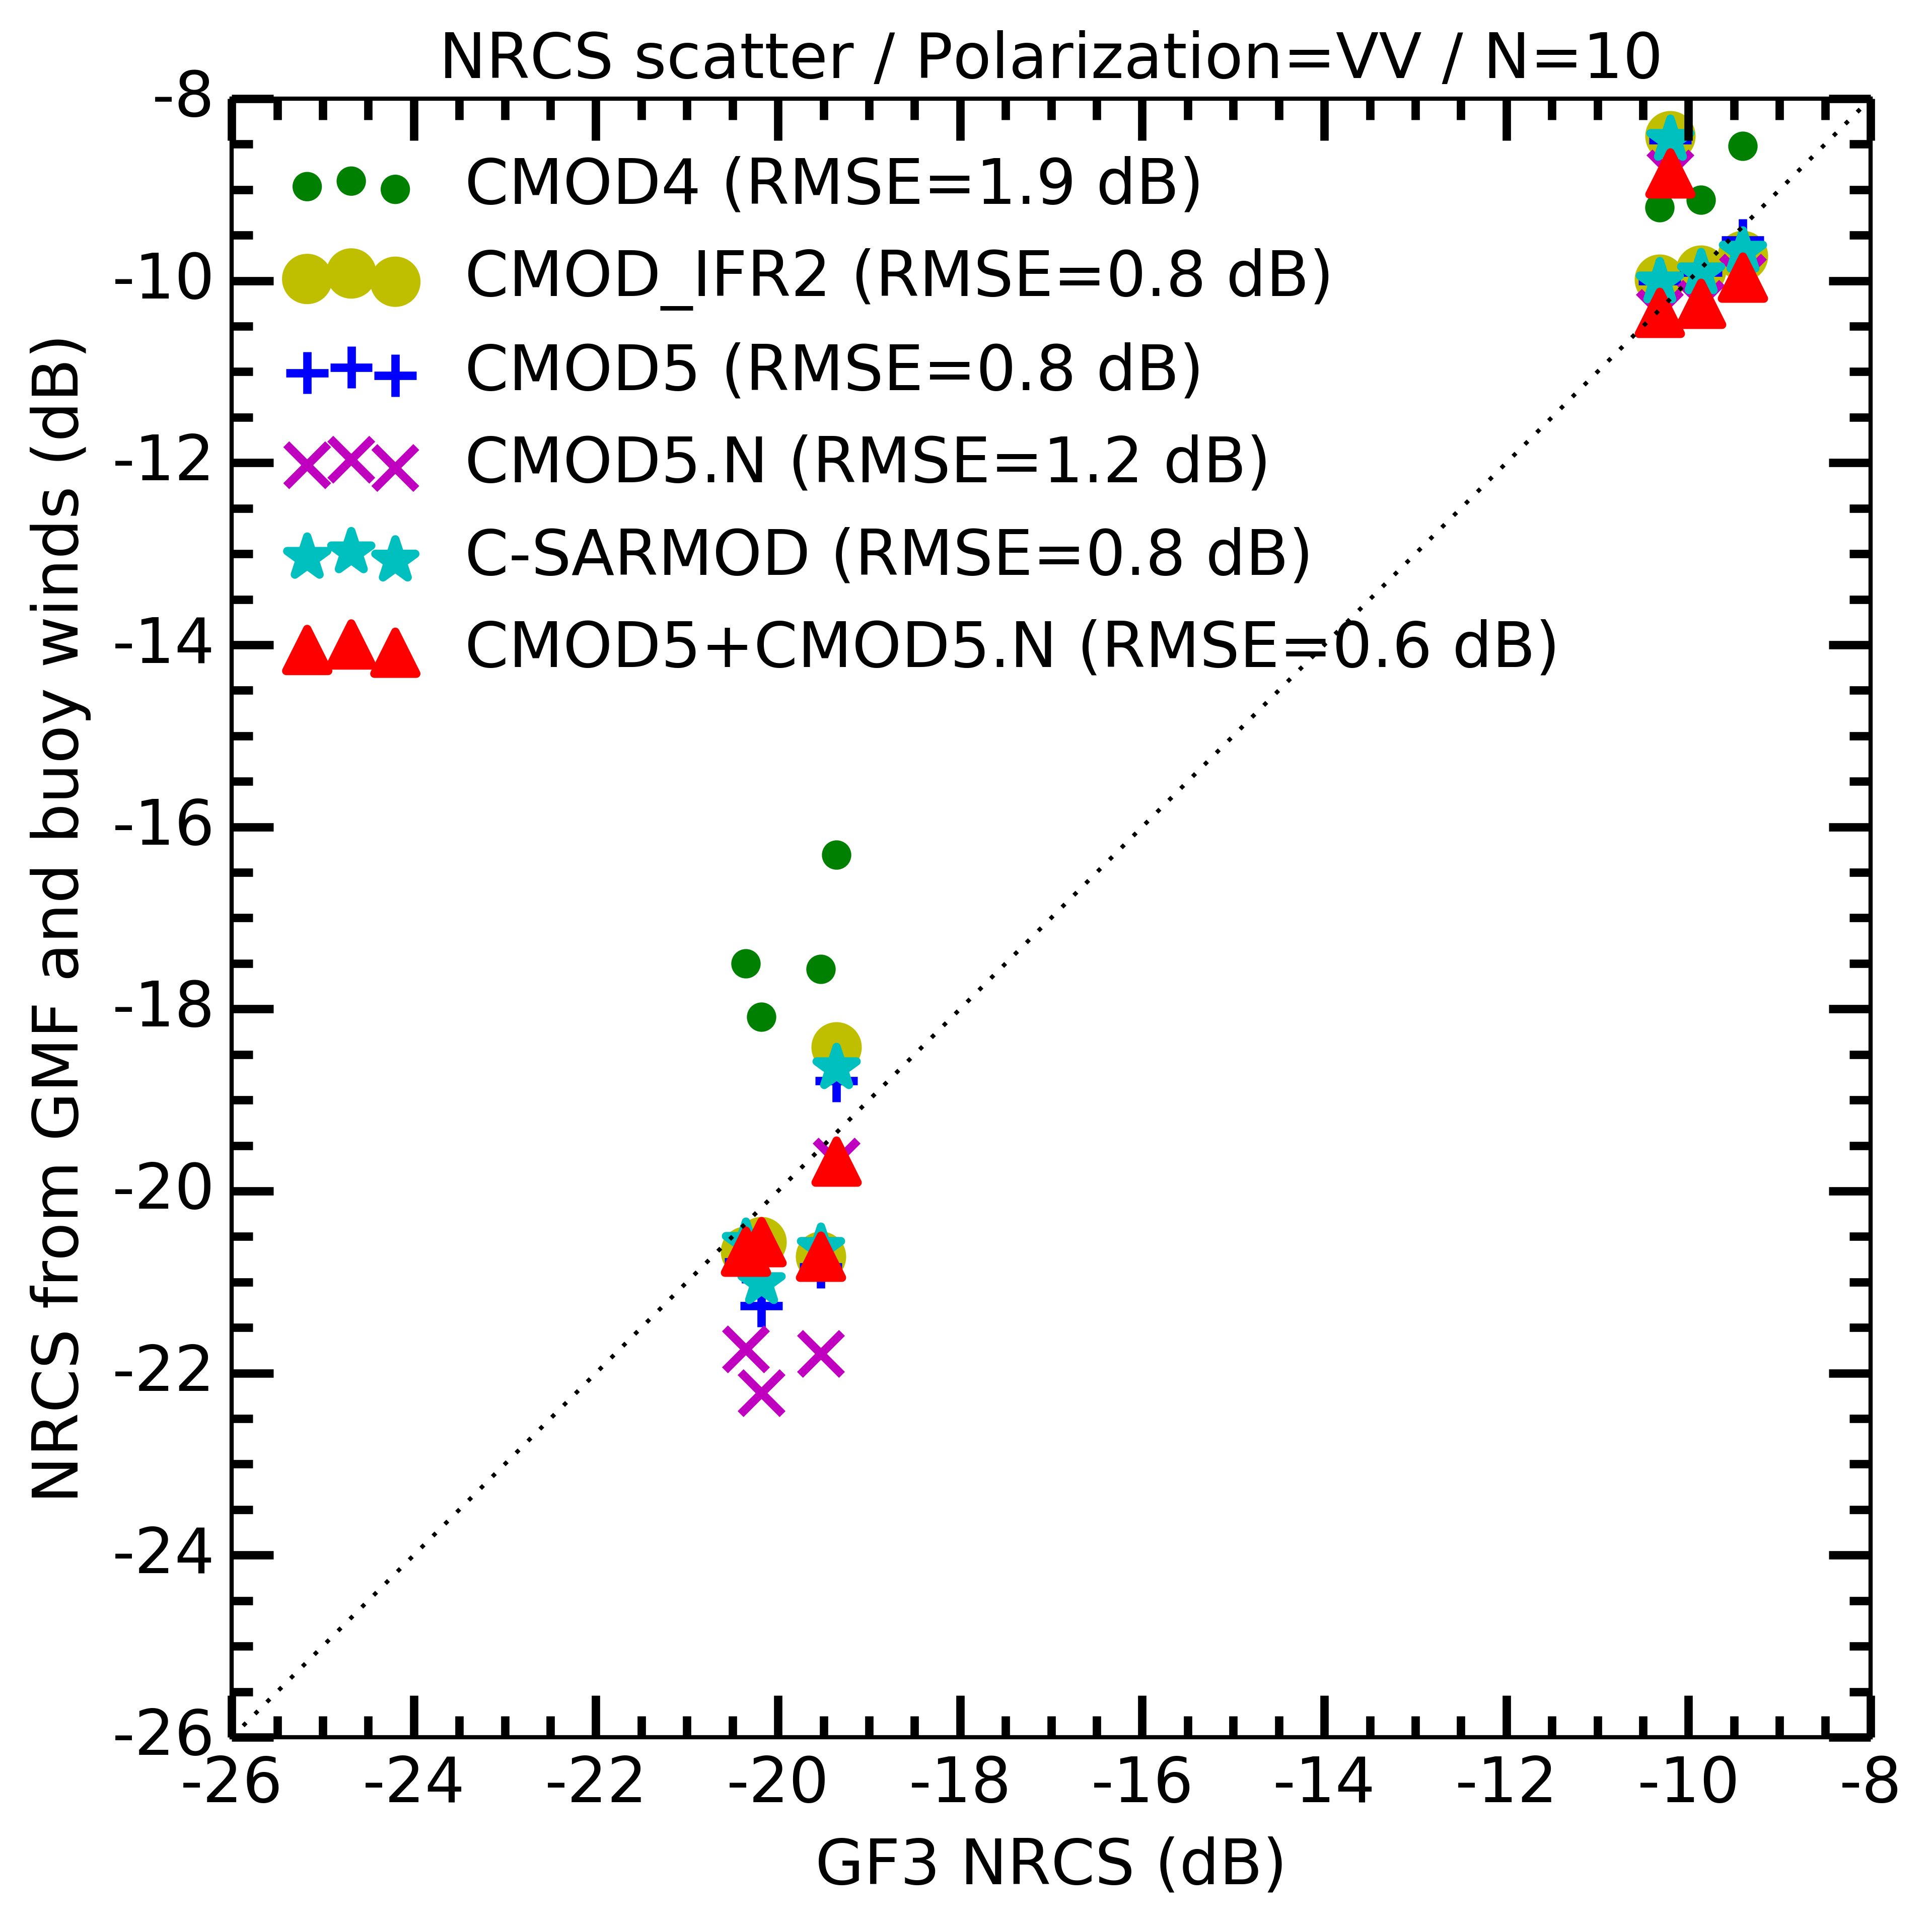
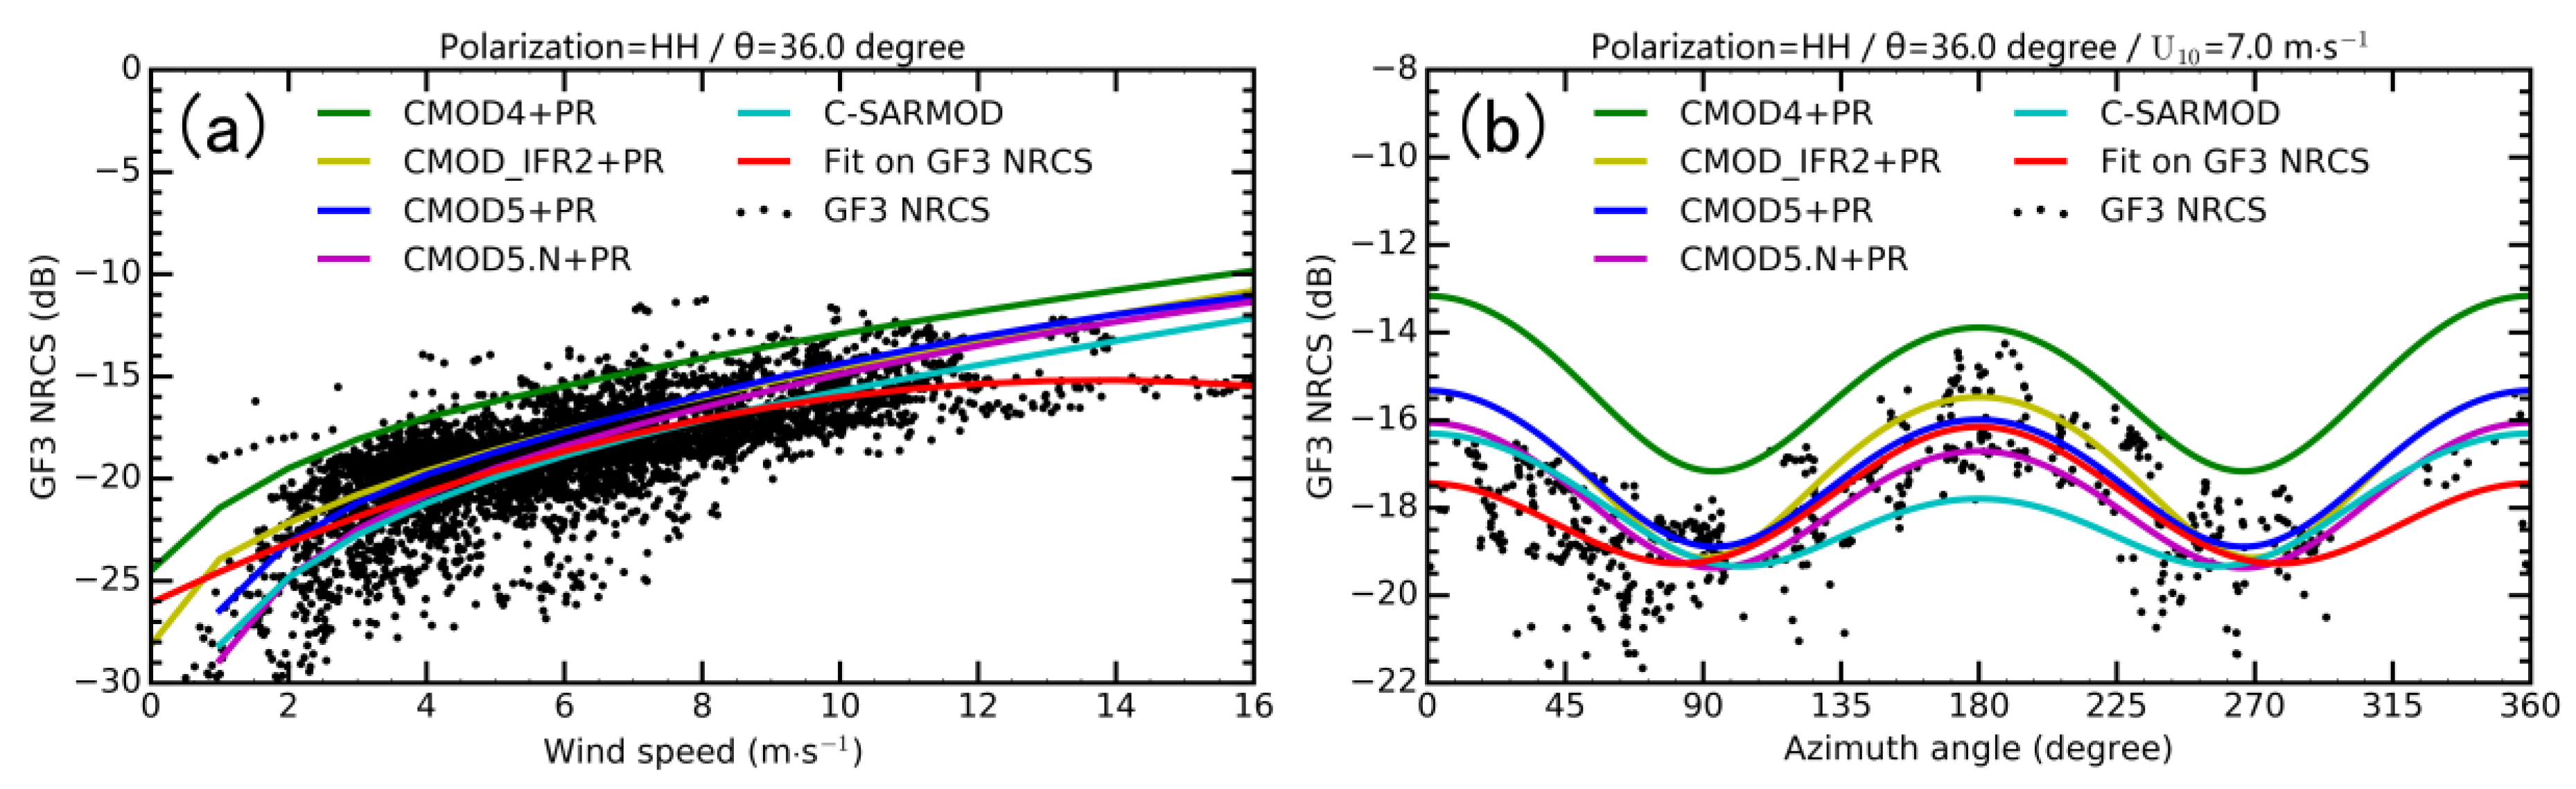
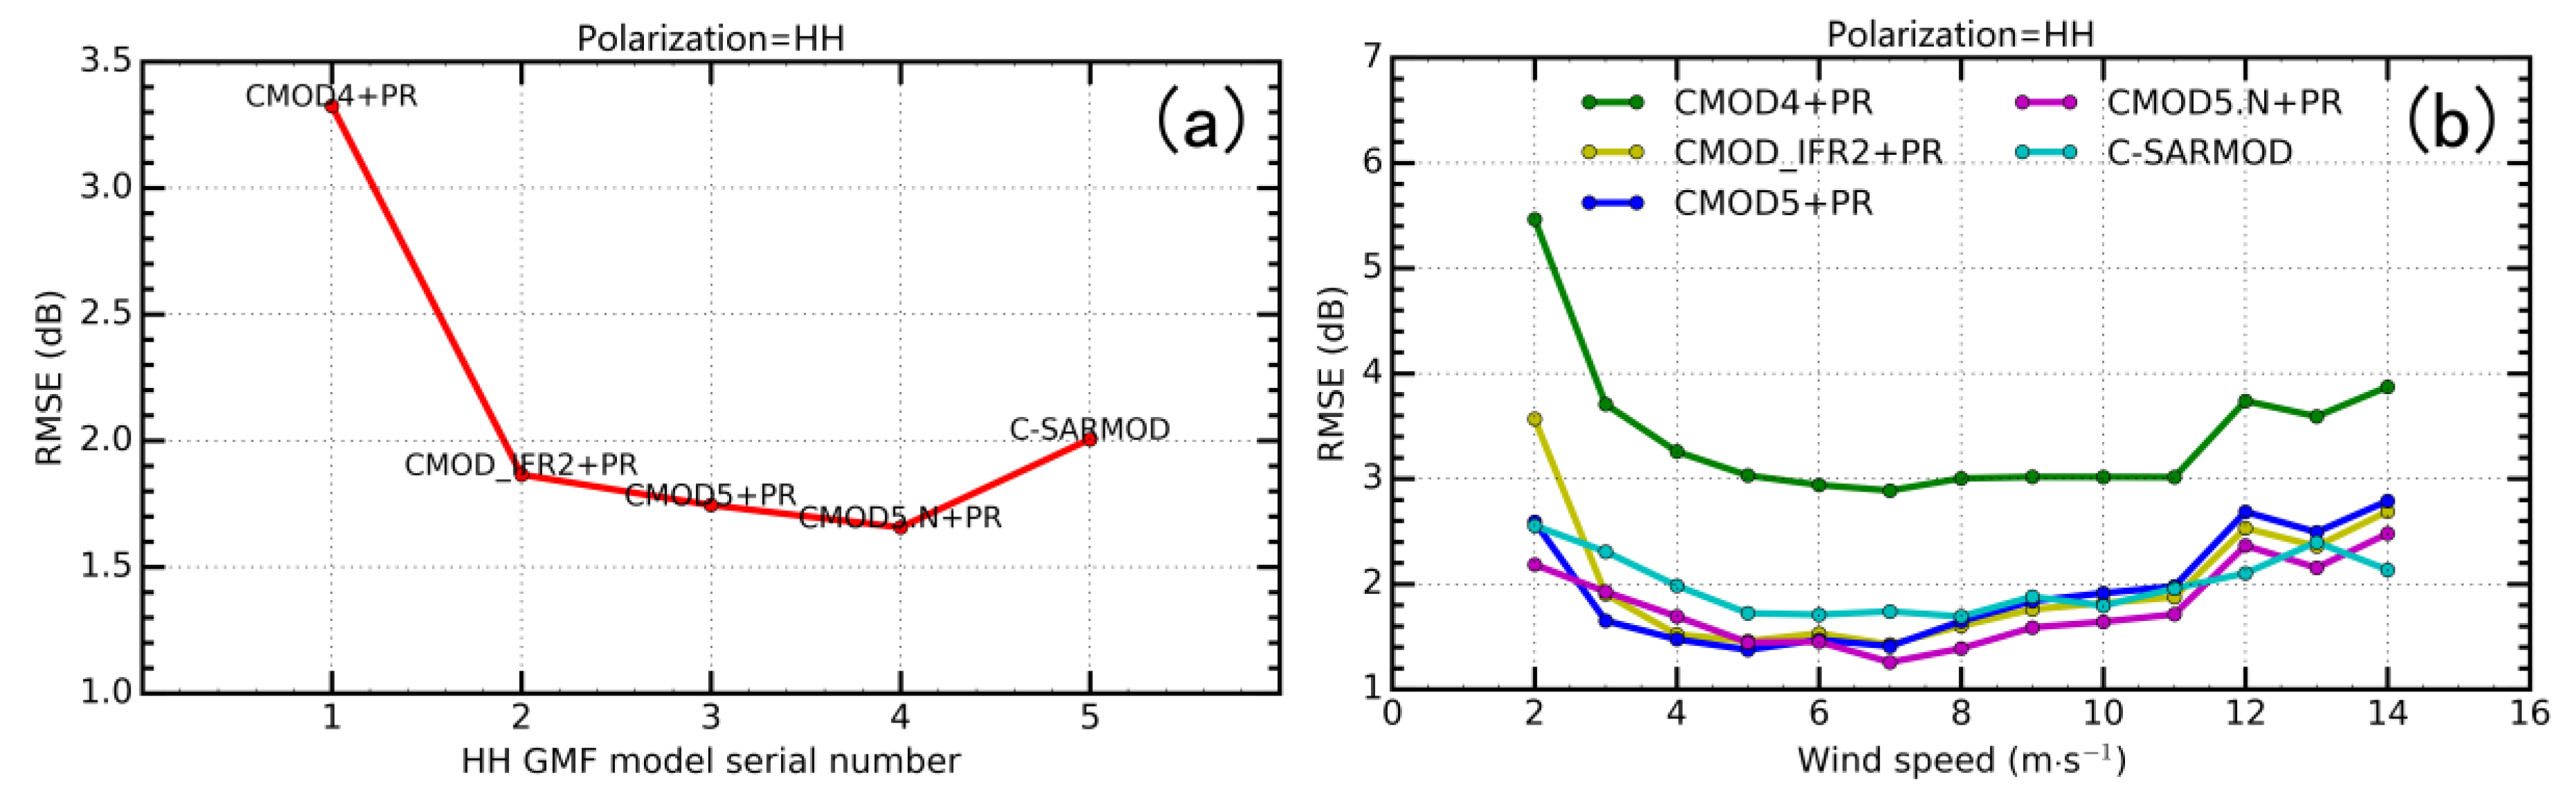
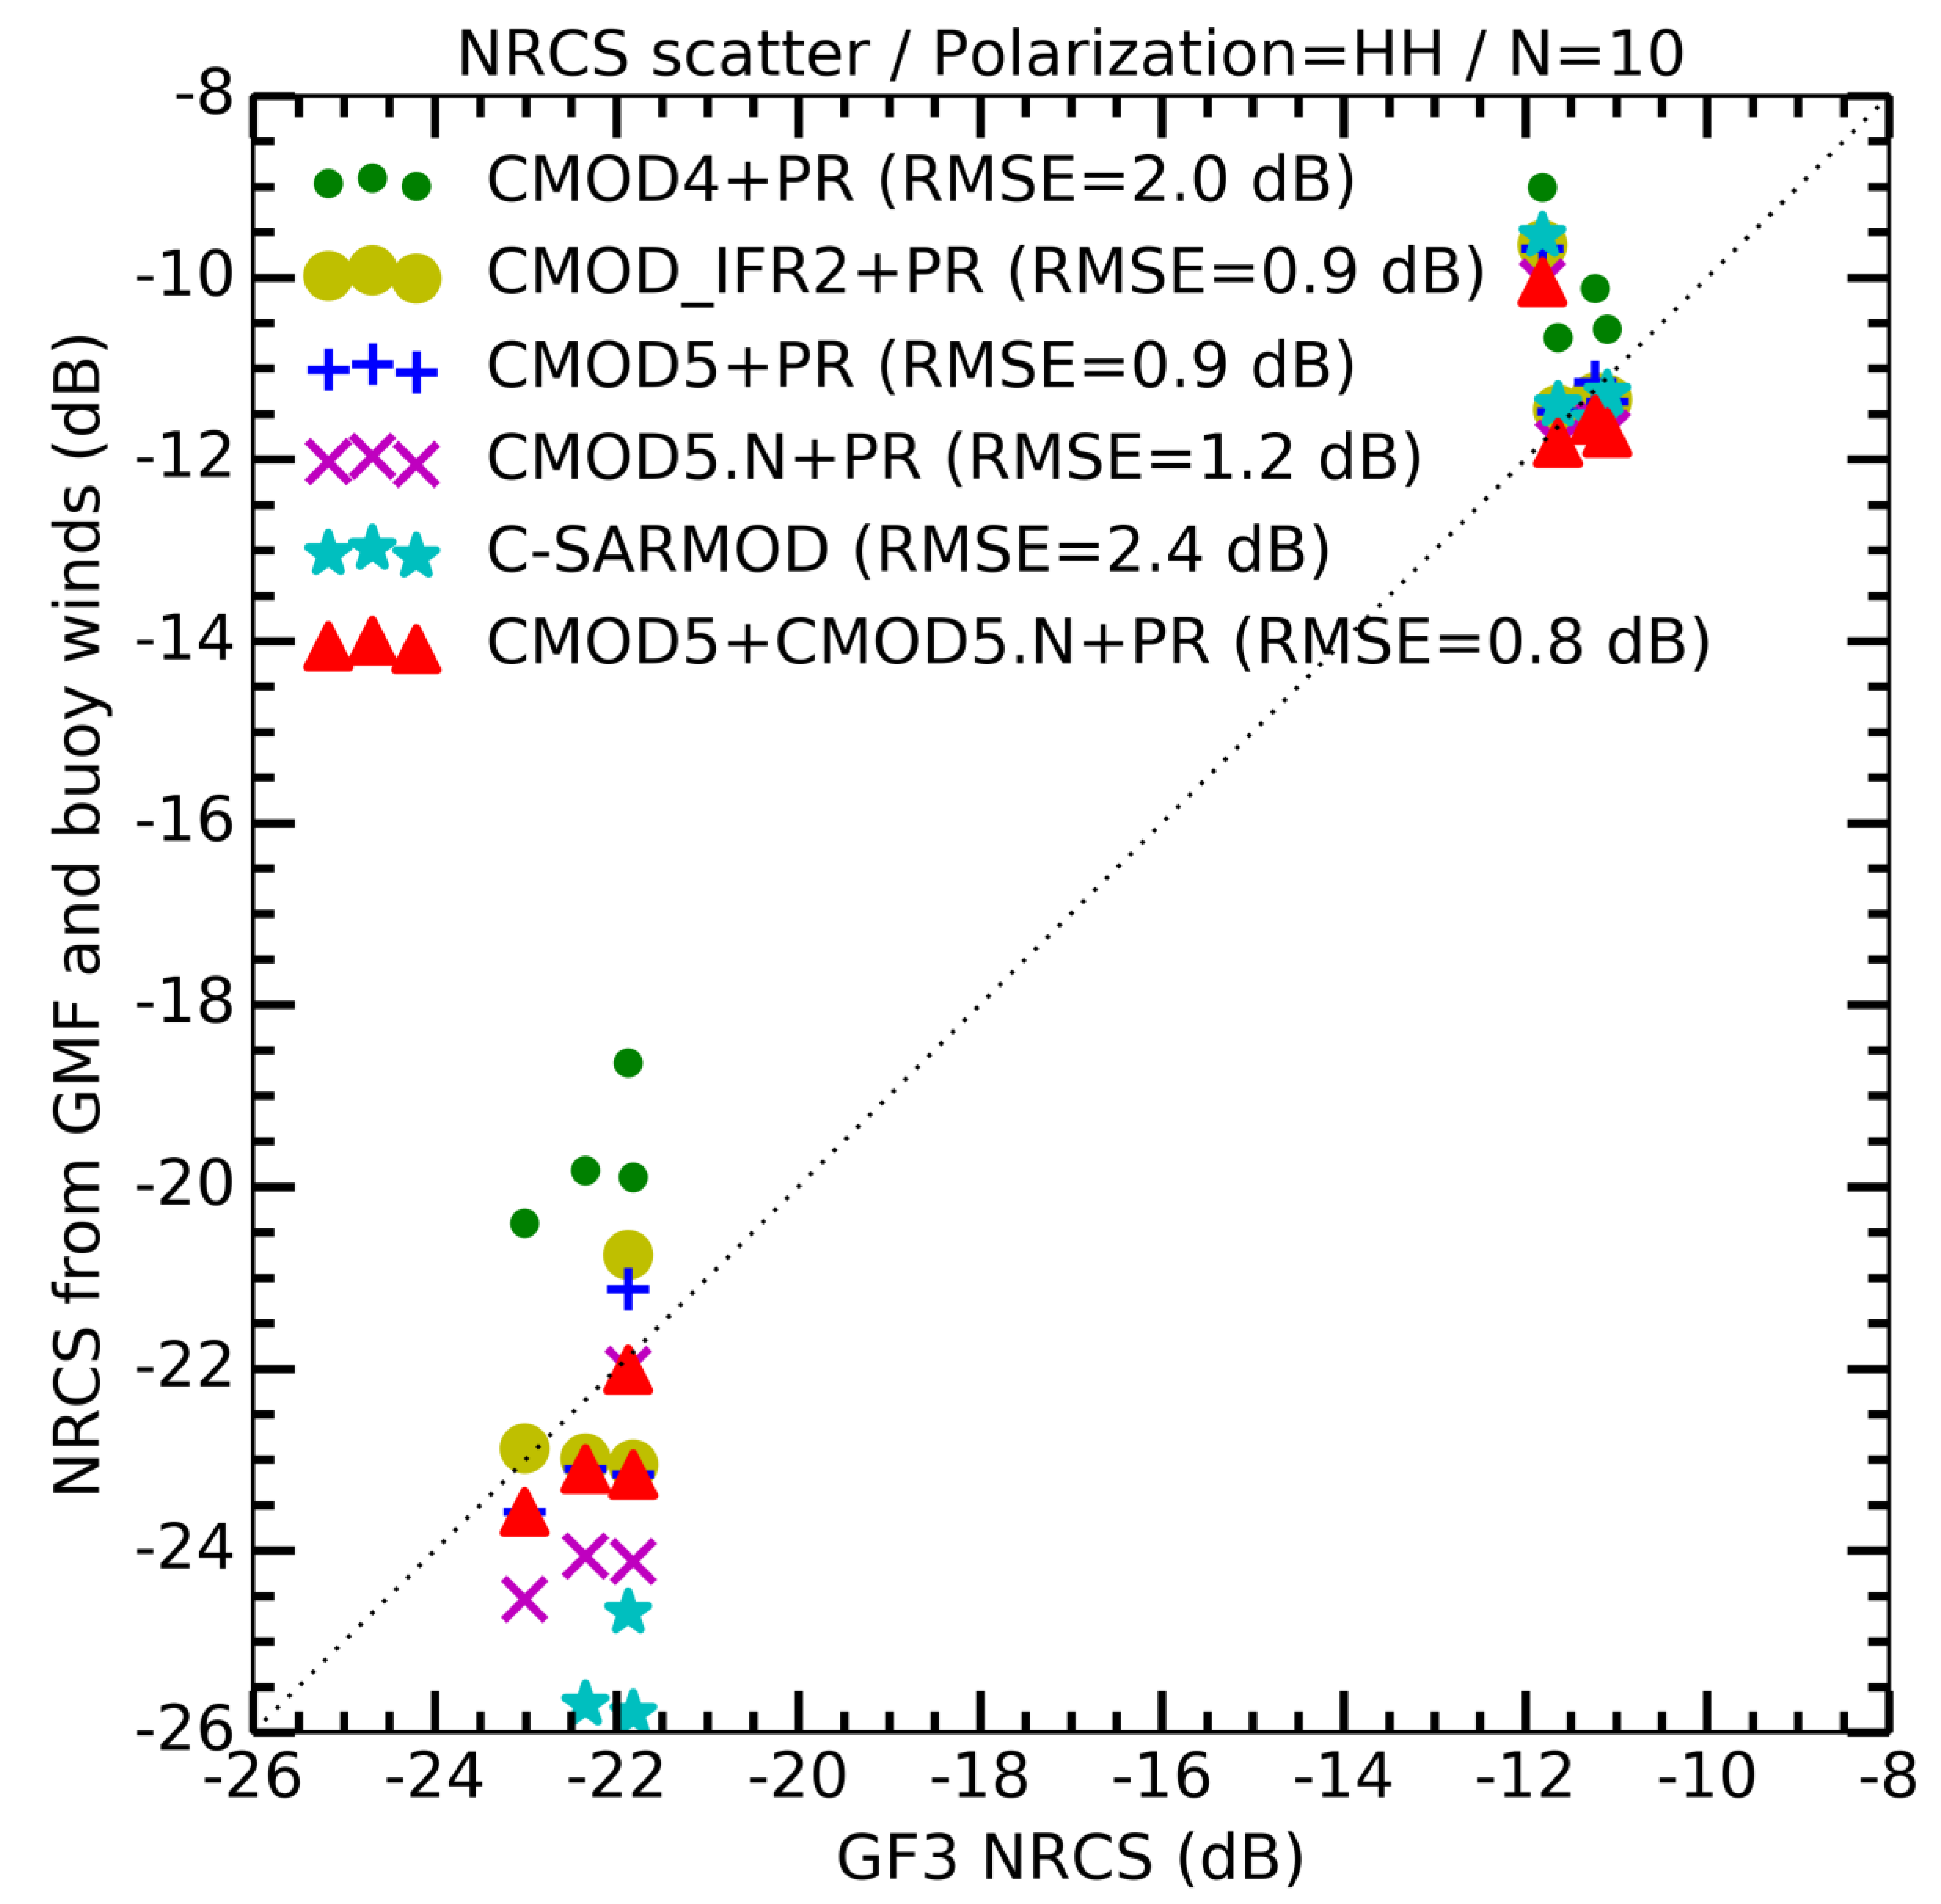
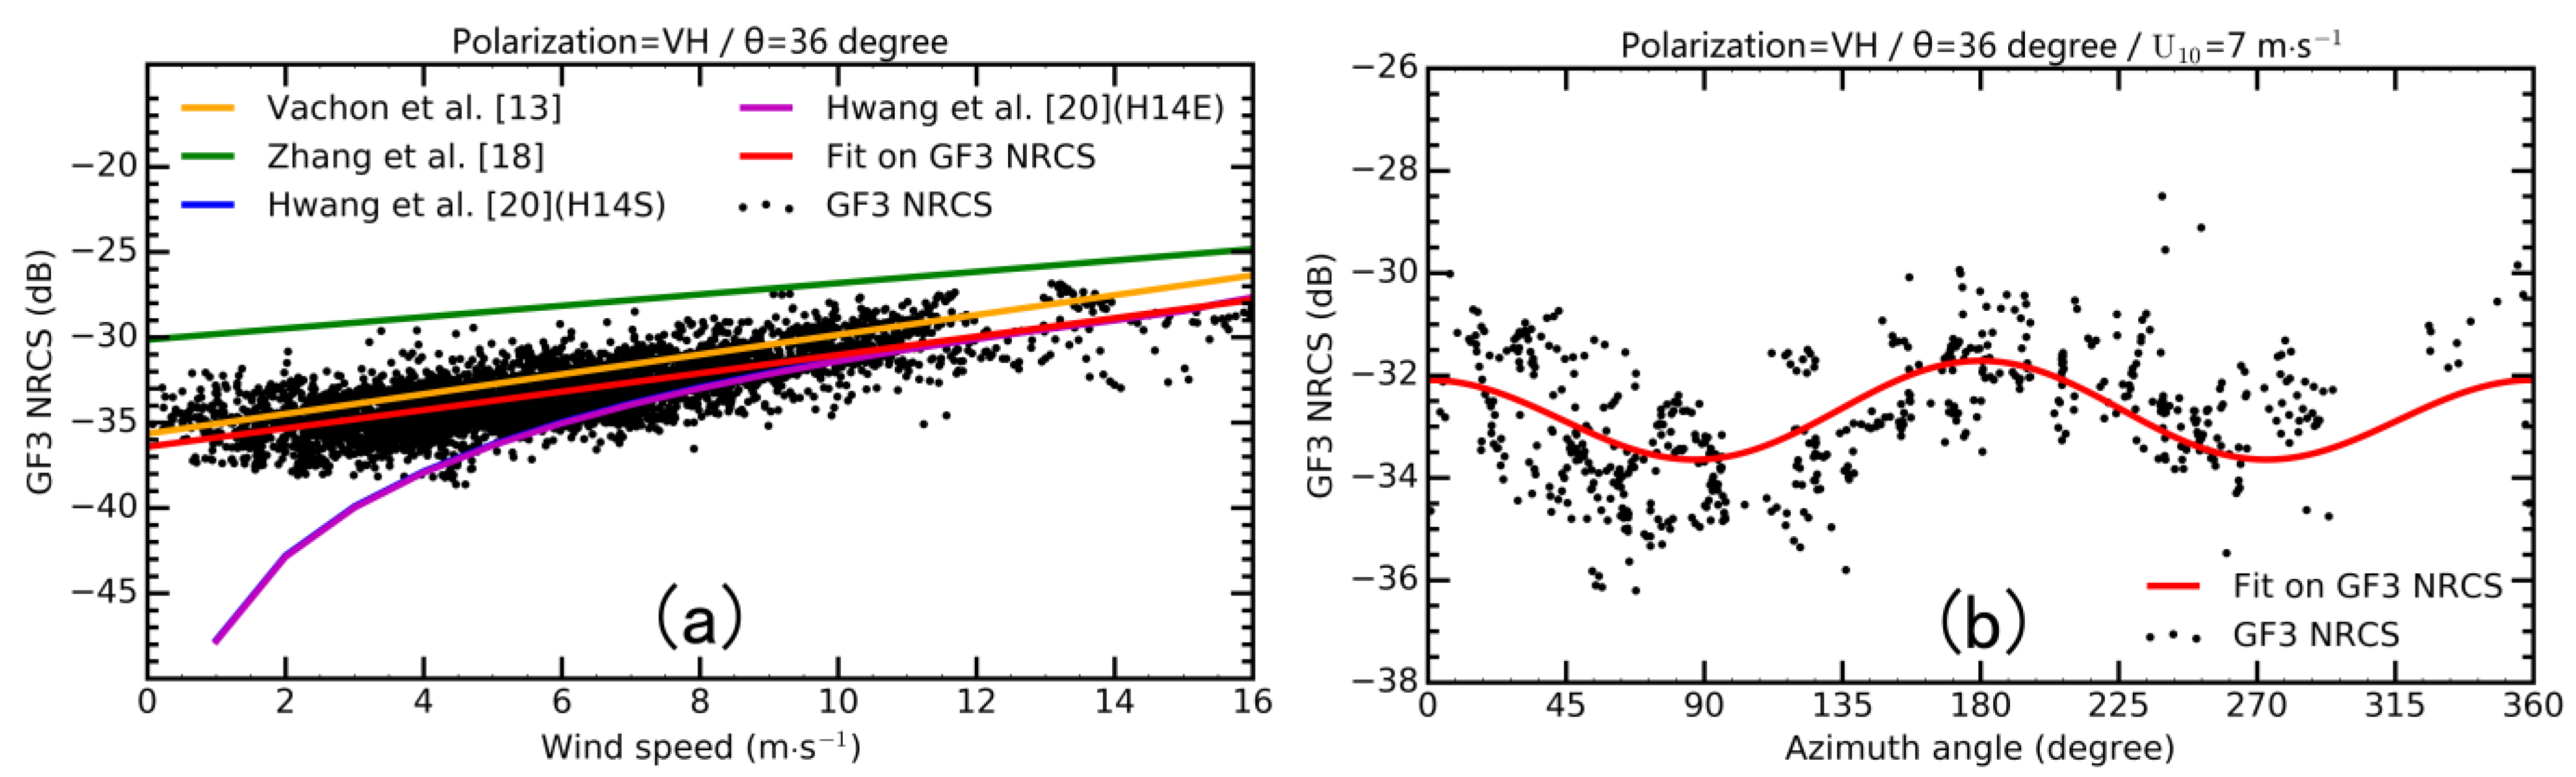
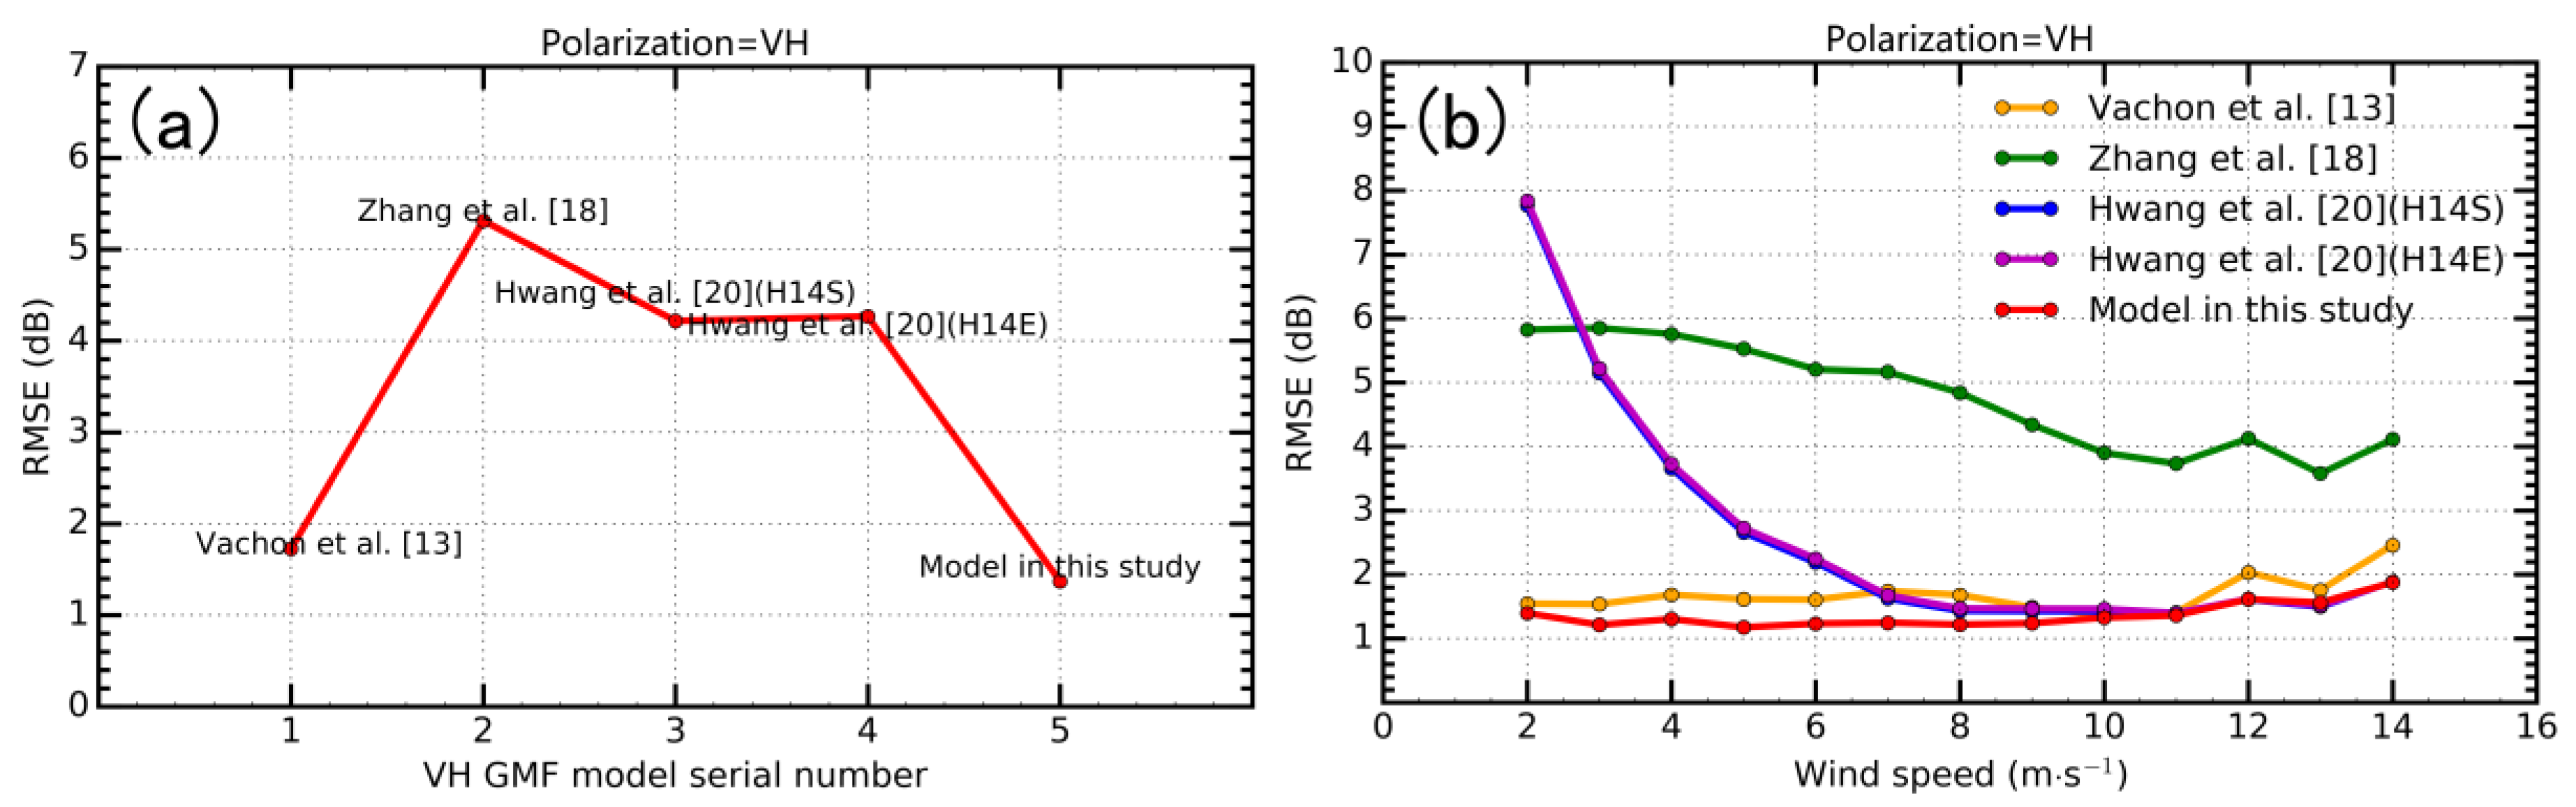
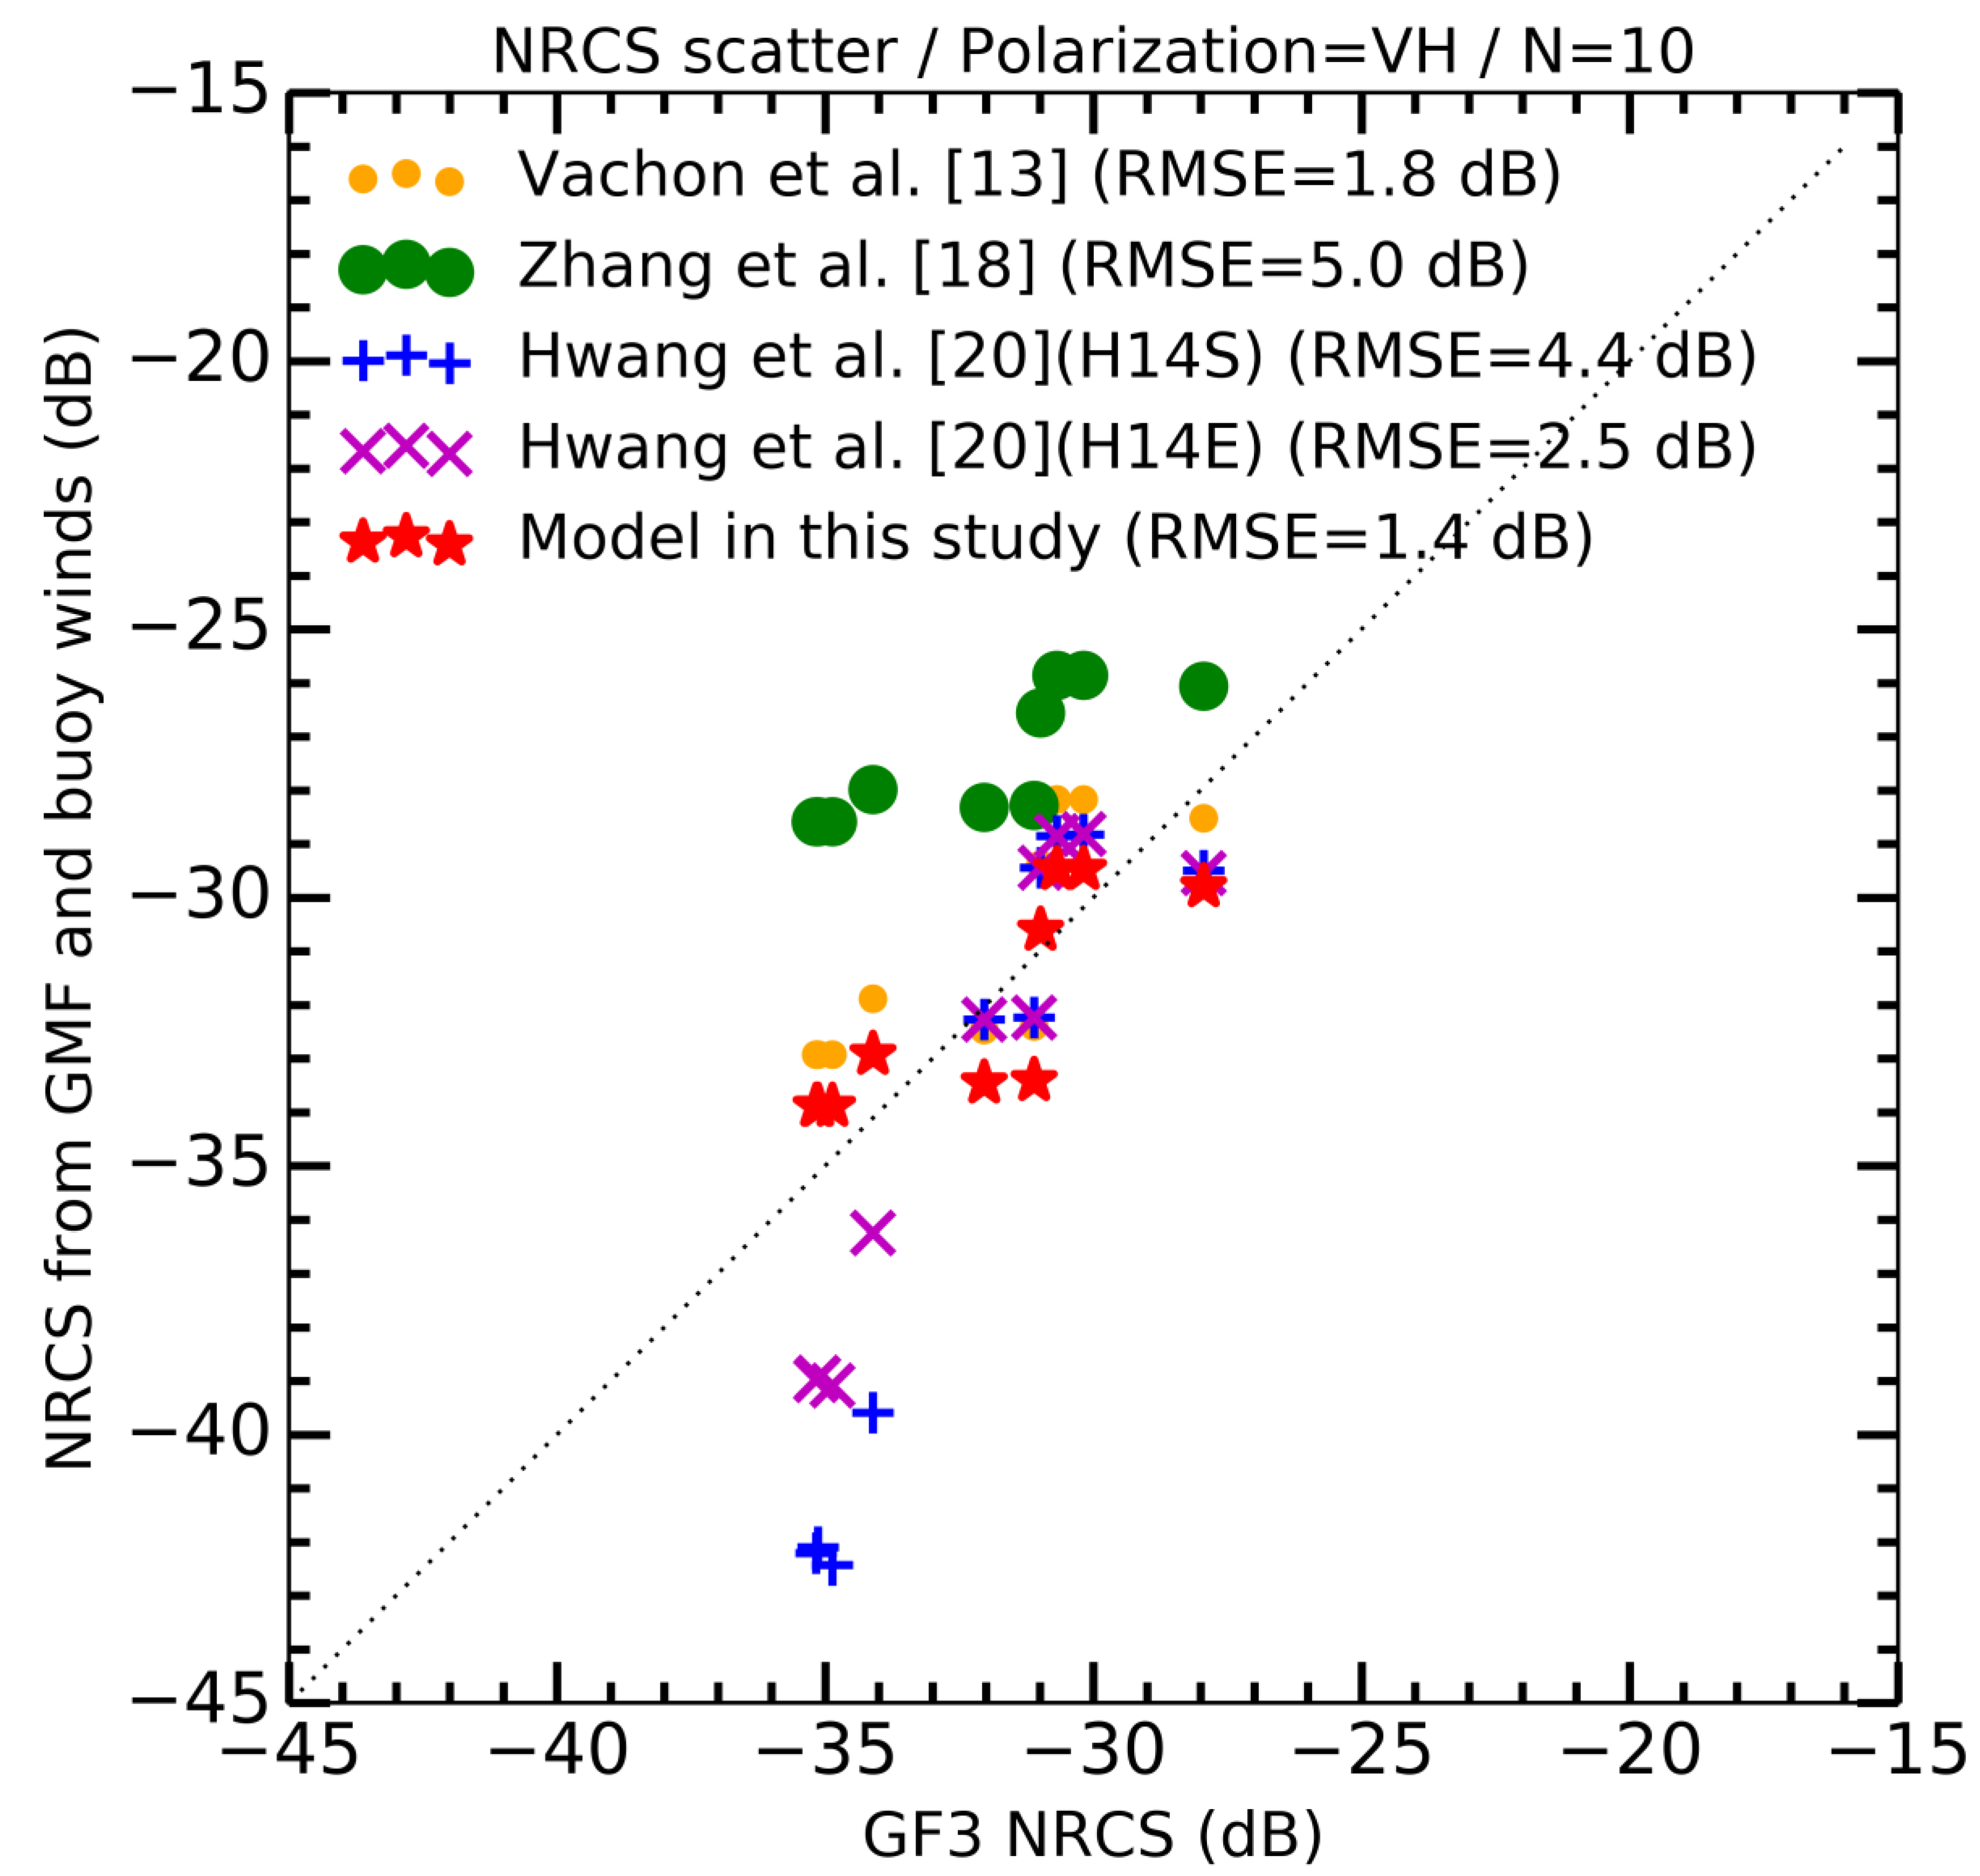
3.2. Wind Sensitivity for NRCS

Figure 5 presents the GF-3 NRCS of VV polarization as a function of wind speed and azimuth angle at the 36° incidence angle bin. The incidence angle bin is set to 2° due to limited data, while the wind speed bin is 1 m·s−1. GMFs used for comparison include CMOD4, CMOD_IFR2, CMOD5, CMOD5.N, and C-SARMOD. In Figure 5a, GMF-derived NRCS is based on the assumption of 45° azimuth angle. In Figure 5a, the VV NRCS increases with the wind speed. For the wind speed range of 2–12 m·s−1, VV NRCS increases by 8 dB. However, the dependence of VV NRCS on wind speeds less than 2 m·s−1 is weak. The CMOD4 model is significantly deviated from the other models. GF-3 data and most GMFs display good agreement and GF-3 data exhibit a more pronounced linearity compared to all other GMFs.
In Figure 5b, NRCS varies with the azimuth angle. The local maxima occur in the upwind and downwind directions, while the local minima occur in the crosswind direction. The maximum is approximately −14 dB while the minimum is −18 dB. CMOD4 remains significantly deviated, while other GMFs and GF-3 data display consistency on the modulation with the azimuth angle.
Figure 6 shows the data-to-model comparisons using collocations for the full data and multiple wind speed bins. The collocated winds used in the GMF models are from GFS. In Figure 6a, CMOD5 and CMOD5.N are close to each other, and are the two GMFs closest to the GF-3 data. In Figure 6b, each GMF does not exhibit exactly the same RMSE at different wind speed bins. In particular, the GMF with the smallest RMSE is CMOD5 for wind speeds less than 6 m·s−1, while it is CMOD5.N for higher wind speeds. Thus, we use a combination of CMOD5 and CMOD5.N as the closest GMF to the GF-3 VV data. In practical application which model is chosen will be determined by according to the wind speed values.
Figure 7 further validates the results presented in Figure 6 using collocated NDBC buoy winds instead of GFS winds. The combination of CMOD5 and CMOD5.N is used according to the wind speed value. All GMFs, except CMOD4, have acceptable RMSEs, with values from 0.6 dB to 1.2 dB. In particular, the smallest RMSE value (0.6 dB) belongs to the combination of CMOD5 and CMOD5.N.
Figure 8 shows the same analysis as in Figure 5, but for HH polarization. C-SARMOD can directly describe HH polarization data; however, CMOD GMFs are only suitable for VV polarization. Thus, the GF-3 HH polarization data are also compared with a hybrid model of CMOD and the PR model in addition to C-SARMOD. The VV NRCS is first obtained using CMOD GMF and then converted into HH NRCS using the PR model. Here, the PR model is tuned from the GF-3 data using Equation (5). The details of the tuning process are described in Section 3.3.
The comparisons of the dependence on wind speed and azimuth angle in Figure 8a,b show that HH polarization exhibits the same trends as those of VV polarization. Most GMFs are still in good agreement with the GF-3 data. The results suggest that C-SARMOD or the combination of CMOD and the PR model can describe the HH NRCS at an incidence angle of 36° and a wind speed of 7 m·s−1.
Figure 9 is the same as Figure 6 but for HH polarization. In Figure 9a, the CMOD5.N yields the least RMSE of about 1.6 dB. In Figure 9b, models are more consistent compared to those of VV polarization except for CMOD4. However, this figure basically exhibits a similar RMSE distribution to that of VV polarization, except that C-SARMOD has some improvements. From the above analysis, the combination of CMOD5 and CMOD5.N is still considered as the closest GMF to GF-3 HH data.
Figure 10 is the same as Figure 7 but for HH polarization. The combined closest GMF still yields the smallest RMSE, with a value of 0.8 dB. It means that GF-3 VV and HH polarization data can use the same combined GMF to retrieve winds, with the help of PR model developed using GF-3 data.
Figure 11 shows the same analysis as Figure 5, but for VH polarization. In Figure 11a, GF-3 VH NRCS dependence on wind speed exhibits a linear relationship for wind speeds higher than 4 m s−1. The VH data are widely used for higher winds. Our results suggest that VH data are sensitive to moderate wind speeds under low noise conditions. Based on this linear relationship, some VH GMFs have been proposed using RS-2 data. Here, we compare the VH NRCS dependence with the proposed models by Vachon et al. [13] and Zhang et al. [18], and two models (H14S and H14E) by Hwang et al. [20]. These comparisons show that the model in Vachon et al. [13] is relatively close to GF-3. This model is nearly parallel to the GF-3 data fit with a difference of approximately 2.0 dB.
In Figure 11b, VH NRCS varies with the azimuth angle similar to the co-polarized NRCS. The maxima and minima still occur in the upwind and crosswind directions, respectively. The VH NRCS dependence on azimuth angle is weak compared to the co-polarized data. This is why most VH GMFs do not consider azimuth modulation.
Based on the results reported in this section, a new VH GMF as a function of wind speed only, is established using the GF-3 data. This GMF is simply developed by fitting the first-order NRCS to the wind speed, expressed by:
σ 0 VH = 0.5629 U 10 36.1786
where σ 0 VH is the NRCS in VH polarization and U 10 is the wind speed at 10 m.
Figure 12 is the same as Figure 6, but for VH polarization. In Figure 12a, the model developed in this study has the smallest RMSE of 1.3 dB. Moreover, the model in Vachon [13] is close to our model with a difference of about 0.3 dB. In Figure 12b, both models are still close, but our model is slightly lower than Vachon’s for most wind speed bins. The new VH GMF model in this study is, thus, used as the closest model to GF-3 VH data.
Figure 13 is the same as Figure 7, but for VH polarization. Our model yields the smallest RMSE of 1.4 dB compared to GF-3 NRCS. Moreover, the model in Zhang [18] yields an extra bias, likely because of the calibration difference between GF-3 and RS-2 SAR data. Both H14S and H14E models have comparable RMSEs to our model at higher wind speeds, whereas there are large differences at low wind speeds. These results are also consistent with those shown in Figure 12.
Figure 14 presents the GF-3 NRCS scatter between VH and HV polarizations. Theoretically, NRCS for VH and HV should be the same. The correlation between the two polarizations is strong when the resolution is 10 km. This indicates that the two sets of cross-polarization data generally have the same GMF at a resolution of several kilometers. However, there are still some small differences on NRCS values between VH and HV. These differences are probably due to the distinctive treatments on how to record or process the two paths in GF-3 SAR configuration.

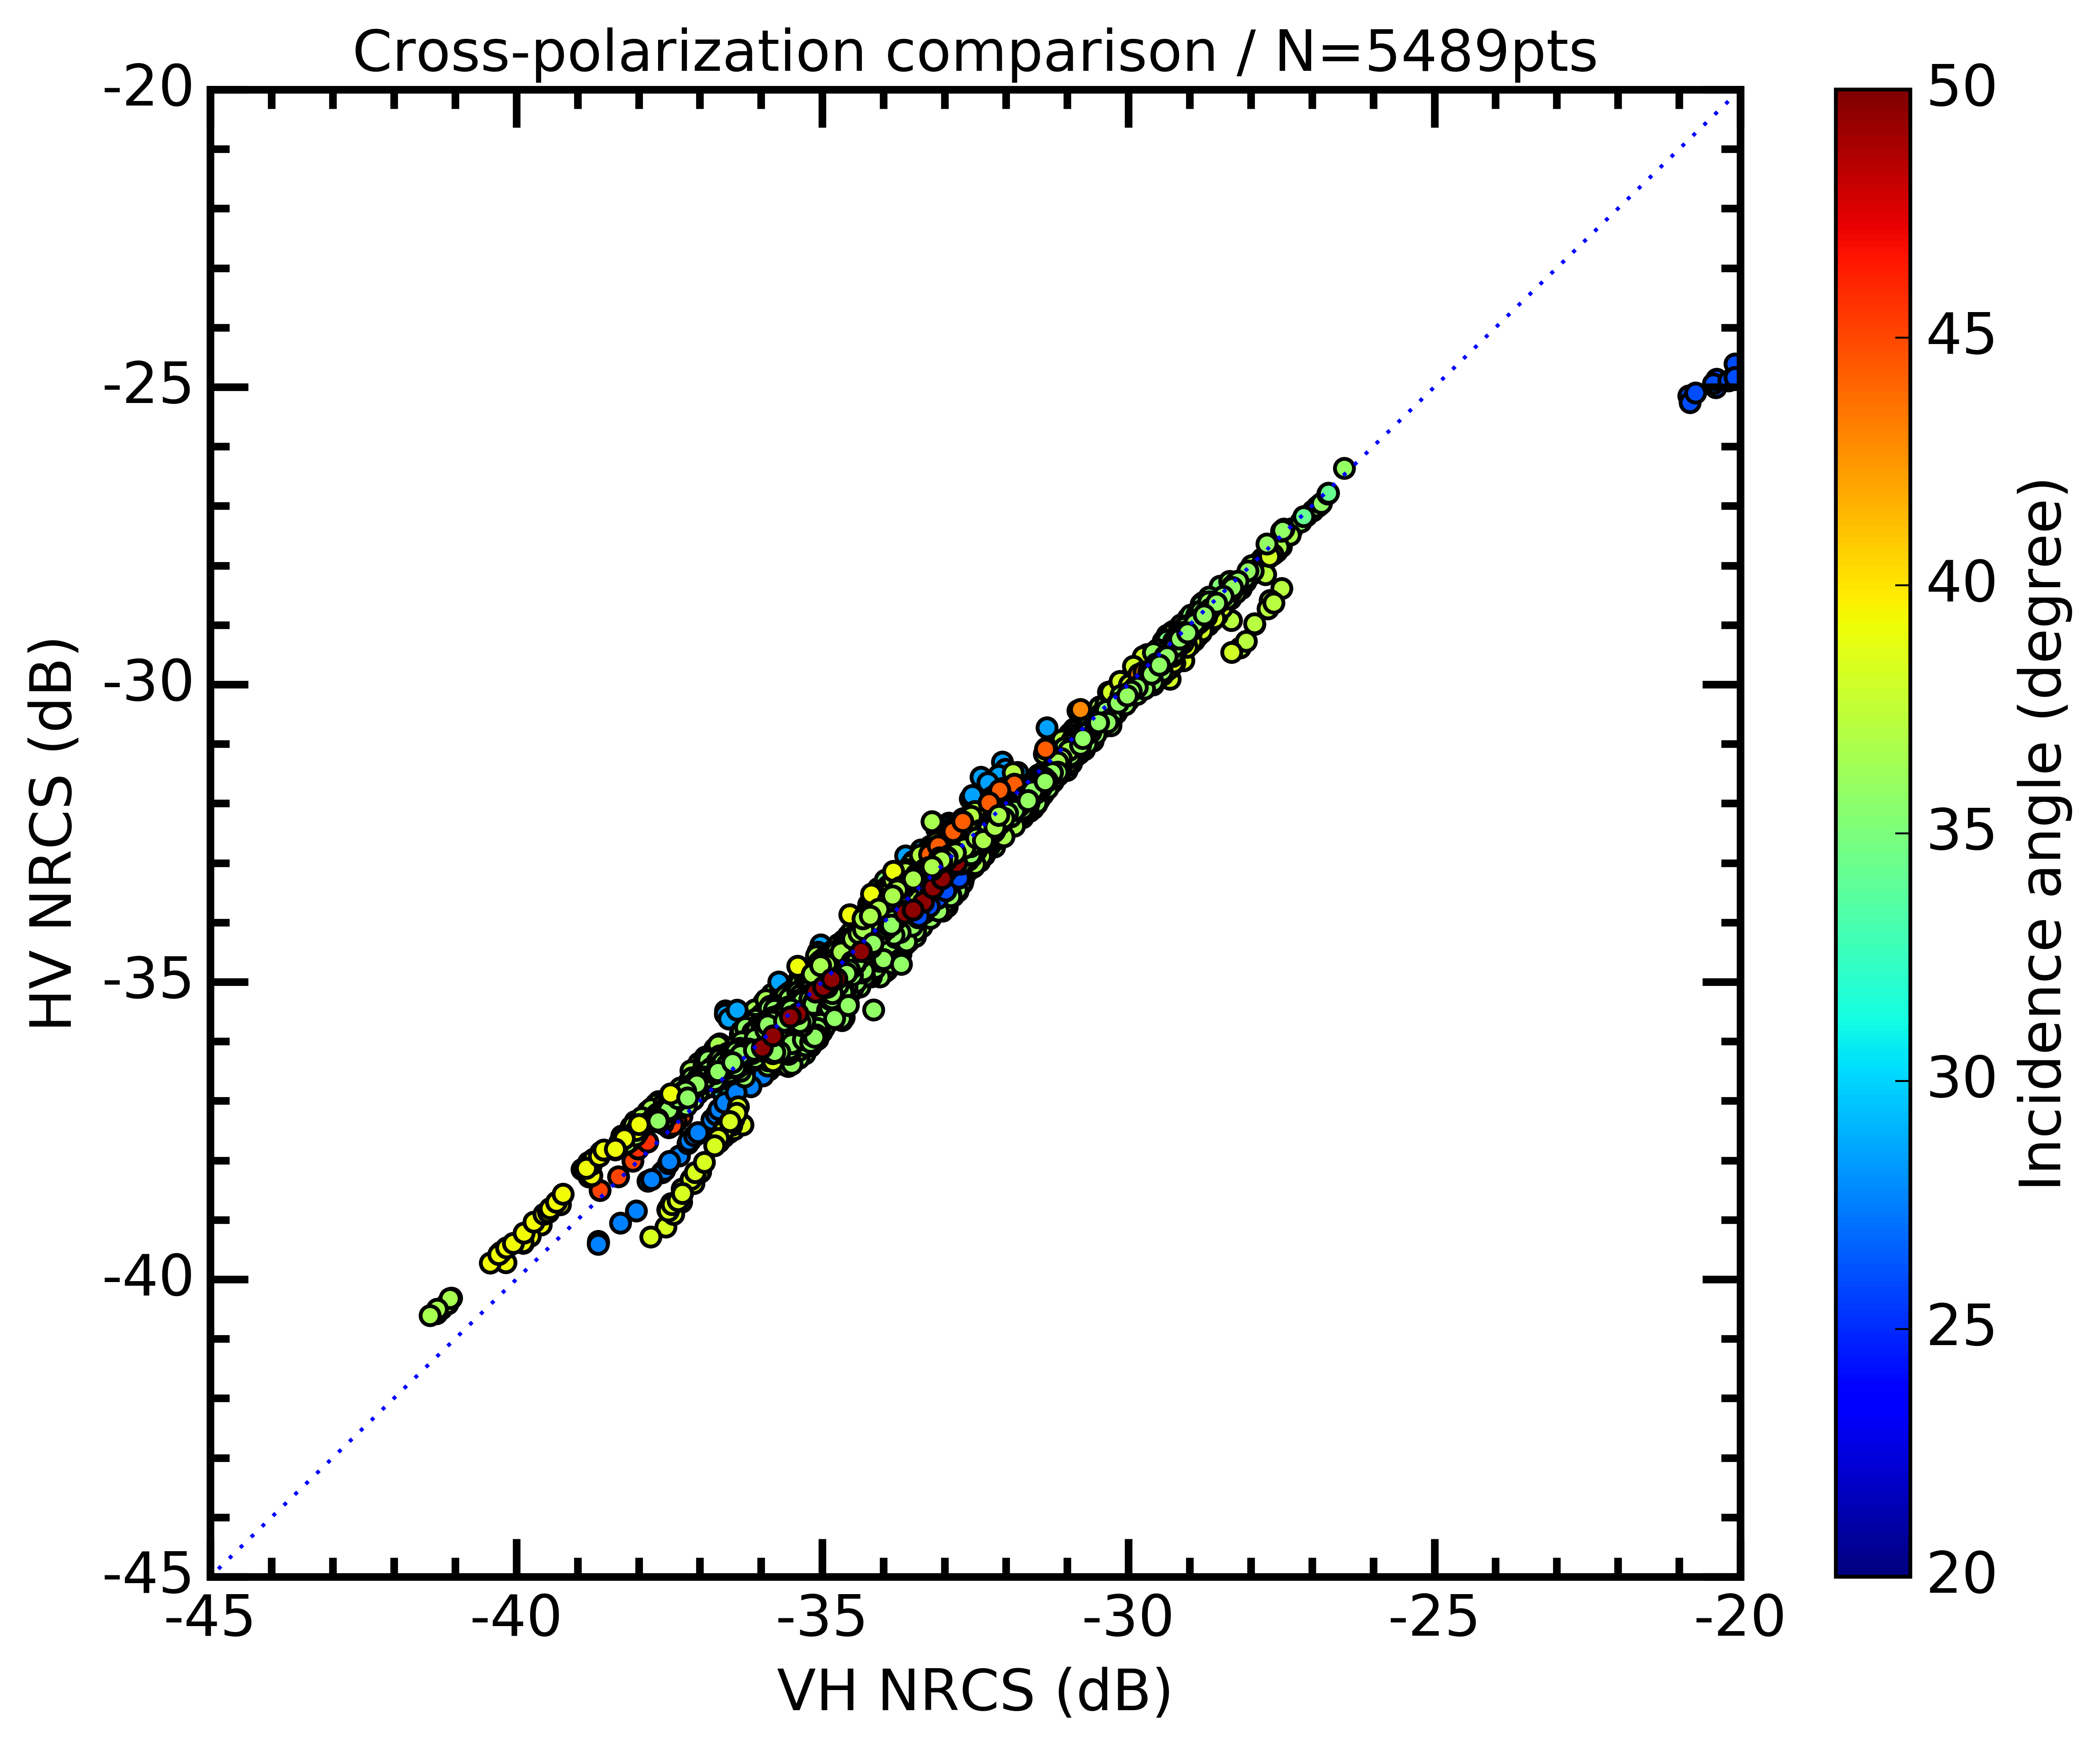
3.3. Wind Sensitivity for the Polarization Combination

Most proposed PR models are incidence angle dependent only, such as those reported in Elfouhaily et al. [6], Thompson et al. [7], Vachon et al. [8], and Horstmann et al. [9]. Some recent models are also wind speed (Zhang et al. [11]) or azimuth angle (Mouche et al. [10]) dependent. We analyze the GF-3 PR dependence on incidence angle, wind speed, and azimuth angle, and compare these to the proposed PR models (Figure 15). Figure 15a shows the GF-3 PR as a function of incidence angle (GF-3 PR increases with the incidence angle). Except for the model in Thompson et al. [7], the GF-3 PR and other PR models agree well with each other within the 20°–40° incidence angle range. However, for incidence angles larger than 40°, the difference between the models increases with the incidence angle.
Figure 15b shows the GF-3 PR dependence on wind speed. Overall, GF-3 PR is significantly lower than the model in Zhang et al. [11] for all wind speeds. There is a difference of approximately 1.0 dB between the two when the wind speed is 6 m·s−1. The model in Zhang et al. [11] decreases with wind speed, whereas GF-3 PR remains basically unchanged.
Figure 15c shows the GF-3 PR dependence on azimuth angle. GF-3 PR is lower than the model in Mouche et al. [10] for any azimuth angle; the maximum difference occurs at the azimuth angle of 180° (1.7 dB). The model in Mouche et al. [10] is sensitive to the azimuth angle and the peak is located at 180°, whereas GF-3 PR is not sensitive to the azimuth angle.
In summary, GF-3 PR is sensitive to the incidence angle, but not to wind speed or azimuth angle. Thus, we develop a new GF-3 PR model using the collocated data and it is a function of the incidence angle only. This model uses the same structure as the model in Vachon et al. [8]. The model coefficient α is estimated by fitting GF-3 PR data to the incidence angle and it has a value of 1.3. The new GF-3 PR model is expressed as:
PR = ( 1   +   2 tan 2 θ ) 2 ( 1   +   1.3 tan 2 θ ) 2
To quantitatively evaluate the models, we compare the PR values from GF-3 measurements and the models. Figure 16 shows the estimated RMSEs of the models. In Figure 16a, the RMSE of the model of this study is very close to the RMSE of the models by Elfouhaily et al. [6] and Vachon et al. [8] that have the same and the smallest RMSE values (~0.19 dB). In Figure 16b, the three models still have lower RMSEs than the other models at most incidence angle bins. Moreover, they show a slowly and alternately increasing trend with the incidence angle. Thus, each one of the three models can be used as the closest model to GF-3 PR data.
Figure 17 presents the same data as Figure 15 except for GF-3 PD dependence. The behavior of PD is different from that of PR. In Figure 17a, PD is insensitive to the incidence angle. The PD has no clear trend with incidence angle, with intensely fluctuation values, ranging from 0.01 to 0.06. Figure 17b shows that PD increases with wind speed, consistent with the study by Mouche et al. [12]; the two analyses have a value of 0.025 at a 10 m·s−1 wind speed. In Figure 17c, PD varies with the azimuth angle. In particular, the azimuthal modulation of PD is comparable to those of VV and HH data, as also discussed in Mouche et al. [12]. Moreover, the positions of the maxima and minima for PD are exactly the same as those for VV and HH data shown in Figure 5b and Figure 8b. The maxima and minima are approximately 0.022 and 0.004, respectively.

4. Discussion

GF-3, as the first Chinese C-band multi-polarization civil SAR, can determine the design adjustment and the launch schedule of subsequent satellites. Among the applications of GF-3, high-resolution measurements of ocean winds are undoubtedly among the most important ones. Currently, GF-3 is still in the early stages of use in orbit operations and is used in data characteristics testing. Some GF-3 data in copolarization have been collected for wind analysis and are used to retrieve ocean winds using frequently-used CMOD GMFs. Corresponding retrievals are validated by collocated buoy data and show an overall agreement. However, the amount of data used for validation is not sufficient. Moreover, polarization modes are confined to copolarization. In particular, there is no holistic analysis method for GF-3 SAR measurements in each polarization. For the ultimate operational application, it is essential to identify the gaps between Chinese GF-3 data and other SAR data or stable SAR models. Thus, in this study, we analyze NESZ and ocean wind sensitivity in each polarization using additional GF-3 quad-polarization measurements. The results of the NESZ analysis show that GF-3 data have an NESZ level comparable with S-1A and RS-2 in each polarization. The analysis of wind sensitivity reveals that GF-3 data are consistent with the proposed GMFs and PR models and contain the wind information. Even more importantly, it proves the reliability of the data quality. We also used the data-to-model comparisons to determine the closest models to the data. These models can be used to extract winds from GF-3 data.
The analysis of copolarization shows that the accuracy of GMFs at different wind speeds are not exactly the same. Therefore, a combined model is used to retrieve winds from GF-3 data more accurately. In fact, the closest GMF to GF-3 copolarization is a combination of two models. Thus, the GF-3 data with lower NRCS can be processed using CMOD5, while the model is replaced by CMOD5.N for higher NRCS. Wind retrieval in extreme wind conditions can also turn to cross-polarized data, which are not easy to saturate. In addition, cross-polarized NRCS also exhibit strong linear relationships with moderate wind speeds larger than 4 m·s−1. This means that cross-polarization has a potential to retrieve moderate winds if the noise meets certain requirements.
In previous studies [12,27], PD mostly contains information on the fast-response spatial changes of short-scale resonant Bragg waves, mainly caused by variable wind fields. Our results show that GF-3 PD data increase with wind speed and are modulated with azimuth direction. This represents a potential of extracting more true winds from PD data using fast-response characteristics for changing coast winds. As a next step, we will compare the wind retrievals from conventional SAR data and PD data in combination with in situ winds, to quantitatively explore the fast-response characteristics.
There are three factors that affect the accuracy of the analysis. The first one is the data location. Most of the data are from the coastal areas of East Asia, which makes it difficult to study the regional differences in GF-3 data characteristics. The second one is the nonuniformity of the distribution of the incidence angle. Most incidence angles of GF-3 data are concentrated in a narrow range, between 35.5° and 37.5°, which limits the analysis of NESZ and wind sensitivity for NRCS to a narrow incidence angle, although wind sensitivity for polarization combination uses a wider, but intermittent, range of incidence angles. The last one is the limited amount of in situ buoy data. In this study, we only collected ten NDBC buoy collocations because most GF-3 data are from the East Asia coast, while most NDBC data are collected off the west coast of the United States. Moreover, most buoy wind data are in the range of 5 m·s−1 and 12 m·s−1. If we have a larger amount of buoy data, we can make more comprehensive comparisons for a wider range of wind speeds.
Despite the limitations, we recommend promoting the initial applications of GF-3 data. For both QPSI and QPSII mode data at a specific incidence angle range, this study reveals the validity and the capacity of GF-3 data to extract wind information. This study also determines the models suitable for GF-3 data.

5. Conclusions

This study focuses on the preliminary analysis of NESZ and wind sensitivity for Chinese GF-3 SAR measurements. The results can be used to select or develop models used for GF-3 operational wind retrievals. Datasets used in this study include the GF-3 SAR quad-polarization data and the collocated wind field data from both GFS and NDBC.
The NESZ for GF-3 SAR measurements in each polarization was first analyzed using NRCS and the collocated GFS wind speeds. The NESZ of VV, HH, VH, and HV data at a 36° incidence angle are −33 dB, −33 dB, −37 dB, and −37 dB, respectively. The copolarization NESZ is slightly higher than the cross-polarization NESZ. The GF-3 NESZ is close to the NESZ levels for RS-2 and S-1A. The low NESZ performance of GF-3 cross-polarization data makes the application of these weak signals possible.
Next, the wind sensitivity of GF-3 SAR measurements was studied by analyzing the dependence of NRCS and polarization combination on wind data. First, the dependence of GF-3 NRCS on wind speed and azimuth angle in different polarizations was analyzed and compared to the proposed GMFs. We explored the trends in GF-3 data against wind speed and azimuth direction. For copolarization data, GF-3 NRCS increased with the wind speed and was modulated by the azimuth angle. The results were consistent with most GMFs, including CMOD_IFR2, CMOD5, and CMOD5.N. The PR model used in the analysis of HH polarization data was developed using GF-3 data. For VH data, a clear linear relationship between GF-3 NRCS and moderate wind speeds (higher than 4 m·s−1) was detected. This suggests that VH data have the potential to retrieve moderate winds accurately, although this type of polarization data has been previously used in high-wind applications. The HV data had nearly identical NRCS at a 10-km spatial resolution.
In addition, the GF-3 polarization combination was analyzed and compared to the results of the existing studies. The polarization combinations analyzed in this study include PR and PD. GF-3 PR increased with the incidence angle, but was insensitive to both wind speed and azimuth angle. GF-3 PR and most PR models were consistent within the incidence angle range of 20°–40°; however, differences were significant for larger incidence angles. GF-3 data was not dependent on wind speed or azimuth angle, whereas GF-3 PD was sensitive to wind speed and azimuth angle, but insensitive to the incidence angle. PD increases with the wind speed and is modulated by the azimuth angle. The GF-3 PD dependence on wind speed and azimuth angle was generally consistent with the studies on ENVISAT ASAR.
Based on the linearity of cross-polarization, a simple GF-3 VH GMF was developed using collocations. Meanwhile, considering the PR diversity for large incidence angles, a new GF-3 PR model was developed using GF-3 data as a function of incidence angle only.
To determine the closest GMF in each polarization and PR model to GF-3 data, we performed data-to-model comparisons. The comparison used collocated GFS winds to determine the closest model in terms of the magnitude of RMSE. The comparisons also used collocated in situ NDBC buoy winds to validate the determined models. The closest GMF in copolarization was the combination of CMOD5 and CMOD5.N. The former was suitable for lower wind speeds, while the latter was suitable for higher wind speeds. For GF-3 cross-polarization, the closest GMF was the model proposed in this study. In addition, there were three very close PR models proposed in Elfouhaily et al. [6], Vachon [8], and the current study. Each one can be used as the closest PR models to GF-3 data.
In future research, the determined closest model in each polarization will be used to extract winds from GF-3 data. Furthermore, we will extend the GF-3 data incidence angle range to enrich the analysis of NESZ and wind sensitivity of GF-3 measurements.

Acknowledgments

The authors thank the National Satellite Ocean Application Service for providing GF-3 quad-polarization SAR data, and the free access to the NOAA/NCEP Global Forecast System (GFS) atmospheric model winds (http://oos.soest.hawaii.edu/erddap/griddap/) and the National Data Buoy Center (NDBC) buoy winds (http://www.ndbc.noaa.gov/). We would also like to thank Limin Cui and Xinzhe Yuan for the help in GF-3 data delivery, and to thank Xiaoming Li for the deep discussion. The authors greatly appreciate the anonymous reviewers for their valuable comments that helped improve the manuscript. This work was supported by the National Key Research and Development Program of China (grant No. 2016YFC1401007), the National High-Resolution Project of China (grant No. Y20A14-9001-15/16), the Scientific Research Fund of the Second Institute of Oceanography, State Oceanic Administration of China (grant No. JG1708), the National Science Foundation of China (grant No. 41621064), and the European Space Agency and Ministry of Science and Technology Dragon 4 Cooperation Programme (grant No. 32249).

Author Contributions

Lin Ren, Jingsong Yang, and Alexis Mouche conceived the idea. Lin Ren wrote the manuscript. He Wang, Gang Zheng, and Juan Wang processed the GF-3 SAR data. All authors contributed to the discussion and revision of the manuscript.

Conflicts of Interest

The authors declare no conflict of interest.

References

  1. Valenzuela, G.R. Theories for the interaction of electromagnetic and oceanic waves—A review. Bound. Layer Meteorol. 1978, 13, 61–85. [Google Scholar] [CrossRef]
  2. Stoffelen, A.; Anderson, D. Scatterometer data interpretation: Derivation of the transfer function CMOD4. J. Geophys. Res. 1997, 102, 5767–5780. [Google Scholar] [CrossRef]
  3. Quilfen, Y.; Chapron, B.; Elfouhaily, T.; Katsaros, K.; Tournadre, J. Observation of tropical cyclones by high-resolution scatterometry. J. Geophys. Res. 1998, 103, 7767–7786. [Google Scholar] [CrossRef]
  4. Hersbach, H.; Stoffelen, A.; Haan, S. An improved C-band scatterometer ocean geophysical model function: CMOD5. J. Geophys. Res. 2007, 112, C03006. [Google Scholar] [CrossRef]
  5. Hersbach, H. CMOD5.N: A C-Band Geophysical Model Function for Equivalent Neural Wind; ECMWF: Reading, UK, 2008; p. 554. [Google Scholar]
  6. Elfouhaily, T. Physical Modeling of Electromagnetic Backscatter from the Ocean Surface, Application to Retrieval of Wind Fields and Wind Stress by Remote Sensing of the Marine Atmospheric Boundary Layer. Ph.D. Thesis, University Paris VII, Paris, France, 1996. [Google Scholar]
  7. Thompson, D.R.; Elfouhaily, T.M.; Chapron, B. Polarization ratio for microwave backscattering from the ocean surface at low to moderate incidence angles. In Proceedings of the 1998 IEEE International Geoscience and Remote Sensing Symposium Proceedings (IGARSS ’98), Seattle, WA, USA, 6–10 July 1998; pp. 1671–1673. [Google Scholar] [CrossRef]
  8. Vachon, P.W.; Dobson, F. Wind retrieval from RADARSAT SAR images: Selection of a suitable C-band HH polarization wind retrieval model. Can. J. Remote Sens. 2000, 26, 306–313. [Google Scholar] [CrossRef]
  9. Horstmann, J.; Koch, W.; Lehner, S.; Tonboe, R. Wind retrieval over the ocean using synthetic aperture radar with C-band HH polarization. IEEE Trans. Geosci. Remote Sens. 2000, 38, 2122–2131. [Google Scholar] [CrossRef]
  10. Mouche, A.; Hauser, D.; Daloze, J.-F.; Guerin, C. Dual-polarization measurements at C-band over the ocean: Results from airborne radar observations and comparison with ENVISAT ASAR data. IEEE Trans. Geosci. Remote Sens. 2005, 43, 753–769. [Google Scholar] [CrossRef]
  11. Zhang, B.; Perrie, W.; He, Y. Wind speed retrieval from RADARSAT2 quad-polarization images using a new polarization ratio model. J. Geophys. Res. 2011, 116, C08008. [Google Scholar] [CrossRef]
  12. Mouche, A.; Chapron, B. Global C-Band Envisat, RADARSAT-2 and Sentinel-1 SAR measurements in copolarization and cross-polarization. J. Geophys. Res. Oceans 2015, 120, 7195–7207. [Google Scholar] [CrossRef]
  13. Vachon, P.W.; Wolfe, J. C-band cross-polarization wind speed retrieval. IEEE Trans. Geosci. Remote Sens. Lett. 2011, 8, 456–458. [Google Scholar] [CrossRef]
  14. Zhang, B.; Perrie, W. Cross-polarized synthetic aperture radar: A new potential technique for hurricanes. Bull. Am. Meteorol. Soc. 2011, 93, 531–541. [Google Scholar] [CrossRef]
  15. Hwang, P.A.; Zhang, B.; Perrie, W. Depolarized radar return for breaking wave measurement and hurricane wind retrieval. Geophys. Res. Lett. 2010, 37. [Google Scholar] [CrossRef]
  16. Hwang, P.A.; Zhang, B.; Toporkov, J.V.; Perrie, W. Comparison of composite Bragg theory and quad-polarization radar backscatter from RADARSAT2: With applications to wave breaking and high wind retrieval. J. Geophys. Res. 2010, 115. [Google Scholar] [CrossRef]
  17. Hwang, P.A.; Perrie, W.; Zhang, B. Cross-polarization radar backscattering from the ocean surface and its dependence on wind velocity. IEEE Trans. Geosci. Remote Sens. Lett. 2014, 11, 2188–2192. [Google Scholar] [CrossRef]
  18. Zhang, B.; Perrie, W.; Zhang, J.A.; Uhlhorn, E.W.; He, Y. High-resolution hurricane vector winds from C-band dual-polarization SAR observations. J. Atmos. Ocean. Technol. 2014, 31, 272–286. [Google Scholar] [CrossRef]
  19. Shen, H.; Perrie, W.; He, Y.; Liu, G. Wind speed retrieval from VH dual-polarization RADARSAT-2 SAR images. IEEE Trans. Geosci. Remote Sens. 2014, 52, 5820–5826. [Google Scholar] [CrossRef]
  20. Hwang, P.A.; Stoffelen, A.; Van Zadelhoff, G.-J.; Perrie, W.; Zhang, B.; Li, H.; Shen, H. Cross-polarization geophysical model function for C-band radar backscattering from the ocean surface and wind speed retrieval. J. Geophys. Res. Oceans 2015, 120, 893–909. [Google Scholar] [CrossRef]
  21. Sun, J.L.; Yu, W.D.; Deng, Y.K. The SAR payload design and performance for the GF-3 mission. Sensors 2017, 17, 2419. [Google Scholar] [CrossRef] [PubMed]
  22. Wang, H.; Yang, J.S.; Mouche, A.; Shao, W.Z.; Zhu, J.H.; Ren, L.; Xie, C.H. GF-3 SAR ocean wind retrieval: The first view and preliminary assessment. Remote Sens. Lett. 2017, 9, 694. [Google Scholar] [CrossRef]
  23. Shao, W.Z.; Sheng, Y.X.; Sun, J. Preliminary assessment of wind and wave retrieval from Chinese Gaofen-3 SAR imagery. Sensors 2017, 17, 1705. [Google Scholar] [CrossRef] [PubMed]
  24. Yang, J.S.; Ren, L.; Wang, J. The first quantitative remote sensing of ocean surface waves by Chinese GF-3 SAR satellite. Acta Oceanol. Sin. 2017, 48, 207–209. [Google Scholar] [CrossRef]
  25. Charnock, H. Wind stress on a water surface. Q. J. R. Meteorol. Soc. 1955, 81, 639–640. [Google Scholar] [CrossRef]
  26. Smith, S.D. Coefficients for sea surface wind stress, heat flux, and wind profiles as a function of wind speed and temperature. J. Geophys. Res. 1988, 93, 15467–15472. [Google Scholar] [CrossRef]
  27. Kudryavtsev, V.N.; Chapron, B.; Myasoedov, A.G.; Collard, F.; Johannessen, J.A. On dual co-polarized SAR measurements of the ocean surface. IEEE Trans. Geosci. Remote Sens. Lett. 2013, 10, 761–765. [Google Scholar] [CrossRef]
Figure 1. Location map of the 1787 GF-3 SAR data points acquired in the QPSI and QPSII modes. Each blue point represents a SAR data central location.
Remotesensing 09 01215 g001
Figure 2. Central incidence angle distribution of the collected GF-3 SAR data.
Remotesensing 09 01215 g002
Figure 3. Normalized radar cross-section (NRCS) from GF-3 QPSI mode quad-polarization SAR data acquired on 3 July 2017 at 01:51:53 UTC for (a) VV, (b) HH, (c) VH, and (d) HV polarization.
Remotesensing 09 01215 g003
Figure 4. The GF-3 NRCS as a function of incidence angle for 4 different polarizations. The color bars represent the collocated wind speed from GFS. (a) For VV polarization; (b) for HH polarization; (c) for VH polarization; and (d) for HV polarization.
Remotesensing 09 01215 g004
Figure 5. The GF-3 NRCS of VV polarization as a function of (a) wind speed and (b) azimuth angle. The GF-3 NRCS data are fitted and compared to GMFs including CMOD4, CMOD_IFR2, CMOD5, CMOD5.N, and C-SARMOD.
Remotesensing 09 01215 g005
Figure 6. RMSE of GMFs compared to GF-3 NRCS of VV polarization. (a) Each RMSE is from the full data; and (b) each RMSE is from a wind speed bin of 1 m·s−1. GMFs used include CMOD4, CMOD_IFR2, CMOD5, CMOD5.N, and C-SARMOD. The winds used in the GMFs are from GFS.
Remotesensing 09 01215 g006
Figure 7. Scatterplots of GF-3 NRCS of VV polarization against NRCS from GMFs using collocated NDBC buoy winds as inputs.
Remotesensing 09 01215 g007
Figure 8. Same as Figure 5, but for HH polarization. The PR model used was developed using GF-3 data, shown in Equation (5).
Remotesensing 09 01215 g008
Figure 9. Same as Figure 6, but for HH polarization. The used PR model was developed using GF-3 data.
Remotesensing 09 01215 g009
Figure 10. Same as Figure 7, but for HH polarization. The used PR model was developed using GF-3 data.
Remotesensing 09 01215 g010
Figure 11. Same as Figure 5, but for VH polarization. The GF-3 NRCS data are fitted and compared to four proposed models.
Remotesensing 09 01215 g011
Figure 12. Same as Figure 6, but for VH polarization. The GMFs used include four previous models and one model developed using GF-3 data.
Remotesensing 09 01215 g012
Figure 13. Same as Figure 7, but for VH polarization. The GMFs used include four previous models and one model developed using GF-3 data.
Remotesensing 09 01215 g013
Figure 14. The GF-3 NRCS scatter between VH and HV polarization. The color bar represents the incidence angle.
Remotesensing 09 01215 g014
Figure 15. The GF-3 polarization ratio as a function of (a) incidence angle, (b) wind speed, and (c) azimuth angle. The GF-3 polarization ratios are fitted and compared to some proposed models.
Remotesensing 09 01215 g015
Figure 16. The RMSE of PR models compared to GF-3 PR measurements. (a) Each RMSE is from full data; and (b) each RMSE is from an incidence angle bin of 1°.
Remotesensing 09 01215 g016
Figure 17. The GF-3 polarization difference dependence on (a) incidence angle, (b) wind speed, and (c) azimuth angle. The GF-3 NRCS data are fitted.
Remotesensing 09 01215 g017
Table 1. Details for QPSI and QPSII modes.
ModePolarizationResolution (m)Swath (km)
QPSIVV + HH + VH + HV830
QPSIIVV + HH + VH + HV2540
Table 2. Details for collocations of GF-3 quad-polarization data and NDBC buoy observations.
NumberModeSAR Time (UTC)SAR Cell Center Latitude (°/N)SAR Cell Center Longitude (°/E)Buoy NameBuoy Latitude (°/N)Buoy Longitude (°/E)Buoy Wind Speed (m·s−1)Buoy Wind Direction (°/North)
1QPSII2017-04-23 01:54:5833.678−120.1834606933.67−120.2010.8314.0
2QPSII2017-03-08 14:08:0437.384−122.8804601237.36−122.884.7331.0
3QPSII2017-03-08 14:08:1037.356−122.8494601237.36−122.884.7331.0
4QPSII2017-04-06 14:08:1037.782−122.7884602637.76−122.846.5161.0
5QPSII2017-04-06 14:08:1637.355−122.8064601237.36−122.884.7155.0
6QPSII2017-04-08 14:25:1737.754−122.8214602637.76−122.845.6254.0
7QPSII2017-04-08 14:25:1737.347−122.8604601237.36−122.885.5269.0
8QPSII2017-04-23 14:05:4034.249−120.3914605434.27−120.4612.3327.0
9QPSII2017-04-23 14:05:4633.692−120.1564606933.67−120.2012.9304.0
10QPSII2017-04-23 14:05:5233.671−120.1924606933.67−120.2012.9304.0

