Article

Integrating Data of ASTER and Landsat-8 OLI (AO) for Hydrothermal Alteration Mineral Mapping in Duolong Porphyry Cu-Au Deposit, Tibetan Plateau, China

1
College of Earth Sciences, Chengdu University of Technology (CDUT), Chengdu 610059, China
2
Key Laboratory of Geoscience Spatial Information Technology, Ministry of Land and Resources of the People’s Republic of China, Chengdu 610059, China
3
The Engineering& Technical College of Chengdu University of Technology, Leshan 614000, China
4
Institute of Mineral Resources, Chinese Academy of Geological Sciences (CAGS), Beijing 100037, China
5
Key Laboratory of Metallogeny and Mineral Assessment, Ministry of Land and Resources of the People’s Republic of China, Beijing 100037, China
6
Tibet Bureau of Geology and Mineral Exploration and Development, Lhasa 850000, China
*
Author to whom correspondence should be addressed.
Remote Sens. 2016, 8(11), 890; https://doi.org/10.3390/rs8110890
Submission received: 3 July 2016 / Revised: 1 October 2016 / Accepted: 24 October 2016 / Published: 28 October 2016
(This article belongs to the Special Issue Multi-Sensor and Multi-Data Integration in Remote Sensing)

Abstract

:
One of the most important characteristics of porphyry copper deposits (PCDs) is the type and distribution pattern of alteration zones which can be used for screening and recognizing these deposits. Hydrothermal alteration minerals with diagnostic spectral absorption properties in the visible and near-infrared (VNIR) through the shortwave infrared (SWIR) regions can be identified by multispectral and hyperspectral remote sensing data. Six Advanced Spaceborne Thermal Emission and Reflection Radiometer (ASTER) bands in SWIR have been shown to be effective in the mapping of Al-OH, Fe-OH, Mg-OH group minerals. The five VNIR bands of Landsat-8 (L8) Operational Land Imager (OLI) are useful for discriminating ferric iron alteration minerals. In the absence of complete hyperspectral coverage area, an opportunity, however, exists to integrate ASTER and L8-OLI (AO) to compensate each other’s shortcomings in covering area for mineral mapping. This study examines the potential of AO data in mineral mapping in an arid area of the Duolong porphyry Cu-Au deposit(Tibetan Plateau in China) by using spectral analysis techniques. Results show the following conclusions: (1) Combination of ASTER and L8-OLI data (AO) has more mineral information content than either alone; (2) The Duolong PCD alteration zones of phyllic, argillic and propylitic zones are mapped using ASTER SWIR bands and the iron-bearing mineral information is best mapped using AO VNIR bands; (3) The multispectral integration data of AO can provide a compensatory data of ASTER VNIR bands for iron-bearing mineral mapping in the arid and semi-arid areas.

Graphical Abstract

1. Introduction

Remote sensing has proven a valuable aid during the early stages of mineral exploration in alteration mineral mapping [1,2]. Porphyry copper deposits (PCDs) presently provide nearly three-quarters of the world’s copper and half of the world’s molybdenum [3]. The PCDs are characterized by alteration and mineralization zones. Hydrothermal alteration minerals with diagnostic spectral absorption properties in the visible and near-infrared (VNIR) through the shortwave infrared (SWIR) regions can be identified by multispectral and hyperspectral remote sensing data [4,5,6].
At present, three porphyry copper belts, namely Yulong, Gangdisi, and Bangong Co-Nujiang River [7,8,9,10,11], have been found in the Tibetan Plateau. Their representative deposits are the PCDs of Yulong, Qulong, and Duolong. All of them are on either a large or ultra-large scale [7,8,9,10,11,12,13,14], thereby showing great potential for Cu prospecting in the Tibetan Plateau. However, because of its remoteness, severe climate, and rugged topography, the Tibetan Plateau remains vastly underexplored at this “third pole” of the world. Furthering the exploration of porphyry copper deposits in the Tibetan Plateau will require taking advantage of remote sensing technology and carrying out a large area of alteration mineral mapping for quickly identifying the prospected target ore areas.
Over the past two decades, the development of spectral remote sensing technologies has significantly advanced capabilities for mapping mineral system-related alteration, particularly with the applications of hyperspectral remote sensing data (Airborne Visible/Infrared Imaging Spectrometer (AVIRIS) [2,15,16], HyMap [17,18,19,20,21], etc.) and the widespread applications of multispectral remote sensing data (Landsat Thematic Mapper (TM) [22,23], Enhanced Thematic Mapper plus (ETM+) [1,24], Advanced Spaceborne Thermal Emission and Reflection Radiometer (ASTER) [25,26,27,28,29,30,31,32], etc.). The recently launched WorldView-3 (WV-3) satellite is a high spatial resolution commercial multispectral sensor with eight VNIR bands (0.42–1.04 μm) and eight SWIR bands (1.2–2.33 μm) [33,34], which will offer us more accurate mineral information. Entering the 21st century, regional scale mineral mapping has been in great demand. The United States Geological Survey (USGS) acquired HyMap data of the countrywide coverage in Afghanistan with 438,012 km2 in 2007, which were developed to assess the activities of coal, water, minerals, and earthquake hazards, as well as southern Afghanistan’s oil and gas basins in Katawaz and Helmand provinces [35]. During 2009–2012, based on ETM+ data (partly TM data), the Ministry of Land and Resources of China finished the national hydrothermal alteration information (hydroxylate anomaly and ferric contamination anomaly) extraction at a 1:250,000 scale [36]. The regional scale and continental-scale mineral mapping products [25,26,27,28], coming from Dr. Cudahy and his Commonwealth Scientific and Industrial Research Organisation (CSIRO) team, are also the case studies. A long-standing problem in remote sensing has been the trade-off between the ability to map complex scenes and the expense of developing sensors with high Signal-to-Noise Ratio (SNR) and spatial/spectral resolution [37]. Current operational hyperspectral remote sensing data (AVIRIS, HyMap, Hyperion [18,38,39], etc.) are difficult to apply to a wide area (regional scale) because of the relatively narrow swath (compared with multispectral imaging sensors like ETM+) in addition to the high cost of commercial airborne surveys. Multispectral remote sensing data (especially the ASTER data) has therefore become the first choice of data sources for regional scale alteration mineral mapping due to its broad swath width and abundant archives.
Unfortunately, ASTER is challenged by having only three VNIR bands in mapping and characterizing ferric iron minerals [40,41,42]. The five VNIR bands from the Operational Land Imager (OLI) sensor carried by the L8 satellite launched in 2013 have a broad bandwidth and a high SNR [43,44,45,46,47]. OLI has three additional VNIR bands compared with ASTER, two of which are at shorter wavelengths in the visible deep inside maximum charge transfer absorption and one at longer wavelengths spanning 0.845 to 0.885 μm covering part of the ferric oxide crystal field absorption of hematite and, to a lesser degree, goethite. However, unlike ASTER and its band 3, OLI lacks a band over the ferric oxide reflectance peak at 0.76 μm, which makes it difficult to measure the relative depth of the crystal field absorption minimum positioned at 0.85 μm (hematite) and 0.93 μm (goethite). At the same time, compared to the bands of OLI SWIR, ASTER SWIR bands have shown to be effective in predicting the occurrence of a certain group of minerals: Al-OH, Fe-OH and Mg-OH (kaolinite, alunite, illite, muscovite, montmorillonite, chlorite, calcite, dolomite and others) [42,48,49]. The question is therefore how to take advantage of the full complement of VNIR spectral band coverage of OLI and ASTER data to maximize the available iron oxide information and have the full SWIR spectral capability of ASTER. The 13 bands of Advanced Land Imager (ALI)+ASTER data structured by Hubbard et al. [37] offer good inspiration. Although the OLI VNIR bands are equal to ALI VNIR bands, the swath width of OLI (185 km) is wider than that of ALI (36 km). If the spectral integration advantage of ALI+ASTER data is to be limited in the single image maximum width to 36 km (the width of ALI), the integration advantages of ASTER and OLI will be extended to the whole ASTER width. In this sense, the data integration of ASTER and OLI will play a significant role at the regional scale in alteration mineral mapping.
The ore deposit of Duolong is the first ultra-large porphyry Cu-Au one found in the Bangong Co-Nujiang River metallogenic belt in recent years. The Duolong PCD is located in the depopulated A’li district in the northern part of the Tibetan Plateau. In this area, the mean altitude is about 5000 m, air is sparse, and water vapor is rare (the daily maximum of water vapor is less than 1.5 cm [50]). The extremely arid conditions of this region result in a sparse vegetation cover, so bedrock, altered rock, and altered minerals are well exposed. The preliminary alteration zones have been delineated in the ground exploration and the field spectra have also been measured in certain areas. Thus, Duolong PCD is the ideal experimental area to test the results of remote sensing alteration mineral extraction.

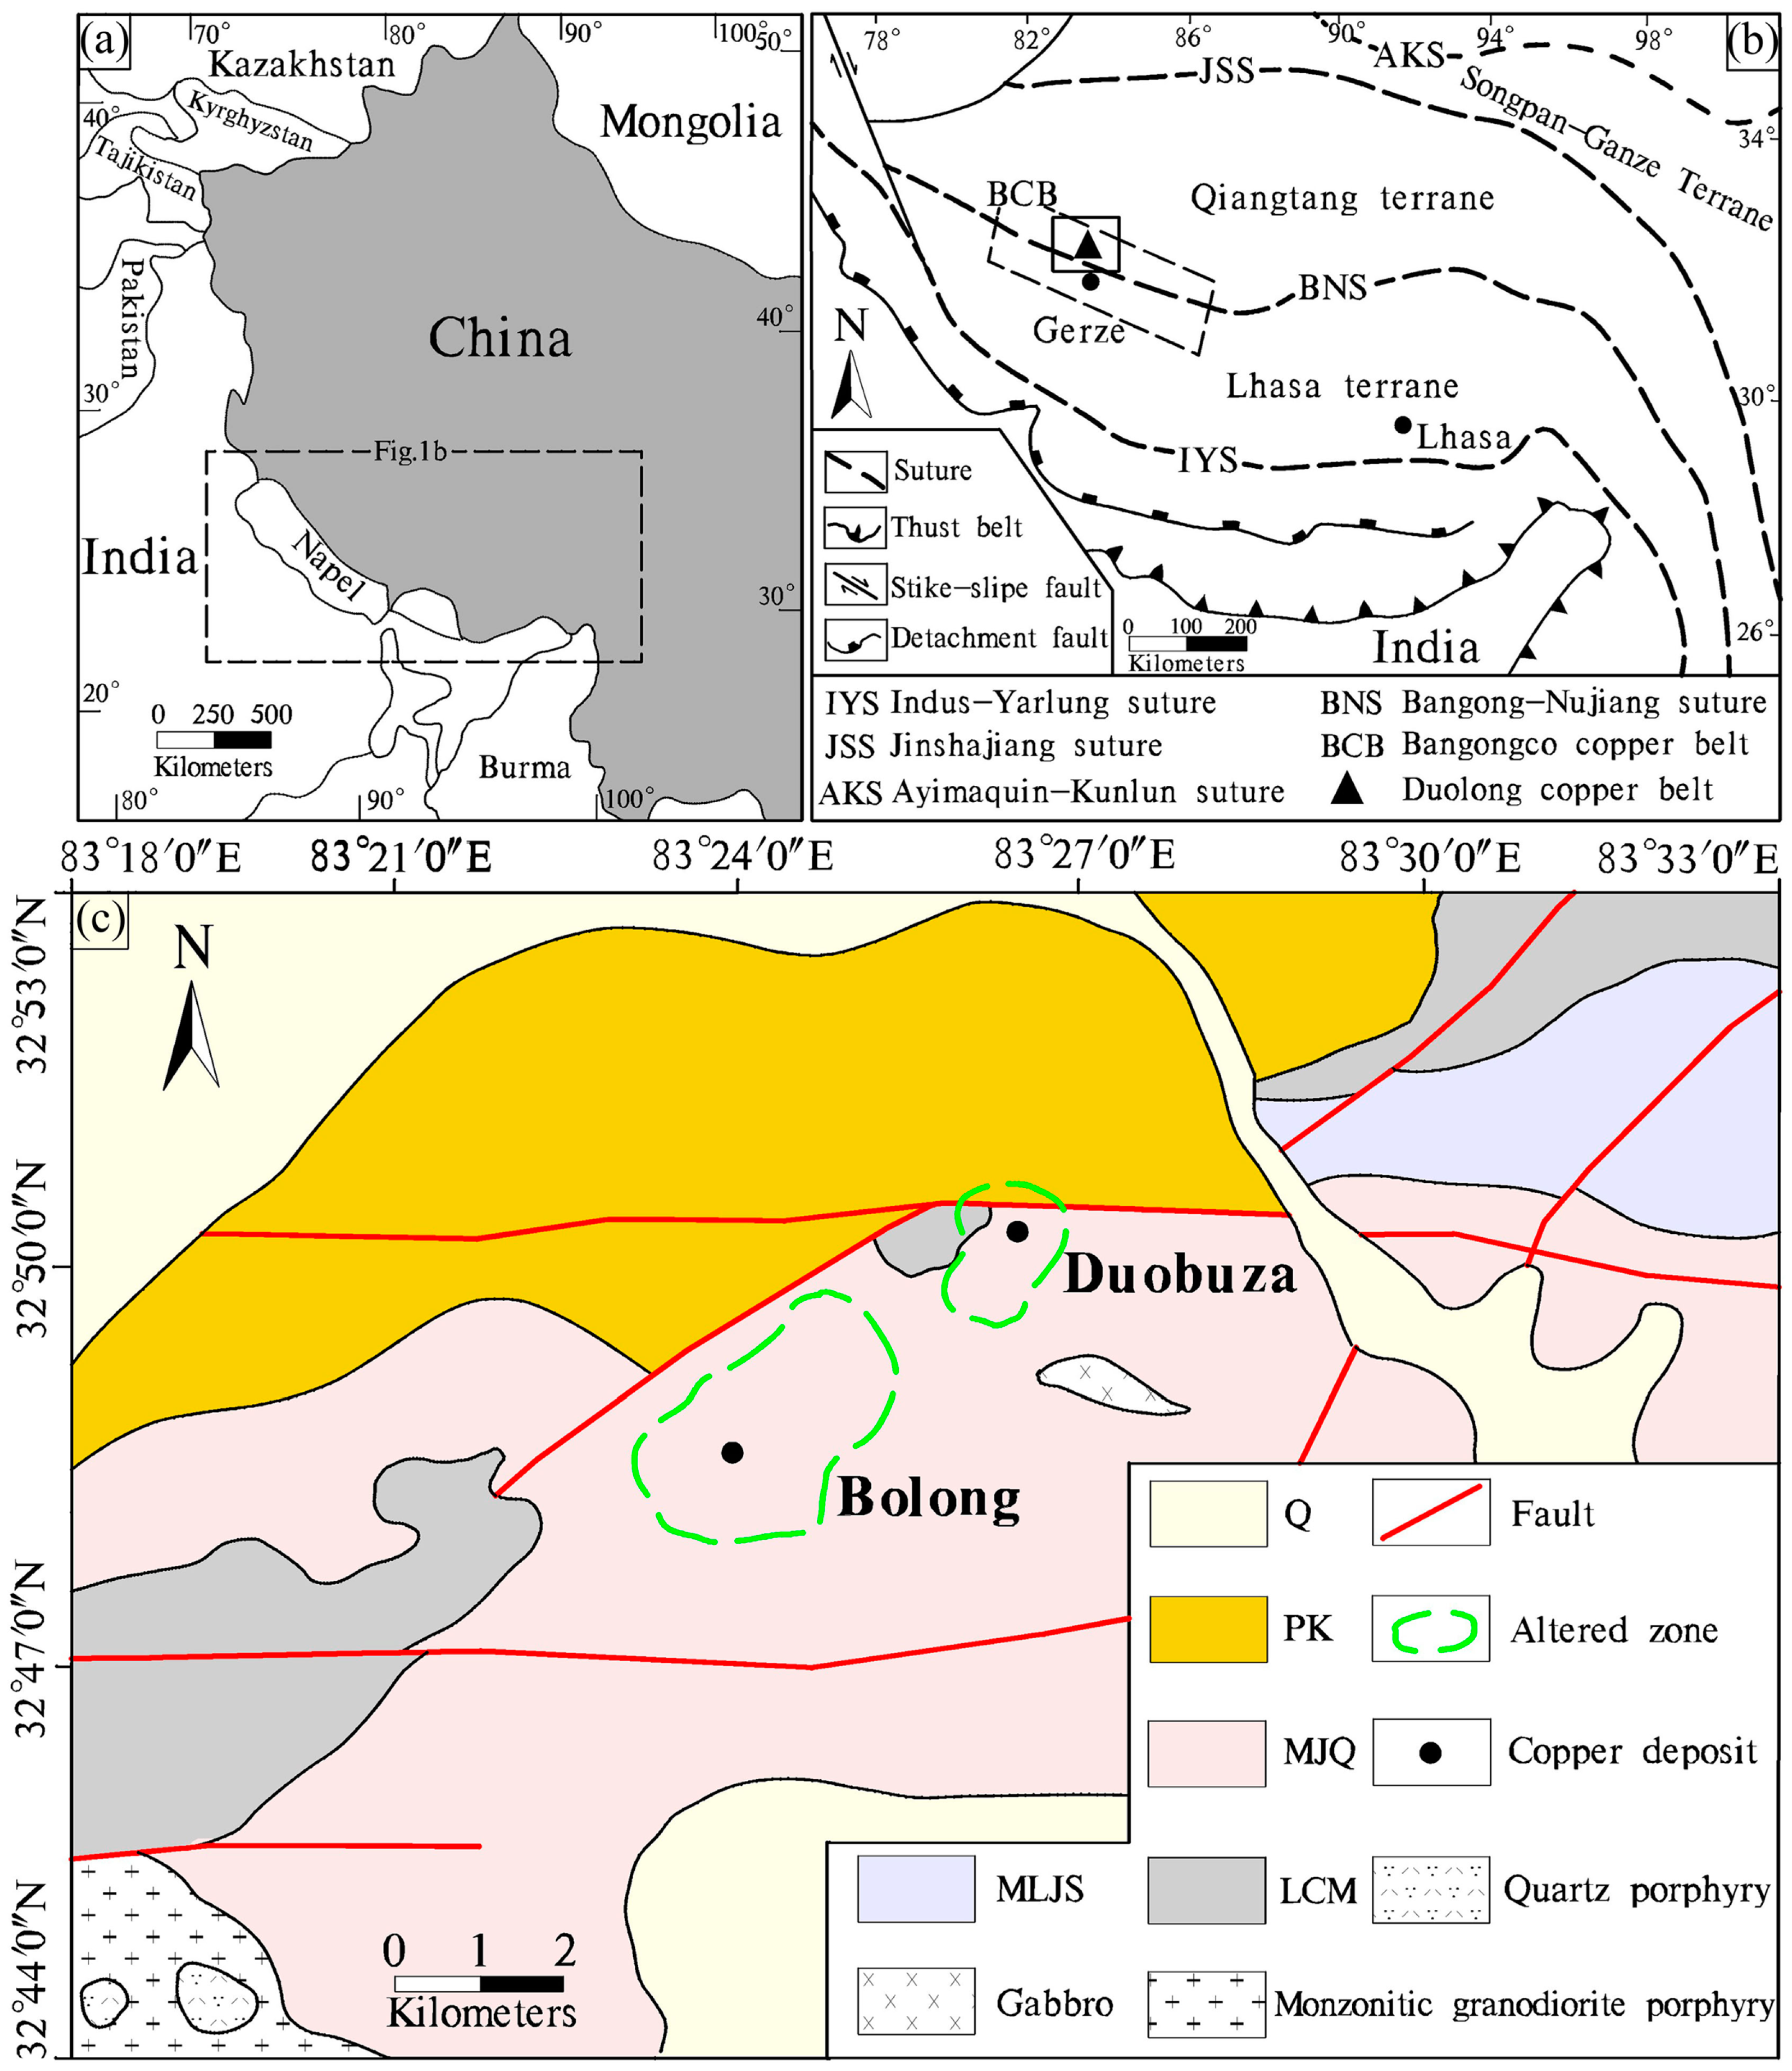
2. Geological Setting

The study area is located in the southwest of Gerze County of the A’li district in the Tibetan Plateau (Figure 1a), a depopulated zone with an altitude of about 4700–5300 m. Therefore, the natural geographical environment here is very harsh. The geotectonic region belongs to the western part of the Bangong Co-Nujiang River Suture zone (BNS, Figure 1b) [51]. Duobuza and Bolong porphyry Cu-Au deposits are situated in the study area, and are referred to together as the Duolong PCD (Figure 1c). In this region, the stratigraphy mainly consists of the Middle Jurassic Quse group (MJQ), the Middle-Lower Jurassic Sewa group (MLJS), the Late Cretaceous Meiriqie group (LCM), the Paleogene Kangtuo group (PK), and the Quaternary (Q) (Figure 1c) [11,14]. The regional intrusive rocks were mainly formed in the Middle-Late Yanshan period and all the mineralized porphyries are granodiorite porphyries.
Duobuza PCD with a core of mineralized porphyry is surrounded by multiple zones, including the potassic zone, pyritization-phyllic zone, argillic zone, and propylitic zone [11,52]. The pyritization-phyllic zone, argillic zone, and propylitic zone are exposed on the ground surface. As a result of superposed alteration zones, the argillic zone cannot be differentiated by the field investigations independently [52]. Bolong porphyry Cu-Au ore is a hidden deposit with unclear alteration zones on the ground surface that can be classified as an intensive pyritization–phyllic zone + argillic zone→weak pyritization-phyllic zone, and an undeveloped propylitic zone [53,54].

3. Data and Methods

3.1. Advanced Spaceborne Thermal Emission and Reflection Radiometer (ASTER) and L8’s Operational Land Imager (OLI) Data

The ASTER, which is aboard the Earth Observing System (EOS) Terra platform, records solar radiation in 14 spectral bands (Table 1). ASTER measures reflected radiation in three bands between 0.52 and 0.86 μm (VNIR) and in six bands from 1.6 to 2.43 μm (SWIR), with 15- and 30-m resolution respectively [56,57,58]. ASTER also has five bands in the thermal infrared (TIR) from 8.125 to 11.65 μm wavelengths. Each ASTER scene covers an area of 60 × 60 km.
L8, launched on 11 February 2013, is the eighth in the series of Landsat satellites [44]. L8 carries two sensors, the OLI and the Thermal Infrared Sensor (TIRS). The OLI collects image data for nine shortwave spectral bands over a 185 km swath with a 30 m spatial resolution for all bands, except for a 15 m panchromatic band (Table 1) [44]. The TIRS, which is not shown in Table 1, collects image data for two thermal bands with a 100 m resolution over a 185 km swath. The OLI design is similar to the Advanced Land Imager (ALI) that is included on Earth Observing 1 (EO-1), and represents a significant technological advancement of spectral resolution, signal quantization level and Signal-to-Noise ratio (SNR) over Landsat-7’s ETM+ sensor (Table 1) [45]. The spectral widths of several OLI bands are refined to avoid atmospheric absorption features within ETM+ bands. The biggest change occurs in OLI band 5 (0.845–0.885 μm) to exclude a water vapor absorption feature at 0.825 μm in the middle of the ETM+ near infrared band (band 4, 0.775–0.900 μm) [43]. Additionally, two new bands are specified for the OLI: a blue band (band 1, 0.433–0.453 μm), principally for ocean color observations in coastal zones, is similar to ALI’s band 1; and a shortwave infrared band (band 9, 1.360–1.390 μm) that falls over a strong water vapor absorption feature allows the detection of cirrus clouds within OLI images [43,45]. The ASTER TIR channels and L8 TIRS sensor are not analyzed in this study.

3.2. Integration of ASTER and L8 OLI Data

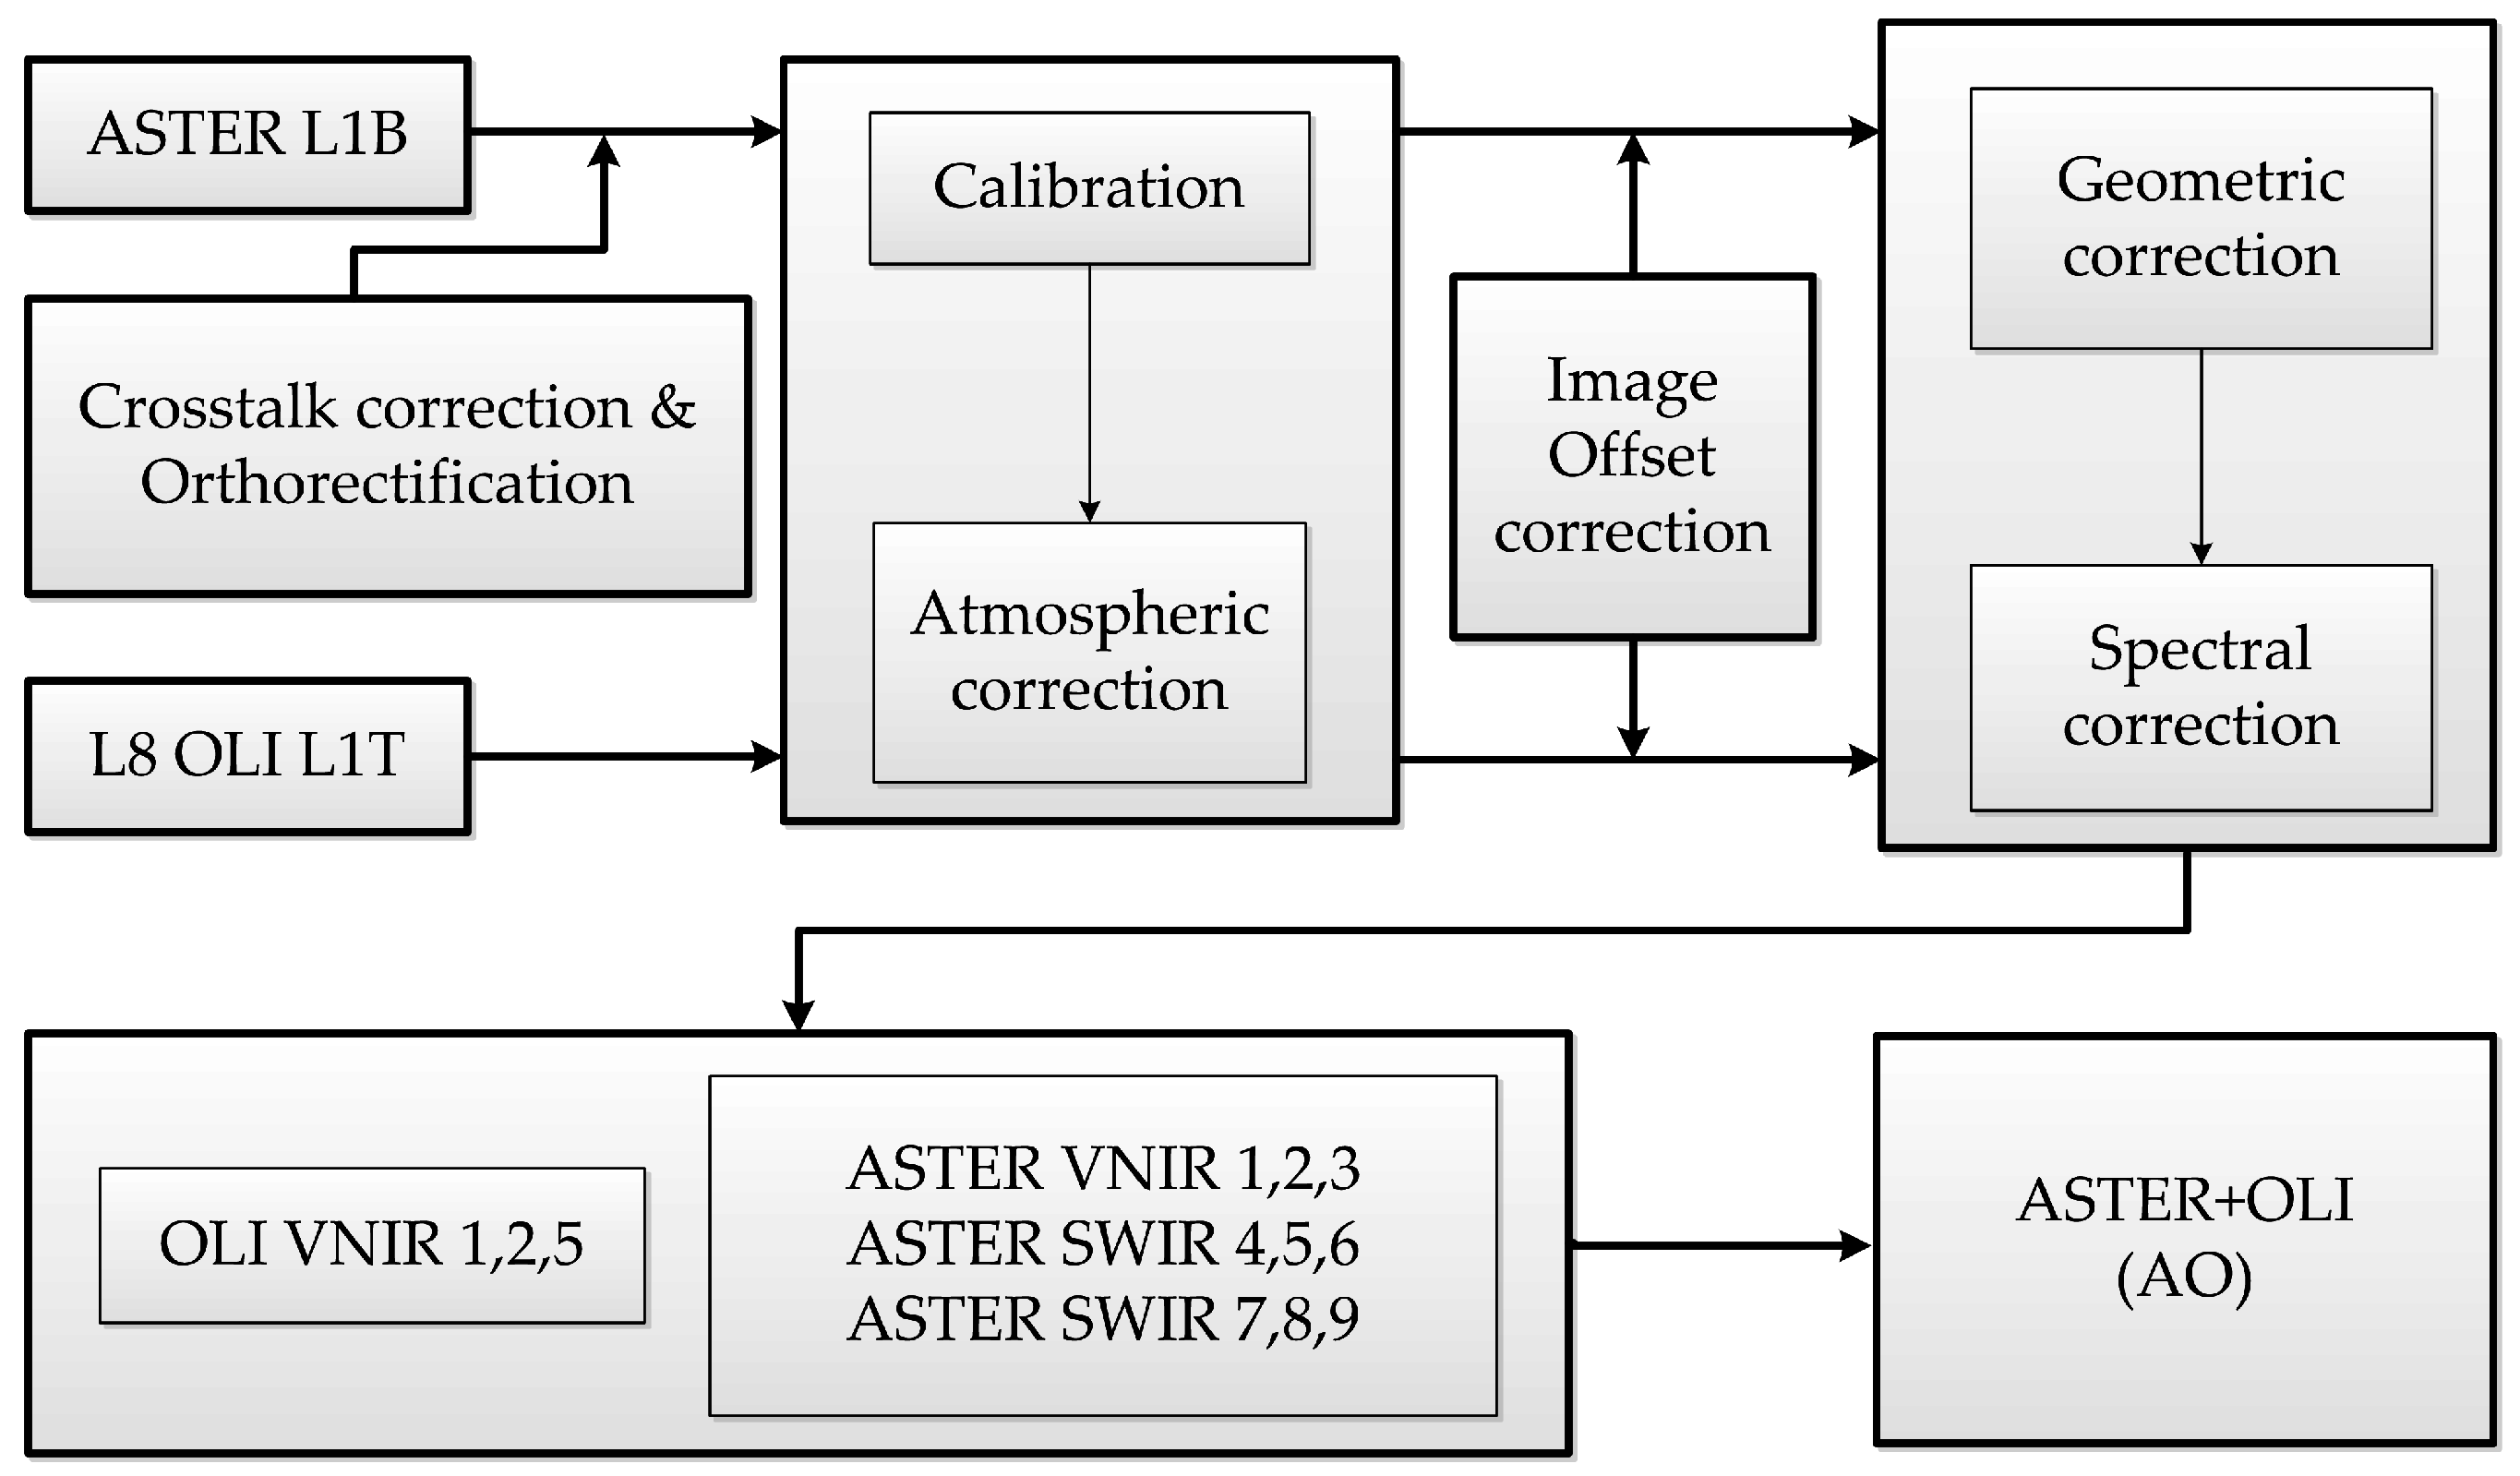
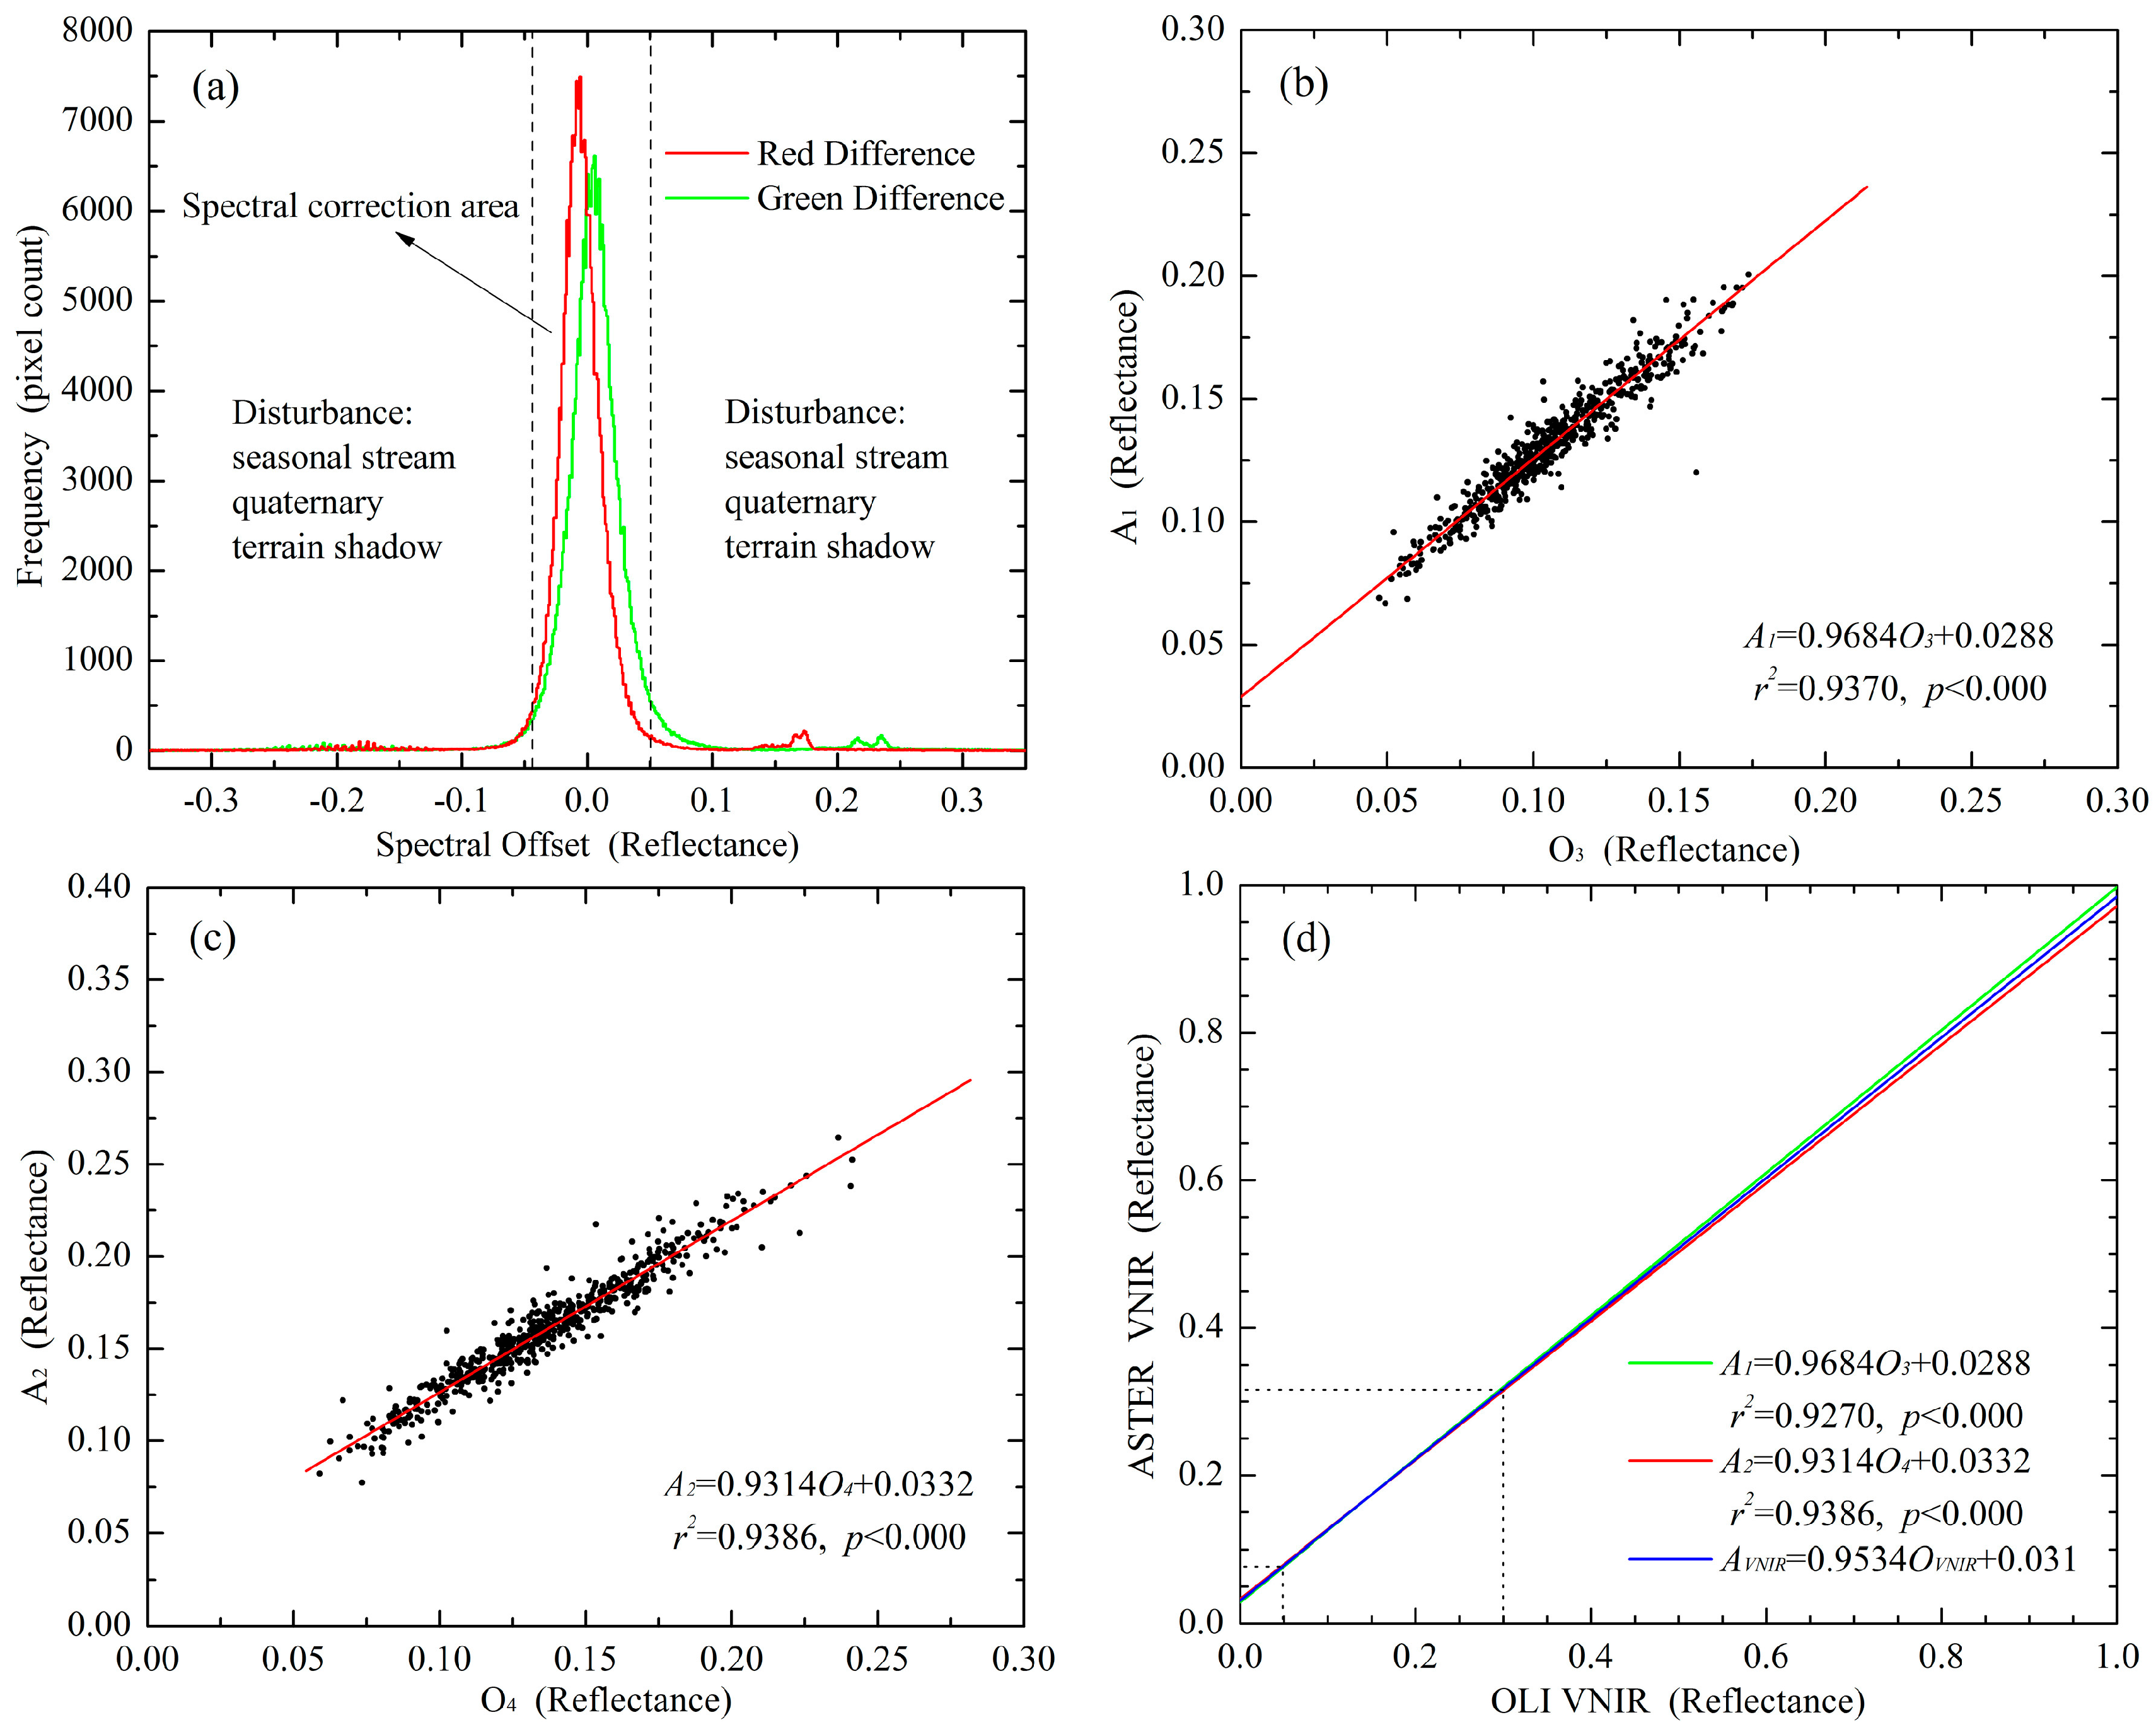
3.2.1. Pre-Processing of ASTER and OLI

The cloud-free level 1B (L1B) ASTER data recorded on 21 November 2006 and level 1T (L1T) L8 OLI data (path 143/row 37) recorded on 22 November 2015 are used for this study. The images were pre-georeferenced to UTM zone 44 North projection WGS–84 datum.
The pre-processing procedures are essential to obtain spatially and radiometrically corrected images in order to analyze and compare spectral data [59,60]. We followed the sequence of steps summarized in the flowchart of Figure 2. Instrumental crosstalk effects and atmospheric transmission are the chief issues for the ASTER SWIR bands [27,32,61]. The SWIR ASTER data are processed using the CCS (Crosstalk Correction Software) to reduce the crosstalk effect, which is anomalously high radiance in bands 5 and 9 due to transmission of energy from the band 4 optical elements to the adjacent band 5 and band 9 detectors [62]. Subsequently, the ASTER VNIR and SWIR bands are orthorectified by taking the ASTER global DEM (GDEM) as topographic base. At the same time, the 15 m resolution VNIR ASTER data are re-sampled to correspond to the SWIR 30 m spatial dimensions by using the nearest neighbor resampling method. Then the three VNIR bands of ASTER data are combined with the six SWIR bands to produce a nine-band ASTER image. Finally, the crosstalk-corrected nine-band ASTER image and L8 OLI image are calibrated to surface reflectance using the Fast Line-of-sight Atmospheric Analysis of Spectral Hypercubes (FLAASH) atmospheric correction model, which incorporates Moderate Resolution Transmittance (MODTRAN) radiation transfer code to remove the atmospheric attenuations to produce reflectance imagery.
Although the standard methods of CCS and FLAASH compensate for the error, residual errors remain which impact the accuracy of geological information products derived from the data [29,60]. The scene-based offset correction technique of two-band scattergrams is used to isolate (and extrapolate) the “dark pixels” (deep shade) for each band of ASTER and OLI data, which in theory should have a value of zero units [60,61]. Thus a spectral curve from each pixel of multispectral image can be derived for target detection, discrimination and classification [63].

3.2.2. ASTER+OLI (AO) Integration Methods

ASTER band 1 (A1, 0.52–0.60 μm) and OLI band 3 (O3, 0.525–0.600 μm) have almost equivalent wavelength regions and center wavelengths. Hence, theoretically, the surface object will have approximately equivalent reflectance in the same site of surface reflectance data of A1 and O3. Similar bands are ASTER band 2 (A2, 0.63–0.69 μm) and OLI band 4 (O4, 0.630–0.680 μm). As ASTER and OLI data come from different sensors and even different acquired phases, the systematic errors among sensors and the accidental errors of the data in the acquired process are likely to leadto the conclusion that the above inference is not established and hence results in certain deviation. The sensor pointing angle Ø = 0.93° (<1.5°) of the study area based on the nadir of the OLI data is calculated, which resulted in minimal cross-sensor geometric distortion and no need to correct for parallax [23]. The OLI data are geometrically corrected to match the ASTER data by means of “Image to Image” and using a second-degree polynomial warp with nearest neighbor resampling. In addition, the total root mean square (RMS) is controlled within 0.5 pixels (0.31 pixels). The study area is located in the high altitude zones of the Tibetan Plateau, wherein the rocks are exposed, the vegetation is sparse, the air is rare, and the acquired phase of the two kinds of data is similar. The seasonal differences can be neglected here.
Figure 3a is the histogram of differences between O3 and A1 (Green Difference), as well as differences between O4 and A2 (Red Difference). The result shows that the main information of the two differences is equally distributed in the −0.05–0.05 intervals with 0 as the center which is dominated by exposed rocks and also the target area of alteration mineral mapping. There is only a little information in the ~−0.05 and 0.05~ intervals, where the information is mainly made up of the ephemeral streams, the quaternary system and the terrain shadows. The information in these regions is called the disturbance information. The effects of disturbance information can be wiped out when the MASK is created by setting up a reasonable threshold with the help of the difference histogram. The histogram of differences also shows that there are few spectral differences between ASTER and OLI data in the target area (Figure 3a, spectral offset in −0.05–0.05) of mineral mapping.
A picture of two-dimensional scatterplots of remote sensing image is the best graphic way to convey the structural information of spectral space of the two bands. It objectively shows the combined distribution of the pixel value of the two images. When a high linear correlation is observed between the two bands, their two-dimensional spectral spaces are generally presented as a single ellipse type. Such a distribution shows that the spectral features of various surface objects are similar and that the spectral curve shape is also similar though only certain differences for spectral value exist [64]. Figure 3b,c are the two-dimensional scatterplots of O3 and A1, as well as O4 and A2. The results show that there is a high linear correlation between O3 and A1 (Equation (1)), and also between O4 and A2 (Equation (2)). The reflectance of A1 and A2 focuses on the region of 0.07–0.32, whereas that of O3 and O4 focuses on 0.05–0.3 (Figure 3d). A certain degree of divergence with the increase of reflectance of the two bands has appeared (Figure 3d). When the reflectance is over 0.8, the reflectance divergence of the two bands becomes large (Figure 3d). However, the reflectance of alteration minerals in the study area is generally less than 0.6 in the VNIR spectral region. The mean linear regression Equation (3) of Equations (1) and (2) will be regarded as the statistical model of spectral correction for ASTER and OLI data in the VNIR spectral region.
A1 = 0.9684 × O3 + 0.0288, r2 = 0.9370, p < 0.000
A2 = 0.9314 × O4 + 0.0332, r2 = 0.9386, p < 0.000
AVNIR = 0.9534 × OVNIR + 0.031
In the six SWIR ASTER bands carbonate, hydrate and hydroxide mineral spectra display molecular absorption features related to overtones and combination tones [65]. Thus, the six SWIR ASTER bands are useful for discrimination between clays and sulfate-bearing minerals, such as kaolinite, smectite, alunite, and jarosite [39,66]. Furthermore, OLI is especially useful for discriminating among ferric iron-bearing minerals with the five VNIR bands. Finally, we choose the ASTER VNIR bands 1–3 and OLI VNIR bands 1, 2, 5 and ASTER SWIR bands 4–9 to produce a 12-channel reflectance image cube, referred to herein as ASTER + OLI (AO). Figure 2 summarizes the integration process of ASTER and L8 OLI data.
Thus, the AO data is composed of the 12-channel reflectance image cube of six VNIR bands (0.433–0.88 μm) and six SWIR bands (1.60–2.430 μm) (Table 2).

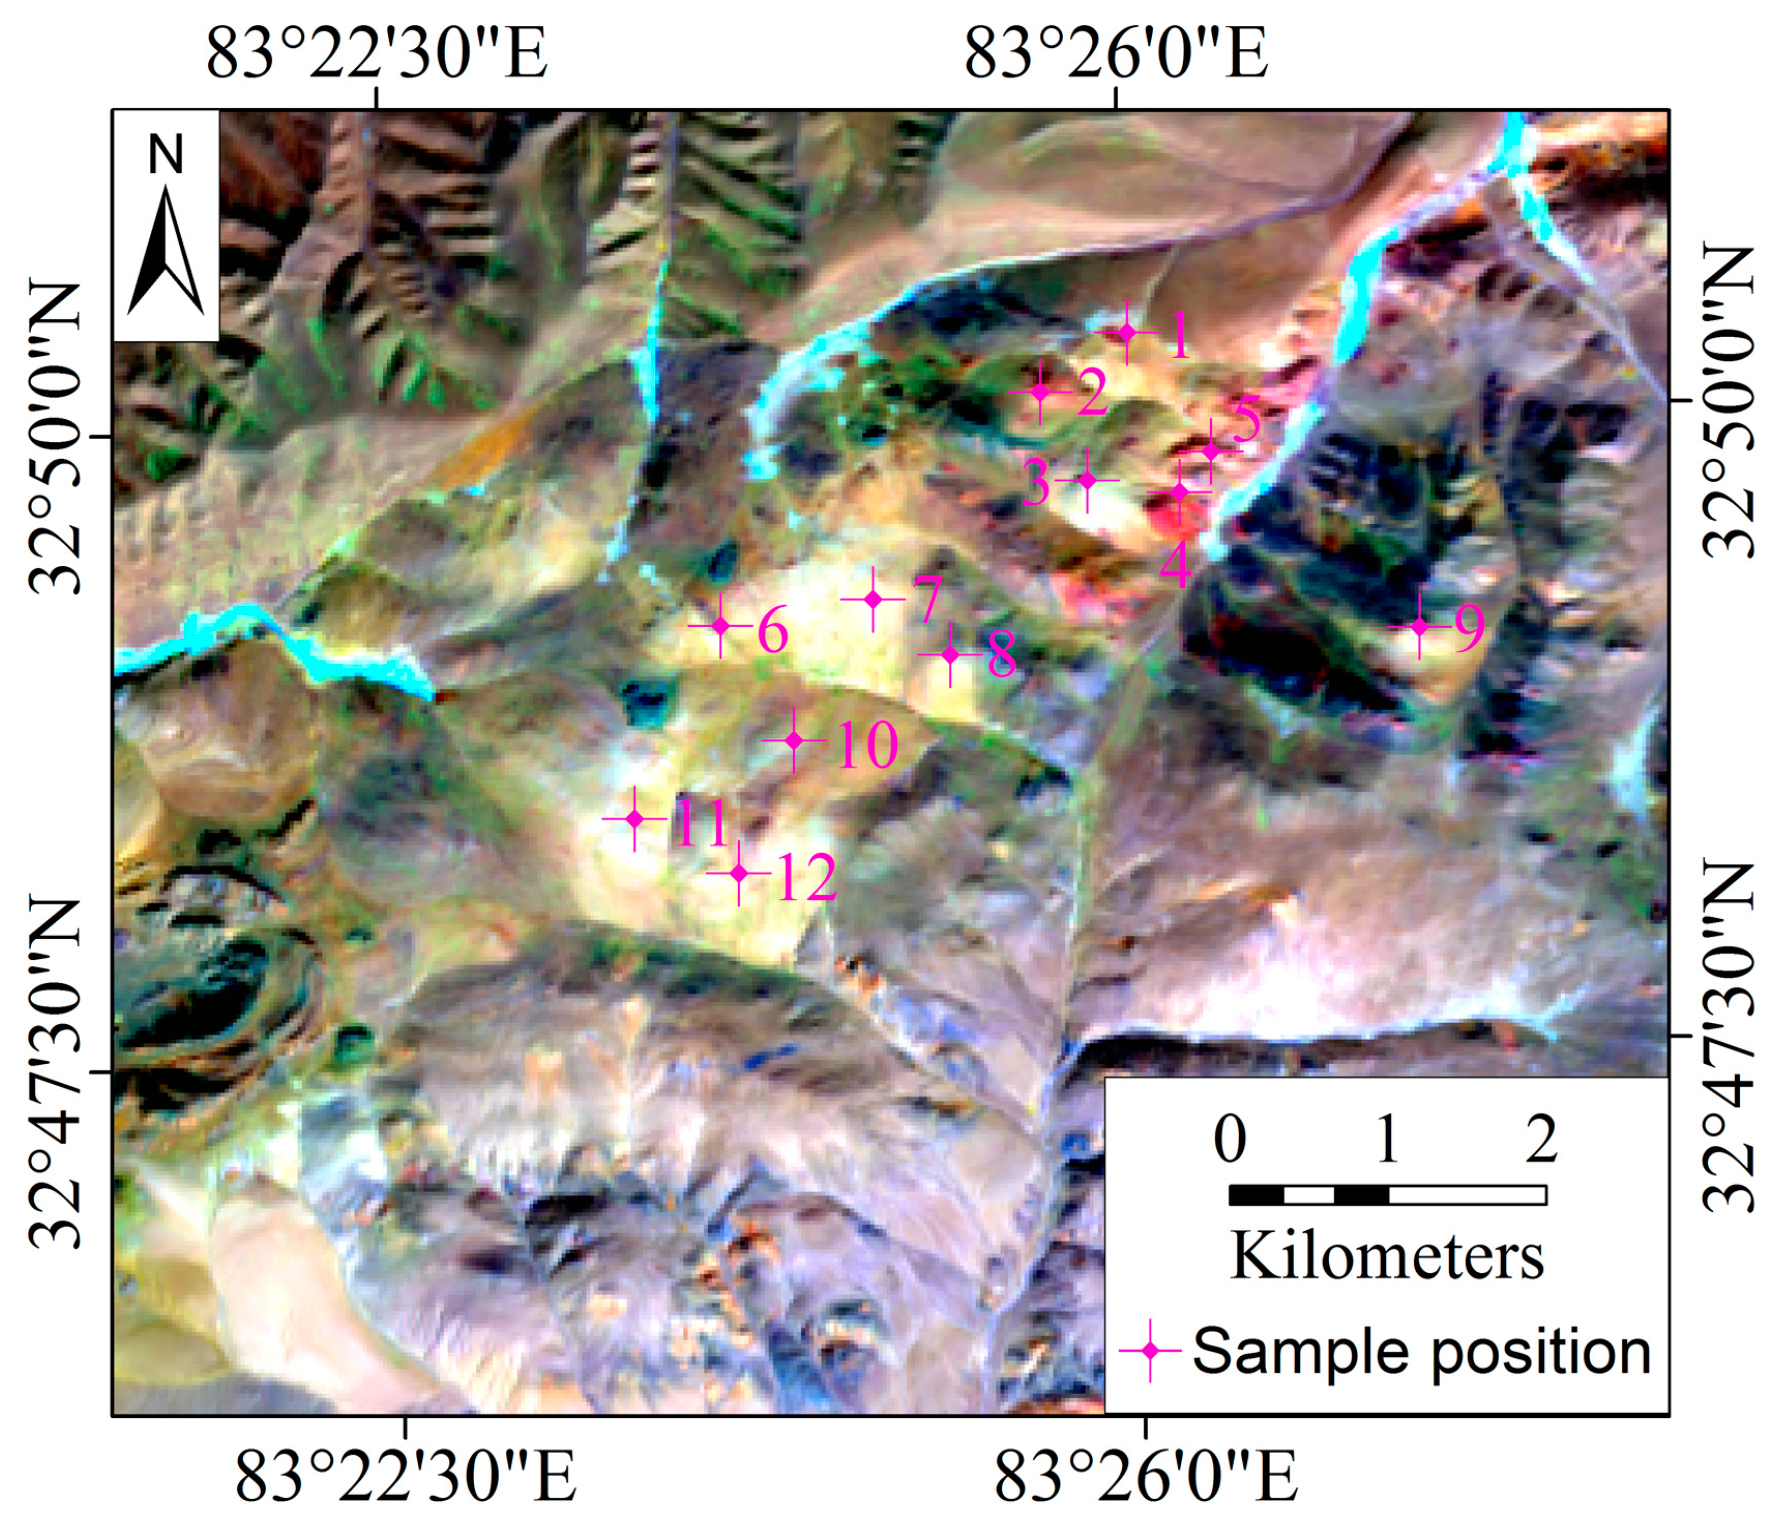
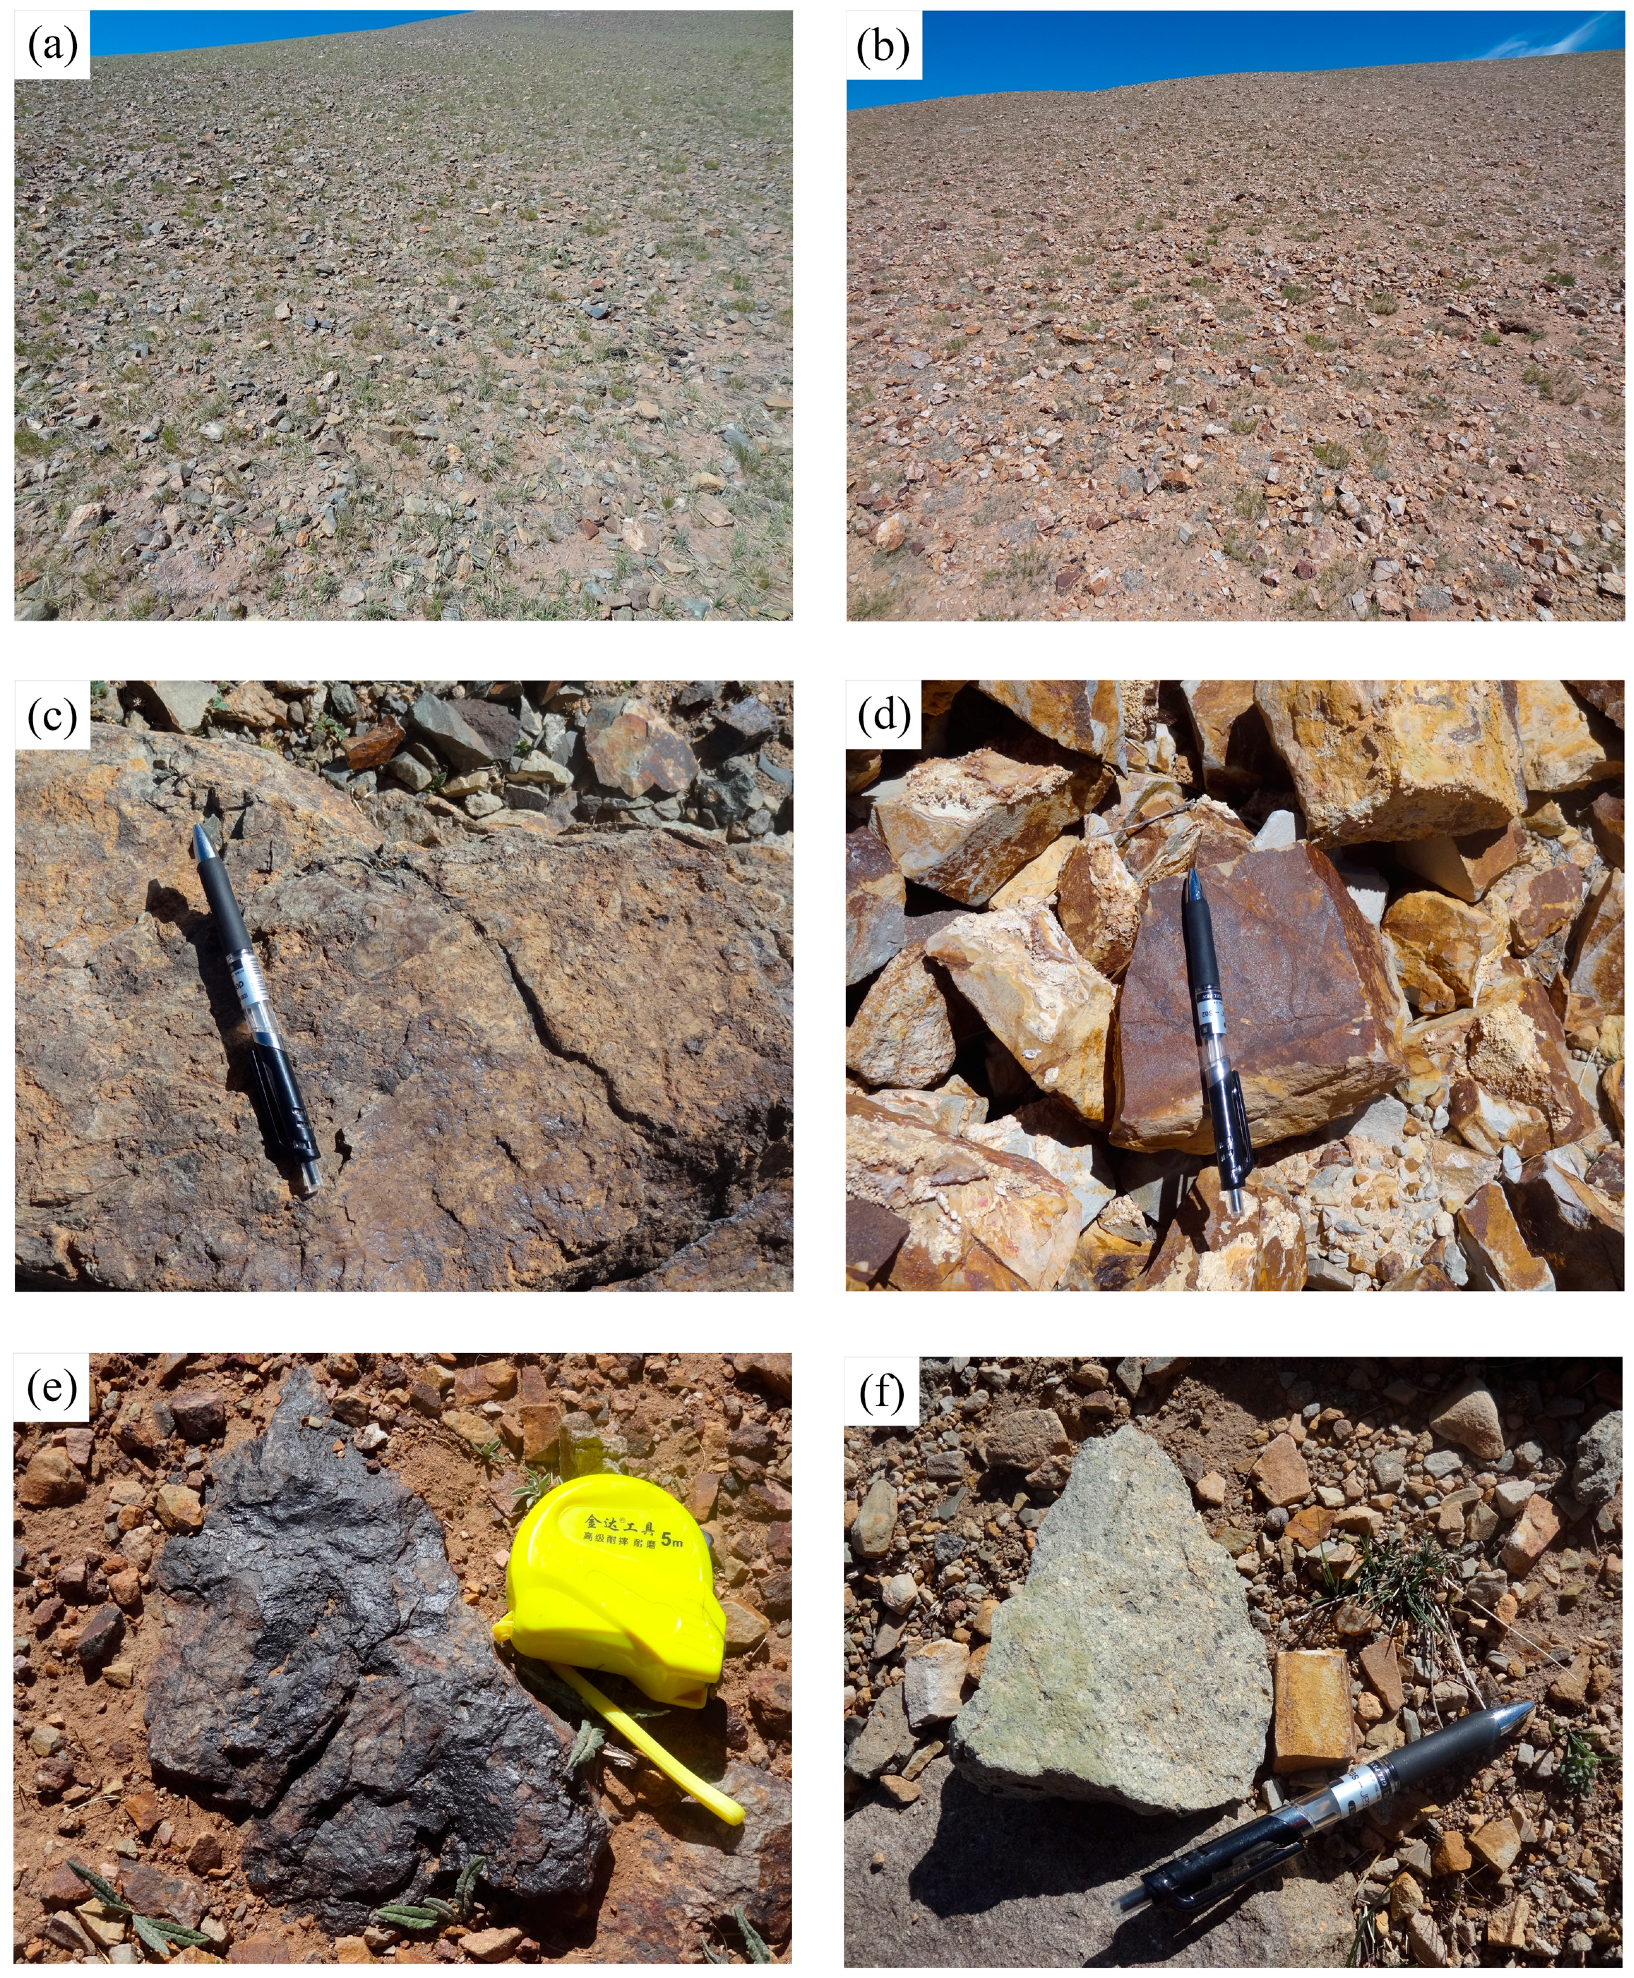
3.3. Spectral Measurements

Spectral reflectance measurements were made in the field during July 2013, using a portable spectral radiometer, “SVC HR 1024,” which records 1024 channels throughout the 0.35 to 2.50 μm wavelength range. Reflectance spectra were obtained from 12 samples distributed in and out of altered zones (Figure 4), and then resampled to the ASTER and AO bandpasses respectively. Table 3 shows the alteration zones and alteration minerals or granite of 12 samples.

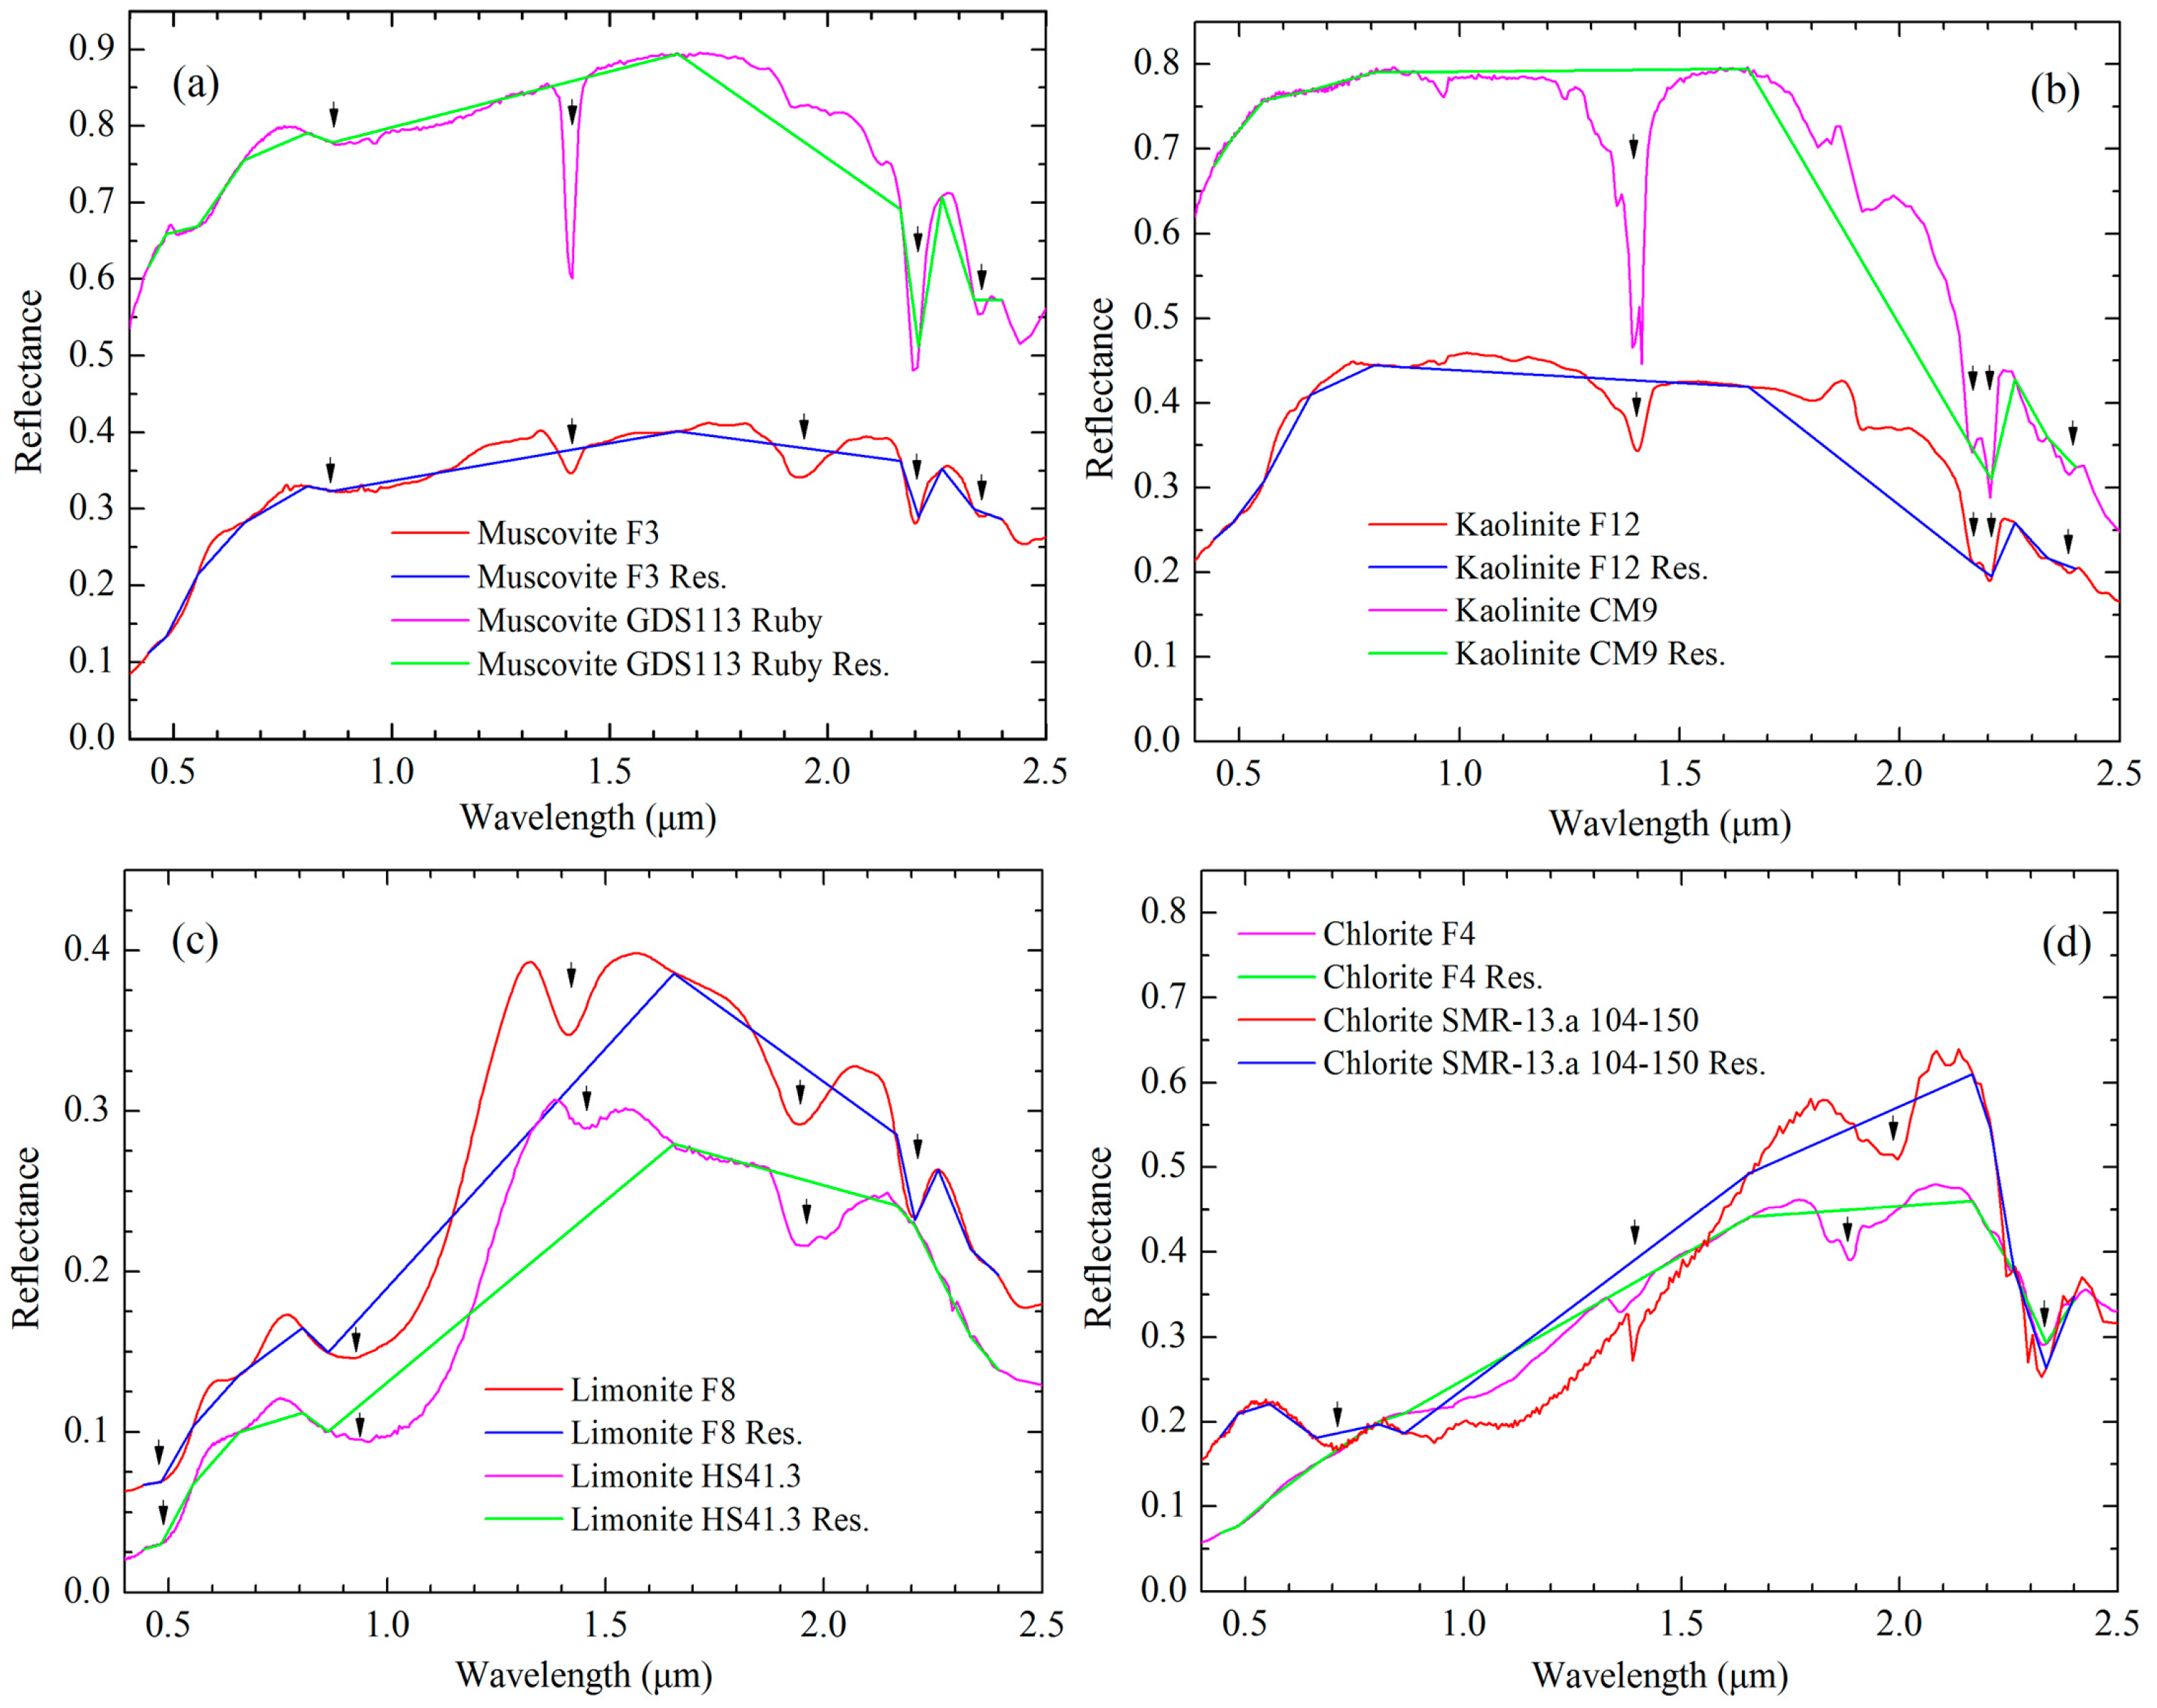
3.4. Spectral Properties

Porphyry copper deposits are typically characterized by hydrothermal alteration mineral zones such as the phyllic, argillic, potassic, and propylitic zones [67]. A core of quartz and potassium-bearing minerals is surrounded by multiple zones that contain clay and other hydroxyl-bearing minerals with diagnostic spectral absorption properties in the VNIR and SWIR portions of the electromagnetic spectrum [30,68]. At the same time, an oxide zone is developing over many of the porphyry bodies, which are rich in iron oxide minerals [42].
The spectra of field samples from the Duolong PCD surface-exposed alteration assemblage are compared with the USGS Spectral Library for minerals (USGS-SL) loaded in the Environment for Visualizing Images (ENVI) 5.1 software, resampled to AO spectral resolution. The spectra selection of USGS-SL is the particle size of the minerals in this study. The chosen range of the mineral particles is 125–500 μm [69], which offers reflectance characteristics of key alteration minerals, including muscovite, kaolinite and chlorite, as well as related Fe-rich gossans (e.g., limonite) (Figure 5).
Overall, the spectra of field samples and USGS-SL have different reflectance levels, but similar reflectance curves. The phyllitic alteration zone contains abundant muscovite (sericite), which exhibits an intense Al-OH absorption feature near 2.20 μm, as well as a secondary feature near 2.35 μm and 2.45 μm [48,49] (Figure 5a). The position of the muscovite absorption feature near 2.20 μm and 2.45 μm coincides with AO band 9 and band 11 respectively. Kaolinite (Figure 5b) and alunite are typical constituents of argillic alteration with Al-OH 2.165 μm and 2.20 μm absorption features.
The ferric oxyhydroxide minerals, goethite and hematite (and their amorphous, hydrous equivalents, commonly called ‘limonite’) have strong electronic absorptions in the VNIR spectral region, including crystal field feature that ranges from 0.87 μm for hematite to 0.93 μm for goethite [70] (Figure 5c).
Chlorite is a characteristic mineral for the propylitic alteration zone of porphyry deposits. Chlorite displays a small feature at 2.25 μm and a stronger feature near 2.33 μm, both of which change in wavelength depending on the chlorite-Mg number (coinciding with AO band 11) (Figure 5d). The strength and position of these absorptions vary due to the chlorite composition in terms of Mg-chlorite to Fe-chlorite [49]. In addition, the muscovite has a narrow single absorption feature near 2.16–2.26 μm (Figure 5a), and the kaolinite has a characteristic doublet feature with its main absorptions at 2.16 and 2.206 μm [71] (Figure 5b). The VNIR bands are the main bands to discriminate the limonite and muscovite. The limonite has two absorption features near 0.50 μm and 0.90 μm (Figure 5c), whereas the muscovite does not. The field spectrum of limonite shows an absorption feature near 2.20 μm, because of the impact of the muscovite in the pyrite-phyllic zone (Figure 5c).

3.5. Hydrothermal Alteration Mineral Mapping Methods

The Band Ratio (BR) technique [72], Relative Band Depth (RBD) procedure [73] and Mixture Tuned Marched Filtering (MTMF) [74] (Table 4) are used for ASTER and AO data to map the hydrothermal alteration minerals associated with alteration zones of Duolong PCD.
BR technique is used to enhance the spectral contrast of specific absorption features between bands and reduce the shadow effects caused by topography. Previous studies have noted that BRs and RBDs are also useful for normalizing the atmospheric and seasonal illumination differences between scenes [32,60,75]. Higher values for the results of BRs and RBDs are indicative of deeper spectral absorption features [60], and we assume it to be the targeted minerals with thresholds. The thresholds are determined by checking the spectral signatures of the resulting image anomalies and combined with the generalized geologic map and field investigations of Duolong PCD.
MTMF is a partial sub-pixel method that combines the strength of the matched filtering (MF) method with physical constraints imposed by mixing theory [38,74]. The data are analyzed using a standardized approach of linear transformation utilizing the Minimum Noise Fraction (MNF) [35] transformation to whiten noise, followed by MTMF [76]. The MTMF result consists of two images of “Matched Filter Score” and “Infeasibility Image” that are used to identify minerals. The MF images help to estimate relative degree of match to the reference spectrum and the approximate pixel abundance with values from zero to one. The infeasibility results are in noise sigma units and indicate the feasibility of the MF results. Then the predominant materials and its pixel abundance are determined by using the combined criteria of high MF and low infeasibility scores [38,77].
Before applying the mineral mapping techniques, the green vegetation, deep shadows, and water bodies are masked out to remove complicating effects. Table 3 shows the list of BRs, RBDs and MTMF designed to estimate Al-OH, Mg-OH, ferric iron and ferrous iron abundance.

4. Results and Discussions

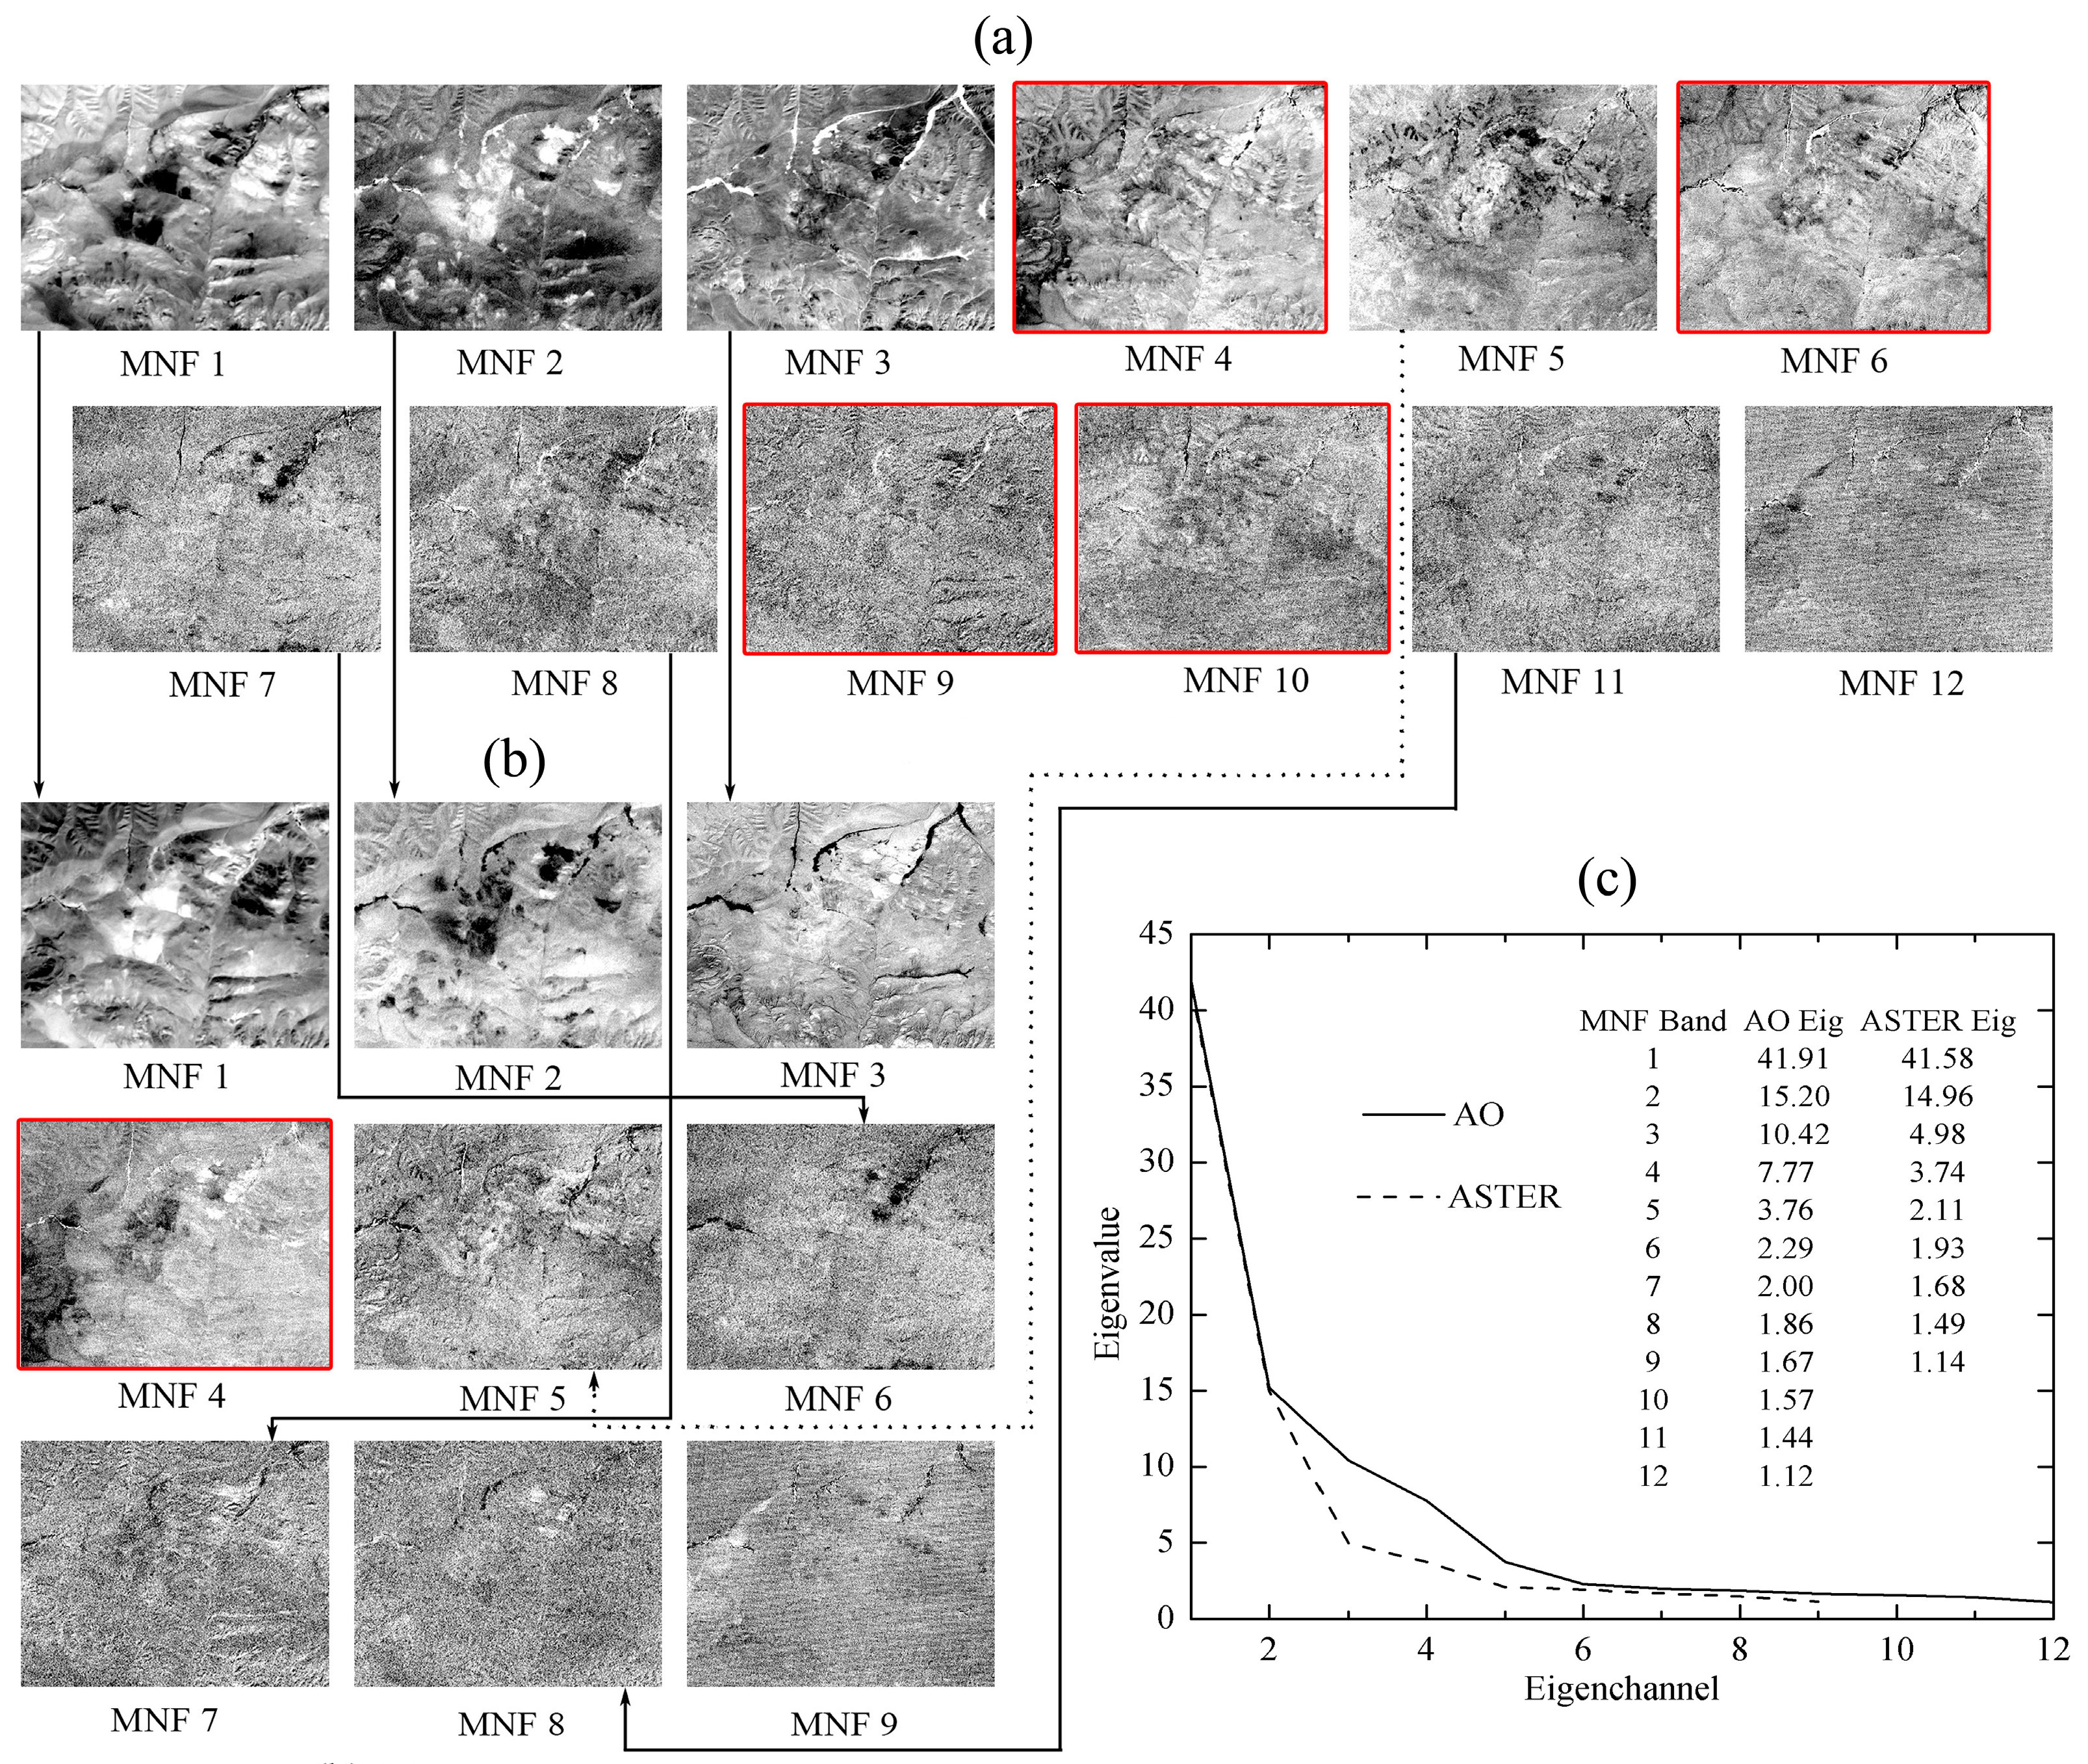
4.1. Minimum Noise Fraction (MNF) Transform

For the purposes of this study, the AO and ASTER data are subsetted to an appropriate area of Duolong PCD (Figure 4). MNF is a variation of the Principal Component Analysis (PCA) procedure, designed to relegate spatially incoherent noise to higher-order channels that can be excluded from subsequent analyses [37,79]. MNF is performed to the two datasets to determine the inherent dimensionality of the image data to segregate noise and reduce the computational requirements for subsequent processing [79]. Besides its usefulness for spectral endmember selection, the MNF procedure also can be used to study the information dimensionality of remote sensing datasets [37]. The eigenvalue of each MNF-transformed channel provides a measure of its information content, with progressively noisier channels approaching eigenvalues near zero [80,81]. As common practice, MNF components with eigenvalues less than 1.25 [37,80] are usually excluded from the data as noise in order to improve the subsequent spectral processing results. In this study, we focus on the eigenvalues greater than 1.25 for all of the MNF-transformed bands.
After applying the MNF technique to AO and ASTER subset data, 12 MNF images of AO (Figure 6a) and nine MNF images of ASTER (Figure 6b) are apparent. A plot of eigenvalues versus MNF band number (Figure 6c) shows a sharp falloff in eigenvalue magnitude between 1 and 12 for AO and between 1 and 9 for ASTER. According to the threshold valve of 1.25, from Figure 6c it can be seen that the last AO eigenchannel 12 and the last ASTER eigenchannel 9 contain little spectral information. The actual data dimensionality is usually determined by comparing both the eigenvalue plots (Figure 6c) and the MNF images for each dataset (Figure 6a,b). In the case of AO, the MNF analysis indicates a dimensionality of approximately 11. The ASTER exhibits dimensionality of approximately 8. The MNF results of AO and ASTER data can be visually assessed below (Figure 6): AO MNF 1 = negative ASTER MNF 1 (both related to albedo and/or topographic illumination), AO MNF 2 = negative ASTER MNF 2, AO MNF 3 = negative ASTER MNF 3, AO MNF 7 = ASTER MNF 6, AO MNF 8 = negative ASTER MNF 7, AO MNF 11 = negative ASTER MNF 8 and AO MNF 5 ≈ ASTER MNF 5. Thus there are another three AO MNF bands versus one ASTER MNF band.
Overall, it indicates that the combination of ASTER and L8 OLI data (AO) has more mineral information content than either alone.

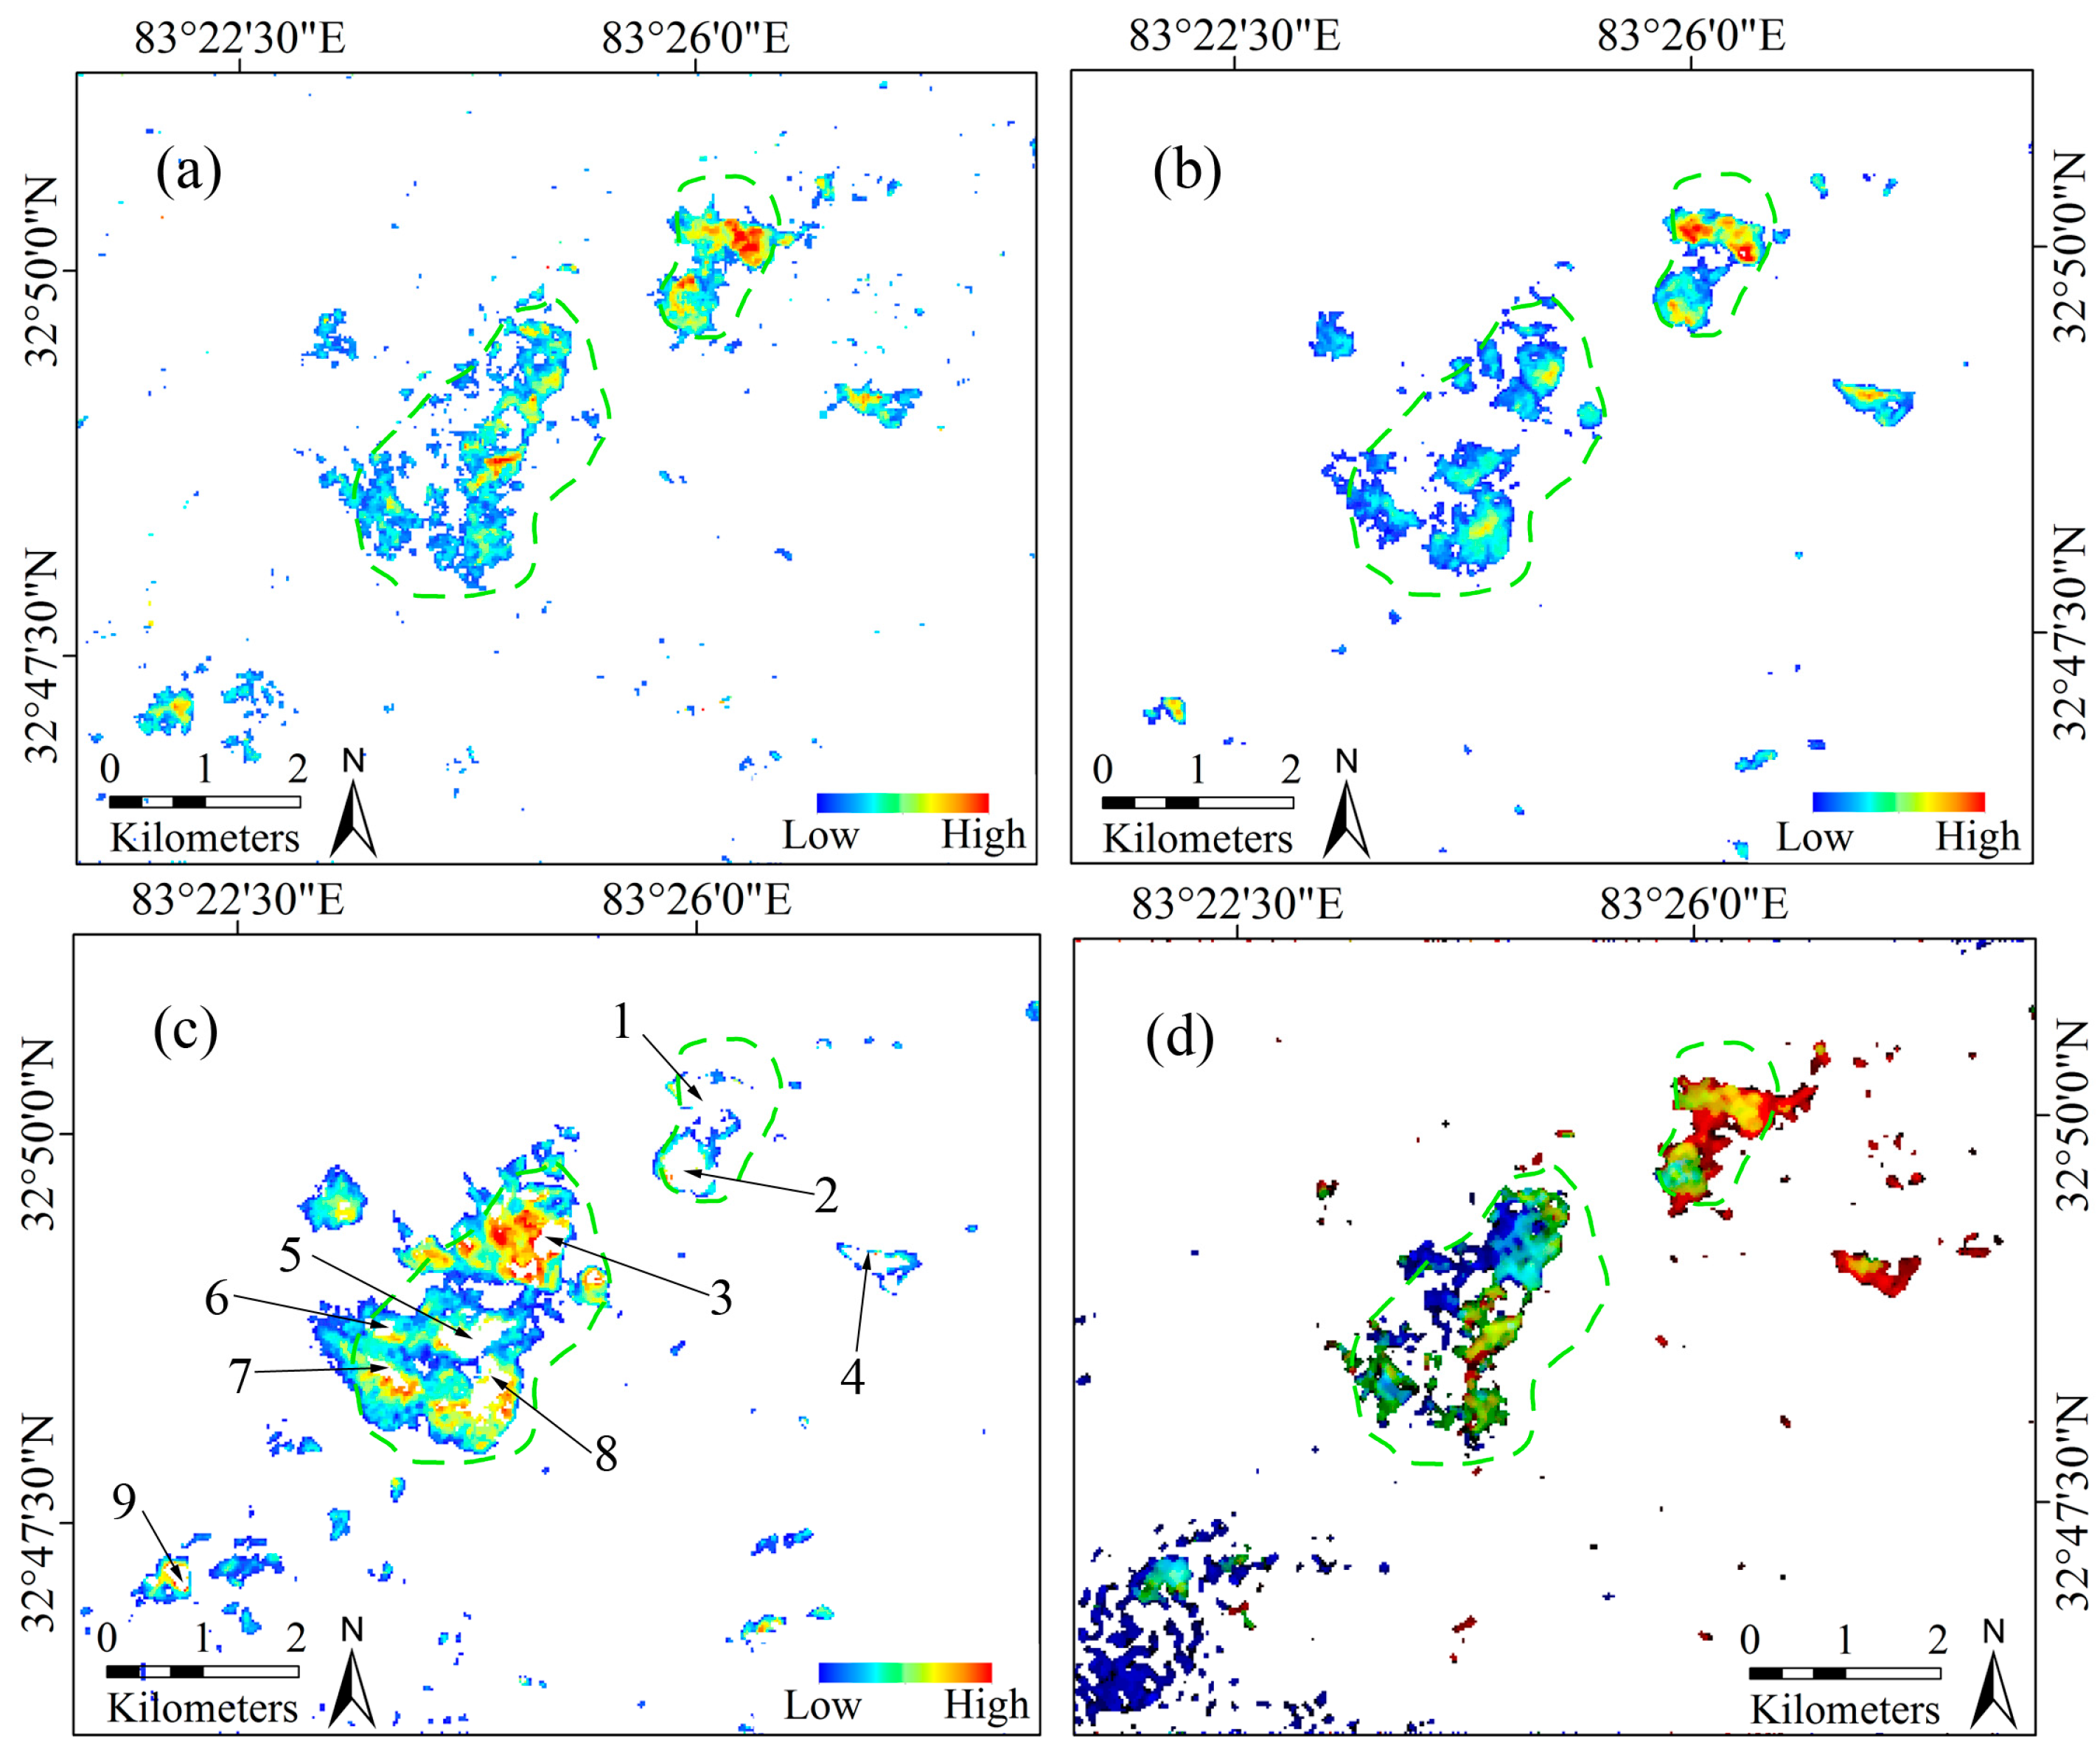
4.2. Mineral Mapping Results

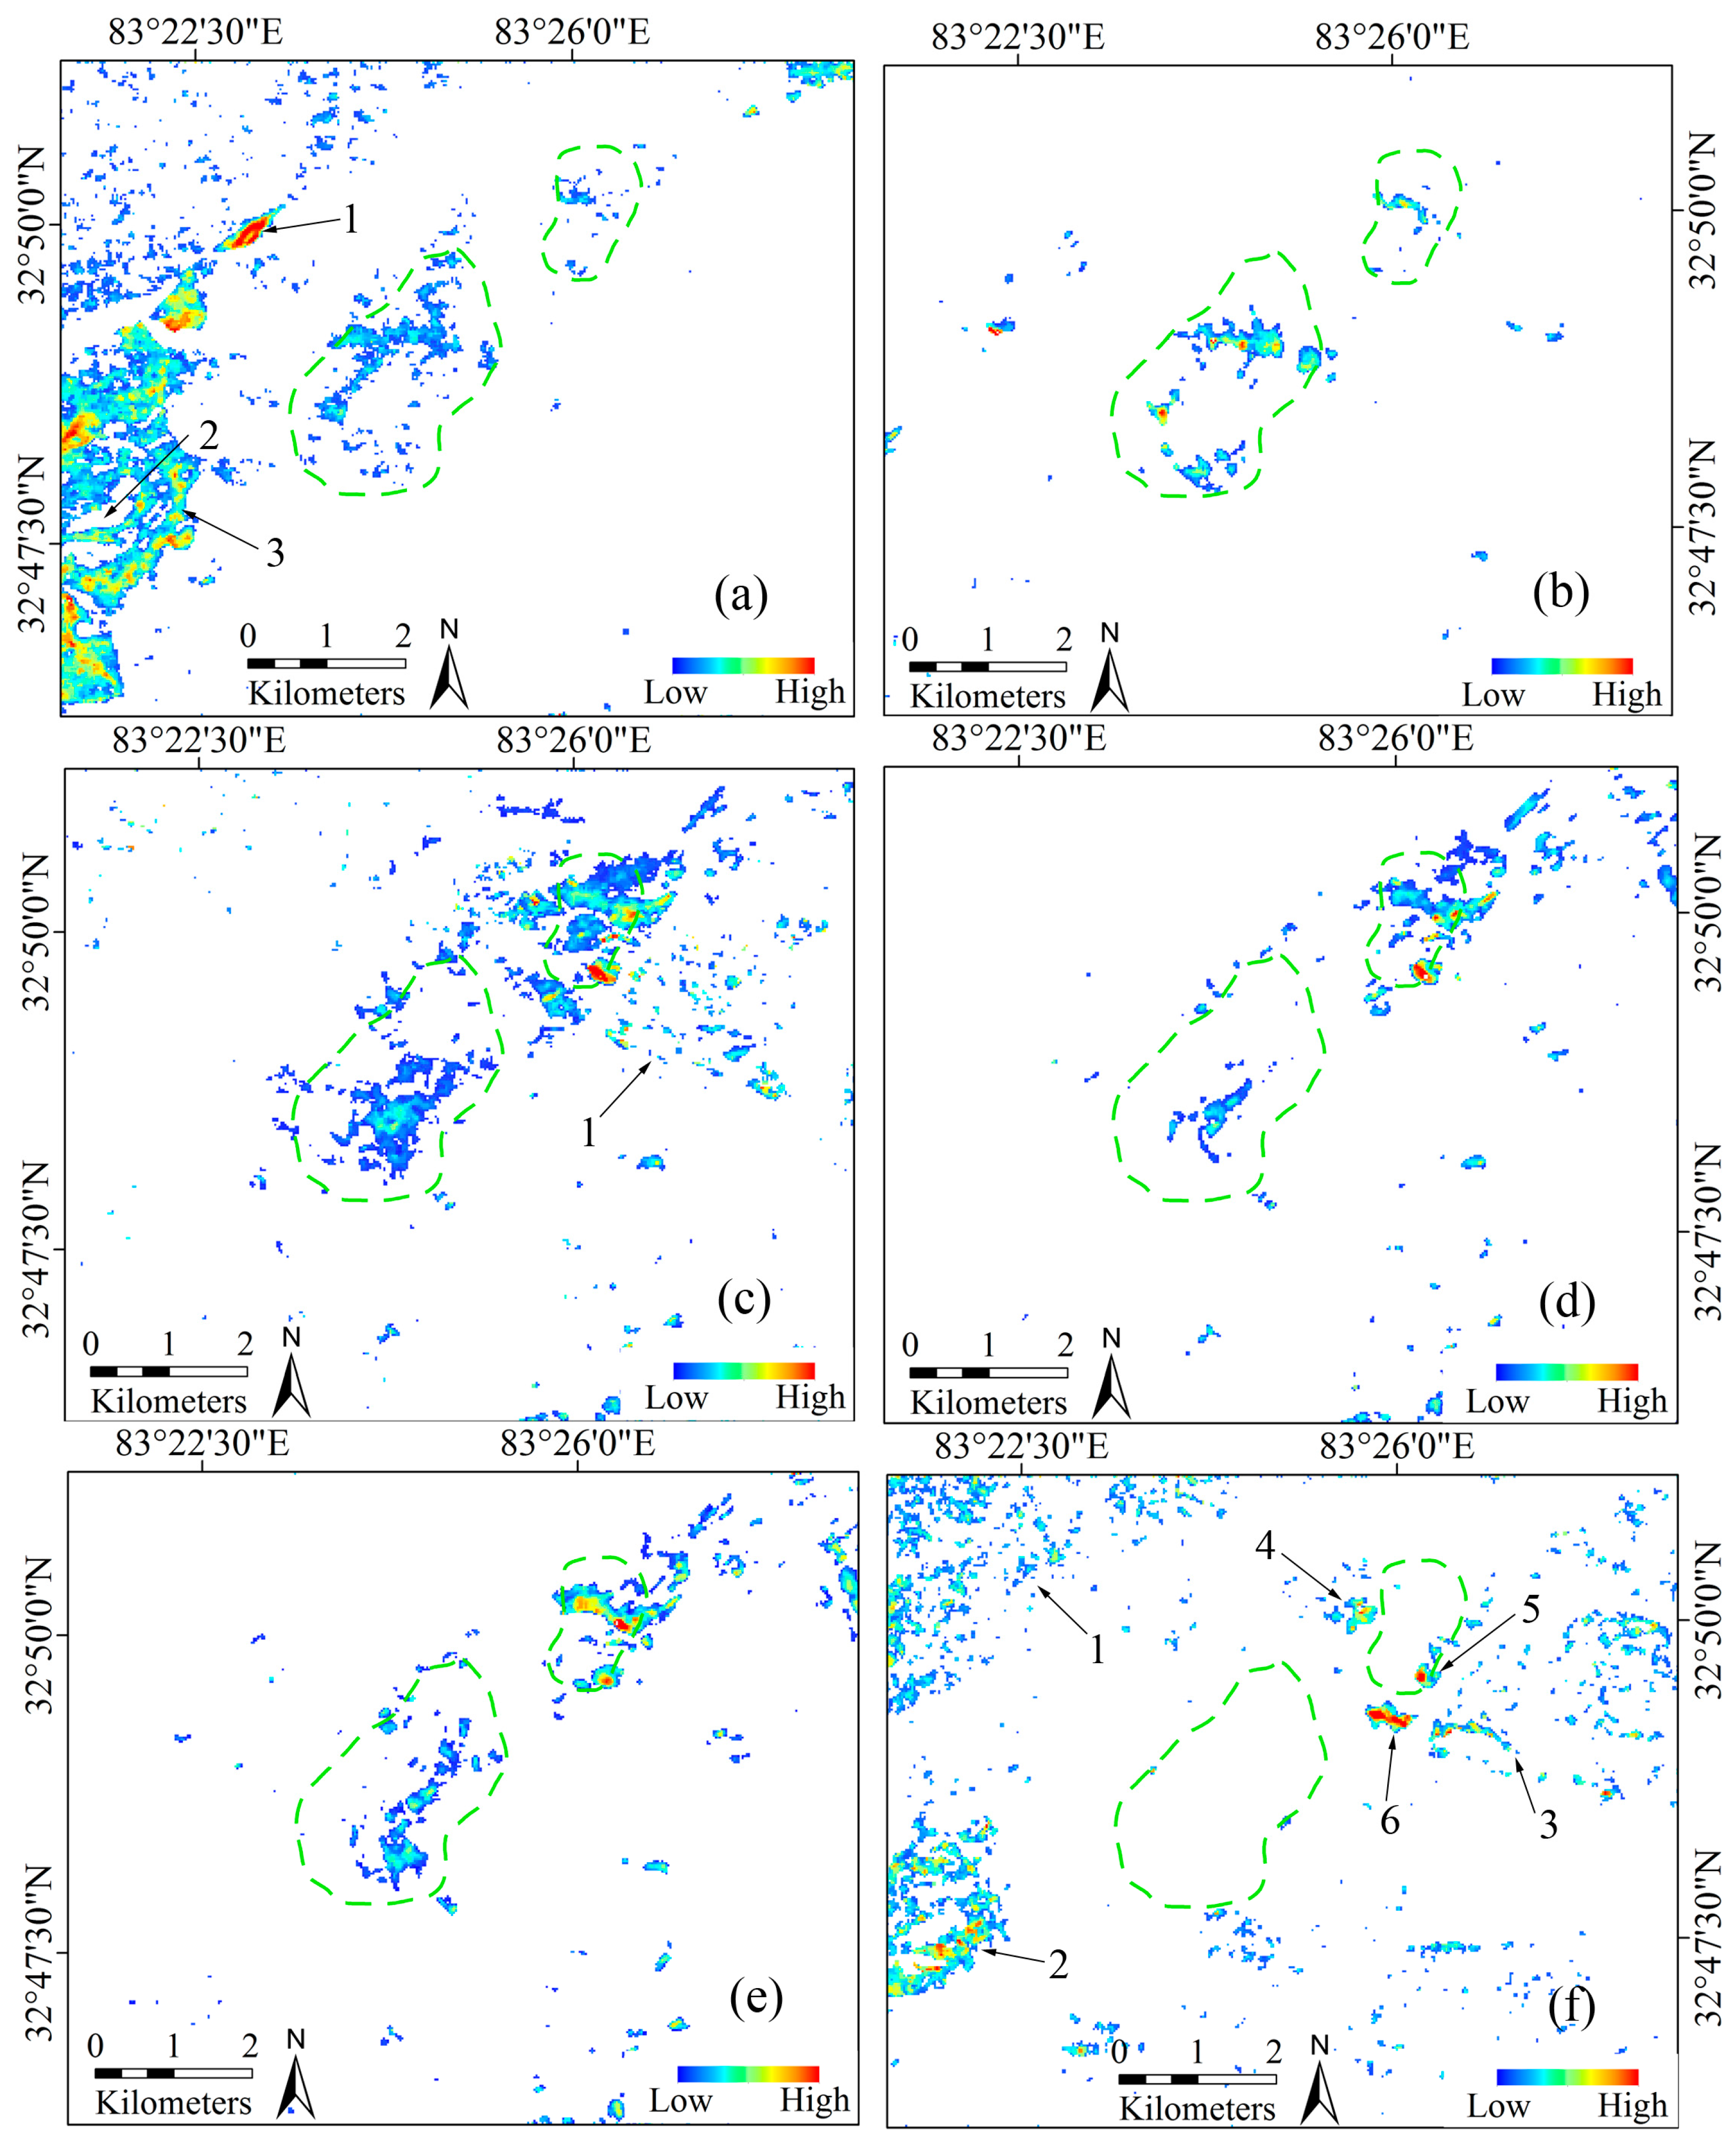
4.2.1. Al-OH Abundance

Al-OH group minerals consist of muscovite, kaolinite, illite, smectite, dickite, etc. Muscovite can be assumed as an indicator of phyllic zone. Kaolinite and/or dikite can also be an indicator of argillic zone. Previous work by Duke [82] has shown that white mica chemistry (e.g., muscovite/illite, phengite), particularly its Al content, can be inferred by the wavelength of its 2.2 μm absorption feature [32]. The studies of Rowan and Mars [57], Hewson and Cudahy [60] and Hewson et al. [32,78] have shown that ASTER data can map Al-OH abundance by RBD (B5 + B7)/B6. We also use RBD (B5 + B7)/B6 of ASTER SWIR bands to produce the Al-OH1 abundance map of Duolong PCD (Table 3, Figure 7a). In Duobuza PCD, the phyllic zone are mainly composed of sericitization and silicification, but muscovite is dominant [52]. In Bolong PCD, the pyritization-phyllic zone is the most extensive alteration types of distribution, and alteration minerals are mainly composed of muscovite, pyrite, and silicide [53,54]. Figure 7a shows that the Al-OH1 abundance decreases from the interior to the exterior of Duolong PCD. The Al-OH2 abundance map (Table 3, Figure 7b) comes from the MTMF results of ASTER SWIR bands 4–7 representing the group minerals of muscovite, kaolinite, illite and smectite. As a whole, Figure 7b shows a qualitative similarity to Figure 7a. However, Figure 7a has a scattered distribution out of the altered zone from field investigations.
Argillization, another broad distribution development alteration type in Duolong PCD, mainly shows intensive kaolinization [66], which corresponds to the argillic zone. Al-OH3 abundance map (Table 3, Figure 7c) represents the group minerals of kaolinite and dickite coming from the MTMF results of ASTER SWIR bands 4–7. The Al-OH3 has a similar but a larger spatial distribution style with the Al-OH2. There are many “empty holes” (e.g., sites 1 and 2 in Duobuza PCD, sites 3–8 in Bolong PCD) inside the Al-OH3 (Figure 7c). The infeasibility scores of “empty holes” labeled in Figure 7c all exceed the threshold. Compared to Al-OH2, the “empty holes” labelled in Figure 7c are a part of Al-OH2. Based on this, the phyllic zone and argillic zone can be inferred.
Duke [82] showed that Al-poor micas (e.g., phengite, montmorllonite) display an absorption feature of Al-OH with a longer wavelength than Al-rich micas (e.g., muscovite, illite, paragonite). Based on the muscovite ASTER spectra, Hewson et al. [32] inferred a white mica composition by ASTER BR indexes B5/B6, B7/B6 and B7/B5. According to the possible shifts in the wavelength of the Al-OH absorption feature [82], in the false color composite of ASTER B5/B6 (R), B7/B6 (G) and B7/B5 (B), the blue areas indicate Al-rich mica compared to red areas representing Al-poor mica (Figure 7d). On the whole, it can be inferred that the phyllic zone of Duobuza PCD is mainly composed of Al-poor micas, whereas Bolong PCD contains Al-rich micas (Figure 7d).

4.2.2. Mg-OH Abundance

In Duobuza PCD, the propylitic zone has broadly developed in the MJQ group (Figure 8a), and the wallrock surrounding the ore body is a broad propylitic zone distributing outward of the argillic-phyllic zone with a zonal-circular pattern. Alteration minerals of the propylitic zone in Duobuza PCD are mainly chlorite, followed by epidote. Nevertheless, the propylitic zone of Bolong PCD is not developed [54].
Mapping results of using RBD (B5 + B7)/B6 of ASTER SWIR bands [25,32,60] and MTMF of ASTER SWIR bands 4–9 reflect the spatial distribution of chlorite and epidote that are the main minerals of the propylitic zone in Duolong PCD (Figure 9). Results show that the Mg-OH1 (Table 3, Figure 9a) and Mg-OH2 (Table 3, Figure 9b) have a similar form and scope of spatial distribution in Duobuza PCD, whereas Mg-OH mapping results of RBD and MTMF all indicate that there is no distribution of Mg-OH in Bolong PCD, which is consistent with the geological results mentioned in Section 2. Compared to the Mg-OH1 abundance distribution, the Mg-OH2 distribution derived from MTMF is more intensive and less scattered. Some basaltic andesites with low albedo distribute in sites 1, 2, 3 and 4 (Figure 9a). The main low albedo of those areas is masked before mapping. However, there also exist false anomalies in the Mg-OH1 abundance correlated with the residue of low albedo masking.

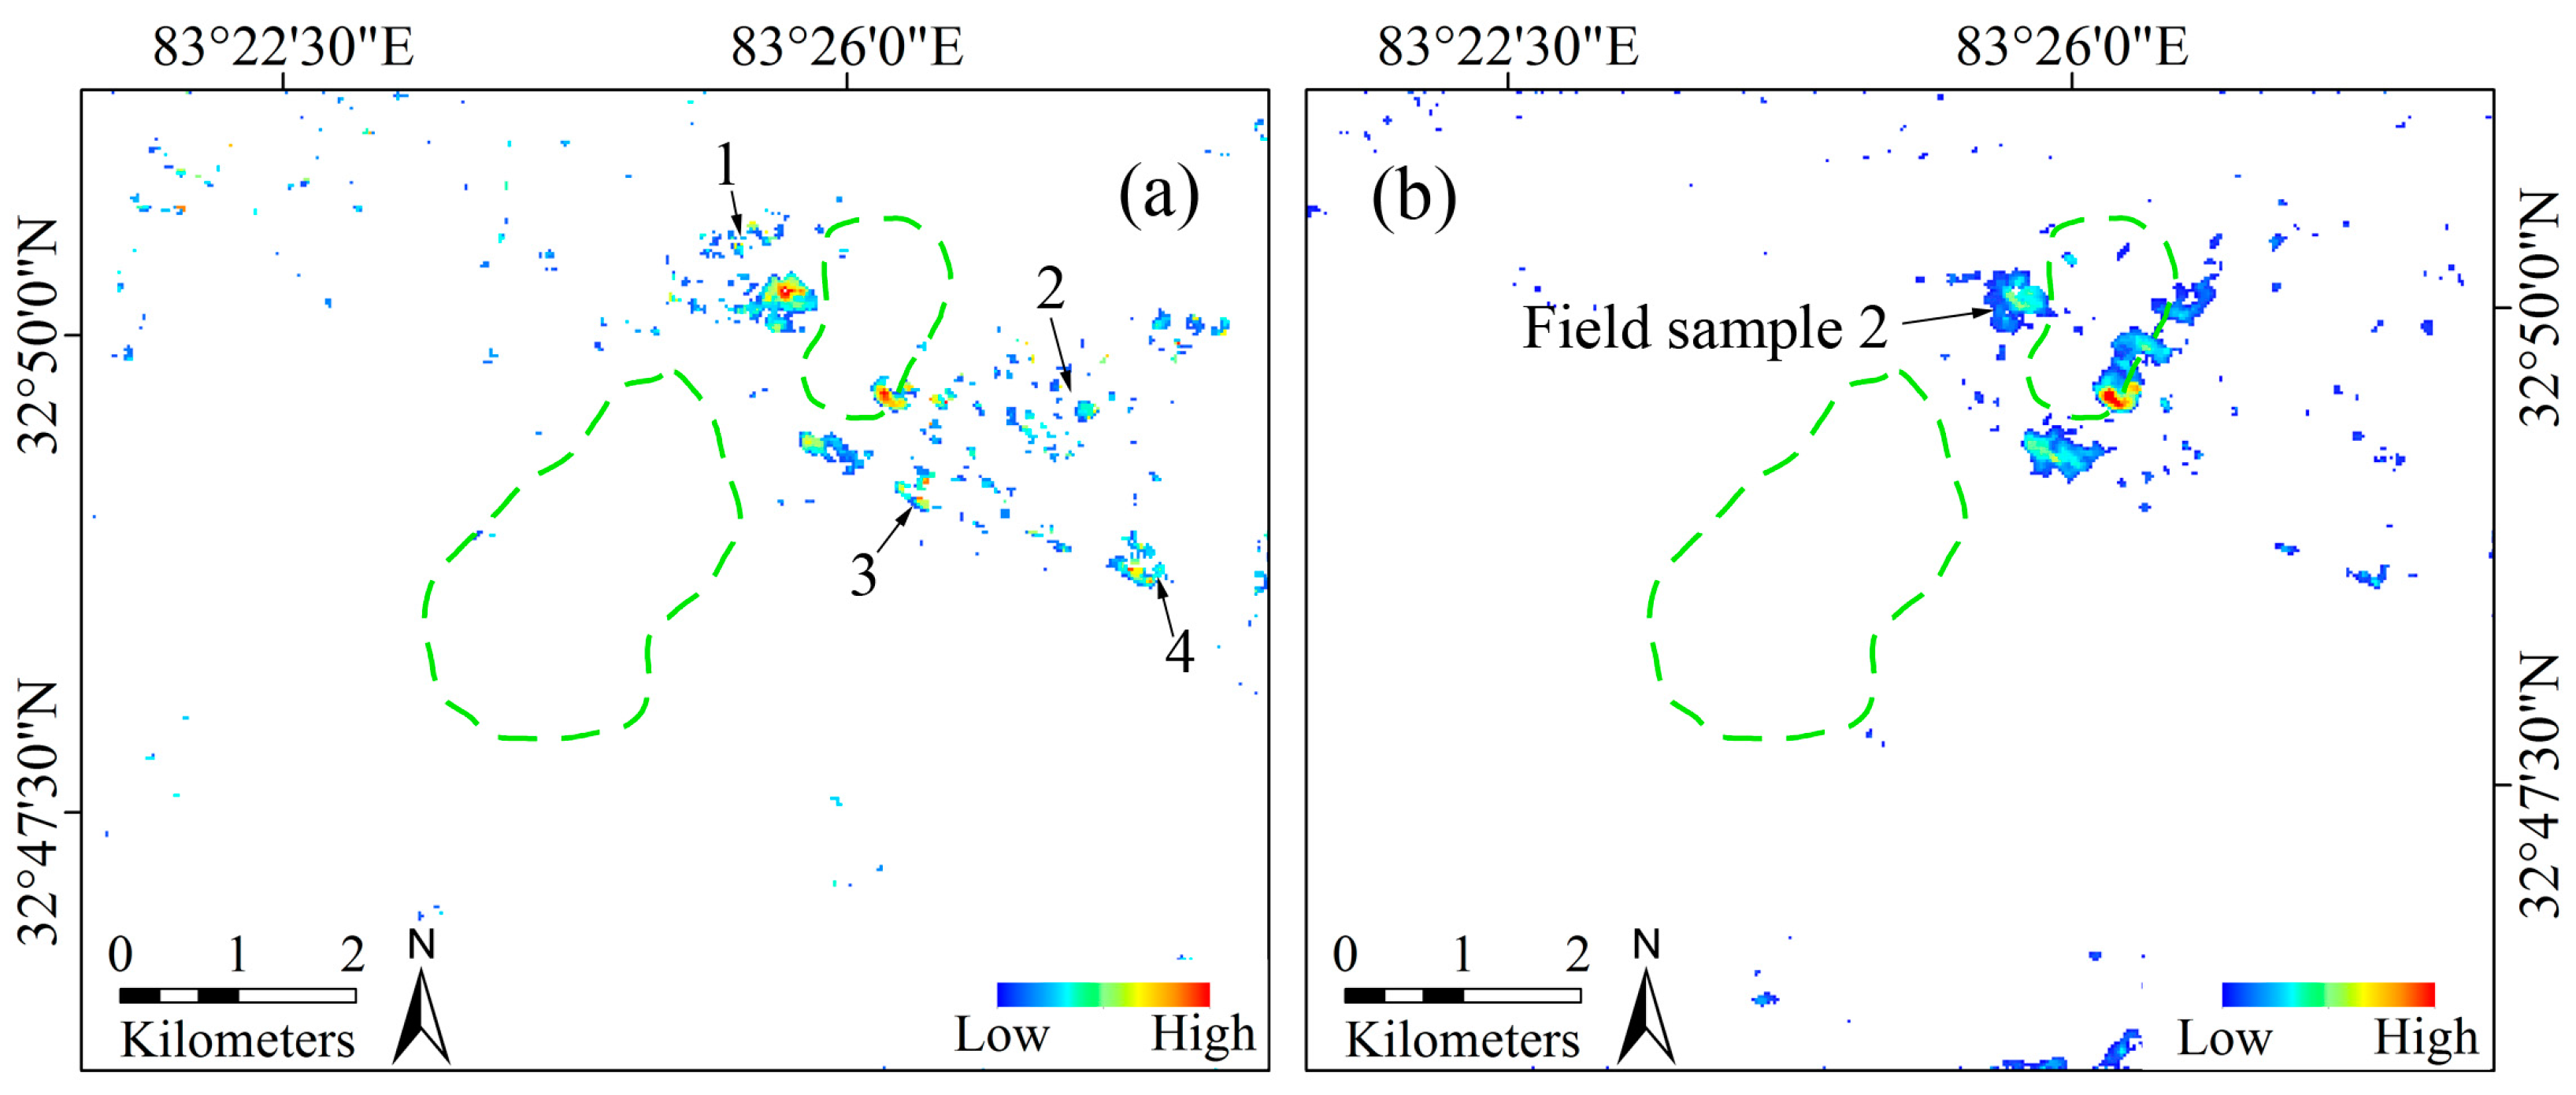
4.2.3. Ferric and Ferrous Iron Abundance

Pyrite distributes broadly in the pyritization-phyllic zone, argillic zone, and propylitic zone of Duobuza PCD and in the pyritization-phyllic and argillic zones of Bolong PCD [52,53,54]. Pyrite exposed at the surface oxidizes form goethite and hematite (and their amorphous, hydrous equivalents, commonly called “limonite”) (Figure 8b,c). The argillic-phyllic zone of Duobuza PCD contains large amounts of limonite, and the hematite content is more than 10% in the local area. The epidiorite-quartz sandstone and shaly slate of the MJY group generally undergo intensive ferruginization in the propylitic zone of Duobuza PCD. In Bolong PCD, the field observation indicates that the epidiorite-quartz sandstone of the MJY group is generally ferruginization (Figure 8d), especially intensive ferruginization on a rocky surface. The copper mineralization mainly distributes in epidiorite-quartz sandstone of intensive ferruginization.
Rowan and Mars [57] and Duuring et al. [25] utilized the BR B2/B1 of ASTER to map the ferric iron mineral abundance due to the intense Fe3+ absorption. Figure 10a,b come from the BRs of ASTER B2/B1 and AO B4/B1 respectively. The numerous additional and apparently false anomalies in the western area of Duolong PCD are also highlighted (Figure 10a, sites 1 and 3), where the stratigraphy consists of the PK group (Figure 10a, site 1) and the LCM group (Figure 10a, site 3). The LCM group contains dark-red basaltic andesite, dacite and volcanic–clastic rocks that are mainly composed of plagioclase, hornblende and minor pyroxene, and the PK group contains brown-red clay and sandy gravel, and main minerals composed of carbonate, a little chlorite and pyrite [11,52]. The false anomalies in these areas correlate with not only the iron-bearing content but also the low albedo of it. Compared to ASTER band 1, the OLI band 1 is at shorter wavelengths in the visible deep inside maximum charge transfer absorption. Figure 10b shows less false anomalies, but a slightly similar outline with the Al-OH1 (Figure 7a) inside the altered zone which is attributed to the intensive absorption of Al-OH.
The BR of ASTER B4/B3 as well as AO B7/B6 is designed to detect the shift in the wavelength of 0.896 μm ferric iron broad absorption feature to longer wavelengths. Some residue of low albedo masking effects is still proved problematic in Figure 10c (site 1). Band 6 of AO, corresponding to OLI band 5 (0.845–0.885 μm), is closer to the wavelength of 0.896 μm than that of ASTER band 3 (0.78−0.86 μm). Figure 10d shows a similar spatial distribution of ferric iron abundance with the MTMF results of AO VNIR bands (Figure 10e).
Reduced reflectance at shorter ASTER SWIR wavelengths (e.g., 1.6 μm) relative to longer SWIR wavelength (e.g., 2.15 μm) reflectance is attributable to the ferrous iron content of several minerals [60,83]. Estimate of the ferrous iron abundance using the ASTER BR B5/B4 is also examined in this study (Figure 10f). Hewson et al. [32] have noted that this interpretation and discrimination could be complicated by ferrous-bearing carbonates (e.g., ankerite, siderite and ferroan dolomite). Hewson and Cudahy [60] also indicated that the presence of an upward ramp in spectral reflectance from ASTER band 4 to band 5 suggest the presence of ferrous iron (e.g., chlorite), though the ramp is absent in the talc and siltstone spectra. The mapping results of ASTER BR B5/B4 seem problematic with the effects of the PK group (Figure 10f, site 1), the LCM group (Figure 10f, site 2) and the residue of low albedo masking (Figure 10f, site 3). Compared to Figure 9b, sites 4, 5 and 6 in Figure 10f reflect the absence of Mg-OH abundance (chlorite and epidote) to some degree.
On the whole, the ferric iron mineral groups are well mapped by AO VINR bands; the results derived from ASTER data show that ferric iron mineral groups suffered from the influence of Mg-OH content (Fe-chlorite) and the residue of low albedo masking. From the mapping results of Figure 10b versus Figure 10a, Figure 10d versus Figure 10c and the high correlation between Figure 10d and Figure 10e, the OLI VNIR bands can well compensate the mapping ability of iron-bearing mineral for ASTER.

4.3. Remotely Sensed Hydrothermal Alteration Zones of the Duolong PCD

Porphyry copper deposits typically occur in association with hydrothermal alteration mineral zones such as potassic, phyllic, argillic, and propylitic [67]. Supergene alteration processes over porphyry copper bodies produce an oxide zone with extensive iron oxide/hydroxide minerals (yellowish to reddish color altered rocks), which are collectively termed “gossan” [22]. The indicator minerals of phyllic, argillic, and propylitic zones and gossan in the Duolong PCD are muscovite, kaolinite/dickite, chlorite/epidote and goethite/hematite [11,52,53,54] respectively. An attempt to draw hydrothermal alteration zones associated with the Duolong PCD, based on the mineral mapping results, is shown in Figure 11.
The three alteration zones from the interior to the exterior of the Duobuza PCD are phyllic zone, argillic zone and propylitic zone. The gossans mainly overlap with phyllic zone (north of the Duobuz PCD) and propylitic zone (east of the Duobuza PCD). This main spatial distribution pattern agrees well with the classic hydrothermal alteration zones of PCD developed by Lowell et al. [67], whereas, due to the absence of Mg-OH group minerals, only two alteration zones of phyllic and argillic are delineated in the Bolong PCD. Unlike the Duobuza PCD, the gossans in the Bolong PCD partly overlap with the argillic zone (north of the Bolong PCD) and partly with the phyllic zone (south of the Bolong PCD).
The distribution patterns of these alteration zones show a good correlation with the alteration zones derived from the field investigations [11,52,53,54]. In general, compared with the alteration zones delineated from the field investigations, the alteration zones of group minerals derived from ASTER and AO data indicate the spatial distribution characteristics of main alteration group minerals in detail.
In addition, according to a previous study [52], among the various alteration types in Duobuza PCD, the most closely related to copper mineralization are the potassic zone (unexposed to the surface) and the superposition of potassic and phyllic zones, followed by the phyllic and argillic superposition zones. The potassic zone contains about 50% copper mineralization, the phyllic zone about 35%, the superposition area of phyllic and argillic zone about 10%, and the propylitic zone about 5%. As for the Bolong PCD, the phyllic zone contains about 45% copper mineralization, and the superposition area of phyllic and argillic zone about 20% [54]. Therefore, the phyllic zone makes a significant contribution to the copper mineralization as about 45%−65% copper mineralization in the Duolong PCD.
A good spatial nested relationship is observed in the Duobuza PCD’s phyllic, argillic, and propylitic zones extracted from the ASTER and AO data. In particular, the plane distribution scope of the underground ore bodies in Duobuza PCD is prominently shown in the phyllic zone, the phyllic and argillic superposition zone. Hence, the important area to explore is the Al-OH1 abundance and Al-OH2 abundance superposition areas extracted from the ASTER SWIR data. Accordingly, three propositions are delineated (Figure 11). The outcrops of granodiorite-porphyry have been found by the field investigations at site 9 of the second proposition (II, Figure 8f). The latest research [84] shows that the breccia pipes are found in the third proposition (III, named Nadun, Figure 11), where the alunite and argillization also exist. The grade of near-surface gold in the third proposition is very high. It has the potential of high sulfidization epithermal gold deposit, which will be tested by the further geological exploration in the prospect areas.

5. Conclusions

This study demonstrates the multispectral data integration method of Advanced Spaceborne Thermal Emission and Reflection Radiometer (ASTER) and L8’s Operational Land Imager (OLI). The ASTER visible and near-infrared (VNIR) through the shortwave infrared (SWIR) data and the intergrating of ASTER and L8-OLI (AO) VNIR data are used for hydrothermal alteration mineral mapping in the Duolong porphyry copper deposits (PCD) of the Tibetan Plateau. The results show that the main alteration zones of the Duolong PCD can be mapped well with limited fieldwork by geologic remote sensing. This study leads to the following three main conclusions.
(a)
The analysis of ASTER and AO data using Minimum Noise Fraction (MNF) transform reveals that a combination of ASTER and L8-OLI data (AO) has more mineral information content than either alone. The results of FI1 (B7/B1) and FI2 derived from AO data illustrate good compensatory capabilities, with OLI being well suited for discerning ferric iron minerals and ASTER enabling distinctions between other clay and sulfate mineral species.
(b)
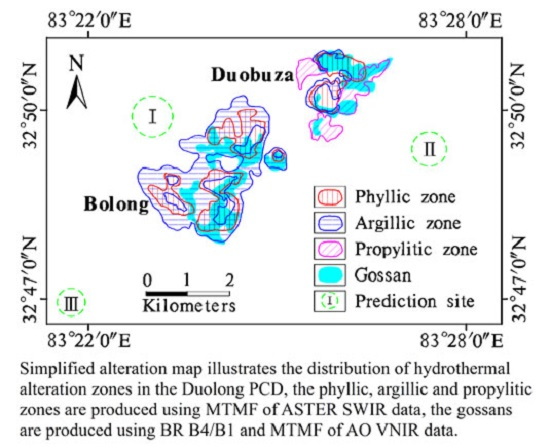
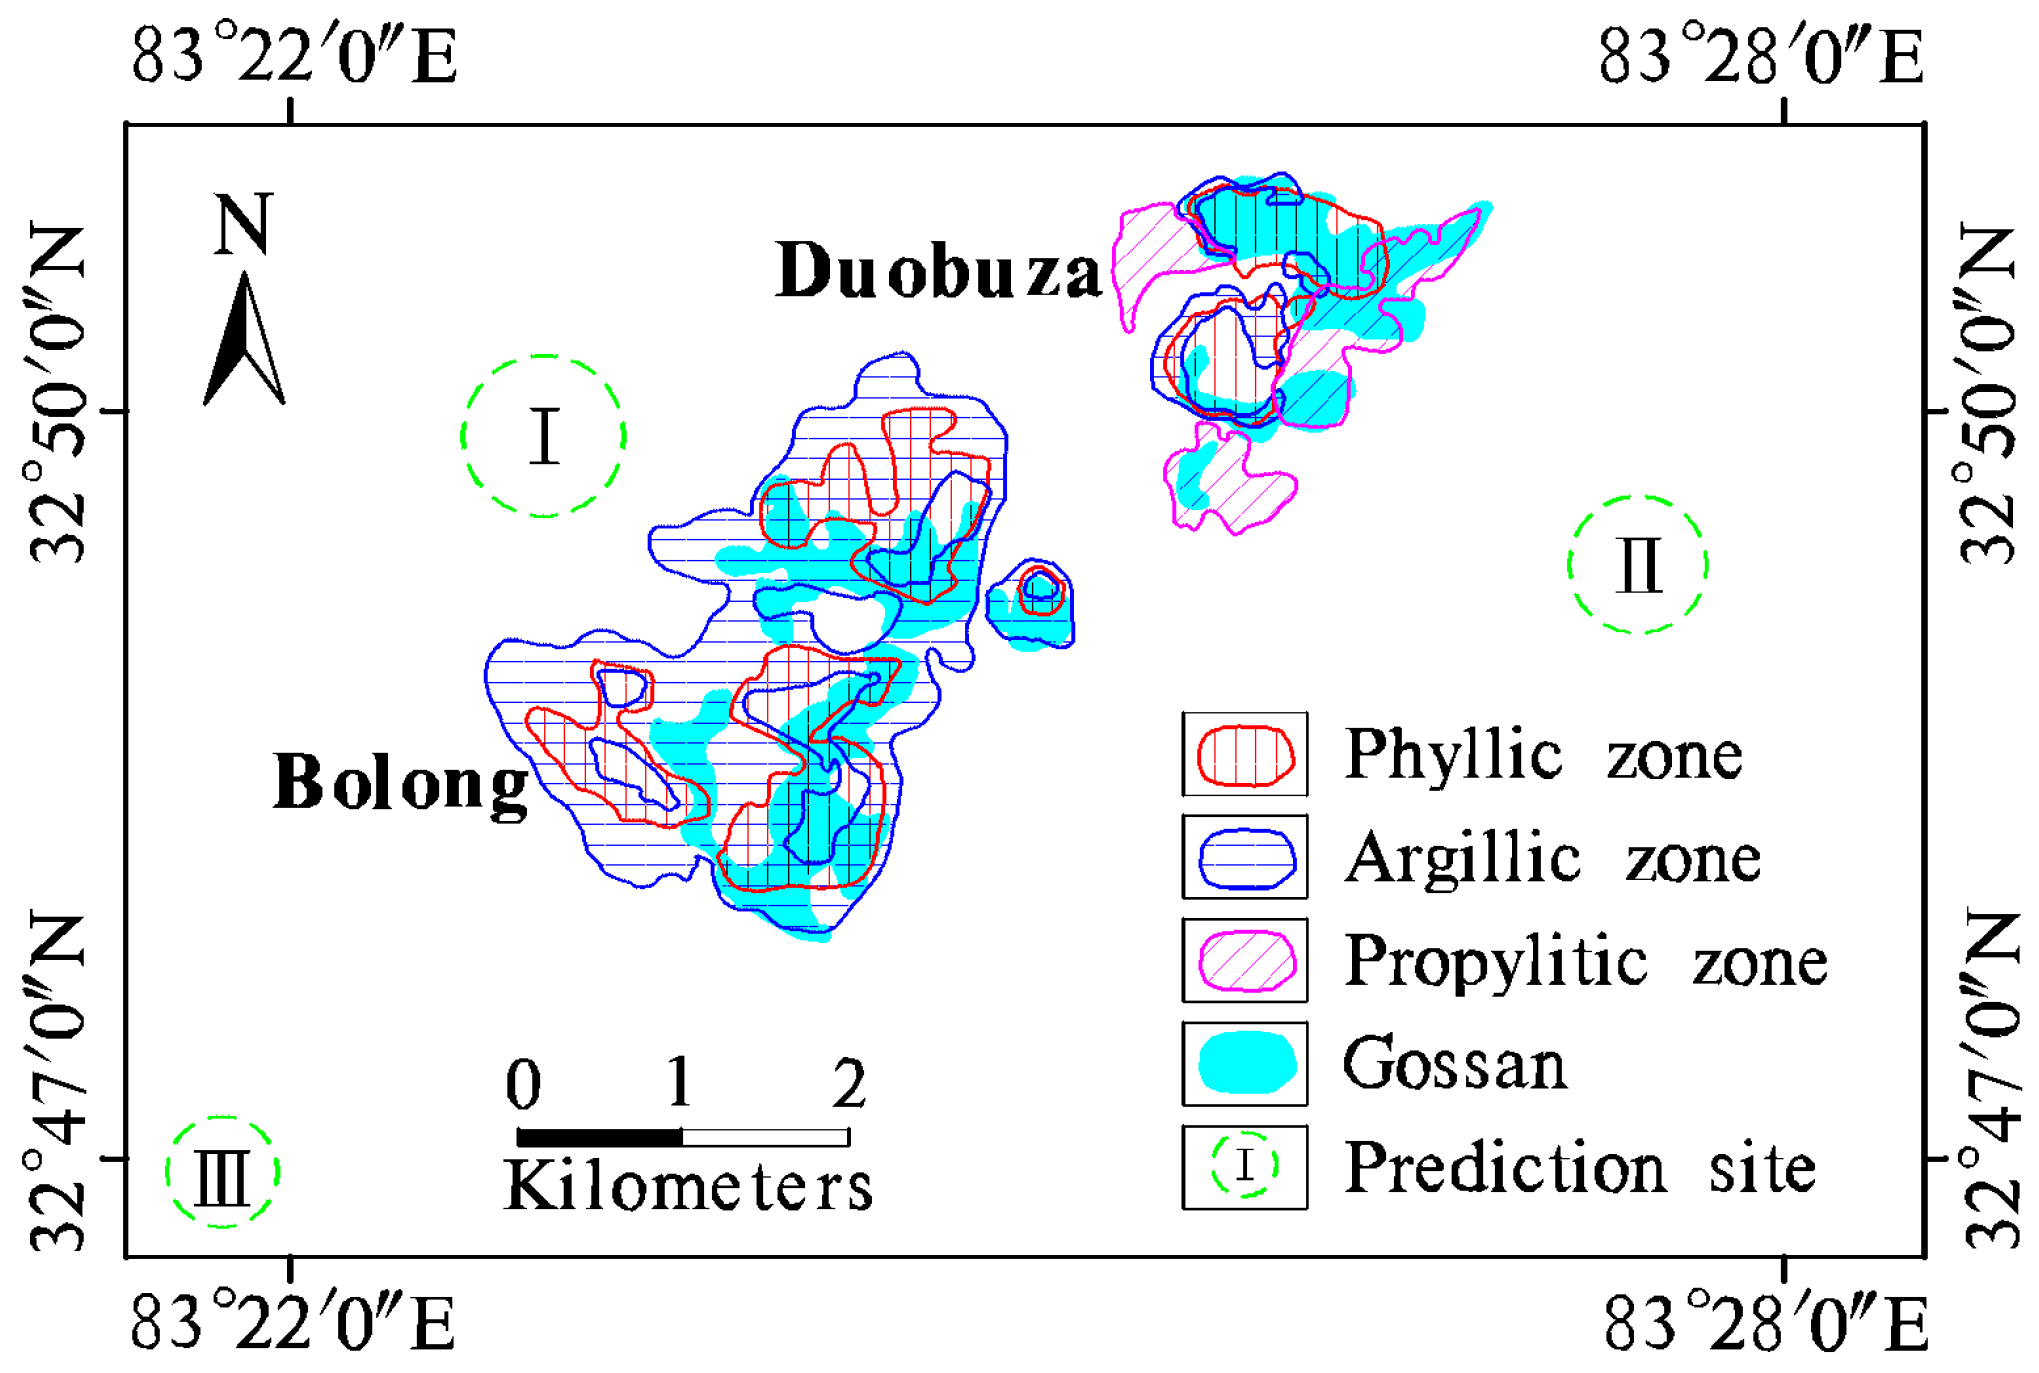
The remote sensing study outlines a full picture of the surface-exposed alteration zones. There are three alteration group minerals from the interior to the exterior of Duobuza PCD: Al-OH2 (muscovite, kaolinite, illite, smectite), Al-OH3 (kaolinite, dickite), and Mg-OH2 (chlorite, epidote), which indicate the phyllic, argillic and propylitic alteration zones. Moreover, there are also two alteration group minerals from the interior to the exterior in the Bolong PCD—Al-OH2 (muscovite, kaolinite, illite, smectite) and Al-OH3 (kaolinite, dickite)—which indicate the presence of phyllic and argillic zones. In addition, gossans are also well mapped using the AO VNIR data. The distribution patterns of these alteration zones show a good correlation with the alteration zones derived by field investigations.
(c)
In accordance with the characterizations of the remote alteration group minerals, three propositions are delineated around the Duolong PCD. The proposition of Nadun (III, Figure 11) has been validated by primary field works. The authors believe that the three propositions are promising locations for future copper and gold exploration in this part of Duolong.
The Qinghai-Tibet Plateau is a vast area of approximately 264.5 × 10⁶ km2 that has rich mineral resources, in which more than 10 dominant minerals have been found, including Cu, Fe, Pb-Zn, Au, and Mo. In the Tibetan Plateau, only 24.43 million tons of copper have been found although the total amount of copper resources are estimated to be more than 110 million tons with the three prominent porphyry metallogenic zones covering over 99% [85]. Hence, the multispectral integration data of AO will provide good complementary data to ASTER for iron-bearing mineral mapping, which aid delineation of the area for hydrothermal alteration minerals and characterization of the alteration zones in the initial steps of ore deposit exploration. In the future, AO reflectance data need further verification using field spectral analysis and different porphyry type deposits in alteration mineral mapping in other arid and semi-arid areas.

Acknowledgments

This research is supported in part by National Natural Science Foundation of China (Grant No. 41202233), the Public Welfare Industry Special Scientific Research Projects of Ministry of Land and Resources of China (Grant No. 201511017), and Study on metallogenic law and optimum selection of proposition of porphyry Cu–Au deposit in Wuma–xianqian area, Tibetan Plateau (Grant No. 12120113095300). We gratefully acknowledge Tom Cudahy (CSIRO, Australia) and other anonymous reviewers for reviewing the manuscript and their useful suggestions.

Author Contributions

All authors have made significant contributions to the manuscript. Tingbin Zhang conceived and designed the study. Tingbin Zhang and Guihua Yi wrote the manuscript. Hongmei Li and Ziyi Wang performed the data analysis and modified some figures. Tingbin Zhang, Juxing Tang, Kanghui Zhong, Yubin Li, and Qin Wang performed the field work. Juxing Tang, Kanghui Zhong, Yubin Li, Qin Wang, and Xiaojuan Bie helped to analyze the results and revise the manuscript. All authors read and approved the final manuscript.

Conflicts of Interest

The authors declare no conflict of interest.

References

  1. Ranjbar, H.; Honarmand, M.; Moezifa, Z. Application of the Crosta technique for porphyry copper alteration mapping, using ETM+ data in the southern part of the Iranian volcanic sedimentary belt. J. Asian Earth Sci. 2004, 24, 237–243. [Google Scholar] [CrossRef]
  2. Rowan, L.C.; Crowley, J.K.; Schmidt, R.G.; Ager, C.M.; Mars, J.C. Mapping hydrothermally altered rocks by analyzing hyperspectral image (AVIRIS) data of forested areas in the Southeastern United States. J. Geochem. Explor. 2000, 68, 145–166. [Google Scholar] [CrossRef]
  3. Sillitoe, R.H. Porphyry copper systems. Econ. Geol. 2010, 105, 3–41. [Google Scholar] [CrossRef]
  4. Bedini, E. Mineral mapping in the Kap Simpson complex, central East Greenland, using HyMap and ASTER remote sensing data. Adv. Space Res. 2011, 47, 60–73. [Google Scholar] [CrossRef]
  5. Pour, B.A.; Hashim, M. Identification of hydrothermal alteration minerals for exploring of porphyry copper deposit using ASTER data, SE Iran. J. Asian Earth Sci. 2011, 42, 1309–1323. [Google Scholar] [CrossRef]
  6. Pour, B.A.; Hashim, M. Fusing ASTER, ALI and Hyperion data for enhanced mineral mapping. Int. J. Image Data Fusion 2013, 4, 126–145. [Google Scholar] [CrossRef]
  7. Hou, Z.Q.; Zaw, K.; Pan, G.T.; Mo, X.X.; Xu, Q.; Hu, Y.Z.; Li, X.Z. Sanjiang Tethyan metallogenesis in S.W. China: Tectonic setting, metallogenic epochs and deposit types. Ore Geol. Rev. 2007, 31, 48–87. [Google Scholar] [CrossRef]
  8. Qu, X.M.; Hou, Z.Q.; Zaw, K.; Li, Y.G. Characteristics and genesis of Gangdese porphyry copper deposits in the southern Tibetan Plateau: Preliminary geochemical and geochronological results. Ore Geol. Rev. 2007, 31, 205–223. [Google Scholar]
  9. Hou, Z.Q.; Yang, Z.M.; Qu, X.M.; Meng, X.J.; Li, Z.Q.; Beaudoin, G.; Rui, Z.Y.; Gao, Y.F.; Zaw, K. The Miocene Gangdese porphyry copper belt generated during post-collisional extension in the Tibetan Orogen. Ore Geol. Rev. 2009, 36, 25–51. [Google Scholar] [CrossRef]
  10. Geng, Q.R.; Zhang, Z.; Peng, Z.M.; Guan, J.L.; Zhu, X.P.; Mao, X.C. Jurassic–Cretaceous granitoids and related tectono-metallogenesis in the Zapug-Duobuza arc, western Tibet. Ore Geol. Rev. 2016, 77, 163–175. [Google Scholar] [CrossRef]
  11. Li, J.X.; Qin, K.Z.; Li, G.M.; Xiao, B.; Zhao, J.X.; Chen, L. Magmatic-hydrothermal evolution of the Cretaceous Duolong gold-rich porphyry copper deposit in the Bangongco metallogenic belt, Tibet: Evidence from U-Pb and 40Ar/39Ar geochronology. J. Asian Earth Sci. 2011, 41, 525–536. [Google Scholar] [CrossRef]
  12. Yang, Z.M.; Hou, Z.Q.; White, N.C.; Chang, Z.S.; Li, Z.Q.; Song, Y.C. Geology of the post-collisional porphyry copper–molybdenum deposit at Qulong, Tibet. Ore Geol. Rev. 2009, 36, 133–159. [Google Scholar] [CrossRef]
  13. Qu, X.M.; Hou, Z.Q.; Zaw, K.; Mo, X.X.; Xu, W.Y.; Xin, H.B. A large-scale copper ore-forming event accompanying rapid uplift of the southern Tibetan Plateau: Evidence from zircon SHRIMP U–Pb dating and LA ICP-MS analysis. Ore Geol. Rev. 2009, 36, 52–64. [Google Scholar]
  14. Li, J.X.; Qin, K.Z.; Li, G.M.; Xiao, B.; Zhao, J.X.; Cao, M.J.; Chen, L. Petrogenesis of ore-bearing porphyries from the Duolong porphyry Cu-Au deposit,central Tibet: Evidence from U-Pb geochronology, petrochemistry and Sr-Nd-Hf-O isotope characteristics. Lithos 2013, 160–161, 216–227. [Google Scholar] [CrossRef]
  15. Clark, R.N.; Swayze, G.A.; Gallagher, A.J.; Gorelick, N.; Kruse, F.A. Mapping with imaging spectrometer data using the complete band shape least-squares fit to multiple spectral features from multiple materials. In Proceedings of the Third AVIRIS Workshop, Pasadena, CA, USA, 20–21 May 1991.
  16. Veraverbeke, S.; Stavros, E.N.; Hook, S.J. Assessing fire severity using imaging spectroscopy data from the Airborne Visible/Infrared Imaging Spectrometer (AVIRIS) and comparison with multispectral capabilities. Remote Sens. Environ. 2014, 154, 153–163. [Google Scholar] [CrossRef]
  17. Cocks, T.; Jenssen, R.; Stewart, W.I.; Shields, T. The HyMap airborne hyperspectral sensor: The system, calibration, and performance. In Proceedings of the 1st EARSEL Workshop on Imaging Spectroscopy, Zurich, Switzerland, 6–8 October 1998.
  18. Hewson, R.; Cudahy, T.; Quigley, M.; Huntington, J.; Whitbourn, L.; Hausknecht, P. Mapping talc mineralisation and associated alteration using airborne and satellite-borne spectrometry: A case study at Mount Fitton, South Australia. In ASEG Extended Abstracts 2003: Geophysical Signatures of South Australian Mineral; Dentith, M.C., Ed.; Australian Society of Exploration Geophysicists (ASEG): Crows Nest, Australia, 2003; Volume 3, pp. 213–221. [Google Scholar]
  19. Rowan, L.C.; Simpson, C.J.; Mars, J.C. Hyperspectral analysis of the ultramafic complex and adjacent lithologies at Mordor, NT, Australia. Remote Sens. Environ. 2004, 91, 419–431. [Google Scholar] [CrossRef]
  20. Debba, P.; van Ruitenbeek, F.J.A.; van der Meer, F.D.; Carranza, E.J.M.; Stein, A. Optimal field sampling for targeting minerals using hyperspectral data. Remote Sens. Environ. 2005, 99, 373–386. [Google Scholar] [CrossRef]
  21. Kratt, C.; Calvin, W.; Coolbaugh, M. Geothermal exploration with Hymap hyperspectral data at Brady-Desert Peak, Nevada. Remote Sens. Environ. 2006, 104, 313–324. [Google Scholar] [CrossRef]
  22. Sabins, F.F. Remote sensing for mineral exploration. Ore Geol. Rev. 1999, 14, 157–183. [Google Scholar] [CrossRef]
  23. Tangestani, M.H.; Moore, F. Iron oxide and hydroxyl enhancement using the Crosta Method: A case study from the Zagros Belt, Fars Province, Iran. Int. J. Appl. Earth Obs. 2000, 2, 140–146. [Google Scholar] [CrossRef]
  24. Goward, S.N.; Masek, J.G.; Williams, D.L.; Irons, J.R.; Thompson, R.J. The Landsat 7 mission Terrestrial research and applications for the 21st century. Remote Sens. Environ. 2001, 78, 3–12. [Google Scholar] [CrossRef]
  25. Hewson, R.D.; Cudahy, T.J.; Drake-Brockman, J.; Meyers, J.; Hashemi, A. Mapping geology associated with manganese mineralisation using spectral sensing techniques at Woodie Woodie, East Pilbara. Explor. Geophys. 2006, 37, 389–400. [Google Scholar] [CrossRef]
  26. Hewson, R.; Cudahy, T.; Jones, M.; Thomas, M.; Laukamp, C.; Agustin, F. Mineral and compositional mapping using airborne hyperspectral and geophysical products, North Queensland. In Proceedings of the 20th International Geophysical Conference and Exhibition, Adelaide, Australia, 22–25 February 2009.
  27. Caccetta, M.; Collings, S.; Cudahy, T. A calibration methodology for continental scale mapping using ASTER imagery. Remote Sens. Environ. 2013, 138, 306–317. [Google Scholar] [CrossRef]
  28. Abrams, M.; Tsu, H.; Hulley, G.; Iwao, K.; Pieri, D.; Cudahy, T.; Kargel, J. The Advanced Spaceborne Thermal Emission and Reflection Radiometer (ASTER) after fifteen years: Review of global products. Int. J. Appl. Earth Obs. 2015, 38, 292–301. [Google Scholar] [CrossRef]
  29. Mars, J.C.; Rowan, L.C. Spectral assessment of new ASTER SWIR surface reflectance data products for spectroscopic mapping of rocks and minerals. Remote Sens. Environ. 2010, 114, 2011–2025. [Google Scholar] [CrossRef]
  30. Pour, A.B.; Hashim, M. The application of ASTER remote sensing data to porphyry copper and epithermal gold deposits. Ore Geol. Rev. 2012, 44, 1–9. [Google Scholar] [CrossRef] [Green Version]
  31. Gabr, S.; Ghulam, A.; Kusky, T. Detecting areas of high-potential gold mineralization using ASTER data. Ore Geol. Rev. 2010, 38, 59–69. [Google Scholar] [CrossRef]
  32. Hewson, R.D.; Cudahy, T.J.; Mizuhiko, S.; Ueda, K.; Mauger, A.J. Seamless geological map generation using ASTER in the Broken Hill-Curnamona province of Australia. Remote Sens. Environ. 2005, 99, 159–172. [Google Scholar] [CrossRef]
  33. Kruse, F.A. Validation of DigitalGlobe WorldView-3 Earth imaging satellite shortwave infrared bands for mineral mapping. J. Appl. Remote Sens. 2015, 9, 307–310. [Google Scholar] [CrossRef]
  34. Asadzadeh, S.; Filho, C.R.D.S. Investigating the capability of WorldView-3 superspectral data for direct hydrocarbon detection. Remote Sens. Environ. 2015, 173, 162–173. [Google Scholar] [CrossRef]
  35. Kokaly, R.F.; King, T.V.V.; Livo, K.E. Airborne Hyperspectral Survey of Afghanistan 2007: Flight Line Planning and HyMap Data Collection; U.S. Geological Survey Open-File Report 2008-1235; U.S. Geological Survey: Reston, VA, USA, 2008; pp. 1–14.
  36. The Potential Evaluation of National Mineral Resources. Available online: http://imr.cags.ac.cn/qlpj/index.html (accessed on 3 July 2016).
  37. Hubbard, B.E.; Crowley, J.K. Mineral mapping on the Chilean-Bolivian Altiplano using co-orbital ALI, ASTER and Hyperion imagery: Data dimensionality issues and solutions. Remote Sens. Environ. 2005, 99, 173–186. [Google Scholar] [CrossRef]
  38. Zadeh, M.H.; Tangestani, M.H.; Roldan, F.V.; Yusta, I. Sub-Pixel mineral mapping of a porphyry copper belt using EO-1 Hyperion data. Adv. Space Res. 2014, 53, 440–451. [Google Scholar] [CrossRef]
  39. Hubbard, B.E.; Crowley, J.K.; Zimbelman, D.R. Comparative alteration mineral mapping using visible to shortwave infrared (0.4–2.4 μm) Hyperion, ALI and ASTER imagery. IEEE Trans. Geosci. Remote Sens. 2003, 41, 1401–1410. [Google Scholar] [CrossRef]
  40. Rowan, L.C.; Schmidt, R.G.; Mars, J.C. Distribution of hydrothermally altered rocks in the RekoDiq, Pakistan mineralized area based on spectral analysis of ASTER data. Remote Sens. Environ. 2006, 104, 74–87. [Google Scholar] [CrossRef]
  41. Tommaso, I.D.; Rubinstein, N. Hydrothermal alteration mapping using ASTER data in the Infiernillo porphyry deposit, Argentina. Ore Geol. Rev. 2007, 32, 275–290. [Google Scholar] [CrossRef]
  42. Azizi, H.; Tarverdi, M.A.; Akbarpour, A. Extraction of hydrothermal alterations from ASTER SWIR data from east Zanjan, northern Iran. Adv. Space Res. 2010, 46, 99–109. [Google Scholar] [CrossRef]
  43. Irons, J.R.; Dwyer, J.L.; Barsi, J.A. The next Landsat satellite: The Landsat Data Continuity Mission. Remote Sens. Environ. 2012, 122, 11–21. [Google Scholar] [CrossRef]
  44. National Aeronautics and Space Administration. Available online: http://science.nasa.gov/missions/ldcm/ (accessed on 7 May 2016).
  45. Landsat 8 (L8) Data Users Handbook (Version 2.0). Available online: http://science.nasa.gov/missions/ldcm/ (accessed on 7 May 2016).
  46. Pour, A.B.; Hashim, M. Hydrothermal alteration mapping from Landsat-8 data, SarCheshmeh copper mining district, south-eastern Islamic Republic of Iran. J. Taibah Univ. Sci. 2015, 9, 155–166. [Google Scholar] [CrossRef]
  47. Lymburner, L.; Botha, E.; Hestir, E.; Anstee, J.; Sagar, S.; Dekker, A.; Malthus, T. Landsat 8: Providing continuity and increased precision for measuring multi-decadal time series of total suspended matter. Remote Sens. Environ. 2016, in press. [Google Scholar] [CrossRef]
  48. Mars, J.C.; Rowan, L.C. Regional mapping of phyllic- and argillic-altered rocks in the Zagros magmatic arc, Iran, using advanced spaceborne thermal emission and reflection radiometer (ASTER) data and logical operator algorithms. Geosphere 2006, 2, 161–186. [Google Scholar] [CrossRef]
  49. Bedini, E. Mapping alteration minerals at Malmbjerg molybdenum deposit, central East Greenland, by Kohonen self-organizing maps and matched filter analysis of HyMap data. Int. J. Remote Sens. 2012, 33, 939–961. [Google Scholar] [CrossRef]
  50. Liang, H.; Liu, J.M.; Li, S.K. Analysis of precipitable water vapor source distribution and its seasonal variation characteristics over Tibetan Plateau and its surroundings. J. Natl. Resour. 2006, 21, 0526–0535. [Google Scholar]
  51. Xu, W.; Li, C.; Wang, M.; Fan, J.J.; Wu, H.; Li, X. Subduction of a spreading ridge within the Bangong Co-Nujiang Tethys Ocean: Evidence from Early Cretaceous mafic dykes in the Duolong porphyry Cu-Au deposit, western Tibet. Gondwana Res. 2016, in press. [Google Scholar] [CrossRef]
  52. Zhang, Z.; Chen, Y.C.; Tang, J.X.; Li, Y.B.; Gao, K.; Wang, Q.; Li, Z.; Li, J.L. Alteration and vein systems of Duobuza gold_rich porphyry copper deposit, Tibet. Miner. Depos. 2014, 33, 1268–1286. [Google Scholar]
  53. Zhu, X.P.; Chen, H.A.; Ma, D.F.; Huang, H.X.; Li, G.M.; Li, Y.B.; Li, Y.C. Re-Os dating for the molybdenite from Bolong porphyry copper-gold deposit in Tibet, China and its geological significance. Acta Petrol. Sin. 2011, 27, 2159–2164. [Google Scholar]
  54. Yang, Y.; Zhang, Z.; Tang, J.X.; Chen, Y.C.; Li, Y.B.; Wang, L.Q.; Li, J.L.; Gao, K.; Wang, Q.; Yang, H.H. Mineralization, alteration and vein systems of the Bolong porphyry copper deposit in the Duolong ore concentration area, Tibet. Geol. China 2015, 42, 759–776. [Google Scholar]
  55. Wang, Q.; Tang, J.X.; Fang, X.; Lin, B.; Song, Y.; Wang, Y.Y.; Yang, H.H.; Yang, C.; LI, Y.B.; Wei, L.J.; et al. Petrogenetic setting of andsites in Rongna ore block, Tiegelong Cu (Au−Ag) deposit, Duolong ore concentration area, Tibet: Evidence from zircon U−Pb LA−ICP−MS dating and petrogeochemistry of and sites. Geol. China 2015, 42, 1324–1336. [Google Scholar]
  56. Yamaguchi, Y.; Fujisada, H.; Kudoh, M. ASTER instrument characterization and operation scenario. Adv. Space Res. 1999, 23, 1415–1424. [Google Scholar] [CrossRef]
  57. Rowan, L.C.; Mars, J.C.; Simpson, C.J. Lithologic mapping in the mountain pass, California area using Advanced Spaceborne thermal Emission and Reflection Radiometer(ASTER) data. Remote Sens. Environ. 2003, 84, 350–366. [Google Scholar] [CrossRef]
  58. Rowan, L.C.; Mars, J.C.; Simpson, C.J. Lithologic mapping of the Mordor, NT, Australia ultramafic complex by using the Advanced Spaceborne Thermal Emission and Reflection Radiometer(ASTER). Remote Sens. Environ. 2005, 99, 105–126. [Google Scholar] [CrossRef]
  59. Bertoldi, L.; Massironi, M.; Visonà, D.; Carosi, R.; Montomoli, C.; Gubert, F.; Naletto, G.; Pelizzo, M.G. Mapping the Buraburi granite in the Himalaya of Western Nepal: Remote sensing analysis in a collisional belt with vegetation cover and extreme variation of topography. Remote Sens. Environ. 2011, 115, 1129–1144. [Google Scholar] [CrossRef]
  60. Hewson, R.; Cudahy, T. Issues Affecting Geological Mapping with ASTER Data: A Case Study of the Mt Fitton Area, South Australia. In Land Remote Sensing and Global Environmental Change; Ramachandran, B., Justice, C.O., Eds.; Springer: New York, NY, USA, 2010; Volume 11, pp. 273–300. [Google Scholar]
  61. Duuring, P.; Hagemann, S.G.; Novikova, Y.; Cudahy, T.; Laukamp, C. Targeting Iron Ore in Banded Iron Formations Using ASTER Data: Weld Range Greenstone Belt, Yilgarn Craton, Western Australia. Econ. Geol. 2012, 107, 585–597. [Google Scholar] [CrossRef]
  62. Iwasaki, A.; Fujisada, H.; Akao, H.; Shindou, O.; Akagi, S. Enhancement of spectral separation performance for ASTER/SWIR. In Proceedings of the SPIE 4486, Infrared Spaceborne Remote Sensing IX, San Diego, CA, USA, 11 February 2002; pp. 42–50.
  63. Kumar, C.; Shetty, A.; Raval, S.; Champati Ray, P.K.; Sharma, R. Sub-Pixel mineral mapping using EO-1 Hyperion hyperspectral data. Int. Arch. Photogramm. Remote Sens. Spat. Inf. Sci. 2014, XL-8, 455–461. [Google Scholar] [CrossRef]
  64. Yang, Z.A.; Peng, S.L.; Zhu, G.C.; Shi, F.F.; Zou, L.; Zhang, Y.F. Spectrum spatial structure characteristic analysis of remote sensing alteration information and interference factors. J. Cent. South Univ. Technol. 2009, 16, 0647–0652. [Google Scholar] [CrossRef]
  65. Hunt, G.R. Spectral signatures of particulate minerals in the visible and near infrared. Geophysics 1977, 42, 501–513. [Google Scholar] [CrossRef] [Green Version]
  66. Yamaguchi, Y.; Naito, C. Spectral indices for lithologic discrimination and mapping by using the ASTER SWIR bands. Int. J. Remote Sens. 2003, 24, 4311–4323. [Google Scholar] [CrossRef]
  67. Lowell, J.D.; Guilbert, J.M. Lateral and vertical alteration mineralization zoning in porphyry ore deposits. Econ. Geol. Bull. Soc. 1970, 65, 373–408. [Google Scholar] [CrossRef]
  68. Pour, A.B.; Hashim, M. Identifying areas of high economic-potential copper mineralization using ASTER data in the Urumieh-Dokhtar Volcanic Belt, Iran. Adv. Space Res. 2012, 49, 753–769. [Google Scholar] [CrossRef]
  69. Moghtaderi, A.; Moore, F.; Mohammadzadeh, A. The application of advanced space-borne thermal emission and reflection (ASTER) radiometer data in the detection of alteration in the Chadormalu paleocrater, Bafq region, Central Iran. J. Asian Earth Sci. 2007, 30, 238–252. [Google Scholar] [CrossRef]
  70. Cudahy, T.J.; Ramanaidou, E.R. Measurement of the hematite:goethite ratio using field visible and near-infrared spectrometry in channel iron deposits, Western Australia. Aust. J. Earth Sci. 1997, 44, 411–420. [Google Scholar] [CrossRef]
  71. Molan, Y.E.; Refahib, D.; Tarashti, A.H. Mineral mapping in the Maherabad area, eastern Iran, using the HyMap remote sensing data. Int. J. Appl. Earth Obs. 2014, 27, 117–127. [Google Scholar] [CrossRef]
  72. Rowan, L.C.; Goetz, A.F.H.; Ashley, R.P. Discrimination of hydrothermaly altered rocks and unaltered rocks in visible and near infrared multispectral images. Geophysics 1977, 42, 522–535. [Google Scholar] [CrossRef]
  73. Crowley, J.K.; Brickey, D.W.; Rowan, L.C. Airborne imaging spectrometer data of the Ruby Mountains, Montana: Mineral discrimination using relative absorption band-depth images. Remote Sens. Environ. 1989, 29, 121–134. [Google Scholar] [CrossRef]
  74. Boardman, J.W.; Kruse, F.A.; Green, R.O. Mapping target signatures via partial unmixing of AVIRIS data, Summaries of the fifth annual JPL airborne geosciences workshop. In Jet Propulsion Laboratory Special Publication; 1995. Available online: http://aviris.jpl.nasa.gov/proceedings/index.html (accessed on 7 May 2016). [Google Scholar]
  75. Ninomiya, Y.; Fu, B.; Cudahy, T. Detecting lithology with Advanced Spaceborne Thermal Emission and Refection Radiometer (ASTER) multispectral thermal infrared “radiance-at-sensor” data. Remote Sens. Environ. 2005, 99, 127–139. [Google Scholar] [CrossRef]
  76. Kruse, F.A.; Perry, S.L. Improving multispectral mapping by spectral modeling with hyperspectral signatures. J. Appl. Remote Sens. 2009, 3. [Google Scholar] [CrossRef]
  77. Boardman, J.W.; Kruse, F.A. Analysis of imaging spectrometer data using N-dimensional geometry and a mixture-tuned matched filtering approach. IEEE Trans. Geosci. Remote Sens. 2011, 49, 4138–4152. [Google Scholar] [CrossRef]
  78. Hewson, R.D.; Mah, A.; Dunne, M.; Cudahy, T.J. Mapping Mineralogical and structural relationships with satellite-borne ASTER and airborne geophysics at Broken Hill. In Proceedings of the ASEG 16th Geophysical Conference and Exhibition, Adelaide, Australia, 16–19 February 2003.
  79. Green, A.A.; Berman, M.; Switzer, B.; Craig, M.D. A transformation for ordering multispectral data in terms of image quality with implications for noise removal. IEEE Trans. Geosci. Remote Sens. 1988, 26, 65–74. [Google Scholar] [CrossRef]
  80. Green, R.O.; Boardman, J.W. Exploration of the Relationship between Information Content and Signal-to-Noise Ratio and Spatial Resolution in AVIRIS Spectral Data. In Summaries of the Ninth Annual JPL Airborne Geosciences Workshop; Available online: http://aviris.jpl.nasa.gov/proceedings/index.html (accessed on 7 May 2016).
  81. Boardman, J.W.; Green, R.O. Exploring the Spectral Variability of the Earth as Measured by AVIRIS in 1999. In Summaries of the Ninth Annual JPL Airborne Geosciences Workshop; Available online: http://aviris.jpl.nasa.gov/proceedings/index.html (accessed on 7 May 2016).
  82. Duke, E.F. Near infrared spectra of muscovite, Tschermak substitution and metamorphic reaction progress: Implications for remote sensing. Geology 1994, 22, 621–624. [Google Scholar] [CrossRef]
  83. Clark, R.N.; King, T.V.V.; Klejwa, M.; Swayze, G.A. High spectral resolution reflectance spectroscopy of minerals. J. Geophys. Res. 1990, 95, 12653–12680. [Google Scholar] [CrossRef]
  84. Tang, J.X.; Sun, X.G.; Ding, S.; Wang, Q.; Wang, Y.Y.; Yang, C.; Chen, H.Q.; Li, Y.B.; Li, Y.B.; Wei, L.J.; et al. Discovery of the Epithermal Deposit of Cu (Au-Ag) in the Duolong Ore Concentrating Area, Tibet. Acta Geosci. Sin. 2014, 35, 6–10. [Google Scholar] [CrossRef]
  85. Tang, J.X.; (MLR Key Laboratory of Metallogeny and Mineral Assessment, Institute of Mineral Resources, CAGS, Beijing, China); Duo, J.; (Tibet Bureau of Geology and Mineral Exploration and Development, Lhasa, Tibet, China); Li, J.G.; (Tibet Bureau of Geology and Mineral Exploration and Development, Lhasa, Tibet, China); Zhong, K.H.; (College of Earth Sciences, Chengdu University of Technology, Chengdu, China); Zhang, T.B.; (College of Earth Sciences, Chengdu University of Technology, Chengdu, China). Personal communication, 2011.
Figure 1. (a) Geographical map; (b) sketch tectonic map and generalized geologic map; (c) the Duolong PCD (Modified from [55]).
Remotesensing 08 00890 g001
Figure 2. ASTER and L8-OLI pre-processing steps and AO integrating processing flowchart.
Remotesensing 08 00890 g002
Figure 3. (a) The histogram of spectral offset values between O3 and A1, O4 and A2; (b) Two-dimensional scatterplot and linear fitting of O3 and A1 (Skipping 200 pixels to display); (c) Two-dimensional scatterplot and linear fitting of O4 and A2 (Skipping 200 pixels to display); (d) Mean linear fitting in OLI VNIR bands and ASTER VNIR bands.
Remotesensing 08 00890 g003
Figure 4. The OLI false color composite image (band 7, 5, 2 in RGB) of the Duolong area, Tibetan Plateau showing the field sample locations.
Remotesensing 08 00890 g004
Figure 5. Laboratory and field samples of mineral reflectance spectra in study area. The spectra of Res. are resampled to AO bandpasses. (a) F3: field sample number 3; Muscovite GDS 113 Ruby coming from USGS-SL; (b) F12: field sample number 12; Kaolinite CM9 coming from USGS-SL; (c) F8: field sample number 8; Limonite HS41.3 coming from USGS-SL; (d) F4: field sample number 4; Chlorite SMR-13.a coming from USGS-SL.
Remotesensing 08 00890 g005
Figure 6. The MNF images and eigenvalues (Eig) of AO and ASTER data. (a) The MNF images of AO data; (b) The MNF images of ASTER data; (c) The eigenvalues of AO MNF and ASTER MNF images.
Remotesensing 08 00890 g006
Figure 7. The abundance of Al-OH group minerals of Duolong PCD. (a) Al-OH1, ASTER RBD (B5 + B7)/B6 (Threshold 94.6%); (b) Al-OH2, ASTER SWIR bands MTMF (Infeasibility < 5); (c) Al-OH3, ASTER SWIR bands MTMF (Infeasibility < 5); (d) False color composite image of Al-OH composition in ASTER BRs B5/B6 (R), B7/B6 (G), B7/B5 (B) (Threshold 97.5%). The green dotted line shows the altered zone outline from field investigations of Duolong PCD. The white areas indicate background values.
Remotesensing 08 00890 g007
Figure 8. The field photographs of the study areas. (a) regional view of propylitic zone of Duobuza PCD in site 2; (b) regional view of phyllic zone of Duobuza PCD in site 1; (c) ferruginization in propylitic zone of Duobuza PCD in site 4; (d) ferruginization and kaolinization in phyllic zone of Bolong PCD in site 7; (e) ferruginization of cryptoexplosion breccia in phyllic zone, Bolong PCD, site 10; (f) granodiorite-porphyry outcrop in site 9. For the geographical location of the sites see Figure 4.
Remotesensing 08 00890 g008
Figure 9. The abundance of Mg-OH group minerals of Duolong PCD. (a) Mg-OH1, ASTER RBD (B6 + B9)/B8 (Threshold 98.6%); (b) Mg-OH2, ASTER SWIR bands MTMF (Infeasibility < 5). The green dotted line shows the altered zone outline from field investigations of Duolong PCD. The white areas indicate background values.
Remotesensing 08 00890 g009
Figure 10. The abundance of ferric iron and ferrous iron group minerals of Duolong PCD. (a) FI1, ASTER RB B2/B1 (Threshold 90.8%); (b) FI1, AO RB B4/B1 (Threshold 98.5%); (c) FI1, ASTER RB B4/B3 (Threshold 95.5%); (d) FI1, AO RB B7/B6 (Threshold 97.8%); (e) FI2, AO VNIR bands MTMF (Infeasibility < 5); (f) FI3, ASTER RB B5/B4 (Threshold 94.9%). The green dotted line shows the altered zone outline from field investigations of Duolong PCD. The white areas indicate background values.
Remotesensing 08 00890 g010
Figure 11. Simplified alteration map illustrates the distribution of hydrothermal alteration zones in the Duolong PCD, the phyllic, argillic and propylitic zones are produced using MTMF of ASTER SWIR data, the gossans are produced using BR B4/B1 and MTMF of AO VNIR data.
Remotesensing 08 00890 g011
Table 1. Performance characteristics of the ASTER, ETM+, and L8 OLI sensors.
SensorsSubsystemBand NumberSpectral Range (μm)Ltypical SNR 1Spatial Resolution (m)Swath Width (km)
ASTERVNIR10.52~0.603701560
20.63~0.69306
3N0.78~0.86202
3B0.78~0.86183
SWIR41.600~1.70046630
52.145~2.185254
62.185~2.225229
72.235~2.285234
82.295~2.365258
92.360~2.430231
ETM+VNIR8(Pan)0.520~0.9001615185
10.450~0.5154030
20.525~0.60541
30.633~0.69028
40.780~0.90035
SWIR51.550~1.75036
72.090~2.35029
OLIVNIR8(Pan)0.500~0.68014915185
10.433~0.45323830
20.450~0.515364
30.525~0.600302
40.630~0.680227
50.850~0.880204
SWIR61.560~1.660265
72.100~2.300334
91.360~1.390165
1. SNR at specified levels of typical spectral radiance (Ltypical).
Table 2. Characteristics of the ASTER+OLI (AO) data.
SubsystemBand NumberASTER/OLI Band CorrespondenceSpectral Range (μm)Center Wavelength (μm)FWHMLtypical SNR
VNIR1OLI10.433~0.4530.4430.020238
2OLI20.450~0.5150.4830.065364
3ASTER10.52~0.600.5600.080370
4ASTER20.63~0.690.6600.060306
5ASTER3N0.78~0.860.8200.080204
6OLI50.850~0.8800.8650.030460
SWIR7ASTER41.600~1.7001.6500.100466
8ASTER52.145~2.1852.1650.040254
9ASTER62.185~2.2252.2050.045229
10ASTER72.235~2.2852.2600.050234
11ASTER82.295~2.3652.3300.070258
12ASTER92.360~2.4302.3950.070231
Spatial resolution 30 m, max swath width 60 km. FWHM, Full Width Half Maximum.
Table 3. The alteration zones and alteration minerals of 12 samples.
SamplesAlteration ZonesAlteration Minerals or Granite
1PhyllicLimonite
2PropyliticChlorite
3PhyllicMuscovite
4PropyliticChlorite
5PropyliticLimonite, chlorite
6Phyllic + argillicMuscovite
7ArgillicKaolinite
8Phyllic + argillicLimonite
9PhyllicGranodiorite-porphyry
10PhyllicMuscovite, limonite
11Phyllic + argillicLimonite
12Phyllic + argillicKaolinite
Table 4. The BRs, RBDs and MTMF parameters used in the study.
Group MineralsObjects IdentifiedASTER Bands ParametersAO Bands Parameters
Al-OH1Muscovite, kaolinite, illite,RBD: (B5 + B7)/B6
[32,57,60,61,78]
RBD *: (B8 + B10)/B9
Al-OH2Muscovite, kaolinite, illite, smectiteMTMF: B4~B9MTMF *: B7~B12
Al-OH3Kaolinite, dickiteMTMF: B4~B9MTMF *: B7~B12
White mica compositionAl-rich mica, Al-poor micaBRs: B5/B6, B7/B6, B7/B5
[32,60,78]
BRs *: B8/B9, B9/B8, B10/B8
Mg-OH1Chlorite, epidoteRBD: (B6 + B9)/B8 [25,32,60]RBD *: (B9 + B12)/B11
Mg-OH2Chlorite, epidoteMTMF: B4~B9MTMF *: B7~B12
Ferric iron (FI1)Hematite, goethiteBRs: B2/B1 [25,57], B4/B3BRs: B7/B6, B4/B1
Ferric iron (FI2)Goethite MTMF: B1~B7
Ferrous iron (FI3)Magnetite, pyriteBR: B5/B4 [56,60]BR *: B7/B5
* The used AO bands entirely integrated from ASTER bands (Table 2).

