Article

An Effective Method for Snow-Cover Mapping of Dense Coniferous Forests in the Upper Heihe River Basin Using Landsat Operational Land Imager Data

1
College of Earth and Environmental Sciences, Lanzhou University, Lanzhou 730000, China
2
Cold & Arid Region Environmental & Engineering Research Institute, Chinese Academy of Sciences, Lanzhou 730000, China
*
Author to whom correspondence should be addressed.
Remote Sens. 2015, 7(12), 17246-17257; https://doi.org/10.3390/rs71215882
Submission received: 10 October 2015 / Revised: 4 December 2015 / Accepted: 11 December 2015 / Published: 18 December 2015

Abstract

:
The Normalized Difference Snow Index (NDSI) is an effective index for snow-cover mapping at large scales, but in forested regions the identification accuracy for snow using the NDSI is low because of forest cover effects. In this study, typical evergreen coniferous forest zones on Qilian Mountain in the Upper Heihe River Basin (UHRB) were chosen as example regions. By analyzing the spectral signature of snow-covered and snow-free evergreen coniferous forests with Landsat Operational Land Imager (OLI) data, a novel spectral band ratio using near-infrared (NIR) and shortwave infrared (SWIR) bands, defined as (ρnir − ρswir)/(ρnir + ρswir), is proposed. Our research shows that this band ratio, named the normalized difference forest snow index (NDFSI), can be used to effectively distinguish snow-covered evergreen coniferous forests from snow-free evergreen coniferous forests in UHRB.

Graphical Abstract

1. Introduction

Snow plays an important role for regional climate change, the quality of the environment, and the daily lives of humans. Estimates of snow-covered areas and the snow depth/water equivalent are important parameters for regional climate change studies, agriculture, and water resource management. Improving techniques for global and regional snow-cover mapping will benefit both environmental interests and hydrological research [1,2,3]. However, traditional in situ measurements provide snow observations for limited areas only [4]. Over the past several decades, satellite remote sensing has been widely used for monitoring snow cover because it enables observations of large and remote areas [5,6,7,8,9].
Among these remote sensing techniques, microwave images are difficult to interpret, and their low spatial resolution makes passive microwave sensors suitable primarily for global snow monitoring [10]. Optical images, on the other hand, can provide accurate snow-cover estimates in cloud-free situations [11]. Snow-cover mapping methods based on optical images include unsupervised and supervised classification algorithms [12], spectral mixture analysis [13], and the MODIS snow-mapping algorithm [14].
In general, the accuracy of snow-cover mapping methods is significantly higher in non-forested areas than in forested areas. Trees increase the complexity of a scene by masking snow on the ground and influencing the satellite-measured radiance. The forest canopy impairs the detection of snow underneath and remote sensing methods consequently tend to underestimate the snow coverage [15,16,17].
The Normalized Difference Snow Index (NDSI) is widely used for snow-cover mapping at large scales [18]. However, research has shown that when the underlying surface consists of vegetation, especially dense forest, applying the NDSI to identify snow leads to low accuracy [19]. In recent years, additional mapping methods for snow-covered forests have been developed. Vikhamar and Solberg in Norway used a linear spectral mixture model, which includes end members for snow, conifers, braches of leafless deciduous trees, and snow-free ground to calculate fractional snow cover [10]. However, this model needs in situ reflectance measurements, surface area proportions, and the individual tree species as input factors. Metsämäki et al. proposed the SCAmod algorithm for fractional snow-cover mapping of boreal forests [20]. This method is based on a semi-empirical reflectance model, and the model essentially depends on the apparent forest transmittance, which must be determined in advance for each unit area. Wang et al. presented a method to retrieve snow information for the coniferous forests of Tianshan Mountain using Multi-angle Imaging SpectroRadiometer (MISR) data [21]. Their results indicate that multi-angle remote sensing has the potential to address snow-mapping problems in forested areas, but lacks quantitative analysis.
The Heihe River Basin (HRB; see Section 2) is a typical inland river basin in an arid area of western China. The Upper HRB (UHRB) is rich in water resources in the form of snow, which represents the majority of the water resources for the entire HRB [22]. A slight change in snow cover in the UHRB would greatly affect the water budget of the Heihe River, thus triggering a chain reaction that would affect agriculture and vegetation in the entire basin area [23]. So, the accuracy of snow-cover mapping is very important to the Heihe River hydrological process.
The objective of this work is to improve the accuracy of snow-cover estimates for the forests of the UHRB. To this end, we present a simplified reflectance model suitable for snow-cover mapping in evergreen coniferous forests. The study area and the data are described in Section 2. The methodology is presented in Section 3. The experiment and verification are in Section 4. The discussion is in Section 5. Finally, the conclusion of this study is summarized in Section 6.

2. Study Area and Data
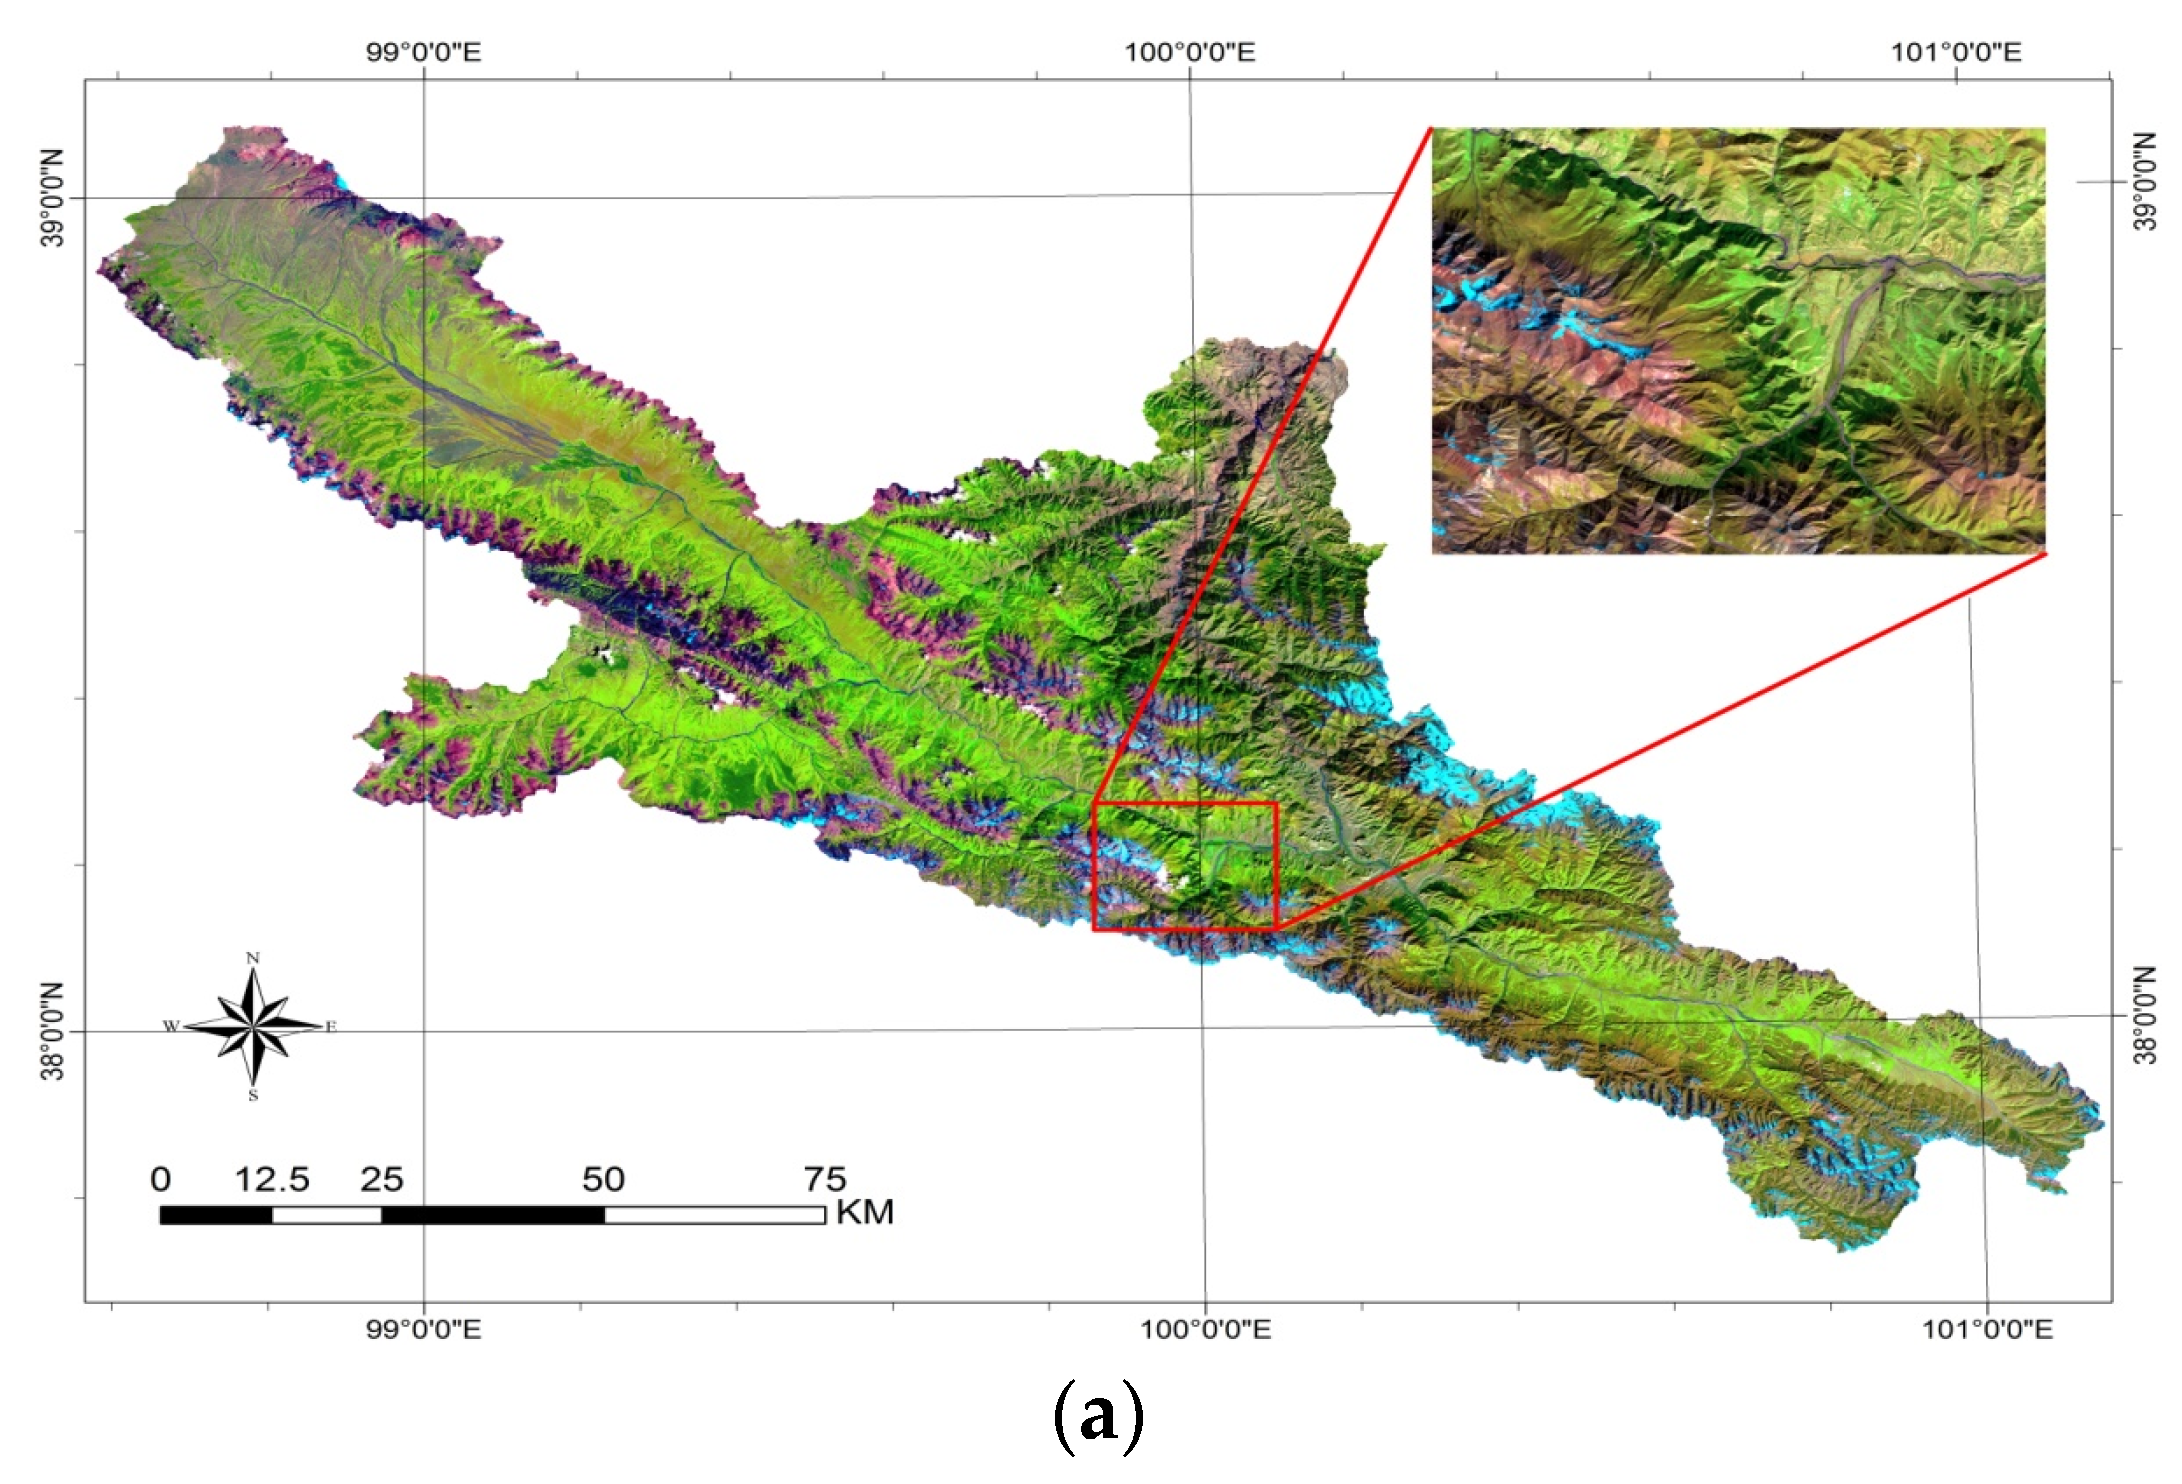
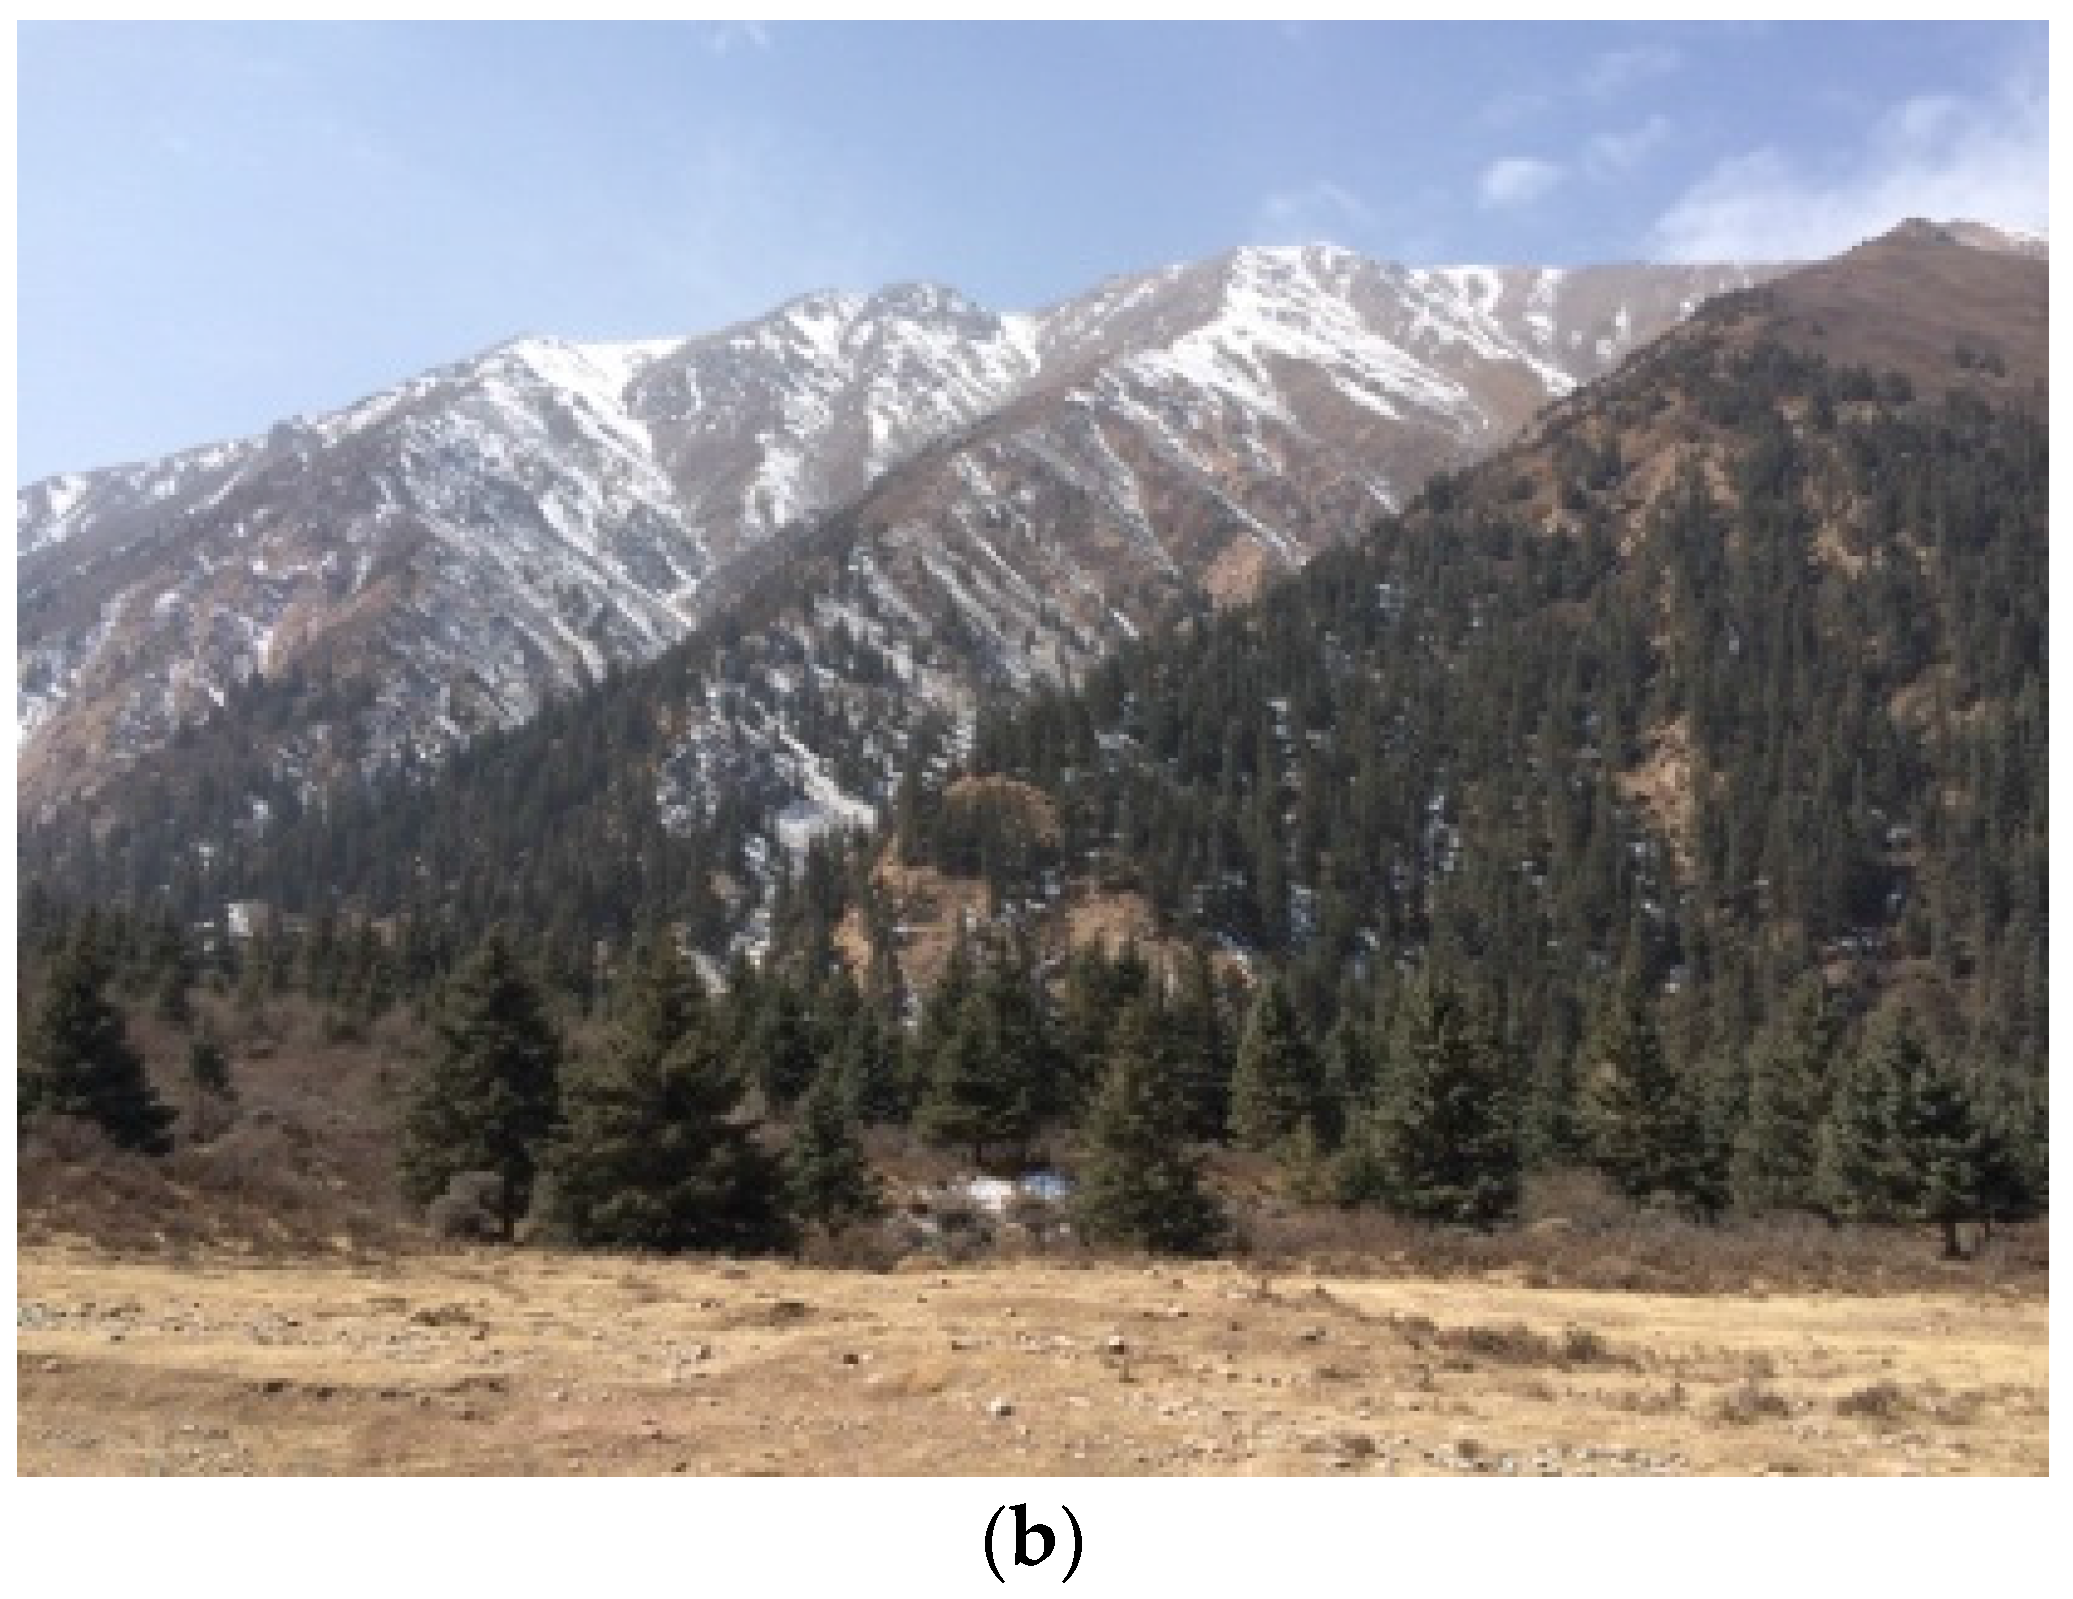
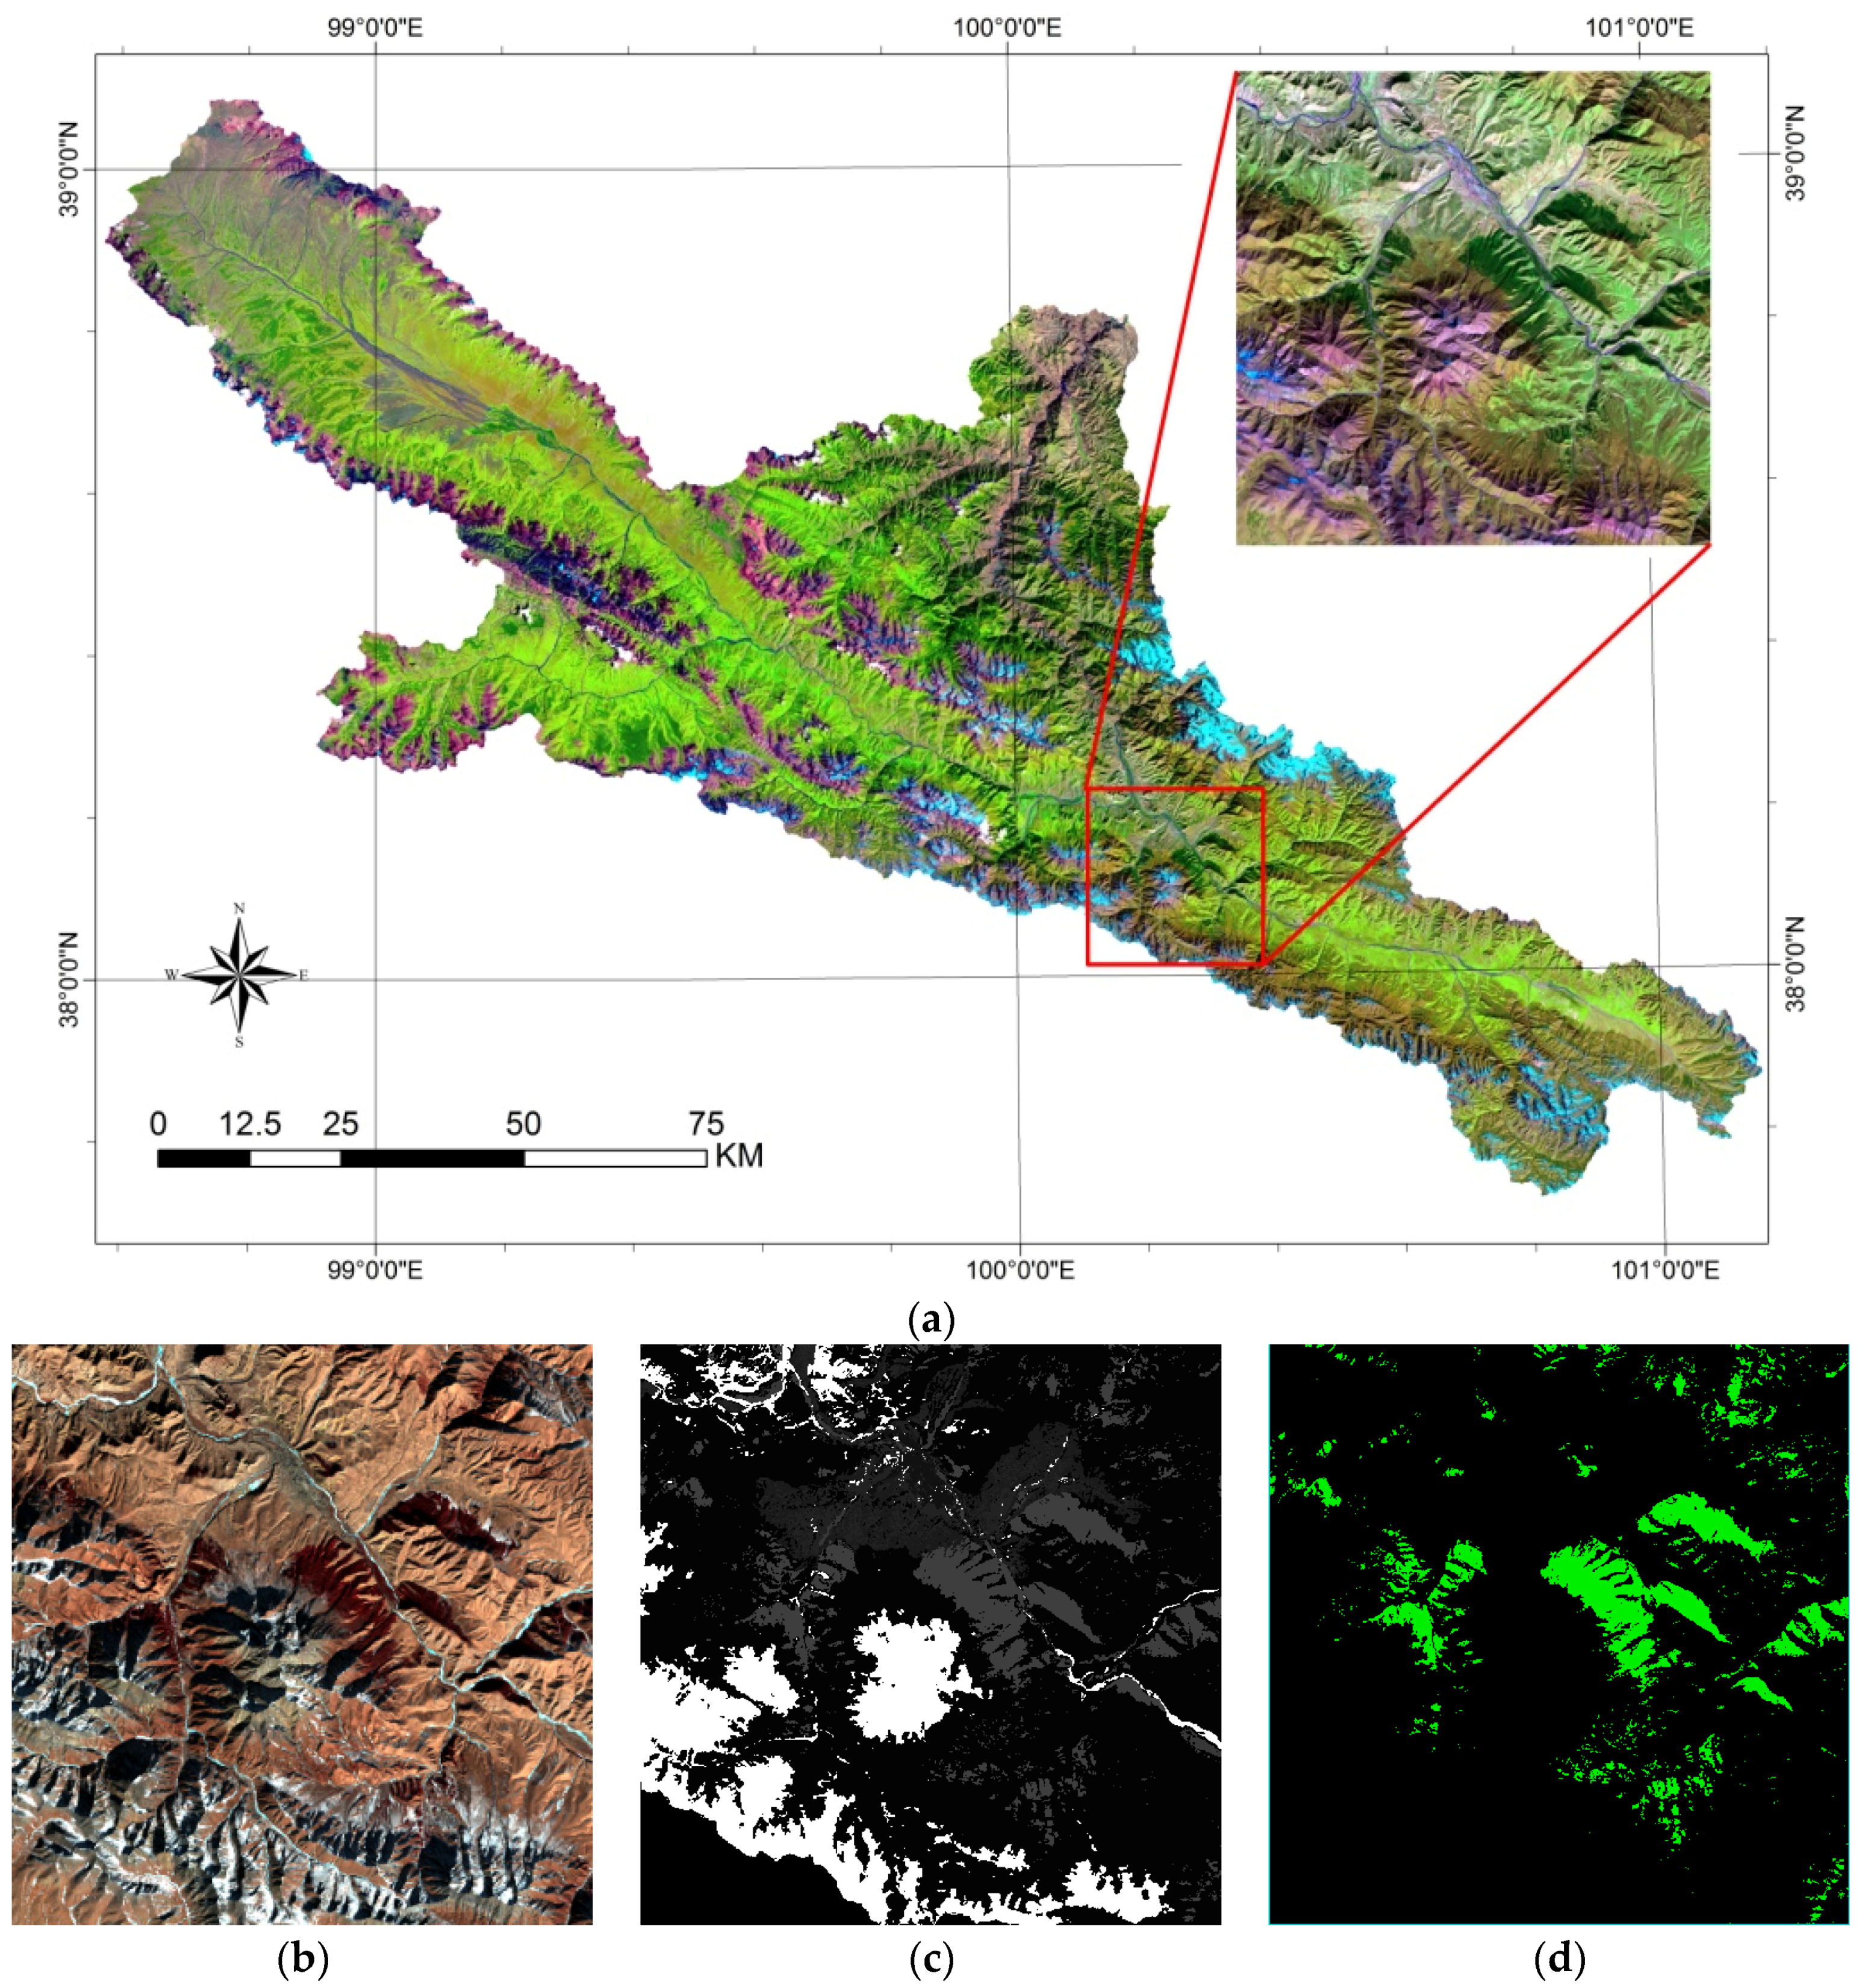
2.1. Study Area

The UHRB is located between 37.6°N–39.1°N and 98.7°E–101.2°E, covering an area of about 10,009 km2 with altitudes ranging from 1674 m to 5108 m. Temporary snow usually exists below 2700 m, patchy snowpack is found between 2700 and 3400 m, and perennial snowpack exists above 3400 m [24]. Figure 1a shows the study area and study sites. There is a large number of dense evergreen coniferous forests (Qinghai spruce) growing on the shaded and semi-shaded slopes at altitudes from 2700 m to 3300 m in the UHRB [25]. Evergreen coniferous forests are the typical forests in the mountains of northwestern China, and they are widely distributed on Qilian Mountain of the UHRB. The forests are covered with patchy snow during the winter season. Figure 1b is a photograph of one portion of the study sites.
Figure 1. Maps (a) and photograph (b) of the study area.
Remotesensing 07 15882 g001aRemotesensing 07 15882 g001b

2.2. Data

2.2.1. Landsat OLI Images

In order to conduct highly accurate snow-cover mapping at the basin scale, Landsat OLI images were chosen for this study. The OLI is mounted on the Landsat 8 satellite, which was launched on 12 February 2013. Table 1 summarizes the available bands and band wavelength ranges.
Table 1. Band characteristics of Landsat 8 OLI data.
Band No.Band NameWavelength Range (nm)GSD (m)
1New Deep Blue433–45330
2Blue450–51530
3Green525–60030
4Red630–68030
5NIR845–88530
6SWIR21560–166030
7SWIR32100–230030
8PAN500–68015
9SWIR1360–139030

2.2.2. Ancillary Data

The purpose of this study was to find an effective snow-cover mapping method for forests. The HRB classification map in Figure 2 shows the forested regions of the basin with a resolution of 30 m (Figure 2c) [26]. Digital elevation data were used to create a three-dimensional (3D) surface view showing the snow extraction result. A high-resolution GF-1 PMS image was used to verify the accuracy of the snow extraction. Figure 2 shows one of the study sites. Figure 2a is an OLI false color composite image acquired on 18 October 2013, showing no snow in the forest. Figure 2b is an OLI false color composite image acquired on 7 February 2014 , which is a winter image and most of the forest is covered with snow according to the high-resolution GF-1 PSM image taken at the same time. The green areas in Figure 2d are forests.
Figure 2. Landsat OLI false color composite image ((a) is acquired on 18 October 2013; (b) is acquired on 7 February 2014) and classification map (c) of the study site; (d) shows the forests in green.
Remotesensing 07 15882 g002

3. Methodology

3.1. Optical Properties of Snow

The underlying idea of using optical sensors to map snow is that snow has a distinctive spectral signature. Its reflectance is very high in the visible wavelengths, drops steeply in SWIR, and remains low for longer wavelengths [27]. Therefore, the normalized difference between green and SWIR reflectance, called NDSI, is widely used for characterizing snow. For Landsat 8 OLI, NDSI is defined as
NDSI = ρ green ρ swir 2 ρ green + ρ swir 2

3.2. Optical Properties of Snow-Covered Forest

In forests, as trees obscure snow on the ground surface, the spectrum acquired by the sensor is a mixed spectrum that includes snow, canopy, and snow-free ground (if the ground is not fully covered by snow). We only tried to find the spectral difference between snow-covered and snow-free forests in the Landsat OLI images, without considering the complexity of the terrain, the density of the forest, or other factors. Some sample points of snow and snow-covered forest are chosen in Figure 2b. Figure 3a shows the spectral signature of these points. The figure shows that, because of the forest effect, the visible reflectance of snow-covered forest is not as high as that of snow. Accordingly, it can be inferred that the NDSI, which is based on the spectral properties of snow, is not an effective index to extract snow information from forested areas.
Figure 3. Optical properties of snow, snow-covered forest, and snow-free forest. (a) The optical properties of snow and snow-covered forest; (b) the optical properties of snow-free forest and snow-covered forest.
Remotesensing 07 15882 g003

3.3. Differences in Optical Properties between Snow-Free and Snow-Covered Forest

The key problem in extracting snow information from forests using optical sensors is to find the differences in optical properties between snow-free and snow-covered forest. We chose the sample points in Figure 2a as “snow-free forest”, which represent the same locations as the “snow-covered forest” sample points chosen in Figure 2b. Figure 3b shows their spectral signature. There are obvious differences between the two images. The reflectance of snow-covered forest in the visible and near-infrared wavelengths is higher than that of the snow-free forest, while the reflectance in the SWIR2 and SWIR3 bands is lower than that of the snow-free forest. In this study, we chose cloud-free images of high quality, and the original images underwent atmospheric correction. Therefore, we believe that the observed changes in the spectral response of the forest are caused by the snow. The spectrum of snow-covered forest consists of a mixed spectrum of snow and forest canopy, in which the high reflectance of snow in the visible and near-infrared wavelengths enhances the reflectance of the forest in the corresponding bands, and the reflectance in the SWIR band is decreased because of the low reflectance of snow.
According to the above analysis, snow can change the spectral signature of forest, and it is possible to separate snow-covered from snow-free forest.

3.4. The Normalized Difference Forest Snow Index

In forested areas, the reflectance in the visible spectrum is low even though there is snow on the ground. However, the reflectance in the near-infrared spectrum is high, and will be higher if there is snow in the forest. Therefore, we propose a new spectral band ratio with bands NIR and SWIR, as shown in Equation (2), called the Normalized Difference Forest Snow Index (NDFSI).
NDFSI = ρ nir ρ swir 2 ρ nir + ρ swir 2
The statistical results for NDFSI and NDSI of the sample points in Figure 2b, which represent snow-covered forest, are shown in Figure 4a. The figure shows that, for snow-covered forest, the NDSI values vary from 0 to 0.9 with significant variance (0.19). This is because of the low reflectance of snow-covered forests in the visible spectrum, which causes the NDSI to be more easily affected by noise. Therefore, the NDSI it is not a good index for identifying snow in forested areas. On the other hand, the distribution of the NDFSI values for snow-covered forest varies within a smaller range (0.4–0.65) and shows less variance (0.05).
For snow-free forest, the NDFSI value is clearly lower than that of snow-covered forest, as shown in Figure 4b. Therefore, we believe that the new NDFSI index is effective for snow identification in forested areas.
Figure 4. The NDFSI and NDSI of the sample points. (a) The NDFSI and NDSI of snow-covered forest; (b) the NDFSI of snow-covered forest and snow-free forest.
Remotesensing 07 15882 g004

4. Experiment and Verification

4.1. Snow Extraction

To test the effectiveness of this new index, we chose another study site in our study area as shown in Figure 5a. Figure 5b is the OLI false color composite image, Figure 5c is the classification map, and Figure 5d shows forested areas in green.
Figure 5. (a) map of study area; (b) Landsat OLI false color composite image of a second study site; (c) classification map; (d) shows the forests in green.
Remotesensing 07 15882 g005
To extract snow information, the traditional NDSI was used in non-forested areas with a threshold value set to 0.4, according to the research by Hao et al. [28]. In forested areas, the NDFSI was used to identify snow with the NDFSI threshold value also set to 0.4, based on the statistical results. Figure 6a shows the snow extraction results and Figure 6b is a 3D representation of the snow distribution. In Figure 6, white areas represent non-forested areas with snow, black areas are non-forested areas without snow, yellow areas are forests with snow, and green areas are forests without snow.
Figure 6. Snow extraction results with NDFSI in forest areas and with NDSI in non-forest areas. (a) The snow extraction results; (b) the 3D representation of the snow distribution.
Remotesensing 07 15882 g006

4.2. Accuracy Assessment

4.2.1. Subjective Assessment

It can be seen from Figure 6 that most of the forested area is covered with snow and that some of the forest edge is without snow. It is known that snow at the edge of a forest usually melts earlier than snow in the middle of a forest. Therefore, our result is consistent with the snow distribution in nature.

4.2.2. Objective Assessment

Without concurrent field investigations, the accuracy of forest snow extraction was assessed using a high-resolution GF-1 image, which was acquired at the same time as the OLI image used in this study. Figure 7 is a GF-1 image of the study area.
In the GF-1 image of our study area, the presence of snow in the forest can be easily identified. Consequently, it is easy to distinguish snow-covered and snow-free forest in the GF-1 image of our study area. In the forested area, the accuracy evaluation of the snow extraction (the snow extraction result is shown in Figure 6) is performed in ENVI 5.1. Some sample points of snow-covered and snow-free forest in the GF-1 image are chosen randomly as the ground truth Region Of Interest (ROIs). The snow extraction result is compared with these ROIs, and the identification accuracy for snow can be acquired. In our experiment, the overall accuracy of snow extraction in forested areas is 93.92%.
To contrast the effectiveness of snow extraction in forested areas using NDSI and NDFSI, we tried to extract snow information using NDSI both in forested and non-forested areas. Figure 8 shows the snow extraction result with different NDSI threshold values. In Figure 8a,b, the respective NDSI threshold values are 0.4 and 0.3. We can see that it is difficult to identify snow in forested areas using NDSI, even when its threshold value is decreased.
Figure 7. GF-1 image used for accuracy evaluation.
Remotesensing 07 15882 g007
Figure 8. Snow extraction result with NDSI both in forested area and in non-forested area. (a) The NDSI threshold value is 0.4; (b) the NDSI threshold value is 0.3.
Remotesensing 07 15882 g008

5. Discussion

Forest represents a challenging problem for snow-cover mapping by optical satellite remote sensing. In forested areas, the identification accuracy for snow using NDSI is low. Vikhamar and Solberg proposed a method for subpixel mapping of snow cover in forests [10], and it was tested in flat terrain covered by spruce, pine and birch forests, close to the Jotunheimen region of south Norway. This method is based on linear spectral mixing modeling of snow, trees and snow-free ground, and therefore, in situ reflectance measurements, surface area proportions, and the individual tree species are necessary input factors. Metsämäki et al. proposed the SCAmod algorithm for fractional snow-cover mapping of boreal forests, and applied this model to NOAA/AVHRR data in drainage basins of Finland [20]. Wang et al. presented a method to retrieve snow information for the coniferous forests of Tianshan Mountain using MISR data [21].
The snow-cover mapping methods mentioned above are performed for different forest types in different study areas, and the low resolution data such as NOAA/AVHRR and MISR cannot meet the need of hydrological research on the basin scale. In order to improve the accuracy of snow extraction in the forested areas in the UHRB, a typical evergreen coniferous forest region in the UHRB is chosen as the study site. By analyzing the spectral difference between snow-covered and snow-free forests in OLI data, a new band ratio named NDFSI is proposed. In our study areas, the snow in evergreen coniferous forests can be identified effectively using NDFSI and the accuracy is satisfactory.
In this study, the methodology is only tested for the evergreen coniferous forests (Qinghai spruce) in the UHRB. In order to confirm the validity of NDFSI, more study sites are needed to perform more careful statistical analysis. Factors that affect the value of NDFSI should be discussed in the future.

6. Conclusions

Snow in the UHRB is the major water resource for the entire HRB. Snow distribution in the UHRB is an important factor in Heihe River hydrological research. Evergreen coniferous forests are widely distributed on Qilian Mountain of the UHRB, and it is challenging but necessary to extract snow information with high accuracy in these areas.
The typical evergreen coniferous forest region in the UHRB is chosen as study site. By analyzing the spectral signature of snow, snow-free forest and snow-covered forest in the study site with Landsat OLI data, the following conclusions are derived.
(1)
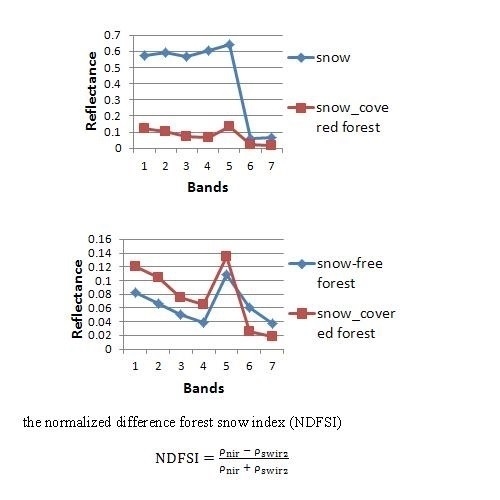
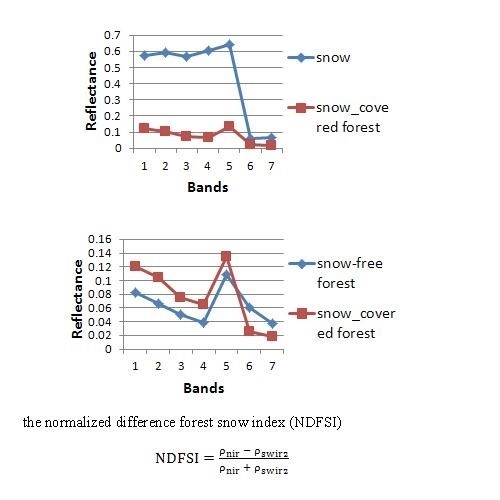
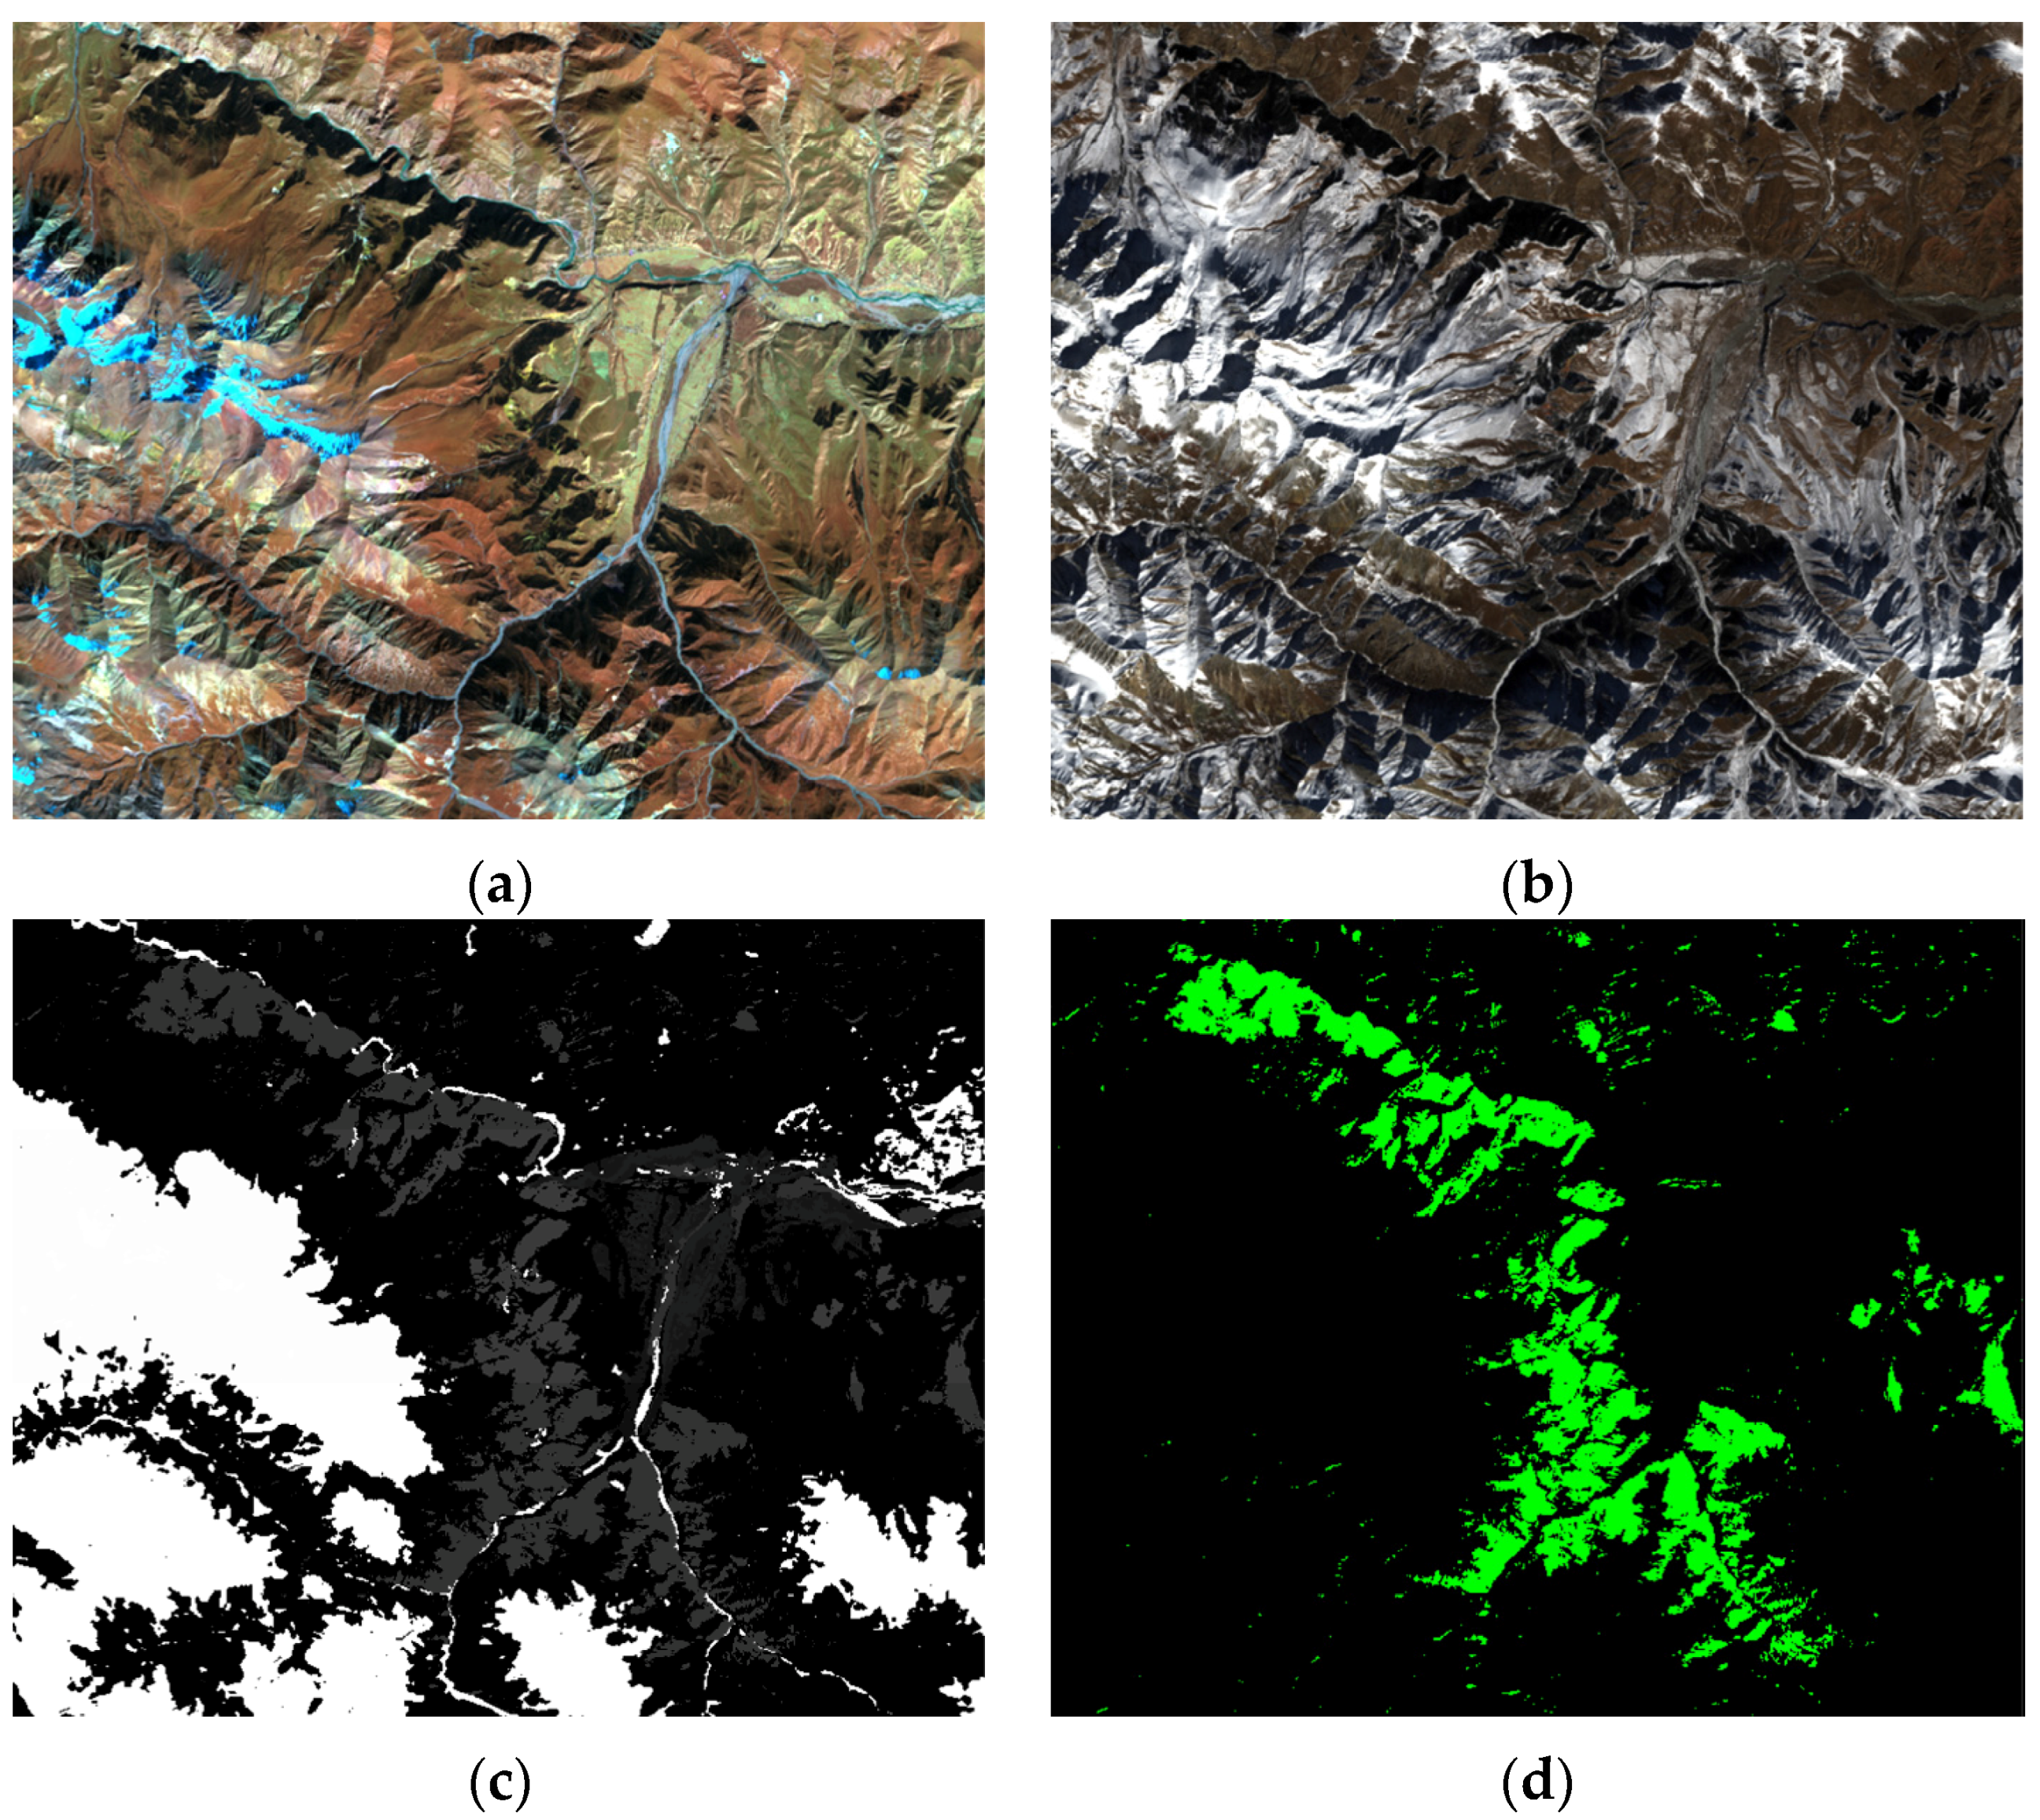
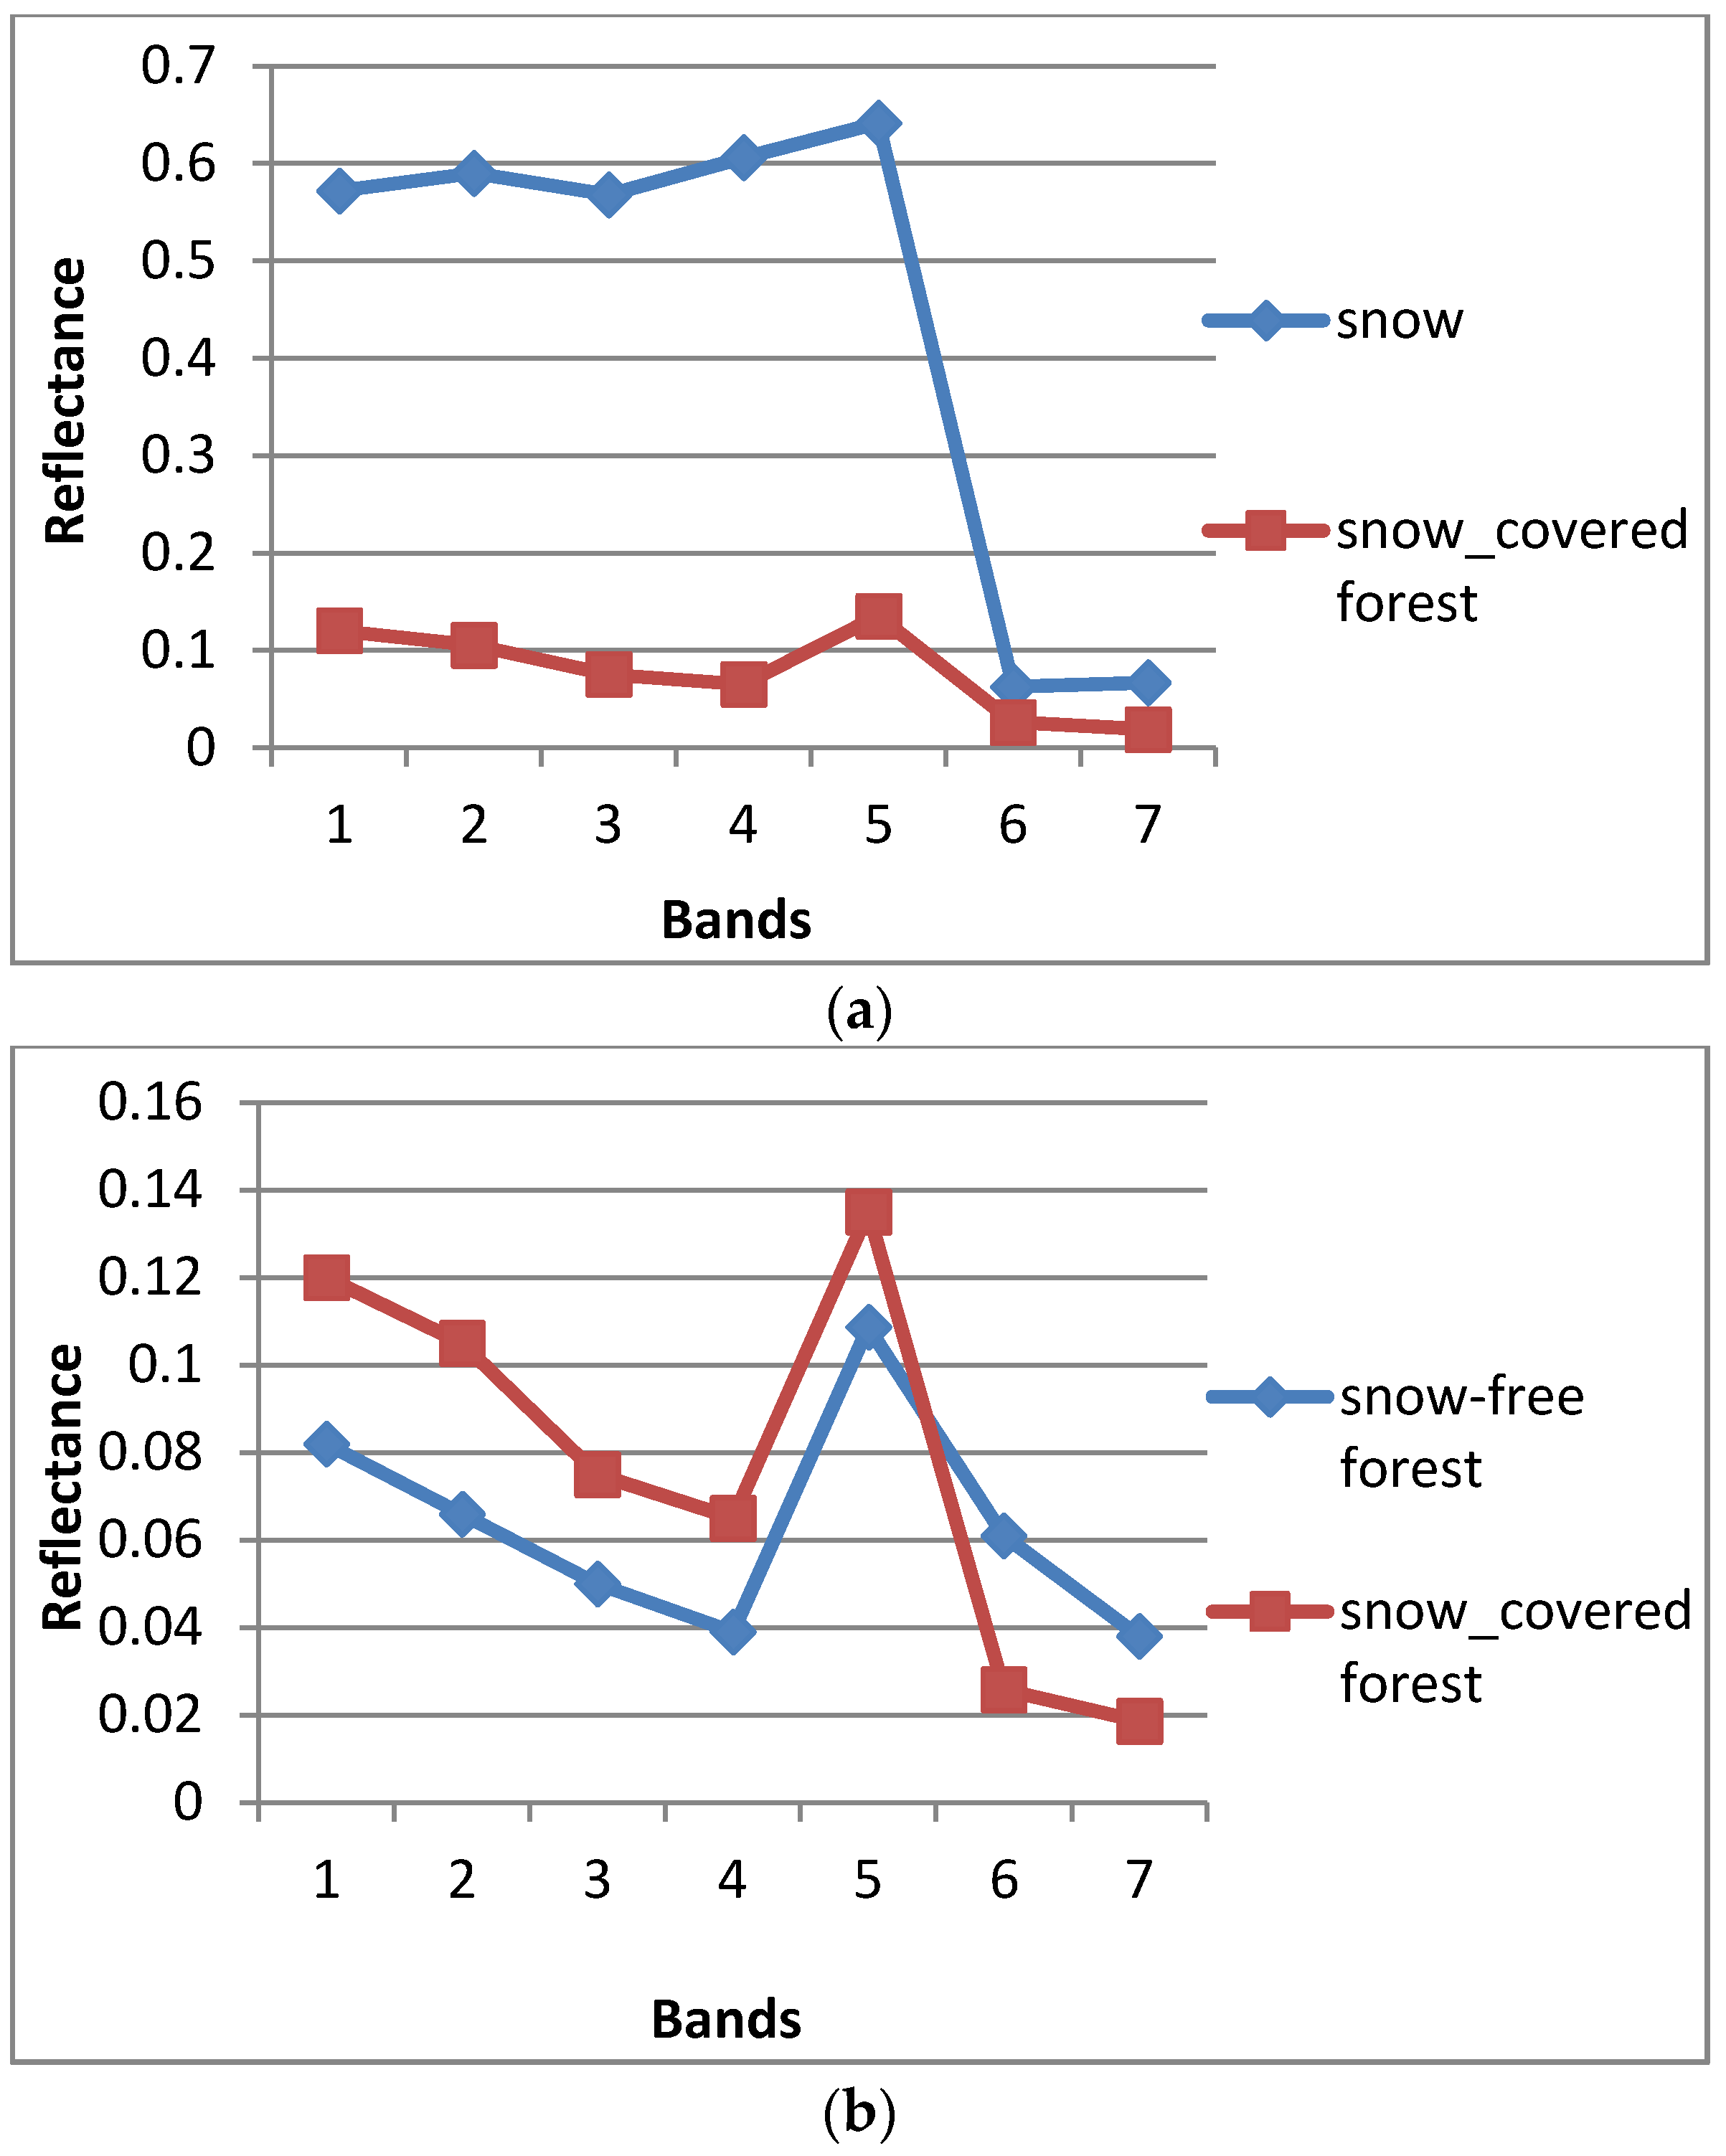
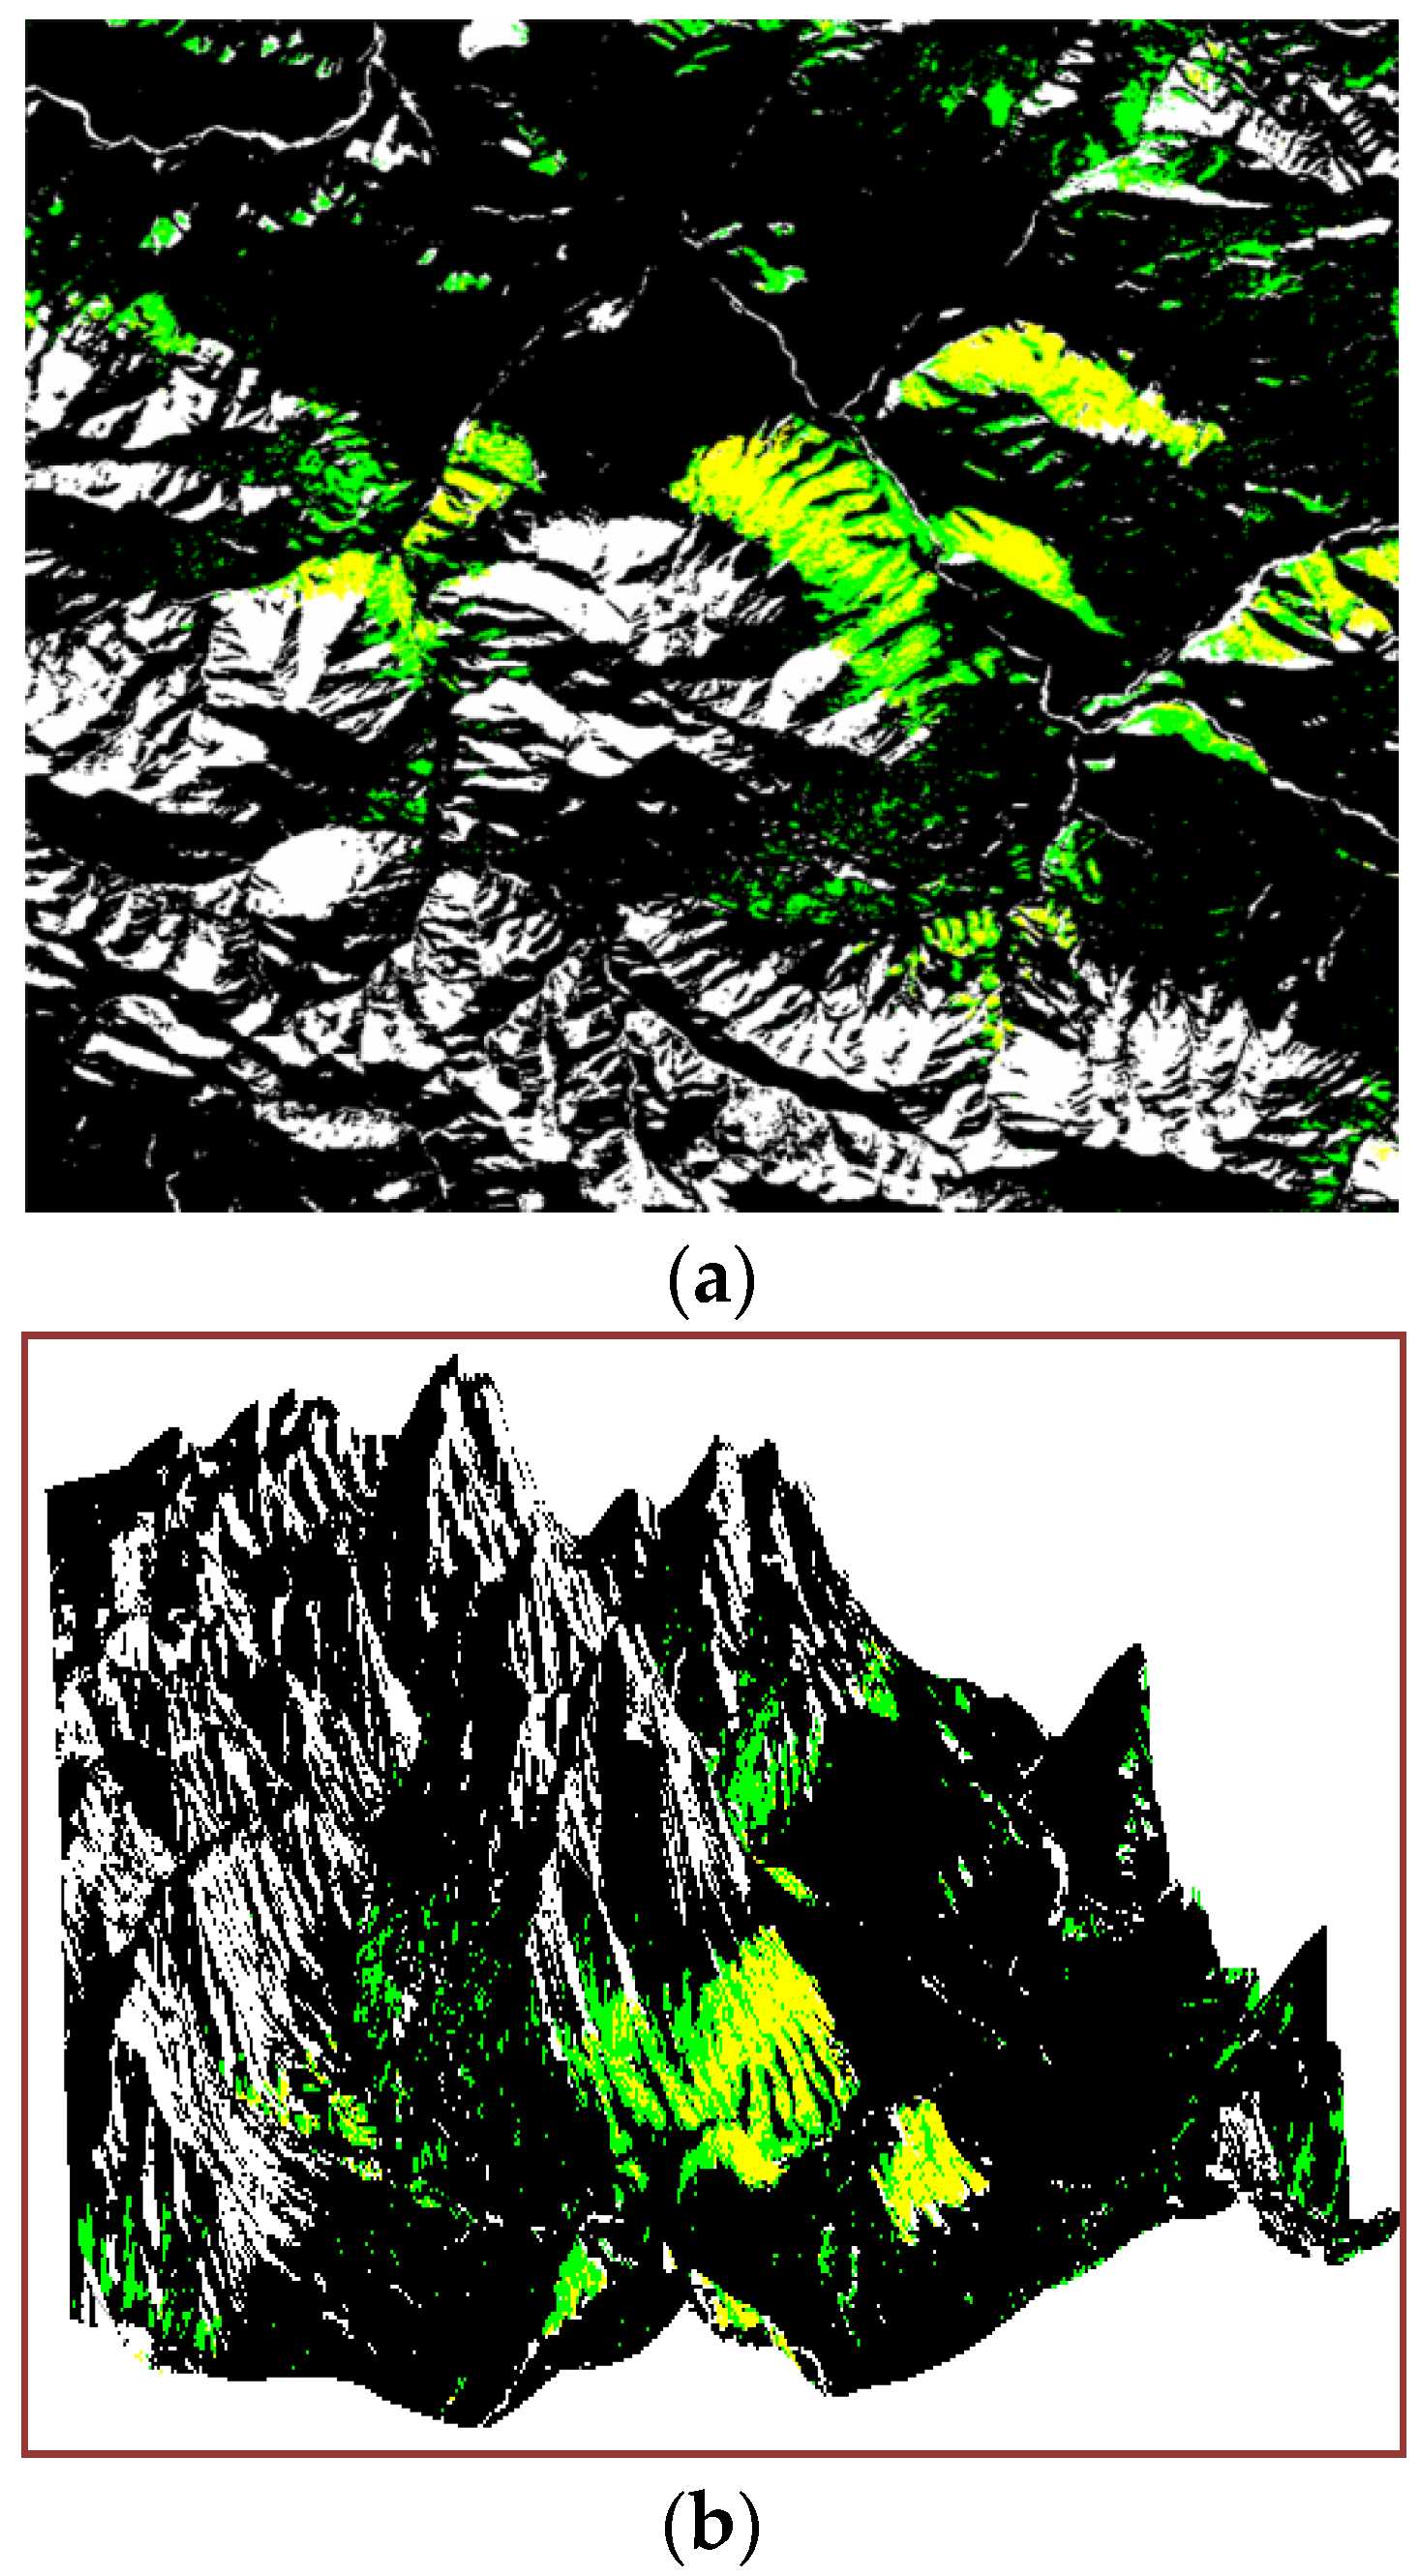
For the effect of forest canopy, the visible reflectance of snow-covered forest is much lower than that of snow (as shown in Figure 3a). It is difficult to extract snow in forested areas using NDSI, as most snow in forest cannot be identified even if the threshold value of NDSI is decreased (as shown in Figure 8).
(2)
Compared with snow-free forest, snow-covered forest has a higher NIR reflectance and lower SWIR reflectance (as shown in Figure 3b), and these changes in the spectral response maybe caused by the snow underneath the forest.
(3)
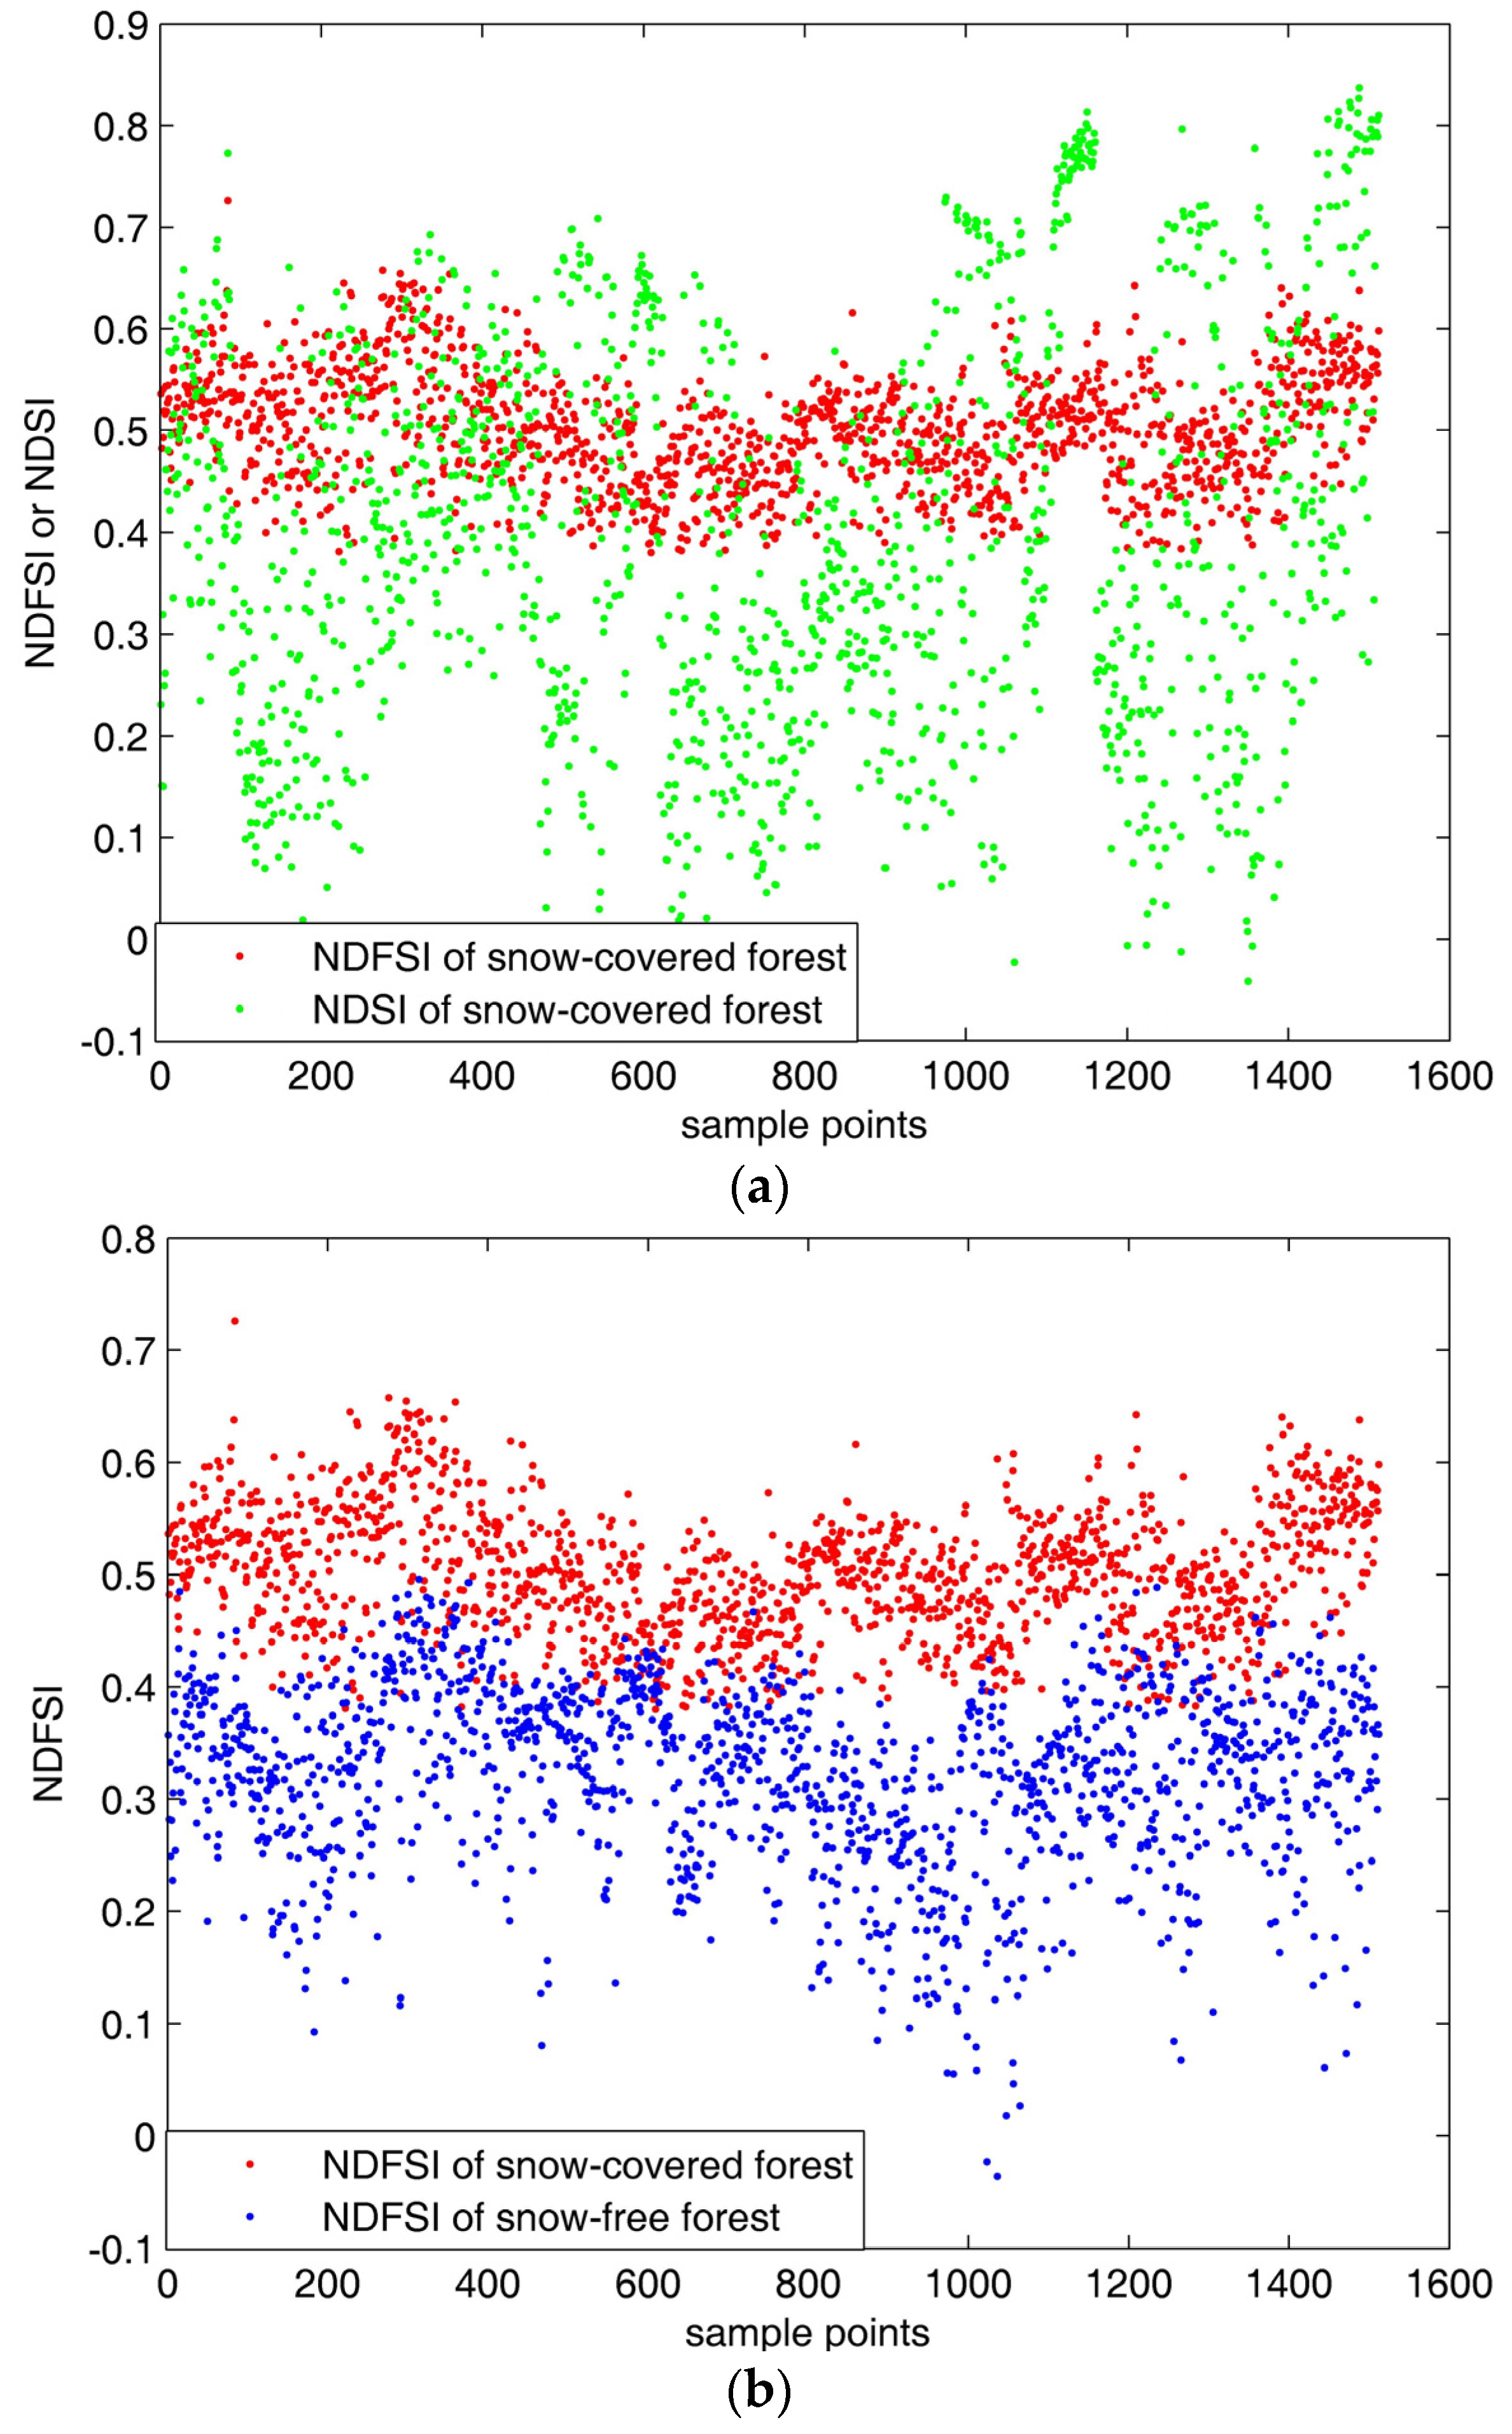
For snow-covered forest, the NDFSI, which is defined as (ρnir − ρswir)/(ρnir + ρswir), distributes with less variance than NDSI (as shown in Figure 4a).
(4)
For snow-covered forest, the NDFSI value is clearly higher than that of snow-free forest (as shown in Figure 4b).
(5)
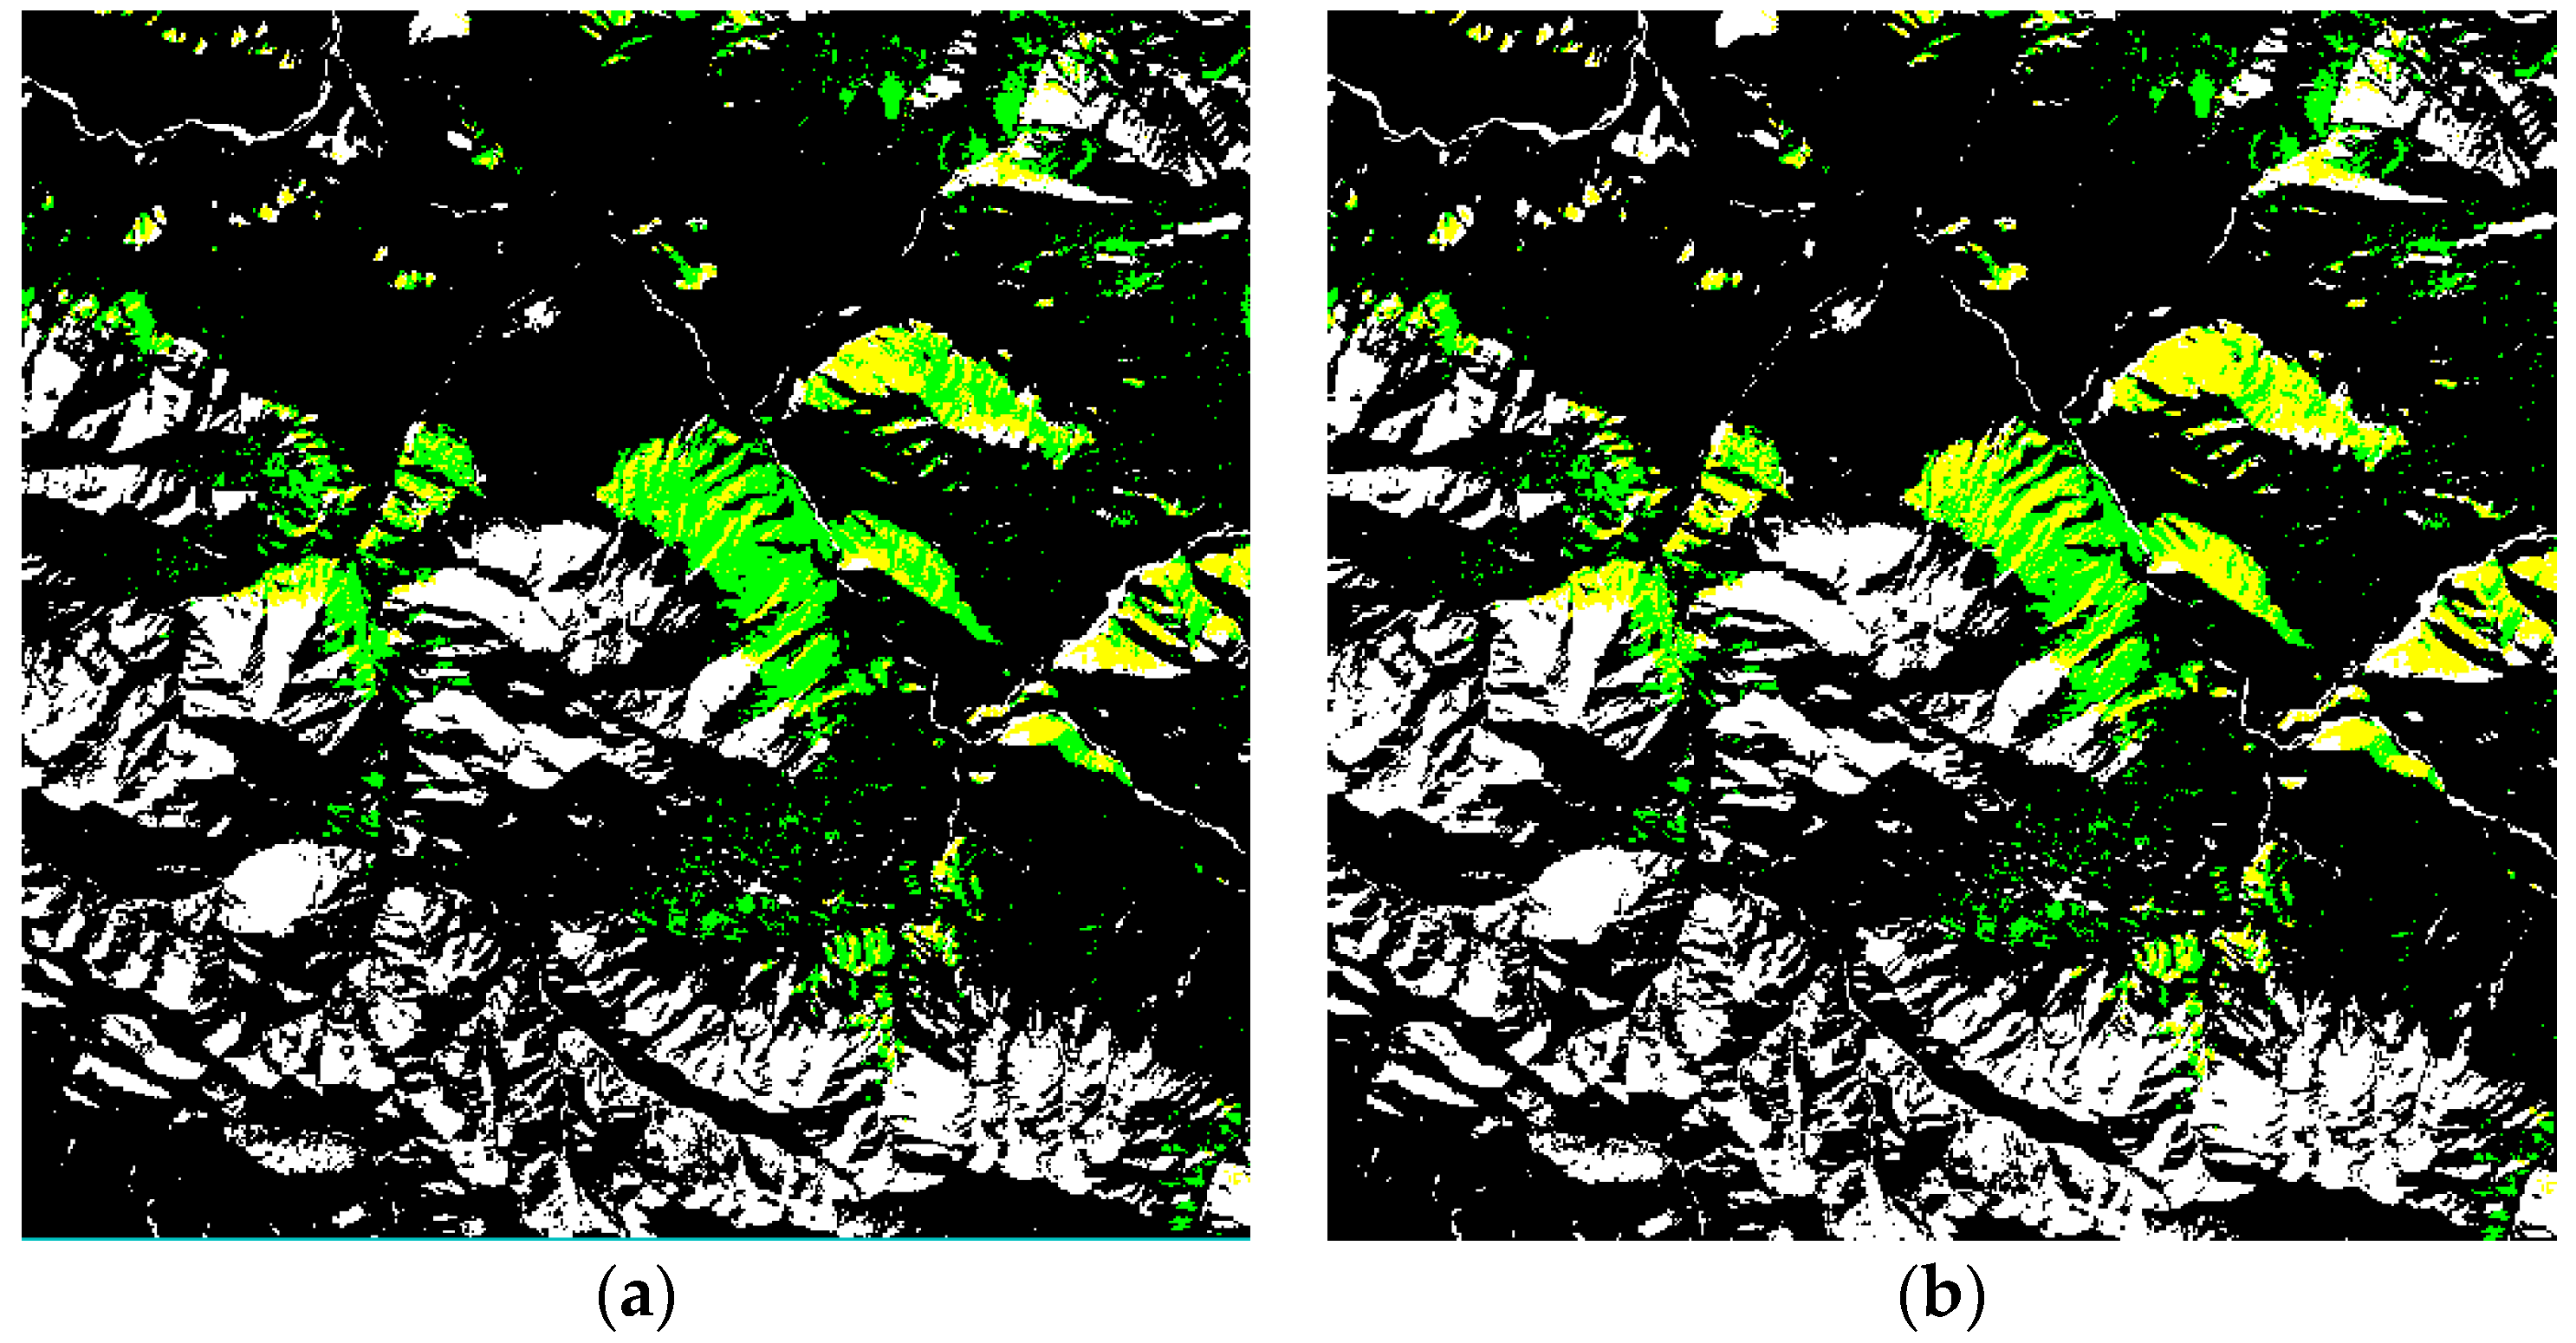
NDFSI is an effective index for snow-cover mapping in evergreen coniferous forests of our study site. The high accuracy of snow extraction is verified using GF-1 image.
In this study, the method is only tested for the evergreen coniferous forests (Qinghai spruce) in the UHRB. Some other test sites are needed to confirm its effectivity. Furthermore, future research will focus on factors affecting the NDFSI.

Acknowledgments

This work was partially supported by the National Natural Science Foundation of China (Grant Nos. 91325203, 41571371 and 41201437) and the Project for Incubation of Specialists in Glaciology and Geocryology of the National Natural Science Foundation of China (Grant No. J1210003/J0109). We would like to acknowledge the Cold and Arid Regions Environmental and Engineering Research Institute of the Chinese Academy of Sciences for providing the GF-1 image for data verification.

Author Contributions

Xiao Yan Wang designed and performed the experiment and finished the manuscript writing; Jian Wang reviewed the manuscript and made helpful suggestions; Zhi Yong Jiang, Hong Yi Li and Xiao Hua Hao provided a portion of the data and made helpful comments.

Conflicts of Interest

The authors declare no conflict of interest.

References

  1. Groisman, P.Y.; Karl, T.R.; Knight, R.W. Changes of snow cover, temperature, and radiative heat balance over the Northern Hemisphere. J. Clim. 1994, 7, 1633–1656. [Google Scholar] [CrossRef]
  2. Cess, R.D.; Potter, G.L.; Zhang, M.H.; Blanchet, J.P.; Chalita, S.; Colman, R.; Dazlich, D.A.; Delgenio, A.D.; Dymnikov, V.; Galin, V.; et al. Interpretation of snow-climate feedback as produced by 17 general circulation models. Science 1991, 253, 888–892. [Google Scholar] [CrossRef] [PubMed]
  3. Cohen, J. Snow and climate. Weather 1994, 49, 150–155. [Google Scholar] [CrossRef]
  4. Dai, L.Y.; Che, T. Spatiotemporal variability in snow cover from 1987 to 2011 in northern China. J. Appl. Remote Sens. 2013, 8. [Google Scholar] [CrossRef]
  5. Wang, J.; Li, H.X.; Hao, X.H.; Huang, X.D.; Hou, J.L.; Che, T.; Dai, L.Y.; Liang, T.G.; Huang, C.L.; Li, H.Y.; et al. Remote sensing for snow hydrology in China: challenges and perspectives. J. Appl. Remote Sens. 2014, 8. [Google Scholar] [CrossRef]
  6. Dozier, J.; Green, R.O.; Nolin, A.W.; Painter, T.H. Interpretation of snow properties from imaging spectrometry. Remote Sens. Environ. 2009, 113, s25–s37. [Google Scholar] [CrossRef]
  7. Dozier, J. Snow reflectance from Landsat-4 thematic mapper. IEEE Trans. Geosci. Remote Sens. 1984, 22, 323–328. [Google Scholar] [CrossRef]
  8. Salomonson, V.V.; Appel, I. Estimating fractional snow cover from MODIS using the normalized difference snow index. Remote Sens. Environ. 2004, 89, 351–360. [Google Scholar] [CrossRef]
  9. Painter, T.H.; Rittger, K.; Mckenzie, C.; Slaughter, P.; Davis, R.E.; Dozier, J. Retrieval of subpixel snow covered area, grain size, and albedo from MODIS. Remote Sens. Environ. 2009, 113, 868–879. [Google Scholar] [CrossRef]
  10. Vikhamar, D.; Solberg, R. Subpixel mapping of snow cover in forest by optical remote sensing. Remote Sens. Environ. 2002, 84, 69–82. [Google Scholar] [CrossRef]
  11. Solberg, R.; Hiltbrunner, D.; Koskinen, J. Snow Algorithms and Products—Review and Recommendations for Research and Development; NR Report No. 924; Norwegian Computing Center: Oslo, Norway, 1997; Volume 111. [Google Scholar]
  12. Baumgartner, M.F.; Rango, A. A microcomputer-based Alpine Snow-Cover Analysis System (ASCAS). Photogramm. Eng. Remote Sens. 1995, 61, 1475–1486. [Google Scholar]
  13. Painter, T.H.; Roberts, D.A.; Green, R.O.; Dozier, J. The effect of grain size on spectral mixture analysis of snow-covered area from AVIRIS data. Remote Sens. Environ. 1998, 65, 320–332. [Google Scholar] [CrossRef]
  14. Hall, D.K.; Riggs, G.A.; Salomonson, V.V. Development of methods for mapping global snow cover using moderate resolution imaging spectroradiometer data. Remote Sens. Environ. 1995, 54, 127–140. [Google Scholar] [CrossRef]
  15. Hall, D.K.; Foster, J.L.; Verbyla, D.L.; Klein, A.G.; Benson, C.S. Assessment of snow-cover mapping accuracy in a variety of vegetation-cover densities in Central Alaska. Remote Sens. Environ. 1998, 66, 129–137. [Google Scholar] [CrossRef]
  16. Metsämäki, S.; Mattila, O.P.; Pulliainen, J.; Niemi, K.; Luojus, K.; Böttcher, K. An optical reflectance model-based method for fractional snow cover mapping applicable to continental scale. Remote Sens. Environ. 2012, 123, 508–521. [Google Scholar] [CrossRef]
  17. Xin, Q.C.; Woodcock, C.E.; Liu, J.C. View angle effects on MODIS snow mapping in forests. Remote Sens. Environ. 2012, 118, 50–59. [Google Scholar] [CrossRef]
  18. Dozier, J. Spectral signature of Alpine snow cover from the Landsat thematic mapper. Remote Sens. Environ. 1989, 28, 9–22. [Google Scholar] [CrossRef]
  19. Rittger, K.; Painter, T.H.; Dozier, J. Assessment of methods for mapping snow cover from MODIS. Adv. Water Resour. 2013, 51, 367–380. [Google Scholar] [CrossRef]
  20. Metsämäki, S.; Anttila, S.; Huttunen, M. A feasible method for fractional snow cover mapping in boreal zone based on a reflectance model. Remote Sens. Environ. 2005, 95, 77–95. [Google Scholar] [CrossRef]
  21. Wang, L.X.; Xiao, P.F.; Feng, X.Z. Retrieving snow information in typical forest zone of Tianshan mountains from multi-angle imaging spetroradiometer data. J. Remote Sens. 2012, 5, 1035–1053. [Google Scholar]
  22. Li, X.; Cheng, G.D.; Liu, S.M.; Xiao, Q.; Ma, M.G.; Jin, R.; Che, T.; Liu, Q.H.; Wang, W.Z.; Qi, Y.; et al. Heihe watershed allied telemetry experimental research (HiWATER): Scientific objectives and experimental design. Bull. Am. Meteorol. Soc. 2013, 94, 1145–1160. [Google Scholar] [CrossRef]
  23. Bi, Y.B.; Xie, H.J.; Huang, C.L.; Ke, C.Q. Snow cover variations and controlling factors at Upper Heihe River Basin, Northwestern China. Remote Sens. 2015, 7, 6741–6762. [Google Scholar] [CrossRef]
  24. Wang, J.; Li, H.Y.; Hao, X.H. Responses of snowmelt runoff to climatic change in an inland river basin, northwestern China, over the past 50 years. J. Hydrol. Earth Sys. Sci. 2010, 15, 1979–1987. [Google Scholar] [CrossRef]
  25. Zhang, T.; Che, K.J.; Wang, H. Research on soil water dynamics along an elevation gradient in piceacrassifolia forestry lands in Qilian Mountains. Hubei Agric. Sci. 2009, 48, 1107–1111. (in Chinese). [Google Scholar]
  26. Zhong, B.; Ma, P.; Nie, A.H.; Yang, A.X.; Yao, Y.J.; Lü, W.B.; Zhang, H.; Liu, Q.H. Land cover mapping using time series HJ-1/CCD data. Sci. China Earth Sci. 2014, 57, 1790–1799. [Google Scholar] [CrossRef]
  27. Wiscombe, W.J.; Warren, S.G. A model for the spectral albedo of snow. J. Atmos. Sci. 1980, 37, 2712–2733. [Google Scholar] [CrossRef]
  28. Hao, X.H.; Wang, J.; Li, H.Y. Evaluation of the NDSI threshold value in mapping snow cover of MODIS-a case study of snow in the middle Qilian Mountains. J. Glaciol. Geocryol. 2008, 30, 132–138. (in Chinese). [Google Scholar]

