Article

Using High-Resolution Hyperspectral and Thermal Airborne Imagery to Assess Physiological Condition in the Context of Wheat Phenotyping

by
Victoria Gonzalez-Dugo
1,
Pilar Hernandez
1,
Ignacio Solis
2 and
Pablo J. Zarco-Tejada
1,*
1
Instituto de Agricultura Sostenible (IAS), Consejo Superior de Investigaciones Científicas (CSIC), Alameda del Obispo s/n, 14004 Cordoba, Spain
2
Agrovegetal S.A., Demetrio de los Rios 15, 41003 Sevilla, Spain
*
Author to whom correspondence should be addressed.
Remote Sens. 2015, 7(10), 13586-13605; https://doi.org/10.3390/rs71013586
Submission received: 28 July 2015 / Revised: 29 September 2015 / Accepted: 1 October 2015 / Published: 19 October 2015
(This article belongs to the Special Issue Remote Sensing in Precision Agriculture)

Abstract

:
There is a growing need for developing high-throughput tools for crop phenotyping that would increase the rate of genetic improvement. In most cases, the indicators used for this purpose are related with canopy structure (often acquired with RGB cameras and multispectral sensors allowing the calculation of NDVI), but using approaches related with the crop physiology are rare. High-resolution hyperspectral remote sensing imagery provides optical indices related to physiological condition through the quantification of photosynthetic pigment and chlorophyll fluorescence emission. This study demonstrates the use of narrow-band indicators of stress as a potential tool for phenotyping under rainfed conditions using two airborne datasets acquired over a wheat experiment with 150 plots comprising two species and 50 varieties (bread and durum wheat). The flights were performed at the early stem elongation stage and during the milking stage. Physiological measurements made at the time of flights demonstrated that the second flight was made during the terminal stress, known to largely determine final yield under rainfed conditions. The hyperspectral imagery enabled the extraction of thermal, radiance, and reflectance spectra from 260 spectral bands from each plot for the calculation of indices related to photosynthetic pigment absorption in the visible and red-edge regions, the quantification of chlorophyll fluorescence emission, as well as structural indices related to canopy structure. Under the conditions of this study, the structural indices (i.e., NDVI) did not show a good performance at predicting yield, probably because of the large effects of terminal water stress. Thermal indices, indices related to chlorophyll fluorescence (calculated using the FLD method), and carotenoids pigment indices (PRI and CAR) demonstrated to be better suited for screening complex traits such as crop yield. The study concludes that the indicators derived from high-resolution thermal and hyperspectral airborne imagery are efficient tools for field-based phenotyping providing additional information to standard NDVI imagery currently used.

Graphical Abstract

1. Introduction

Wheat provides 20% of the global population’s calorie intake and a similar percentage of its daily protein [1]. The global average rate of yield increase for wheat is 0.9% per year, while predictions of increase in demand reach 2.4% [2]. This means that the rate of genetic improvement required in the near future is greater than those currently being achieved [3]. Well-focused high-throughput phenotyping will be crucially important in developing new avenues for genetic improvement [4]. When the number of lines is limited or the studies are conducted under controlled environments, this task should be afforded by technologies such as high-throughput phenotyping platforms [5]. However, the performance of breeding programs on crop yield and productivity must be assessed under natural conditions [6,7]. Field-based phenotyping (FBP) is recognized as the only approach capable of delivering the required throughput and an accurate description of trait expression in real-world cropping systems [6,8]. A review of the approaches available for FBP and sensors commonly used can be found in Deery et al. [7]. Nevertheless, and in spite of recent progress, FBP remains a bottleneck for future advance in breeding [9].
The development of improved varieties relies on the ability to identify the best genetic variations for advancement, but the spatial variability that is generally observed in fields and the interaction with the environment (G × E) add more complexity to the analysis of crop performance [8]. Several features, related to crop physiology and agronomy, are involved, making difficult the identification of simple traits for phenotyping purposes [4]. Spatial variability must be taken into account when the results of phenotyping experiments are being evaluated. For this reason, plant breeders have been displaying a growing interest in high-resolution remote sensing for phenotyping purposes [5,6,9,10]. Remote sensing has proven useful for monitoring vegetation in the context of plant phenotyping [9]. Most efforts in this field employ RGB (visible) or CIR (color infrared) cameras to produce high-resolution maps of the Normalized Difference Vegetation Index (NDVI) or pseudo-NDVI as an indicator of plant vigor and structure both from near-field and airborne scales [11,12,13]. The development of techniques and methodologies to assess crop performance by such structural indices has been favored by its direct link with the interception of solar radiation and thus with potential yield [14] along with the relatively simple and inexpensive sensors required to acquire the imagery. Nevertheless, under rainfed growing conditions in arid environments such as the Mediterranean area, the combination of limited availability of water and high temperatures, especially during grain filling, tends to seriously limit yields below their potential. In such environments, the unpredictable and variable rainfall season is largely responsible for the variation in yield [15]. Under these conditions, interactions between genotype, year, and location tend to mask the genetic variations affecting yield. This is the reason why the genetic advances in wheat yield in dry areas have not been as successful as in high-yielding environments [15].
In this context, hyperspectral remote sensing has the potential to provide much richer datasets by the collection of several narrow spectral bands that are sensitive to the absorption of specific photosynthetic pigments [16], which are also capable of quantifying the chlorophyll fluorescence naturally emitted by vegetation [17]. Evidence exists of the usefulness of hyperspectral data for phenotyping crops using hand-held spectroradiometers for near-field data acquisition [18,19,20,21]. Nevertheless, the potential of hyperspectral cameras installed on manned or unmanned vehicles for plant phenotyping purposes remains uncertain.
In another spectral domain, thermal remote sensing has been shown to detect small changes in stress levels caused by reduced transpiration under water-stress conditions, and it has also displayed potential for yield screening [22]. Therefore, high-resolution (i.e. below 50 cm pixels) thermal and hyperspectral imagery (mainly deployed on-board aircraft or unmanned vehicles) is capable of providing information over small plots typically used by crop breeders to calculate several vegetation and spectral indices at the canopy level. Such indices derived from both thermal and hyperspectral imagery are related to specific leaf biochemical and canopy biophysical parameters related to crop growth and function. The application of chlorophyll fluorescence in this context is still at a very early stage but recent results indicate that fluorescence quantification from hyperspectral imagers were able to detect stress levels [17,23]. Some authors have suggested the application of one or more imaging technique in a multi-sensor approach where thermal sensing in combined with reflectance, fluorescence, and other sensing technique [24,25].
The aim of this study was to determine whether the airborne hyperspectral and thermal-derived indicators acquired from an aircraft can be used to assess physiologically-based plot variability in the context of plant phenotyping, evaluating the effects on wheat yield under rainfed conditions in the Mediterranean area. Specifically, the study evaluated narrow-band hyperspectral indices and the quantification of chlorophyll fluorescence emission as indicators of yield variations under water-stress conditions.

2. Materials and Methods

2.1. Study Area

A field trial site for wheat selection was established by Agrovegetal S.A. in Ecija, Seville, Spain (37°32ʹ29ʺN, 5°05ʹ29ʺW) under rainfed conditions. The trial site comprised 300 individual plots of 6 m2 each (1.2 m × 5 m) (Figure 1 and Figure 2). The field was sown on 4 December 2013 at a density of 360 seed/m2. This study concentrated on the 150 central plots in order to avoid the edges of the images. These 150 plots comprised 25 varieties of durum wheat (Triticum turgidum L. var. durum) and 25 of bread wheat (Triticum aestivum L.), each replicated three times on a balanced square lattice design. Regarding fertilization, pest and disease management, all plots received the same treatment.

2.2. Water Relations Measurements

Water relations in selected cultivars were measured on DOY 76 and DOY 126, 2014 at noon. The first date corresponded to the early stem elongation stage (Z31); and the second date to grain filling (milk stage Z77). Leaf water potential (LWP; MPa) was measured using a pressure chamber (Model 3000, Soil Moisture Equipment Corp., Santa Barbara, USA) on two sunlit leaves per plot. Assimilation rate and stomatal conductance were measured with a portable photosynthesis measurement system (LCpro-SD, ADC Bioscientific Ltd., Herts, UK) on two sunlit leaves per plot.

2.3. Assessment of Yield

Every plot was individually harvested using a Wintersteiger “Classic” plot combine and yield per plot was determined on 7 June 2014.

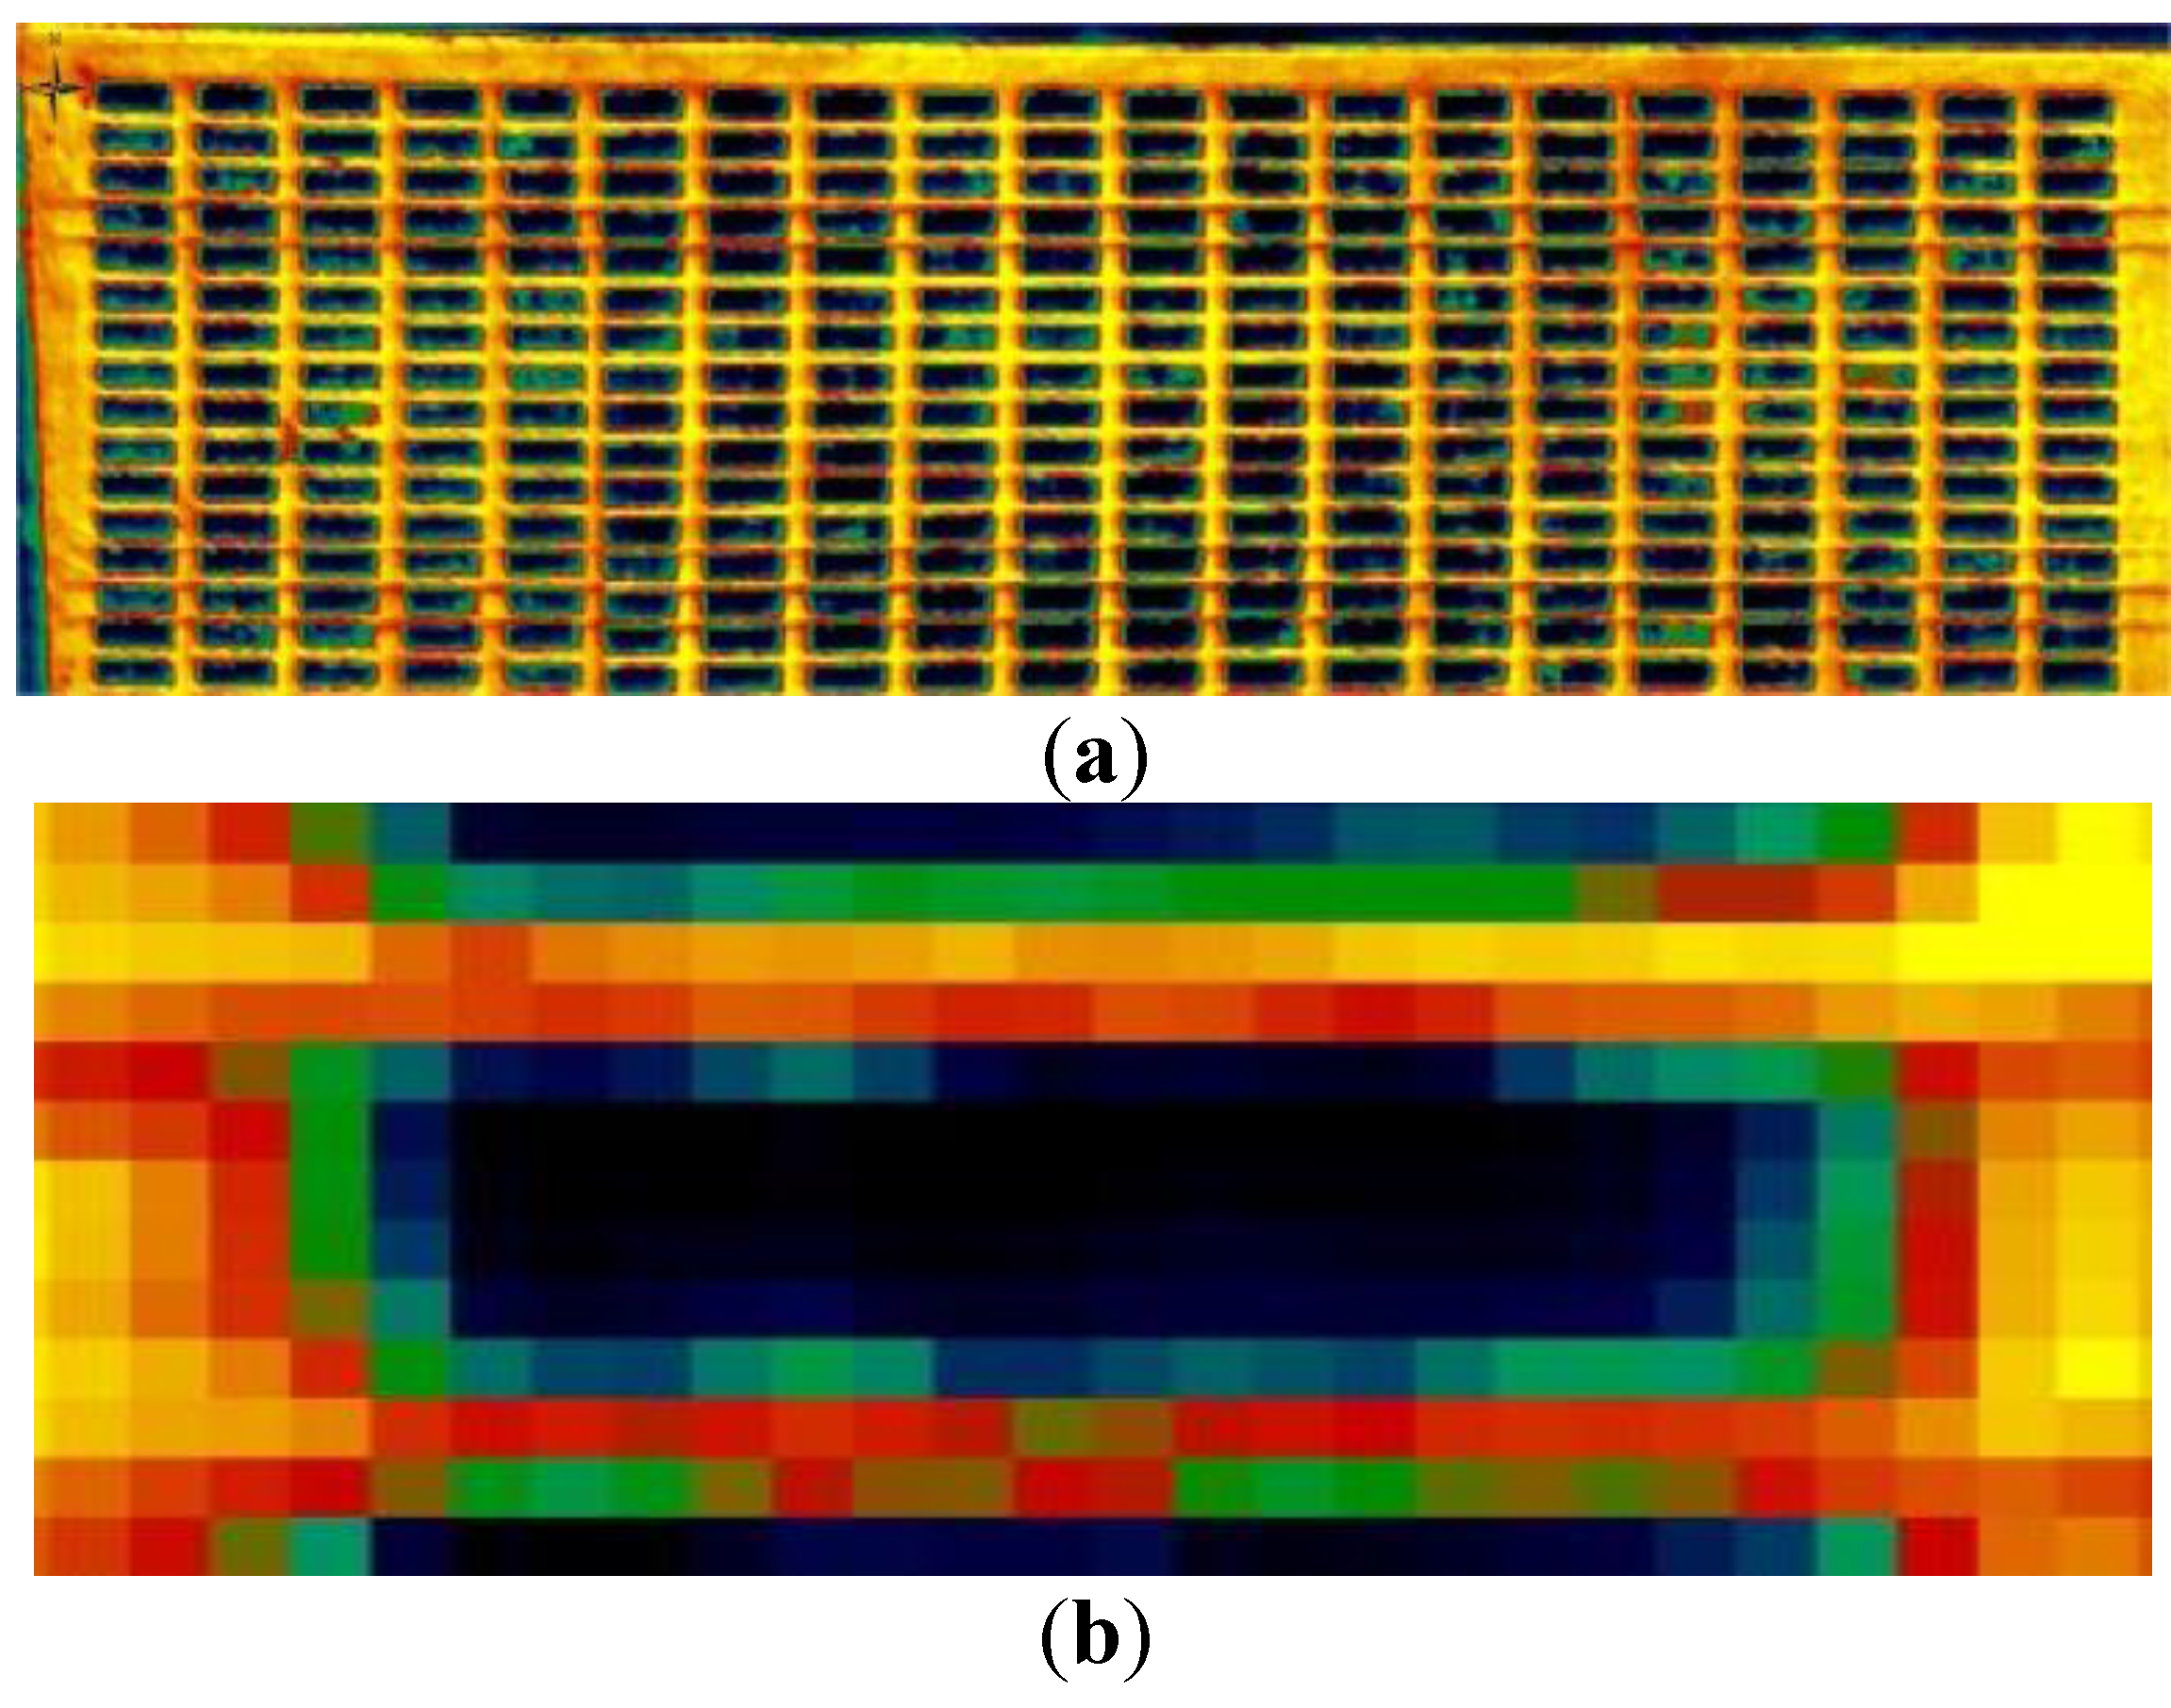
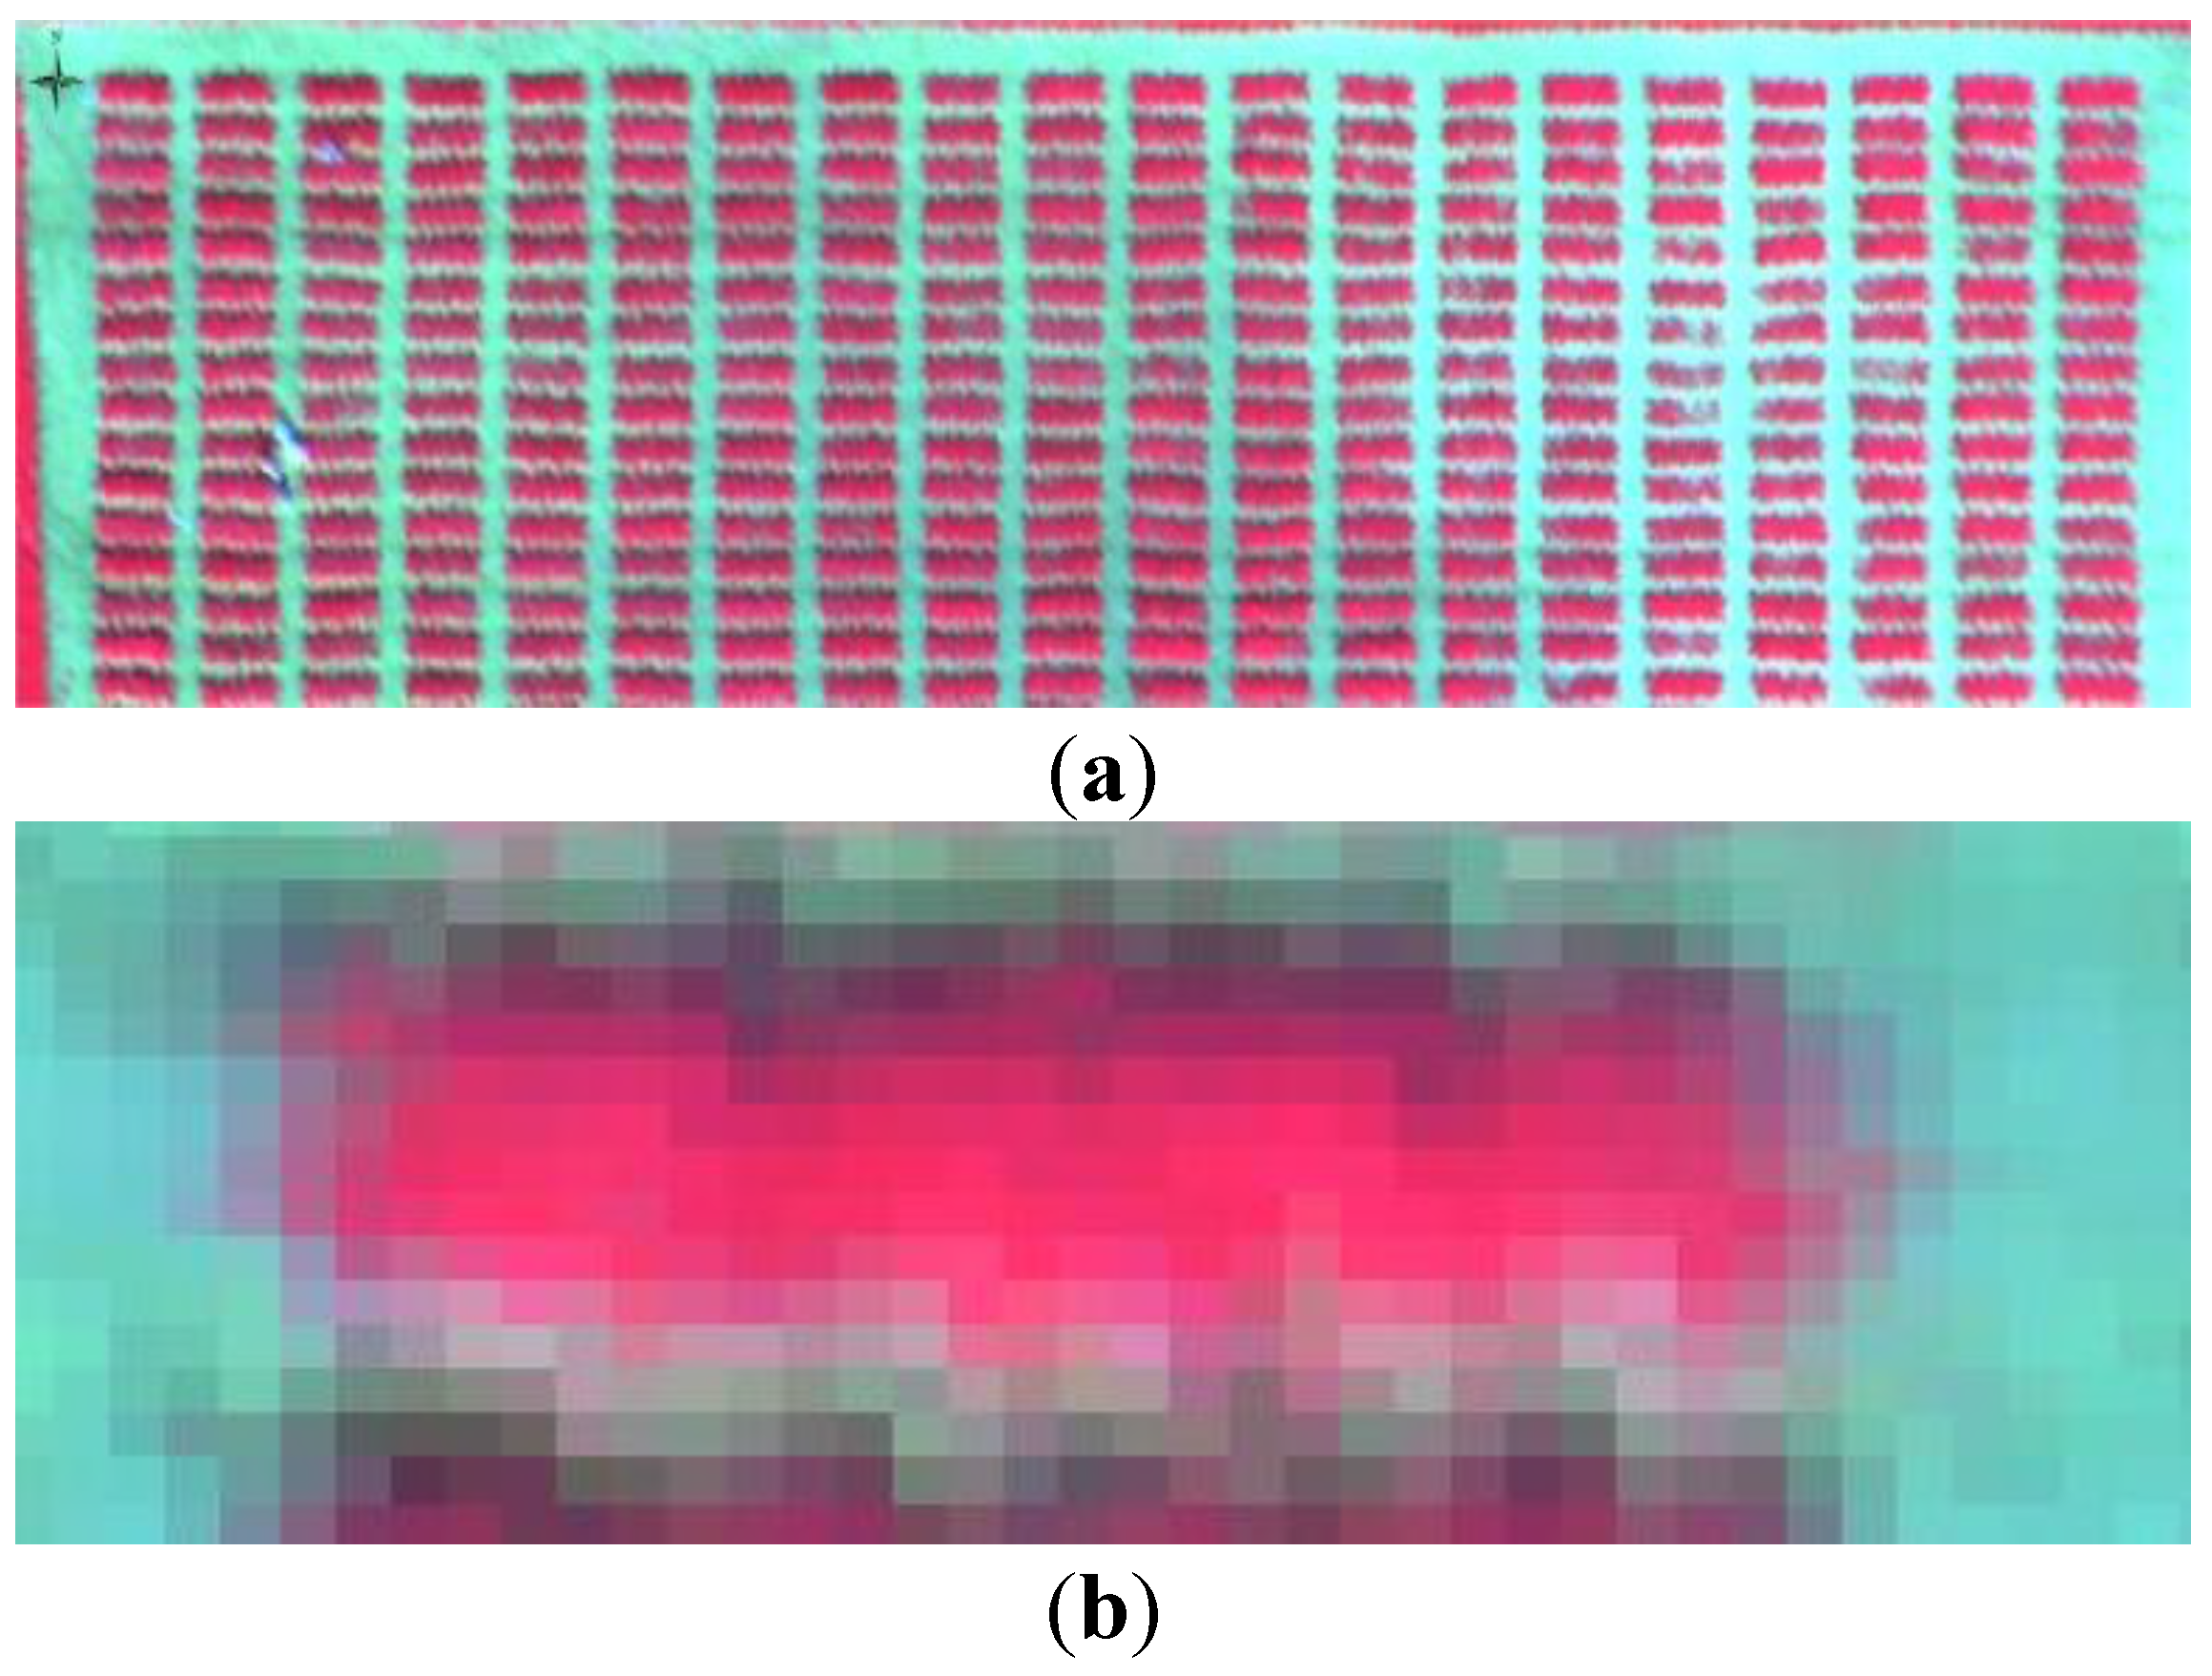
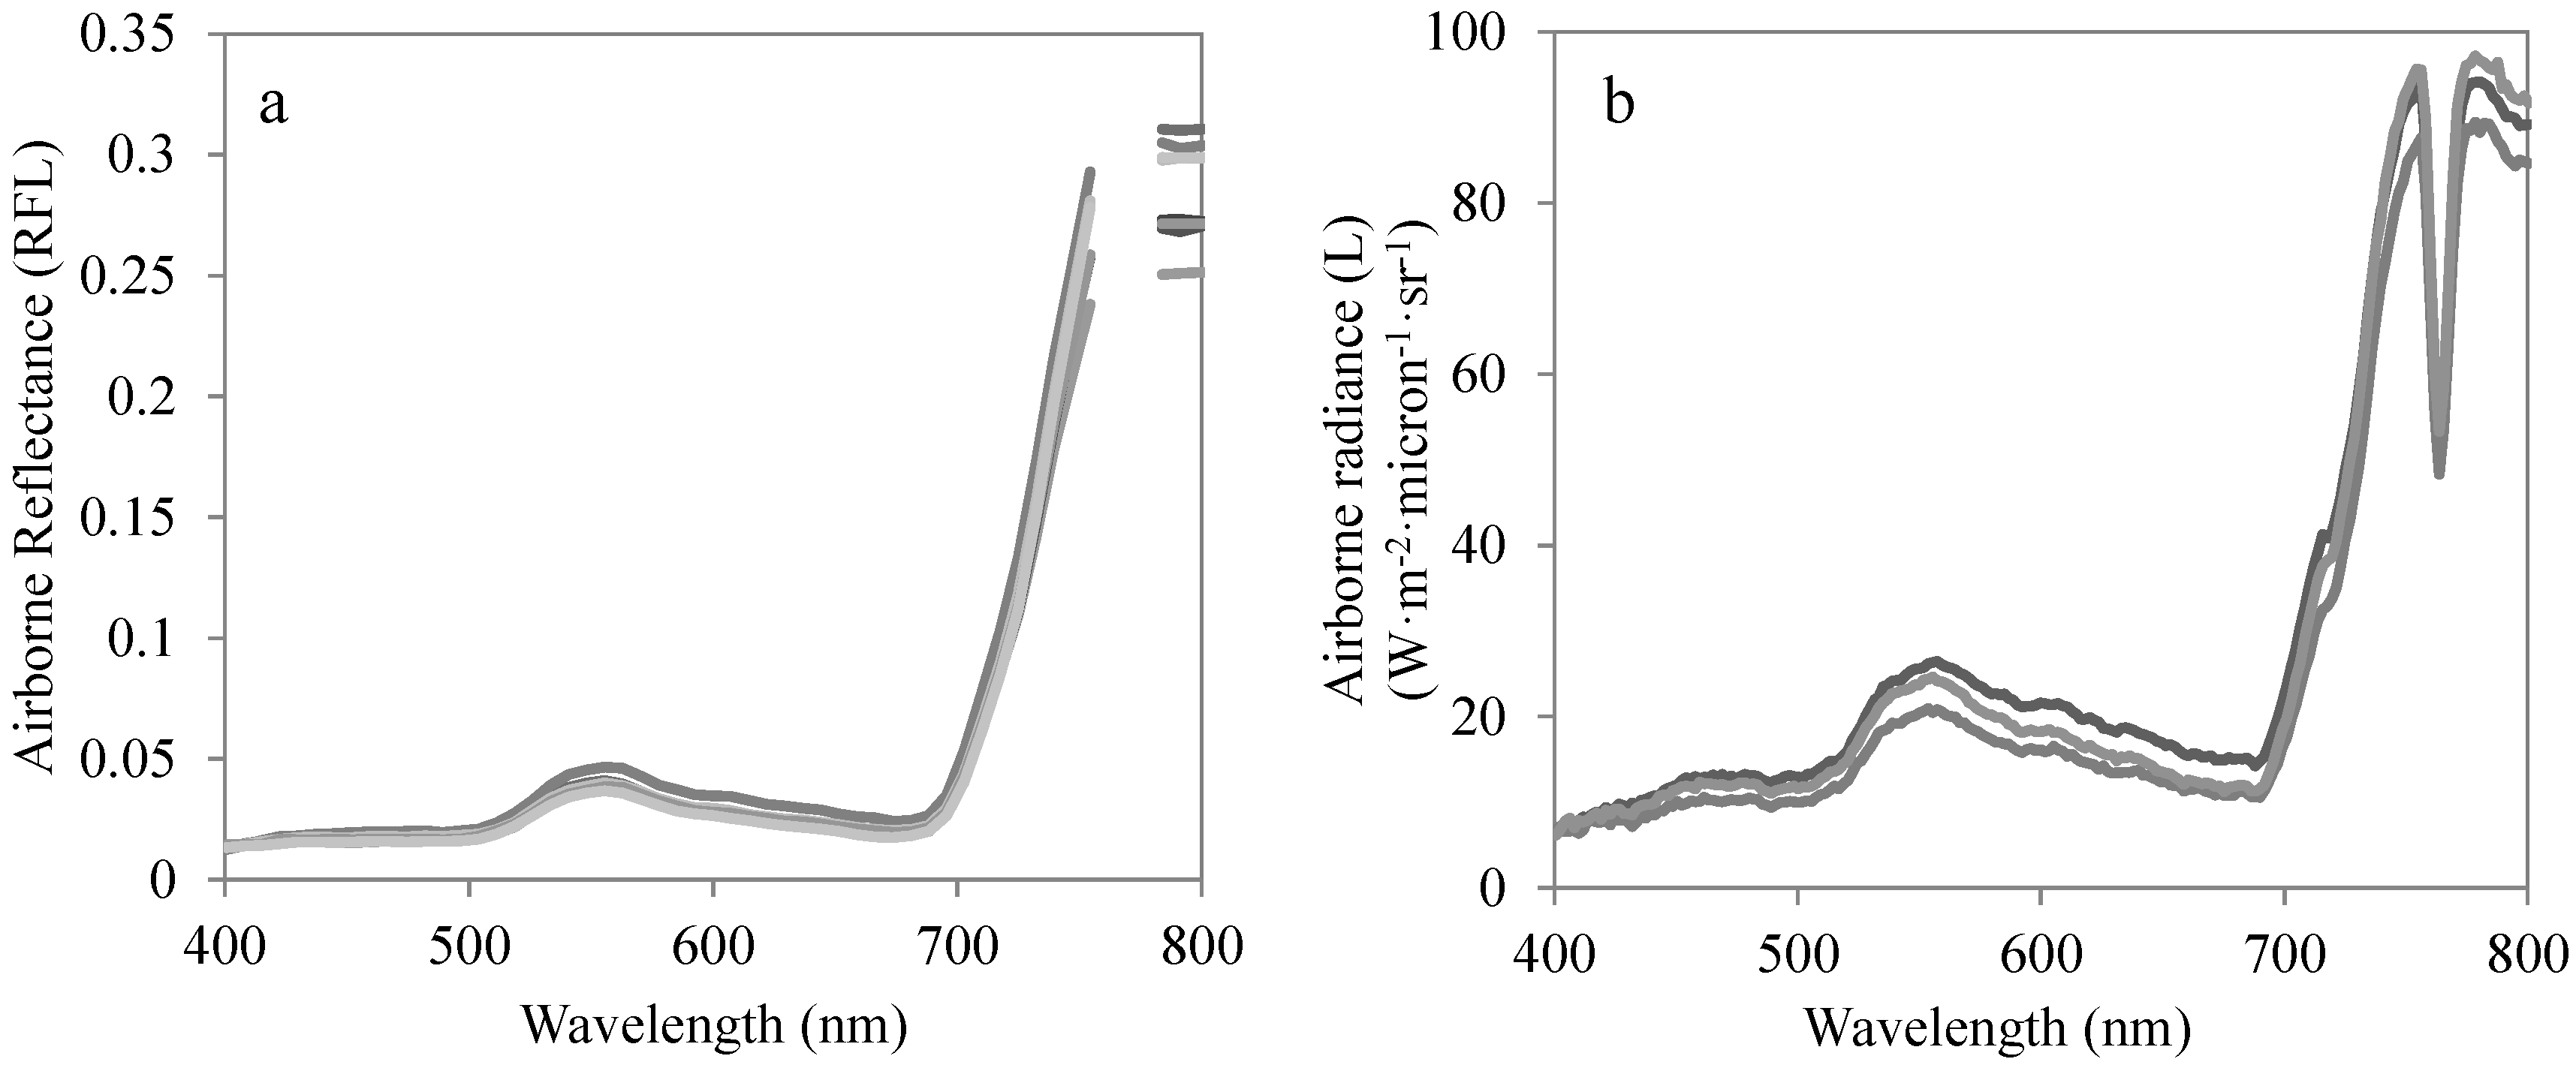
2.4. Airborne Campaigns

A thermal camera (FLIR SC655, FLIR Systems, Wilsonville, OR, USA) and a micro-hyperspectral imager (Micro-Hyperspec VNIR model, Headwall Photonics, Fitchburg, MA, USA) were installed on a Cessna aircraft operated by the Laboratory for Research Methods in Quantitative Remote Sensing (IAS, CSIC, Spain). The thermal camera has a 640 × 480 pixel resolution with a 24.5 mm f1.0 lens, with radiometric performance assessed in the laboratory using a black body (model P80P, Land Instruments, Dronfield, UK) and through vicarious calibrations using surface temperature measurements (Figure 1).
Figure 1. (a) Thermal imagery acquired from the study area; (b) Detail of a single plot.
Remotesensing 07 13586 g001
The hyperspectral sensor used in this experiment is the micro-hyperspectral instrument operating in the spectral mode of 260 bands at 1.85 nm/pixel and 12-bit radiometric resolution, yielding 6.4 nm FWHM with a 25-micron slit in the 400–885 nm region (Figure 2 and Figure 3). No spectral binning was performed during the acquisition of the imagery. The frame storage rate on board the aircraft was set to 50 fps with an integration time of 18 ms. The 8-mm focal length lens yielded an IFOV of 0.93 mrad and an angular FOV of 50°. The hyperspectral sensor was radiometrically calibrated in the laboratory using coefficients derived from a calibrated uniform light source and an integrating sphere (CSTMUSS2000C Uniform Source System, LabSphere, North Sutton, NH, USA) using four levels of illumination and six integration times. Ortho-rectification of the hyperspectral imagery was performed using PARGE (ReSe Applications Schläpfer, Wil, Switzerland). Inputs were obtained from an inertial measuring unit (IMU) (MTiG model, Xsens, Enschede, The Netherlands), installed on board, and synchronized with the micro-hyperspectral imager (as described by [17]).
Two flights were carried out at noon on the solar plane on DOY 76 and DOY 126, 2014 over the experimental field. Flight altitude was 345 m. It delivered a ground resolution of 30 and 20 cm for the thermal and the hyperspectral imagery, respectively.
Figure 2. (a) Hyperspectral imagery acquired from the study area; (b) Detail of a single plot.
Remotesensing 07 13586 g002
Figure 3. Airborne hyperspectral reflectance (a) and radiance (b) extracted from pure vegetation pixels obtained on DOY 76.
Remotesensing 07 13586 g003

2.5. Hyperspectral-Derived Indices

The indicators described in Table 1 were calculated from the hyperspectral imagery. These indices have been shown to be closely related to certain specific features of plant physiology [17,23]. We selected four types of indices, related to: (i) fluorescence emission by PS-I photosystem, (ii) structural effects, (iii) chlorophyll content, and (iv) carotenoid content.
The fluorescence emission was assessed from the radiance spectra by the Fraunhofer Line Depth (FLD) principle calculated from a total of three bands for the in (L763 nm) and out bands (L750 nm; L780 nm) (FLD3), using the equation described in Zarco-Tejada et al. [17]. Some other indices related to the emission of chlorophyll fluorescence as described in Zarco-Tejada et al. [26] were also included in the analysis.
The structural indices were calculated to assess whether final yield in wheat could be captured by the Normalized Difference Vegetation Index, NDVI [27], with a modification of NDVI to increase its sensitivity, in the form of the Renormalized Difference Vegetation Index, RDVI [28]. Soil-adjusted indices (OSAVI and MSAVI) that minimize the background influence were included in the analysis as well as MCARI1, which has demonstrated a great potential for LAI predictions [29].
The selected chlorophyll a + b indices were the Transformed Chlorophyll Absorption in Reflectance Index (TCARI) [30], the aforementioned TCARI, normalized by OSAVI to obtain TCARI/OSAVI, as proposed by Haboudane et al. [30] and used by Meggio et al. [31]. Other indices related with the pigment content were also included in the analysis (Table 1).
The Photochemical Reflectance Index (PRI) was calculated using the 570 nm band as a reference [32] in the form PRI = (R570 − R531)/(R570 + R531), also using the 515 nm band as reference as proposed by Hernandez-Clemente et al. [33] and normalized by structural and chlorophyll effects (PRIn, [34]). Some other indices related with the carotenes content were included (CAR, [35]). RARS is related to the carotenoids content, as well as chlorophyll a + b [36].
Table 1. Hyperspectral indices used in this study.
IndexEquationReference
Fluorescence indices
FLD E out · L in E in · L out E out E in [17,37,38]
UR R 683 2 ( R 675 · R 691 ) [26]
R690/R630 R 690 R 630 [26]
DPi (R) R 688 · R 710 R 697 2 [26]
R685/R655 R 685 R 655 [26]
Structural indices
NDVI R 800 R 670 R 800 + R 670 [27]
RDVI R 800 R 670 ( R 800 + R 670 ) 0 , 5 [28]
OSAVI ( 1 + 0.16 ) · R 800 R 670 R 800 + R 670 + ( 0.16 ) [39]
MCARI1 1.2 · [ 2.5 · ( R 800 R 670 ) 1.3 · ( R 800 R 550 ) ] [29]
MSAVI 1 2 [ 2 · R 800 + 1 ( 2 · R 800 + 1 ) 2 8 · ( R 800 R 670 ) ] [40]
Chlorophyll indices
TCARI 3 · [ ( R 700 R 670 ) 0.2 · ( R 700 R 550 ) · R 700 / R 670 ) ] [30]
TCARI/OSAVICOMBINED TCARI/OSAVI[30]
TVI 0.5 · [ 120 · ( R 750 R 550 ) 200 · ( R 670 R 550 ) ] [41]
SIPI R 800 R 445 R 800 + R 680 [42]
G R 550 R 670 -
ZTM R 750 R 710 [43]
VOG R 740 R 720 [44]
Carotenoid indices
CAR R 515 R 570 [35]
LIC3 R 440 R 740 [45]
RARS R 746 R 513 [36]
PRI R 570 R 531 R 570 + R 531 [32]
PRI515 R 515 R 531 R 515 + R 531 [33]
PRIn P R I R D V I · R 700 R 670 [34]

2.6. Determination of the Crop Water Stress Index (CWSI) and Water Stress Index (WSI)

Two indices were derived from the thermal imagery obtained over the experiment. The Crop Water Stress Index (CWSI) was calculated by normalizing the canopy temperature (Tc) with the air temperature (Ta) and vapor pressure deficit (VPD), according to the methodology proposed by Idso et al. ([46]; Equation (1)).
C W S I = ( T c T a ) ( T c T a ) L L ( T c T a ) U L ( T c T a ) L L
where (Tc − Ta)LL is the lower limit and corresponds to the Tc − Ta value of a canopy that is transpiring at its potential rate and (Tc − Ta)UL is the upper limit and corresponds to the Tc − Ta value of a canopy where the transpiration is completely halted. The lower limit was determined by the Non-Water Stress Baseline proposed by Idso [47], with the following equation: (Tc − Ta)LL = −3.25·DPV + 3.38.
The Water Deficit Index (WDI) was calculated according to the procedure developed by Moran et al. [48]. It is based on the vegetation index/temperature trapezoid (VIT) and has been developed to combine the spectral vegetation indices with temperature measurements in order to apply CWSI theory to partially-vegetated fields without knowledge of foliage temperature.

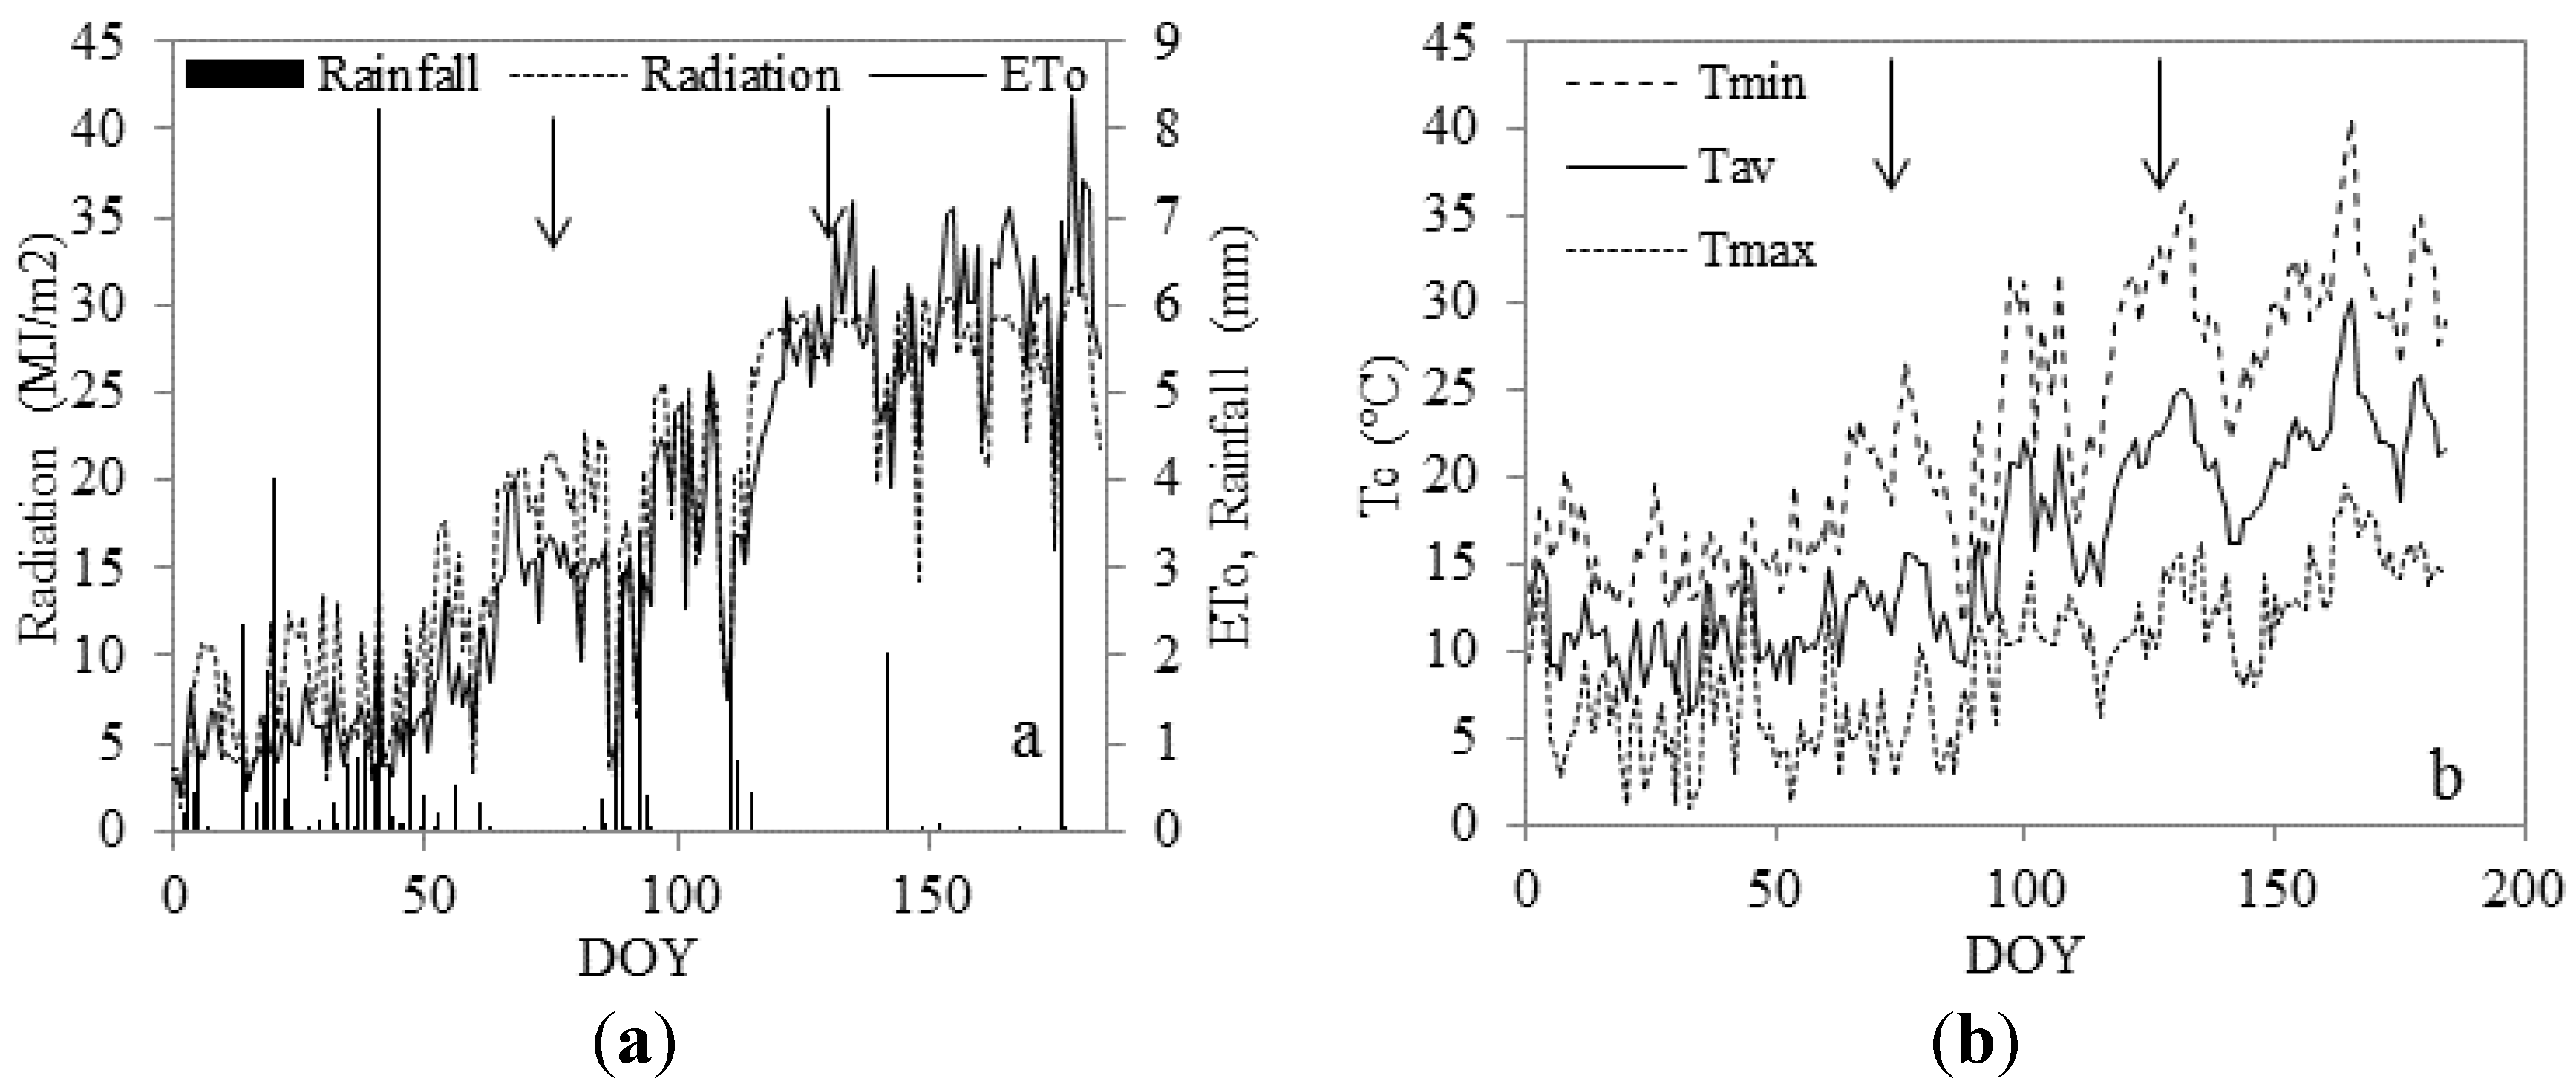
2.7. Climatic Conditions during the Experiment

Climate during the growing season was close to the average for the past 10 years on the site. The previous autumn and winter were rainy, with a total of 260 mm rainfall. During the spring season, the amount of rainfall was 82 mm (Figure 4a). At the time of the flights, ETo and mean Ta were 3.3 mm and 15.5 °C on DOY 76 and 5.7 mm and 22.6 °C. Maximum Ta achieved on these days were 26.6 and 33.3 °C on DOY 76 and 126, respectively (Figure 4b).
Figure 4. (a) Temporal evolution of ETo (mm), solar radiation (MJ·m−2), and rainfall (mm) during the growing season; (b) Maximum, average, and minimum daily temperature (°C) for the same period. Arrows indicate the times of flights (on DOY 76 and 126).
Remotesensing 07 13586 g004

2.8. Statistical Analyses

Data were analyzed using SPSS® software (IBM Corporation, Armonk, NY, USA). In order to obtain insight into the relative weight of each of the indices derived from the thermal and hyperspectral imagery, a stepwise multiple regression analysis was employed. The multiple regression model was run with yield as dependent variables and one index per category (categories are defined in Table 1) as independent variables.

3. Results

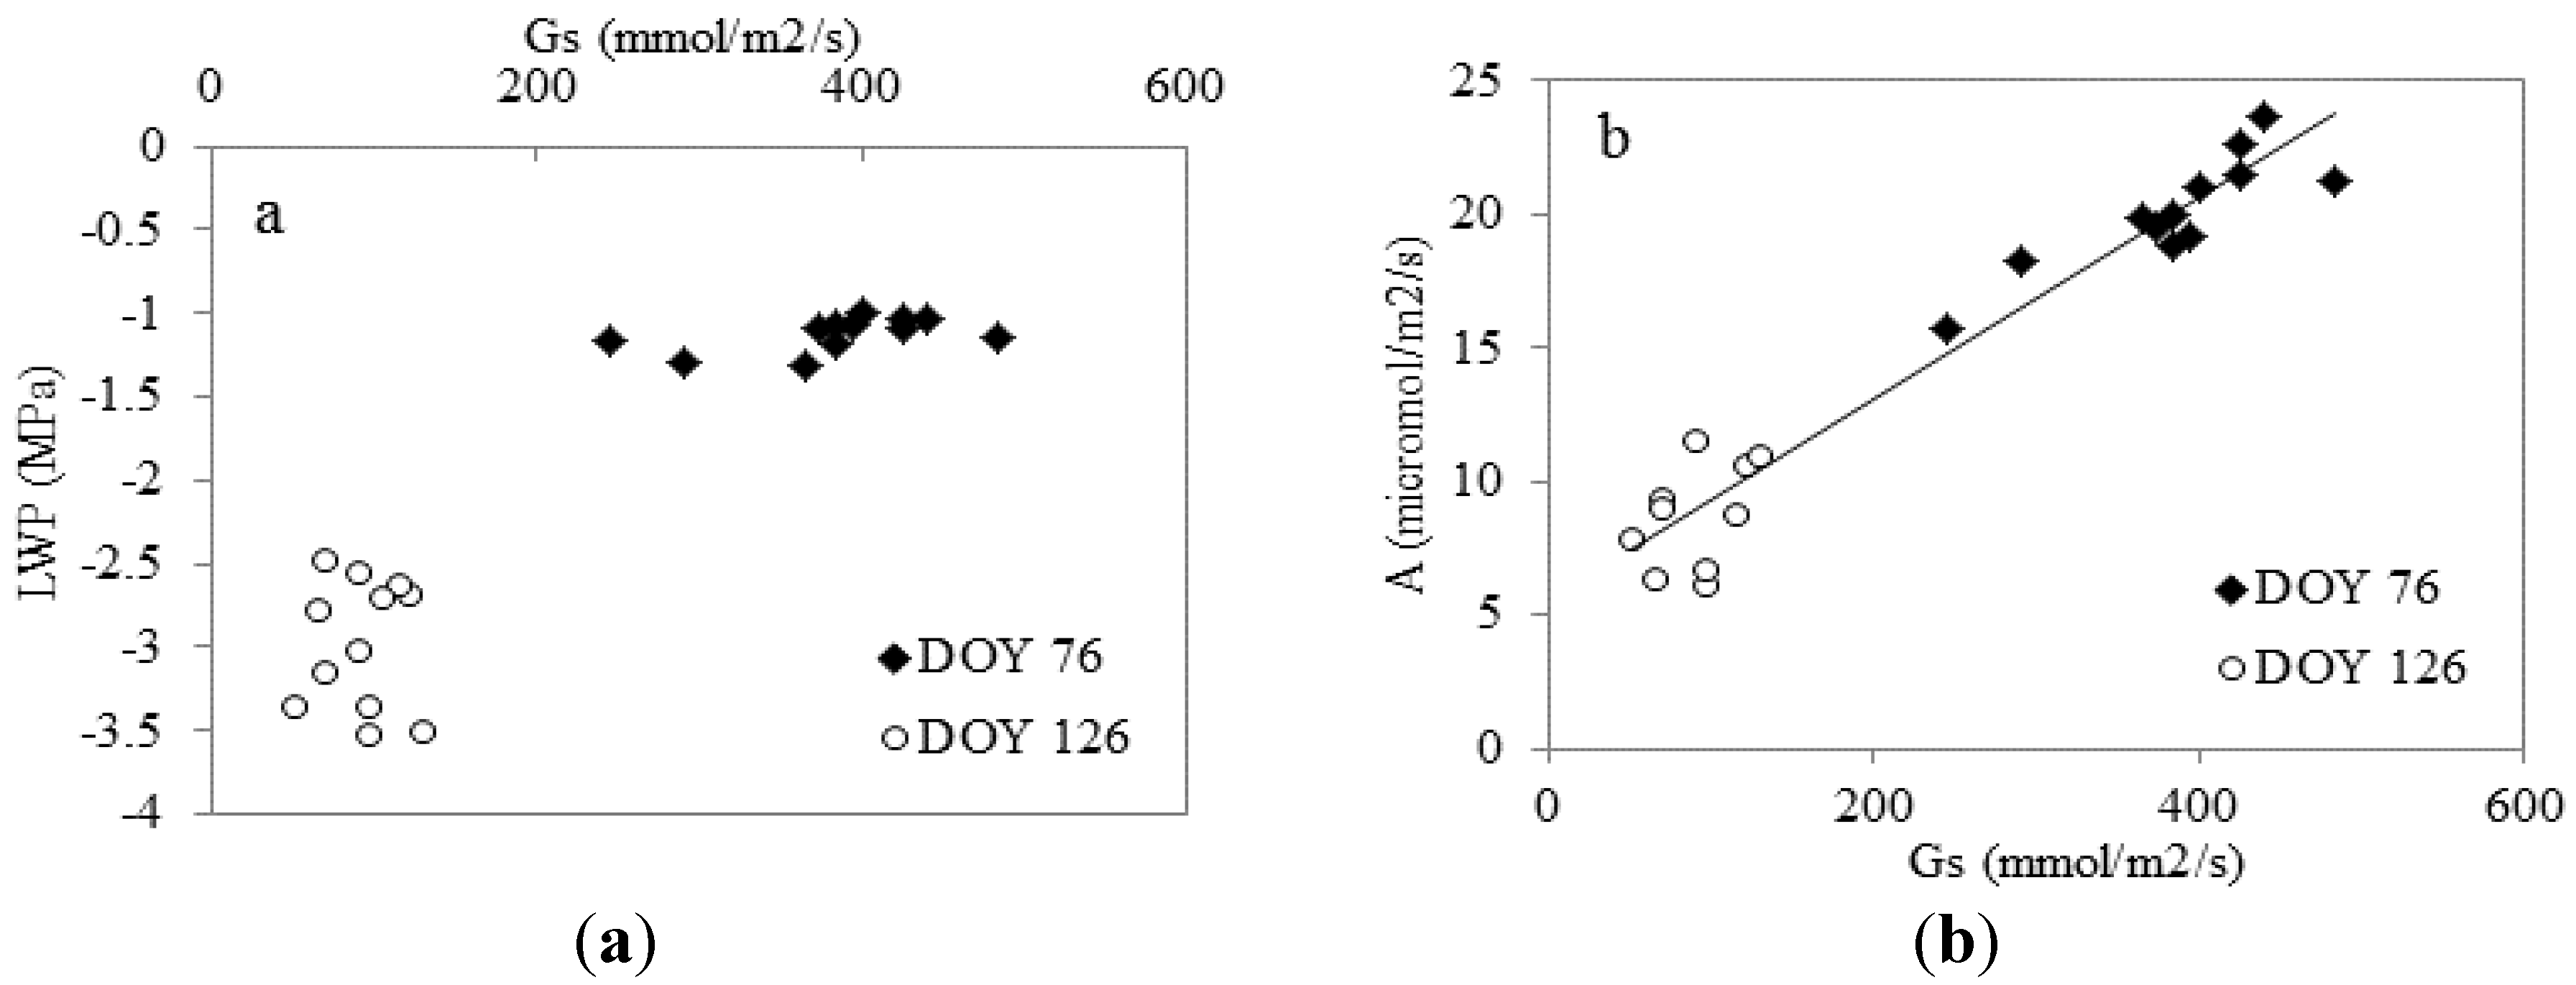
3.1. Water Relations

Two durum and two bread wheat cultivars were chosen to assess the water relations under the conditions described above. The first measurements were made on DOY 76 and corresponded with the early stem elongation stage. The leaf water potential was maintained close to −1.1 MPa for the four cultivars, although the stomatal conductance varied between 245 and 485 mmol·m−2·s−1 (Figure 5a). On DOY 126, due to water stress, the water potential ranged from −2.4 to −3.5 MPa. At this moment, the crop was at the milking stage (grain filling). Stomatal conductance was kept below 120·mmol·m−2·s−1. The assimilation rate was linearly related to stomatal conductance for the two measurement dates (Figure 5b).
Figure 5. Relationships between stomatal conductance (Gs; mmol·m−2·s−1) and leaf water potential (LWP; MPa) (a); and net assimilation (A; μmol·m−2·s−1) (b) for two selected varieties of bread wheat and two of durum wheat. Each point represented a single plot. A linear regression was fitted to both dates in Figure 5b.
Remotesensing 07 13586 g005

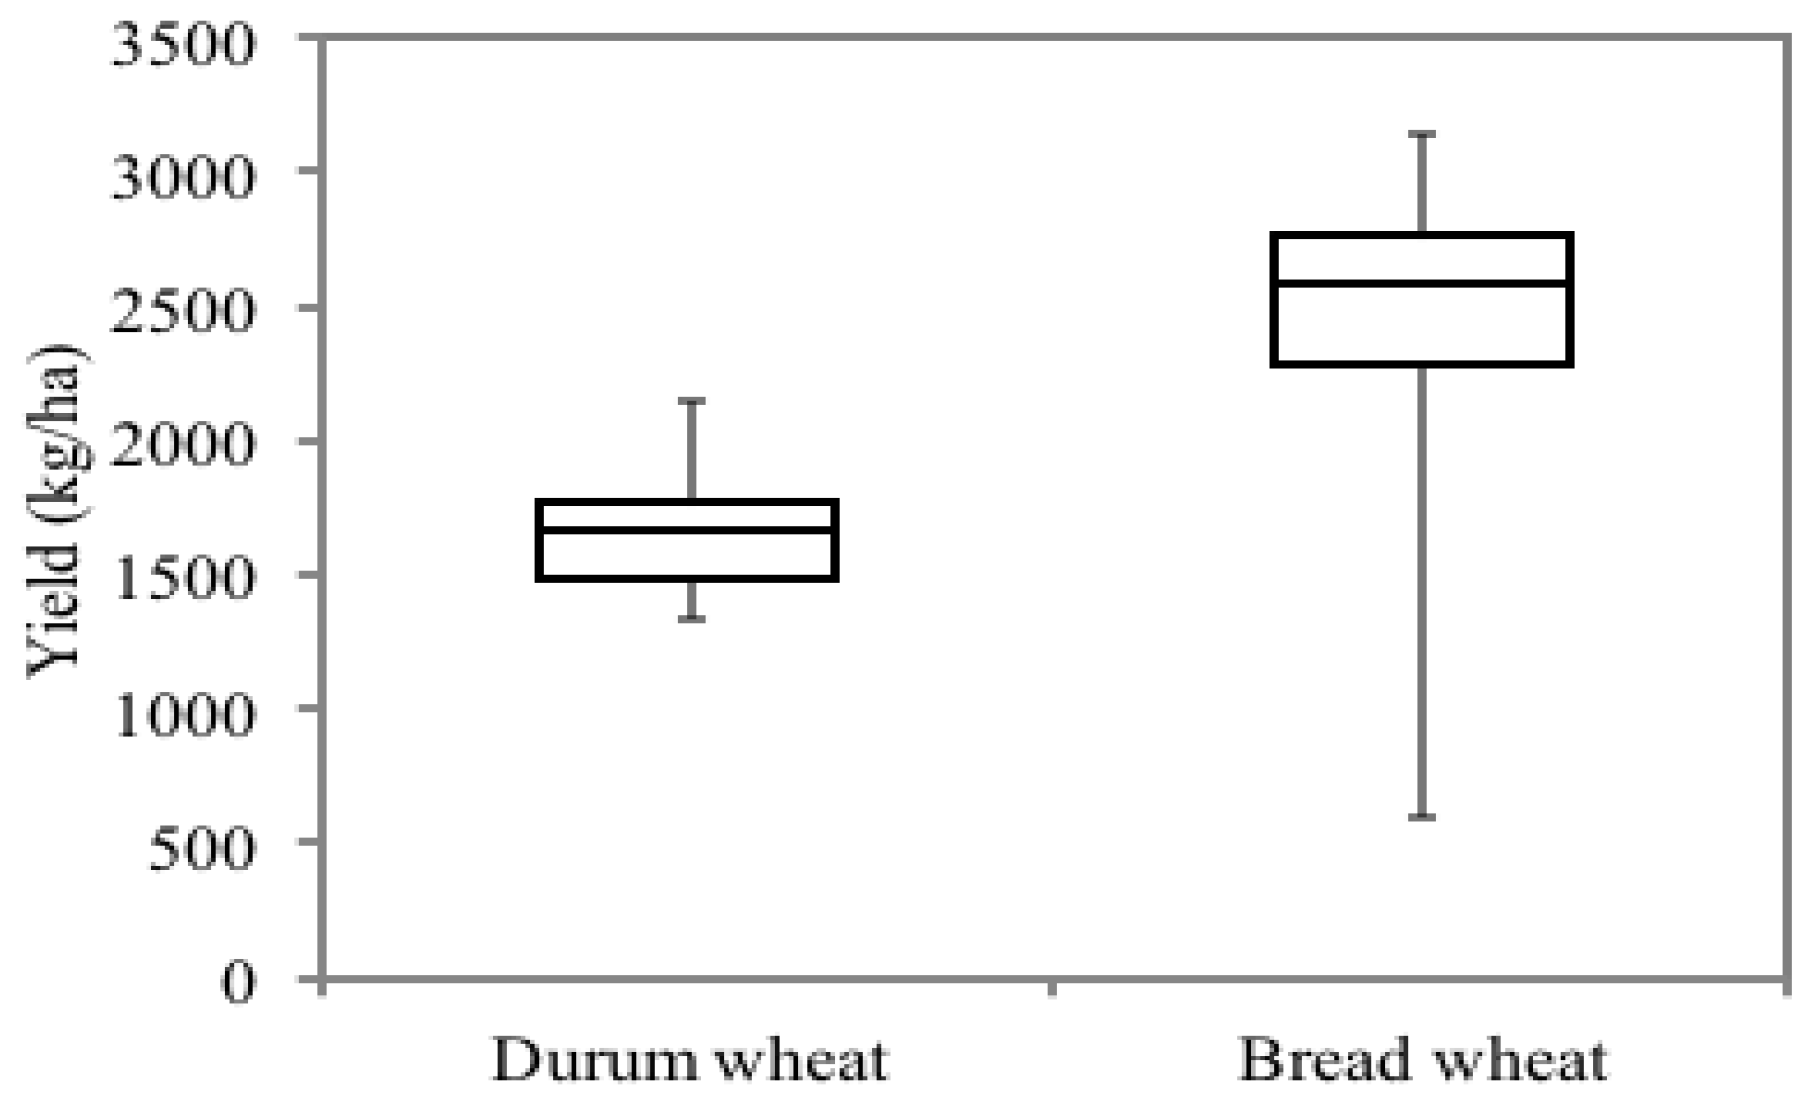
3.2. Variability of Grain Yield

The average grain yield was 2466 kg·ha−1 for the 25 bread wheat genotypes and 1670 kg·ha−1 for the 25 durum wheat genotypes. The ranges of variability among the analyzed varieties were large for both wheat species (Figure 6), despite the severe heat and water stress at the time of grain filling. Mean grain yield was higher for bread wheat than for durum wheat varieties (Figure 6), which is the typical performance in this area. The coefficient of variation (CV) was calculated for each cultivar, taking into consideration the three replicates per cultivar. The CVs were separately averaged for bread and durum wheat. The results demonstrated that bread cultivars displayed a higher CV (10%) than durum wheat cultivars (7.2%).
Figure 6. Mean, upper and lower quartile values for bread and durum wheat yield (kg·ha−1). Maximum and minimum values are also indicated by whiskers. Each group corresponded to a single species and 25 varieties were used for the calculation.
Remotesensing 07 13586 g006

3.3. Relationship with the Assimilation Rate

There was a good correlation between the assimilation rate and the indices derived from the thermal and hyperspectral images (Figure 7). The relationship between the CWSI and the assimilation rate on DOY 76 was different for the two species (Figure 7a), although this relationship was unique on DOY 126 (R2 = 0.54, p < 0.05; Figure 7b). The assimilation rate was slightly higher for durum wheat than for the bread wheat. The well-watered conditions during the flight on DOY 76 can be observed in Figure 5 and were confirmed by the lower CWSI values, which were below 0.15. The CWSI values during the second flight ranged between 0.7 and 0.9 (Figure 7b).
The relationship between the assimilation rate and the FLD was unique for the two species on both dates (Figure 7c,d). The coefficient of correlation was similar for the two dates with different water status, and the slope was positive on both dates. On the other hand, the relationship with NDVI was significant (R2 = 0.45 and 0.28 for the first and second flight, respectively) but weak, as the slope of the relationship with the assimilation rate was reversed on the two dates. On DOY 76, before the start of water stress, plots displaying a higher NDVI value (indicating a better developed canopy) exhibited a higher assimilation rate (Figure 7e). No difference between the two species was observed. Nevertheless, once the water stress was imposed on DOY 126, the tendency was the opposite, and the larger canopy volume was related to a further fall in photosynthetic capacity (Figure 7f).

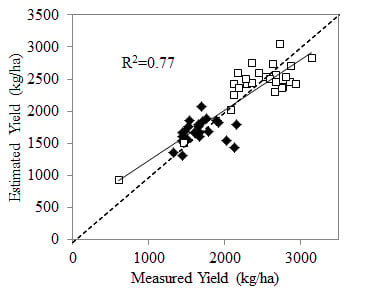
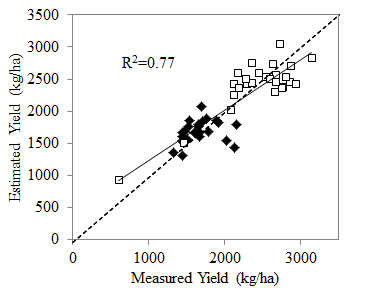
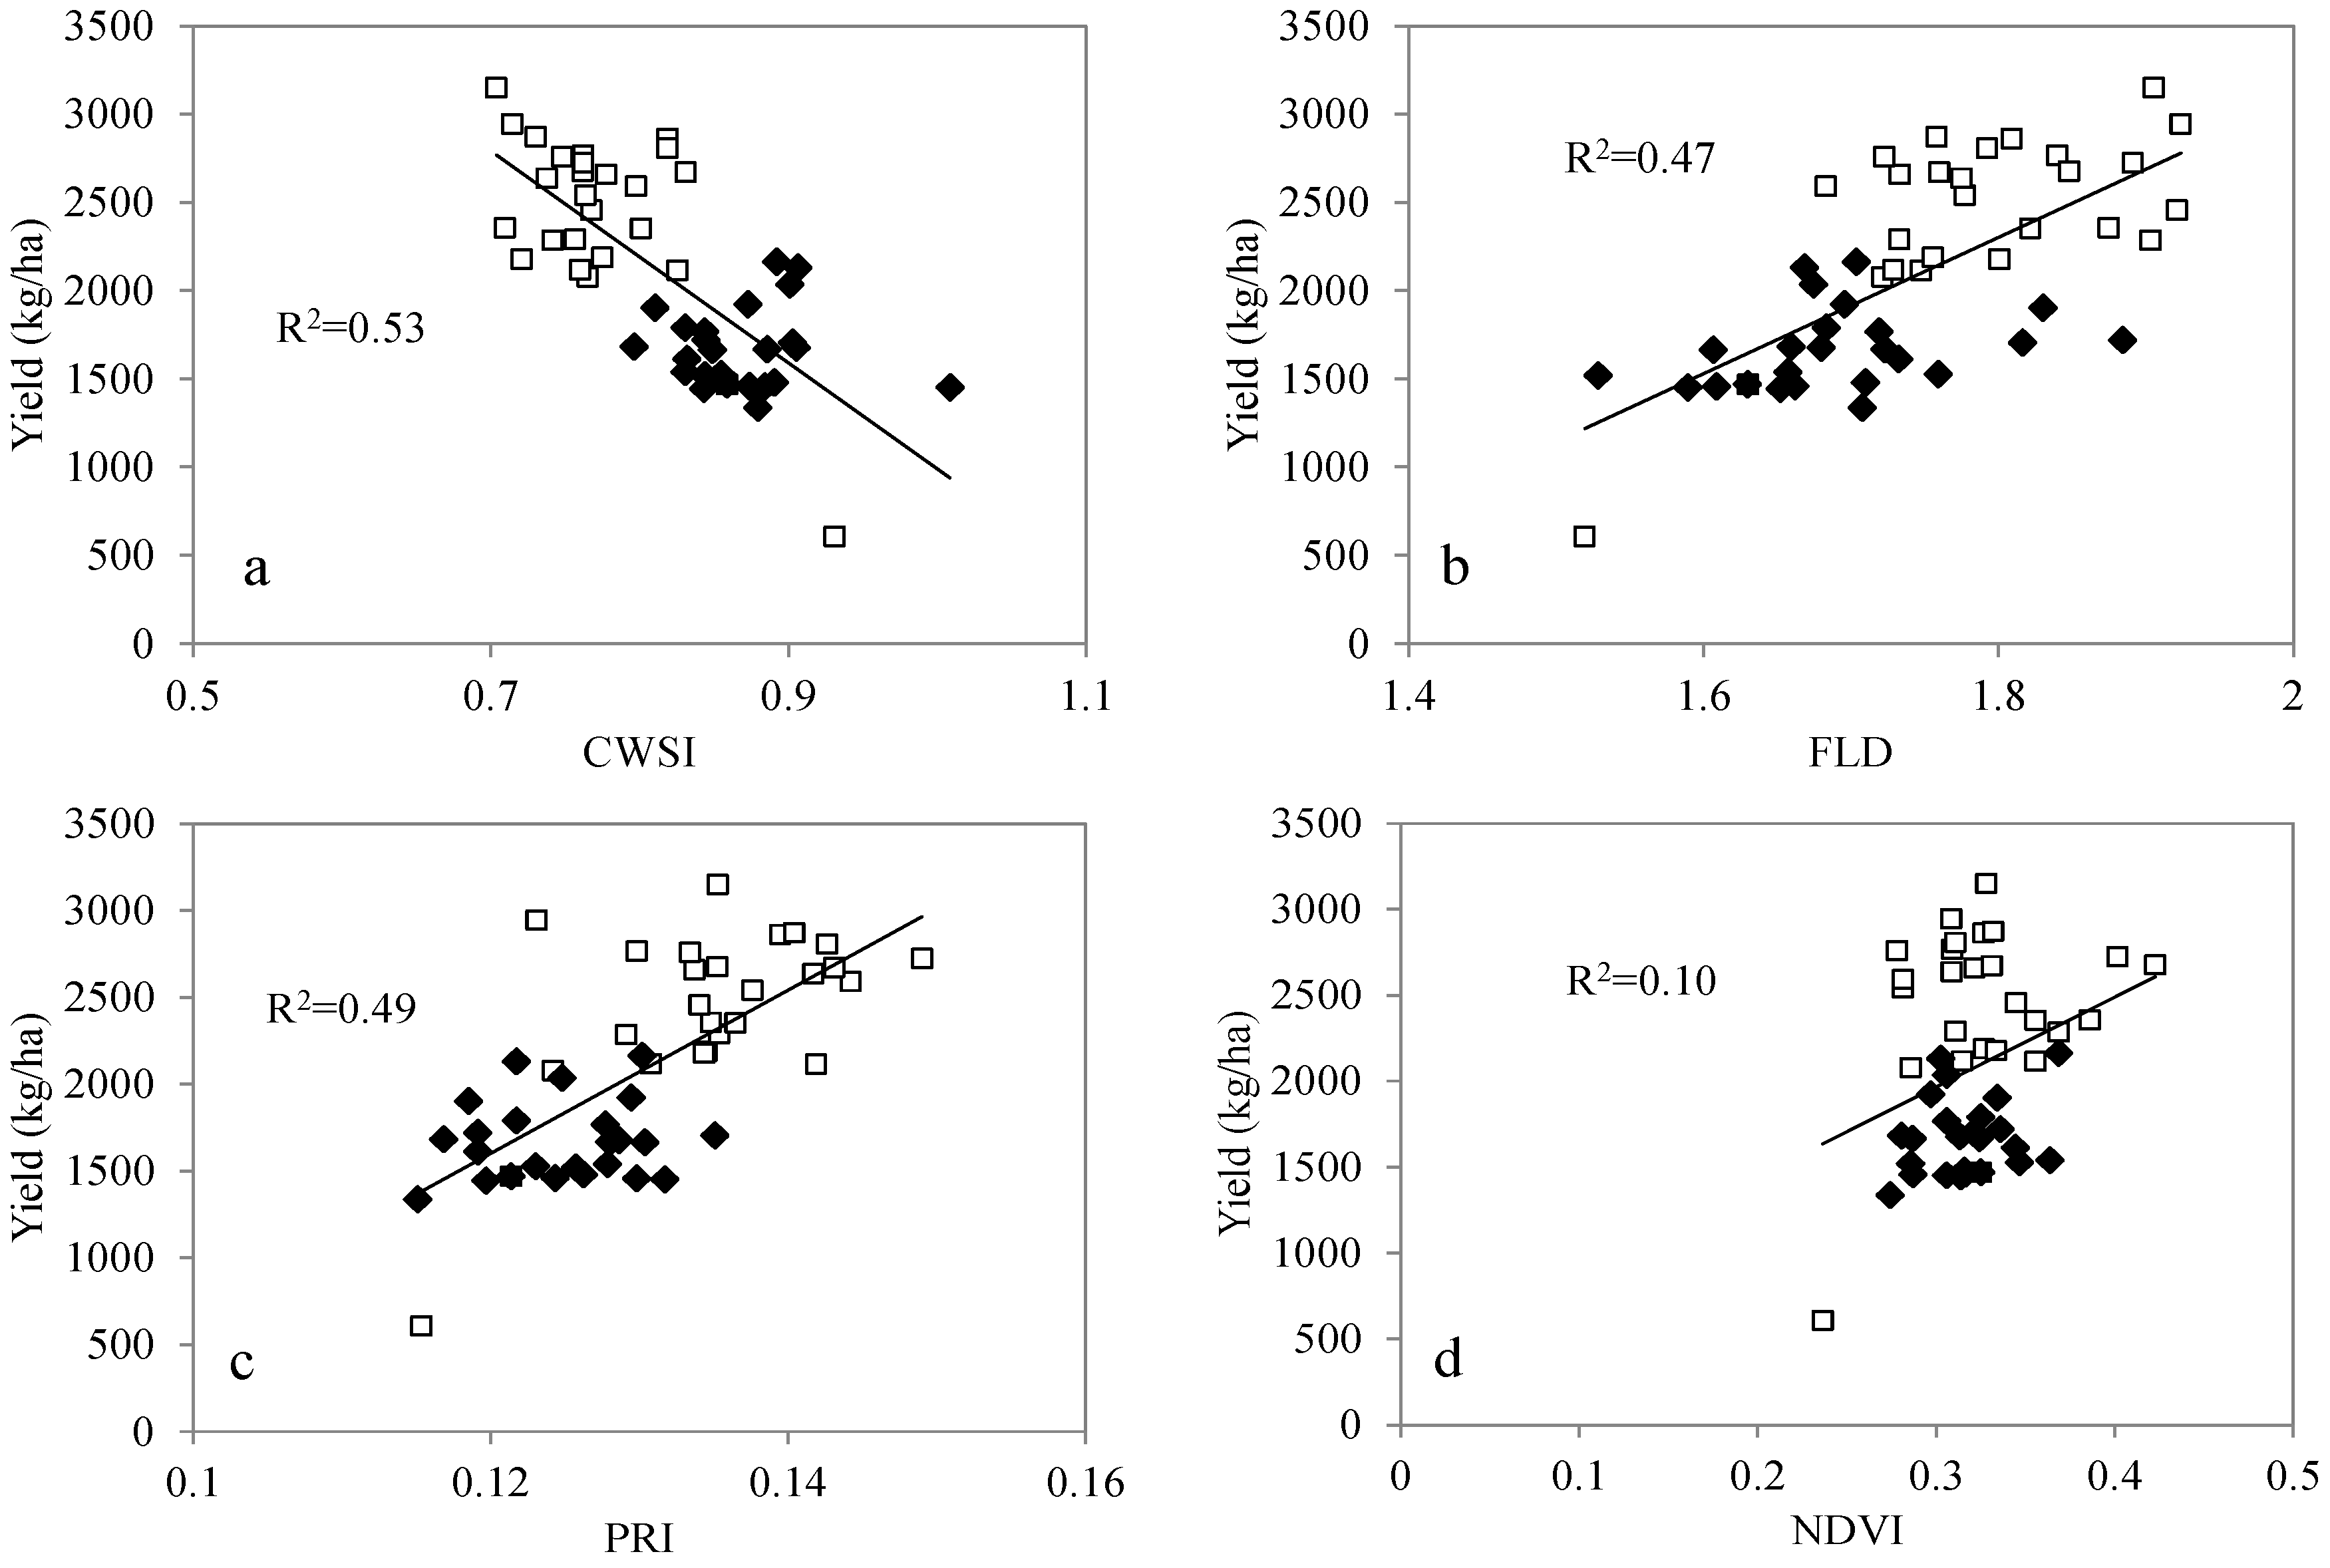
3.4. Relationship with Yield

The relationship between the thermal and hyperspectral derived indices with yield was assessed for all 50 cultivars. The three replicates per cultivar were averaged to obtain a mean value per cultivar. The two species displayed the same tendency, so although they were individually identified, the regression analyses took both into account (Figure 8). The analysis was performed for the two dates, although on DOY 76 none of the indices produced good results and the differences were not significant (data not shown). On DOY 126, the best relationship with yield (R2 = 0.53, p < 0.001) was obtained for the CWSI (Figure 8a). The results for the regression with yield for the whole set of indices can be found in Table 2. Other indices that produced good results were FLD, which obtained an R2 = 0.47 (p < 0.001; Figure 8b), PRI (R2 = 0.49, p < 0.001; Figure 8c) and WDI (R2 = 0.45, p < 0.001; Table 2). Among the structural-related indices, MSAVI obtained the best relationship with yield, with R2 = 0.31 (p < 0.001; Table 2). It can be observed that, for each category presented in Table 2, there was a wide variability in the results, from highly significant (p < 0.001) to non-significant (p > 0.05). Note that NDVI, the most widely used index for the assessment of structural effects, was not significantly correlated with yield (Figure 8d and Table 2) (R2 = 0.10; p > 0.05). Concerning the chlorophyll content, the best indices were TCARI and TCARI/OSAVI (Table 2) yielding R2 = 0.35 and 0.41, respectively.

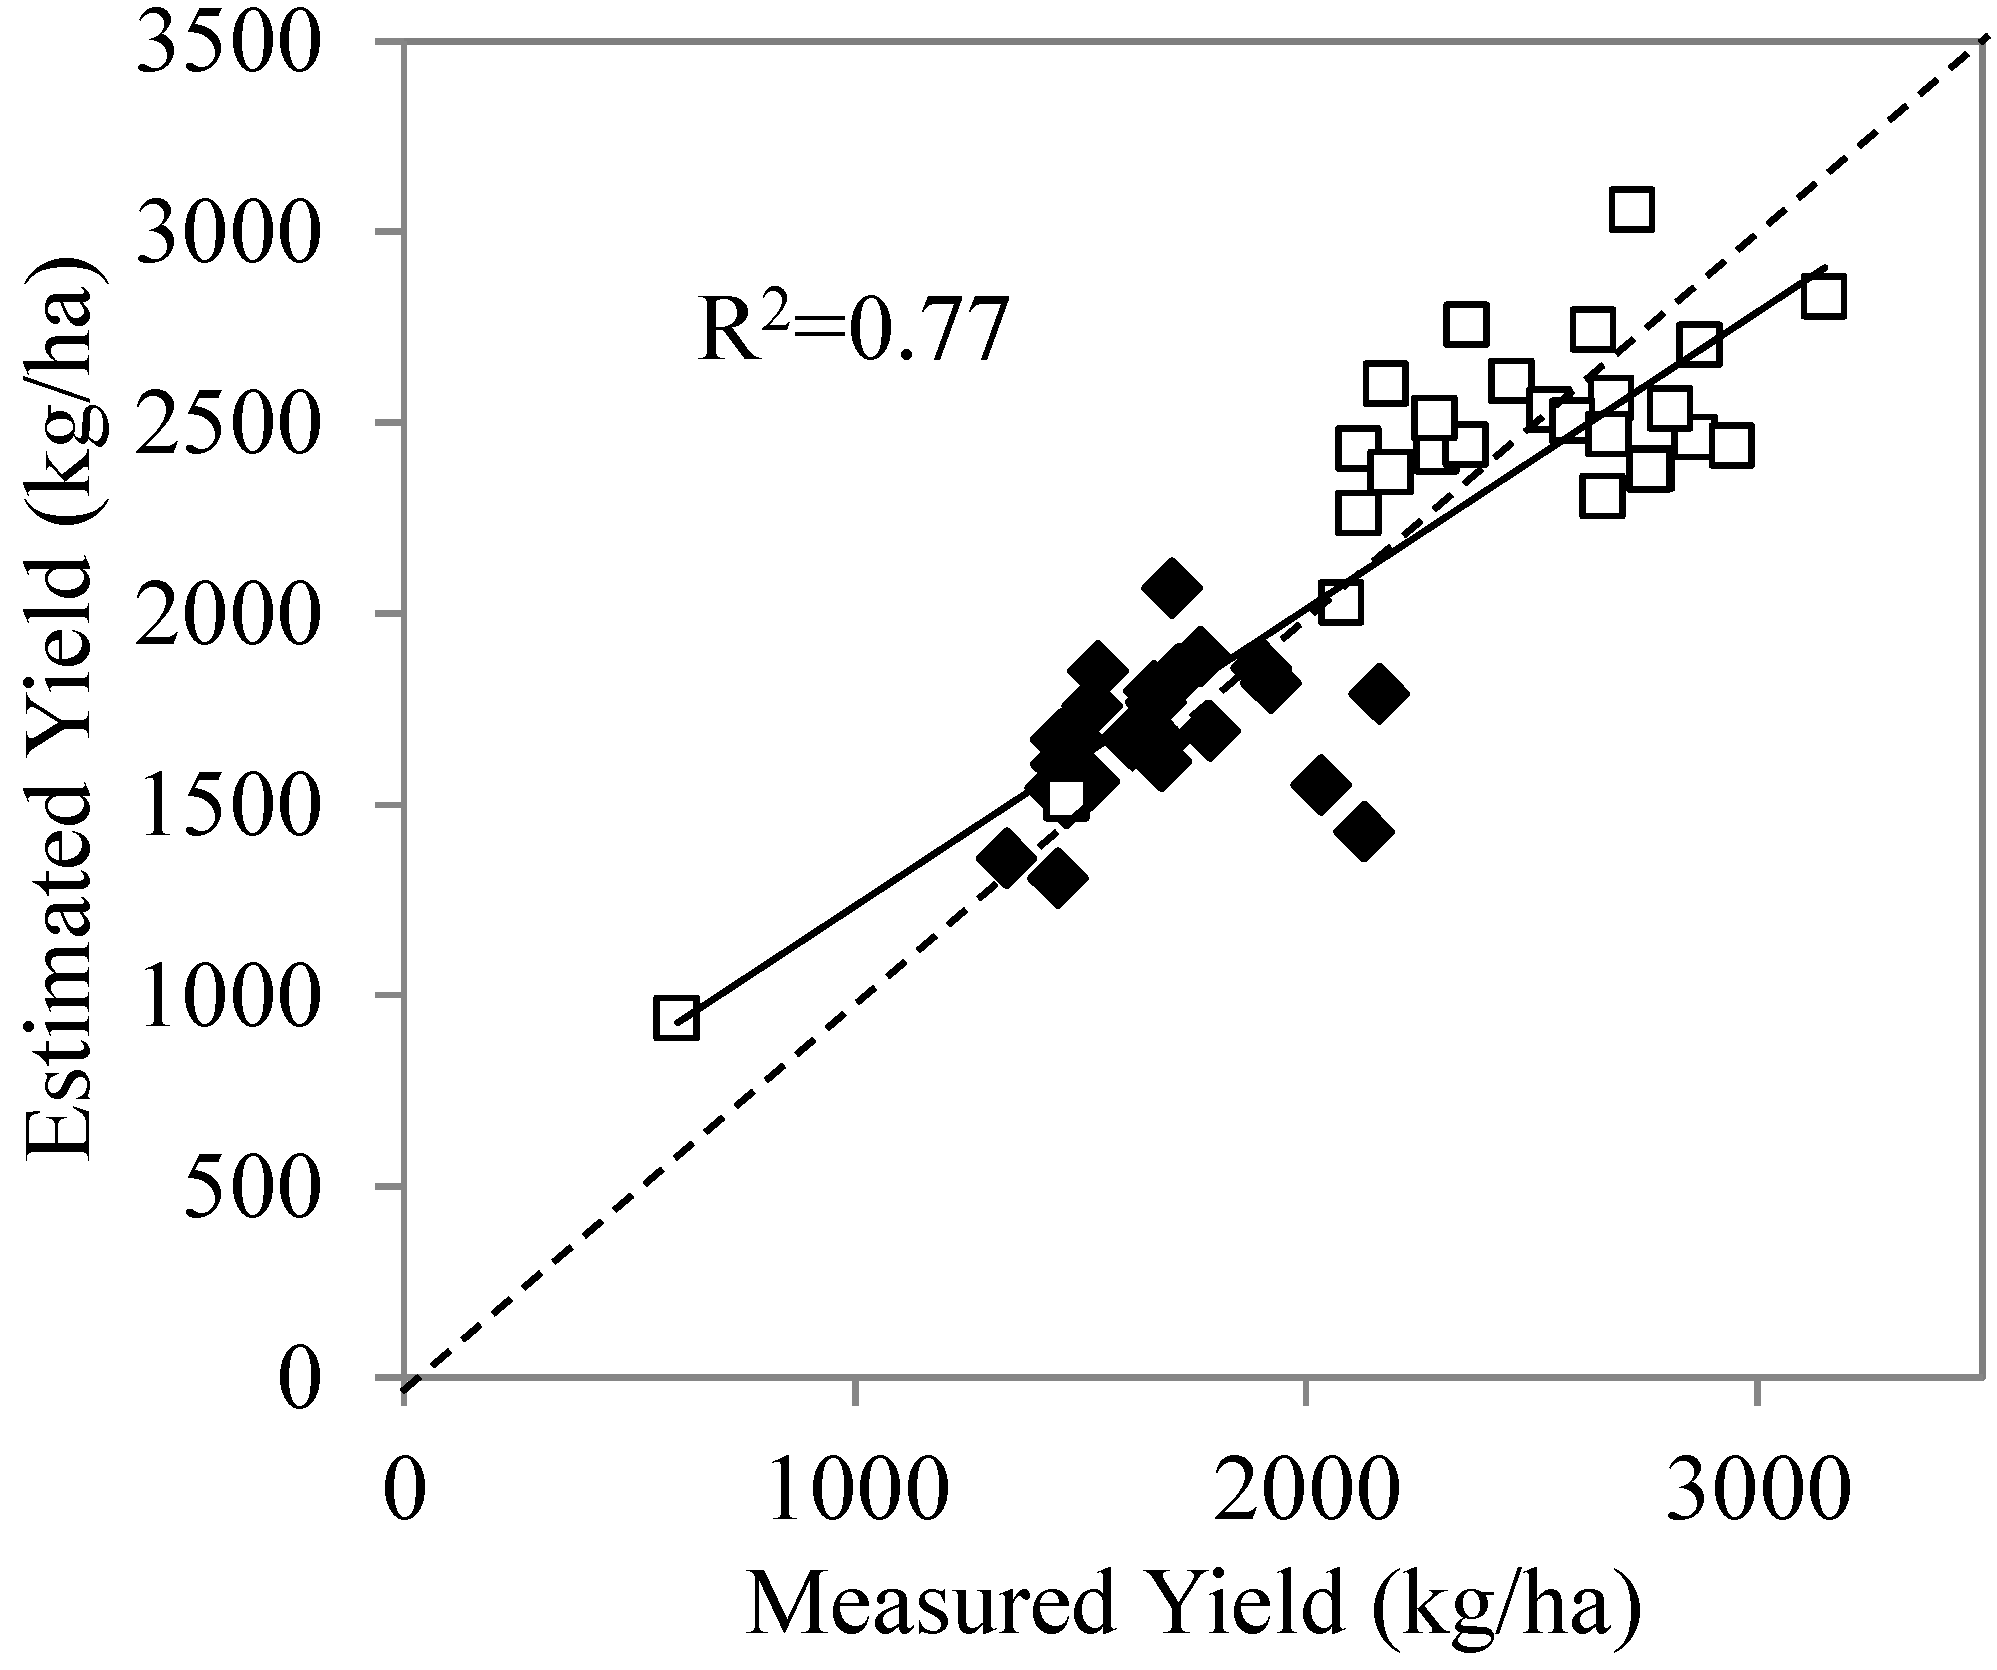
3.5. Stepwise Multiple Regression Analysis

One index per category (the one that obtained the best relationship with yield) was selected for the stepwise multiple regression. The categories considered were: (i) temperature-derived, (ii) chlorophyll fluorescence emission-related, (iii) structural indices, (iv) chlorophyll indices, and (v) carotenoid indices. The indices chosen for this analysis were CWSI, FLD, PRI, MSAVI, and TCARI/OSAVI but the stepwise multiple regression excluded MSAVI and TCARI/OSAVI from the analysis (Table 3), indicating that these two indices did not contribute to predict yield. This analysis was repeated for all of the indices comprised in the categories iii and iv (structural and chlorophyll indices), and the results obtained were the same (data not shown). These categories were therefore eliminated from the analysis and only CWSI, FLD, and PRI were included. The regression model for these three indices explained 77% of the total variability in yield and was significant (p < 0.001). The RMSE yielded 259 kg·ha−1 (Figure 9), which corresponded to a relative RMSE of 10.2%. When NDVI and TCARI/OSAVI were included in the regression analysis, the RMSE was 276 kg·ha−1 (RMSEr = 10.8%).
Figure 7. Relationship between net assimilation (A; μmol·m−2·s−1) and: CWSI (a) and (b), FLD (c) and (d) and NDVI (e) and (f) for two selected varieties of durum wheat (solid symbols) and two varieties of bread wheat (open symbols) on DOY 76 (a), (c) and (e) and DOY 126 (b), (d) and (f). For each case, a linear regression was fitted.
Remotesensing 07 13586 g007
Figure 8. Relationship between yield (kg·ha−1) and: CWSI (a), fluorescence (FLD) (b), PRI (c) and NDVI (d) for durum (solid symbols) and bread wheat (open symbols). Each point represents the average of the three replicates of each variety.
Remotesensing 07 13586 g008
Table 2. Coefficient of correlation (R2) and level of significance of the thermal- and hyperspectral-derived indices related with yield.
IndexR2
(i) Thermal-derived indices
CWSI0.53**
WDI0.45**
(ii) Fluorescence indices
FLD0.47**
CUR0.41**
R690/R6300.13*
DPi (R)0.03
R685/R6550.14*
(iii) Structural indices
NDVI0.10
RDVI0.25**
OSAVI0.20**
MCARI10.17*
MSAVI 0.31**
(iv) Chlorophyll indices
TCARI0.35**
TCARI/OSAVI0.41**
TVI0.22**
SIPI0.17*
G0.00
ZTM0.02
VOG0.01
(v) Carotenoid indices
CAR0.44**
LIC30.36**
RARS0.29**
PRI0.49**
PRI5150.23**
PRIn0.05
* p < 0.05, **p < 0.001
Table 3. Results of the multiple regression analysis performed on the selected indicators.
Explanatory VariableBetatp
CWSI−0.468−4.4990.000
FLD0.3833.1410.003
PRI0.5396.6090.000
MSAVI0.0780.4650.644
TCARI/OSAVI−0.335−1.6930.098
Figure 9. Comparison of measured yield and the estimation derived from the multiple regression, with CWSI, FLD, and PRI as independent variables. The adjusted regression and the calculation of the RMSE include both durum (solid symbols) and bread wheat (open symbols).
Remotesensing 07 13586 g009

4. Discussion

The reliable and early assessment of yield and overall crop performance is of paramount importance for breeding programs. Plant breeders need to be able to phenotype large numbers of lines rapidly and accurately identify the best progeny [9]. The performance of the breeding programs for crop yield and productivity must be evaluated under natural conditions [6,7]. In this study, we demonstrate that high-resolution thermal and hyperspectral imagery obtained from imagers installed on-board aircraft can provide valuable information about yield and crop performance, with the resolution necessary for phenotyping studies. We have observed that some indices derived from the thermal and hyperspectral imagery described the variations in yield in bread and durum wheat varieties more accurately than the standard structural-derived indices such as NDVI, which demonstrated good results in previous studies [19,49]. The relationship between the indices and the assimilation rate at the times of flights demonstrated that the results were robust and physiologically relevant. The thermal-based index CWSI and the fluorescence retrieval through the FLD method demonstrated their value for monitoring physiological processes. It has previously been observed in the context of water stress monitoring [23,38]. On the other hand, the widely used structural-derived NDVI index was not suitable in the context of this study for successfully tracking rapid changes in water status and assimilation rate. Earlier studies support this conclusion [17].
The climatic conditions during this study were within average values for the site, with a relatively rainy winter and spring, followed by a hot and dry summer. The crop would have maintained its water status during the vegetative phase, and thus a relatively satisfactory rate of growth. However, the depletion of soil water reserves and the increase in temperature and evaporative demand in the spring and summer left the plants under terminal water stress, which is typical in this region under rainfed conditions. Terminal stress causes substantial losses of yield in wheat. This is mainly driven by early leaf senescence and thus a shortening of the green leaf area duration, reduced rates of assimilation and reduced grain set and development, among other effects [50]. The relationship between the indices and crop yield was only significant for the second flight, performed during grain filling, while no relationship was observed on DOY 76. Previous studies have demonstrated that yield can be estimated at earlier stages, such as stem elongation [49]. The contrasted and variable climate would explain the inability to estimate yield before grain filling, as this period is critical for yield formation. Under most conditions, 90%–95% of the carbohydrate in grain is derived from carbon dioxide fixation after anthesis. Thus, the post-anthesis period seems the most appropriate period for screening crop performance in arid environments, as has already been observed by other authors [18,21].
The thermal-derived indices displayed the best relationship with yield. It was already proposed as a method to carry out high-throughput field phenotyping [24,25,51]. The close links between temperature changes, stomatal conductance, and finally, yield, are well known. The thermal-derived index CWSI showed a good relationship with assimilation rate (Figure 7a,b). Fischer et al. [52] demonstrated that the increase in yield in eight cultivars over six years was correlated with the difference between canopy and air temperatures (known as canopy temperature depression). A similar conclusion was reached by Amani et al. [22], who suggested canopy temperature as a criterion for grain yield selection in wheat breeding in hot climates. Gutierrez et al. [21] obtained similar results.
In addition to thermal-derived indices, those related to chlorophyll fluorescence emissions are also candidates for screening of wheat yield under these conditions. The close link between fluorescence emission and photosynthesis is well known [53]. Indices derived from this process may track changes in photosynthetic activity. In fact, Araus et al. [54] evaluated the usefulness of chlorophyll fluorescence measurements at leaf level during grain filling to evaluate yield performance under Mediterranean conditions. Remote sensing of chlorophyll fluorescence emissions under natural sunlight conditions confirmed its usefulness for tracking gross primary productivity (GPP) at field [23] and even global level [55]. Fluorescence retrieval using the Fraunhofer Line Depth (FLD) has recently been linked to stomatal conductance [38] and net photosynthesis [23]. Our results confirmed these findings and scaled up the usefulness of fluorescence for phenotyping purposes.
In this study, indices related to the xantophyll pigments cycle (mainly the PRI) showed a close relationship with yield. However, previous studies have demonstrated a lower discrimination power for PRI compared to other indices at different locations [19]. Our study was limited to a single site, although the relationship was consistent for the two species considered.
The weaker relationship with the structural-derived indices was evaluated by the stepwise multiple regression. The usefulness of these indicators (mainly the NDVI) as a criterion for yield selection has been well established [12,56]. It has been shown to be effective under well-watered conditions [20,57]. In high-yielding environments, the ability to intercept radiation can define final yield much more accurately than under arid Mediterranean conditions, where limitations on water availability during grain filling can overcome other constraints and defines yield. Lobos et al. [58] recently observed a good relationship between yield and NDVI for a large number of spring bread wheat varieties under Mediterranean conditions. However, compared to our average temperatures, their climate was milder and, even under severe water stress conditions, the level of stress reached was probably lower than in our study. The sudden change in air temperature and thus atmospheric demand for transpiration would have substantially increased the use of water by the crop. Plots displaying more vigorous growth would therefore already have depleted the soil water reserves, and thus, would have been more sensitive to terminal stress. This is corroborated by the relationship observed between NDVI and assimilation rate (Figure 7f) and would impair the relationship between crop vigor and yield (Figure 8d). In agreement with this conclusion, Royo et al. [19] observed that NDVI was not closely correlated with grain yield at the milk stage for those experiments that received less water and produced lower yields. The early leaf senescence caused by the terminal stress was probably the origin of this impairment.
Other indices have been proposed for screening yield performance under arid conditions. Gutierrez et al. [21] observed that vegetation indices did not clearly correlate with yield, while other indices, related to water content (calculated from the near infrared spectral region) obtained better results under a wide range of environmental conditions.

5. Conclusions

This study demonstrated that thermal and hyperspectral imagery provides indices that display a close link with plant functioning, show potential for wheat yield screening and phenotyping under real field breeding trial conditions. High-resolution imagery was acquired with thermal and hyperspectral cameras installed on-board a manned aircraft that flew over a field trial for wheat phenotyping on two separate dates. The imagery enabled the calculation of vegetation and spectral indices related to canopy structure, photosynthetic pigment absorption, the quantification of chlorophyll fluorescence emission, as well as indices derived from canopy temperature. These physiological indices designed to minimize the sensitivity to structural changes while maximizing a rapid response to environmental conditions could be of paramount importance for plant breeding in variable climates such as the Mediterranean, and especially under rainfed conditions. Under the settings of this study, the thermal index CWSI demonstrated the best relationship with yield (R2 = 0.53), the fluorescence emission quantification carried through the FLD method (R2 = 0.47) and the xanthophyll index PRI (R2 = 0.49). The multiple regression model built for the three indices explained 77% of the total variability in yield and was statistically significant (p < 0.001). On the contrary, NDVI, a standard vegetation index widely used in plant phenotyping, showed a weaker relationship for both durum and bread wheat (R2 = 0.10). These results may be explained by the terminal stress that is usually observed in semi-arid regions, as crops displaying higher values of NDVI deplete soil reserves during vegetative growth and are more sensitive to water stress during yield formation. This study showed promising results on the use of new high-resolution remote sensing indices suitable for field-based phenotyping under rainfed conditions. The use of the remote sensing physiological indicators enables the evaluation of crop performance over wider areas, allowing high throughput phenotyping assessments while still taking spatial variability into account.

Acknowledgments

Authors would acknowledge A. Gomez, K. Gutierrez, D. Notario, and A. Vera for their technical support. Funding from Junta de Andalucia project P12-AGR-0482 and MINECO project AGL2012-40053-C03-01 is gratefully acknowledged.

Author Contributions

Ignacio Solis and Pilar Hernandez did the experimental design and collected grain yield data. Pablo J. Zarco-Tejada led the airborne campaigns and processed the image collections. Victoria Gonzalez-Dugo collected field data at the ground level, made the majority of the data analyses, and wrote the manuscript. All authors contributed to the data analyses and interpretations, as well as to the editing of the manuscript

Conflicts of Interest

The authors declare that there are no conflicts of interest.

References

  1. Braun, H.J.; Atlin, G.; Payne, T. Multi-location testing as a tool to identify plant response to global climate change. In Climate Change and Crop Production; Matthew, P.R., Ed.; CAB International: Cambridge, MA, USA, 2010. [Google Scholar]
  2. Ray, D.K.; Mueller, N.D.; West, P.C.; Foley, J.A. Yield trends are insufficient to double global crop production by 2050. PLoS ONE 2013, 8. [Google Scholar] [CrossRef] [PubMed]
  3. Fischer, R.A.; Edmeades, G.O. Breeding and cereal yield progress. Crop Sci. 2010, 50, 85–98. [Google Scholar] [CrossRef]
  4. Passioura, J.B. Phenotyping for drought tolerance in grain crops: When is it useful to breeders? Funct. Plant. Biol. 2012, 39, 851–859. [Google Scholar] [CrossRef]
  5. Montes, J.M.; Melchinger, A.E.; Reif, J.C. Novel throughput phenotyping platforms in plant genetic studies. Trends Plant. Sci. 2007, 12, 433–436. [Google Scholar] [CrossRef] [PubMed]
  6. White, J.W.; Andrade-Sanchez, P.; Gore, M.A.; Bronson, K.F.; Coffelt, T.A.; Conley, M.M.; Feldmann, K.A.; French, A.N.; Heun, J.T.; Hunsaker, D.J.; et al. Field-based phenomics for plant genetics research. Field Crop. Res. 2012, 133, 101–112. [Google Scholar] [CrossRef]
  7. Deery, D.; Jimenez-Berni, J.; Jones, H.G.; Sirault, X.; Furbanks, R. Proximal remote sensing buggies and potential applications for field-based phenotyping. Agronomy 2014, 5, 349–379. [Google Scholar] [CrossRef]
  8. Chapman, S.C.; Merz, T.; Chan, A.; Jackway, P.; Hrabar, S.; Dreccer, M.F.; Holland, E.; Zheng, B.; Ling, T.J.; Jimenez-Berni, J. Pheno-copter: A low altitude, autonomous remote-sensing robotic helicopter for high-throughput field-based phenotyping. Agronomy 2014, 4, 279–301. [Google Scholar] [CrossRef]
  9. Araus, J.L.; Cairns, J.E. Field high-throughput phenotyping: The new crop breeding frontier. Trends Plant Sci. 2014, 19, 52–61. [Google Scholar] [CrossRef] [PubMed]
  10. Tuberosa, R. Phenotyping for drought tolerance of crops in the genomics era. Front. Physiol. 2012, 3. [Google Scholar] [CrossRef] [PubMed]
  11. Ball, S.T.; Konzak, C.F. Relatioship between grain yield and remotely-sensed data in wheat breeding experiments. Plant Breed. 1993, 110, 277–282. [Google Scholar] [CrossRef]
  12. Raun, W.R.; Solie, J.B.; Johnson, G.V.; Stone, M.L.; Lukina, E.V.; Thomason, W.E.; Schepers, J.S. In-season prediction of potential grain yield in winter wheat using canopy reflectance. Agron. J. 2001, 93, 131–138. [Google Scholar] [CrossRef]
  13. Kipp, S.; Mistele, B.; Baresel, P.; Schmidhalter, U. High-throughput phenotyping early plant vigour of winter wheat. Eur. J. Agron. 2014, 52, 271–278. [Google Scholar] [CrossRef]
  14. Ma, B.L.; Morrison, M.J.; Dwyer, L.M. Canopy light reflectance and field greenness to assess nitrogen fertilization and yield of maize. Agron. J. 1996, 88, 915–920. [Google Scholar] [CrossRef]
  15. Richards, R.A.; Condon, A.G.; Rebetzke, G.J. Traits to improve yield in dry environments. In Application of Physiology in Wheat Breeding; Reynolds, M.P., Ortiz-Monasterio, J.I., McNab, A., Eds.; International Maize and Wheat Improvement Center (CIMMYT): Mexico City, Mexico, 2001; pp. 88–100. [Google Scholar]
  16. Blackburn, J.A. Hyperspectral remote sensing of plant pigments. J. Exp. Bot. 2007, 58, 855–867. [Google Scholar] [CrossRef] [PubMed]
  17. Zarco-Tejada, P.J.; Gonzalez-Dugo, V.; Berni, J.A.J. Fluorescence, temperature and narrow-band indices acquired from a UAV platform for water stress detection using a micro-hyperspectral imager and a thermal camera. Remote Sens. Environ. 2012, 117, 322–337. [Google Scholar] [CrossRef]
  18. Aparicio, N.; Villegas, D.; Casadesus, J.; Araus, J.L.; Royo, C. Spectral vegetation indices as nondestructive tools for determining durum wheat yield. Agron. J. 2000, 92, 83–91. [Google Scholar] [CrossRef]
  19. Royo, C.; Aparicio, N.; Villegas, D.; Casadesus, J.; Monneveux, P.; Araus, J.L. Usefulness of spectral reflectance indices as durum wheat yield predictors under contrasting mediterranean conditions. Int. J. Remote SenS. 2003, 24, 4403–4419. [Google Scholar] [CrossRef]
  20. Gutiérrez-Rodríguez, M.; Reynolds, M.P.; Escalante-Estrada, J.A.; Rodríguez-González, M.T. Association between canopy reflectance indices and yield and physiological traits in bread wheat under drought and well-irrigated conditions. AusT. J. Agric. Res. 2004, 55, 1139–1147. [Google Scholar] [CrossRef]
  21. Gutierrez, M.; Reynolds, M.P.; Raun, W.R.; Stone, M.L.; Klatt, A.R. Spectral water indices for assessing yield in elite bread wheat genotypes under well-irrigated, water-stressed, and high-temperature conditions. Crop Sci. 2010, 50, 197–214. [Google Scholar] [CrossRef]
  22. Amani, I.; Fischer, R.A.; Reynolds, M.P. Canopy temperature depression association with yield of irrigated spring wheat cultivars in a hot climate. J. Agron. Crop Sci. 1996, 176, 119–129. [Google Scholar] [CrossRef]
  23. Zarco-Tejada, P.J.; Morales, A.; Testi, L.; Villalobos, F.J. Spatio-temporal patterns of chlorophyll fluorescence and physiological and structural indices acquired from hyperspectral imagery as compared with carbon fluxes measured with eddy covariance. Remote Sens. Environ. 2013, 133, 102–115. [Google Scholar] [CrossRef]
  24. Jones, H.G.; Serraj, R.; Loveys, B.R.; Xiong, L.; Wheaton, A.; Price, A.H. Thermal infrared imaging of crop canopies for the remote diagnosis and quantification of plant responses to water stress in the field. Funct. Plant Biol. 2009, 36, 978–989. [Google Scholar] [CrossRef]
  25. Virlet, N.; Lebourgeois, V.; Martinez, S.; Costes, E.; Labbe, S.; Regnard, J.-L. Stress indicators based on airborne thermal imagery for field phenotyping a heterogeneous tree population for response to water constraints. J. Exp. Bot. 2014, 65, 5429–5442. [Google Scholar] [CrossRef] [PubMed]
  26. Zarco-Tejada, P.J.; Miller, J.R.; Mohammed, G.H.; Noland, T.L. Chlorophyll fluorescence effects on vegetation apparent reflectance: I. Leaf-level measurements and model simulation. Remote Sens. Environ. 2000, 74, 582–595. [Google Scholar]
  27. Rouse, J.W.; Haas, R.H.; Schell, J.A.; Deering, D.W.; Harlan, J.C. Monitoring the Vernal Advancements and Retrogradation of Natural Vegetation. Available online: http://ntrs.nasa.gov/search.jsp?R=19740022555 (accessed on 28 July 2015).
  28. Roujean, J.L.; Breon, F.M. Estimating par absorbed by vegetation from bidirectional reflectance measurements. Remote Sens. Environ. 1995, 51, 375–384. [Google Scholar] [CrossRef]
  29. Haboudane, D.; Miller, J.R.; Pattey, E.; Zarco-Tejada, P.J.; Strachan, I.B. Hyperspectral vegetation indices and novel algorithms for predicting green LAI of crop canopies: Modeling and validation in the context of precision agriculture. Remote Sens. Environ. 2004, 90, 337–352. [Google Scholar] [CrossRef]
  30. Haboudane, D.; Miller, J.R.; Tremblay, N.; Zarco-Tejada, P.J.; Dextraze, L. Integrated narrow-band vegetation indices for prediction of crop chlorophyll content for application to precision agriculture. Remote Sens. Environ. 2002, 81, 416–426. [Google Scholar] [CrossRef]
  31. Meggio, F.; Zarco-Tejada, P.J.; Nuñez, L.C.; Sepulcre-Canto, G.; Gonzalez, M.R.; Martin, P. Grape quality assessment in vineyards affected by iron deficiency chlorosis using narrow-band physiological remote sensing indices. Remote Sens. Environ. 2010, 114, 1968–1986. [Google Scholar] [CrossRef]
  32. Gamon, J.A.; Peñuelas, J.; Field, C.B. A narrow-waveband spectral index that tracks diurnal changes in photosynthetic efficiency. Remote Sens. Environ. 1992, 41, 35–44. [Google Scholar] [CrossRef]
  33. Hernández-Clemente, R.; Navarro-Cerrillo, R.M.; Suárez, L.; Morales, F.; Zarco-Tejada, P.J. Assessing structural effects on PRI for stress detection in conifer forests. Remote Sens. Environ. 2011, 115, 2360–2375. [Google Scholar] [CrossRef]
  34. Zarco-Tejada, P.J.; González-Dugo, V.; Williams, L.E.; Suárez, L.; Berni, J.A.J.; Goldhamer, D.; Fereres, E. A PRI-based water stress index combining structural and chlorophyll effects: Assessment using diurnal narrow-band airborne imagery and the CWSI thermal index. Remote Sens. Environ. 2013, 138, 38–50. [Google Scholar] [CrossRef]
  35. Zarco-Tejada, P.J.; Guillén-Climent, M.L.; Hernández-Clemente, R.; Catalina, A.; González, M.R.; Martín, P. Estimating leaf carotenoid content in vineyards using high resolution hyperspectral imagery acquired from an unmanned aerial vehicle (UAV). Agric. Forest Meteorol. 2013, 171–172, 281–294. [Google Scholar] [CrossRef]
  36. Chappelle, E.W.; Kim, M.S.; McMurtrey Iii, J.E. Ratio analysis of reflectance spectra (RARS): An algorithm for the remote estimation of the concentrations of chlorophyll a, chlorophyll b, and carotenoids in soybean leaves. Remote Sens. Environ. 1992, 39, 239–247. [Google Scholar] [CrossRef]
  37. Plascyk, J.A.; Gabriel, F.C. The fraunhofer line discriminator MKII an airborne instrument for precise and standardized ecological luminescence measurement. IEEE Trans. Instrum. Meas. 1975, 24, 306–313. [Google Scholar] [CrossRef]
  38. Zarco-Tejada, P.J.; Suarez, L.; Gonzalez-Dugo, V. Spatial resolution effects on chlorophyll fluorescence retrieval in a heterogeneous canopy using hyperspectral imagery and radiative transfer simulation. IEEE Geosci. Remote Sens. Lett. 2013, 10, 937–941. [Google Scholar]
  39. Rondeaux, G.; Steven, M.; Baret, F. Optimization of soil-adjusted vegetation indices. Remote Sens. Environ. 1996, 55, 95–107. [Google Scholar]
  40. Qi, J.; Chehbouni, A.; Huete, A.R.; Kerr, Y.H.; Sorooshian, S. A modified soil adjusted vegetation index. Remote Sens. Environ. 1994, 48, 119–126. [Google Scholar] [CrossRef]
  41. Broge, N.H.; Leblanc, E. Comparing prediction power and stability of broadband and hyperspectral vegetation indices for estimation of green leaf area index and canopy chlorophyll density. Remote Sens. Environ. 2001, 76, 156–172. [Google Scholar] [CrossRef]
  42. Penuelas, J.; Filella, I.; Lloret, P.; Munoz, F.; Vilajeliu, M. Reflectance assessment of mite effects on apple trees. Int. J. Remote Sens. 1995, 16, 2727–2733. [Google Scholar] [CrossRef]
  43. Zarco-Tejada, P.J.; Miller, J.R.; Noland, T.L.; Mohammed, G.H.; Sampson, P.H. Scaling-up and model inversion methods with narrowband optical indices for chlorophyll content estimation in closed forest canopies with hyperspectral data. IEEE Trans. Geosci. Remote Sens. 2001, 39, 1491–1507. [Google Scholar]
  44. Vogelmann, J.E.; Rock, B.N.; Moss, D.M. Red edge spectral measurements from sugar maple leaves. Int. J. Remote Sens. 1993, 14, 1563–1575. [Google Scholar] [CrossRef]
  45. Lichtenthaler, H.K.; Lang, M.; Sowinska, M.; Heisel, F.; Miehé, J.A. Detection of vegetation stress via a new high resolution fluorescence imaging system. J. Plant Physiol. 1996, 148, 599–612. [Google Scholar] [CrossRef]
  46. Idso, S.B.; Jackson, R.D.; Pinter, P.J., Jr.; Reginato, R.J.; Hatfield, J.L. Normalizing the stress-degree-day parameter for environmental variability. Agric. MeteoroL. 1981, 24, 45–55. [Google Scholar] [CrossRef]
  47. Idso, S.B. Non-water-stressed baselines: A key to measuring and interpreting plant water stress. Agric. Meteorol. 1982, 27, 59–70. [Google Scholar] [CrossRef]
  48. Moran, M.S.; Clarke, T.R.; Inoue, Y.; Vidal, A. Estimating crop water deficit using the relation between surface-air temperature and spectral vegetation index. Remote Sens. Environ. 1994, 49, 246–263. [Google Scholar] [CrossRef]
  49. Marti, J.; Bort, J.; Slafer, G.A.; Araus, J.L. Can wheat yield be assessed by early measurements of normalized difference vegetation index? Ann. Appl. Biol. 2007, 150, 253–257. [Google Scholar] [CrossRef]
  50. Farooq, M.; Hussain, M.; Siddique, K.H.M. Drought stress in wheat during flowering and grain-filling periods. Crit. Rev. Plant Sci. 2014, 33, 331–349. [Google Scholar] [CrossRef]
  51. Costa, J.M.; Grant, O.M.; Chaves, M.M. Thermography to explore plant-environment interactions. J. Exp. Bot. 2013, 64, 3937–3949. [Google Scholar] [CrossRef] [PubMed]
  52. Fischer, R.A.; Rees, D.; Sayre, K.D.; Lu, Z.M.; Condon, A.G.; Larque Saavedra, A. Wheat yield progress associated with higher stomatal conductance and photosynthetic rate, and cooler canopies. Crop Sci. 1998, 38, 1467–1475. [Google Scholar] [CrossRef]
  53. Krause, G.H.; Weis, E. Chlorophyll fluorescence as a tool in plant physiology—II. Interpretation of fluorescence signals. Photosynth. Res. 1984, 5, 139–157. [Google Scholar] [CrossRef] [PubMed]
  54. Araus, J.L.; Amaro, T.; Voltas, J.; Nakkoul, H.; Nachit, M.M. Chlorophyll fluorescence as a selection criterion for grain yield in durum wheat under mediterranean conditions. Field Crop. Res. 1998, 55, 209–223. [Google Scholar] [CrossRef]
  55. Guanter, L.; Zhang, Y.; Jung, M.; Joiner, J.; Voigt, M.; Berry, J.A.; Frankenberg, C.; Huete, A.R.; Zarco-Tejada, P.; Lee, J.E.; et al. Global and time-resolved monitoring of crop photosynthesis with chlorophyll fluorescence. Proc. Natl. Acad. Sci. USA 2014, 111, 1327–1333. [Google Scholar] [CrossRef] [PubMed]
  56. Peñuelas, J.; Isla, R.; Filella, I.; Araus, J.L. Visible and near-infrared reflectance assessment of salinity effects on barley. Crop Sci. 1997, 37, 198–202. [Google Scholar] [CrossRef]
  57. Reynolds, M.P.; Rajaram, S.; Sayre, K.D. Physiological and genetic changes of irrigated wheat in the post-green revolution period and approaches for meeting projected global demand. Crop Sci. 1999, 39, 1611–1621. [Google Scholar] [CrossRef]
  58. Lobos, G.A.; Matus, I.; Rodriguez, A.; Romero-Bravo, S.; Araus, J.L.; Del Pozo, A. Wheat genotypic variability in grain yield and carbon isotope discrimination under mediterranean conditions assessed by spectral reflectance. J. Integr. Plant Biol. 2014, 56, 470–479. [Google Scholar] [CrossRef] [PubMed]

