Article

Analysis of Deformation Dynamics in Guatemala City Metropolitan Area Using Persistent Scatterer Interferometry

by
Carlos García-Lanchares
1,2,3,
Miguel Marchamalo-Sacristán
1,2,*,
Alfredo Fernández-Landa
2,
Candela Sancho
2,
Vrinda Krishnakumar
2 and
Belén Benito
3
1
Department of Land Morphology & Engineering, ETSI Caminos, Canales y Puertos, Universidad Politécnica de Madrid, 28040 Madrid, Spain
2
Detektia Earth Surface Monitoring S.L., C/ Faraday 7, 28049 Madrid, Spain
3
ETSI Topografía, Geodesia y Cartografía, Universidad Politécnica de Madrid, 28040 Madrid, Spain
*
Author to whom correspondence should be addressed.
Remote Sens. 2023, 15(17), 4207; https://doi.org/10.3390/rs15174207
Submission received: 6 June 2023 / Revised: 16 August 2023 / Accepted: 23 August 2023 / Published: 27 August 2023

Abstract

:
The analysis of deformation dynamics in Guatemala city and its surrounding region presented in this paper holds significant relevance due to the high vulnerability of this area to natural disasters, combined with its rapid urbanization, similar to most Central American cities, contrasting with a lack of InSAR and deformation studies in the region. A total of 226 SAR images from Sentinel-1 A and B satellites in both ascending and descending geometries were processed with the Persistent Scatterer Interferometry (PSI) technique employing the SNAP-StaMPS integrated processing chain. The study area encompasses the Metropolitan Region of Guatemala, which is characterized by a diverse and active geological framework, with a historical record of earthquakes, intense groundwater extraction, and local subsidence phenomena, causing fissures and sinkholes. Four active areas were identified in the study area, each covering more than 50 hectares, with subsidence velocities greater than 10 mm/yr. This study provides valuable insights into fostering the sustainable development of this region by identifying deformation patterns, characterizing main active areas, and evaluating associated risks for disaster management and prevention. The results can also aid informed decision-making processes and guide urban planning and resource management strategies in other Central American countries. The application of InSAR studies is crucial for improving safety and sustainability in urban environments and natural resource management in vulnerable regions.

1. Introduction

Synthetic Aperture Radar Interferometry (InSAR) is a cost-effective and highly accurate technology for studying the deformation dynamics of surfaces [1,2,3]. InSAR has been extensively used to analyze land deformation resulting from geologic and seismological hazards [4,5,6], as well as landslide risk studies [7,8,9,10] and mining activities [11,12], among others. Moreover, InSAR has proved to be a valuable tool for urban development strategies aimed at improving sustainability and safety in urban environments [13,14,15,16,17,18,19,20,21]. Additionally, InSAR has also been used to analyze urban deformation caused by the exploitation of groundwater [1,22,23,24,25]. For instance, Mexico City is one of the fastest sinking metropolises in the world, with a displacement rate of up to 2.5 cm/month. Many urban areas have experienced these phenomena in varying degrees; thus, subsidence is becoming a major factor in urban development planning [1]. Jakarta has sunk by about 4 m, prompting Indonesia to build a new capital. This subsidence began affecting permanent constructions as early as 1978, causing such phenomena as cracks, expansion of flooding areas, lowering of groundwater level, and increased inland seawater intrusion [26]. Another example is the Semarang case [17], where excessive groundwater extraction and natural consolidation of alluvial soil led to land subsidence, with displacement velocities reaching up to 16.5 cm/yr. In summary, InSAR has proven to be a versatile tool for studying and monitoring various types of surface deformations, including those caused by natural and anthropogenic factors, making it an essential tool for urban development strategies.
Persistent Scatterer Interferometry (PSI) [2,27] is a technique that relies on the identification of point-like features on the Earth’s surface, called Persistent Scatterers (PSs), which have a strong and stable radar backscatter signal. PSI focuses on stable and coherent scatterers such as buildings and infrastructure, providing high-precision measurements of surface deformation.
PS techniques are particularly abundant in built-up areas, allowing this technique to achieve high spatial resolutions of deformation dynamics in urban areas. By quantifying the phase difference between the radar signals from different images, PSI can detect small changes in the distance between the satellite and the persistent scatterers, allowing for the detection and monitoring of ground subsidence, landslides, and other surface deformations with high accuracy. PSI is then particularly useful for monitoring urban deformation processes that can have a significant impact on infrastructure, property, and public safety. PSI can also provide valuable information for urban planning and management, allowing authorities to identify areas of potential risk and take appropriate action. Overall, the use of PSI in urban areas offers a cost-effective and efficient way to monitor surface deformation and improve the safety and sustainability of cities. Despite the extensive use of InSAR in several parts of the world, such as Europe, there is a lack of such studies in Central American countries. Only a few studies have utilized InSAR to study surface deformations in Guatemala, specifically, in volcanology [28,29], tectonics [30], and urban environments [17,18,20,23,29,31].
The lack of InSAR studies in Central American countries is particularly concerning given the region’s high vulnerability to natural disasters and anthropogenic activities [32]. For instance, several cities in the region are located in areas prone to earthquakes, landslides, and volcanic activity, increasing the likelihood of surface deformation events. Furthermore, rapid urbanization and population growth in the region have led to an increase in infrastructure development and extraction of natural resources, which can contribute to land subsidence and other forms of surface deformation. Therefore, the use of InSAR in Central American countries can provide valuable insights into surface deformation dynamics, inform risk assessments, and guide decision-making processes for sustainable urban development and natural resource management.
This study analyzes the deformation dynamics, with PS InSAR, of part of the Metropolitan Region of Guatemala, known officially as Región Metropolitana de Guatemala (RMG) (Figure 1 and Figure 2). This area is integrated by Guatemala city (formed by 22 zones) and four adjacent cities: Santa Catarina de Pinula, Petapa, Villanueva, and Mixco. The RMG is influenced by natural factors, such as geological features, extreme climate with intense precipitation, and socio-demographic factors, which makes it an interesting case study. The purpose of this paper is to emphasize the significance of using InSAR for an accurate and comprehensive analysis of deformation in urban areas to ensure sustainable development. Examining and evaluating risks is an initial step towards reducing their impact, as acknowledged by numerous international reports on Disaster Risk Reduction (DRR) and sustainable development [33,34,35].
DRR plays a crucial role in promoting social and economic growth and ensuring a sustainable future. Central American urban areas are geologically young volcanic areas. The physiographic architecture of Central America is primarily determined by the northwestern course of the Central American trench and the Central American volcanic front, which were formed by Cenozoic subduction [36]. Soils in the region, combined with heavy rainfall, topographic complexity, and a seismically active area, can be prone to great instability during earthquakes and heavy precipitation [37]. The Population Census XII and the Housing Census VII reveal that 14,901,286 people reside in Guatemala, with a yearly population growth rate of 1.8% between 2002 and 2018. The Guatemala Department, which includes Guatemala City and 16 other municipalities, houses the most significant percentage of the country’s population, 20.2% of the total [38]. This population growth has resulted in increased infrastructure development and exploitation of natural resources, such as underground water. Between 2017 and 2019, 2–3 million square meters of construction was authorized, with the municipality of Guatemala accounting for 45% of these new construction areas. Housing projects make up a large proportion of these projects, with an increase of 1,363,777 buildings between 2002 and 2018 [39]. Construction and urban growth must be conducted within the framework provided by risk assessments, with a focus on disaster risk reduction. Land use sensitive to disaster risks, urban planning, safe construction, and sound infrastructure will not only contribute to water management, but will also protect lives and properties, and thus benefit entire cities [39].
Studies have demonstrated that water pumping for urban and agricultural use is one of the primary factors that trigger land subsidence [10,16,40,41,42,43,44]. InSAR is an accurate tool that can be applied to groundwater management and used to monitor changes in urban areas and predict disasters to avoid economic, environmental, and human losses. The conservation and efficient use of water resources is a vital concern of the RMG government. Factors such as climate change, environmental degradation, and pollution have contributed to water scarcity in Guatemala [45,46]. Due to population growth, there has been an increase in groundwater exploitation, resulting in lower water levels in some wellfields [45,46,47]. In addition, deforestation of hydrographic basins has led to an increase in surface runoff, decreasing infiltration into the soil. The sealing of land through construction and urbanization of areas, overuse of aquifers by public and private entities, lack of regulations and control on the use of water resources, and other factors, threaten the availability of this vital resource [48].
Guatemala City is located in an area that has been affected by highly destructive earthquakes throughout history. Specifically it has experienced 21 major earthquakes, with an intensity on the Mercalli scale greater than VIII [49]. The study area contains important faults and volcanic elements, with Mixco and Pinula fault structures being the main faults located within the study area, and Santiaguito, Fuego, and Pacaya being the main volcanoes [50].
Several sinkholes and some other local events have been identified in the study area. A relevant sinkhole cited in the literature [51] occurred in the year 2007, measuring 30 m in diameter and 60 m in depth. In the short period between June and October 2022, nine sinkhole events [52], with associated collapsed buildings, were recorded in the study. As mentioned above, this study focuses on diagnosing the patterns of deformation in the main urbanized zones of RMG, and aims to locate and quantify the severity of the deformation phenomenon in the area.
The use of InSAR technology is being considered as a potentially economically sustainable approach to detect areas of instability. Given the reported cases in the literature of environmental characteristics and population growth in the area, attending to this case study is deemed important. Understanding the conditions of change is crucial in meeting the needs of the affected areas, and identifying the characteristics of the most affected areas can aid in finding the causes and developing solutions to avoid future problems.

2. Materials and Methods
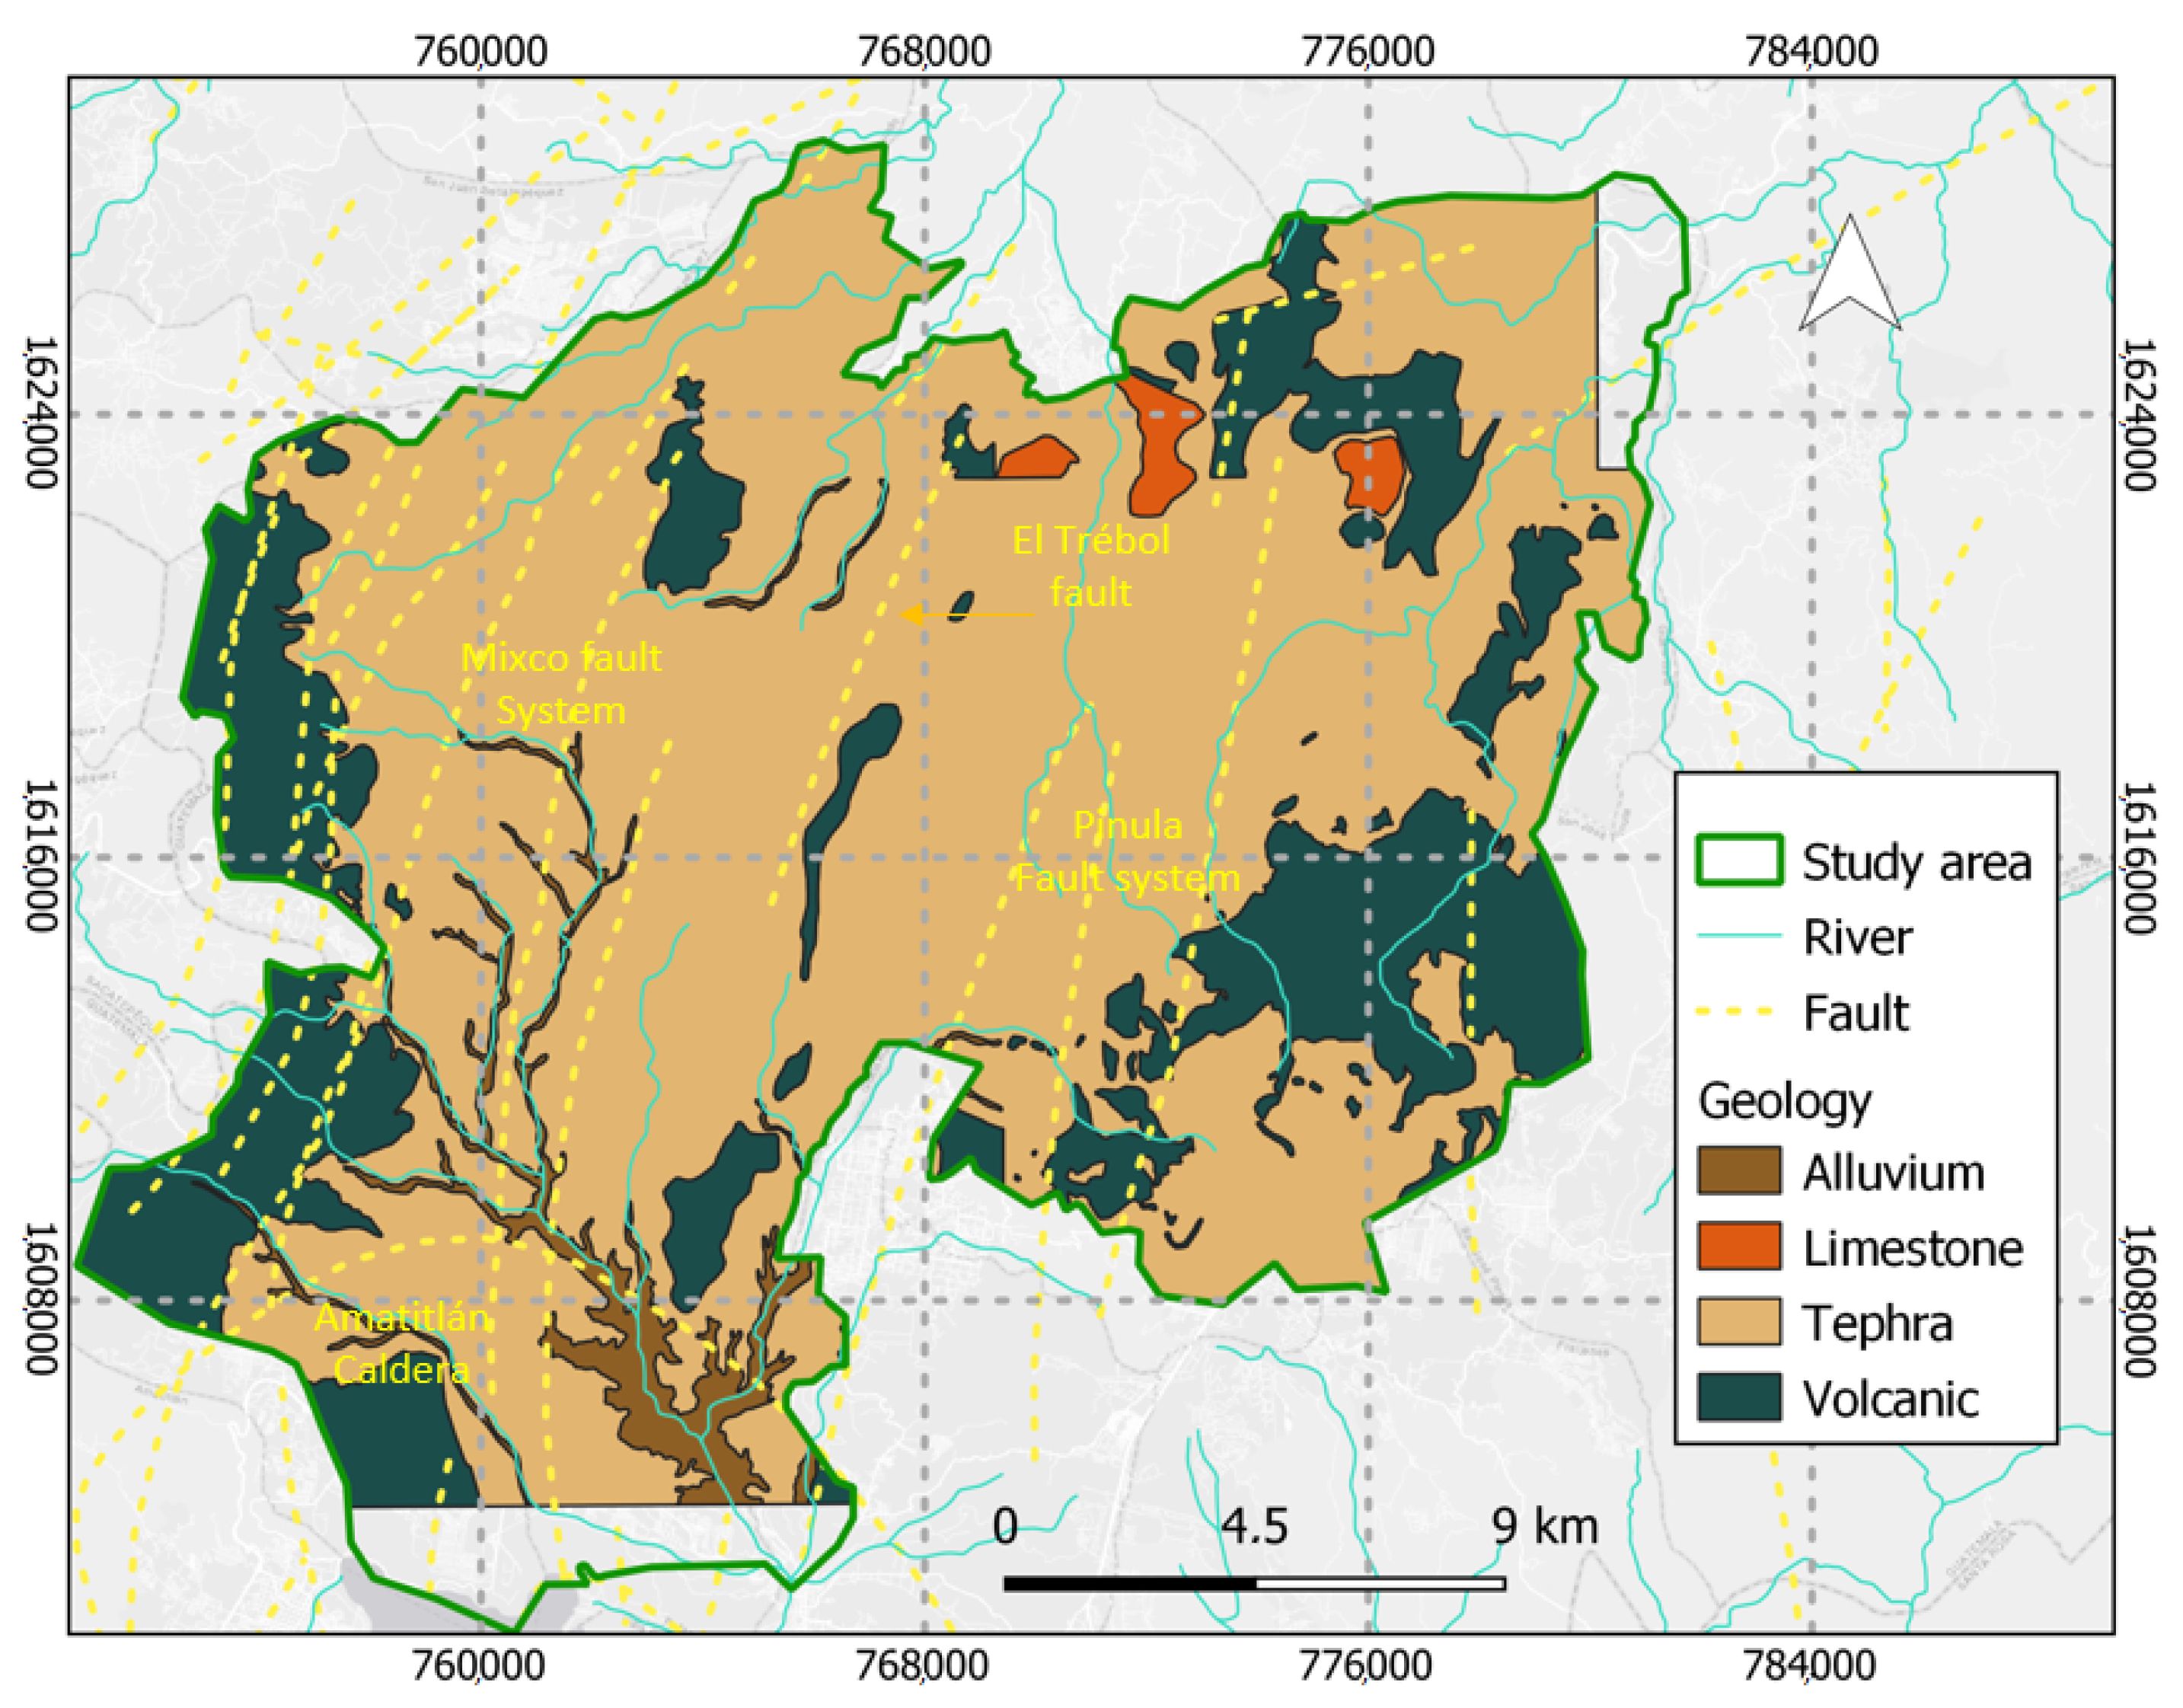
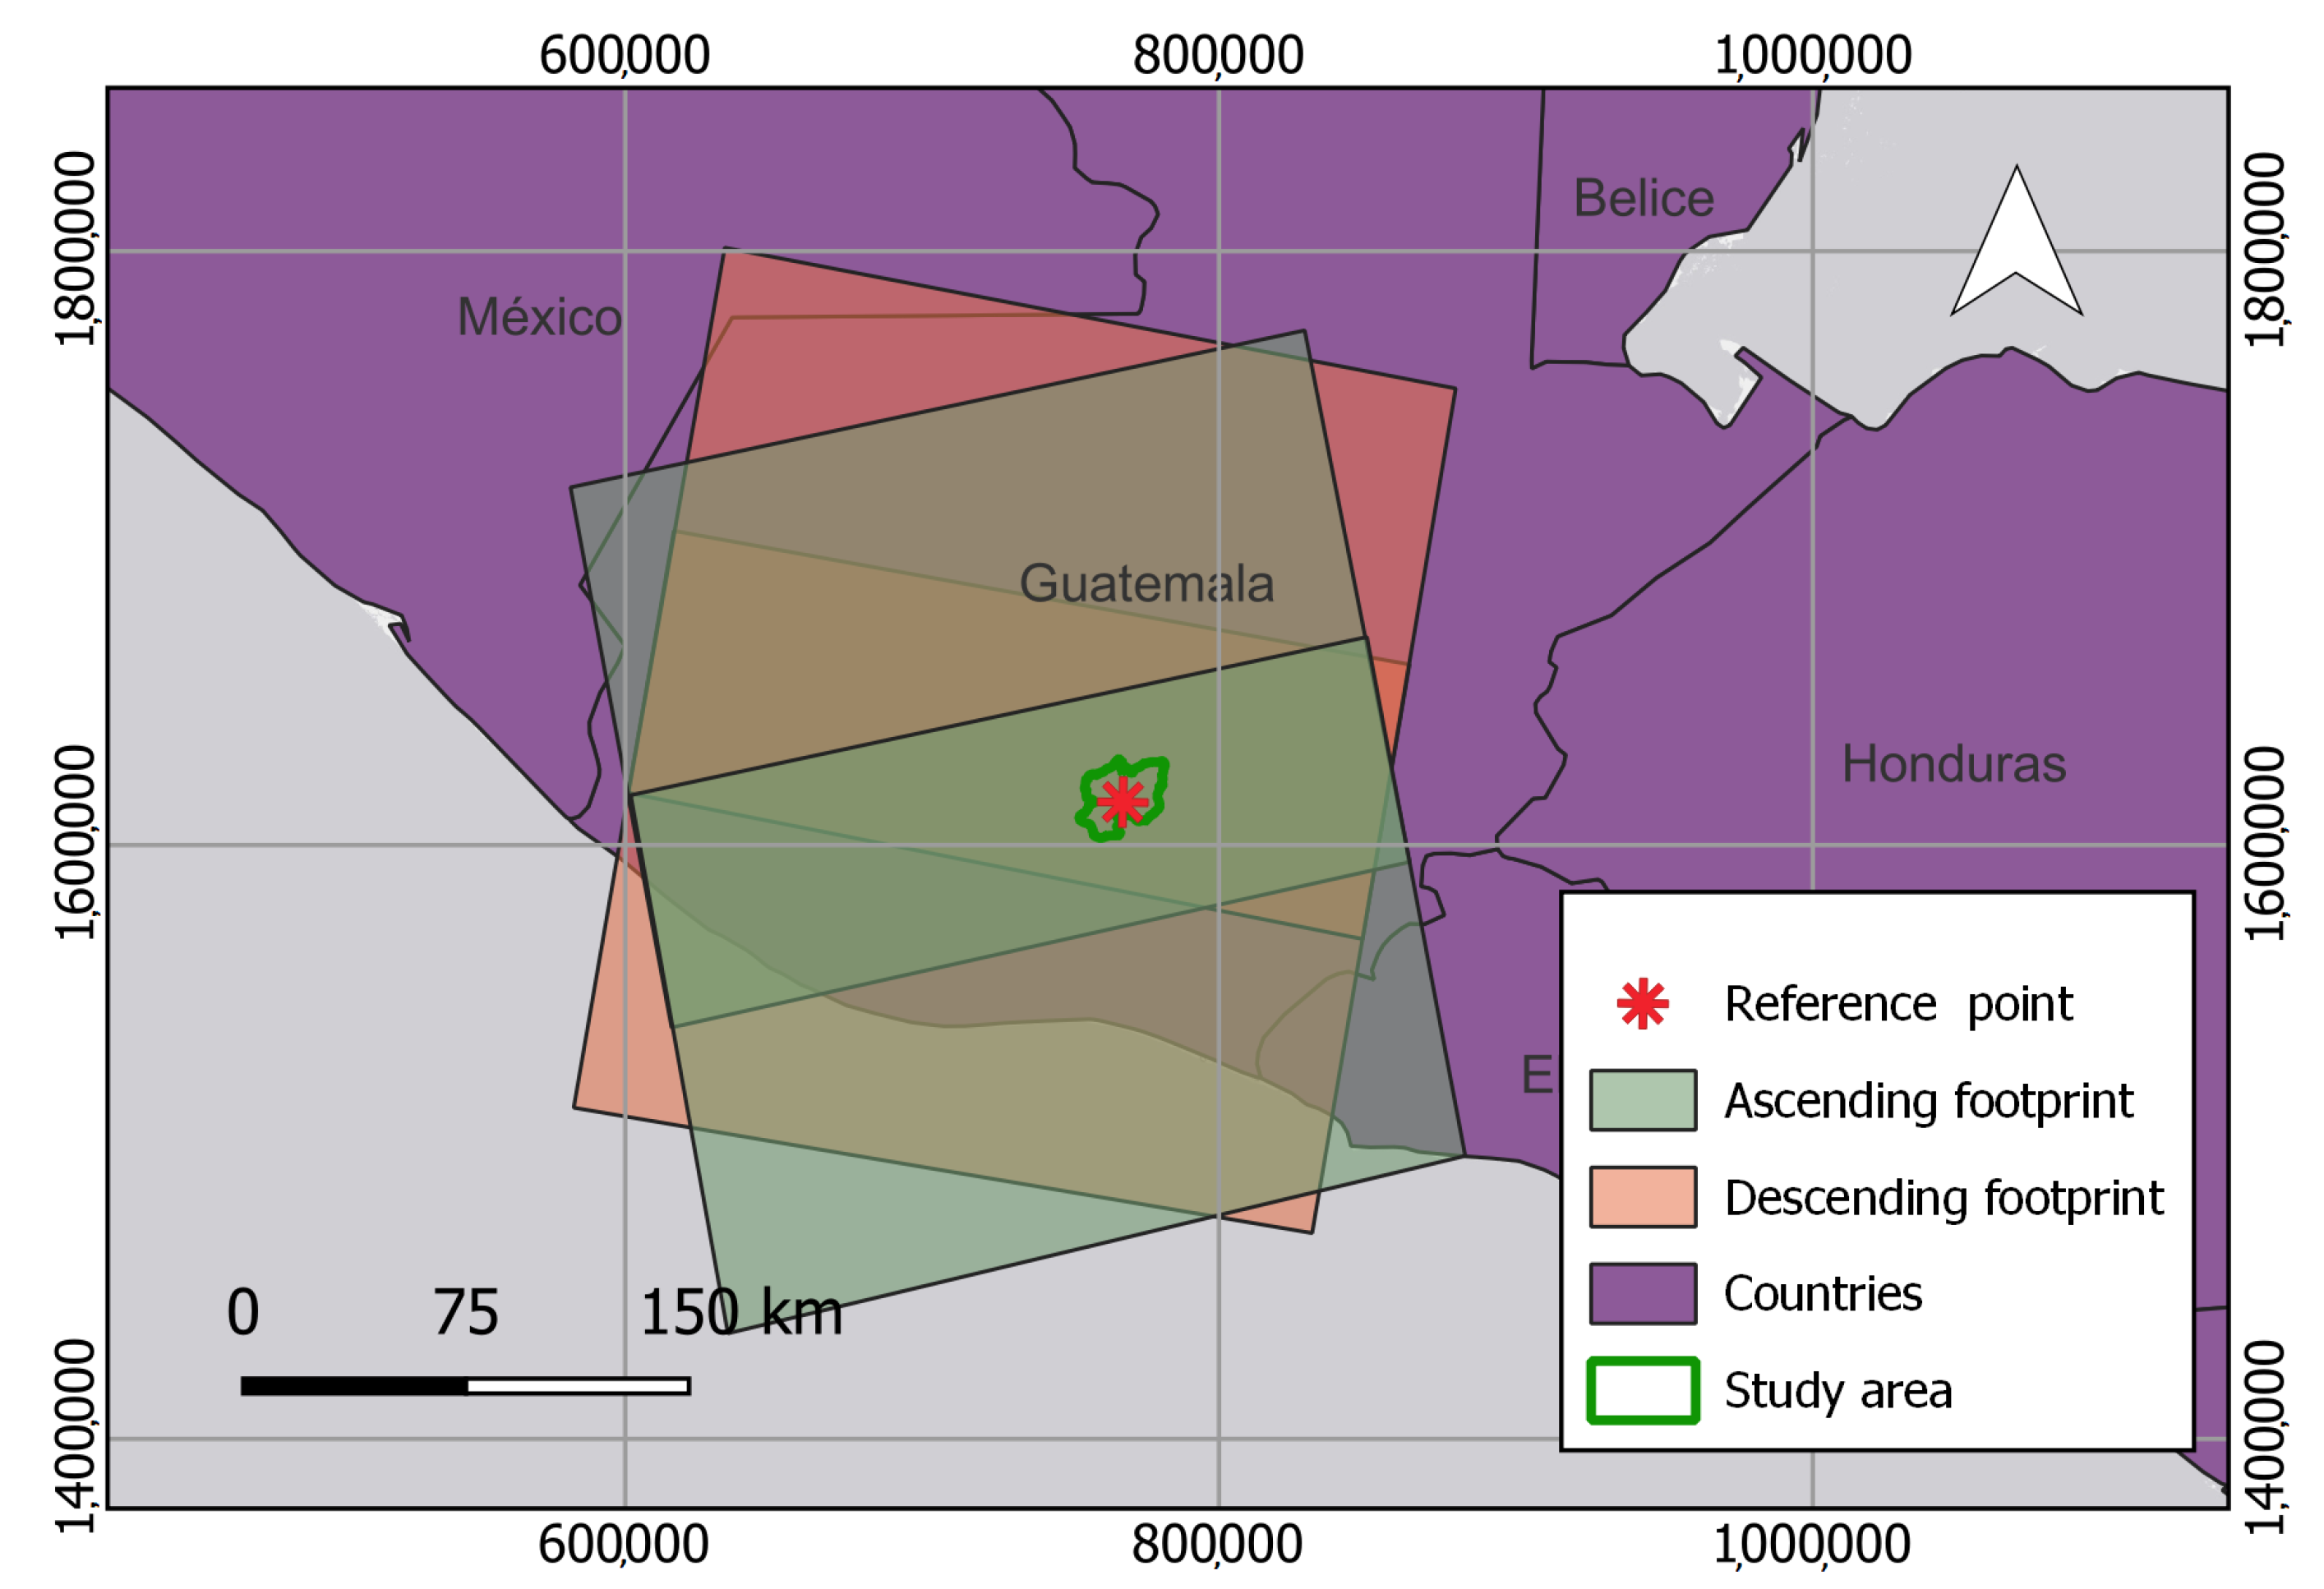
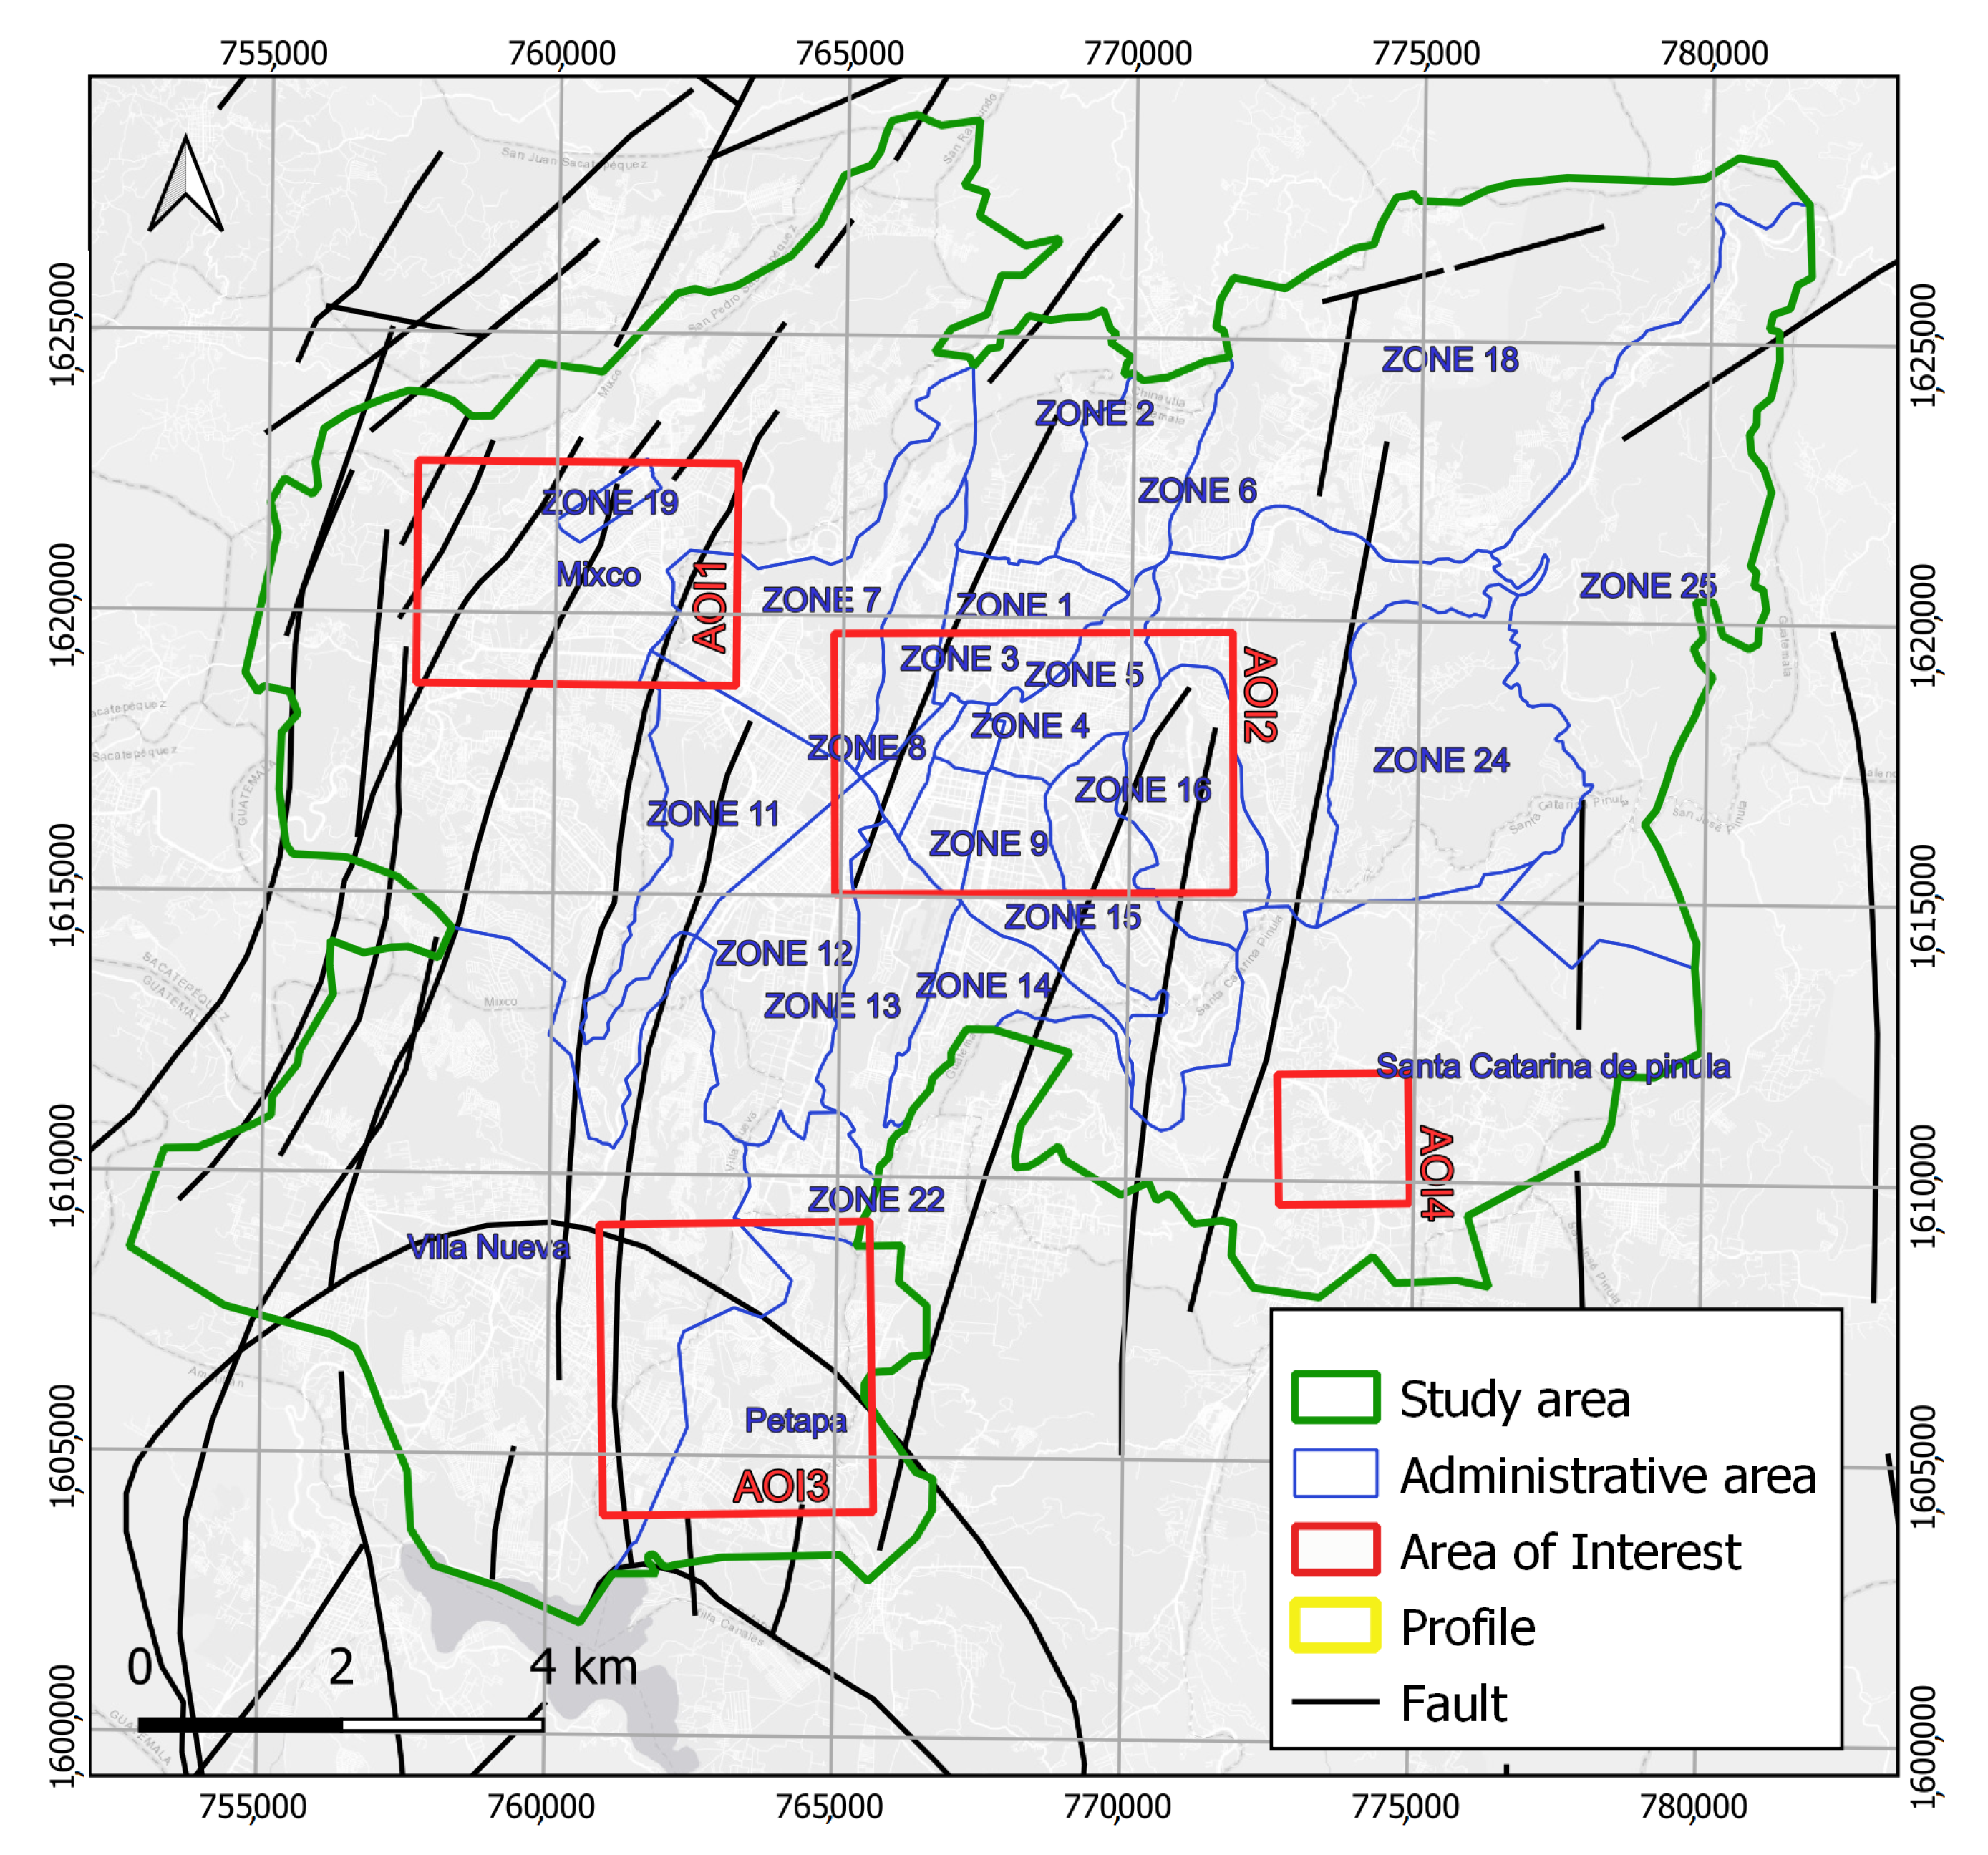
2.1. Study Area

The study area encompasses the municipalities of Guatemala City, Mixco, Villa Nueva, San Miguel de Petapa, and Santa Catarina de Pinula. They integrate the RMG (Región Metropolitana de Guatemala), spanning a total area of 47,218 hectares.
The Guatemala City valley lies at the intersection of three tectonic plates: North America, Caribbean, and Cocos. The Cocos plate subducts under the Caribbean plate in the Mesoamerican trench, giving rise to the Central American mountain range of volcanoes. This range has attained its maximum growth in Guatemala, and is characterized by calderic cones and depression outcrops, with acid volcanism represented by rhyolites, ignimbrites, and pyroclasts. The Guatemala City valley can be defined as a graben or trench bounded on the east by the Pinula and on the west by the Mixco faults [50,53]. The geological formations in the area consist of granitic intrusive rocks, rhyolitic lava flows, sediments, and tuffs, which constitute the Tertiary volcanic group. Additionally, there are Quaternary volcanic deposits in the form of tephras (pyroclasts) that culminate in alluvial deposits. The geology was reclassified into four classes: alluvium, sedimentary rock, tephra, and other volcanic rocks (Figure 1) [50,54,55,56,57].
The formation process of the Guatemala City valley is intricately linked with the Motagua and Jalpatagua faults, and the zone of distension that arose at their intersection. During the Middle Miocene, the Motagua and Pinula faults became increasingly active [58], resulting in the creation of a weaker zone that facilitated the rise of magma to the volcanic structures of the Pinula and El Naranjo volcanoes. While this zone initially served as a channel for magma to rise, continuous movements of the faults in the distension zone eventually led to the formation of the Mixco fault. The shape of the Mixco fault closely follows the contour of the relict structure of the Pinula volcano, and its movements induced the subsidence of the valley and its volcanic structures. The boundary between the depression and the volcanic structure is delineated by the El Trébol fault within the Guatemala City valley [50]. Guatemala City was established as the capital of the country in 1773, after the former capital of Santiago de los Caballeros was devastated by the Santa Marta earthquake [59,60].
Analyzing isophreatic lines from 1978, 1995, and 2012 [46], a decline in the water table over the past three decades of exploitation was observed. In sedimentary rock deposits, the water table has decreased by −3 to −5.5 m/year, while volcanic aquifers have decreased by around −3.4 m/yr. Due to uncontrolled exploitation of aquifers without legal regulation, excessive groundwater extraction is taking place in the area, risking premature depletion of the reserves [46].

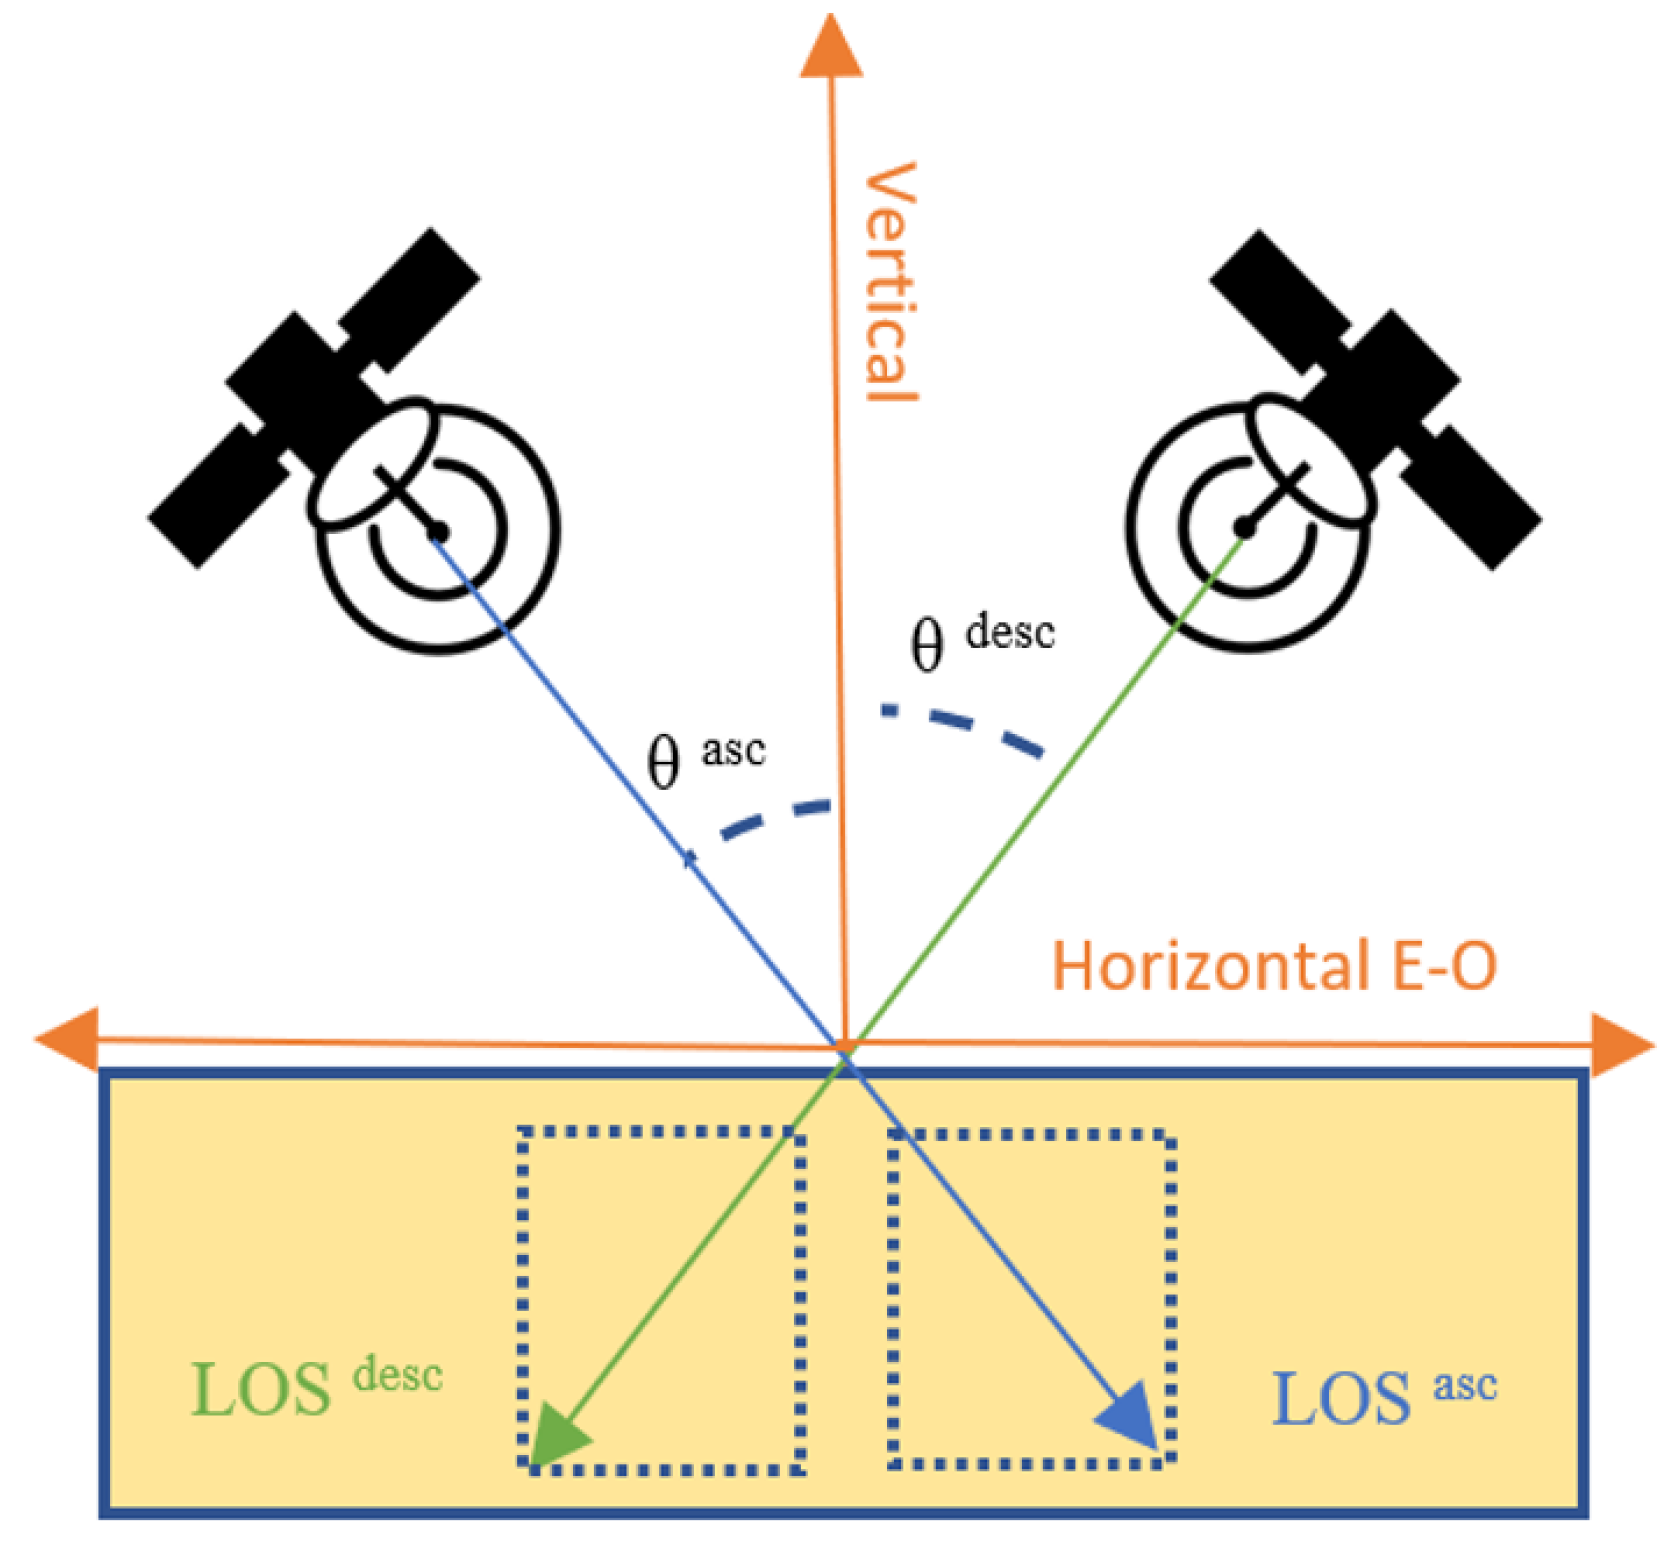
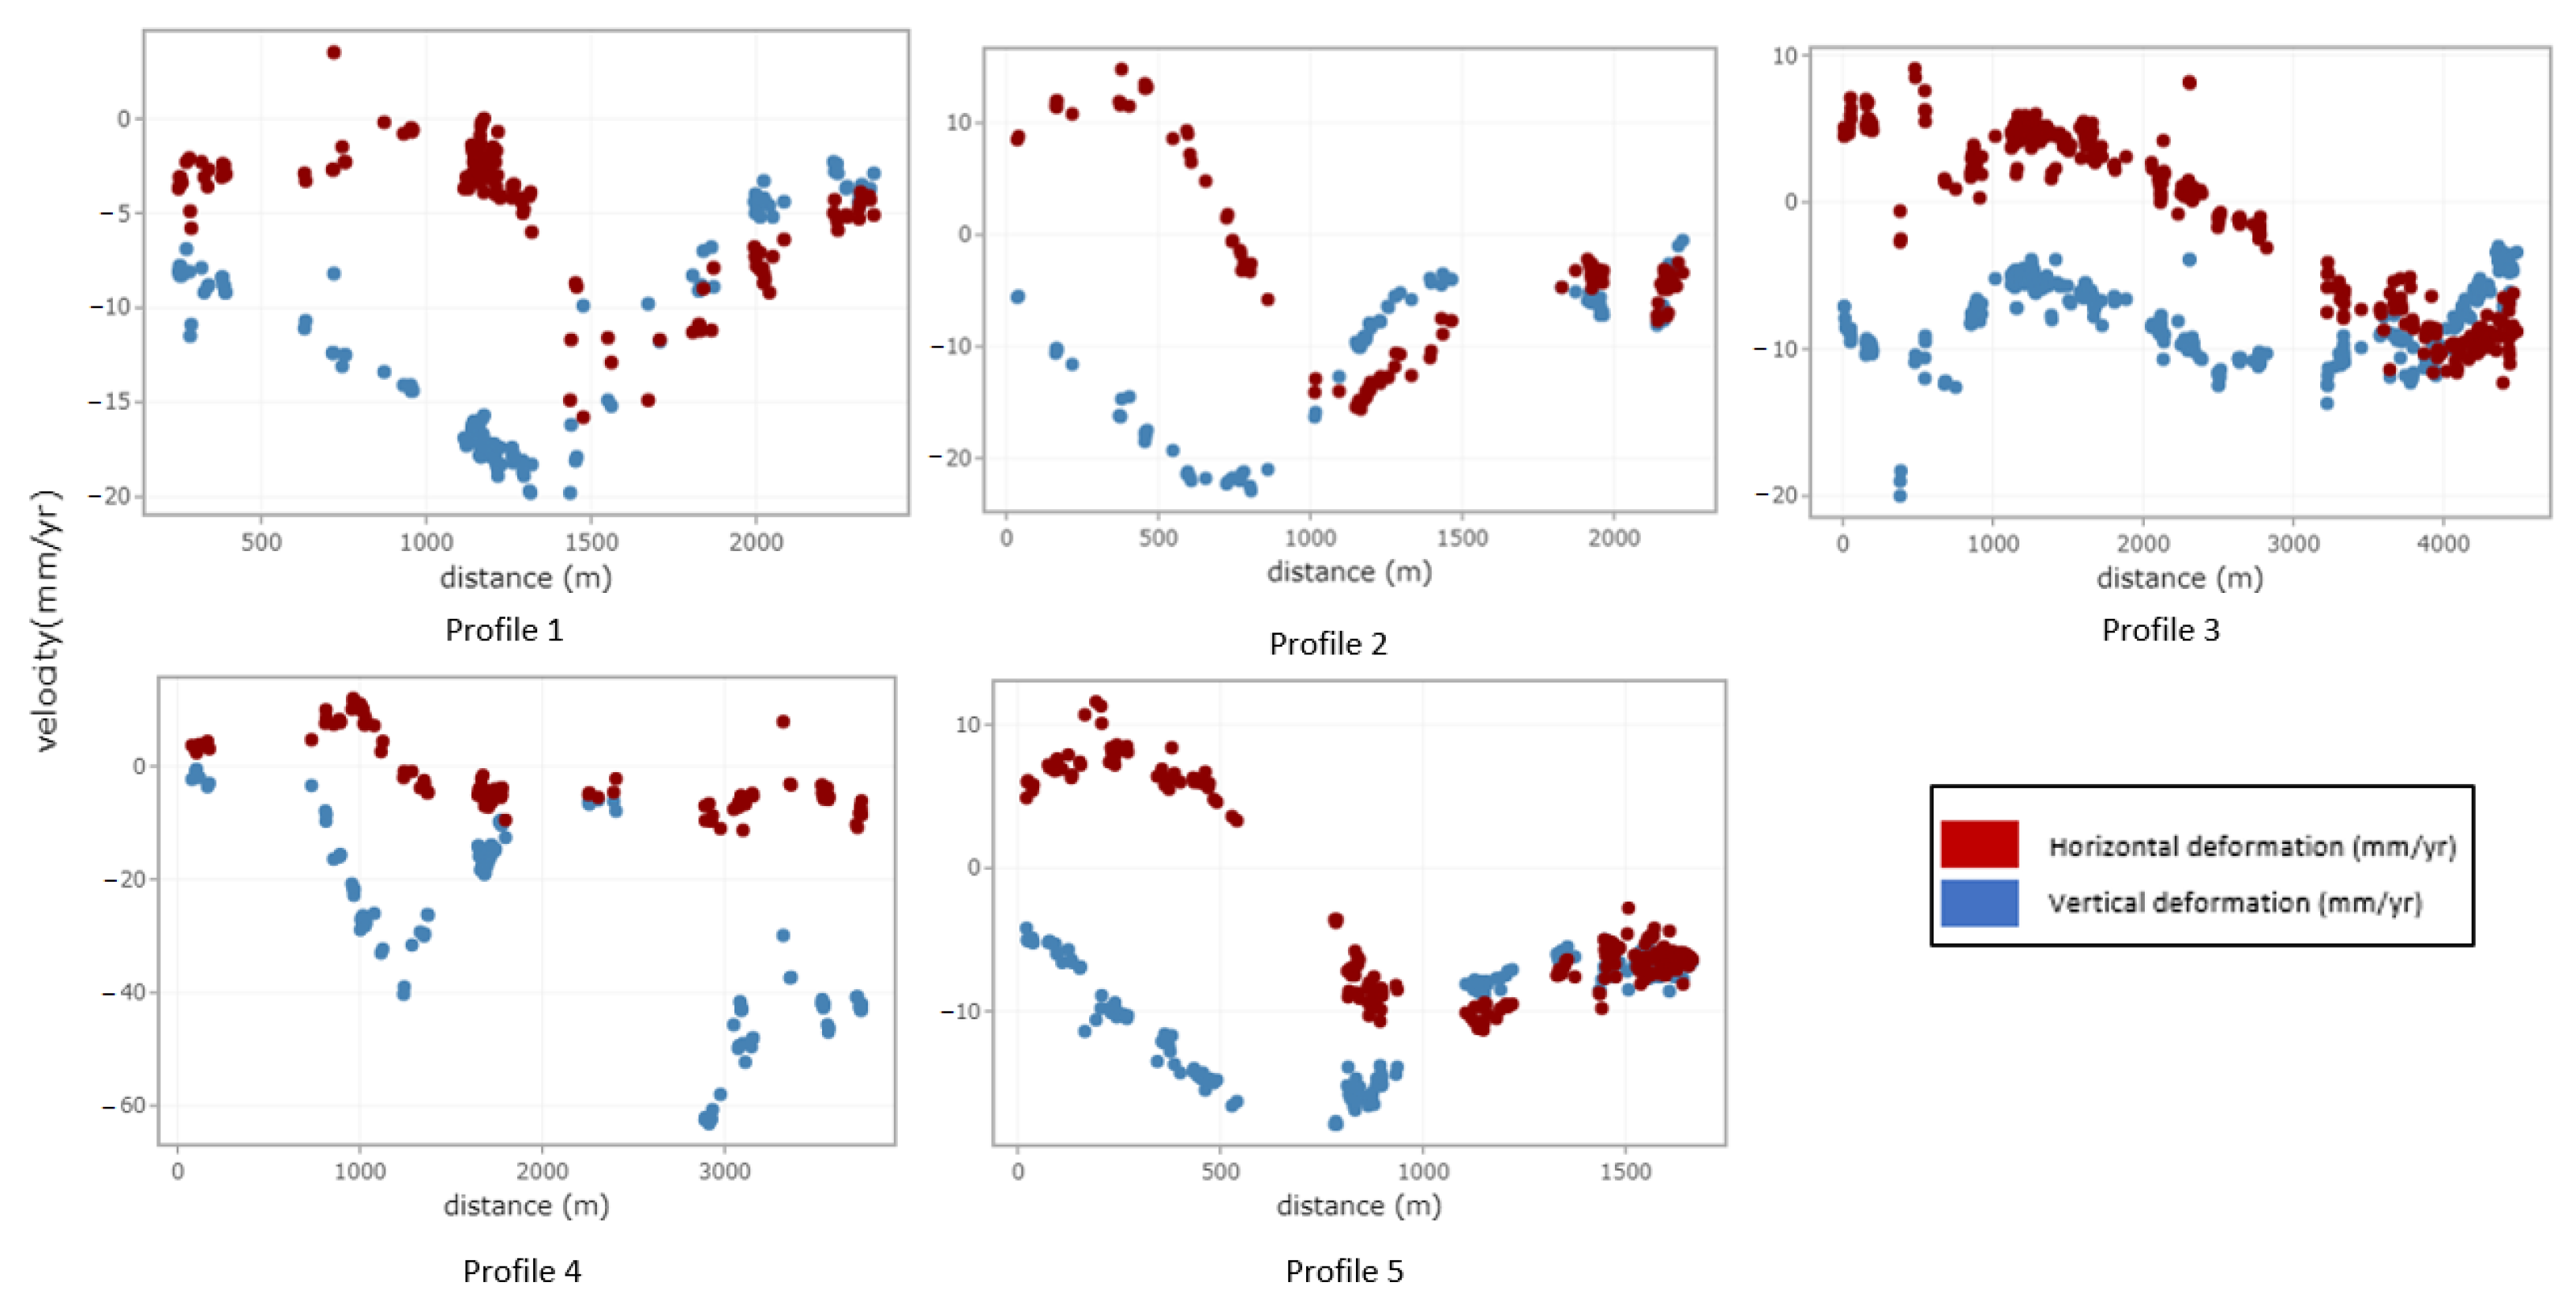
2.2. MT-InSAR Processing and Vectorial Decomposition

A total of 226 SAR images were processed, including both ascending and descending geometries from Sentinel-1 constellation satellites A and B (Figure 2). All images are Single Look Complex (SLC) TOPSAR data acquired in Interferometric Wide (IW) swath mode with VV polarization, for the time frame of January 2017 to September 2021 (Table 1).
The SeNtinel Application Platform (SNAP) version 9.0.0 developed by the European Space Agency (ESA), snap2stamps, and the Stanford Method for Persistent Scatterers (StaMPS) software were used following SNAP-StaMPs integrated processing for Sentinel-1 PSI [61].
To achieve satisfactory outcomes, it is crucial to appropriately configure the input parameters for StaMPS processing to prevent the occurrence of non-natural artifacts. StaMPS parameters significantly influence the final results. The characteristics of the analyzed movements impact the processing results, emphasizing the importance of appropriate settings. In our case, default parameter values led to an irregular stepped trend in several PS time series. To address this, parameters related to atmospheric filtering, phase unwrapping, and estimation of the Spatially Correlated Look Angle (SCLA) error have been set to values explained by Balbi et al. 2021 [62]. Specifically, these modified parameters introduced in the final steps of StaMPS that allowed us to obtain a more natural trend are as follows: “unwrap_time_win” set to 24 days (default 730 days) to smooth the phase in time by estimating noise for each pair of neighboring pixels; “unwrap_grid_size” set to 10 m (default 200 m) for spacing of the resampling grid; “unwrap_gold_n_win” set to 8 (default 32) for the size of the window used in the Goldstein filter; “scla_deramp” set to “yes” (default “no”) to estimate the phase ramp for each interferogram; and “scn_time_win” set to 50 days (default 365) for the window size of the low-pass temporal filter.
Both geometries were referenced to a compact area with highly temporal coherence (>0.8) near the GNSS station GUAT (14.590, −90.520) [63]. The reference point is located in a flat area (slopes close to zero degrees) over the tephra geology class. Line-of-Sight (LOS) ascending and descending series were combined in a vectorial decomposition to obtain the vertical and east–west displacements. Each point in the ascending geometry is paired with the nearest neighbor point in the descending geometry, not further than a certain predefined threshold. This distance threshold has been defined according to the accuracy of the position of the PS. Under the assumption that there is no movement in the north–south planimetry direction, it is possible to decompose LOS movements on the vertical and east–west planimetry directions. For each ascending/descending pair of points, we compute decomposed movements following Equations (1) and (2). This decomposition approach has been successfully applied in previous studies [64,65]:
d e a s t = c o s θ d e s c d L O S a s c c o s θ a s c d L O S d e s c c o s θ a s c c o s ϕ d e s c s i n θ d e s c c o s θ d e s c c o s ϕ a s c s i n θ a s c
d u p = s i n θ d e s c c o s ϕ d e s c d L O S a s c s i n θ a s c c o s ϕ a s c d L O S d e s c c o s θ a s c c o s ϕ d e s c s i n θ d e s c c o s θ d e s c c o s ϕ a s c s i n θ a s c
where d L O S a s c and d L O S d e s c are the measured displacements in the Line-Of-Sight (LOS) direction for the ascending and descending datasets, θ a s c and θ d e s c are the looking angles for the ascending and descending LOS directions, ϕ a s c and ϕ d e s c are the horizontal angles of the LOS directions measured from the north in a clockwise direction, and d u p and d e a s t are the decomposed mean deformations in the vertical and east directions (Figure 3).
The combination of ascending and descending PS was performed in the vector domain [64,66], combining PSs based on spatial proximity. Any PS located in one geometry that lacked neighboring PSs in the opposite geometry within a designated search radius of 10 m were omitted.

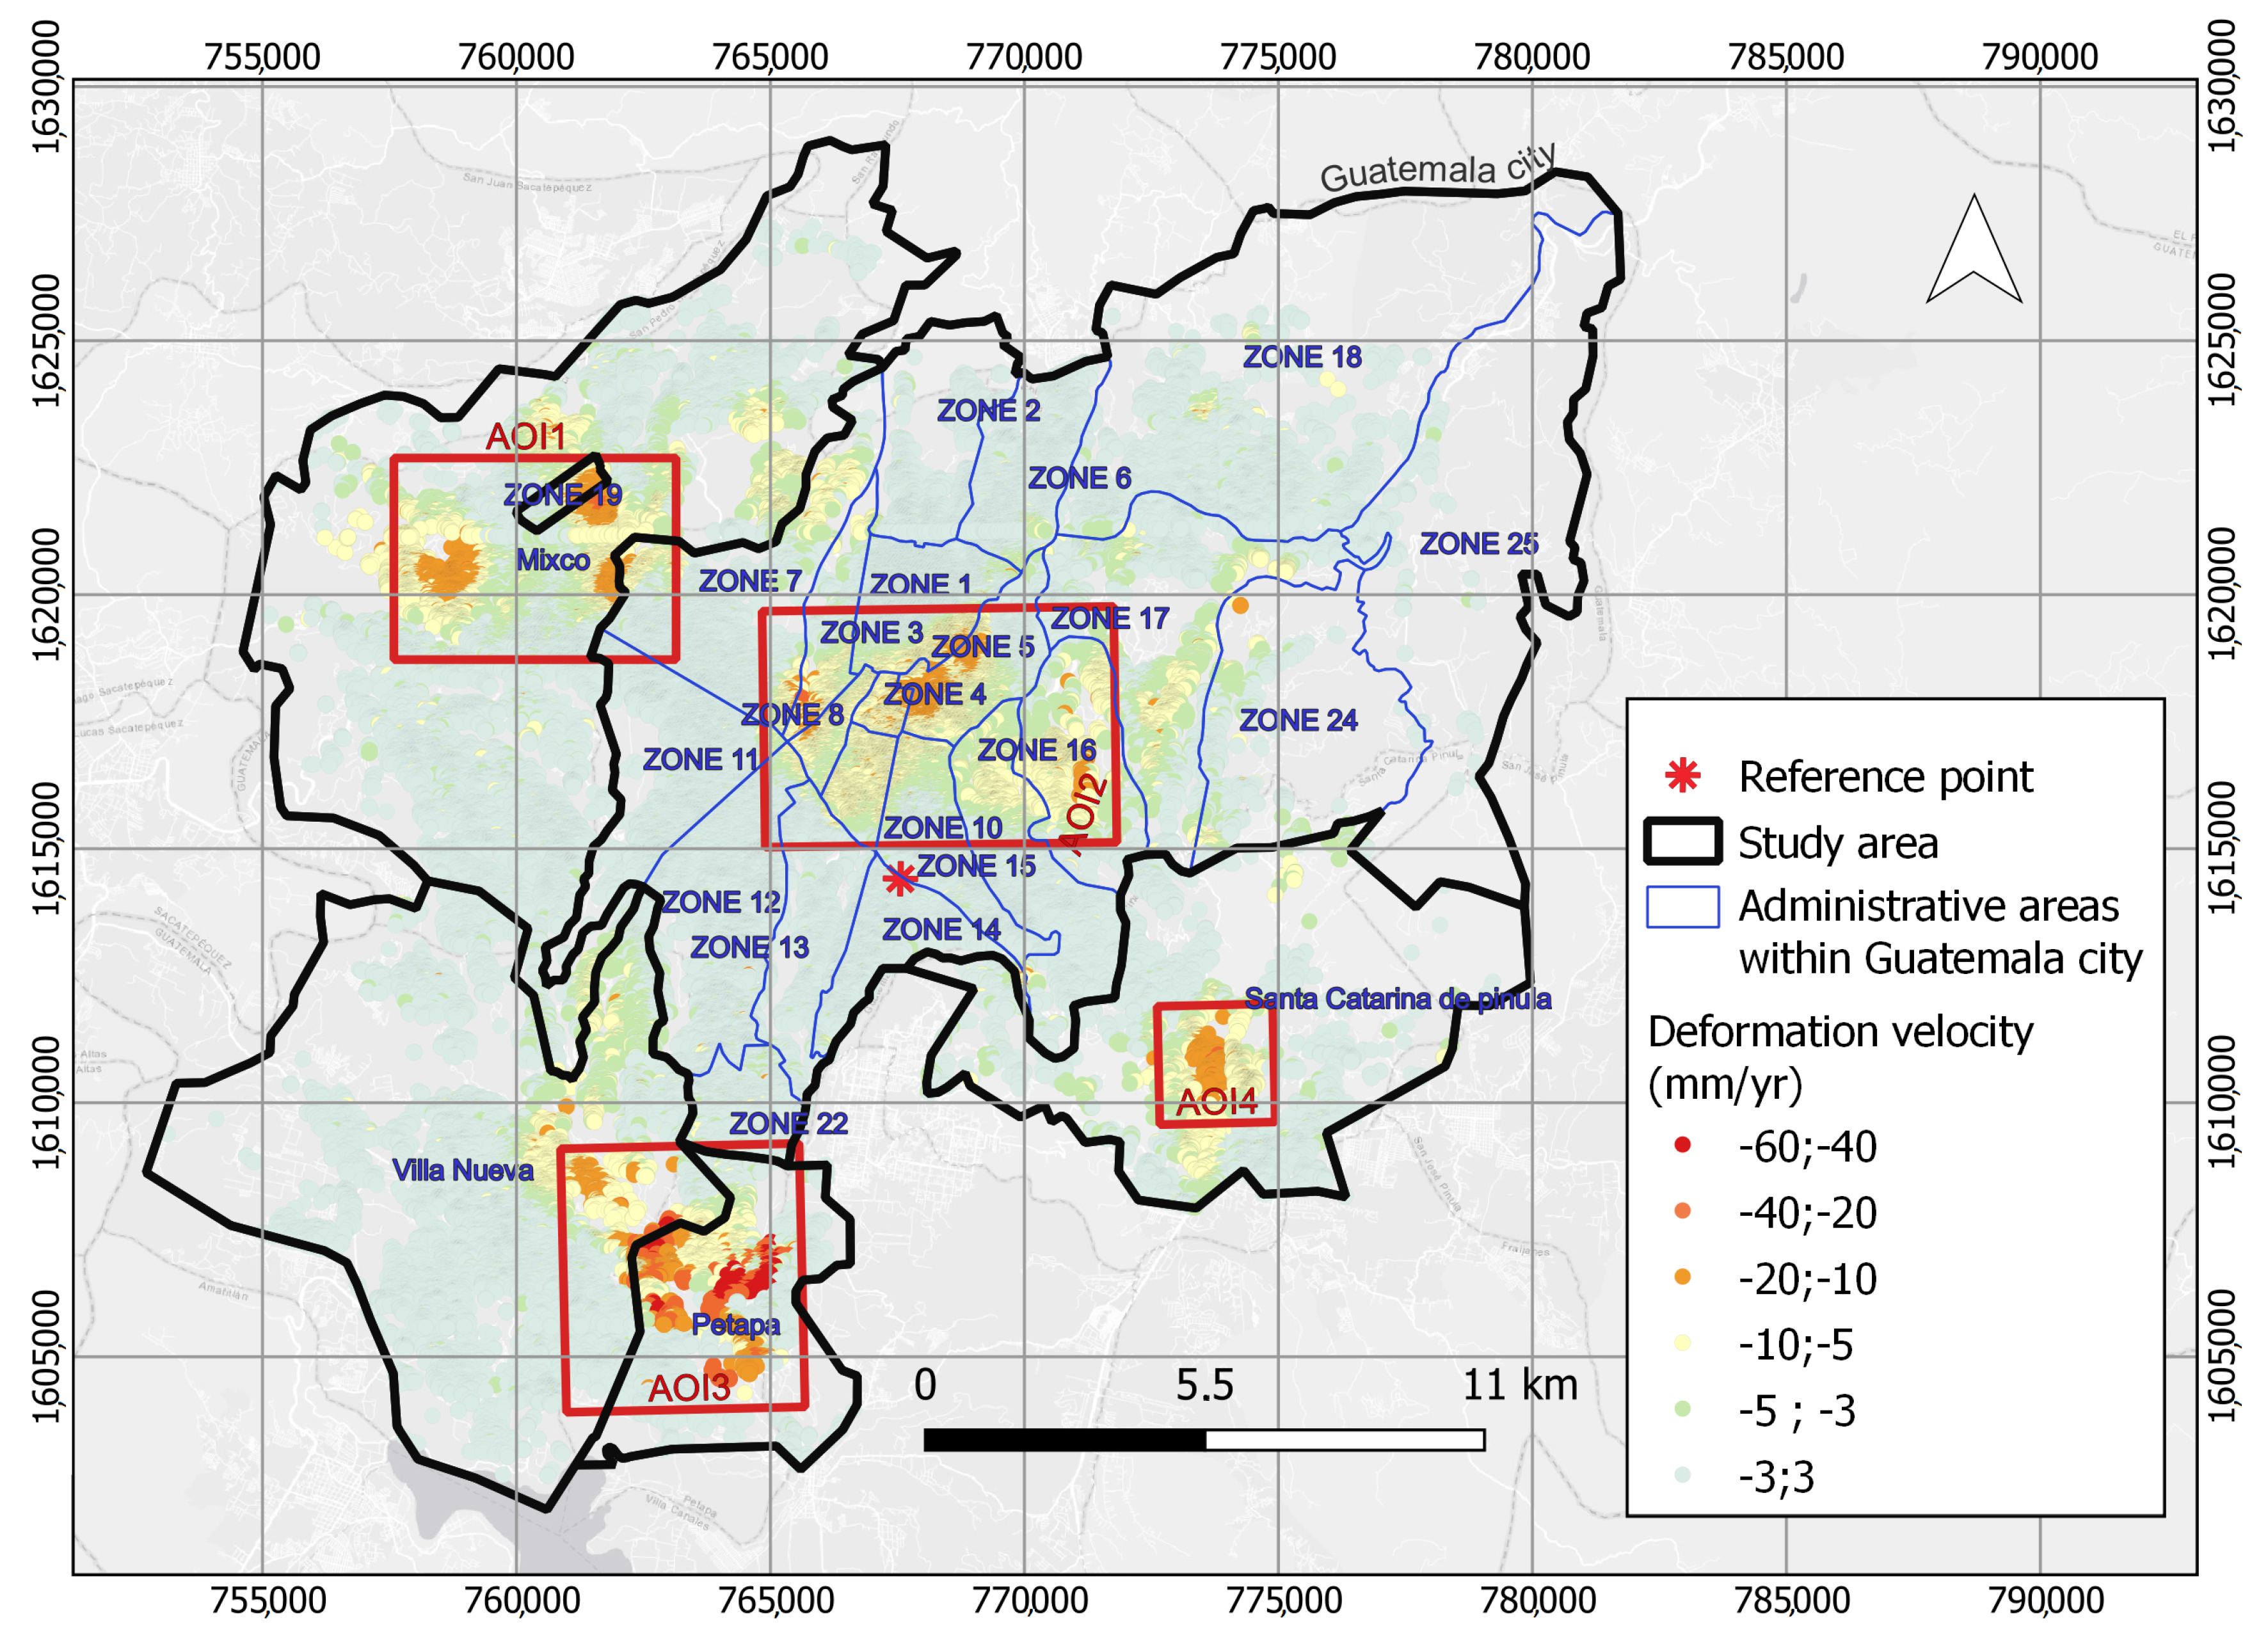
2.3. Deformation Analysis and Identification of Critical Areas of Subsidence

With the aim of highlighting the existing patterns over the vertical velocity deformation maps, a Jenks classification with six classes was performed with QGIS software [67,68]. Class ranges were rounded to closer multiples of 10, taking into account the range and variability of vertical deformations in the area of study. Velocity profiles have been drawn over the areas with the largest subsidences to perform a qualitative analysis on the trends and patterns of the vertical and east–west deformation average velocities. Kriging techniques [69] have been applied to delineate the critical areas of subsidence. In the generated rasters, regions displaying subsidence rates exceeding 10 mm/yr were carefully identified and outlined as areas with the most significant subsidence patterns. The administrative zones and the Global Human Settlement Built-up area product [70] were employed to accurately quantify the extent and severity of the impact on each of these administrative zones.
In order to delve deeper into the analysis and identify consistent patterns of deformation, a comprehensive examination was conducted within the study area. Specifically, relevant Areas of Interest (AOIs) were delineated and characterized, aiming to pinpoint distinct zones exhibiting significant subsidence. These AOIs were defined as areas where vertical deformations exceeded 10 mm/yr and encompassed an area larger than 50 hectares.
The deformation patterns of each AOI were examined independently and in conjunction with other variables. Deformation maps were analyzed jointly with slope (%), elevation (m.a.s.l.), aspect, and geology class. For this purpose, we used a DTM from Alos Palsar-1 [71] and the geology map classification developed by Intituto Geográfico Nacional in Guatemala [54,55,56,57]. This map was reclassified on the four main geology classes that can be found in the area: sedimentary rocks, alluvium, tephra, and other volcanic rocks.
In each of the AOIs, areas representing a subsidence trend have been selected. Subsequently, the time series of deformation for these areas were analyzed to assess variations in subsidence trends and accelerations during the specified period.

3. Results

A total of 269,205 PSs were obtained after the decomposition into vertical and east–west directions. A point density of 189 PS/km2 was obtained for the urban surface inside the study area (Figure 4). According to the Global Human Settlement Built-up area product [70], 48% of the analysis area is urbanized, while 51% is vegetated.
The majority of PSs are localized in constructed zones, as dense vegetation hinders the obtention of PSs derived from C band data. The data also show that 3.9% (891 ha) of the urbanized area included in the study area is affected by deformations greater than 10 mm/yr (Table 2).
The most affected areas by deformation in terms of surface are Petapa and Mixco, located in the south and northwest of the study area, respectively, with surfaces that reach 355 and 185 ha of urban area. Santa Catarina de Pinula, Villanueva, and Zone 5 (Guatemala City) also reach subsidences of over 10 mm/yr in areas larger than 50 ha (Table 2).
Figure 5 presents the distribution of the PS vertical velocities for the main geology classes. This distribution shows that the largest subsidence is located in the alluvium class. The presence of numerous and widely scattered outliers for sedimentary, tephra, and volcanic rock indicates a higher degree of variability and potentially complex deformation patterns in these geology classes.
The majority of the alluvium class is situated in the municipality of Petapa, which coincides with the area where the highest deformation magnitudes have been observed. Non-meaningful results were obtained in the comparison of deformation patterns with the rest of the analyzed variables, such as slope, elevation, and aspect.

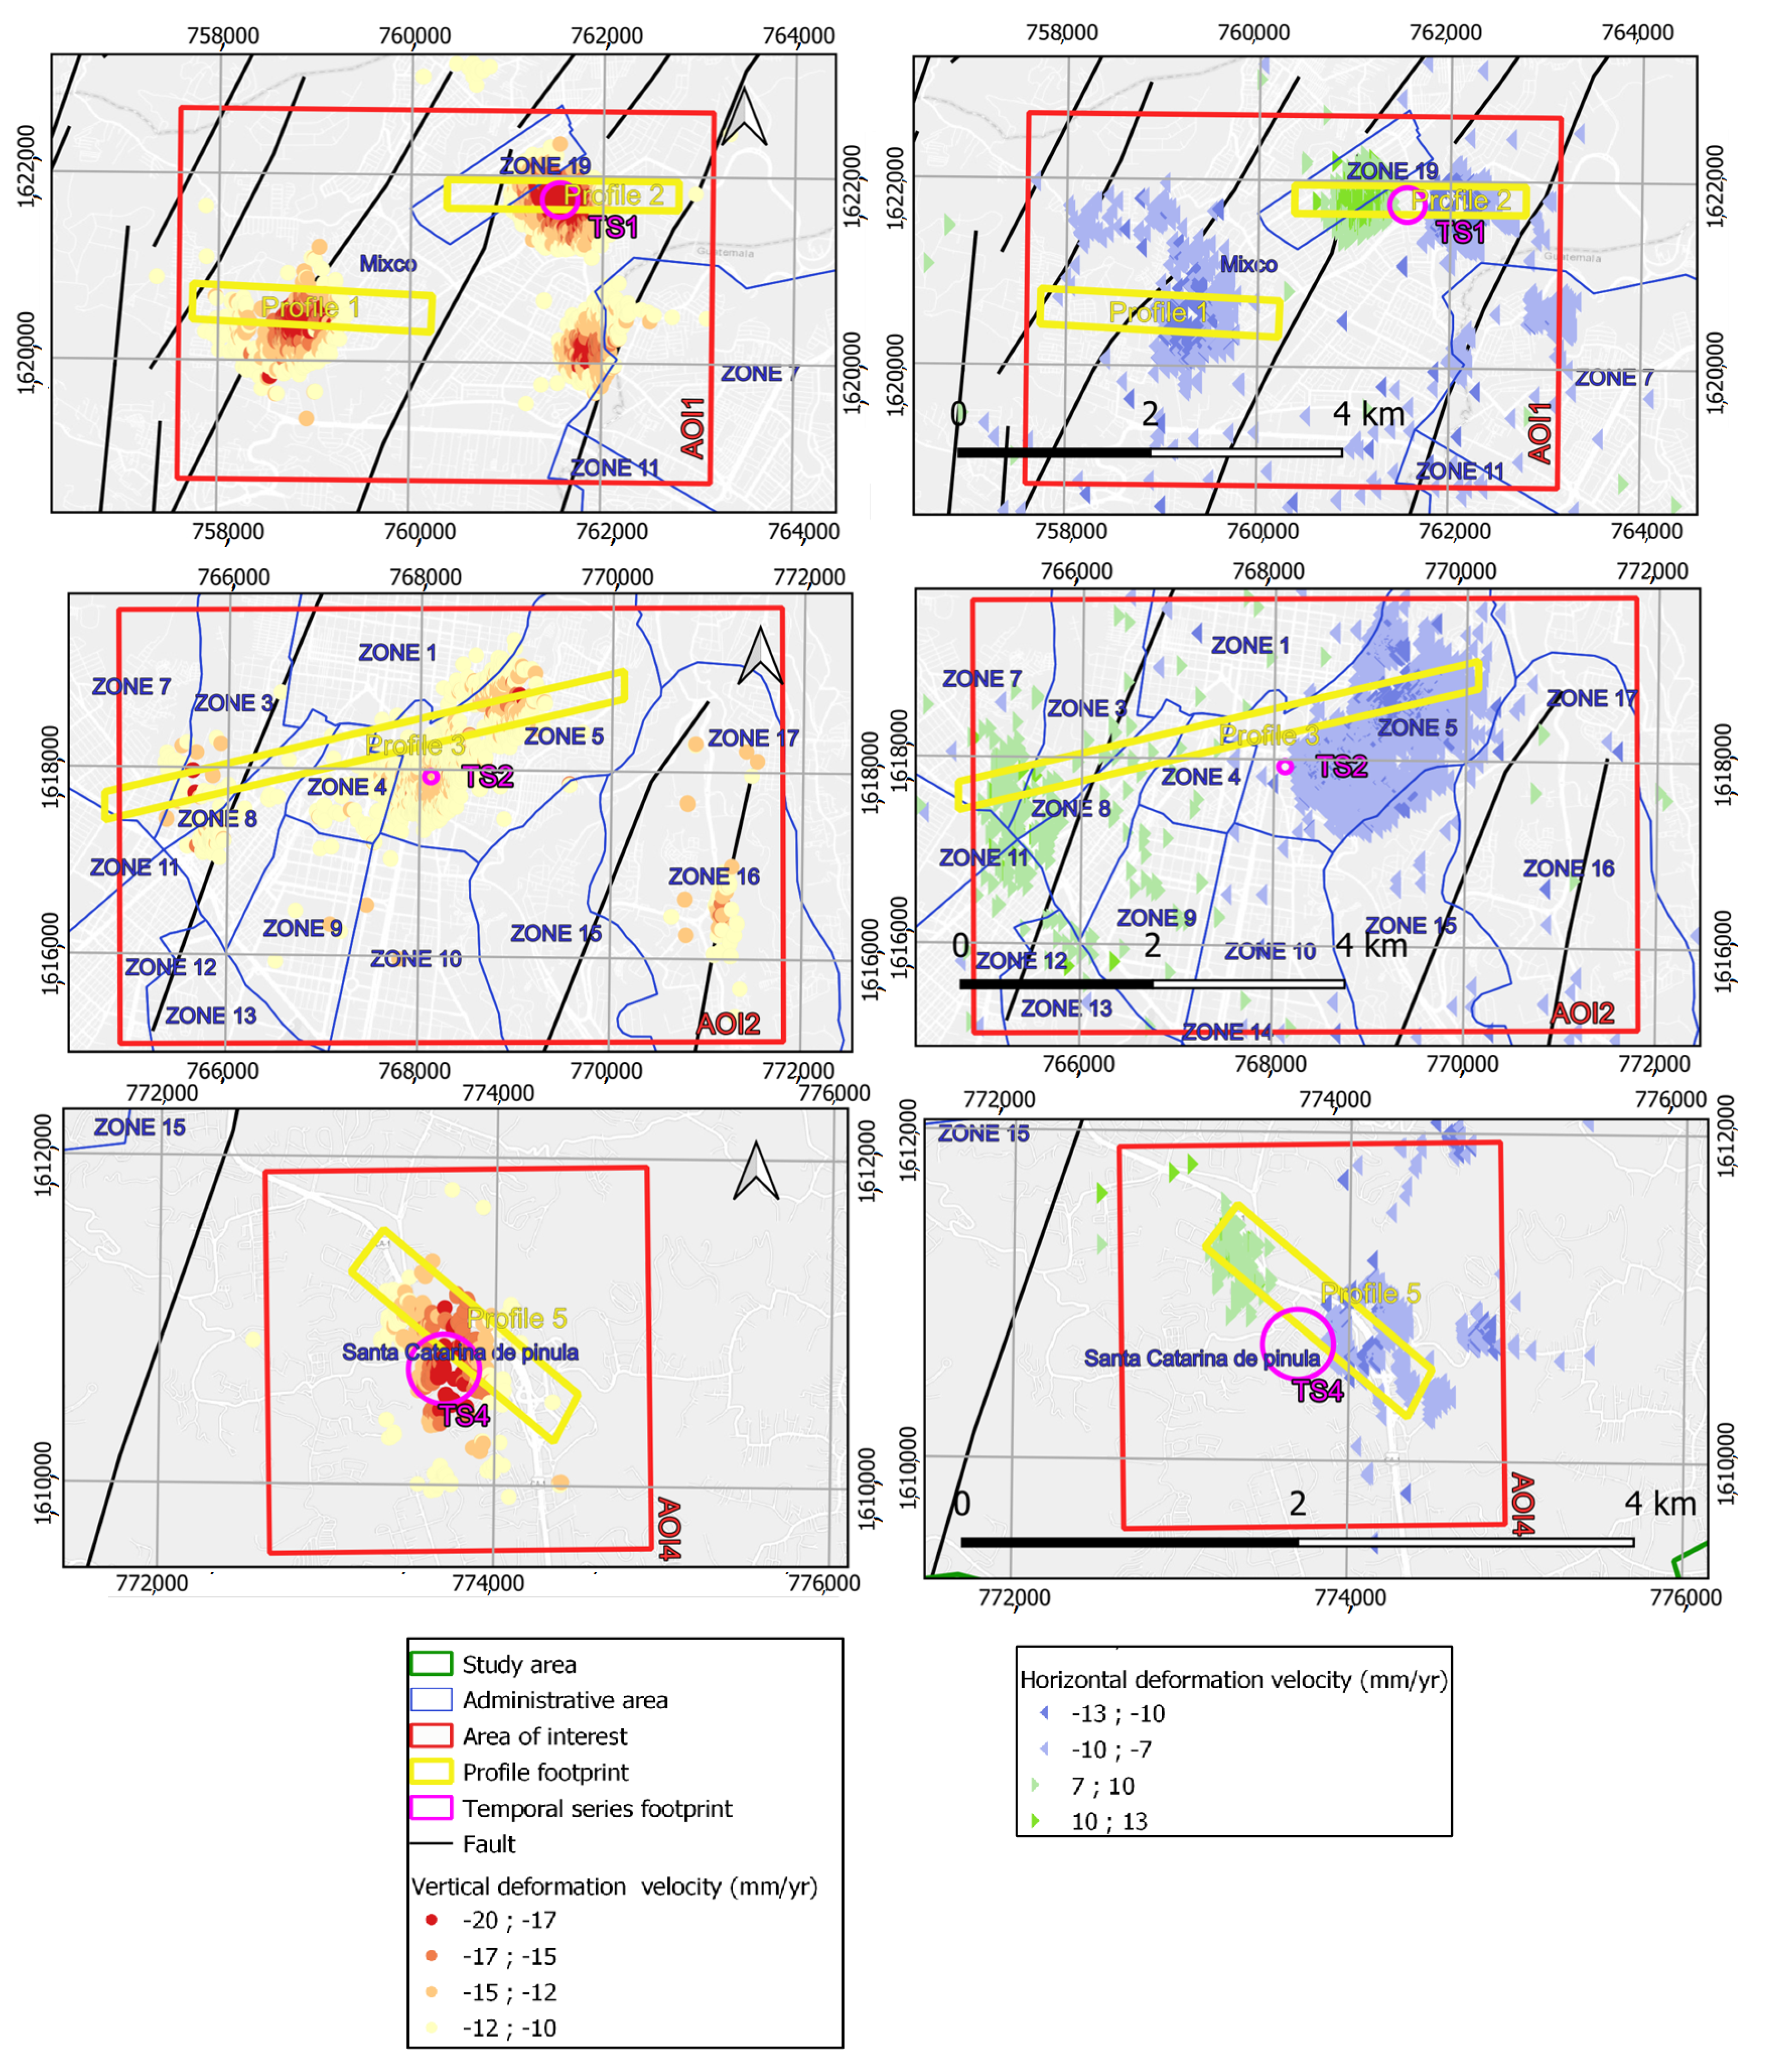
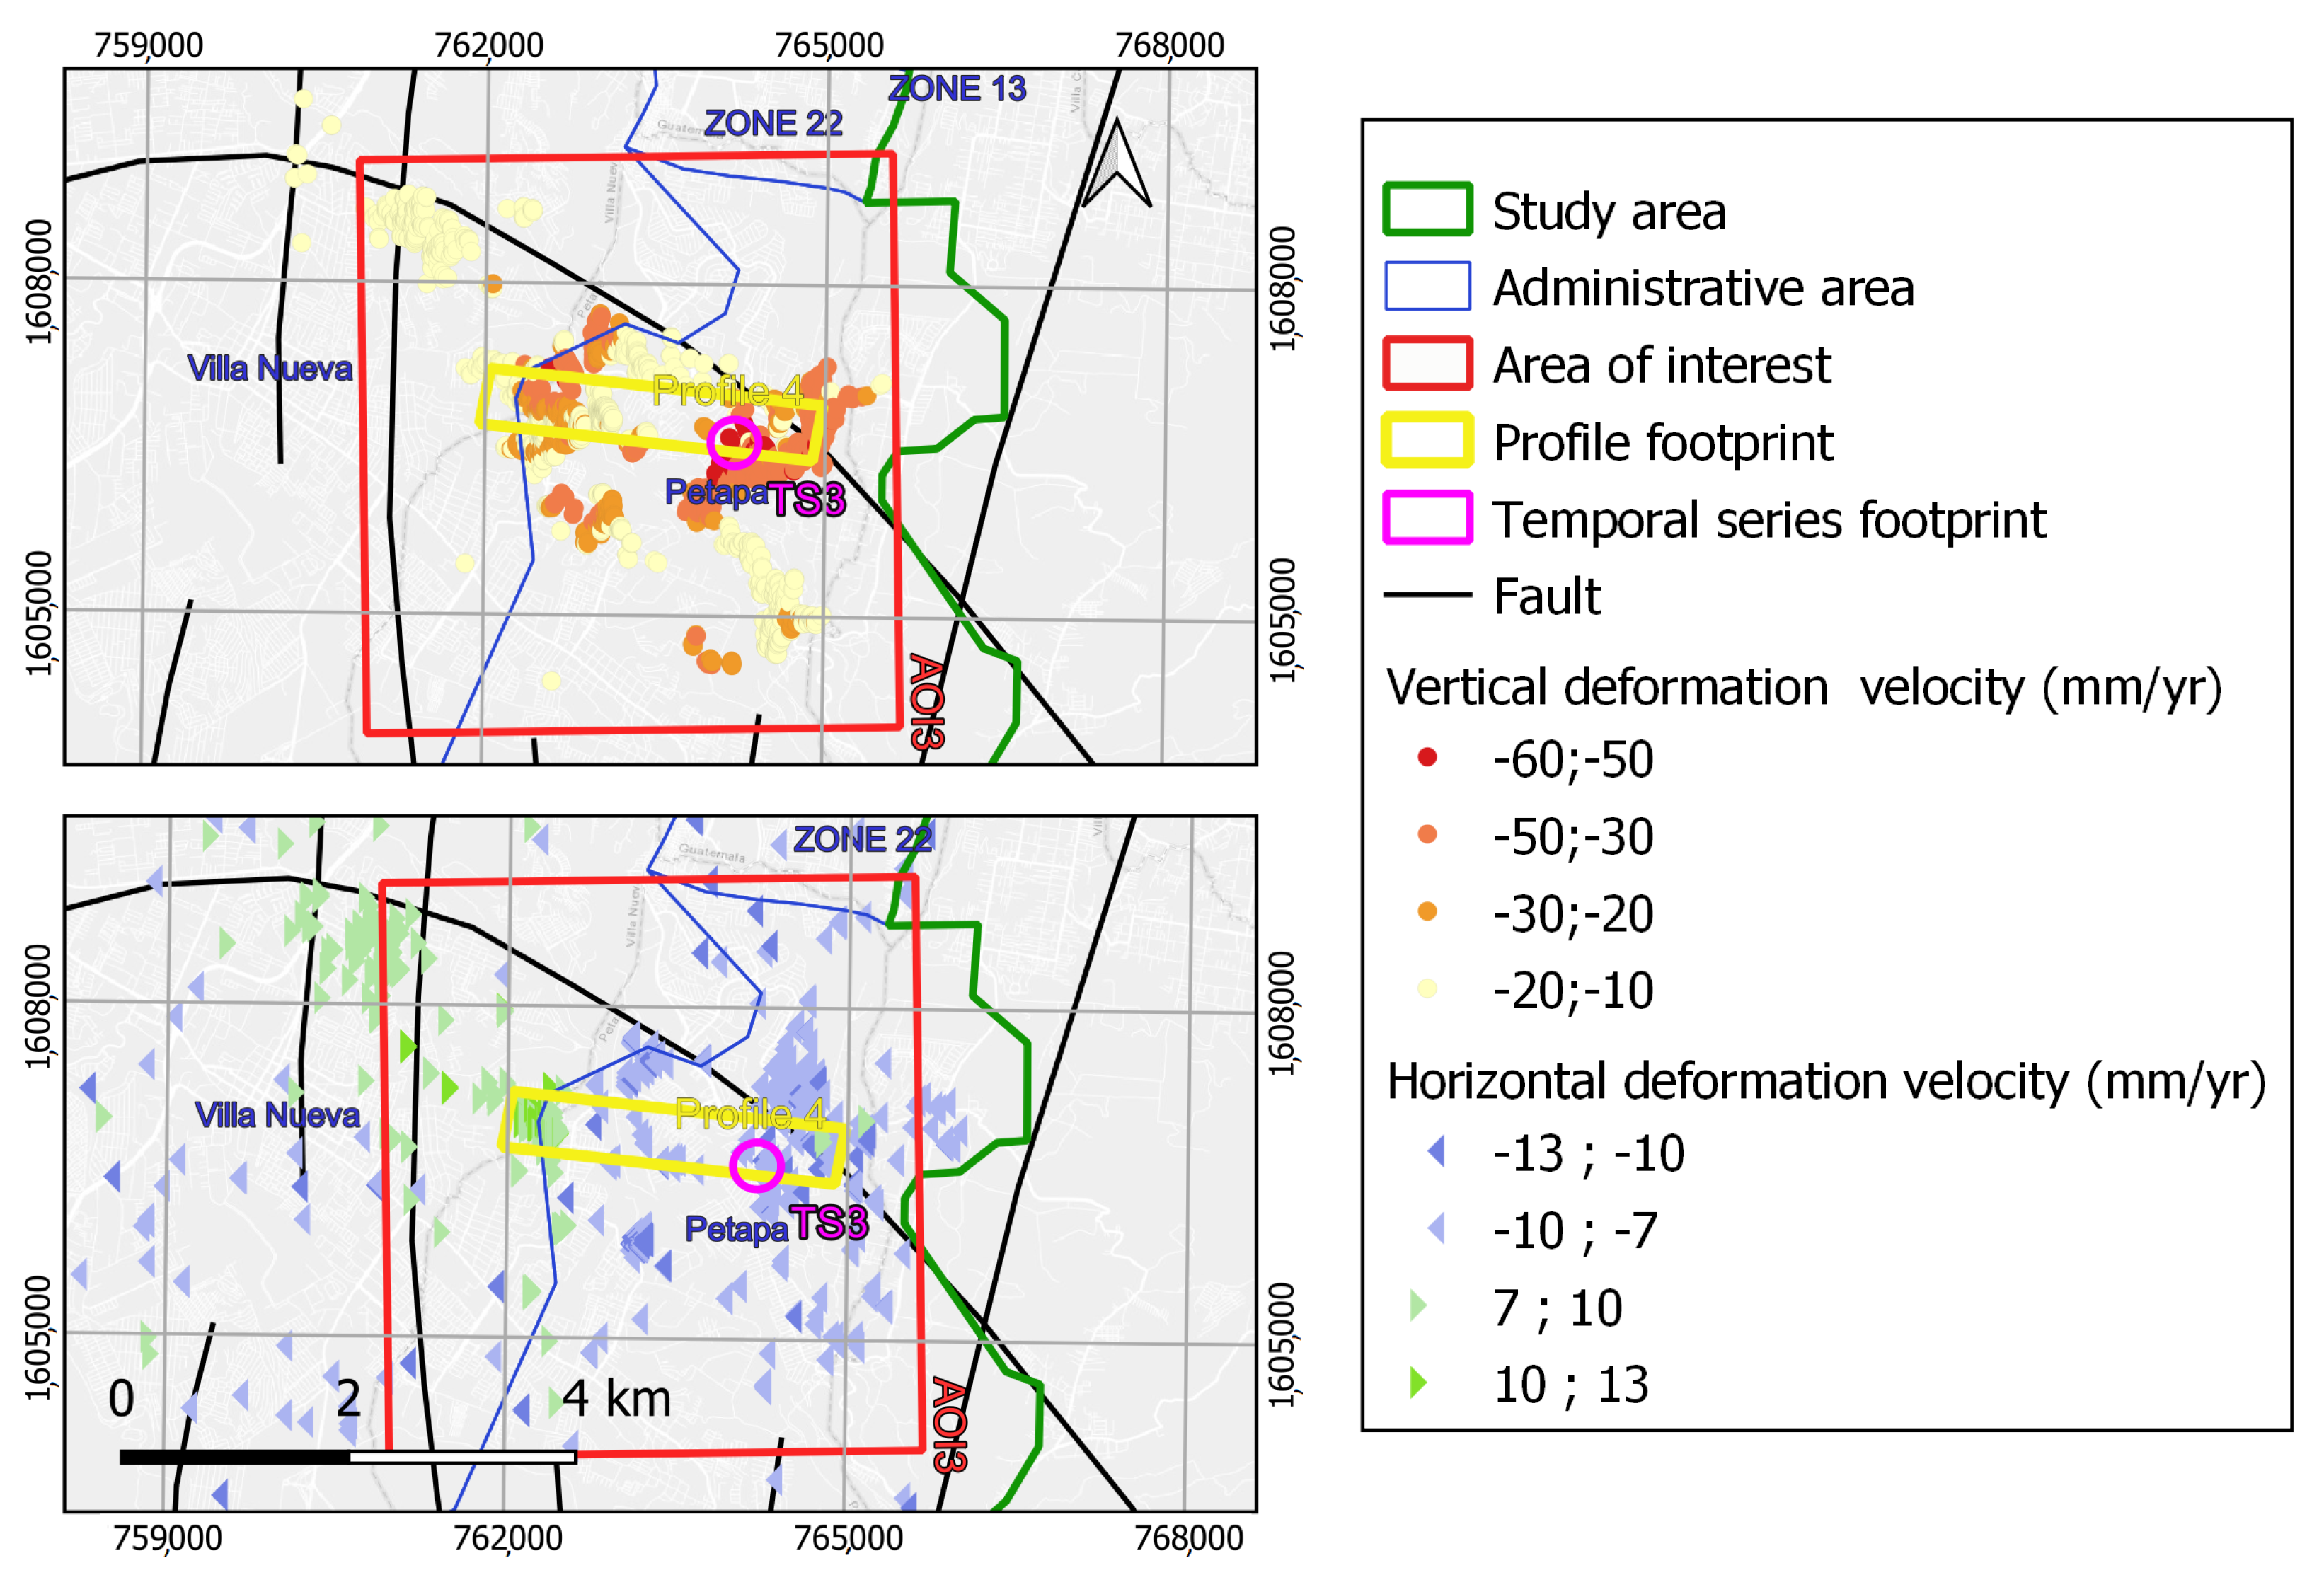
3.1. Areas of Interest: Critical Areas of Subsidence

Four different AOIs have been identified and characterized, all of them with subsidence velocities greater than 10 mm/yr on areas exceeding 50 ha (Figure 6). These areas are located within the following zones: (i) Mixco and Zone 19 (AOI 1), (ii) historical area (AOI 2), (iii) Petapa and Villanueva (AOI 3), and (iv) Santa Catarina de Pinula (AOI 4). In all these areas subsidence velocities exceed 20 mm/yr, reaching up to 6 cm/yr in Petapa/Villanueva.
The largest areas affected by subsidences over 10 mm/yr are located in AOIs 1 (Mixco/Zone 19) and 3 (Petapa/Villanueva), which reach 216 and 440 ha, respectively, representing 1% and 2%, respectively, of the total urbanized surface in the RMG.
Figure 7 (AOI 1, 2, and 4) and Figure 8 (AOI 3) present the vertical and east–west planimetry deformation patterns in the AOIs. Figure 9 presents the corresponding profiles of vertical and horizontal deformation for the selected cross sections. Subsidence bowl-like patterns, or depression cones, with a radial displacement in planimetry towards the center of maximum subsidence, were detected in AOI 1 (Mixco and Zone 19), AOI 2 (historical area), and AOI 4 (Santa Catarina de Pínula). In AOI 1, three subsidence zones were identified; the one at Zone 19 exhibits a subsidence bowl pattern, while in the Mixco subsidence area, western PSs were not obtained due to dense vegetation, hindering the confirmation of a subsidence bowl pattern. However, we observed westward movements in the eastern part of that region. The third one, located south from Zone 19, shows net subsidence.
In AOI 2, the subsidence and east–west deformations expand over the entire AOI, indicating either a wide subsidence bowl or a combination of diverse subsidence processes, as shown in the profiles in Figure 9. AOI 4 also shows a pattern compatible with a subsidence bowl or depression cone pattern. In these AOIs (1, 2, and 4), the subsidence velocities reached 20 mm/yr, while the planimetry magnitudes remained below 13 mm/yr.
The results for AOI 3 show that the deformation points are mainly located within the boundaries of the Amatitlán caldera, with a significant concentration of PSs displaying an eastward movement within the Amatitlán caldera and along the southern part of the Mixco fault system [60]. In this AOI, the planimetry magnitudes remained below 13 mm/yr, as in the other AOIs, but subsidence velocities reached up to 60 mm/yr.

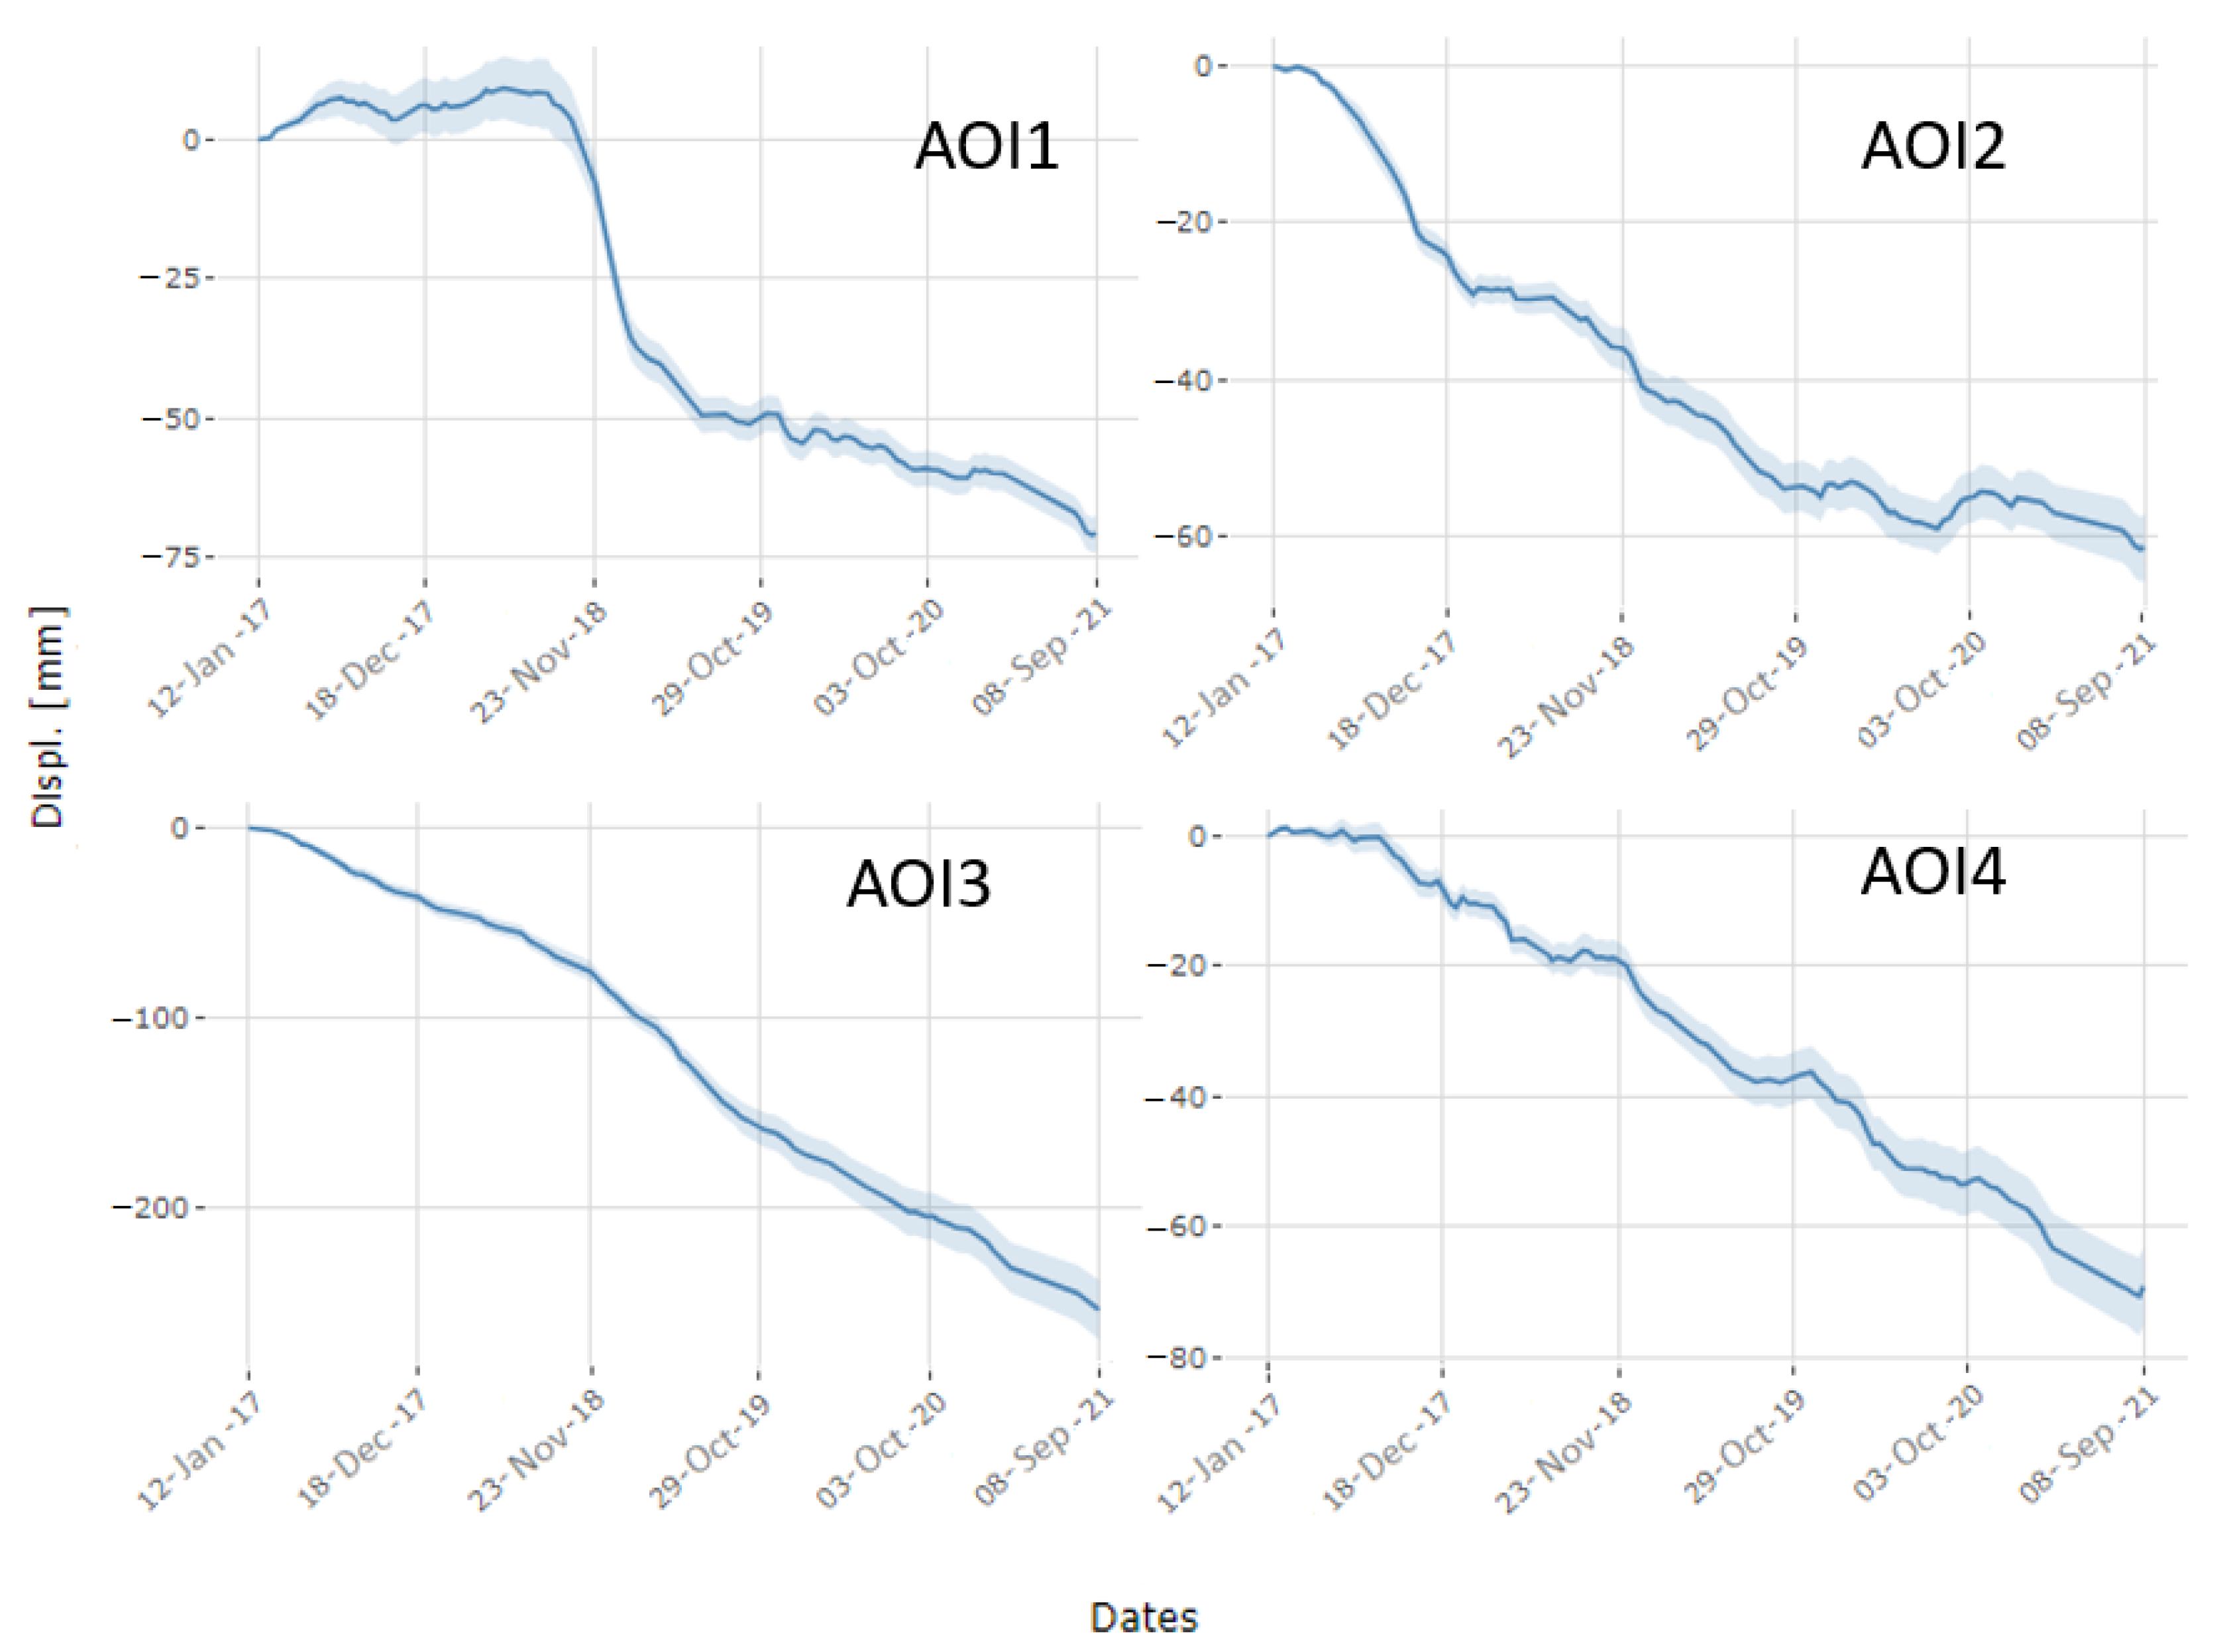
3.2. Deformation Time Series

Figure 10 shows representative deformation time series for each of the subsidence areas in the AOIs (footprints of selected areas located in Figure 7 and Figure 8. For AOI 1 (Zone 19), the time series integrates the deformation of 47 points situated at the center of the subsidence area, covering an area of 6.1 ha. The average subsidence velocity for this time series is 21.28 mm/yr. Notably, there is a sudden increase in subsidence velocity, commencing after October 2018. As for AOIs 2, 3, and 4, their respective time series exhibit average subsidence velocities of 13.4 mm/yr, 59 mm/yr, and 16.2 mm/yr. These values were calculated based on 48, 58, and 74 points located within the subsidence areas, spanning 1.4 hectares, 3.4 hectares, and 2.9 hectares, respectively.
All these time series show different trends. The time series of AOI 1 show a sudden increase in subsidence velocity starting from October 2018 to May 2019. The times series of AOI 3 show an increase in velocity from October 2018, meanwhile, the time series of AOI 2 show a slight deceleration from October 2018 and a stronger deceleration from October 2019. Subsidence velocity remains constant for the time series of AOI 4 during the entire study period.

4. Discussion

The obtained PS density is in agreement with other studies carried out in urban areas using PSI InSAR [72]. As expected, information gaps or low-PS density areas correspond to regions with vegetation or complex topography. In situations where subsidence is the predominant process, it can be postulated that the horizontal displacement is directly proportional to the first spatial derivative of the vertical deformation [66,73]. By applying this hypothesis, the horizontal displacement reaches zero in the maximum subsidence point and in the edges of the subsidence bowl-like patterns. Conversely, it attains maximum values where the first spatial derivative of vertical deformation is at its maximum, which aligns with observations made in other cases worldwide [23,44,66,74,75].
In AOIs 1, 2, and 4, we identified a pattern coherent with these subsidence bowl deformation processes, or depression cones, associated with groundwater extraction. This pattern is characterized by convergent horizontal deformations (eastward movements in the western margin and westward movements in the eastern margin) towards the areas of maximum subsidence. North–south displacements cannot be estimated due to the geometry of the image acquisition and further decomposition; therefore, the movements along the north–south axis could be in the same order of magnitude as the east–west movements, fitting the theoretical 3D cone shape. These conical strains have maximum deformation velocities in the center of the areas that taper to the edges. This phenomenon was documented by Hu (2009) [76] in the Yang-tze delta, revealing a discernible correlation between groundwater extraction and a temporal and spatial pattern of land subsidence. A previous study in Guatemala [23] confirms the patterns appreciated in the present study, compatible with depression cones caused by aquifer extraction.
Zhu et al. (2015) [44] identified an area in northern Beijing with deformations of 55 mm/yr in the vertical component, partially matching the theoretical distribution of a groundwater subsidence cone. This study attributes the irregularities to the unequal thickness of the deposits. However, groundwater volume analysis using the InSAR technique is not fully feasible without accurate knowledge of the lithology and stratigraphy of the study area [16]. Calibration data are also required for the validation of groundwater management models. The need for consistent information is one of the major challenges in hydrogeology [77].
Kim et al. (2019) conducted a previous InSAR study in a subset of the area of study in Guatemala City, for the period between late 2014 and March 2018 [23]. Comparison of the observed patterns of this previous study with those of the present study demonstrates a general agreement, considering the limited overlap of only 15 months and the different areas of analysis. The behavior of the central historical area (AOI 2) shows similar results in both studies, with a maximum subsidence deformation of 27 mm/year, consistent with our findings for the overlapping period. Similarly, east–west deformation shows similar patterns. There are other areas in [23] that do not show significant deformations in our study period (January 2017–September 2021). The first one is located in the southeastern area of administrative Zone 6 (north of AOI 2), with a measured subsidence of up to 17.5 mm/year between 2014 and 2018. However, in our longer time series (2017–2021), this area showed mean subsidences under 5 mm/year, explained by the double deceleration that the time series shows for October 2018 and October 2019 (Figure 10). There are also two subsidence areas located in administrative Zones 10 and 14 (south of AOI 2), consistent with [23]. However, our results do not show any meaningful subsidence in central administrative Zone 16 (eastern AOI 2) due to a lack of PSs.
Deformation time series for AOI 1 (Figure 10) shows a sudden increase in subsidence velocity starting from October 2018 to May 2019. This area is affected by the Mixco fault system [50,53,60]. The change in the time series coincides in time with two registered earthquakes of over 5.4 Mw reported on October 12th and 18th 2018 [78,79].
The deformation times series of AOIs 2 and 3 show trend changes after October 2018: time series of AOI 2 decelerate, meanwhile, time series in AOI 3 accelerate. It seems considerably important that one must analyze the possible effects of seismic events as a trigger of deformation dynamics. The velocity profile of AOI 2 (Figure 9) shows a subsidence bowl pattern in the first part of the profile. The distribution of the vertical deformations in the profile shows different overlapping areas of subsidence, which suggests a combination of different driving processes (water extraction, geological activity, anthropogenic works, etc.).
In AOI 3, the alluvial sector in the south of the study area presents higher values of subsidence, coinciding with an area of water extraction. The deformation pattern is intense and more uniform than in the other classes of geology. This behavior can be related to three phenomena: first, water withdrawal in Ojo de Agua, which is the group of water wells that extracts around 72% of the groundwater from the aquifers of the central valley [80,81]; second, alluvium areas happen to be prone to seismic hazards [82,83,84,85]; third, its location at the boundaries of the Amatitlán caldera and the presence of associated faults [60].
The characterization of the deformation patterns in the RMG opens up new avenues for investigating their origins and enhances urban and infrastructure management practices. Further research in this area would enable the identification and anticipation of local events, such as landslides and sinkholes, as well as the monitoring of infrastructure during construction and operation. Developing a historical database of such incidents would facilitate the application of machine learning algorithms to predict future events and plan appropriate measures to mitigate potential harm and losses.
Moreover, the integration of data from other SAR sensors (such as L-band and X-band) and combination with other InSAR algorithms [86] based on distributed scatterers would prove advantageous, particularly in regions with challenging topography or dense vegetation. L-band SAR data could improve the monitoring in vegetated areas, whereas distributed scatterer processing would provide results in the less coherent areas. Conducting small-scale investigations that incorporate physical and environmental data, along with detailed GNSS information, would further support future research efforts and enhance the validity of our findings.
As an illustrative example, we refer to a recent news report by García and Kestller in September 2022 [87], highlighting how several buildings in the municipality of Petapa have been affected. Petapa municipality reached maximum subsidence velocities exceeding 6 cm/yr in our study. This demonstrates the real-world implications and significance of studying deformation patterns for the betterment of local communities and infrastructure management.

5. Conclusions

The results of this study indicate that the application of InSAR in the Central American region can provide valuable insights into surface deformation dynamics and associated risks. InSAR also provides valuable information for urban planning and management, allowing authorities to identify areas of potential disaster and take appropriate action and/or planning measures.
This research confirms that multi-temporal InSAR PSI processing is a competent method to characterize deformation patterns in the Metropolitan Region of Guatemala (RMG). Nonetheless, the intricate topography and dense vegetation in the area posed challenges in accurately characterizing the deformation patterns. Further research is necessary to combine data from different SAR bands, such as using the vegetation penetration capabilities of L-band and combining PSI and distributed scatterer algorithms, to complete the characterization of the identified deformation patterns. Critical areas in the RMG were identified for the monitored period. The delineation was based on qualitative analysis and Jenks classifications. Future studies will focus on clustering and machine learning methods considering time series of relevant variables and time-precise variations based on registered events (such as earthquake records).
Additional research is needed to characterize some of the observed deformations, such as the subsidence bowl patterns, which are currently depicted in the literature as depression cones induced by water withdrawal processes. Furthermore, these patterns should be verified with the water extraction and precipitation data registers.
It is also recommended that we analyze the influence of tectonics and geological factors in the observed deformation patterns, excluding other driving forces, such as anthropogenic activities. The study area is traversed by dense geological structures (faults, calderas, etc.) and complex river networks, making it difficult to characterize the relationships between deformation dynamics and causative factors. In the case of tectonics, a reliable database of events and affected areas and structures is required to conduct a proper analysis. The collection and consolidation of these data is a challenge due to the lack of resources or governance structure in some countries.

Author Contributions

Conceptualization, C.G.-L., B.B. and M.M.-S.; Methodology, C.G.-L., V.K., C.S., M.M.-S. and A.F.-L.; Validation, C.G.-L., M.M.-S. and A.F.-L.; Formal analysis, C.G.-L.; Investigation, C.G.-L.; Writing—original draft, C.G.-L.; Writing—review & editing, M.M.-S., A.F.-L., C.S., V.K. and B.B.; Supervision, M.M.-S. and A.F.-L. All authors have read and agreed to the published version of the manuscript.

Funding

This research received public funds from Comunidad de Madrid, Industrial doctorates program (IND2020/TIC-17528) and the KUK-AHPAN Project, Grant RTI2018-094827- 417B-C21/C22 funded by MCIN/AEI/10.13039/501100011033 and by “ERDF A way of making Europe”.

Acknowledgments

The authors would like to acknowledge all of their colleagues involved in the KUK-AHPAN Project from Central America and Spain, specially, Carlos Gamboa, Orlando Hernandez-Rubio, Maribel Jimenez, and Omar Flores for their advice. We thank Jaime Sánchez and Álvaro Hernández from Detektia for their support in InSAR processing. The Mancomunidad Sur de Ciudad de Guatemala provided relevant reference data. The authors would also like to thank Jose Luis Armayor, Pedro Ruano, and Amanda Vazquez from the international hydrogeological team at TRAGSATEC for their support in the interpretation of the data. The first author is supported by the Industrial Doctorates of the Community of Madrid (IND2020/TIC-17528).

Conflicts of Interest

The authors declare no conflict of interest.

Abbreviations

The following abbreviations are used in this manuscript:
InSARInterferometric Synthetic Aperture Radar
PSIPersistent Scatterer Interferometry
PSPersistent Scatterer
RMGRegión Metropolitana de Guatemala
AOIArea of Interest
LOSLine Of Sight

References

  1. Fernández-Torres, E.; Cabral-Cano, E.; Solano-Rojas, D.; Havazli, E.; Salazar-Tlaczani, L. Land Subsidence risk maps and InSAR based angular distortion structural vulnerability assessment: An example in Mexico City. Proc. Int. Assoc. Hydrol. Sci. 2020, 382, 583–587. [Google Scholar] [CrossRef]
  2. Ferretti, A.; Prati, C.; Rocca, F. Permanent Scatterers in SAR Interferometry. IEEE Trans. Geosci. Remote Sens. 2001, 39, 13. [Google Scholar] [CrossRef]
  3. Gabriel, A.K.; Goldstein, R.M.; Zebker, H.A. Mapping small elevation changes over large areas: Differential radar interferometry. J. Geophys. Res. 1989, 94, 9183. [Google Scholar] [CrossRef]
  4. Cavalié, O.; Lasserre, C.; Doin, M.-P.; Peltzer, G.; Sun, J.; Xu, X.; Shen, Z.-K. Measurement of interseismic strain across the Haiyuan fault (Gansu, China), by InSAR. Earth Planet. Sci. Lett. 2008, 275, 246–257. [Google Scholar] [CrossRef]
  5. Cuervas-Mons, J.; Domínguez-Cuesta, M.J.; Redondo, F.M.; Barra, A.; Monserrat, O.; Valenzuela, P.; Jiménez-Sánchez, M. Sentinel-1 Data Processing for Detecting and Monitoring of Ground Instabilities in the Rocky Coast of Central Asturias (N Spain). Remote Sens. 2021, 13, 3076. [Google Scholar] [CrossRef]
  6. Tong, X.; Sandwell, D.T.; Smith-Konter, B. High-resolution interseismic velocity data along the San Andreas Fault from GPS and InSAR. J. Geophys. Res. Solid Earth 2013, 118, 369–389. [Google Scholar] [CrossRef]
  7. Abidin, H.Z.; Andreas, H.; Gamal, M.; Wirakusumah, A.D.; Darmawan, D.; Deguchi, T.; Maruyama, Y. Land subsidence characteristics of the Bandung Basin, Indonesia, as estimated from GPS and InSAR. J. Appl. Geod. 2008, 2, 167–177. [Google Scholar] [CrossRef]
  8. Barra, A.; Monserrat, O.; Mazzanti, P.; Esposito, C.; Crosetto, M.; Mugnozza, G.S. First insights on the potential of Sentinel-1 for landslides detection. Geomat. Nat. Hazards Risk 2016, 7, 1874–1883. [Google Scholar] [CrossRef]
  9. Cigna, F.; Bianchini, S.; Casagli, N. How to assess landslide activity and intensity with Persistent Scatterer Interferometry (PSI): The PSI-based matrix approach. Landslides 2012, 10, 267–283. [Google Scholar] [CrossRef]
  10. Koudogbo, F.N.; Duro, J.; Arnaud, A.; Bally, P.; Abidin, H.Z.; Andreas, H. Combined X- and L-Band PSI Analyses for Assessment of Land Subsidence in Jakarta; SPIE: Edinburgh, UK, 2012. [Google Scholar]
  11. Samsonov, S.; d’Oreye, N.; Smets, B. Ground deformation associated with post-mining activity at the French–German border revealed by novel InSAR time series method. Int. J. Appl. Earth Obs. Geoinf. 2013, 23, 142–154. [Google Scholar] [CrossRef]
  12. Zheng, M.; Deng, K.; Fan, H.; Du, S. Monitoring and Analysis of Surface Deformation in Mining Area Based on InSAR and GRACE. Remote Sens. 2018, 10, 1392. [Google Scholar] [CrossRef]
  13. Abidin, H.Z.; Andreas, H.; Gumilar, I.; Gamal, M.; Fukuda, Y.; Deguchi, T. Land Subsidence and Urban Development in Jakarta (Indonesia). In Proceedings of the Regional Conference of Spatial Data Serving People: Land Governance and the Environment, Hanoi, Vietnam, 19–22 October 2009; Available online: https://www.researchgate.net/publication/237757739_Land_Subsidence_and_Urban_Development_in_Jakarta_Indonesia (accessed on 27 October 2022).
  14. Chatterjee, R.; Fruneau, B.; Rudant, J.; Roy, P.; Frison, P.-L.; Lakhera, R.; Dadhwal, V.; Saha, R. Subsidence of Kolkata (Calcutta) City, India during the 1990s as observed from space by Differential Synthetic Aperture Radar Interferometry (D-InSAR) technique. Remote Environ. 2006, 102, 176–185. [Google Scholar] [CrossRef]
  15. Abidin, H.Z.; Andreas, H.; Gumilar, I.; Fukuda, Y.; Pohan, Y.E.; Deguchi, T. Land subsidence of Jakarta (Indonesia) and its relation with urban development. Nat. Hazards 2011, 59, 1753–1771. [Google Scholar] [CrossRef]
  16. Ezquerro, P.; Del Soldato, M.; Solari, L.; Tomás, R.; Raspini, F.; Ceccatelli, M.; Fernández-Merodo, J.; Casagli, N.; Herrera, G. Vulnerability Assessment of Buildings due to Land Subsidence Using InSAR Data in the Ancient Historical City of Pistoia (Italy). Sensors 2020, 20, 2749. [Google Scholar] [CrossRef]
  17. Marfai, M.A.; King, L. Monitoring land subsidence in Semarang, Indonesia. Environ. Geol. 2007, 53, 651–659. [Google Scholar] [CrossRef]
  18. Phien-wej, N.; Giao, P.; Nutalaya, P. Land subsidence in Bangkok, Thailand. Eng. Geol. 2006, 82, 187–201. [Google Scholar] [CrossRef]
  19. Pratesi, F.; Tapete, D.; Terenzi, G.; Del Ventisette, C.; Moretti, S. Rating health and stability of engineering structures via classification indexes of InSAR Persistent Scatterers. Int. J. Appl. Earth Obs. Geoinf. 2015, 40, 81–90. [Google Scholar] [CrossRef]
  20. Strozzi, T.; Wegmuller, U. Land subsidence in Mexico City mapped by ERS differential SAR interferometry. In Proceedings of the IEEE 1999 International Geoscience and Remote Sensing Symposium, Hamburg, Germany, 28 June–2 July 1999; IEEE: New York, NY, USA, 1999; Volume 4, pp. 1940–1942. [Google Scholar] [CrossRef]
  21. García, A.J.; Marchamalo, M.; Martínez, R.; González-Rodrigo, B.; González, C. Integrating geotechnical and SAR data for the monitoring of underground works in the Madrid urban area: Application of the Persistent Scatterer Interferometry technique. Int. J. Appl. Earth Obs. Geoinf. 2019, 74, 27–36. [Google Scholar] [CrossRef]
  22. Hussain, M.A.; Chen, Z.; Zheng, Y.; Shoaib, M.; Ma, J.; Ahmad, I.; Asghar, A.; Khan, J. PS-InSAR Based Monitoring of Land Subsidence by Groundwater Extraction for Lahore Metropolitan City, Pakistan. Remote Sens. 2022, 14, 3950. [Google Scholar] [CrossRef]
  23. Kim, Y.C.; Kim, D.J.; Jung, J. Monitoring Land Subsidence in Guatemala City Using Time-Series Interferometry. In Proceedings of the IGARSS 2019 IEEE International Geoscience and Remote Sensing Symposium, Yokohama, Japan, 28 July–2 August 2019; IEEE: New York, NY, USA, 2019; pp. 2099–2102. [Google Scholar] [CrossRef]
  24. Martín, P.E. Estudio de la Subsidencia del Terreno Producida por la Explotación de Acuíferos Mediante Datos de Interferometría Radar Satélite. Ph.D. Thesis, Universidad Politécnica de Madrid, Madrid, Spain, 2021. [Google Scholar] [CrossRef]
  25. Béjar-Pizarro, M.; Ezquerro, P.; Herrera, G.; Tomás, R.; Guardiola-Albert, C.; Hernández, J.M.R.; Merodo, J.A.F.; Marchamalo, M.; Martínez, R. Mapping groundwater level and aquifer storage variations from InSAR measurements in the Madrid aquifer, Central Spain. J. Hydrol. 2017, 547, 678–689. [Google Scholar] [CrossRef]
  26. Abidin, H.Z.; Andreas, H.; Gamal, M.; Djaja, R.; Subarya, C.; Hirose, K.; Maruyama, Y.; Murdohardono, D.; Rajiyowiryono, H. Monitoring Land Subsidence of Jakarta (Indonesia) Using Leveling, GPS Survey and InSAR Techniques. In A Window on the 155 Future of Geodesy; Sansò, F., Ed.; International Association of Geodesy Symposia; Springer: Berlin/Heidelberg, Germany, 2005; Volume 128, pp. 561–566. [Google Scholar]
  27. Crosetto, M.; Monserrat, O.; Cuevas-González, M.; Devanthéry, N.; Crippa, B. Persistent Scatterer Interferometry: A review. ISPRS J. Photogramm. Remote Sens. 2016, 115, 78–89. [Google Scholar] [CrossRef]
  28. Pritchard, M.E.; Biggs, J.; Wauthier, C.; Sansosti, E.; Arnold, D.W.D.; Delgado, F.; Ebmeier, S.K.; Henderson, S.T.; Stephens, K.; Cooper, C.; et al. Towards coordinated regional multi-satellite InSAR volcano observations: Results from the Latin America pilot project. J. Appl. Volcanol. 2018, 7, 5. [Google Scholar] [CrossRef]
  29. Wnuk, K.; Wauthier, C. Surface deformation induced by magmatic processes at Pacaya Volcano, Guatemala revealed by InSAR. J. Volcanol. Geotherm. Res. 2017, 344, 197–211. [Google Scholar] [CrossRef]
  30. Cosenza-Muralles, A.B.; Lasserre, C.; DeMets, C.; De Zan, F.; Shau, R.; Ansari, H.; Lyon-Caen, H.; Feigl, K.; Parizzi, A. Large Scale Observations and Modeling of Strain Partitioning in Guatemala from SAR Interferometry. Geodesy 2022, preprint. [Google Scholar] [CrossRef]
  31. Hussain, M.A.; Chen, Z.; Shoaib, M.; Shah, S.U.; Khan, J.; Ying, Z. Sentinel-1A for monitoring land subsidence of coastal city of Pakistan using Persistent Scatterers In-SAR technique. Sci. Rep. 2022, 12, 5294. [Google Scholar] [CrossRef]
  32. Benito, M.B.; Lindholm, C.; Camacho, E.; Climent, A.; Marroquin, G.; Molina, E.; Rojas, W.; Escobar, J.J.; Talavera, E.; Alvarado, G.E.; et al. A New Evaluation of Seismic Hazard for the Central America Region. Bull. Seismol. Soc. Am. 2012, 102, 504–523. [Google Scholar] [CrossRef]
  33. UNDRR. Transformar Nuestro Mundo: La Agenda 2030 para el Desarrollo Sostenible; Naciones Unidas: Geneva, Switzerland, 2015.
  34. UNISDR. Sendai Framework for Disaster Risk Reduction 2015–2030; Naciones Unidas: Geneva, Switzerland, 2022.
  35. United Nations. Directrices para la Prevención de los Desastres Naturales, la Preparación para Casos de Desastre y la Mitigación de sus Efectos. In Informe de la Conferencia Mundial sobre la Reducción de Riesgos Naturales; United Nations: Yokohama, Japan, 1994; p. 17. [Google Scholar]
  36. Marshall, J.S. The Geomorphology and Physiographic Provinces of Central America. In Central Americal: Geology, Resources and Hazards; Bundschuh, J., Alvarado, G.E., Eds.; Chapter 3—The Geomorphology and Physiographic Provinces of Central America in Central A; Taylor & Francis Group: Abingdon, UK, 2007; p. 1974. [Google Scholar]
  37. Bommer, J.; Rodríguez, C. Earthquake induced landslides in Central America. Eng. Geol. 2002, 63, 189–220. [Google Scholar] [CrossRef]
  38. Instituto Nacional de Estadística Guatemala. XII Censo Nacional de Población y VII de Vivienda; Instituto Nacional de Estadística Guatemala: Ciudad de Guatemala, Guatemala, 2019. [Google Scholar]
  39. UNISDR. Reducción del Riesgo de Desastres: Un Instrumento para Alcanzar los Objetivos de Desarrollo del Milenio; Union Interparlamentaria, Ed.; Unión Interparlamentaria: Ginebra, Switzerland, 2010. [Google Scholar]
  40. Chaussard, E.; Bürgmann, R.; Shirzaei, M.; Fielding, E.J.; Baker, B. Predictability of hydraulic head changes and characterization of aquifer-system and fault properties from InSAR-derived ground deformation. JGR Solid Earth 2014, 119, 6572–6590. [Google Scholar] [CrossRef]
  41. Chaussard, E.; Milillo, P.; Bürgmann, R.; Perissin, D.; Fielding, E.J.; Baker, B. Remote Sensing of Ground Deformation for Monitoring Groundwater Management Practices: Application to the Santa Clara Valley During the 2012–2015 California Drought. J. Geophys. Res. Solid Earth 2017, 122, 8566–8582. [Google Scholar] [CrossRef]
  42. Engi, D. Subsidence Due to Fluis Withdrawal: A Survey of Analytical Capabilities; Sandia National Laboratories: Albuquerque, NM, USA, 1985. [Google Scholar]
  43. Normand, J.C.L.; Heggy, E. InSAR Assessment of Surface Deformations in Urban Coastal Terrains Associated with Groundwater Dynamics. IEEE Trans. Geosci. Remote 2015, 53, 6356–6371. [Google Scholar] [CrossRef]
  44. Zhu, L.; Gong, H.; Li, X.; Wang, R.; Chen, B.; Dai, Z.; Teatini, P. Land subsidence due to groundwater withdrawal in the northern Beijing plain, China. Eng. Geol. 2015, 193, 243–255. [Google Scholar] [CrossRef]
  45. Herrera Ibáñez, I.R.; Brown Manrique, O. Propuesta de una metodología para la estimación de áreas de recarga hídrica en Guatemala. Rev. Cienc. Tècn. Agr. 2011, 20. [Google Scholar]
  46. Herrera Ibáñez, I.R. Sobreextracción de las Aguas Subterráneas en la Cuenca Norte de la Ciudad de Guatemala. In Revista Científica de la Facultad de Agronomía Universidad de San Carlos de Guatemala; Facultad de Agronomía Universidad de San Carlos de Guatemala: Ciudad de Guatemala, Guatemala, 2018; Available online: http://cete.fausac.gt/wp-content/uploads/2018/10/TIKALIA-2-2018.pdf (accessed on 4 October 2022).
  47. Morales, J.I. Evaluación del Descenso del Nivel Freático en la Parte Norte del Acuífero Motropolitano en el Valle de Guatemala. Ph.D. Thesis, San Carlos de Guatemala, Ciudad de Guatemala, Guatemala, 2012. Available online: https://revistas.usac.edu.gt/index.php/asa/article/view/1487 (accessed on 31 January 2023).
  48. Recinos, I.N.; Paiz, L.V.; Fallas, W.; Cabrera, L.E.B. Análisis Piezométricos de Pozos de Agua para los Municipios de la Mancomunidad Gran Ciudad del Sur: Amatitlán, Mixco, San Miguel Petapa, Santa Catarina Pinula, Villa Canales y Villa Nueva, Guatemala; Fundación para la Conservación del Agua en la Región Metropolitana de Guatemala: Ciudad de Guatemala, Guatemala, 2019. [Google Scholar]
  49. Lang, D.H.; Sergio, M.; Crempien, J.; Erduran, E. Reducción de Resgo Sísmico en Guatemala, El Salvador y Nicaragua con Cooperación Regional a Honduras, Cota Rica y Panamá. 2009. Available online: https://blogs.upm.es/geoalerta/otros-paises/proyecto-resis-ii-reduccion-del-riesgo-sismico-en-guatemala-el-salvador-y-nicaragua-con-cooperacion-regional-a-honduras-costa-rica-y-panama/ (accessed on 31 January 2023).
  50. Pérez, C.L. Estructura geológica del Valle de la Ciudad de Guatemala interpretada mediante un modelo de cuenca por distensión. Rev. Geo. Am. Cent. 2009, 41. [Google Scholar] [CrossRef]
  51. Hermosilla, R.G. The Guatemala City sinkhole collapses. Carbonates Evap. 2012, 27, 103–107. [Google Scholar] [CrossRef]
  52. Domínguez, A.; Vega, J.M. Hundimientos en Guatemala: Dónde Están y cómo Son los que han Aparecido en los Úlitmos Meses. Prensa Libre. Available online: https://www.prensalibre.com/guatemala/comunitario/interactivo-hundimientos-en-guatemala-donde-estan-y-como-son-los-que-han-aparecido-en-los-ultimos-meses/ (accessed on 18 December 2021).
  53. Guzmán Ramírez, E. Estudio Geológico-Geotécnico de la Susceptibilidad de Deslizamientos en la Colonia El Carmen Zona 12 de la Ciudad de Guatemala. Diploma Thesis, San Carlos de Gautemala, Ciudad de Guatemala, Guatemala, 2002. [Google Scholar]
  54. Brown, R.; Lamarre, A.; Lamarre, T.; Loucks, T. Mapa geológico de Guatemala, Escala 1:50,000. Hoja San José Pinula 2159:IV 1980, 3, 2159. [Google Scholar]
  55. Koch, A.; McLean, H. Mapa geológico de Guatemala, Escala 1:50,000. Hoja San Juan Sacatepéquez 2060 II 1981, 2, 2060. [Google Scholar]
  56. Ritchie, A. Mapa geológico de Guatemala, Scale 1:50,000. Hoja Ciudad. de Guatem. 2059 I 1977, 3, 2160. [Google Scholar]
  57. Vaides del Valle, V. Mapa geológico de Guatemala, Scale 1:50,000. Hoja San Pedro Ayampuc 2160 III 1973, 1, 2059. [Google Scholar]
  58. Weyl, R. Geology of Central America. In Beiträge zur Regionalen Geologie der Erde, 2nd ed.; Gebr. Borntraeger: Berlin, Germany, 1980. [Google Scholar]
  59. Benito Oterino, B.; Torres Fernández, Y. Amenaza Sísmica en América Central; OCLC: 733885452; Entimema: Madrid, Spain, 2009. [Google Scholar]
  60. Bohnenberger, O. REvisión del Sistema de Fallas en la Región Metropolitana de Guatemala. 1996. Available online: http://cidbimena.desastres.hn/pdf/spa/doc7548/doc7548.htm (accessed on 8 June 2022).
  61. Foumelis, M.; Blasco, J.M.D.; Desnos, Y.-L.; Engdahl, M.; Fernandez, D.; Veci, L.; Lu, J.; Wong, C. Esa Snap—Stamps Integrated Processing for Sentinel-1 Persistent Scatterer Interferometry. In Proceedings of the IGARSS 2018 IEEE International Geoscience and Remote Sensing Symposium, Valencia, Spain, 22–27 July 2018; IEEE: New York, NY, USA, 2018; pp. 1364–1367. [Google Scholar] [CrossRef]
  62. Balbi, E.; Terrone, M.; Faccini, F.; Scafidi, D.; Barani, S.; Tosi, S.; Crispini, L.; Cianfarra, P.; Poggi, F.; Ferretti, G. Persistent Scatterer Interferometry and Statistical Analysis of Time-Series for Landslide Monitoring: Application to Santo Stefano d’Aveto (Liguria, NW Italy). Remote Sens. 2021, 13, 3348. [Google Scholar] [CrossRef]
  63. Blewitt, G.; Hammond, W.; Kreemer, C. Harnessing the GPS Data Explosion for Interdisciplinary Science. Eos. 2018. Available online: https://eos.org/project-updates/harnessing-the-gps-data-explosion-for-interdisciplinary-science (accessed on 31 January 2022).
  64. Blasco, J.D.; Foumelis, M.; Stewart, C.; Hooper, A. Measuring Urban Subsidence in the Rome Metropolitan Area (Italy) with Sentinel-1 SNAP-StaMPS Persistent Scatterer Interferometry. Remote Sens. 2019, 11, 129. [Google Scholar] [CrossRef]
  65. Ruiz-Armenteros, A.M.; Marchamalo-Sacristán, M.; Lamas-Fernández, F.; Cabezudo, H.; Delgado-Blasco, J.M.; Bakon, M.; Lazecky, M.; Perissin, D.; Papco, J.; Mesa-Mingorance, J.L.; et al. Utilizing the Land Monitoring Copernicus Program as a Regular Method for Observing Dams, Large Ponds and Surrounding Areas; IEEE: Pasadena, CA, USA, 2023. [Google Scholar]
  66. Samieie-Esfahany, S.; Hanssen, R.F.; van Thienen-Visser, K.; Muntendam-Bos, A. On the effect of horizontal deformation on InSAR subsidence estimates. In Proceedings of the Fringe 2009 Workshop, Frascati, Italy, 30 November–4 December 2009; SP-677. ESA: Paris, France, 2009; p. 7. [Google Scholar]
  67. Jenks, G.F.; Caspall, F.C. Error on choroplethic maps: Definition, measurement, reduction. Ann. Assoc. Am. Geogr. 1971, 61, 217–244. [Google Scholar] [CrossRef]
  68. Jenks, G.F. Geographic Logic in Line Generalization. Cartogr. Int. J. Geogr. Inf. Geovis. 1989, 26, 27–42. [Google Scholar] [CrossRef]
  69. Oliver, M.A.; Webster, R. Kriging: A method of interpolation for geographical information systems. Int. J. Geogr. Syst. 1990, 4, 313–332. [Google Scholar] [CrossRef]
  70. Pesaresi, P.; Politis, P. GHS-BUILT-C R2022A—GHS Settlement Characteristics; European Commission, Joint Research Centre (JRC): Brussels, Belgium, 2022. [Google Scholar]
  71. Japan Aerospace Exploration Agency. JAXA7 METI ALOS PALSAR L1.0. 2023. Available online: https://asf.alaska.edu/data-sets/ (accessed on 22 April 2022).
  72. Sadeghi, Z.; Wright, T.; Hooper, A.; Jordan, C.; Novellino, A.; Bateson, L.; Biggs, J. Benchmarking and inter-comparison of Sentinel-1 InSAR velocities and time series. Remote Sens. Environ. 2021, 256, 112306. [Google Scholar] [CrossRef]
  73. Kratzsch, H. Mining Subsidence Engineering; Springer: Berlin/Heidelberg, Germany, 1983. [Google Scholar]
  74. Cigna, F.; Tapete, D. Present-day land subsidence rates, surface faulting hazard and risk in Mexico City with 2014–2020 Sentinel-1 IW InSAR. Remote Sens. Environ. 2021, 253, 112161. [Google Scholar] [CrossRef]
  75. Cigna, F.; Tapete, D. Urban growth and land subsidence: Multi-decadal investigation using human settlement data and satellite InSAR in Morelia, Mexico. Sci. Total Environ. 2022, 811, 152211. [Google Scholar] [CrossRef] [PubMed]
  76. Hu, J.; Shi, B.; Inyang, H.I.; Chen, J.; Sui, Z. Patterns of subsidence in the lower Yangtze Delta of China: The case of the Suzhou-Wuxi-Changzhou Region. Environ. Monit. Assess. 2009, 153, 61–72. [Google Scholar] [CrossRef]
  77. Castellazzi, P.; Arroyo-Domínguez, N.; Martel, R.; Calderhead, A.I.; Normand, J.C.; Gárfias, J.; Rivera, A. Land subsidence in major cities of Central Mexico: Interpreting InSAR-derived land subsidence mapping with hydrogeological data. Int. J. Appl. Earth Obs. Geoinf. 2016, 47, 102–111. [Google Scholar] [CrossRef]
  78. United States Geological Survey. Seismic Event: 11 km E of Nueva Concepción, Guatemala. 2018. Available online: https://earthquake.usgs.gov/earthquakes/eventpage/us1000hbcu/executive (accessed on 1 February 2023).
  79. United States Geological Survey. Seismic Event: 12 km SW of Guanagazapa, Guatemala. 2018. Available online: https://earthquake.usgs.gov/earthquakes/eventpage/us1000eu39/executive (accessed on 1 February 2023).
  80. Velásquez, E. Estudio Hidrogeológico de los Acuíferos Aluviales del Río Villalobos; EMPAGUA: Ciudad de Guatemala, Guatemala, 2018. [Google Scholar]
  81. Herrera, I.R.; Orozco, E.O. Hidrogeología de Ojo de Agua, Cuenca Sur de la Ciudad de Guatemala. Rev. Geo. Am. Cent. 2010, 42, 85–97. [Google Scholar] [CrossRef]
  82. Eckis, R. Alluvial Fans of the Cucamonga District, Southern California. J. Geol. 1928, 36, 224–247. [Google Scholar] [CrossRef]
  83. Sharp, R.P.; Nobles, L.H. Mudflow of 1941 at Wrightwood, Southern California. Geol. Soc. Am. Bull. 1953, 64, 547–560. [Google Scholar] [CrossRef]
  84. Blissenbach, E. Relation of Surface Angle Distribution to Particle Size Distribution on Alluvial Fans. J. Sediment. Res. 1952, 22, 25–28. [Google Scholar] [CrossRef]
  85. Davis, W.M. The Basin Range Problem. Proc. Natl. Acad. Sci. USA 1925, 11, 387–392. [Google Scholar] [CrossRef] [PubMed]
  86. Berardino, P.; Fornaro, G.; Lanari, R.; Sansosti, E. A new algorithm for surface deformation monitoring based on small baseline differential SAR interferograms. IEEE Trans. Geosci. Remote Sens. 2002, 40, 2375–2383. [Google Scholar] [CrossRef]
  87. García; Kestller, C. Vecinos de la Zona 7 de San Miguel Petapa Alertan sobre Formación de Grietas en Casas y Calles. Noticias Nacionales en Guatevisión. 2022. Available online: https://www.guatevision.com/nacionales/vecinos-de-la-zona-7-de-san-miguel-petapa-alertan-sobre-formacion-de-grietas-en-casas-y-calles-breaking (accessed on 11 July 2023).
Figure 1. Geomorphology, hydrology, and geology of the Metropolitan Region of Guatemala. Projected coordinate system WGS84 UTM zone 15N.
Remotesensing 15 04207 g001
Figure 2. Study area and footprints of ascending and descending images. Projected coordinate system WGS84 UTM zone 15N.
Remotesensing 15 04207 g002
Figure 3. Decomposition of the vertical and horizontal (east–west) components of deformation.
Remotesensing 15 04207 g003
Figure 4. General map of the vertical deformation velocities for the study area. AOIs are located across five municipalities (Ciudad de Guatemala, Santa Catarina de Pinula, Villanueva, Mixco, and Petapa), demarcated by black lines, and Ciudad de Guatemala is further divided into 22 administrative zones, represented by blue lines. The projected coordinate system used for the map is WGS84 UTM zone 15N.
Remotesensing 15 04207 g004
Figure 5. Boxplots for PS subsidence velocity and the geology class.
Remotesensing 15 04207 g005
Figure 6. Administrative areas, geological structures, and critical areas of subsidence (AOIs) in the Metropolitan Region of Guatemala. Projected coordinate system WGS84 UTM zone 15N.
Remotesensing 15 04207 g006
Figure 7. Deformation patterns for AOIs 1, 2, and 4 showing vertical (left, red–yellow) and horizontal (right, blue–green) deformations over 10 mm/yr and 7mm/yr, respectively. Yellow rectangles indicate the location of the velocity profiles and pink circles show the location of the selected PS time series for each Area of Interest. Black lines indicate geological features. Projected coordinate system WGS84 UTM zone 15N.
Remotesensing 15 04207 g007
Figure 8. Deformationpatterns for AOI 3 (top, red–yellow) and horizontal (bottom, blue–green) deformations over 10 mm/yr and 7mm/yr, respectively. Yellow rectangles indicate the location of the velocity profiles and pink circles show the location of the selected PS time series for each Area of Interest. Black lines indicate geological features. Projected coordinate system WGS84 UTM zone 15N.
Remotesensing 15 04207 g008
Figure 9. Longitudinal profiles of horizontal and vertical deformation velocities (mm/yr) for the sections displayed in Figure 7 and Figure 8.
Remotesensing 15 04207 g009
Figure 10. Representative deformation time series for the subsidence areas in the four identified AOIs, displayed as pink circles in Figure 7 and Figure 8. Time series show the pattern of several PSs (ranging from 47 to 74), where the strong continuous blue line shows the average time series of all selected PSs and the light blue shadow represents the standard deviation of all these selected PSs.
Remotesensing 15 04207 g010
Table 1. Sentinel-1 image characteristics.
SatelliteFirst ImageLast ImageGeometryOrbitImagesPolarizationMean Inc. Angle (°)Heading Angle (°)
S1A8 January 20178 September 2021Ascending136112VV39.2349.3
S1AB12 January 201712 September 2021Descending26114VV36.5190.6
Table 2. Total urban surface per administrative area affected by vertical deformations over 10 mm/yr.
Administrative AreaVertical Deformation Velocity > 10 mm/yr (ha)Total Urban Area (ha)Ratio (%)
Zone 166091
Zone 33124613
Zone 4139714
Zone 510048521
Zone 7189552
Zone 8121508
Zone 16134163
Zone 19179717
Mixco18545604
Petapa355124229
Santa Catarina de Pinula5714584
Villa Nueva8440192
Disclaimer/Publisher’s Note: The statements, opinions and data contained in all publications are solely those of the individual author(s) and contributor(s) and not of MDPI and/or the editor(s). MDPI and/or the editor(s) disclaim responsibility for any injury to people or property resulting from any ideas, methods, instructions or products referred to in the content.

