
AOD Derivation from SDGSAT-1/GLI Dataset in Mega-City Area


1
College of Geomatics and Geoinformation, Guilin University of Technology, Guilin 541004, China
2
Key Laboratory of Earth Observation of Hainan Province, Hainan Aerospace Information Research Institute, Wenchang 571399, China
3
International Research Center of Big Data for Sustainable Development Goals, Beijing 100094, China
4
Key Laboratory of Digital Earth Science, Aerospace Information Research Institute, Chinese Academy of Sciences, Beijing 100094, China
*
Author to whom correspondence should be addressed.
Remote Sens. 2023, 15(5), 1343; https://doi.org/10.3390/rs15051343
Submission received: 14 January 2023
/
Revised: 22 February 2023
/
Accepted: 23 February 2023
/
Published: 27 February 2023
(This article belongs to the Section Atmospheric Remote Sensing)
Abstract
:Aerosol optical depth (AOD) is the key parameter for determining the aerosol radiative effects and air quality variation. It is important to quantify nighttime aerosols using satellite-based night light images to understand their diurnal variations. This study selected high-resolution low light images from the Glimmer Imager (GLI) aboard the SDGSAT-1 satellite to examine spatial–temporal changes in night light emitted from the urban surface of Beijing. The radiance observed by SDGSAT-1/GLI was used to discern the AOD changes using the radiance background method (RB) and standard deviation method (SD) based on the characterization of the radiance from artificial light sources. Cloud cleaning processes were conducted to reduce the influence of the cloud cover in the glimmer images of the derived AOD. The results showed that there are good consistencies between the derived AOD results from the remote sensing and nighttime site observations. The radiance background method is better than the standard deviation method for deriving AOD using SDGSAT-1/GLI with the RMSE of its RB (0.0984) being greater than that of the SD (0.7653). The influence of moonlight, atmospheric absorption, and positioning errors on the results is briefly discussed. This paper shows that SDGSAT-1 can obtain relatively reliable night AOD values based on our investigations using the available satellite images taken in winter and spring, and that it has the potential to provide the scientific products of nighttime AOD.
1. Introduction
SDGSAT-1, launched on 5 November 2021, is the first scientific satellite dedicated to serving the United Nations 2030 Agenda for Sustainable Development Goals (SDG) [1]. Three key payloads are carried by SDGSAT-1, including a thermal infrared spectrometer (TIS), a glimmer imager (GLI), and multispectral imager (MII) [2]. SDGSAT-1 is operational at the height of 505 km with its inclination of 97.5°. The satellite’s swath width reaches 300 km, and its repetitive Earth coverage is about 11 days. SDGSAT-1 aims to detect human activities in detail at a higher spatial resolution day and night under the collaborative operation of three key payloads, further providing satellite images and scientific products supporting the Sustainable Development Goals (SDG) evaluations related to the intensive interaction between human activities and environmental changes [3].
SDGSAT-1/GLI can efficiently detect the intensity and distribution of ground low lights, which can be used to examine the details of urban spatial patterns, populations, or economic development levels. GLI can provide night light images at a spatial resolution of 10 m for panchromatic bands and of 40 m for three visible bands (red, green and blue), respectively, and it represents a great improvement in the detection of night light at higher spatial resolutions to examine detailed urban structures by comparing the data obtained by it with the popular night light datasets from VIIRS/DNB (nearly 742 m). RGB channels could detect the color variation of night light to understand the transformation of energy consumption modes [4].
Aerosols consist of very finely subdivided liquid or solid particles suspended in the atmosphere, which can maintain in the air for a long time [5]. Aerosol optical depth (AOD) is the key parameter for measuring the extinction effect of atmospheric aerosols, mainly characterized by the integration of the extinction coefficient of the medium in the vertical direction, which is widely used to assess the degree of air pollution [6]. The content of aerosols in the atmosphere is small, but they play an important role in climate change and atmospheric radiation balance due to their participation in many physical and chemical processes [7,8,9]. According to the processes of scattering, absorption, and transmission of solar radiation adopted by the algorithm, AOD could be detected from satellite platforms based on the characterization of sensitive wavelengths or the multiple observation angles adopted by their carried sensors [5], as is possible with Moderate Resolution Imaging Spectroradiometer (MODIS) [10], Advanced Very High Resolution Radiometer (AVHRR) [11], and Multi-angle Imaging Spectroradiometer (MISR) [12]. However, it is a big challenge to retrieve AOD at night due to the lack of appropriate satellite-based observation data. Meanwhile, there are big differences of aerosol optical depth values between day and night due to their rapid change rate and short life cycle. The diurnal variations of atmospheric aerosols are important for understanding climate change, air quality, and weather forecasts [13,14]. Nighttime aerosol information would further improve the prediction of aerosol visibility and air quality [15,16].
Many methods have been developed to derive aerosol optical depth using remote sensing images since the 1980s [5]. However, there are many limitations to the inversion of nighttime aerosol optical depth, especially the accuracy, spatial resolution, and universality of inversion algorithms [17,18,19]. Traditional methods adopted by daily satellite images are no longer applicable to retrieving nighttime aerosol optical depth due to the lack of solar radiation observations at night. Investigations have found that the nights of our world have been gradually lighted up along with intensive human activities and rapid economic development, especially in urban areas. Recent studies have suggested that the observation of night light can potentially allow the retrieval of nighttime aerosol optical depth [20,21,22,23,24,25,26]. The US Defense Meteorological Satellite Program(DMSP/OLS) was originally designed to observe cloud coverage using the weak moonlight reflected from the top of the cloud layer, and subsequently it was found to be appropriate for observing night light and retrieving AOD, but it could not provide an accurate AOD value due to the lack of absolute radiometric calibration and the saturation of the detector in the urban center [27]. Johnson et al. (2013) proposed the use of VIIRS/DNB night light data to discern the presence of aerosols according to the difference between urban lights and dark backgrounds. However, this method is more suitable for AOD derivation in isolated small cities regarding the inherent variation within an artificial light source. McHardy et al. (2015) proposed an improved method by using the spatial difference of urban light sources in the selected artificial light source area to retrieve the AOD value at night, and it is easier to obtain the global nighttime AOD values without the manual selection of the surrounding contrast area. Wang et al. (2016) found a good correlation between DNB observations and surface PM2.5 at the urban scale through nighttime AOD values, but these algorithms ignored multiple instances of scattering and gas absorption. Zhang et al. (2019) investigated nighttime AOD in the United States, the Middle East, and India using VIIRS/DNB datasets, and found that the derived nighttime aerosol value was mainly influenced by the satellite observation angle rather than the moonlight. This algorithm has the potential to provide the missing nighttime AOD with a relative low spatial resolution (1° × 1°) at the regional and global scales. Zhou et al. (2021) developed an algorithm to retrieve nighttime AOD from the moonlight observations of VIIRS DNB, without the pollution of human lights, using radiative transfer equations. However, the algorithm is mainly limited by the lunar phases and cannot perform effective inversion in cities with dense human activity. Jiang et al. (2022) conducted the inversion of nighttime AOD for two pollution processes in East China by combining the 6S radiative transfer model with synthetic nightlight background values of multiple days by building a look-up table, and the retrieved AOD values were in good agreement with the AOD values and site-observed air quality indices. Li et al. (2022) further verified the potential of point light sources to derive nighttime AOD according to the developed nighttime AOD inversion model based on observational experiments in Dunhuang using VIIRS/DNB data and ground-based integrating sphere measurements.
Accurate AOD variation has been possible to detect by site observation and space-borne Lidar systems in recent years. There are more than 200 Aerosol Robotic Network(AERONET) sites in the world equipped with the Climel CE318-T instrument, which can adopt the moonlight in photometer measurements to derive nighttime AOD information [28]. As the instrument’s calibration and quality control methods are being improved, AERONET can only provide temporary level 1.5 night AOD values at present. The ground-based laser system is another way to actively detect aerosol backscattering and extinction profiles at night [29], but they cannot provide full spatial coverage of the study area due to their isolated points of observation. The active space-borne Lidar instrument (Cloud-Aerosol Lidar with Orthogonal Polarization, CALIOP) is capable of more accurately exploring the global nighttime AOD [30]. However, it can only detect a narrow strip with a width of 70 m on the ground, and the area that can be detected every day is relatively limited [30,31].
The GLI imager aboard the SDGSAT-1 can capture low light signals at a spatial resolution of 10 m (PAN) and 40 m (VIS), and it has the potential to identify the types of urban light and reduce the error caused by different types of light sources. This study tried to explore nighttime aerosol optical depth using SDGSAT-1/GLI images. Cloud-free images were selected from the SDGSAT-1/GLI images to create clean background data. The analysis of the atmospheric radiation transfer process and the characterization of low light at night over an artificial light source were used to derive the spatial distribution of nighttime AOD in Beijing. The possible factors affecting the AOD derivation were also evaluated to further improve the aerosol optical depth inversion at night.
2. Study Area and Datasets
2.1. Study Area
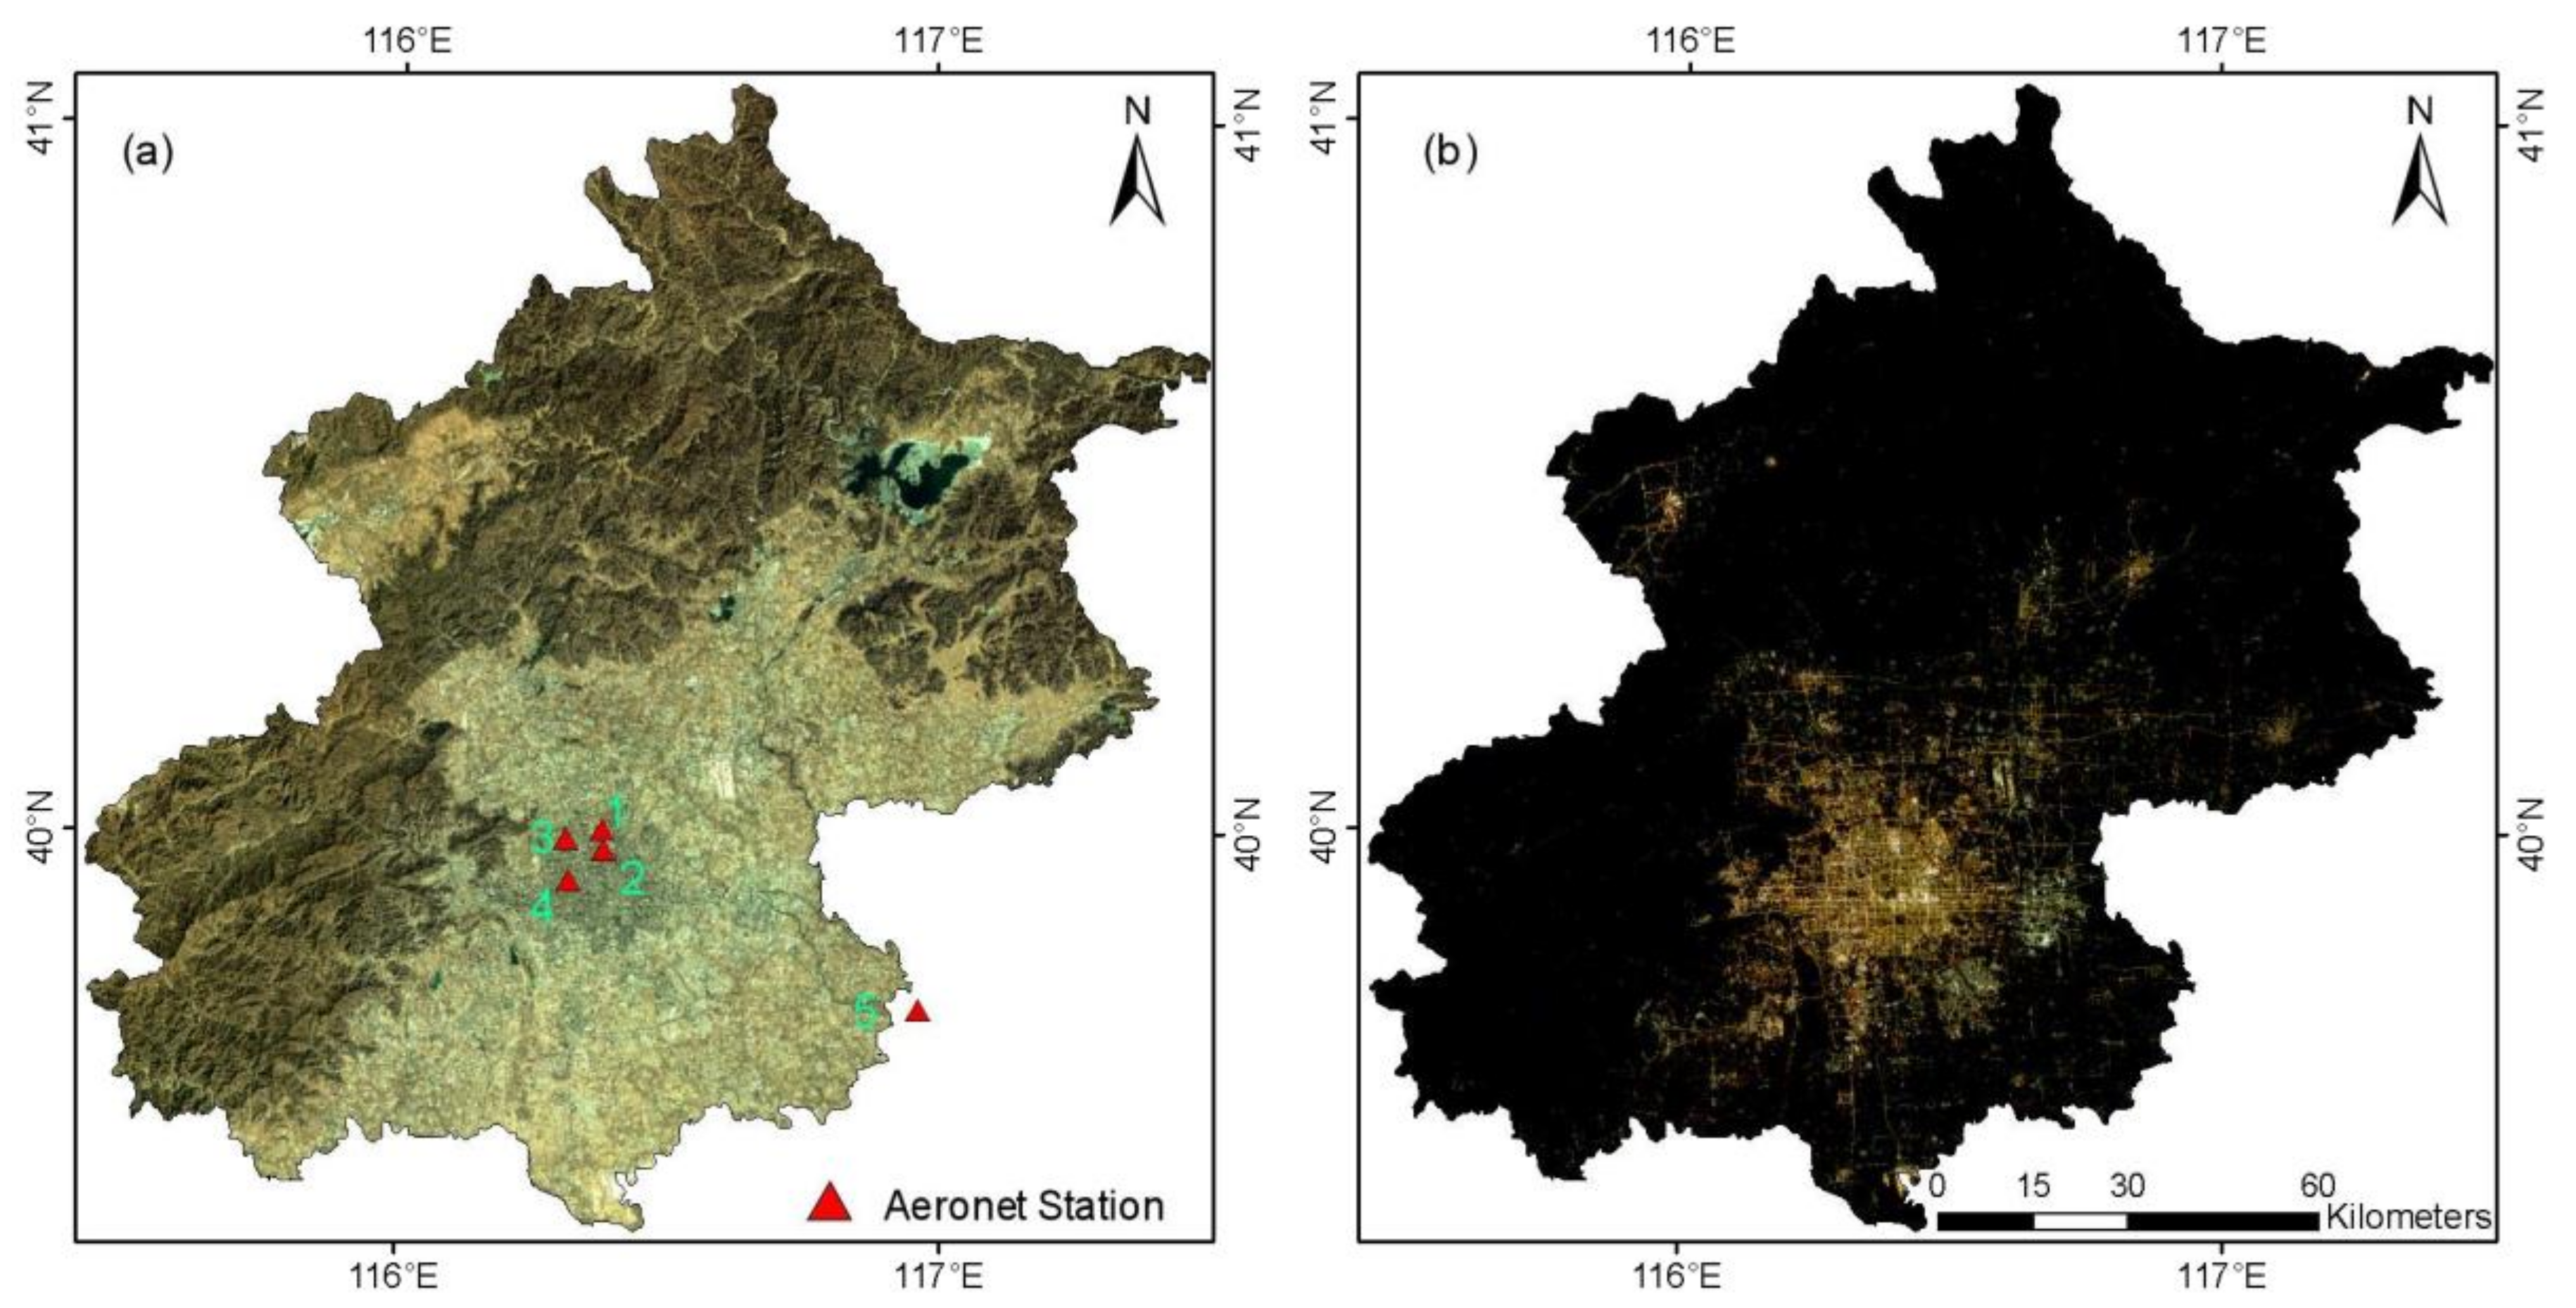
Beijing, located in the North China Plain (115.4–117.6°E, 39.4–41.1°N), is a typical mega-city with a population of 21.886 million and an urbanization level of 87.5% in 2021. Beijing has complex terrain conditions with mountains and a natural surface mainly located in the northern part and the western part of Beijing, while the southeast part, mainly cropland and settlements, is flat and densely populated (Figure 1a) [32]. Beijing has experienced rapid economic growth and urbanization in recent decades. The emission of atmospheric pollutants from industrial production, vehicle exhaust, fuel combustion, and other sources caused a change in the aerosol concentration [33]. Figure 1b shows a true-color composite image of low light at night in Beijing on April 15, and we found that the orange color appeared in the central urban area with there being many high-pressure sodium lamps in this region, while LED lamps were mainly distributed in the eastern part of the urban area with different colors.
2.2. SDGSAT-1 GLI Data
As SDGSAT-1/GLI can produce high spatial resolution images, it can clearly capture nighttime city lights and their spatial distribution, further providing the details of urban structure and street extension. The overpass time of SDGSAT-1 in Beijing is around 21:20 local time, about 4 h earlier than that of VIIRS/DNB [34], which may make it better for monitoring local human activities. L4A images of SDGSAT-1 were selected from the satellite data sharing service system (http://www.sdgsat.ac.cn/ (accessed on 1 August 2022)), and they were systematically geographically corrected and radiometrically calibrated to create highly consistent and continuous data products. This study selected 17 satellite images from November 2021 to July 2022 (Table 1).
2.3. VIIRS/DNB Data
NASA’s Black Marble product suite consists of the daily at-sensor TOA nighttime radiance product (VNP46A1) and the daily moonlight-adjustment nighttime lights (NTL) product (VNP46A2) (https://ladsweb.modaps.eosdis.nasa.gov/ (accessed on 15 July 2022)). The spatial resolution of VNP46A1 and VNP46A2 products is 15″ (about 500 m at the equator) [35]. According to the quality control information (QC) of the datasets, we selected high quality images to minimize the data uncertainty by excluding pixels with missing values or damaged calibration data, such as pixels contaminated by stray lights and clouds. Here, the parameters, TOA, UTC, ANG, and QF of VNP46A1 and VNP46A2 are selected. They mainly delineate the radiance, time, satellite azimuth angle, and quality control (including cloud mask), respectively. VIIRS/DNB images were also used to derive nighttime AOD to compare it with that from SDGSAT-1/GLI. Table 2 provides the comparison of satellite specifications of VIIRS/DNB and SDGSAT-1/GLI.
2.4. AERONET Data
Aerosol observation datasets were selected in this study from the AERONET (Aerosol Robotic Network) website, a global aerosol monitoring network jointly established by NASA (National Aeronautics and Space Administration) and LOAPHOTONS (CNRS). AERONET has collected daytime aerosol information since 1993, while it began to conduct nighttime aerosol measurements, using moonlights as the light source, in 2015 [24,28]. Currently, about 200 AERONET stations are capable of monitoring nighttime AOD. Generally, the total calibration uncertainty of the AERONET radiance measurement ranges from 5% to 12% when the wavelength and the lunar phase angle varies from 440–1640 nm and 0–90 degrees, respectively. The uncertainty of nighttime AOD from AERONET observations is less than 0.03, which makes it more accurate than other AOD products. Therefore, it is widely used in the validation or verification of satellite-derived AOD datasets [24,36]. Due to the lack of nighttime Level 2 AOD data from AERONET products, we mainly selected the latest AOD datasets from AERONET Level 1.5 products to conduct a quality assessment of satellite-based AOD datasets. Due to there being no AOD products at the wavelength of 550 nm in AERONET, band interpolation based on the Ångström index estimation model was used to calculate AOD 550 nm from the AOD at 500 nm and 675 nm to compare the results with the satellite-based AOD results:
where and are the AOD at wavelengths (500 nm) and (675 nm), respectively, and denotes the Ångström index.
3. Aerosol Inversion Methods
3.1. Theoretical Basis
According to Johnson et al. (2013) and Li et al. (2022), the upward radiance of the target pixel at the bottom of the atmosphere at night is contributed by the radiance from the artificial light source and the lunar light source, which can be expressed as:
is the incident light from the Moon, μ0 is the cosine of the Moon’s zenith angle, is the surface reflectance, and is the aerosol reflectance. is the scattered transmittance, is the radiance emitted by the surface source, () denotes the reflected direct Moon radiance, and () denotes the scattered Moon radiance. The observed radiance from the satellite in the visible band at night can be expressed as:
where is the radiance observed by the satellite, is the radiance from the surface upward, τ is the total optical thickness, μ is the cosine of the zenith angle observed by the satellite, and is the path radiance (at night, mainly refers to the radiance that reaches the sensor directly after the scattering by the components of the atmosphere and aerosol particles during the moonlight transmission). and represent the direct and surface diffuse emission term radiance upward from the surface source.
3.2. AOD Derivation Using Standard Deviation Method (SD Algorithm)
According to McHardy et al. (2015), assuming that remains constant throughout the observations and city light pixels are contiguous, all pixels have the same total optical thickness, scattered radiance, path radiance, reflected direct lunar radiance (), and scattered lunar radiance (). When AOD is 1, is about 0.1, and multiplying it by the surface reflectance, , will make it even smaller, so the effect of in the denominator can be neglected. Taking the spatial derivative of Equation (3) yields Equation (4):
is the intrinsic spatial deviation of the ground source and is the spatial deviation observed by the satellite. Assuming that aerosol optical depth is the total optical thickness, , under cloud-free conditions, it can be expressed as:
3.3. Radiance Background Method for AOD Inversion (RB Algorithm)
The radiance received by satellites can be expressed as:
is the radiance emitted from the surface light source, is the radiance of moonlight reflected by the surface, and is the total transmittance (usually the convolved spectral atmospheric transmittance of each band with the spectral response function). is the nighttime atmospheric path radiance, which mainly refers to the radiance that reaches the sensor scattered by the components of the atmospheric and aerosol particles during the moonlight transmission. The observed radiance of the satellite at the top of the atmosphere without considering moonlight can be expressed as:
The simulation of the atmospheric radiative transfer model can provide atmospheric transmittance, and the total atmospheric transmittance is established in this study using MODTRAN 5.2.2. We created a lookup table to conduct the AOD derivation according to the satellite zenith angles, AOD values, and the simulated total atmospheric transmittance. We selected the standard atmospheric profile of mid-latitude winter from MODTRAN and the urban aerosol type in the model simulation. Then, the AOD interval of 0.1 within the range of 0–3 and the satellite zenith angle, 0–18° with the interval of 2°, were also adopted in the simulation.
The flow chart of RB and SD algorithms provides the details of our nighttime AOD retrieval using SDGSAT-1/GLI images (Figure 2). According to the relative information from the lookup table simulated by the MODTRAN radiative transfer model, the images could delineate AODs under different satellite observation situations, including the corresponding atmospheric transmittance under different aerosol states and different satellite observation angles.
3.4. VIIRS/DNB Data Pre-Processing
The creation of an appropriate and stable nightlight background from the multi-day synthetic artificial light radiance was used to conduct the aerosol inversion. However, we found that artificial light sources are usually affected by human activities, especially abrupt changes in local light sources detected in a short period, for example, their brightness increases during holiday celebrations [25]. These big changes in surface light are not applicable to AOD derivation algorithms. The coefficient of variation (), reflecting the diffusion degree in a specific region, is used to identify and remove inappropriate signals. Here, we quantify the coefficient of variation as the ratio between the standard deviation () and the averaged value (M) of a data sequence:
The VIIRS/DNB data in the study area were divided into 5 × 5 pixel grids. The city light pixels in the grid were selected to calculate the standard deviation. First, these grids, with cloud cover detected by quality control information, were removed. We calculate the coefficient of variation of these grids using the monthly data sequences from selected images. Then, the regions could be divided into stable and unstable light source areas using the maximization of inter-class variance method (Otsu) [37].
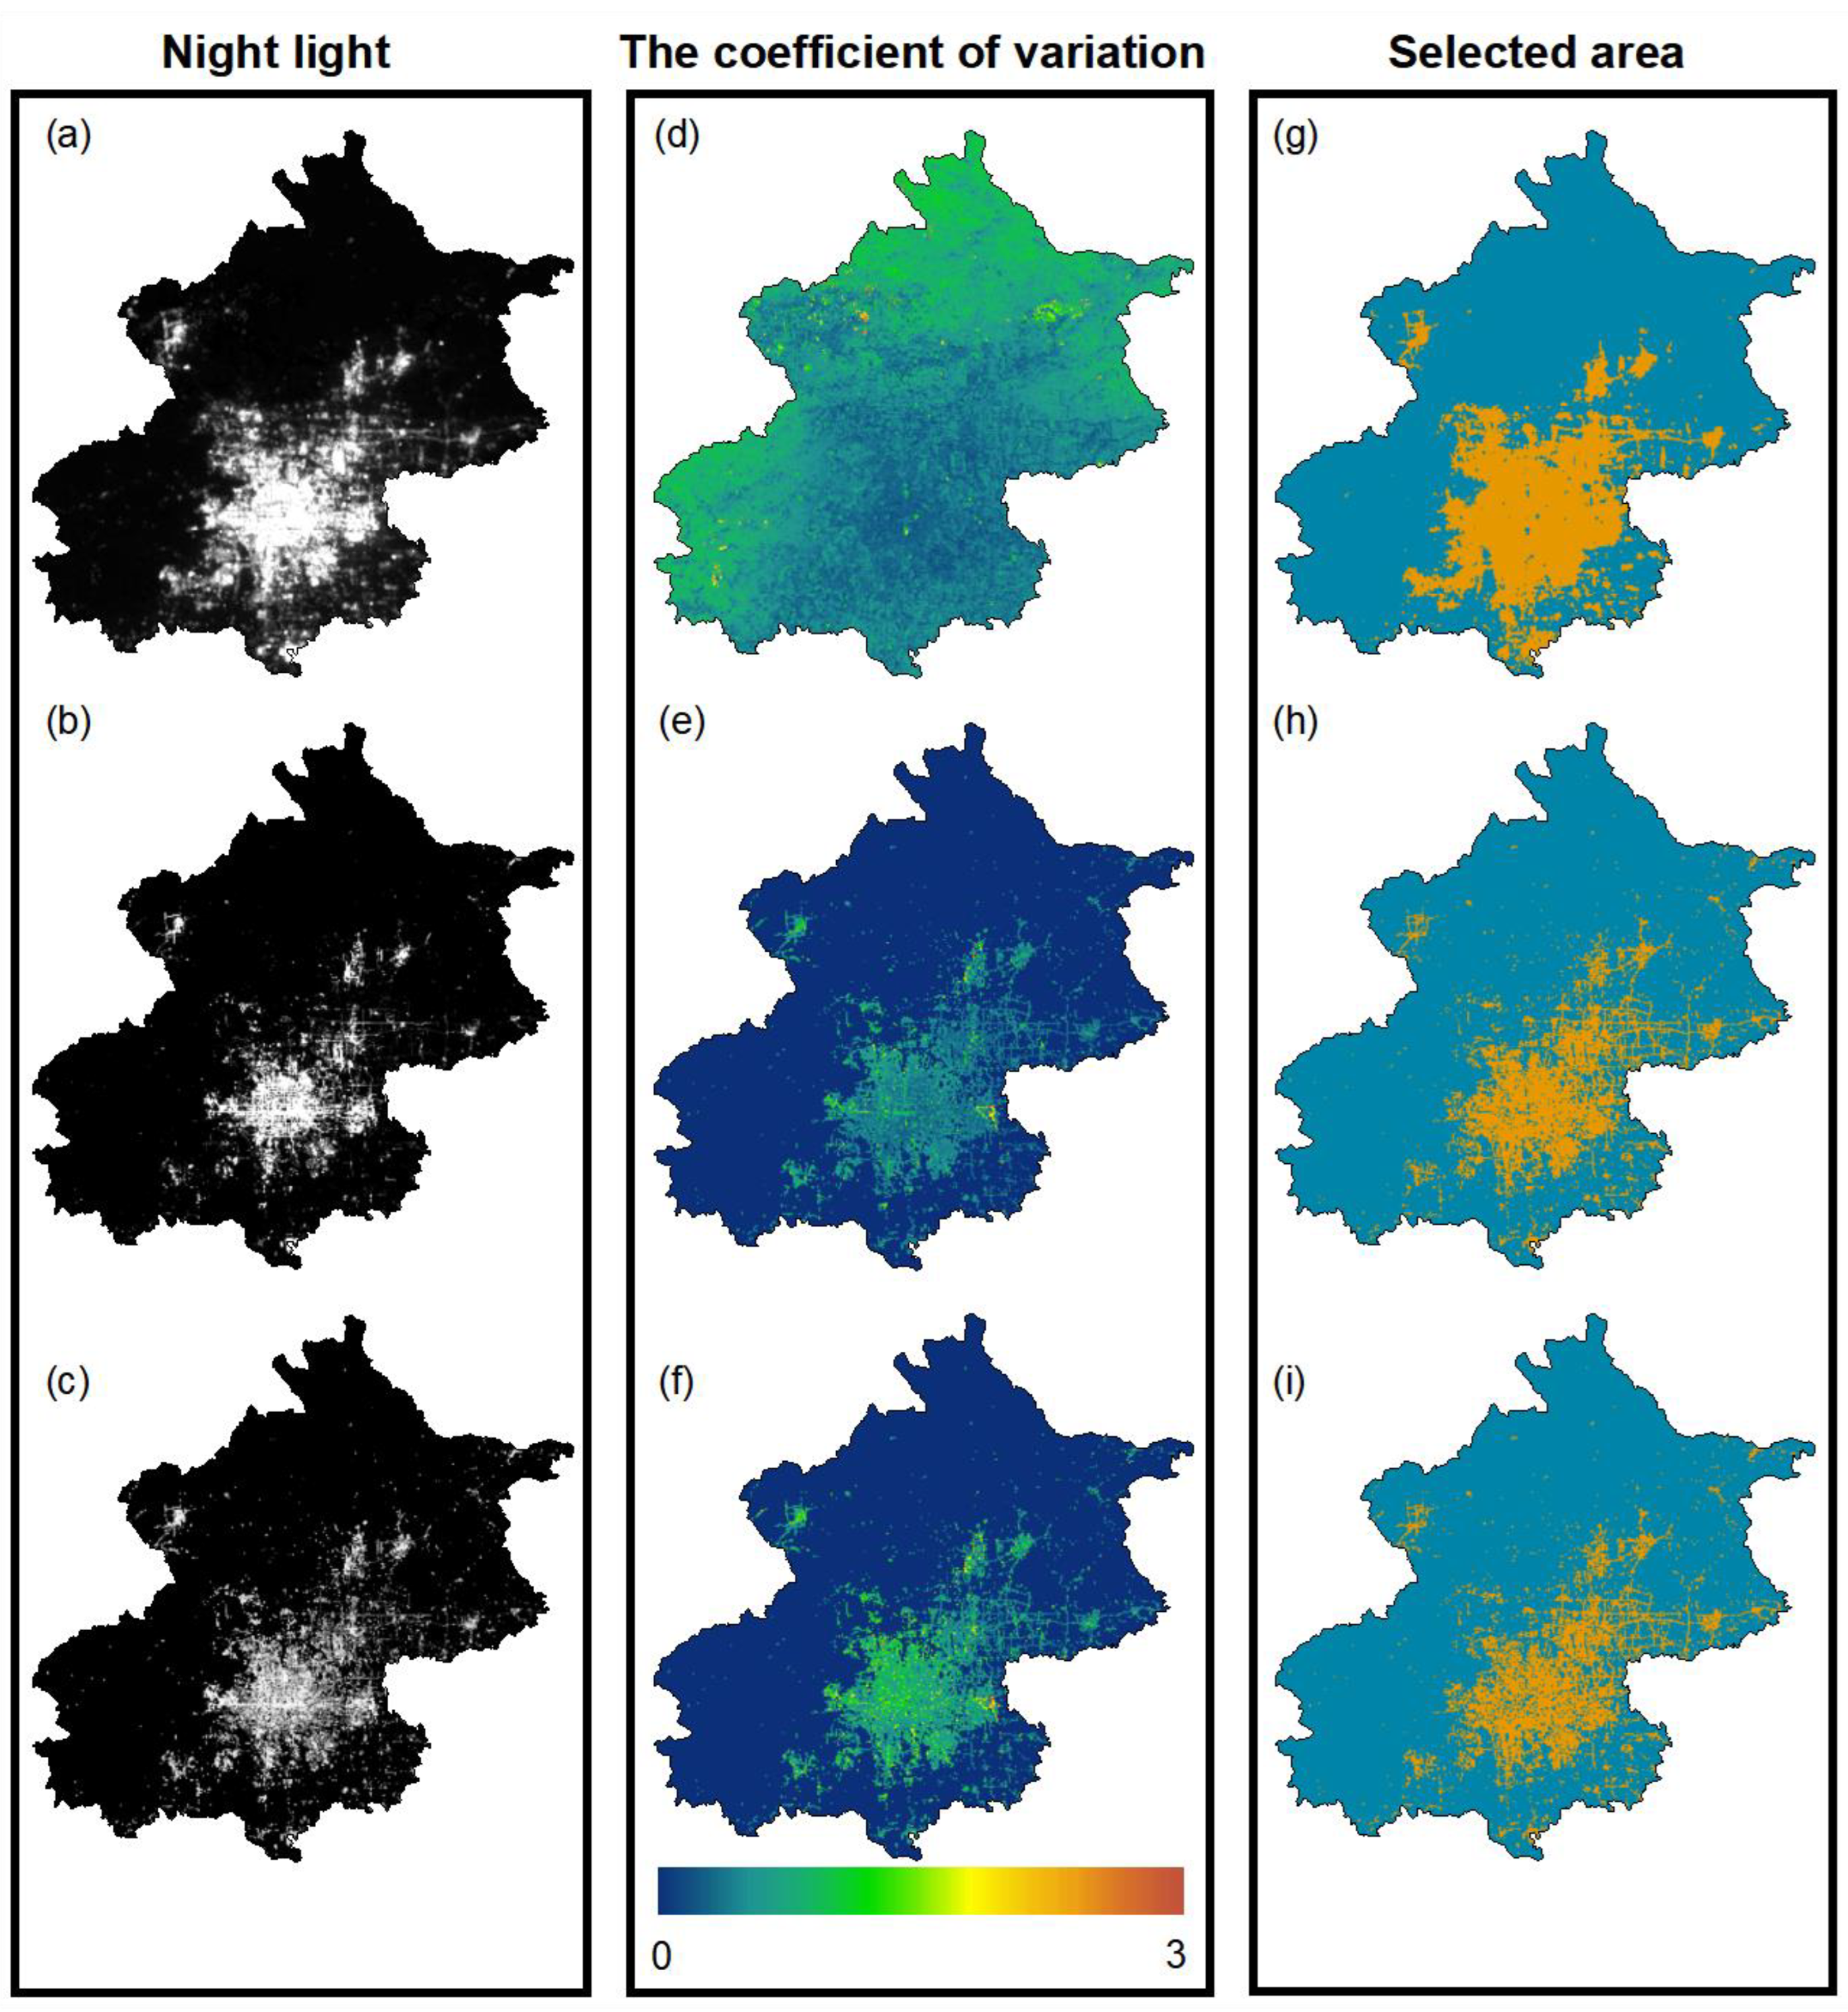
We synthesized monthly background data using the maximum radiance value of the time series of cloud free data within a month and selected the pixels with radiance values greater than 1.5 times the average value as urban pixels. This method can identify a relatively stable urban area using night light signals [20]. Figure 3 shows the synthesized radiance value and the variation coefficient figure calculated on March 2022; we found that there was no light in the mountain area and that the change in its radiance was mainly affected by moonlight. The variation coefficient is relatively stable except for the urban center, which is suitable for the inversion of aerosol optical depth at night. Figure 3g,i shows the selected region used in the AOD derivation. In order to reduce the error created by possible abnormal changes, the inversion process was canceled to maintain the stability of the results when the urban light pixel in the grid was less than 4.
3.5. SDGSAT-1/GLI Data Preprocessing
According to radiometric calibration coefficients and a spectral response function of the panchromatic band of SDGSAT-1, the DN values from the GLI L4A images were converted to radiance (unit: ) accoriding to the absolute radiometric calibration coefficient released by the International Research Center of Big Data For Sustainable Development Goals (http://www.sdgsat.ac.cn/ (accessed on 1 August 2022)).
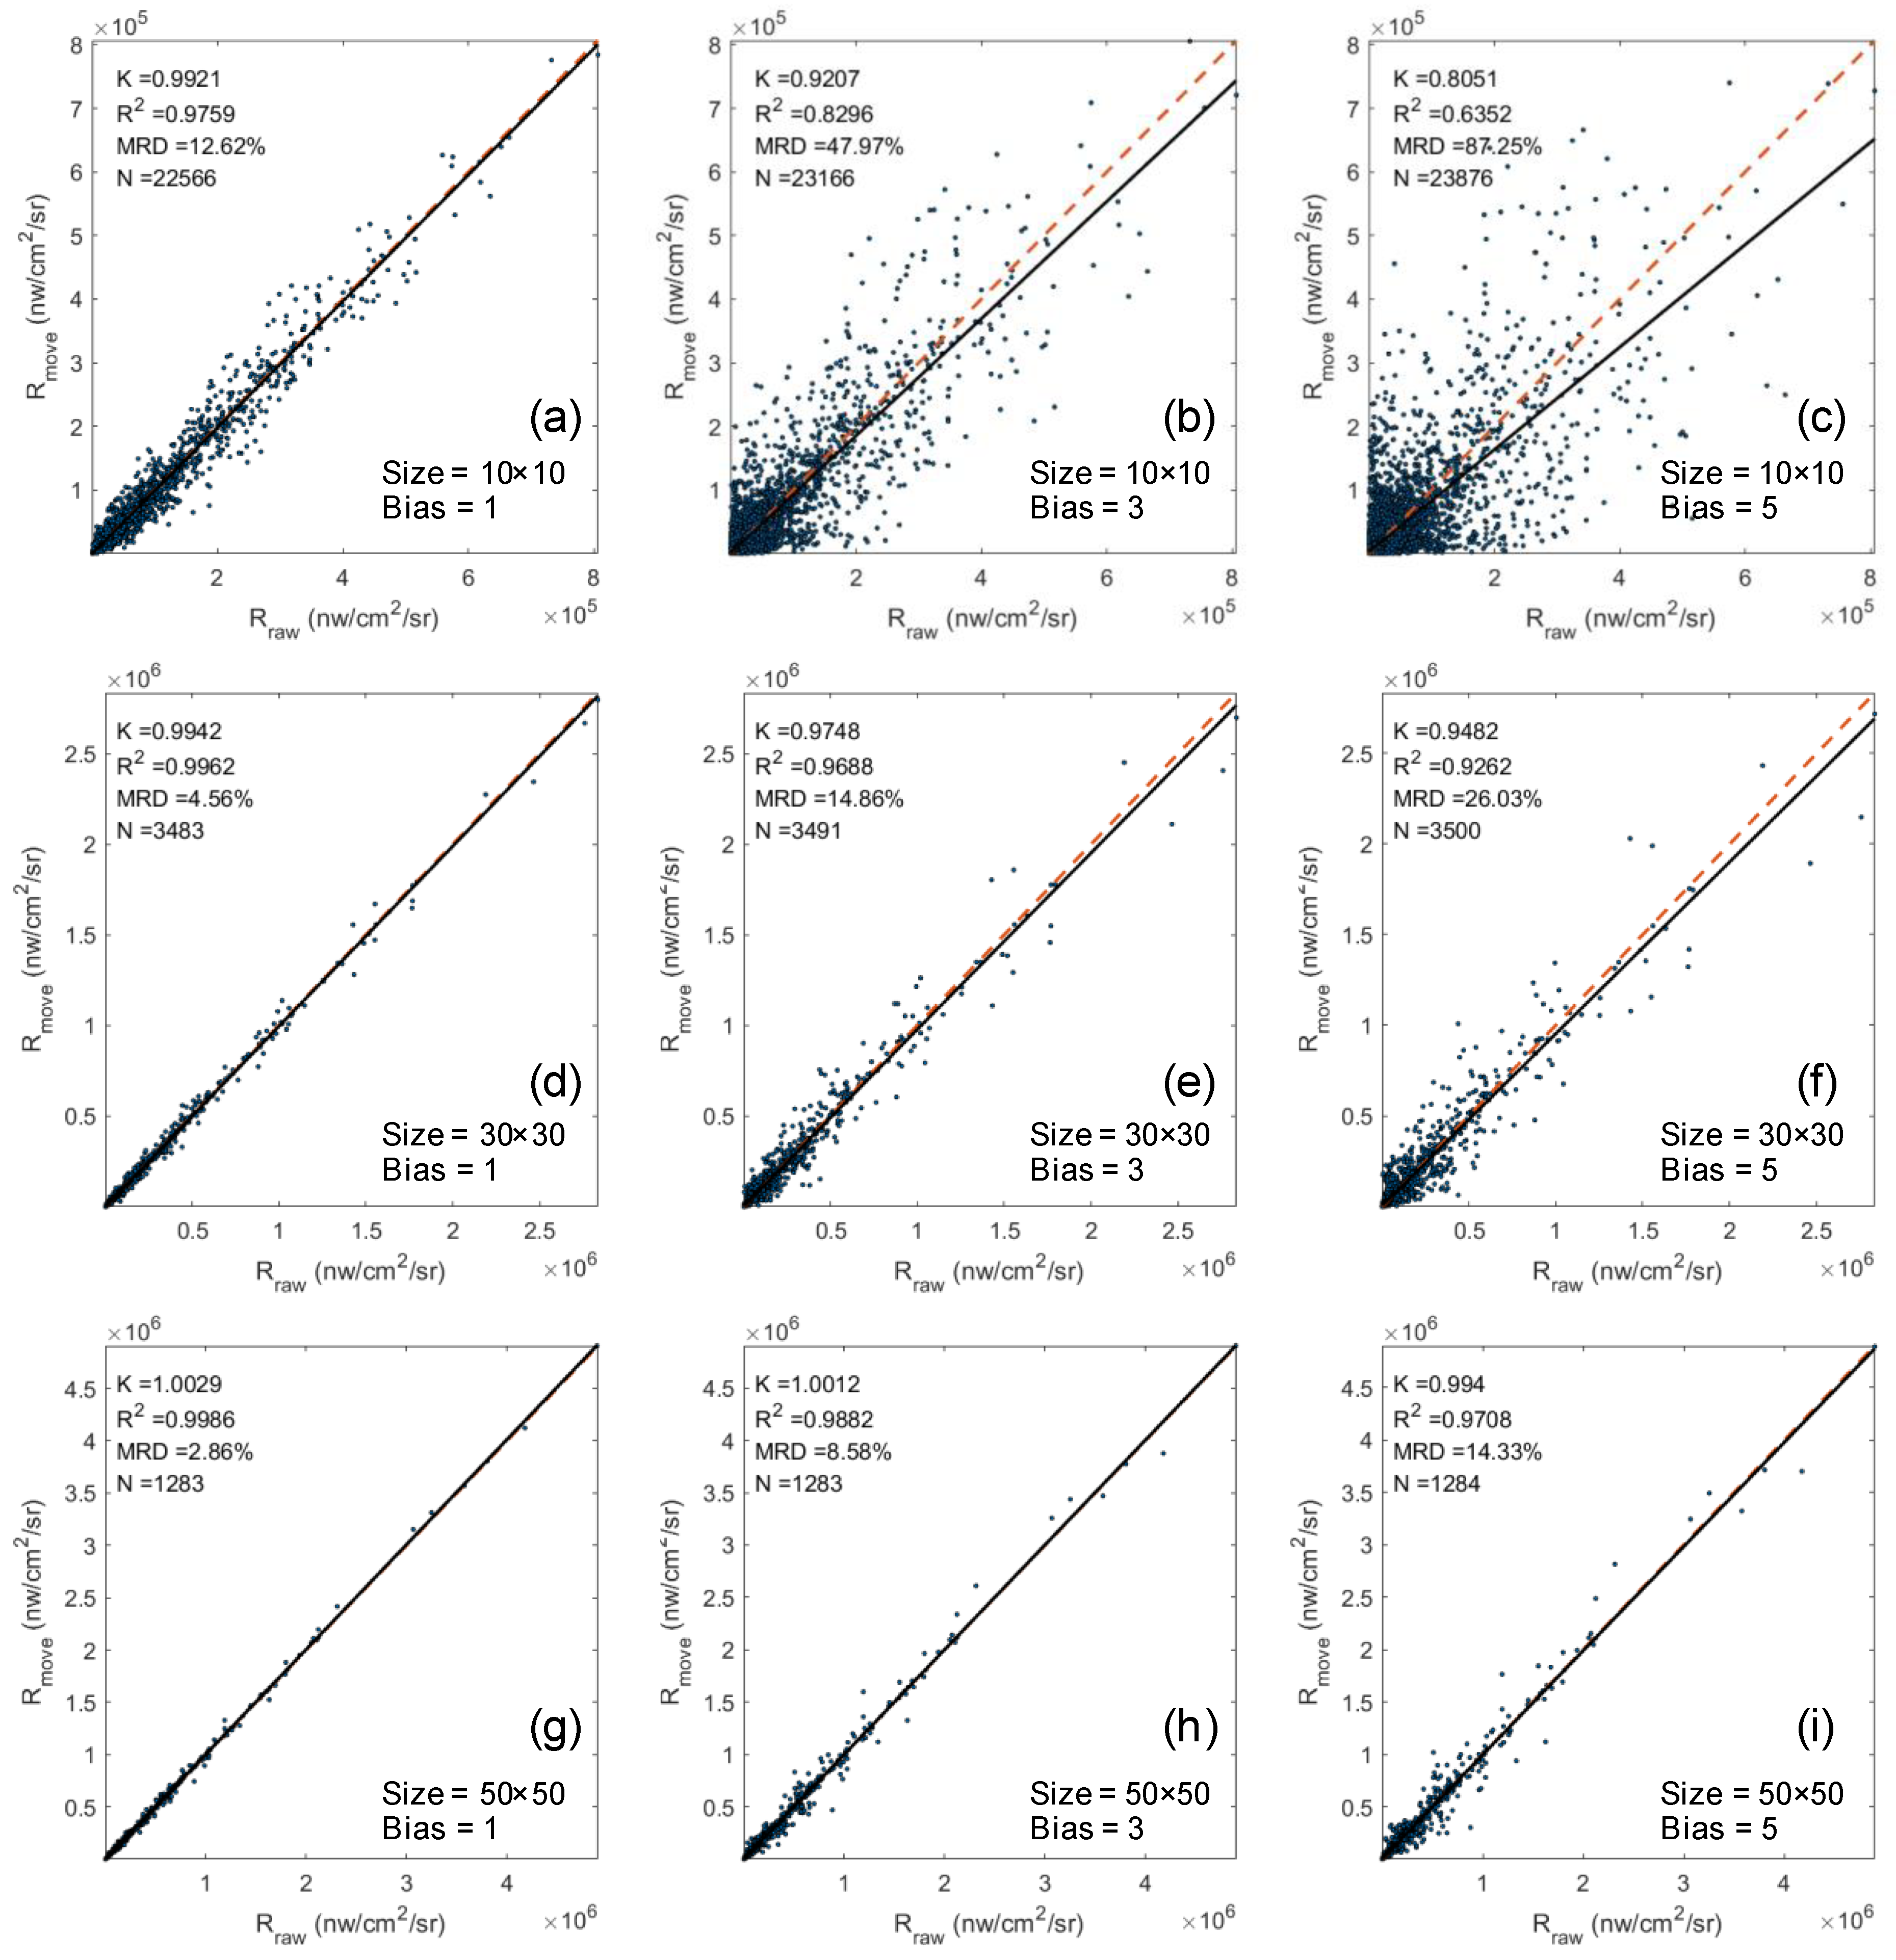
Due to the diffusion effect of night light, changes city light may modify the radiance of their adjacent pixels. Generally, urban lights are complex and dynamic with many different point light sources over the urban surface. The brightness of the light center greatly differs from that of the surrounding area, and large changes in pixel radiance could be caused by small positioning errors. Due to the improved spatial resolution of SDGSAT-1/GLI data compared with that of VIIRS/DNB data, the ratio of the positioning error to the pixel resolution also increased, which led to difficulties when comparing the multi-temporal light data of the same geographical location. In order to select stable urban lights from the SDGSAT-1/GLI low light images, we further expanded the selected window to search for more urban light pixels. The central area of Beijing (116.264–116.490°E, 39.825–39.995°N) was selected to explore the appropriate window size selection, and we found that there is positive relationship between selected window size and data stability. The investigation of the panchromatic glimmer images from SDGSAT-1 showed that the maximum positioning error range was about 4–5 pixels (40–50 m). Therefore, we explored window size using the displacement of 1–5 pixels of panchromatic band data and the 10 × 10 window. The radiance values of the window were obtained as the original radiance, . Then, the window, moved by 1 pixel, 3 pixels, and 5 pixels, was used to calculate the total radiance values, . We analyzed the relationship between and to evaluate the impact of geographical positioning errors on the background windows (Figure 4). The increase in position deviation was negative and related to the correlation coefficient of and in the same window size. One pixel positioning error at 10 × 10 window would cause the mean relative deviation (MRD) to be 12.62%, with R2 by 0.975 and the scale coefficient, K, by 0.9921, while the MRD increased to 87.25% when the positioning error reached 5 pixels. Meanwhile, the determination coefficient and the scale coefficient also decreased to 0.6352 and 0.8051, respectively. Figure 4b,e,h shows that the scale factor would approach 1 when the window size increased with a 3-pixel deviation, with R2 increasing from 0.8296 to 0.9882 and MRD decreasing from 47.97% to 8.58%, which indicated that the data stability improved along with the increasing window size.
Similar to VIIRS/DNB, AOD inversion using SDGSAT-1/GLI data also requires the appropriate pre-processing of city lights. Due to the influence of atmospheric conditions, radiometric calibration, moon phase, and observation geometry, the radiance value of the same pixel may vary on different days. Light pixels with a DN value greater than 20 were considered relatively stable and were classified as urban light pixels based on the characteristics of the SDGSAT-1/GLI night light data. Here, the number of stable light pixels in the same window was considered a constant, which can be quantified by the median of the multi-day observation. The median number of urban light pixels observed from multiple days in each window was considered to be the total number of real urban light pixels in the window in . This method could maintain the stability of the selection and enhance the comparability of the low light data.
The night light images of Beijing were divide into grids with 50 × 50 pixels, and the pixels with the largest brightness value of each grid were considered as the city light pixels in the grid. We calculated the standard deviation, , of all the light pixels in the grid for the SD algorithm, and selected the grid with the maximum standard deviation across multiple days as the standard deviation background grid, (without aerosol influence). The total radiance, , of all the light pixels in the grid was calculated by the RB algorithm. For the same grid, the maximum radiance across multiple days was selected to delineate the grid as the radiance background grid, (without aerosol influence).
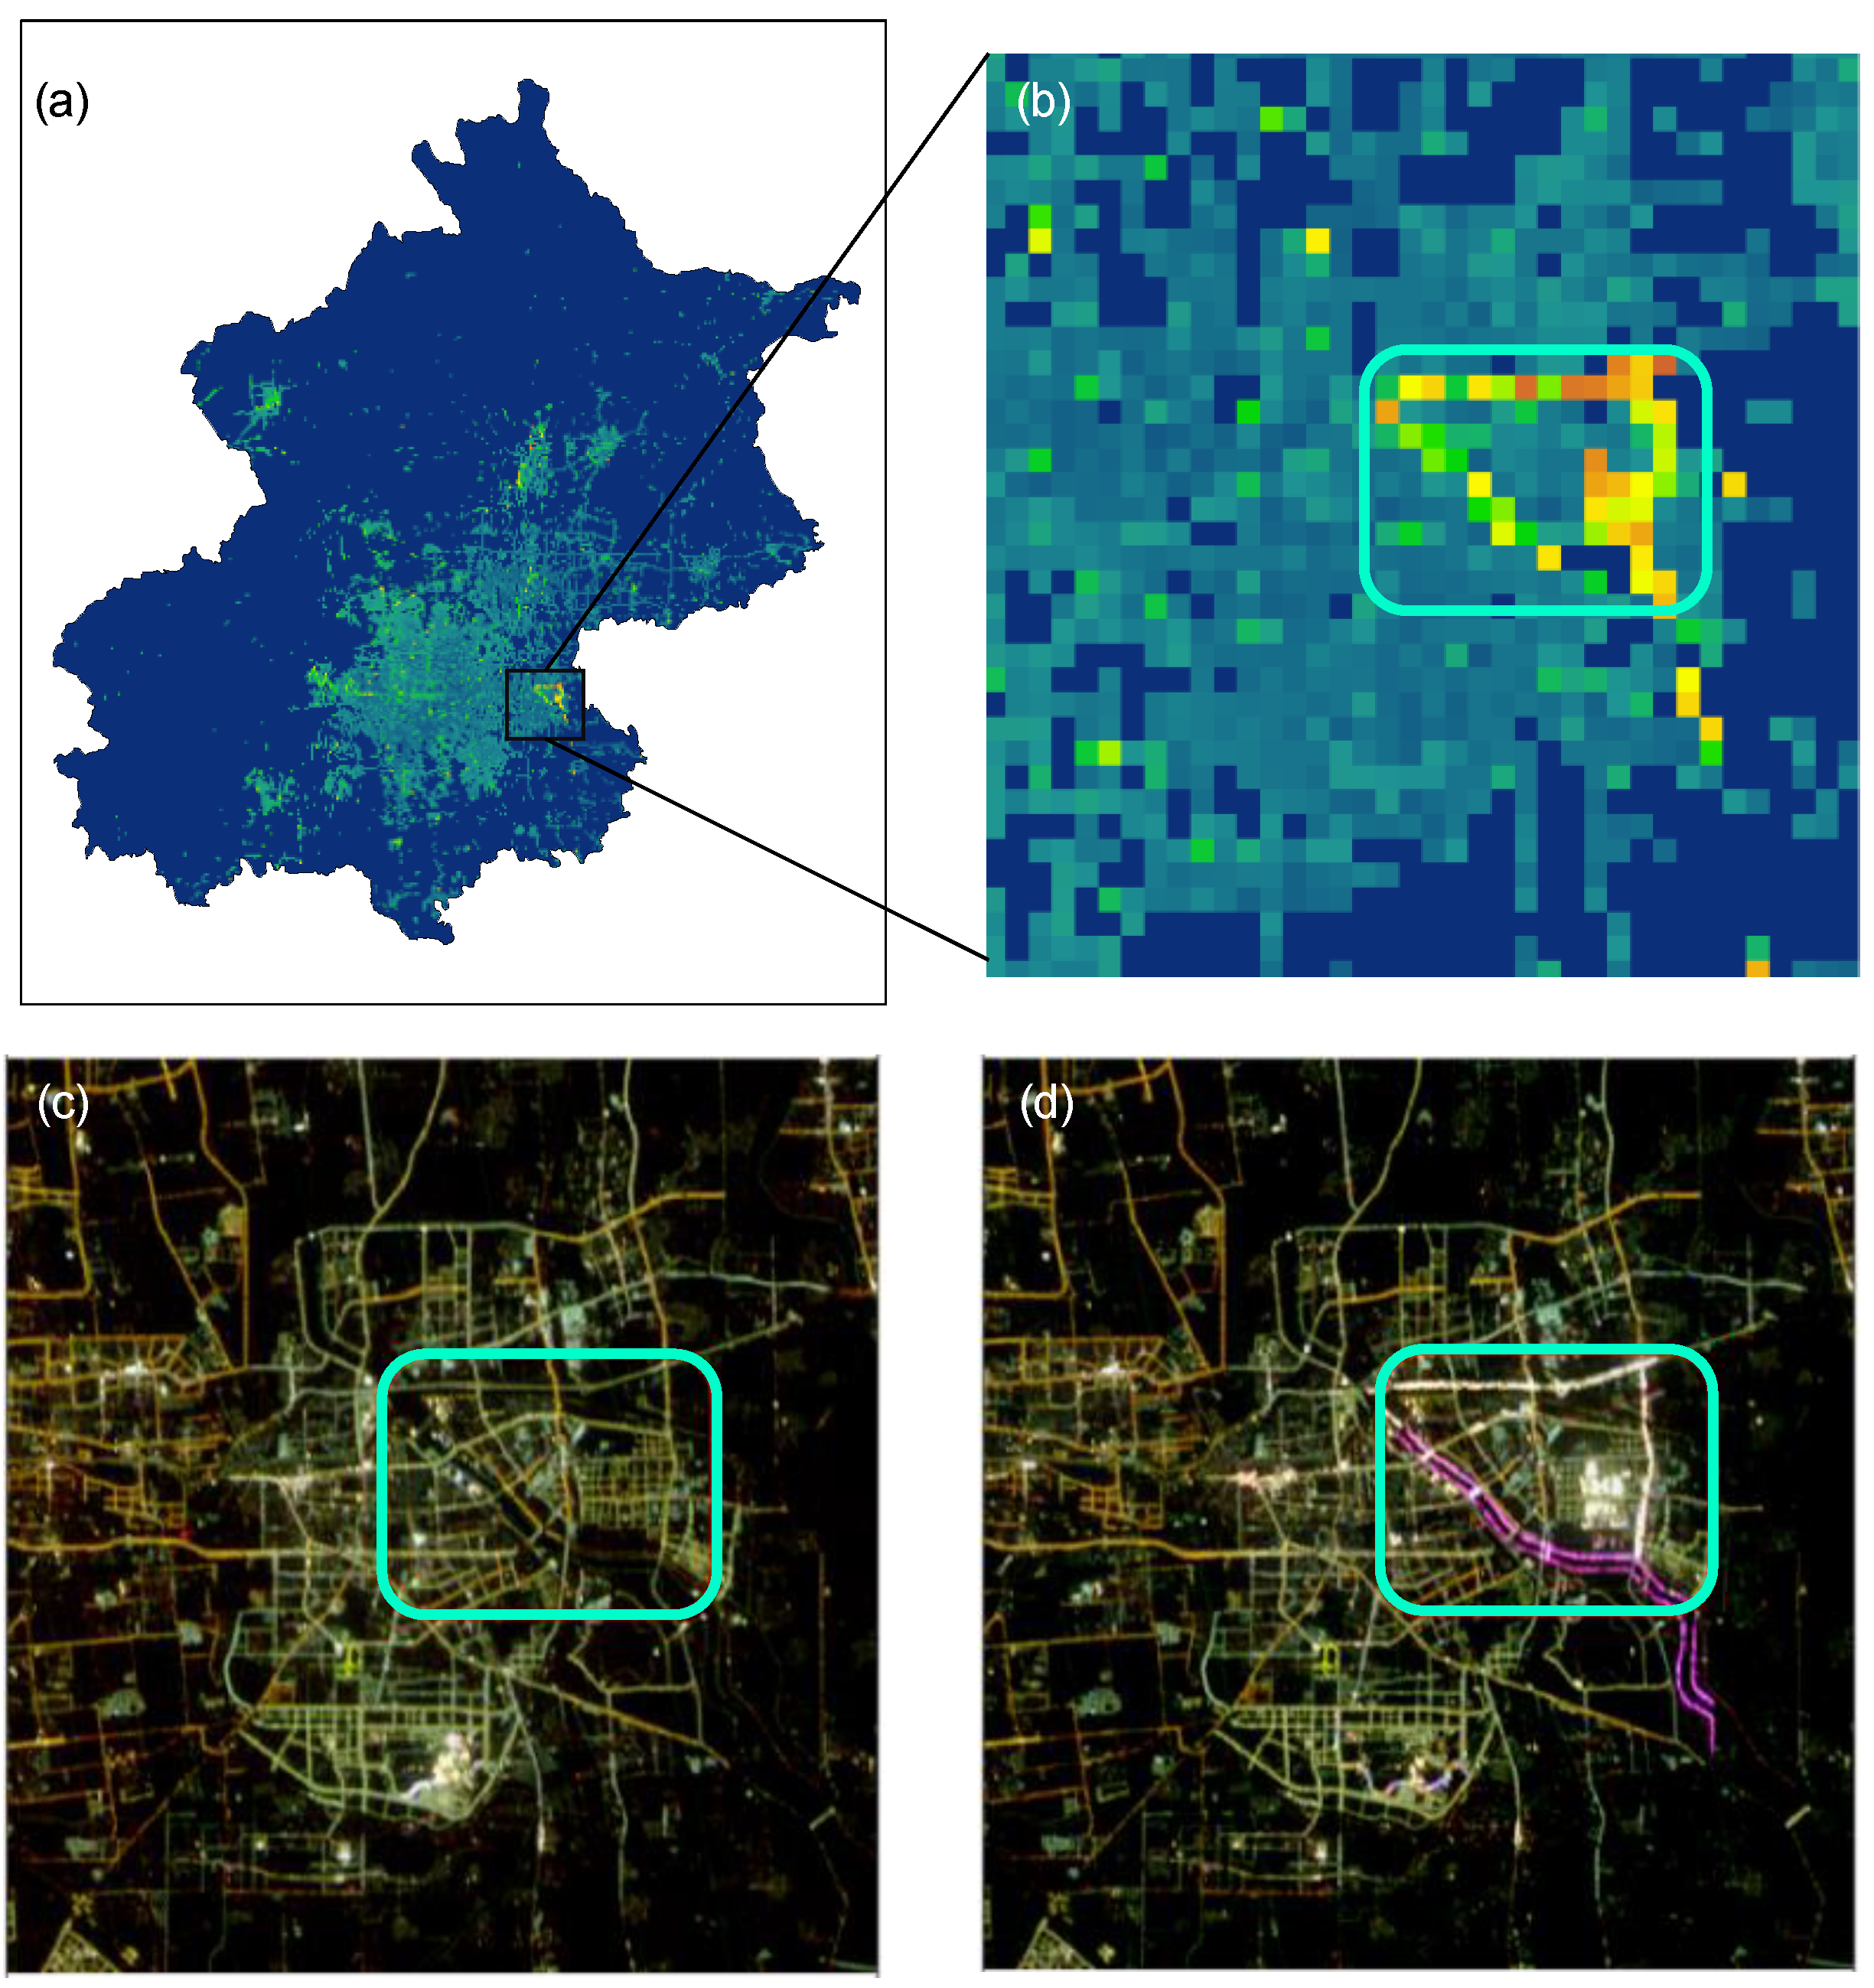
In order to maintain the stability of the data in the grid and enhance their comparability, the grid of less than 10 was defined as a dark grid without retrieving nighttime AOD. The coefficient of variation was quantified using the radiance, , and the standard deviation, . The regions with rapid changes in night lights were defined as about 1.5 times greater than the averaged CV values. The rapid change area was identified on 1 May 2022 in Beijing (Figure 5), and many purple landscape lights have been detected on both sides of a river in the east of Beijing. Light brightness enhancement also occurred in a nearby commercial area. They are the typical unstable light areas, which needed to be identified and eliminated to reduce the large errors would have created in the AOD results. Meanwhile, a manual visual inspection of the SDGSAT-1 low light images was also conducted to detect cloud cover. When the urban areas were completely or mostly covered by clouds, the images were not used for the retrieval of aerosol optical depth at night.
3.6. Nighttime AOD Derivation
An SD algorithm was used to derive the nighttime AOD in Beijing using VIIRS/DNB datasets from 1 July 2021 to 30 June 2022. In order to compare those with AOD retrieved by the SDGSAT-1 satellite, the spatial deviation observed by the VIIRS/DNB () calculated from cloudless night light data and the inherent spatial deviation of light observed by VIIRS/DNB () were selected to calculate the nighttime aerosol optical depth, .
SDGSAT-1/GLI data were used to retrieve nighttime AOD using the SD and RB algorithms, respectively. The standard deviation, , standard deviation background value, , of the light pixel in the daily retrieval window, and the zenith angle of the satellite observation were adopted by the SD algorithm to retrieve the nighttime aerosol optical thickness according to Equation (5). Similarly to the SD algorithm, the RB algorithm used the daily retrieval of radiance, , radiance background value, , of light pixels in the window, as well as the satellite observation zenith angle, combined with the lookup table established by MODTRAN to retrieve the nighttime aerosol optical thickness.
Clouds cause the attenuation of the brightness of city lights detected by satellites. Therefore, if the pixel value of urban light participating in the calculation in the inversion window was lower than the minimum value of the detection range of the SDGSAT-1/GLI sensor, it was considered that this window may have been affected by thick clouds, and the AOD inversion was not performed. The median filtering method was used to optimize the AOD inversion results of the SDGSAT-1 low light data, and it could efficiently remove outliers (maximum or minimum) to improve the stability of the AOD inversion value.
4. Results
4.1. The Nighttime AOD from SDGSAT-1/GLI
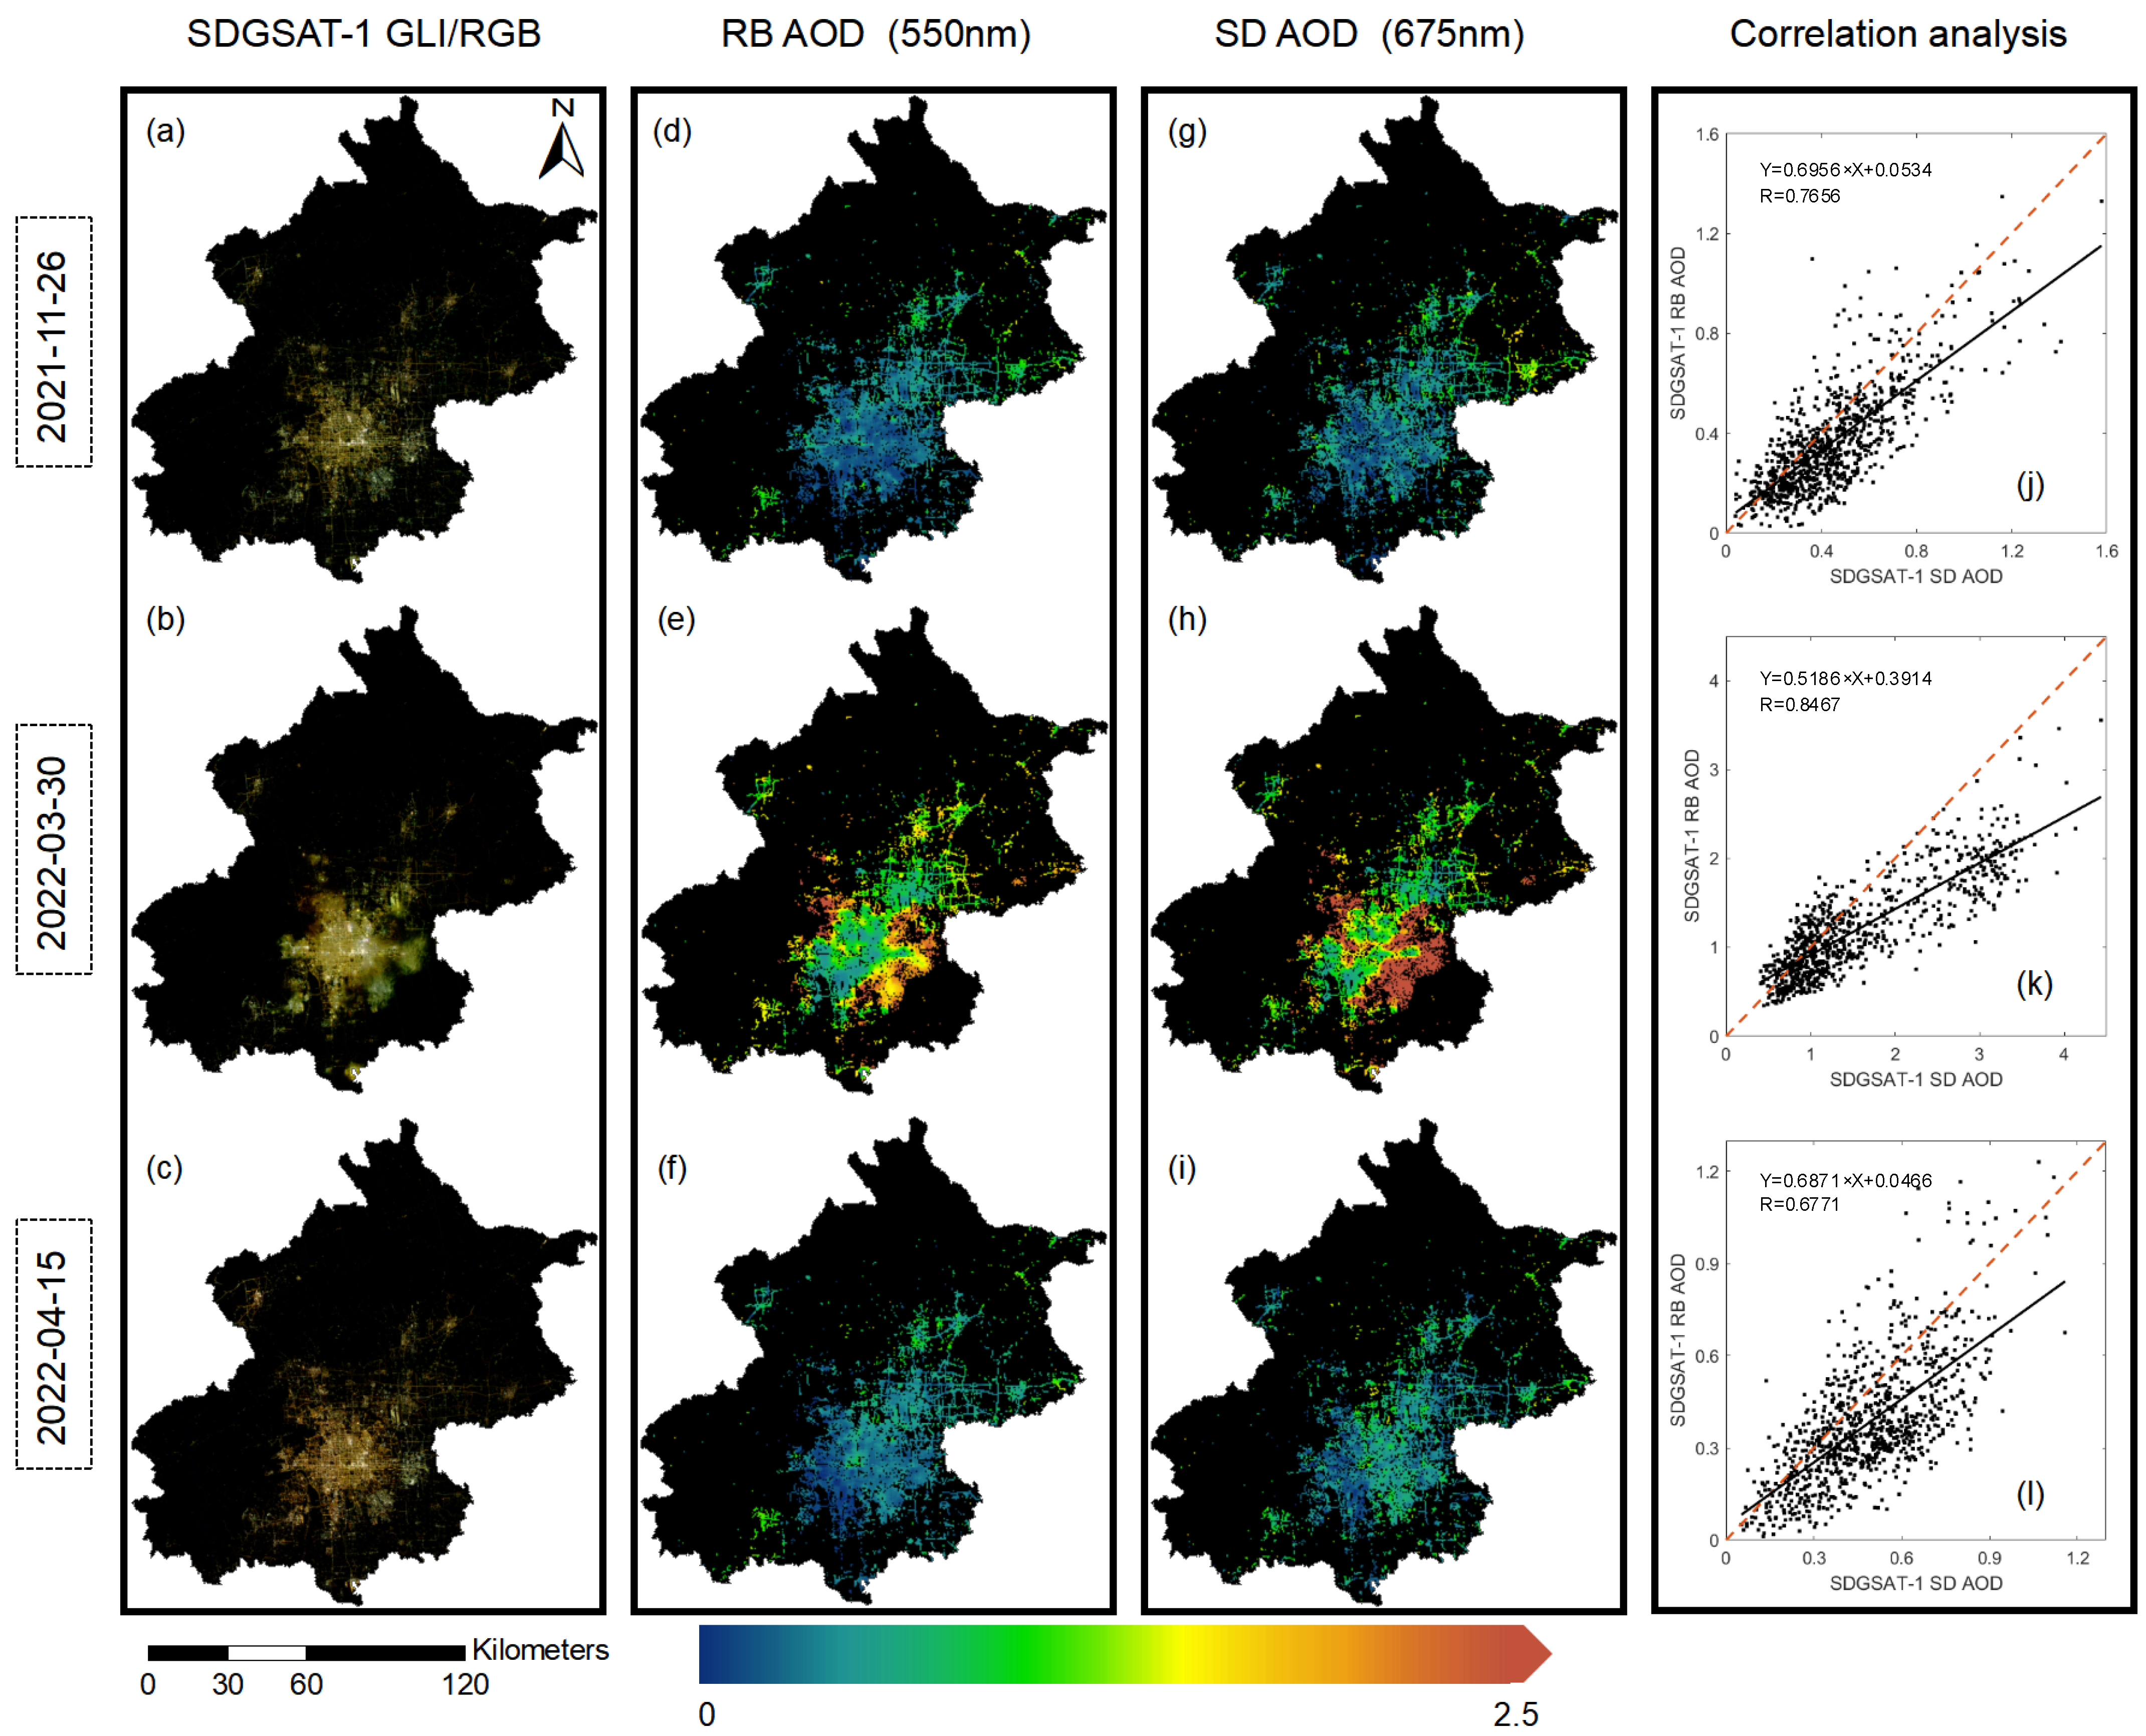
We compared the derived nighttime AOD results of Beijing from the SDGSAT-1 panchromatic low light images using RB and SD algorithms (Figure 6). Here, we selected the nighttime AOD to examine their spatial variations under three typical weather conditions, including the clear skies on 26 November 2021 and 15 April 2022 and the polluted sky on 30 March 2022. Figure 6d,i shows the spatial distribution of the AOD obtained by the two algorithms on 26 November 2021, 30 March 2022, and 15 April 2022. The spatial distribution of the AOD values obtained by the two algorithms is relatively consistent. We compared the AOD values obtained by the two inversion algorithms using a 3 × 3 filtering grid. For the same grid, the comparable inversion pixels were marked as the two inversion algorithms carried out, and the averaged AOD values were calculated when more than half of the pixels were identified. There is a good correlation between the AOD data from the SD and RB algorithms, with their correlation coefficient, R, ranging from 0.6782 to 0.8534. We quantified the overall difference in the AOD obtained by the RB and that obtained by the SD algorithm and found that the AOD values from the SD algorithm are larger than those from the RB algorithm, with their deviation being 52.18%, 38.29%, and 59.95%. According to the investigation of the true-color low light level image, the high AOD value on 30 March 2022 was possibly caused by some clouds or fog over urban area. There were similar patterns of AOD variation retrieved by the RB and SD methods, with a consistent position and degree of light blur in the color image (Figure 6). Clear skies, which were the conditions on 26 November 2021 and 15 April 2022, could provide more details on urban light, and they usually have low AOD values for understanding the spatial distribution of aerosols and urban air pollution.
4.2. The Verification of Satellite-Based AOD Using Nighttime AERONET Observations
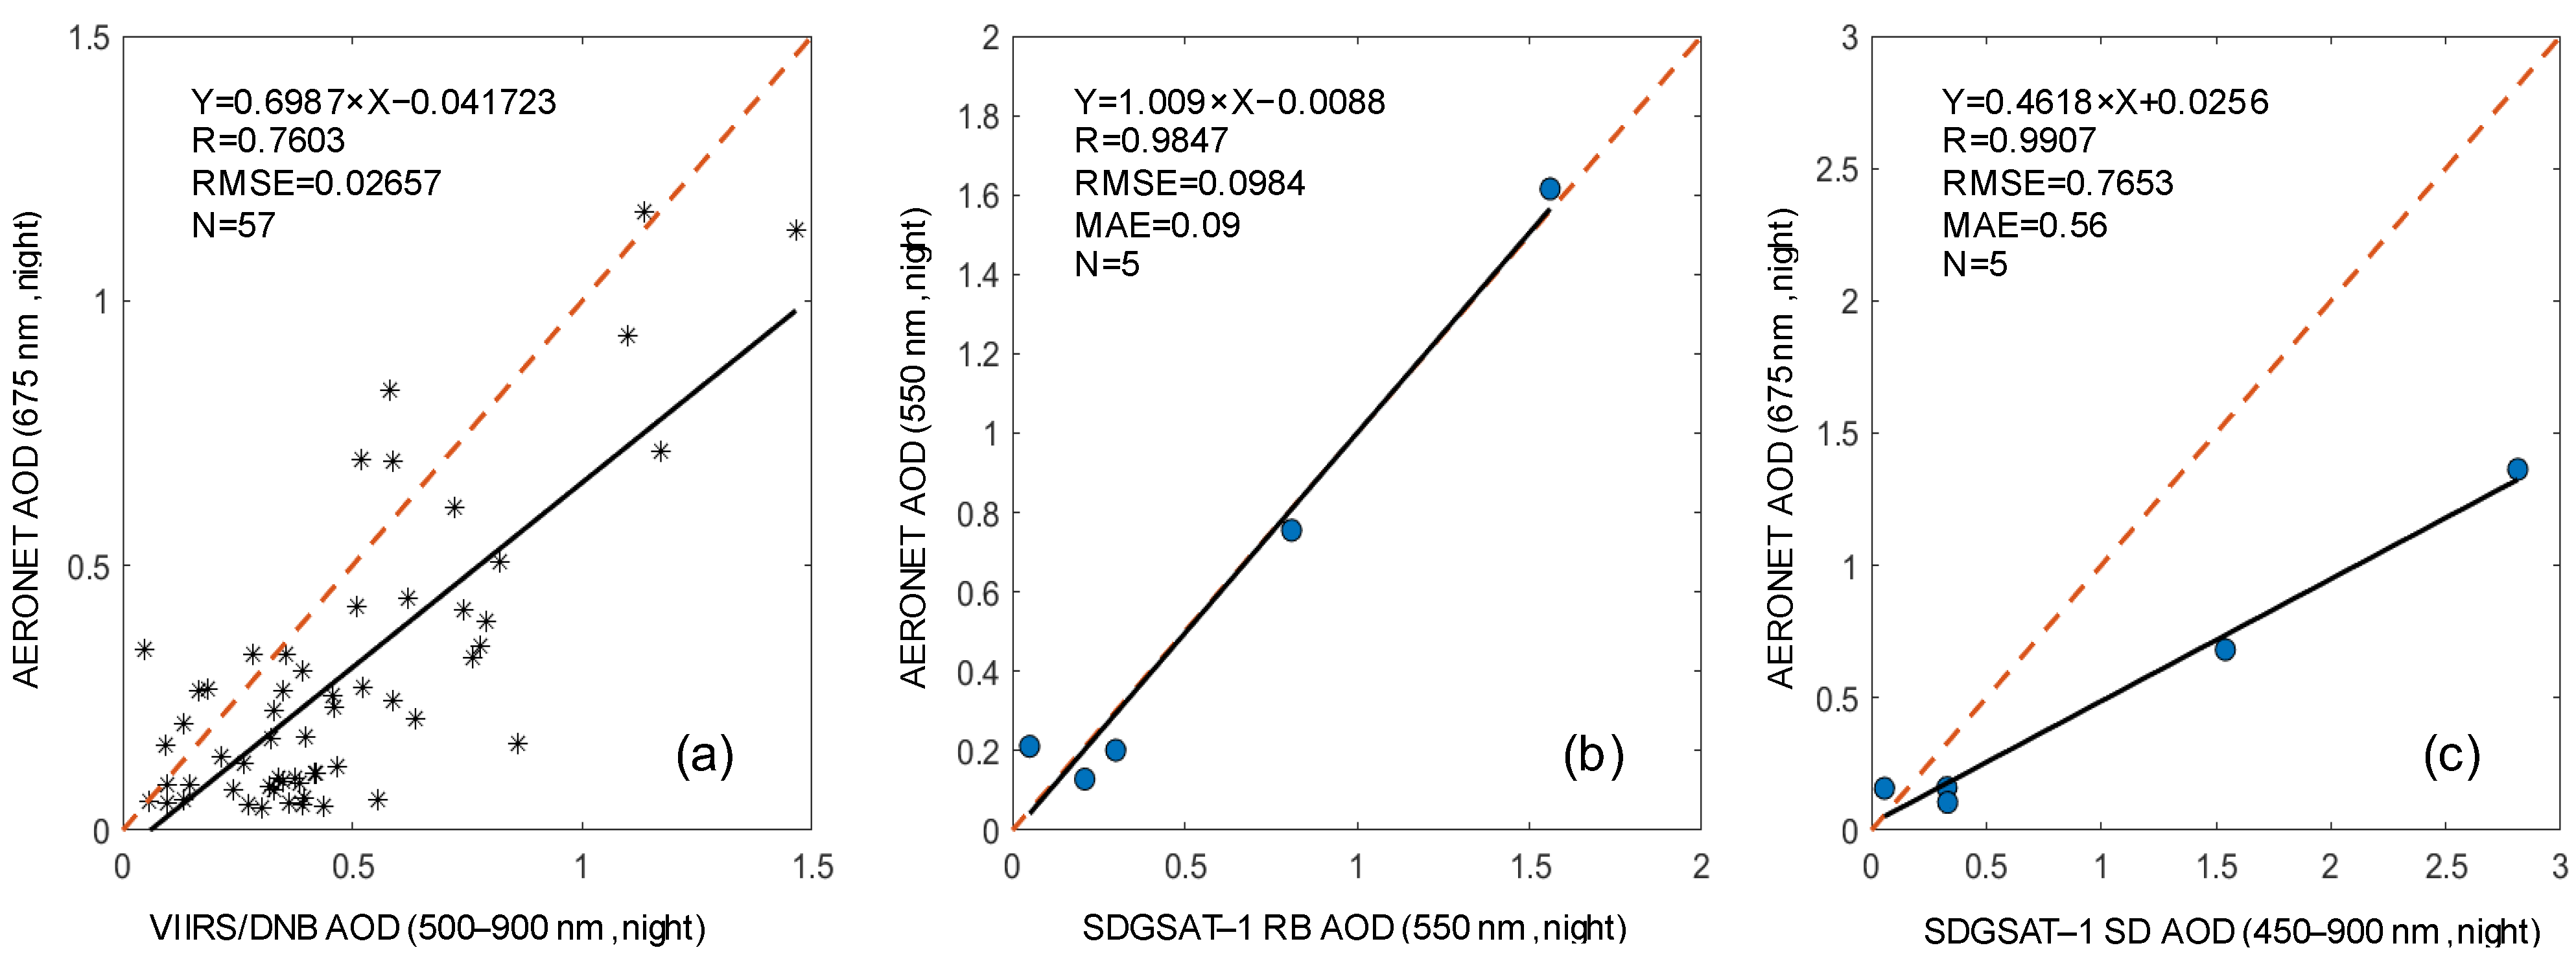
Observation records from AERONET stations are important data sources of surface verification in understanding the accuracy of aerosol retrieval results [38]. Beijing-CAMS, the AERONET station in the study area, can provide continuous AOD measurements at night. In order to eliminate the uncertainties, the mean value from a 3 × 3 grid close to the site was derived from a VIIRS/DNB image, then it was evaluated or verified using AERONET site data (Figure 7). We found that the Pearson correlation coefficient, R, reached 0.7603, which indicated that VIIRS/DNB has the ability to obtain AOD values at night (Figure 7a). Meanwhile, the derived AOD values from VIIRS/DNB are overestimated when AOD is lower than 0.5, which may be related to changes in background value, such as the increase of brightness of nightlight during holidays [34].
Due to the influence of the revisit cycle, amount of clouds, and changes in moon phase, there were limited AERONET AOD data to be used in a data verification analysis across all night stations during the study period. We conducted a correlation analysis of the AOD results from the SDGSAT-1/GLI images and observation records from Beijing-CAMS close to the satellite overpass. Figure 7b–c examined the difference in the AOD values derived from the SDGSAT-1/GLI images by the RB algorithm and SD algorithm and the reference data acquired by the AERONET site at night at 550 nm and 675 nm. The results show that the AOD inversion results of the two methods have a good correlation, with the observed values of the station and the correlation coefficients, R, reaching 0.9847 and 0.9907, respectively, indicating that the two algorithms can well capture the changing trend of AOD values. The RMSE obtained by the RB algorithm and SD algorithm were 0.0984 and 0.7653, respectively. The mean absolute error (MAE) can represent the absolute error of remote sensing inversion results. The MAE of is significantly smaller than that of (0.56) with a difference of 0.47. The AOD values obtained by the SD method are about twice the observed value from the AERONET site, while those obtained by the RB method are very close to the observed value from the AERONET site. Therefore, the inversion method based on RB has higher reliability for deriving AOD values than the SD method.
4.3. The Difference of AOD from SDGSAT/GLI and Daytime Stations
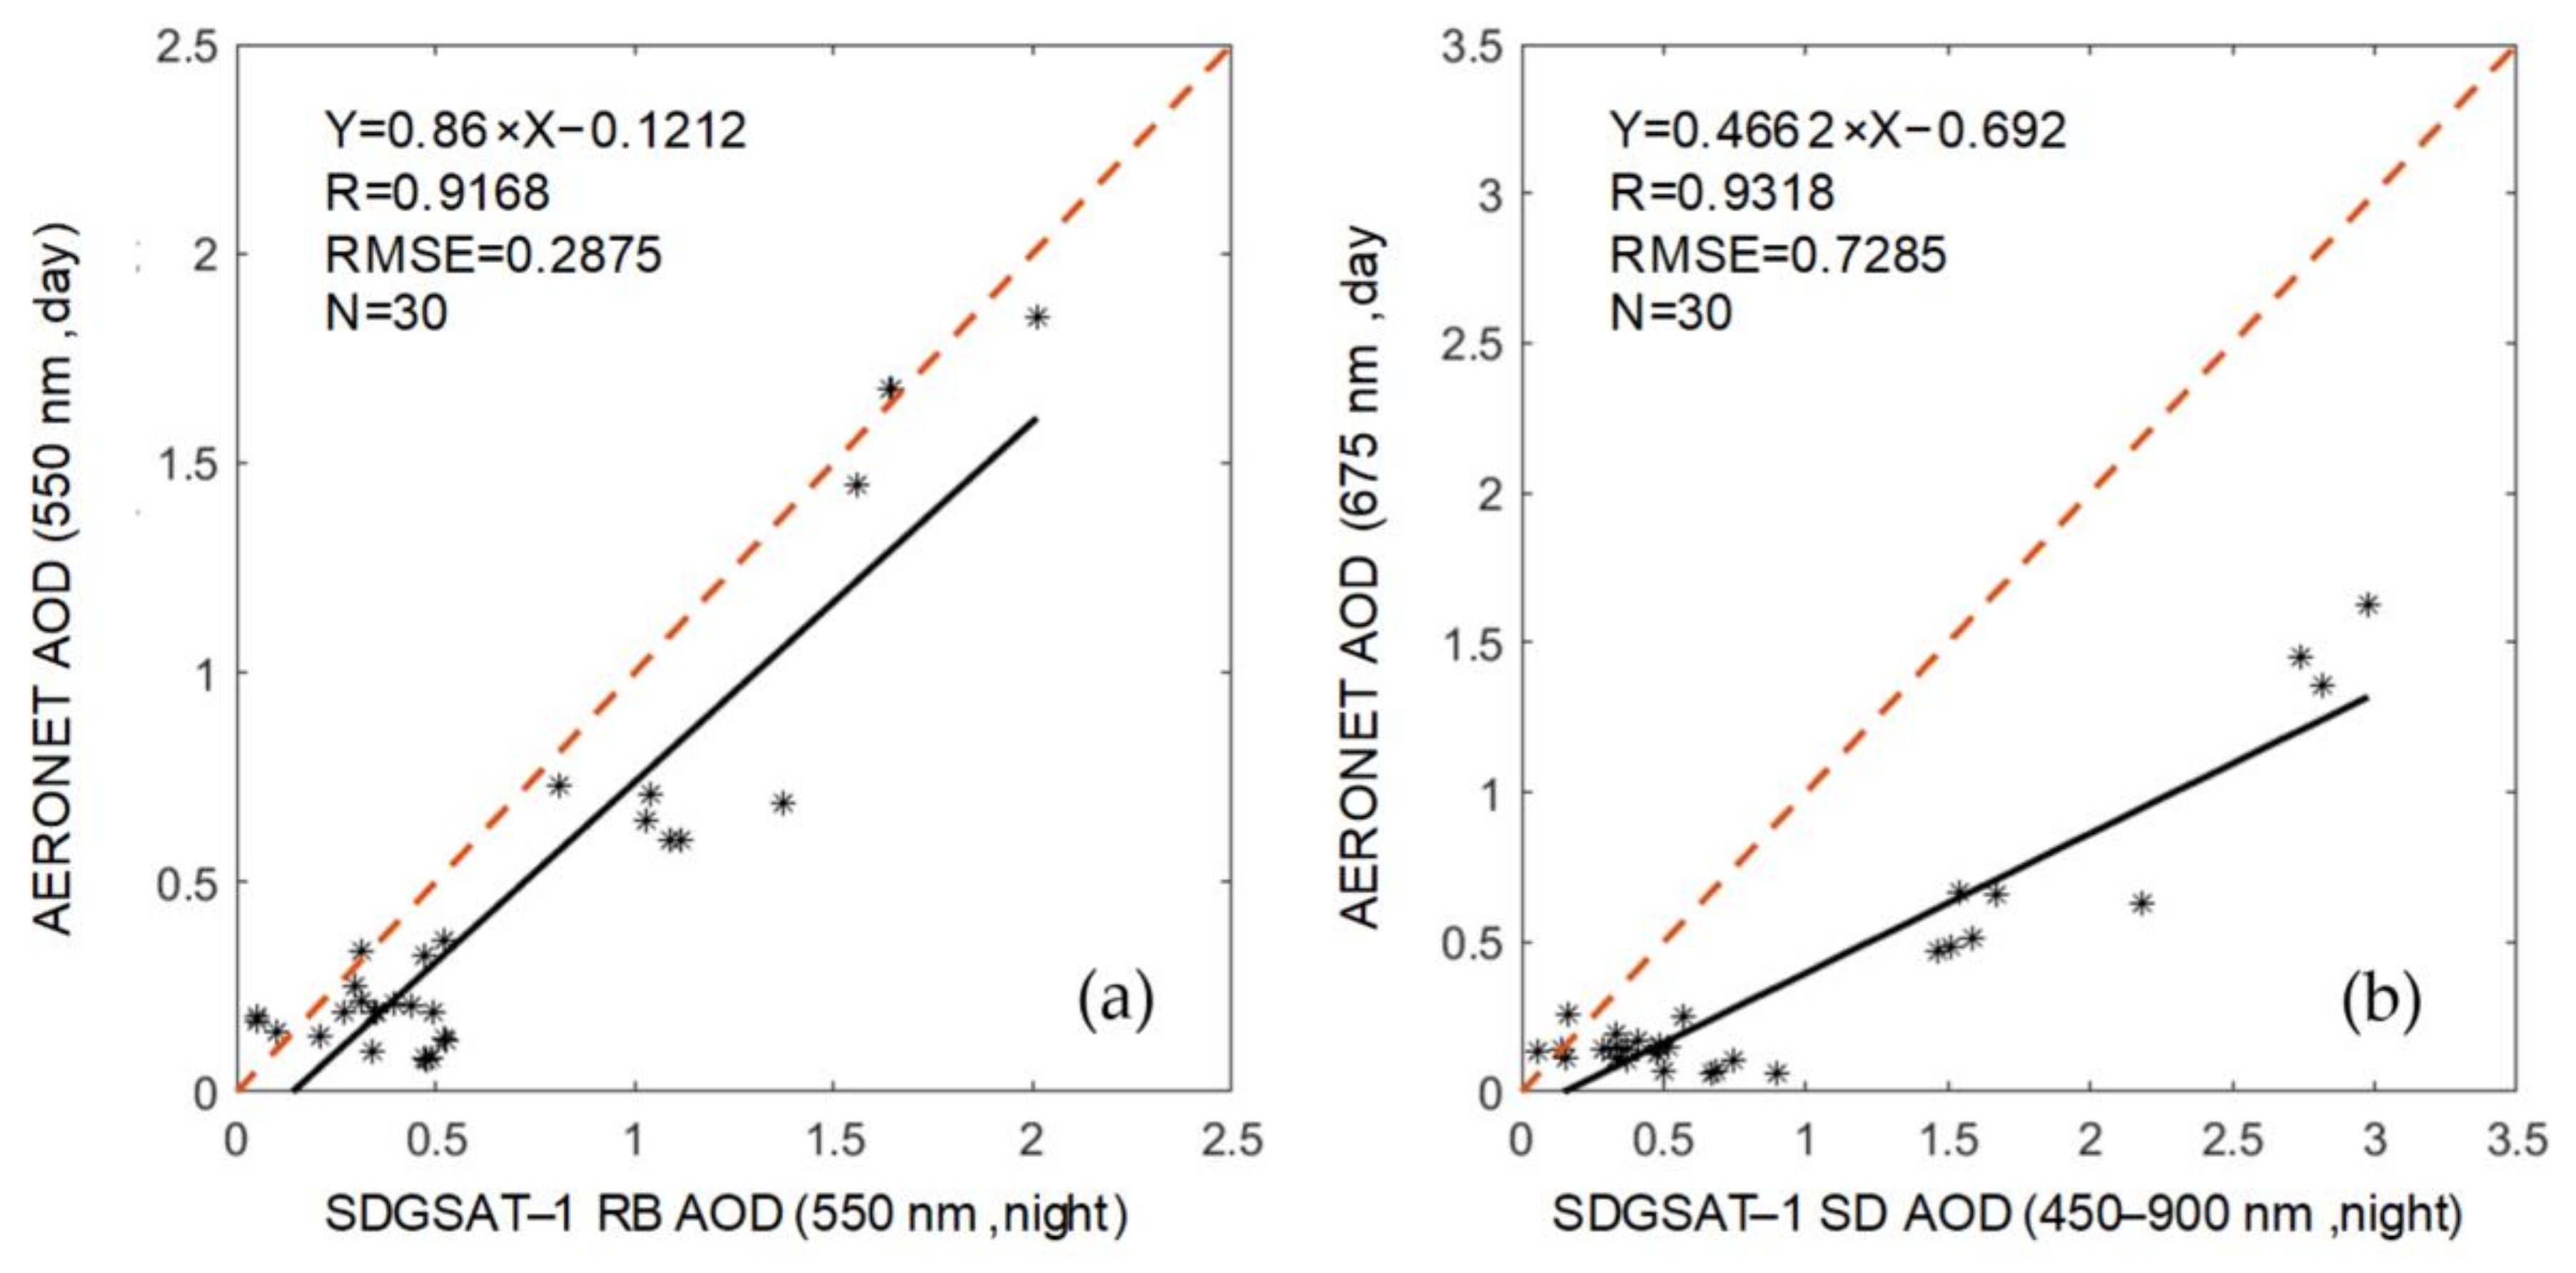
In order to collect more reference data for the verification analysis of the satellite-based AOD, we selected the AERONET AOD value of daytime observations before and after the satellite overpass, including the evening observation closest to the overpass and an observation of the next morning for daytime aerosol. Previous investigations suggested that the daytime AERONET AOD observations could be used to semi-quantitatively verify satellite-based nighttime AOD results, assuming the aerosol conditions during the night are relatively stable [21]. Therefore, the average value of the AERONET observation in the afternoon and the first observation in the morning of the next day was considered as the reference data for reducing possible uncertainties. Certainly, the AOD value was also influenced by cloud cover during the selected period, which may have caused larger AOD variations. Five daytime stations in Beijing were selected to conduct the verification (Figure 1a), and the results show that the satellite-based AOD using the SD algorithm is approximately twice the site-observed AOD from AERONET (Figure 8). We also found a similar phenomenon at night, with the slope of from SD and the nighttime AERONET AOD being 0.4618 (Figure 7c). McHardy et al. (2015) assume that the surface diffuse emission term () is spatially invariant in the SD algorithm, but that it will be affected by the ground light source, which may have a large impact on the SD algorithm [21,23].
5. Discussion
We could examine the spatial difference in the AOD values derived from the SDGSAT-1/GLI panchromatic bands using two inversion methods, and it was found that the RB algorithm based on the atmospheric radiative transfer model could capture more appropriate nighttime AOD than the SD algorithm could. The analysis of 999 cities in the Middle East by Zhang et al. (2019) shows that the slope from the correlation analysis between the derived AOD values from VIIRS/DNB and AERONET AOD values will increase from 0.36 to 0.61 after the correction of the surface diffuse emission term. Meanwhile, the slope between the derived AOD values from VIIRS/DNB and CALIOP AOD will also increase from 0.33 to 0.48. Another investigation in India also found that surface diffuse emission correction played an important role in reducing the deviation between the derived AOD values from VIIRS/DNB and AERONET AOD [23].
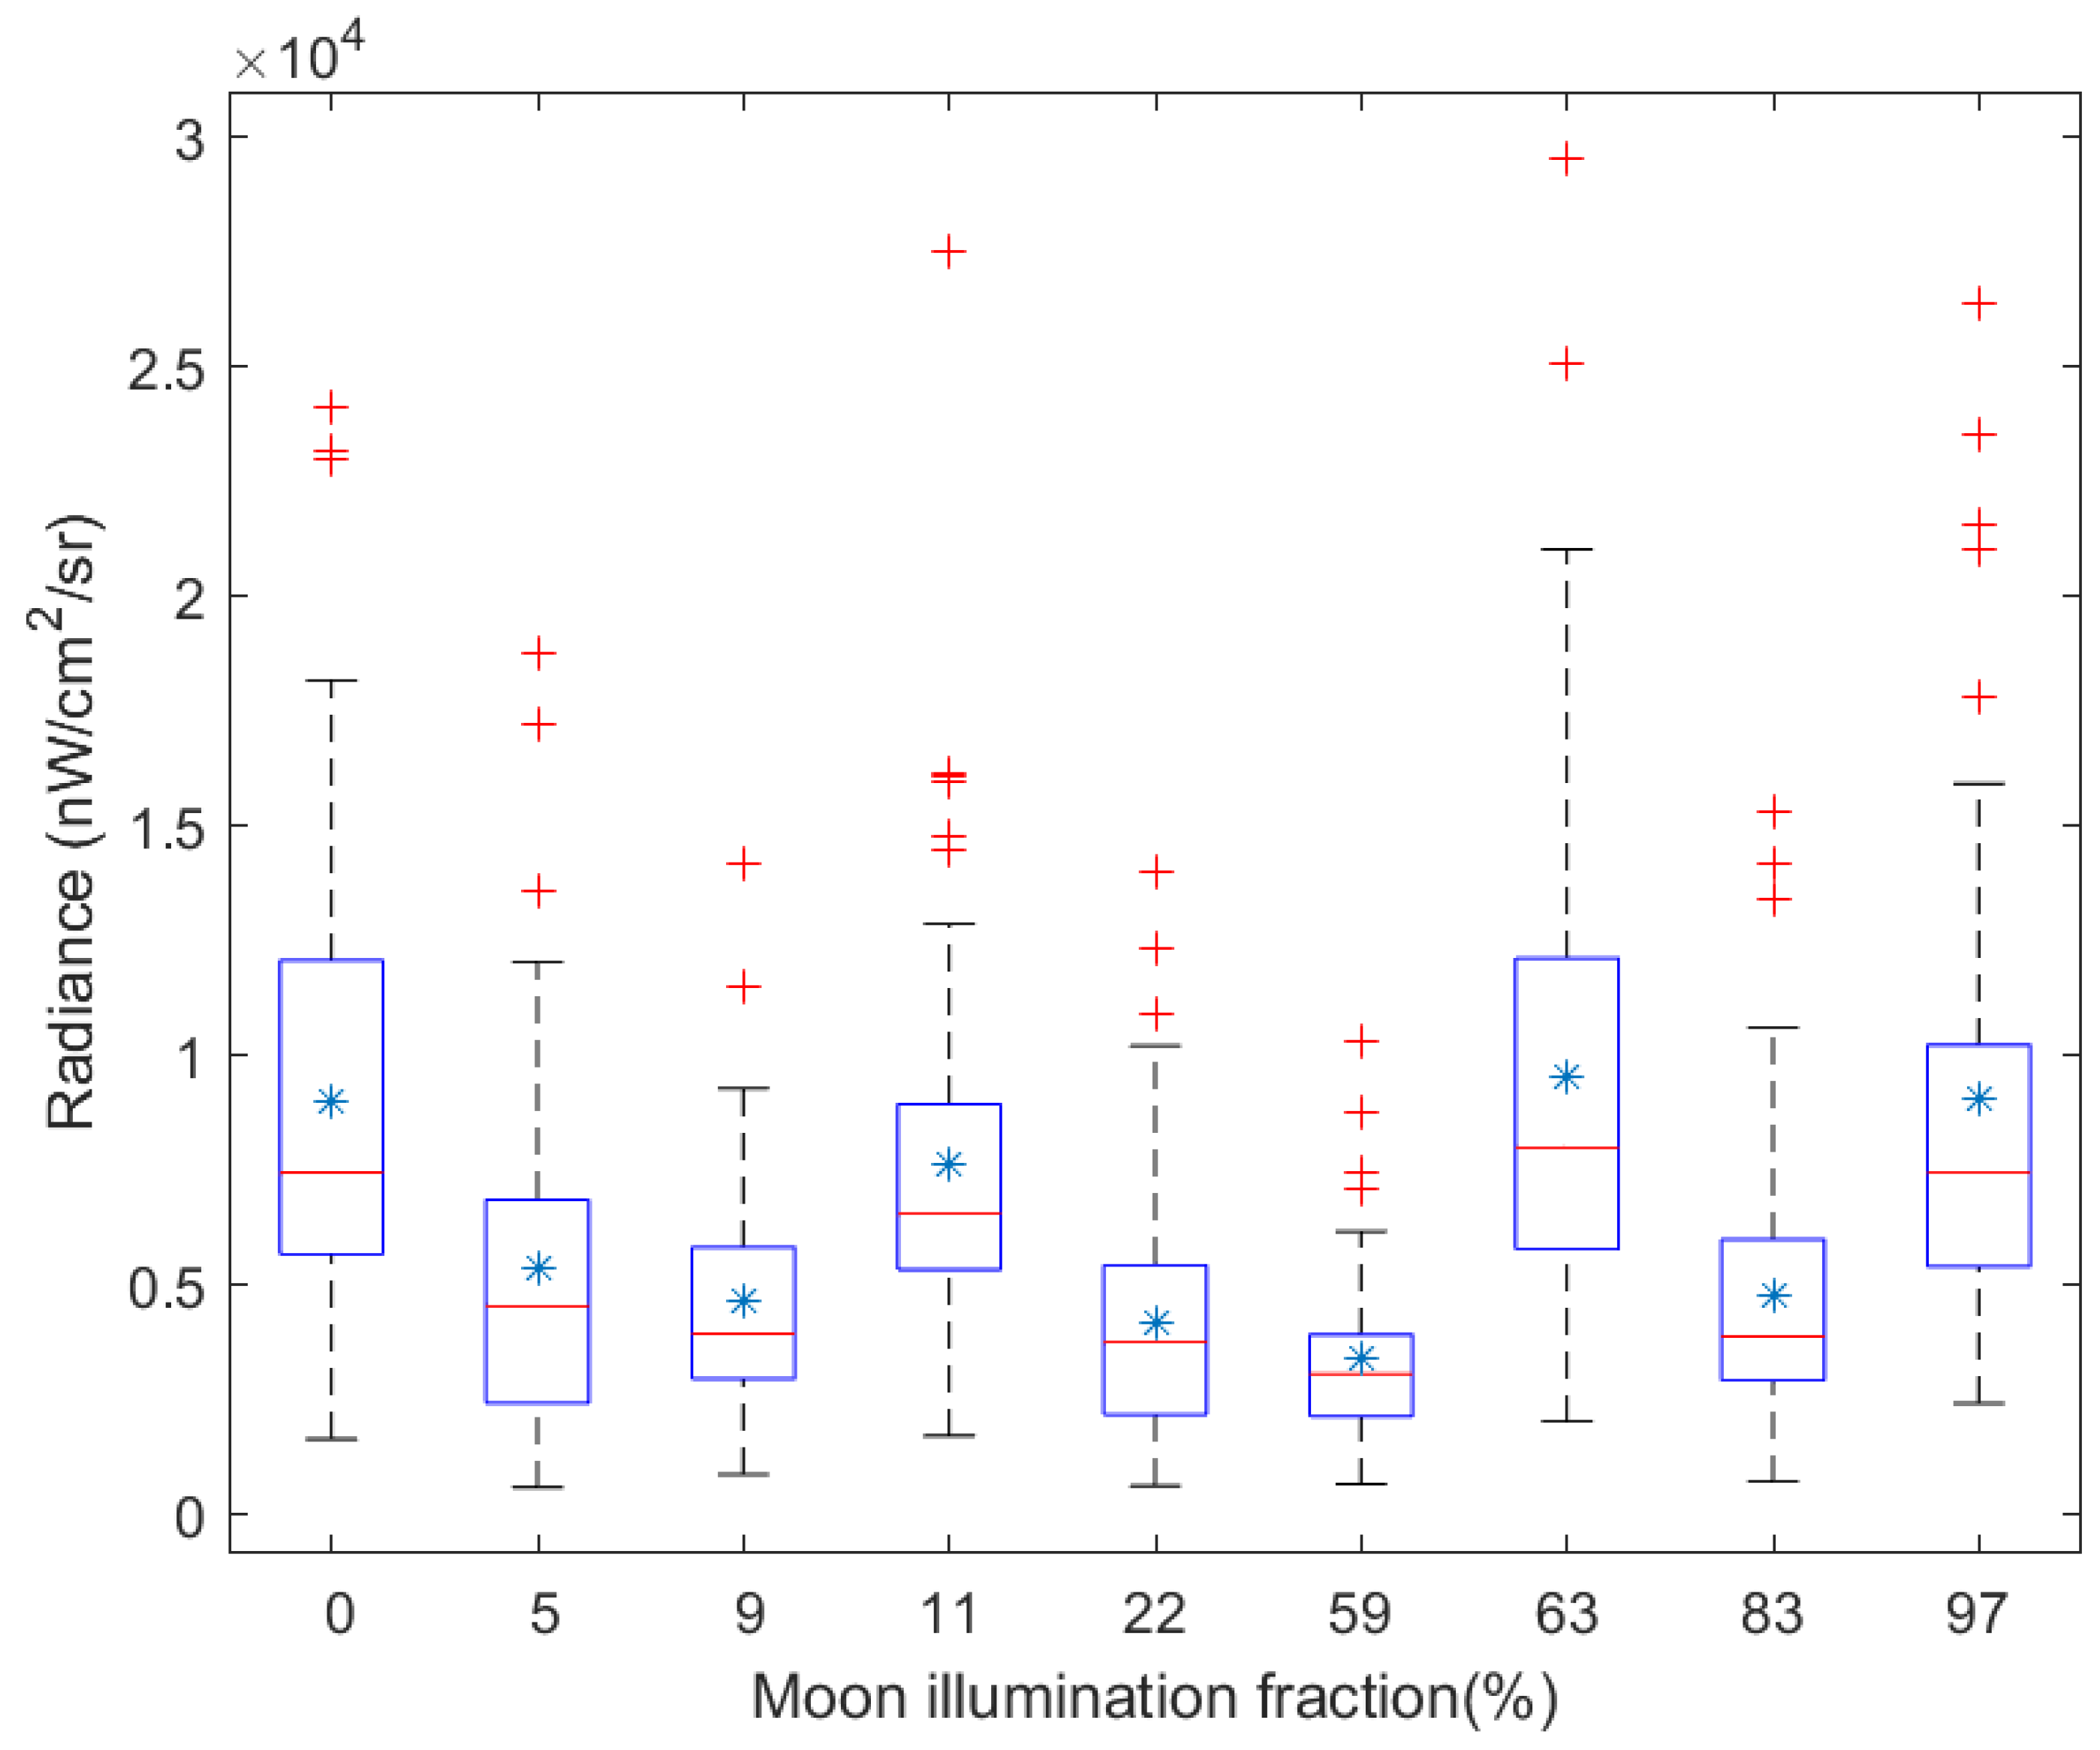
We examined the influence of moon illumination under different moon phase conditions on the derived AOD in the selected transection area (116.357–116.361°E, 39.711–40.118°N) across Beijing (Figure 9). Higher radiance was detected on 26 November 2021, 15 April 2022, 3 January 2022, and 4 February 2022 along with lunar illumination fraction of 63%, 97%, 0%, and 11%, respectively, while the lowest radiance was detected on 10 April 2022 with a 59% lunar illumination fraction. According to the variation patterns of the radiance under different moon phases, there was no correlation between the lunar illumination fraction and the mean radiances. The range of the statistical distribution of radiances of each day is positive related to the average radiance of the lights in the area, such as the largest radiance on 26 November 2021, with the highest average radiance of 0.95 × 10⁴ nW/cm2/sr (the height of the box in Figure 9). The magnitude of the change in radiance in the selected area is usually positively related to its discrete pattern, which suggests that the RB algorithm based on the radiance value and the SD algorithm based on the radiance standard deviation selected in this paper change by the sa,e amount under different atmospheric conditions [23,31].
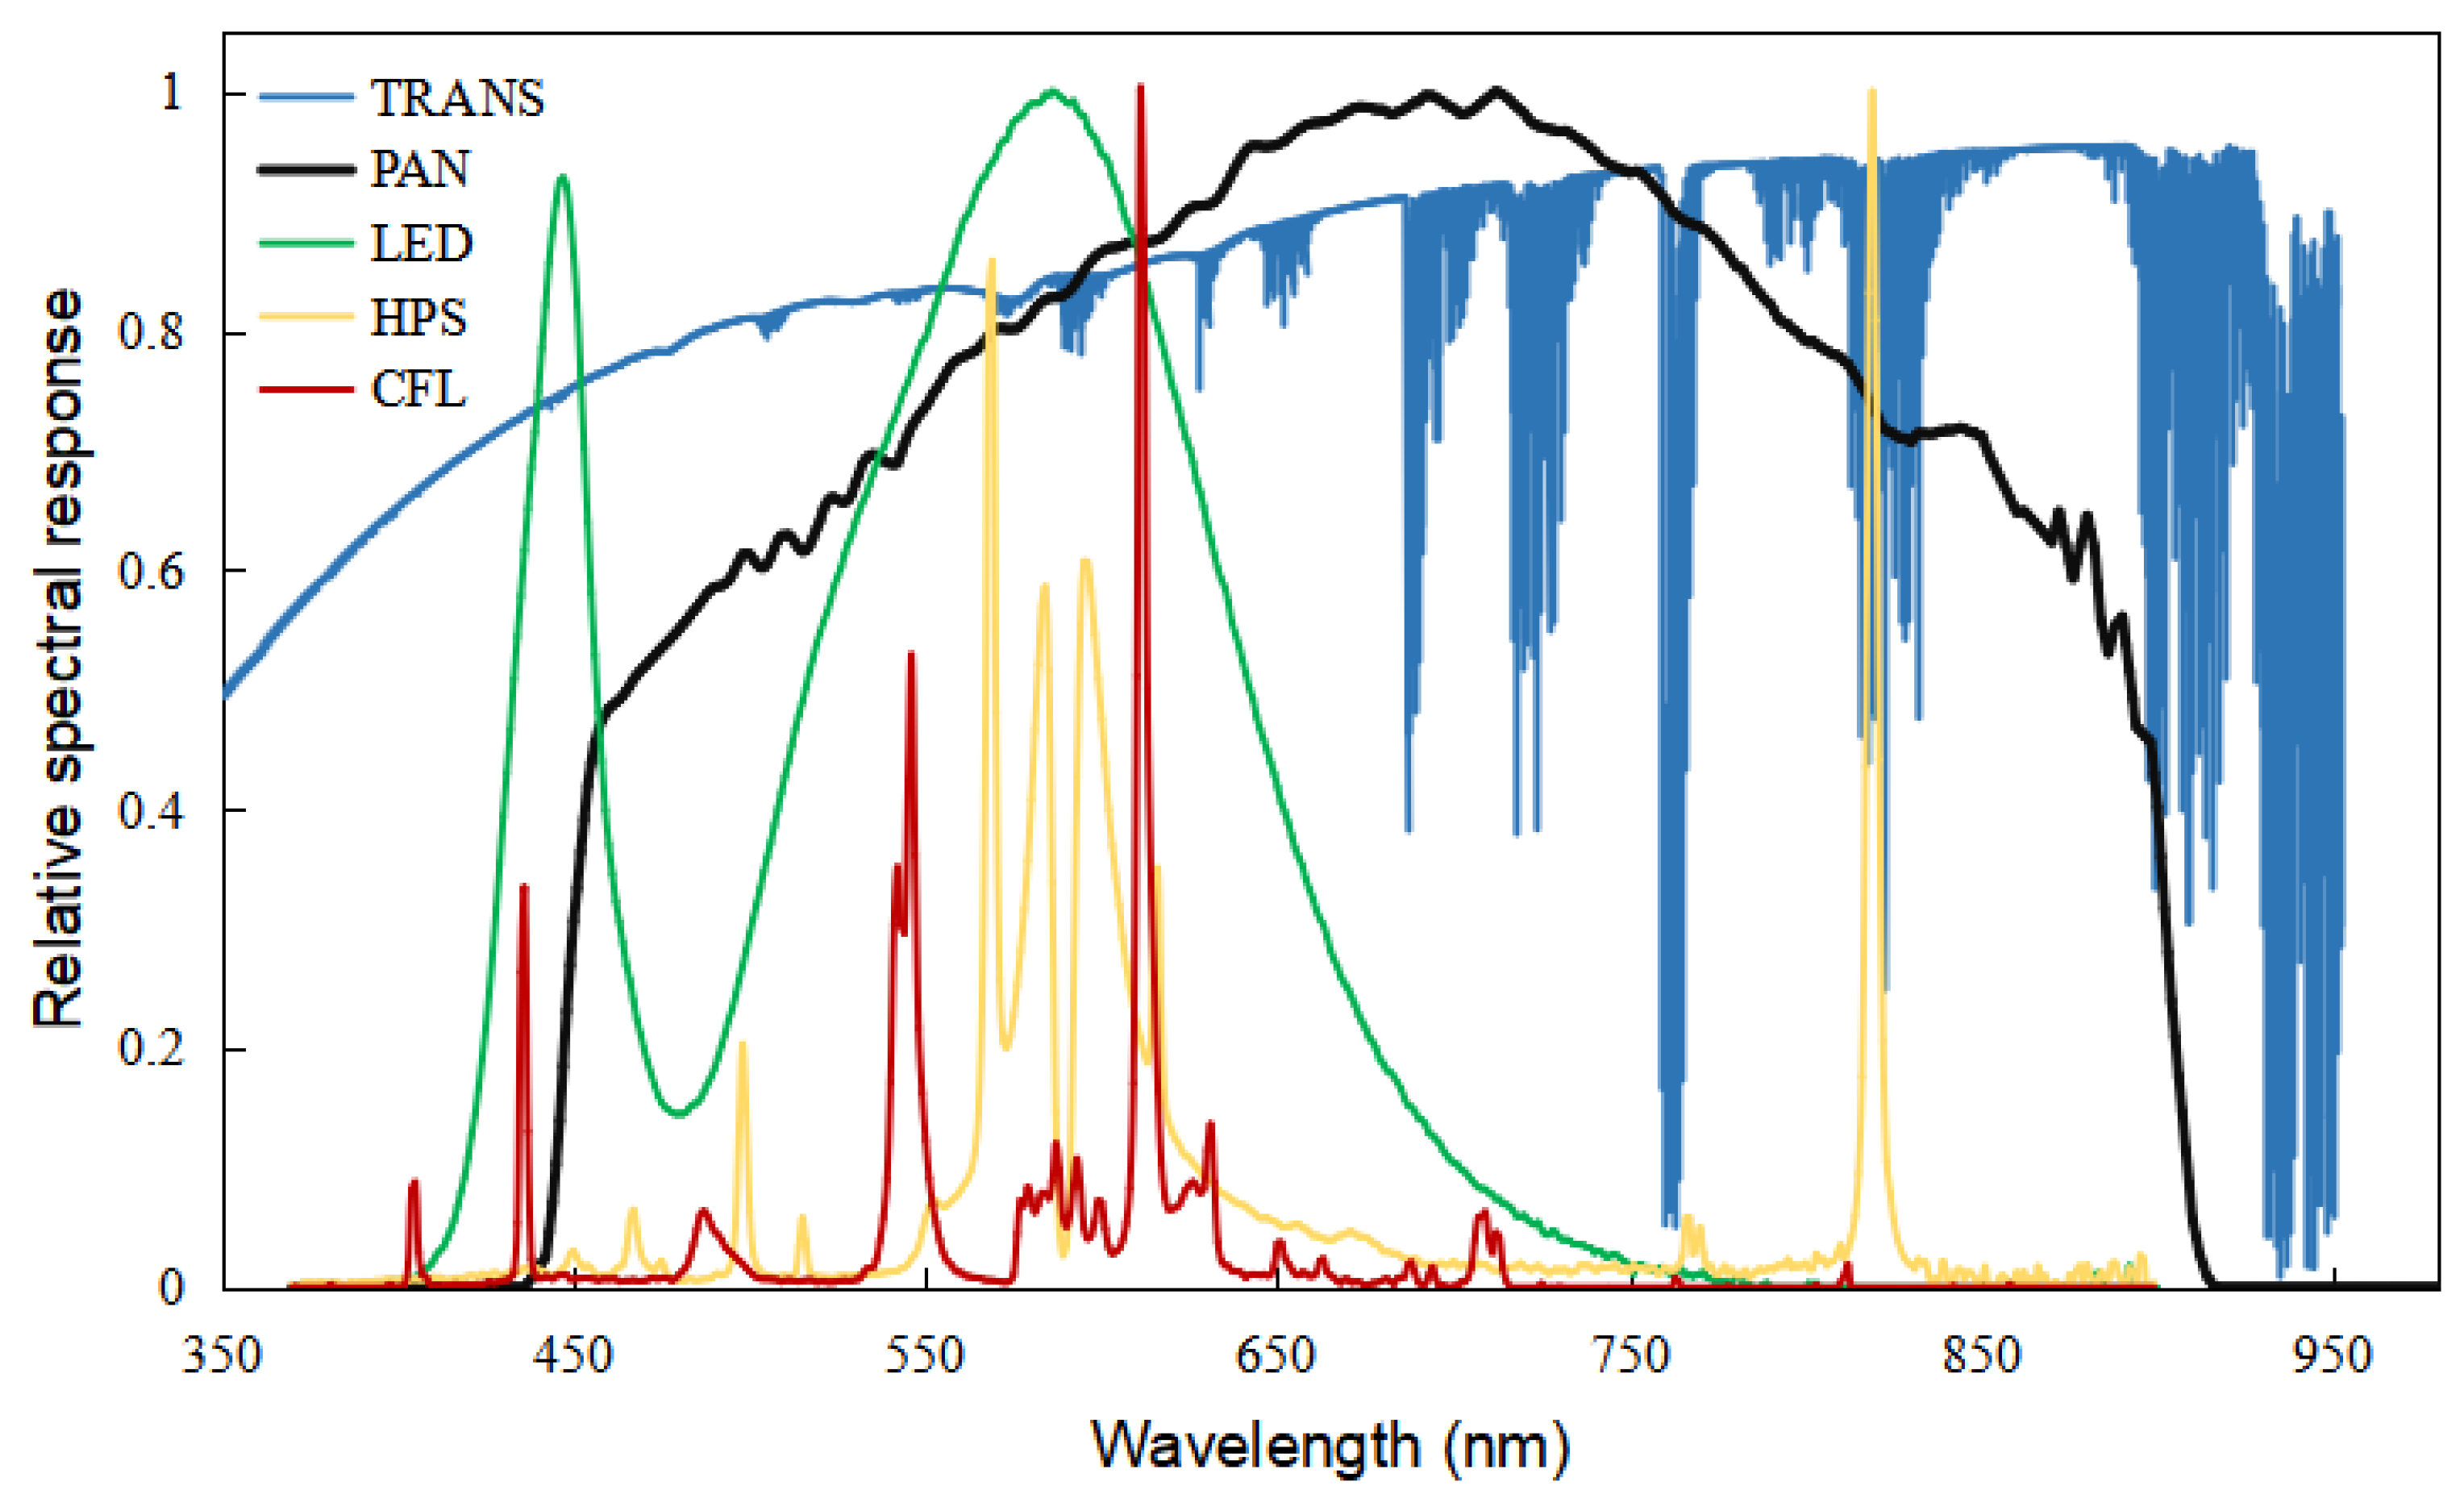
The spectrum of urban nightlight sources was investigated to better understand the potential impact of atmospheric absorption on the inversion results (Figure 10). We analyzed the difference in the atmospheric spectral transmittance from 350–950 nm (without aerosol), the spectral characterization of the three main light sources in cities, and the relative spectral response of the SDGSAT-1/GLI panchromatic bands. The spectral ranges of three main urban light sources mainly cover 300–700 nm, which means that a large part of the atmospheric absorption can be avoided in AOD inversion [39]. The light source datasets were collected from the light spectrum database (https://lspdd.org/app/en/home (accessed on 13 July 2022)). In addition, some trace gases, such as ozone and nitrogen dioxide, may slightly alter the derived AOD values in the aerosol retrieval processes [40,41]. This effect can be quantified by the detailed simulation of the atmospheric transfer model in combination with the reasonable atmospheric observations from the reanalysis datasets. An increase in water vapor will alter the size of aerosol particles, causing changes in the optical properties of aerosol [42], which will lead to changes in AOD values. We also found that the wavelengths of three main urban light sources mainly cover 450–700 nm. Therefore, the AOD obtained by the SD algorithm may not be accurate if we choose the central wavelength of the panchromatic band 675 nm to derive the AOD, and the characteristics of ground light sources may be one of the factors that make the SD algorithm overestimate the AOD.
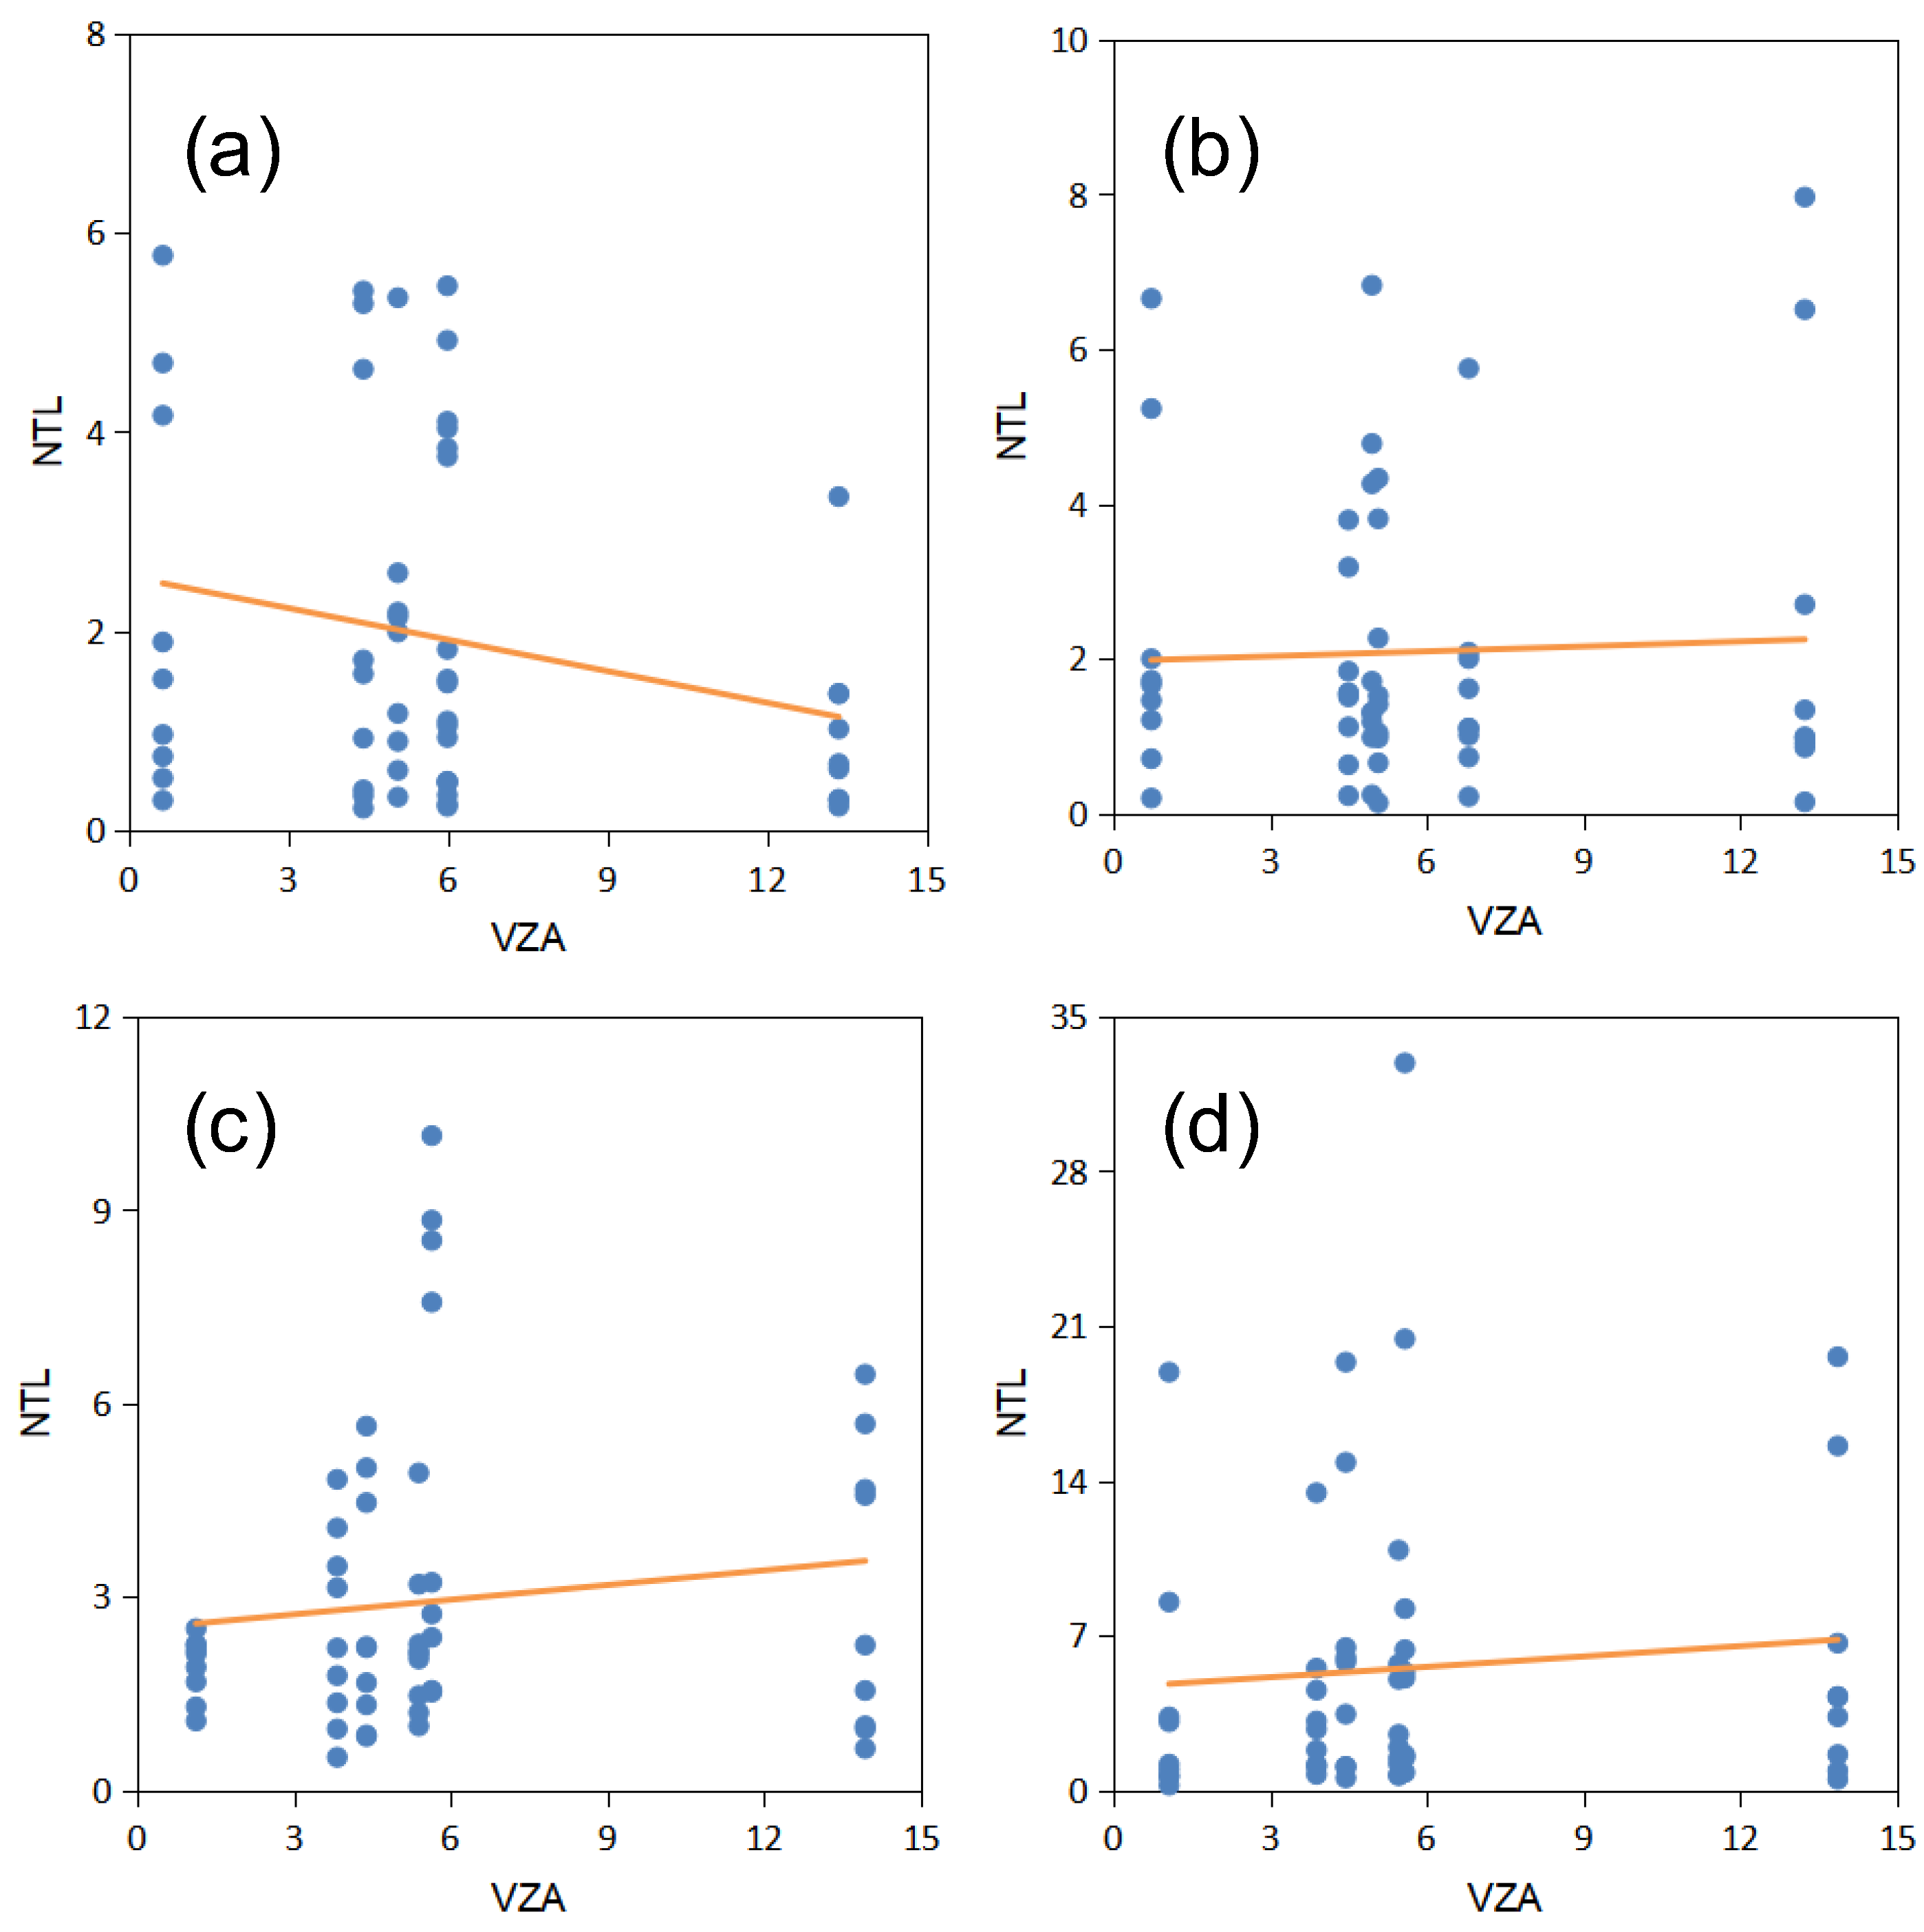
The satellite viewing zenith angle (VZA) usually has great impacts on the observation of NTL [4,43]. The investigation carried out by Tan et al. (2022) suggested that the change in light radiance at night was mainly caused by the blocking effect of buildings and the change in light visibility [44]. The ground lights observed from tall buildings are gradually blocked along with VZA increase, but more lights on the side of buildings will be detected. In order to explore the impact of the observation VZA on NTL, we selected radiance changes around four AERONET stations obtained from different observation zenith angles under clear weather (Figure 11). In order to reduce the possible uncertainties, 3 × 3 inversion windows were selected to derive the radiance around the inversion window of the station. Figure 11a shows that the light radiation observed by satellite decreases with the increase of the VZA at the Beijing-PKU station with a relatively strong blocking effect, while the positive angle effects could be detected over the other three sites with light radiance increases along with increases in the VZA, which indicates that the increased light radiance on the side of the buildings was greater than the blocked radiance. Therefore, the NTL data also need to be corrected according to the VZA for AOD derivation, even for the relatively small zenith angle range of SDGSAT-1/GLI. However, the difference or inconsistency in the angle’s effects between SDGSAT-1/GLI and VIIRS/DNB also suggest that the quantification of spatial resolution gaps and the detailed urban morphology used in the analysis of the relationship between NTL and VZA may be helpful for improving derived AOD results in the future.
Due to the lack of cloud detection, the visual inspection in our study did not perfectly distinguish cloud boundaries, especially those of thin and cirrus clouds. In order to implement AOD derivation at the regional or global scale, an automated cloud screening scheme needs to be conducted in place of the manual cloud screening performed in this study.
6. Conclusions
SDGSAT-1/GLI has provided the latest low-light images at a spatial resolution of 10 m, and these images were used in this study to detect detailed urban surface light and to monitor the optical aerosol depth at night. The nighttime AOD values in the mega-city area were derived using the SDGSAT-1/GLI panchromatic band data from November 2021 to May 2022 using RB and SD algorithms, respectively. The correlation coefficients, R, of the RB algorithm and SD algorithm with the night AERONET site were 0.9847 and 0.9907, respectively, while they slightly decreased to 0.9168 and 0.9318, respectively when the daytime AERONET site was used in the verification analysis. Both of the AOD inversion methods based on the SDGSAT-1 low light level data have a good correlation with the AOERONET AOD values used for verification. The RMSE of the radiance background method is 0.0984, and the RMSE of the standard deviation method is 0.7653. The radiance background method is better than the standard deviation method for AOD derivation using SDGSAT-1/GLI images. Generally, SDGSAT-1 low light data has the potential to provide high-resolution urban nighttime AOD data for studying the distribution characteristics and diurnal variation of nighttime aerosols. Compared with the VIIRS/DNB data, the SDGSAT-1 data could identify the details of abrupt bright spots at a local scale, such as those of rural areas and small roads. AOD values from SDGSAT-1/GLI were also of higher precision and higher resolution than the derived AOD values from VIIRS/DNB.
One aerosol type in our study (city-type aerosols) was included in the RB algorithm during the AOD analysis. This would have had a negative impact on the accuracy of the aerosol retrieval results. In the future, it is necessary to use ground-based observation data to build more aerosol models to improve the accuracy of aerosol inversion results. The algorithm for AOD derivation in our study was conducted based on urban night light images from SDGSAT-1. Theoretically, the latter cannot be used for the inversion of non-urban areas with limited or unstable night lights, such as sparse light areas in rural regions. Previous research has tried to develop a nighttime AOD inversion algorithm using moonlight in non-urban areas. This may be a better way to expand the application of SDGSAT-1/GLI data to derive nighttime AOD. This study investigated the ability to retrieve of nighttime AOD values from SDGSAT-1/GLI images using different inversion algorithms. Moreover, they can be used to obtain a larger scale and higher precision nighttime AOD value. Furthermore, RGB images from SDGSAT-1 GLI may play important roles in AOD value inversion in terms of reducing the dependence on multi-day synthetic background data.
Author Contributions
Conceptualization, Y.H. and N.W.; methodology, N.W., Y.H. and X.L.; formal analysis, N.W. and Y.H.; writing—original draft preparation, N.W.; writing—review and editing, Y.H., X.L., C.K., L.Y. and N.W.; supervision, Y.H. and X.L.; funding acquisition, X.L. and Y.H. All authors have read and agreed to the published version of the manuscript.
Funding
This research was funded by Hainan Provincial Natural Science Foundation of China (422CXTD532), the National Science Fund for Distinguished Young Scholars (42025605), and the CAS Strategic Priority Research Program (XDA19010402), the Innovative Research Program of the International Research Center of Big Data for Sustainable Development Goals (CBAS2022IRP05).
Data Availability Statement
The SDGSAT-1/GLI data were obtained from the International Research Center of Big Data for Sustainable Development Goals site (http://www.sdgsat.ac.cn/ (accessed on 1 August 2022)). NASA’s Black Marble data were obtained from the NASA LAADS site (https://ladsweb.modaps.eosdis.nasa.gov/ (accessed on 15 July 2022)). The AERONET data were obtained from the NASA AERONET website (https://aeronet.gsfc.nasa.gov/ (accessed on 9 September 2022)).
Acknowledgments
The authors would like to thank SDGSAT-1, AERONET, and NASA’s Black Marble team for providing the data. The authors would like to thank Zhenzhen Cui (Aerospace Information Research Institute, CAS) and Hongwei Zhang (Aerospace Information Research Institute, CAS) for their help in applying the MODTRAN radiative transfer model.
Conflicts of Interest
The authors declare no conflict of interest.
References
- Chen, J.; Cheng, B.; Zhang, X.; Long, T.; Chen, B.; Wang, G.; Zhang, D. A TIR-Visible Automatic Registration and Geometric Correction Method for SDGSAT-1 Thermal Infrared Image Based on Modified RIFT. Remote Sens. 2022, 14, 1393. [Google Scholar] [CrossRef]
- Guo, H.; Dou, C.; Chen, H.; Liu, J.B.; Fu, B.H.; Li, X.M.; Zou, Z.; Liang, D. SDGSAT-1: The world’s first scientific satellite for Sustainable Development Goals. Sci. Bull. 2022, 22, S2095–S9273. [Google Scholar] [CrossRef] [PubMed]
- Huadong, G.; Dong, L.; Fang, C.; Zhongchang, S.; Jie, L. Big Earth Data Facilitates Sustainable Development Goals. Bull. Chin. Acad. Sci. (Chin. Version) 2021, 36, 874–884. [Google Scholar]
- Levin, N.; Kyba, C.C.M.; Zhang, Q.; Sánchez De Miguel, A.; Román, M.O.; Li, X.; Portnov, B.A.; Molthan, A.L.; Jechow, A.; Miller, S.D.; et al. Remote sensing of night lights: A review and an outlook for the future. Remote Sens. Environ. 2020, 237, 111443. [Google Scholar] [CrossRef]
- Wei, X.; Chang, N.; Bai, K.; Gao, W. Satellite remote sensing of aerosol optical depth: Advances, challenges, and perspectives. Crit. Rev. Env. Sci. Tec. 2020, 50, 1640–1725. [Google Scholar] [CrossRef]
- Zhang, S.; Wu, J.; Fan, W.; Yang, Q.; Zhao, D. Review of aerosol optical depth retrieval using visibility data. Earth-Sci. Rev. 2020, 200, 102986. [Google Scholar] [CrossRef]
- Kambezidis, H.D.; Kaskaoutis, D.G. Aerosol climatology over four AERONET sites: An overview. Atmos. Environ. 2008, 42, 1892–1906. [Google Scholar] [CrossRef]
- Ranjan, A.K.; Patra, A.K.; Gorai, A.K. A Review on Estimation of Particulate Matter from Satellite-Based Aerosol Optical Depth: Data, Methods, and Challenges. Asia-Pac. J. Atmos. Sci. 2021, 57, 679–699. [Google Scholar] [CrossRef]
- Luo, Y.; Zheng, X.; Zhao, T.; Chen, J. A climatology of aerosol optical depth over China from recent 10 years of MODIS remote sensing data. Int. J. Climatol. 2014, 34, 863–870. [Google Scholar] [CrossRef]
- Levy, R.C.; Mattoo, S.; Munchak, L.A.; Remer, L.A.; Sayer, A.M.; Patadia, F.; Hsu, N.C. The Collection 6 MODIS aerosol products over land and ocean. Atmos. Meas. Tech. 2013, 6, 2989–3034. [Google Scholar] [CrossRef] [Green Version]
- Tao, M.; Li, R.; Wang, L.; Lan, F.; Wang, Z.; Tao, J.; Che, H.; Wang, L.; Chen, L. A critical view of long-term AVHRR aerosol data record in China: Retrieval frequency and heavy pollution. Atmos. Environ. 2020, 223, 117246. [Google Scholar] [CrossRef]
- Kahn, R.A.; Gaitley, B.J. An analysis of global aerosol type as retrieved by MISR. J. Geophys. Res. Atmos. 2015, 120, 4248–4281. [Google Scholar] [CrossRef]
- Hsu, N.C.; Gautam, R.; Sayer, A.M.; Bettenhausen, C.; Li, C.; Jeong, M.J.; Tsay, S.C.; Holben, B.N. Global and regional trends of aerosol optical depth over land and ocean using SeaWiFS measurements from 1997 to 2010. Atmos. Chem. Phys. 2012, 12, 8037–8053. [Google Scholar] [CrossRef] [Green Version]
- Zhang, J.; Spurr, R.J.D.; Reid, J.S.; Xian, P.; Colarco, P.R.; Campbell, J.R.; Hyer, E.J.; Baker, N.L. Development of an Ozone Monitoring Instrument (OMI) aerosol index (AI) data assimilation scheme for aerosol modeling over bright surfaces—A step toward direct radiance assimilation in the UV spectrum. Geosci. Model Dev. 2021, 14, 27–42. [Google Scholar] [CrossRef]
- Zhang, J.; Campbell, J.R.; Reid, J.S.; Westphal, D.L.; Baker, N.L.; Campbell, W.F.; Hyer, E.J. Evaluating the impact of assimilating CALIOP-derived aerosol extinction profiles on a global mass transport model. Geophys. Res. Lett. 2011, 38. [Google Scholar] [CrossRef] [Green Version]
- Zhang, J.; Campbell, J.R.; Hyer, E.J.; Reid, J.S.; Westphal, D.L.; Johnson, R.S. Evaluating the impact of multisensor data assimilation on a global aerosol particle transport model. J. Geophys. Res. Atmos. 2014, 119, 4674–4689. [Google Scholar] [CrossRef]
- Li, Z.; Zhao, X.; Kahn, R.; Mishchenko, M.; Remer, L.; Lee, K.H.; Wang, M.; Laszlo, I.; Nakajima, T.; Maring, H. Uncertainties in satellite remote sensing of aerosols and impact on monitoring its long-term trend: A review and perspective. Ann. Geophys. 2009, 27, 2755–2770. [Google Scholar] [CrossRef]
- Wang, J.; Zhou, M.; Xu, X.; Roudini, S.; Sander, S.P.; Pongetti, T.J.; Miller, S.D.; Reid, J.S.; Hyer, E.; Spurr, R. Development of a nighttime shortwave radiative transfer model for remote sensing of nocturnal aerosols and fires from VIIRS. Remote Sens. Environ. 2020, 241, 111727. [Google Scholar] [CrossRef]
- Schutgens, N.; Sayer, A.M.; Heckel, A.; Hsu, C.; Jethva, H.; de Leeuw, G.; Leonard, P.J.T.; Levy, R.C.; Lipponen, A.; Lyapustin, A.; et al. An AeroCom–AeroSat study: Intercomparison of satellite AOD datasets for aerosol model evaluation. Atmos. Chem. Phys. 2020, 20, 12431–12457. [Google Scholar] [CrossRef]
- Johnson, R.S.; Zhang, J.; Hyer, E.J.; Miller, S.D.; Reid, J.S. Preliminary investigations toward nighttime aerosol optical depth retrievals from the VIIRS Day/Night Band. Atmos. Meas. Tech. 2013, 6, 1245–1255. [Google Scholar] [CrossRef] [Green Version]
- McHardy, T.M.; Zhang, J.; Reid, J.S.; Miller, S.D.; Hyer, E.J.; Kuehn, R.E. An improved method for retrieving nighttime aerosol optical thickness from the VIIRS Day/Night Band. Atmos. Meas. Tech. 2015, 8, 4773–4783. [Google Scholar] [CrossRef] [Green Version]
- Wang, J.; Aegerter, C.; Xu, X.; Szykman, J.J. Potential application of VIIRS Day/Night Band for monitoring nighttime surface PM 2.5 air quality from space. Atmos. Environ. 2016, 124, 55–63. [Google Scholar] [CrossRef] [Green Version]
- Zhang, J.; Jaker, S.L.; Reid, J.S.; Miller, S.D.; Solbrig, J.; Toth, T.D. Characterization and application of artificial light sources for nighttime aerosol optical depth retrievals using the Visible Infrared Imager Radiometer Suite Day/Night Band. Atmos. Meas. Tech. 2019, 12, 3209–3222. [Google Scholar] [CrossRef] [Green Version]
- Zhou, M.; Wang, J.; Chen, X.; Xu, X.; Colarco, P.R.; Miller, S.D.; Reid, J.S.; Kondragunta, S.; Giles, D.M.; Holben, B. Nighttime smoke aerosol optical depth over U.S. rural areas: First retrieval from VIIRS moonlight observations. Remote Sens. Environ. 2021, 267, 112717. [Google Scholar] [CrossRef]
- Li, H.; Hu, S.; Ma, S.; Tan, Z.; Ai, W.; Yan, W. Retrieving nighttime aerosol optical depth using combined measurements of satellite low light channels and ground-based integrating spheres. Int. J. Remote Sens. 2022, ahead-of-print. 1–13. [Google Scholar] [CrossRef]
- Jiang, M.D.; Chen, L.; He, Y.Q.; Hu, X.Q.; Liu, M.Q.; Zhang, P. Nighttime aerosol optical depth retrievals from VIIRS day/night band data. Natl. Remote Sens. Bull. 2022, 3, 493–504. [Google Scholar]
- Zhang, J.; Reid, J.S.; Miller, S.D.; Turk, F.J. Strategy for studying nocturnal aerosol optical depth using artificial lights. Int. J. Remote Sens. 2008, 29, 4599–4613. [Google Scholar] [CrossRef]
- Barreto, Á.; Cuevas, E.; Granados-Muñoz, M.; Alados-Arboledas, L.; Romero, P.M.; Gröbner, J.; Kouremeti, N.; Almansa, A.F.; Stone, T.; Toledano, C.; et al. The new sun-sky-lunar Cimel CE318-T multiband photometer—A comprehensive performance evaluation. Atmos. Meas. Tech. 2016, 9, 631–654. [Google Scholar] [CrossRef] [Green Version]
- Bian, Y.; Xu, W.; Hu, Y.; Tao, J.; Kuang, Y.; Zhao, C. Method to retrieve aerosol extinction profiles and aerosol scattering phase functions with a modified CCD laser atmospheric detection system. Opt. Express 2020, 28, 6631. [Google Scholar] [CrossRef]
- Winker, D.M.; Vaughan, M.A.; Omar, A.; Hu, Y.; Powell, K.A.; Liu, Z.; Hunt, W.H.; Young, S.A. Overview of the CALIPSO Mission and CALIOP Data Processing Algorithms. J. Atmos. Ocean. Tech. 2009, 26, 2310–2323. [Google Scholar] [CrossRef]
- Zhang, J.; Reid, J.S.; Miller, S.D.; Román, M.; Wang, Z.; Spurr, R.J.; Jaker, S. Sensitivity studies of nighttime TOA radiances from artificial light sources using a 3-D radiative transfer model for nighttime aerosol retrievals. Atmos. Meas. Tech. Discuss. 2022, 2022, 1–28. [Google Scholar]
- Wang, M.; Zhang, X.; Yan, X. Modeling the climatic effects of urbanization in the Beijing–Tianjin–Hebei metropolitan area. Theor. Appl. Clim. 2013, 113, 377–385. [Google Scholar] [CrossRef]
- Zhao, C.; Liu, Z.; Wang, Q.; Ban, J.; Chen, N.X.; Li, T. High-resolution daily AOD estimated to full coverage using the random forest model approach in the Beijing-Tianjin-Hebei region. Atmos. Environ. 2019, 203, 70–78. [Google Scholar] [CrossRef]
- Li, T.; Zhu, Z.; Wang, Z.; Román, M.O.; Kalb, V.L.; Zhao, Y. Continuous monitoring of nighttime light changes based on daily NASA’s Black Marble product suite. Remote Sens. Environ. 2022, 282, 113269. [Google Scholar] [CrossRef]
- Román, M.O.; Wang, Z.; Sun, Q.; Kalb, V.; Miller, S.D.; Molthan, A.; Schultz, L.; Bell, J.; Stokes, E.C.; Pandey, B.; et al. NASA’s Black Marble nighttime lights product suite. Remote Sens. Environ. 2018, 210, 113–143. [Google Scholar] [CrossRef]
- Giles, D.M.; Sinyuk, A.; Sorokin, M.G.; Schafer, J.S.; Smirnov, A.; Slutsker, I.; Eck, T.F.; Holben, B.N.; Lewis, J.R.; Campbell, J.R.; et al. Advancements in the Aerosol Robotic Network (AERONET) Version 3 database—Automated near-real-time quality control algorithm with improved cloud screening for Sun photometer aerosol optical depth (AOD) measurements. Atmos. Meas. Tech. 2019, 12, 169–209. [Google Scholar] [CrossRef] [Green Version]
- Otsu, N. A Tlreshold Selection Method from Gray-Level Histograms. IEEE Trans. Syst. 1979, 9, 61–66. [Google Scholar]
- Xie, Y.Q.; Li, Z.Q.; Hou, W.Z. Aerosol optical depth retrieval over land using data from AGRI onboard FY-4A. Natl. Remote Sens. Bull. 2022, 5, 913–922. [Google Scholar]
- Cao, C.; Zhang, B.; Xia, F.; Bai, Y. Exploring VIIRS Night Light Long-Term Time Series with CNN/SI for Urban Change Detection and Aerosol Monitoring. Remote Sens. 2022, 14, 3126. [Google Scholar] [CrossRef]
- Veefkind, J.P.; Boersma, K.F.; Wang, J.; Kurosu, T.P.; Krotkov, N.; Chance, K.; Levelt, P.F. Global satellite analysis of the relation between aerosols and short-lived trace gases. Atmos. Chem. Phys. 2011, 11, 1255–1267. [Google Scholar] [CrossRef] [Green Version]
- Levy, R.C.; Remer, L.A.; Mattoo, S.; Vermote, E.F.; Kaufman, Y.J. Second-generation operational algorithm: Retrieval of aerosol properties over land from inversion of Moderate Resolution Imaging Spectroradiometer spectral reflectance. J. Geophys. Res. Atmos. 2007, 112, D13211. [Google Scholar] [CrossRef] [Green Version]
- Xiang, J.; Tao, M.H.; Guo, L.; Chen, L.F.; Tao, J.H.; Gui, L. Progress of near-surface PM2.5 concentration retrieve based on satellite remote sensing. Natl. Remote Sens. Bull. 2022, 9, 1757–1776. [Google Scholar]
- Li, X.; Ma, R.; Zhang, Q.; Li, D.; Liu, S.; He, T.; Zhao, L. Anisotropic characteristic of artificial light at night—Systematic investigation with VIIRS DNB multi-temporal observations. Remote Sens. Environ. 2019, 233, 111357. [Google Scholar] [CrossRef]
- Tan, X.; Zhu, X.; Chen, J.; Chen, R. Modeling the direction and magnitude of angular effects in nighttime light remote sensing. Remote Sens. Environ. 2022, 269, 112834. [Google Scholar] [CrossRef]
Figure 1.
The location of the study area (Beijing) and the night light image of it acquired by SDGSAT-1. The surface of Beijing can be characterized by the SDGSAT-1 daytime true-color composite image on 5 March 2022 (a) and the nighttime true-color composite image on 15 April 2022 (b). We selected five Aeronet stations over the study area: site 1 is Beijing_RADI station, site 2 is Beijing station, site 3 is Beijing_PKU station, site 4 is Beijing_CAMS station, and site 5 is Xianghe station.

Figure 2.
Flowchart of RB and SD algorithms for retrieving nighttime AOD.

Figure 3.
The selection of urban nightlight regions for AOD derivation based on the coefficient of variation (CV). Regions with high CV values were not used in AOD inversion due to the unstable light variation. (a,d,g) show the radiance background from VIIRS/DNB in March 2022, the variation coefficient image, and the selected area for AOD derivation at night, respectively. (b,e,h) provide the background light synthesized by SDGSAT-1/GLI images, the variation coefficient image, and the selected area for AOD derivation based on the radiation transfer method, respectively. (c,f,i) are the background light synthesized by SDGSAT-1/GLI images, the coefficient of variation images, and the selected area for AOD derivation based on the standard deviation method, respectively.

Figure 4.
Relationship between selected grid size and positioning error. (a–c) are the regression diagrams of the total radiance of light pixels in the grid when the grid size was 10 pixels and the position moved by 1, 3, and 5 pixels, respectively. (d–f) are the regression graphs of the total radiance of the light pixel in the grid when the grid size was 30 pixels and the position moved by 1, 3, and 5 pixels, respectively. (g–i) are the regression graphs of the total radiance of the light pixel in the grid when the grid size was 50 pixels and the position moved by 1, 3, 5 pixels, respectively.

Figure 5.
The identification of the unstable nightlight areas in Beijing. Higher variation coefficient area (b) in Beijing was identified according to the variation coefficient synthesized using radiance value for many days (a), and the nightlight images obtained on 15 April 2022 (c) and 1 May 2022 (d) by SDGSAT-1 could identify the abrupt-change regions.

Figure 6.
Spatial patterns of AOD in Beijing derived from SDGSAT-1/GLI images. Each row lists AOD results from RB and SD method under three typical weather conditions on 26 November 2021, 30 March 2022, and 15 April 2022, respectively. (a–c) are the night color low-light level images of SDGSAT-1/GLI, (b–f) are the AOD results obtained by inversion of the RB algorithm, (g–i) are the AOD results obtained by inversion of the SD algorithm, and (j–l) are the correlation analyses of AOD values obtained by SD and RB inversion algorithms.

Figure 7.
The comparison between AOD values from SDGSAT-1/GLI and AERONET site. (a) is the correlation analysis of AOD from nighttime stations and VIIRS/DNB images, (b) is the linear regression of AOD from nighttime stations and SDGSAT-1/GLI images based on RB algorithm, and (c) is the linear regression of AOD from nighttime stations and SDGSAT-1/GLI images based on SD algorithm.

Figure 8.
Comparison of AOD values obtained by SDGSAT-1/GLI data and daytime AERONET stations using RB (a) and SD algorithm (b), respectively.
Figure 8.
Comparison of AOD values obtained by SDGSAT-1/GLI data and daytime AERONET stations using RB (a) and SD algorithm (b), respectively.

Figure 9.
The influence of moon illumination on satellite-observed radiance in the selected area under different lunar illumination fractions of nine days, including 26 November 2021, 3 January 2022, 4 February 2022, 14 March 2022, 30 March 2022, 4 April 2022, 10 April 2022, 15 April 2022, and 26 April 2022. Marker ‘+’ represents the outlier above the upper boundary line, marker ‘❊’ represents the mean of the group of data, and the red line in the box is the median of the group of data.

Figure 10.
Satellite spectral response function, the emission spectrum of main ground light sources, and the relationship between atmospheric spectral transmissivity and wavelength under clear weather, including the atmospheric spectral transmittance (blue curve), the spectral response function of SDGSAT-1/GLI panchromatic band (black curve), the normalized LED lamp spectral curve (green curve), the normalized high-pressure sodium lamp spectral curve (yellow curve), and the normalized fluorescent lamp spectral curve (red curve).

Figure 11.
The nighttime light radiance changes (10−4 W/cm2/sr) along with the increase of satellite viewing zenith angle. The analysis results were derived from four AERONET station, including Beijing_PKU (a), Beijing_CAMS (b), Beijing_RADI (c), and Beijing station (d). The solid orange line is the regression line.


Table 1.
The selected L4A images of SDGSAT-1/GLI in Beijing.
| Number | Date | Overpass Time (UTC) | Number | Date | Overpass Time (UTC) |
|---|---|---|---|---|---|
| 1 | 10 November 2021 | 13:10:52 | 10 | 14 March 2022 | 13:22:30 |
| 2 | 26 November 2021 | 13:17:02 | 11 | 30 March 2022 | 13:23:26 |
| 3 | 3 January 2022 | 13:18:49 | 12 | 4 April 2022 | 13:29:17 |
| 4 | 25 January 2022 | 13:13:45 | 13 | 5 April 2022 | 13:11:52 |
| 5 | 4 February 2022 | 13:27:33 | 14 | 10 April 2022 | 13:17:27 |
| 6 | 5 February 2022 | 13:10:33 | 15 | 15 April 2022 | 13:23:28 |
| 7 | 15 February 2022 | 13:24:13 | 16 | 26 April 2022 | 13:16:18 |
| 8 | 20 February 2022 | 13:30:45 | 17 | 1 May 2022 | 13:21:17 |
| 9 | 21 February 2022 | 13:13:30 |
Table 2.
The difference of night light images from VIIRS/DNB and SDGSAT-1/GLI.
| Satellite | NPP-VIIRS/DNB | SDGSAT-1/GLI |
|---|---|---|
| Orbit height | 750 km | 505 km |
| Spatial resolution | 740 m | Panchromatic: 10 m RGB: 40 m |
| Bands | Panchromatic: 500–900 nm | Panchromatic: 444–910 nm Blue: 424~526 nm Green: 506~612 nm Red: 600~894 nm |
| Swath width | 3060 km | 300 km |
| Revisit cycle | 1 d | 11 d |
| Overpass time (Local time) | About 1:30 | About 21:20 |
| Available Period | 2021-present | 2012-present |
Disclaimer/Publisher’s Note: The statements, opinions and data contained in all publications are solely those of the individual author(s) and contributor(s) and not of MDPI and/or the editor(s). MDPI and/or the editor(s) disclaim responsibility for any injury to people or property resulting from any ideas, methods, instructions or products referred to in the content. |
© 2023 by the authors. Licensee MDPI, Basel, Switzerland. This article is an open access article distributed under the terms and conditions of the Creative Commons Attribution (CC BY) license (https://creativecommons.org/licenses/by/4.0/).
Share and Cite
MDPI and ACS Style
Wang, N.; Hu, Y.; Li, X.M.; Kang, C.; Yan, L. AOD Derivation from SDGSAT-1/GLI Dataset in Mega-City Area. Remote Sens. 2023, 15, 1343. https://doi.org/10.3390/rs15051343
AMA Style
Wang N, Hu Y, Li XM, Kang C, Yan L. AOD Derivation from SDGSAT-1/GLI Dataset in Mega-City Area. Remote Sensing. 2023; 15(5):1343. https://doi.org/10.3390/rs15051343
Chicago/Turabian StyleWang, Ning, Yonghong Hu, Xiao Ming Li, Chuanli Kang, and Lin Yan. 2023. "AOD Derivation from SDGSAT-1/GLI Dataset in Mega-City Area" Remote Sensing 15, no. 5: 1343. https://doi.org/10.3390/rs15051343
Note that from the first issue of 2016, this journal uses article numbers instead of page numbers. See further details here.