


An Object-Oriented Method for Extracting Single-Object Aquaculture Ponds from 10 m Resolution Sentinel-2 Images on Google Earth Engine
 ,
, 
Abstract
:
1. Introduction
2. Materials
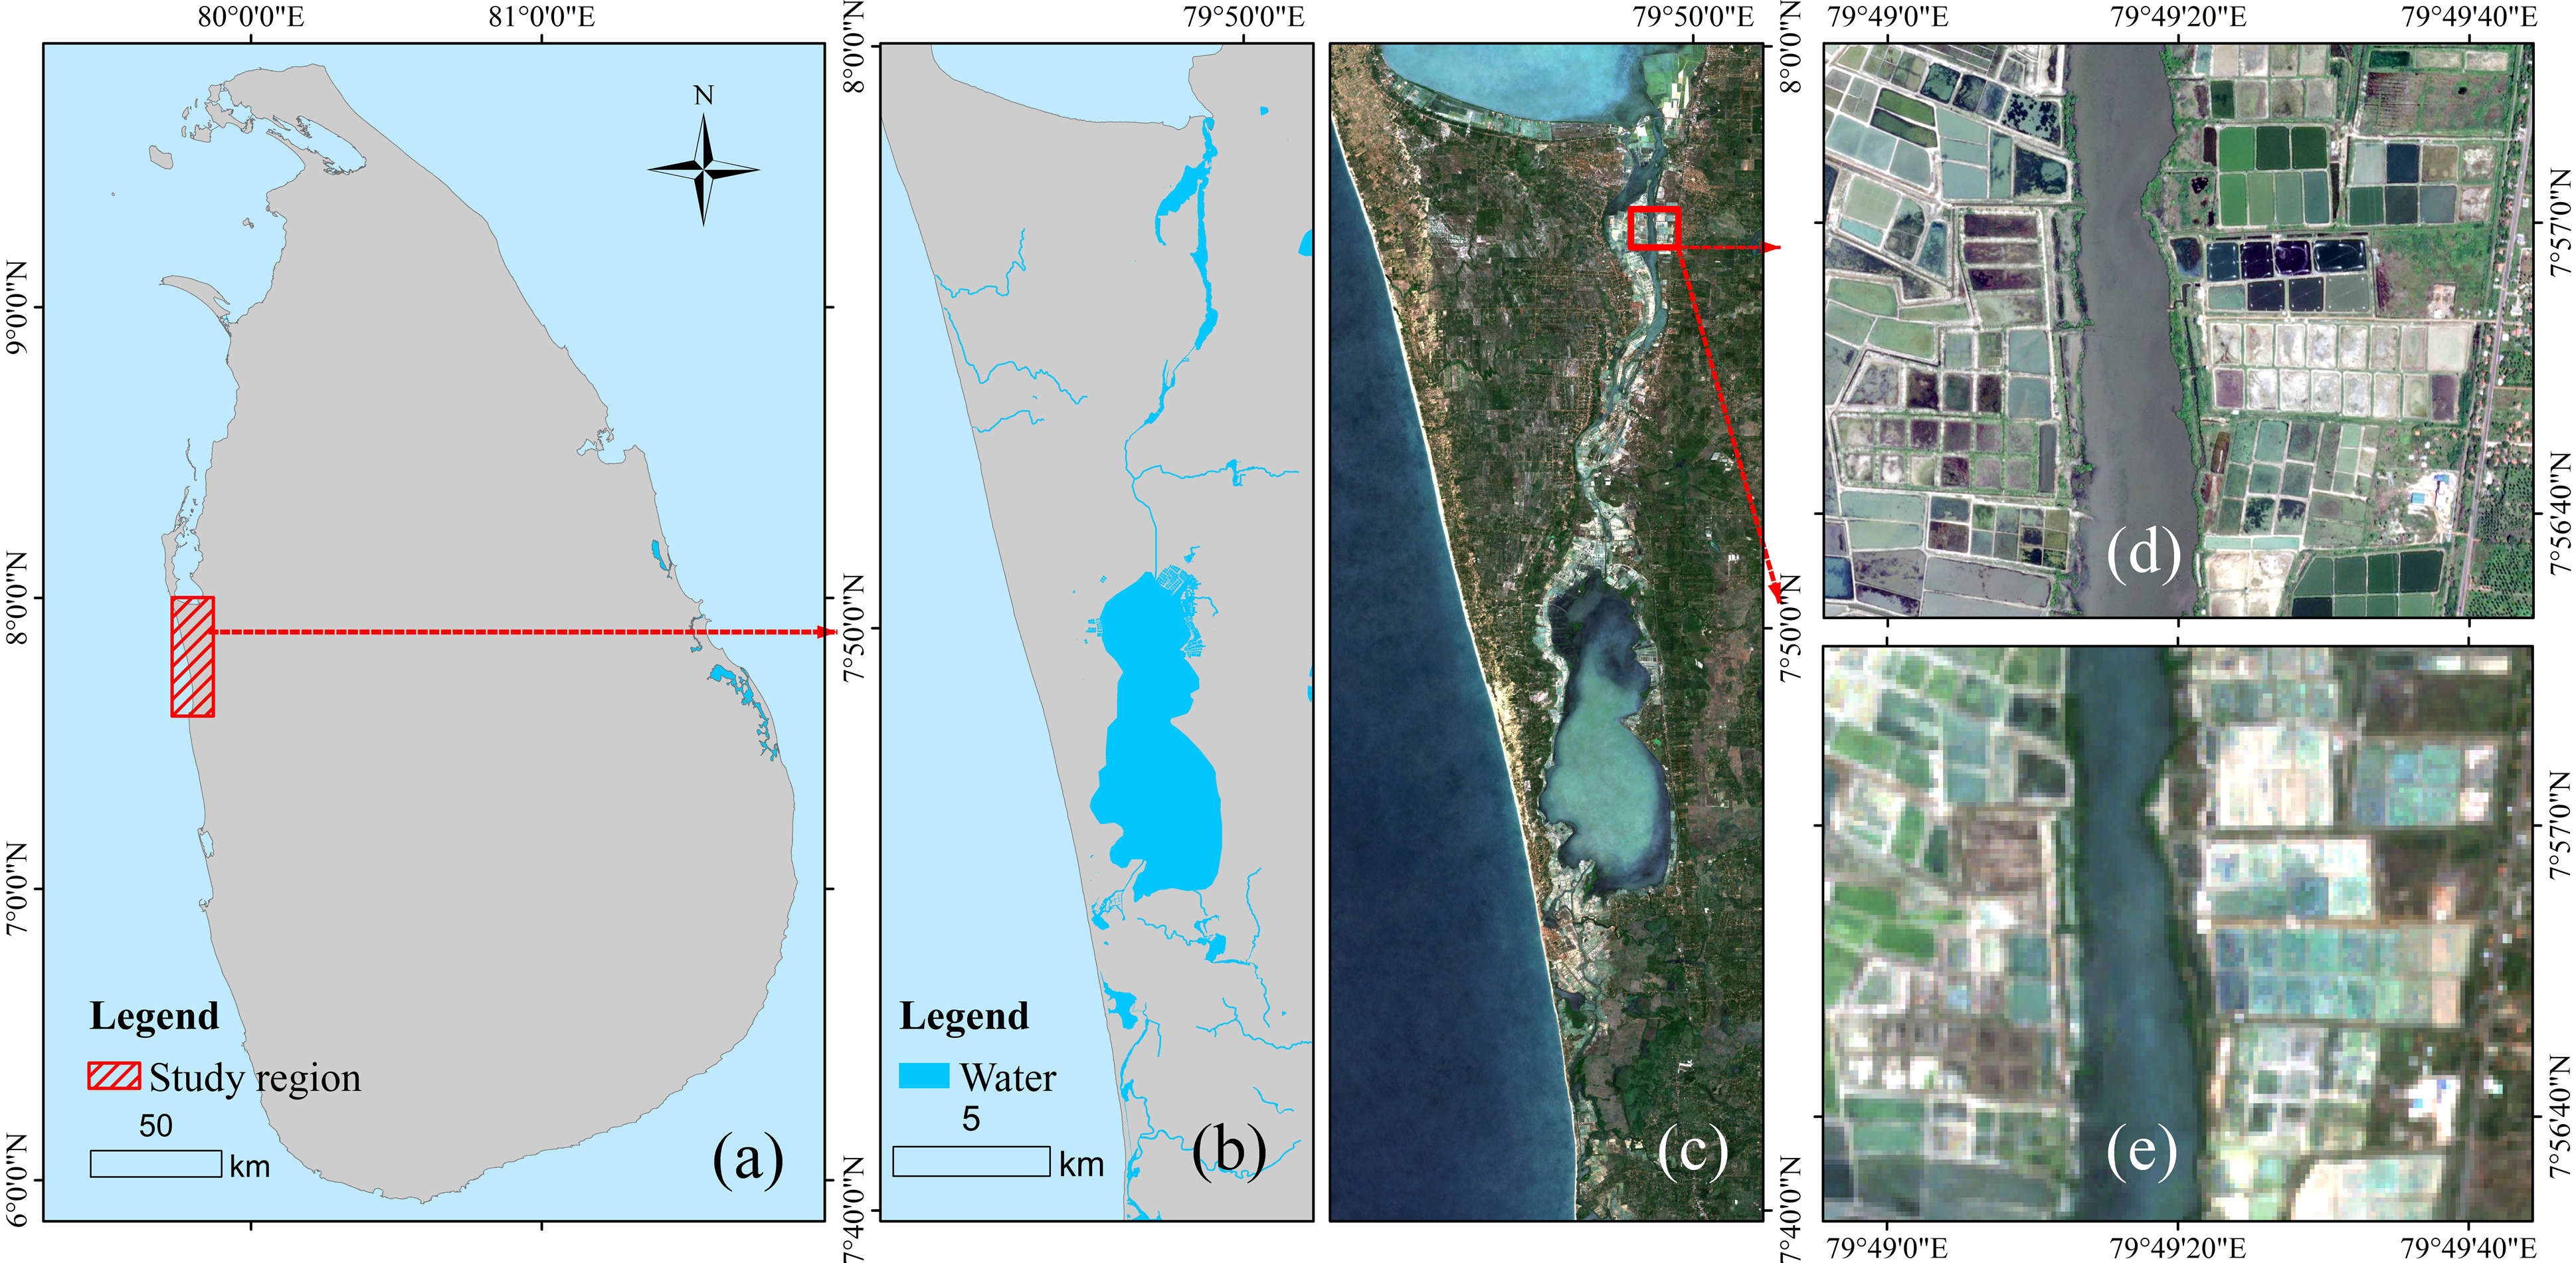
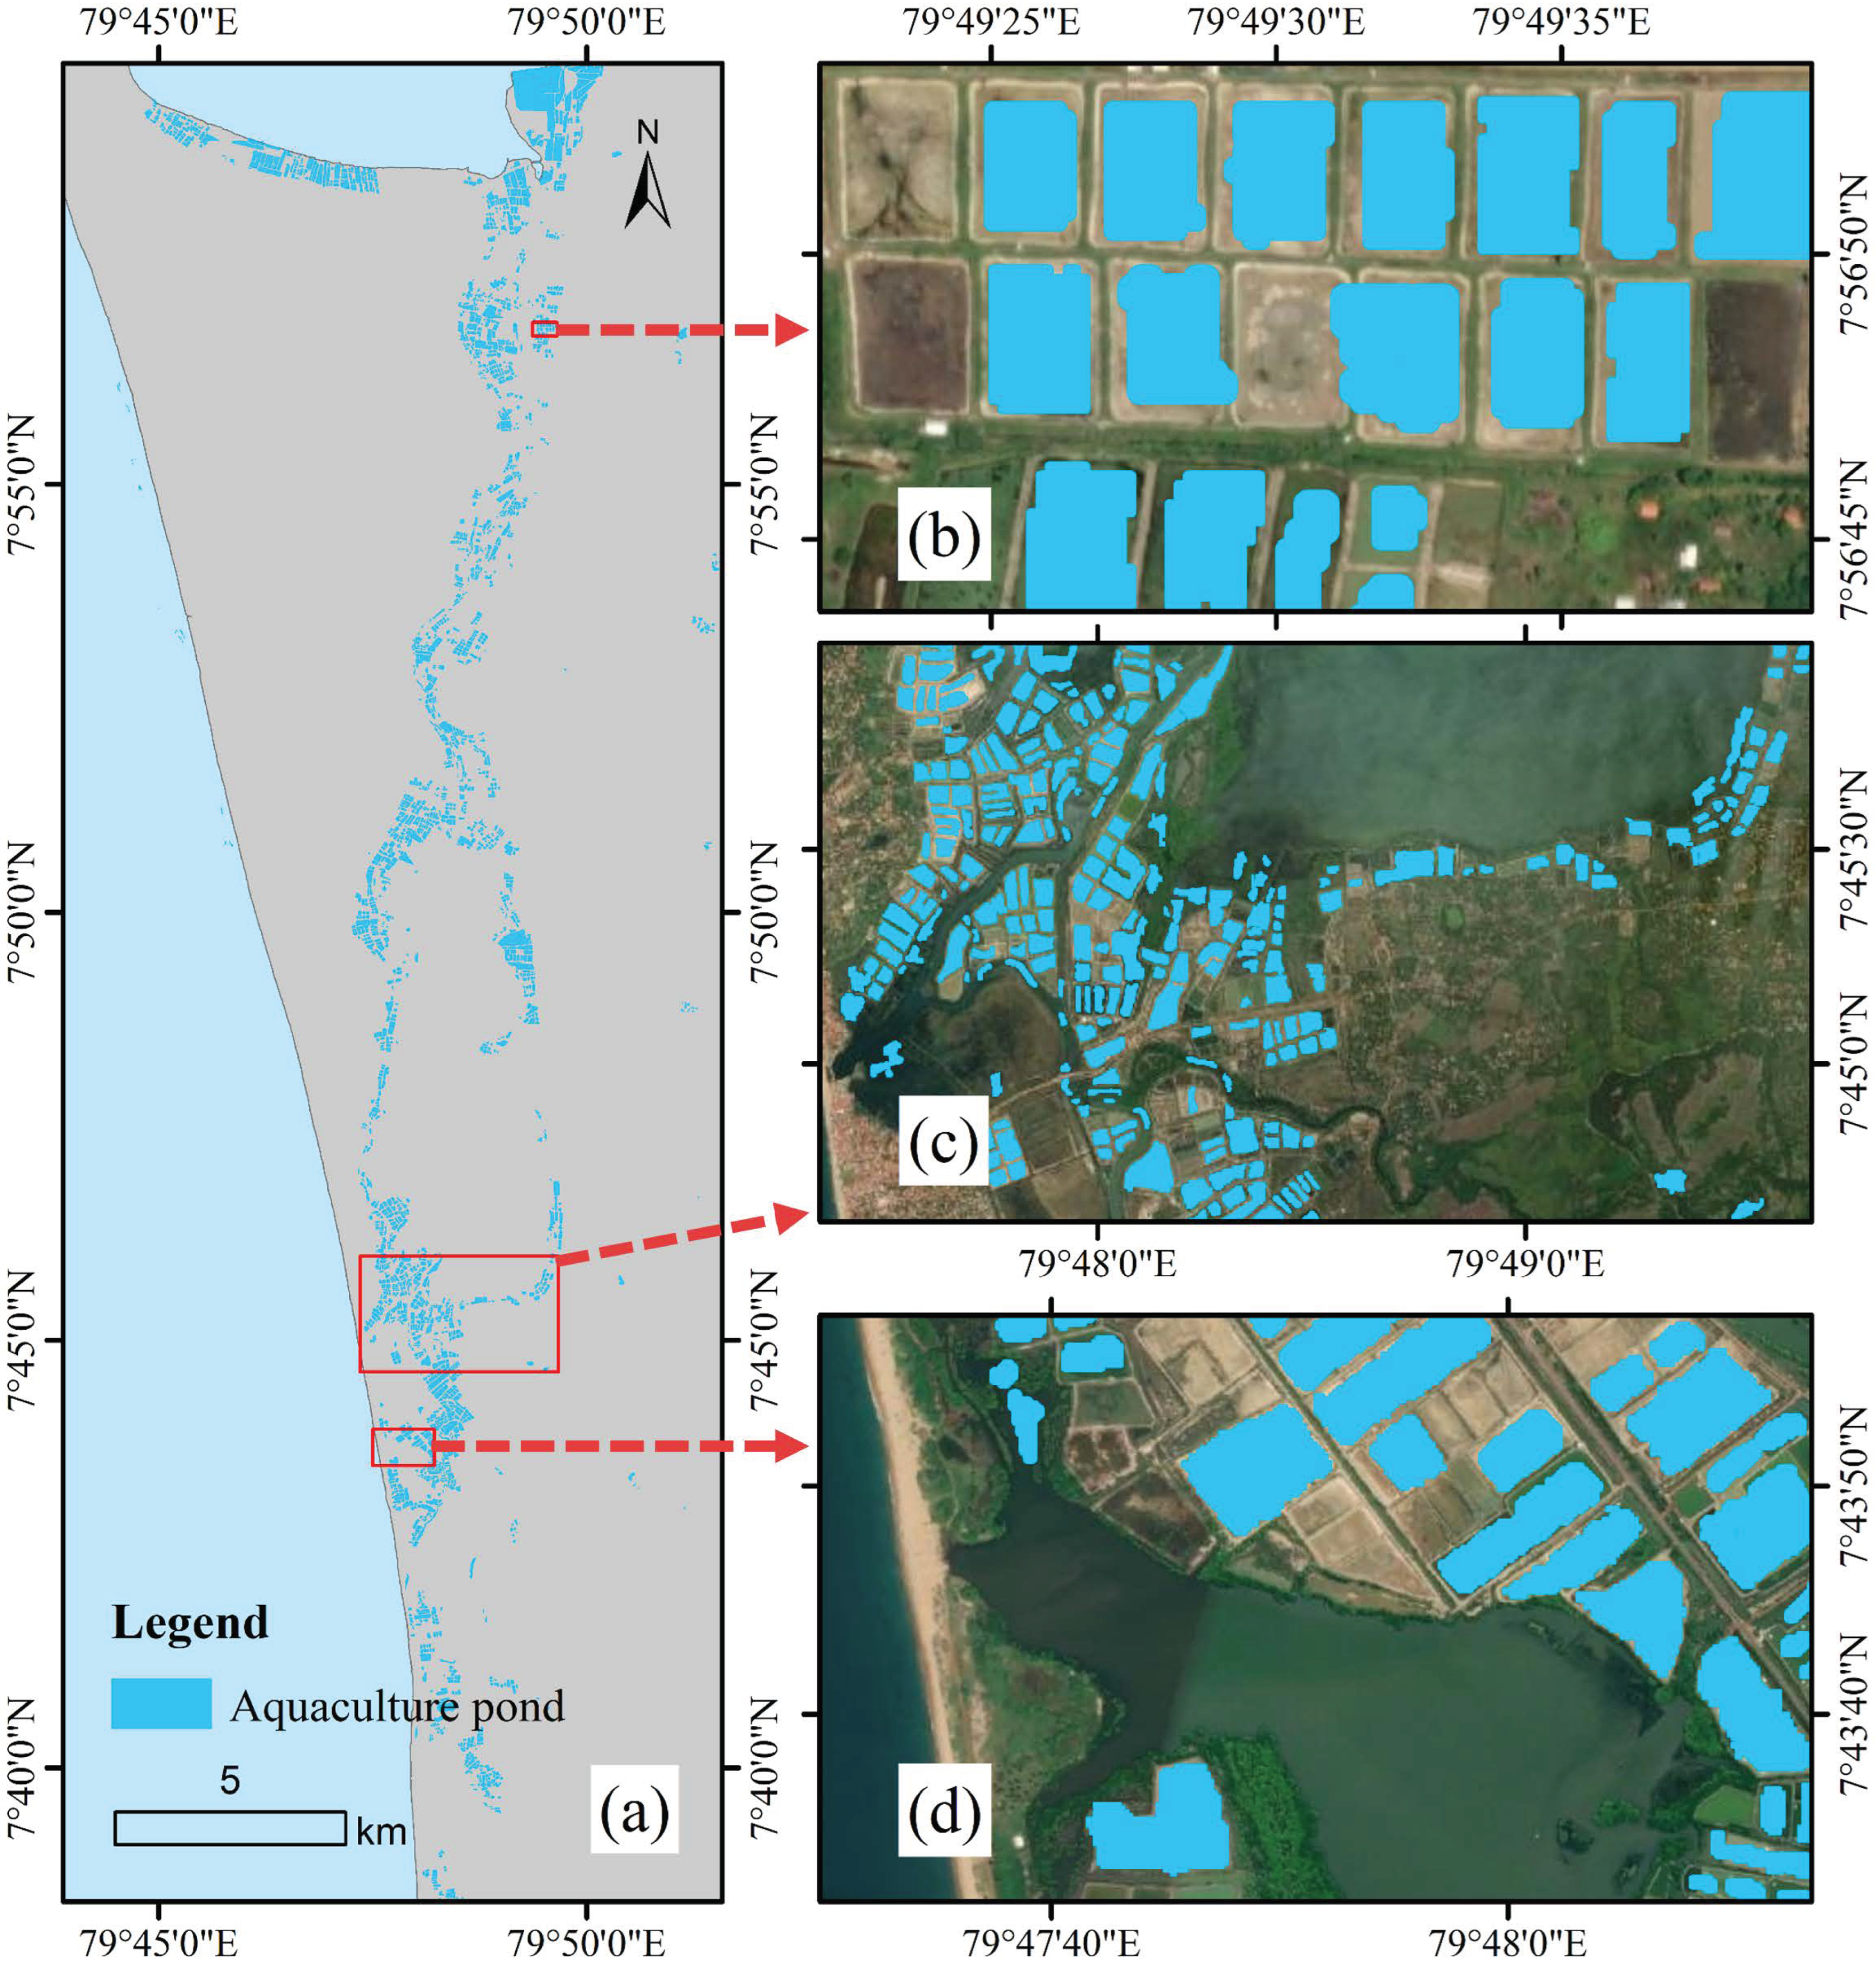
2.1. Study Region
2.2. Data
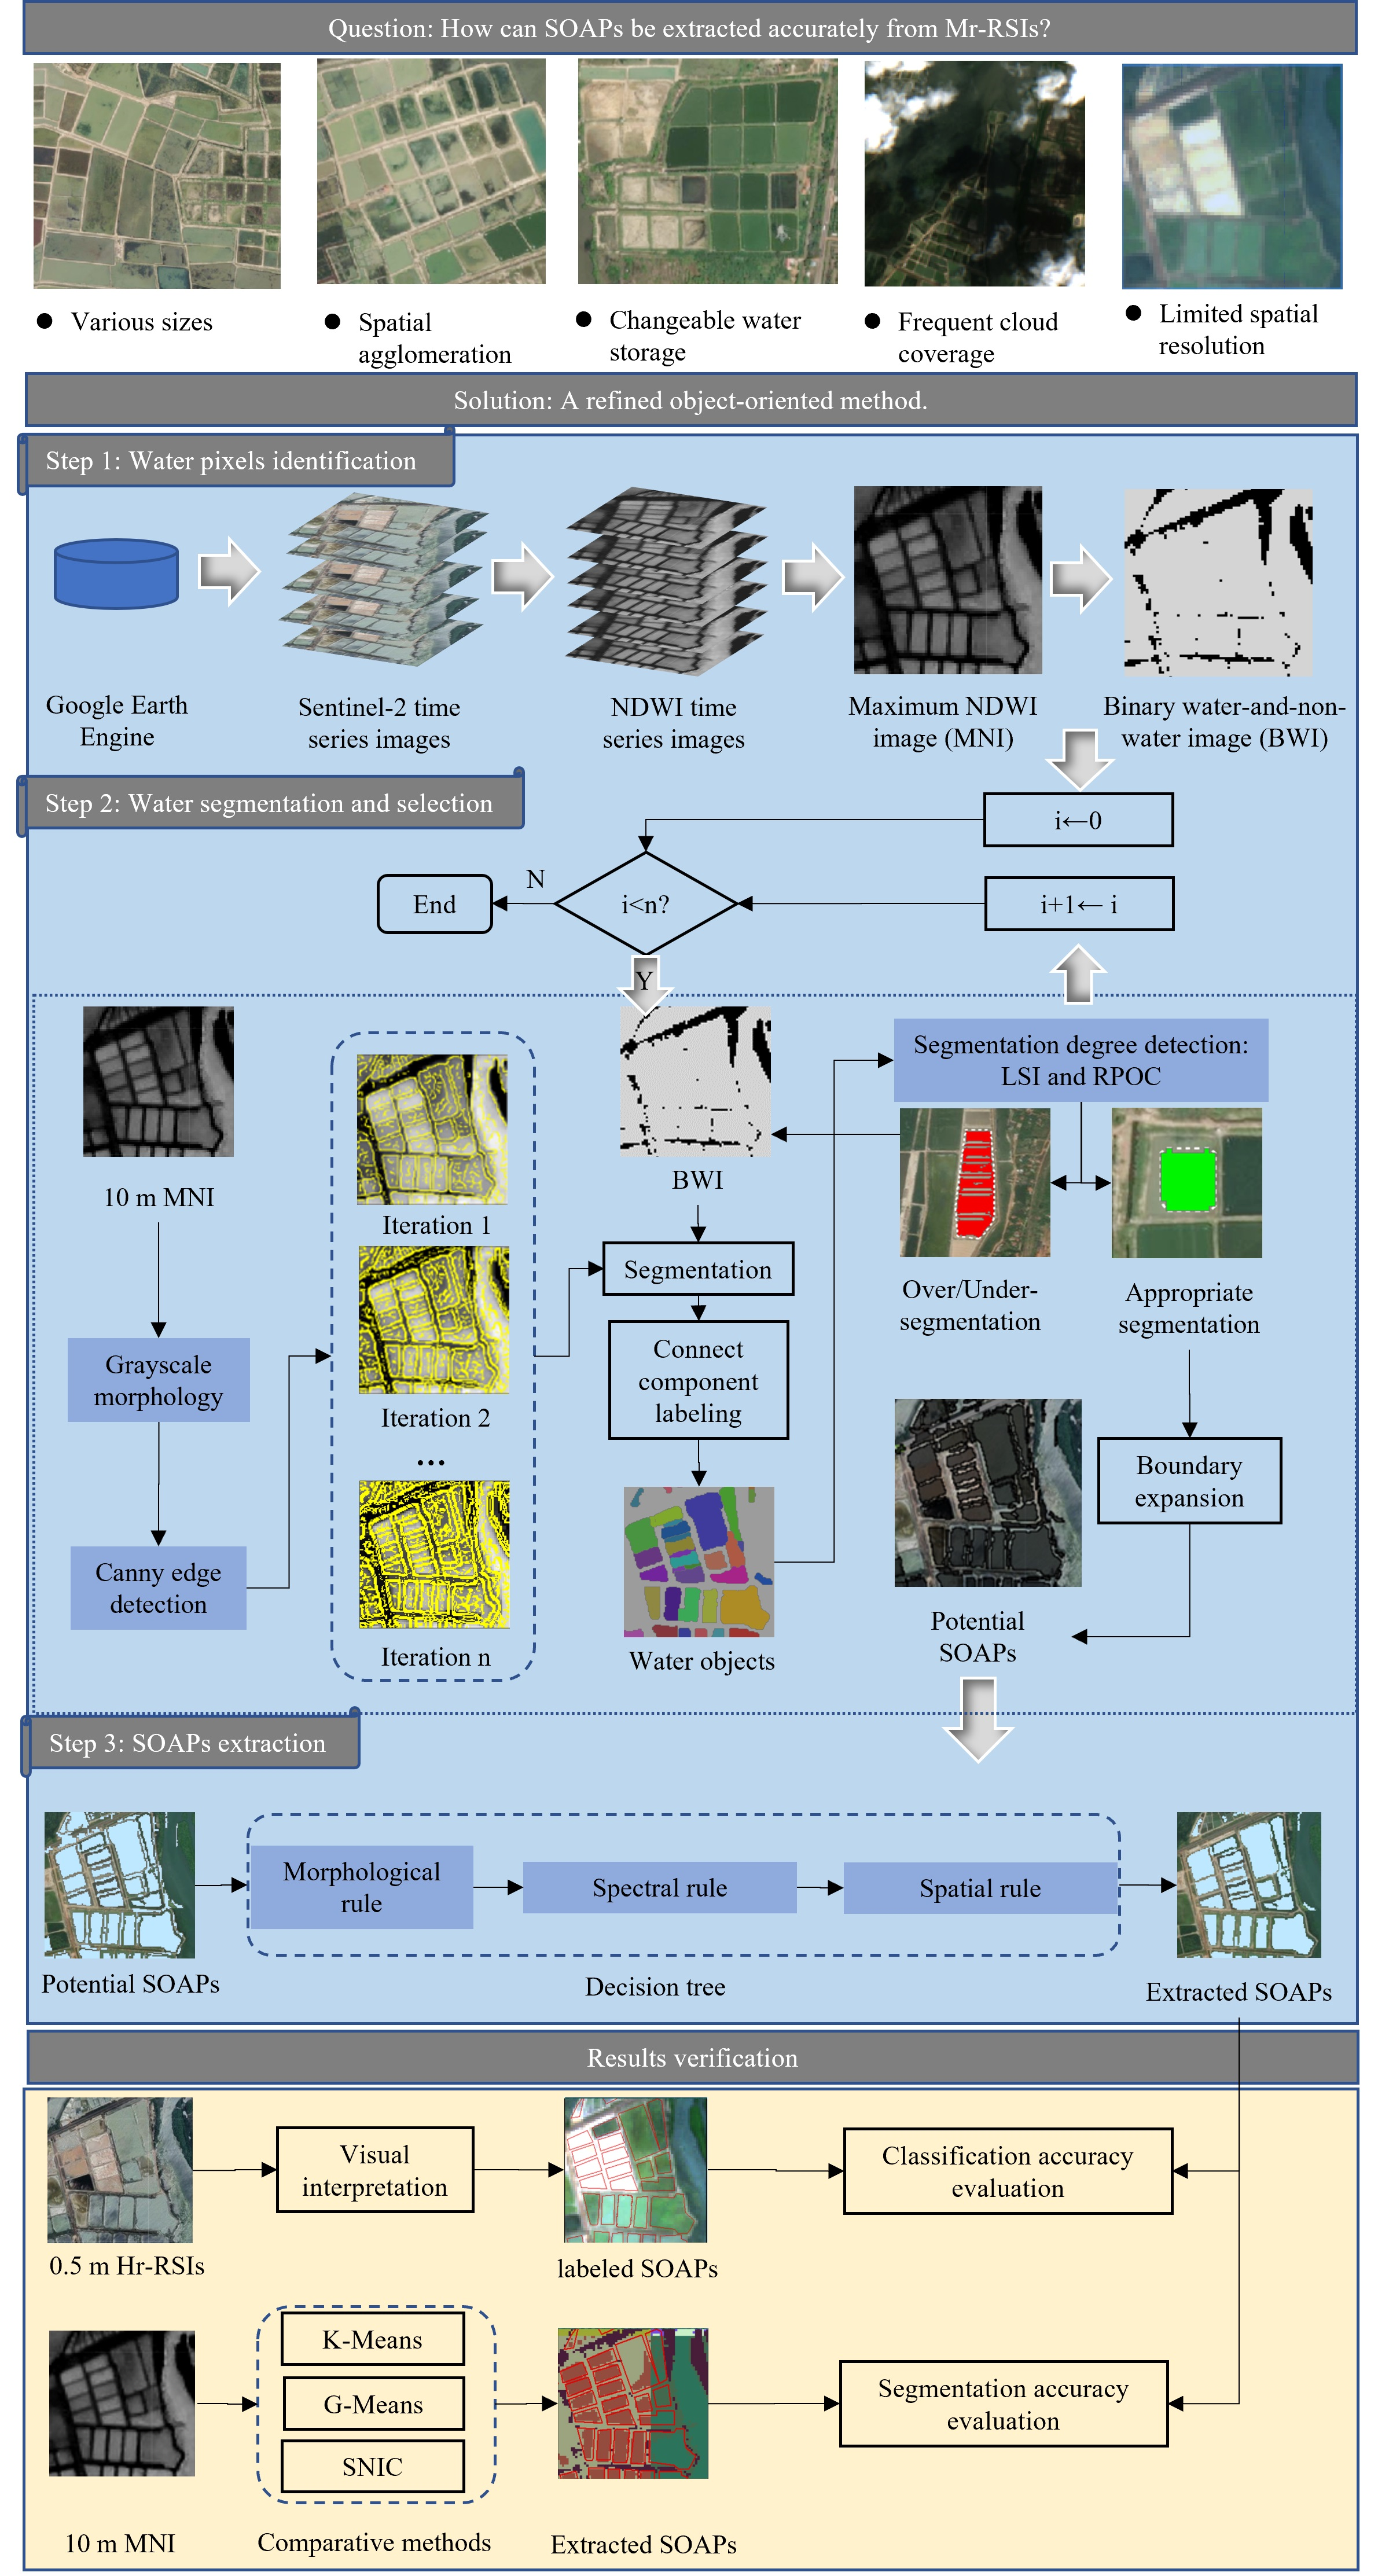
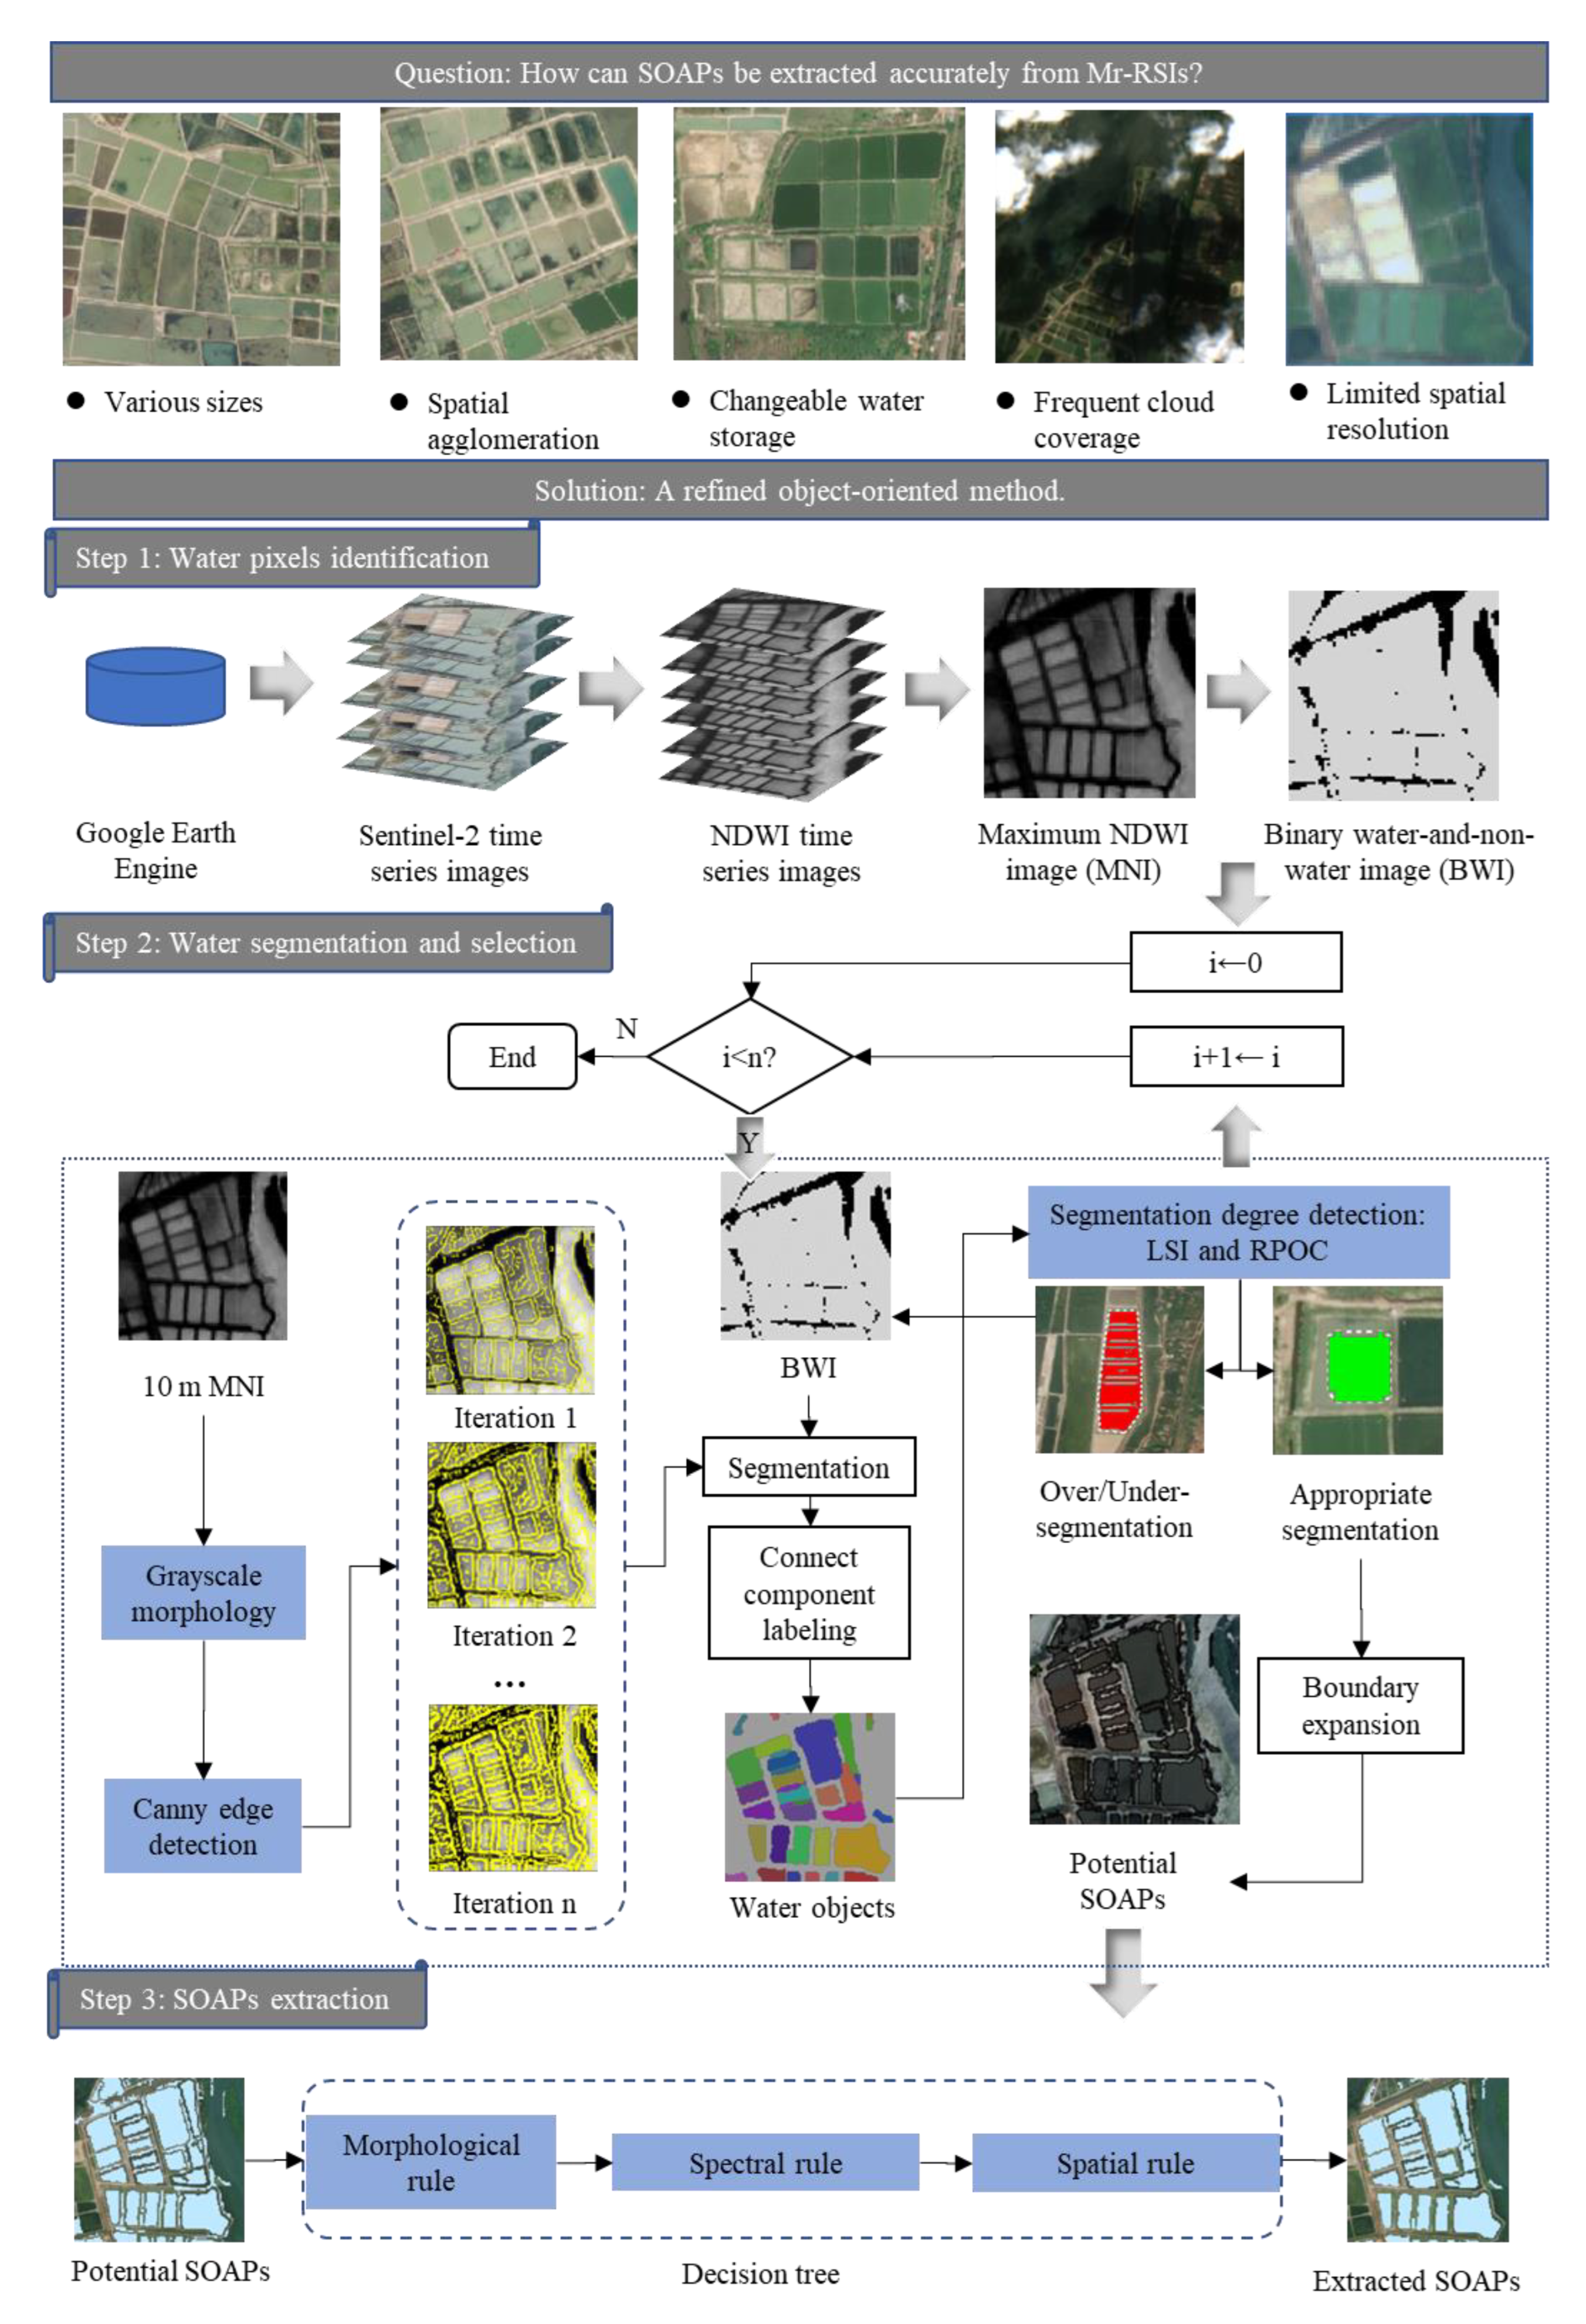
3. Methodology
3.1. Water Pixels Identification
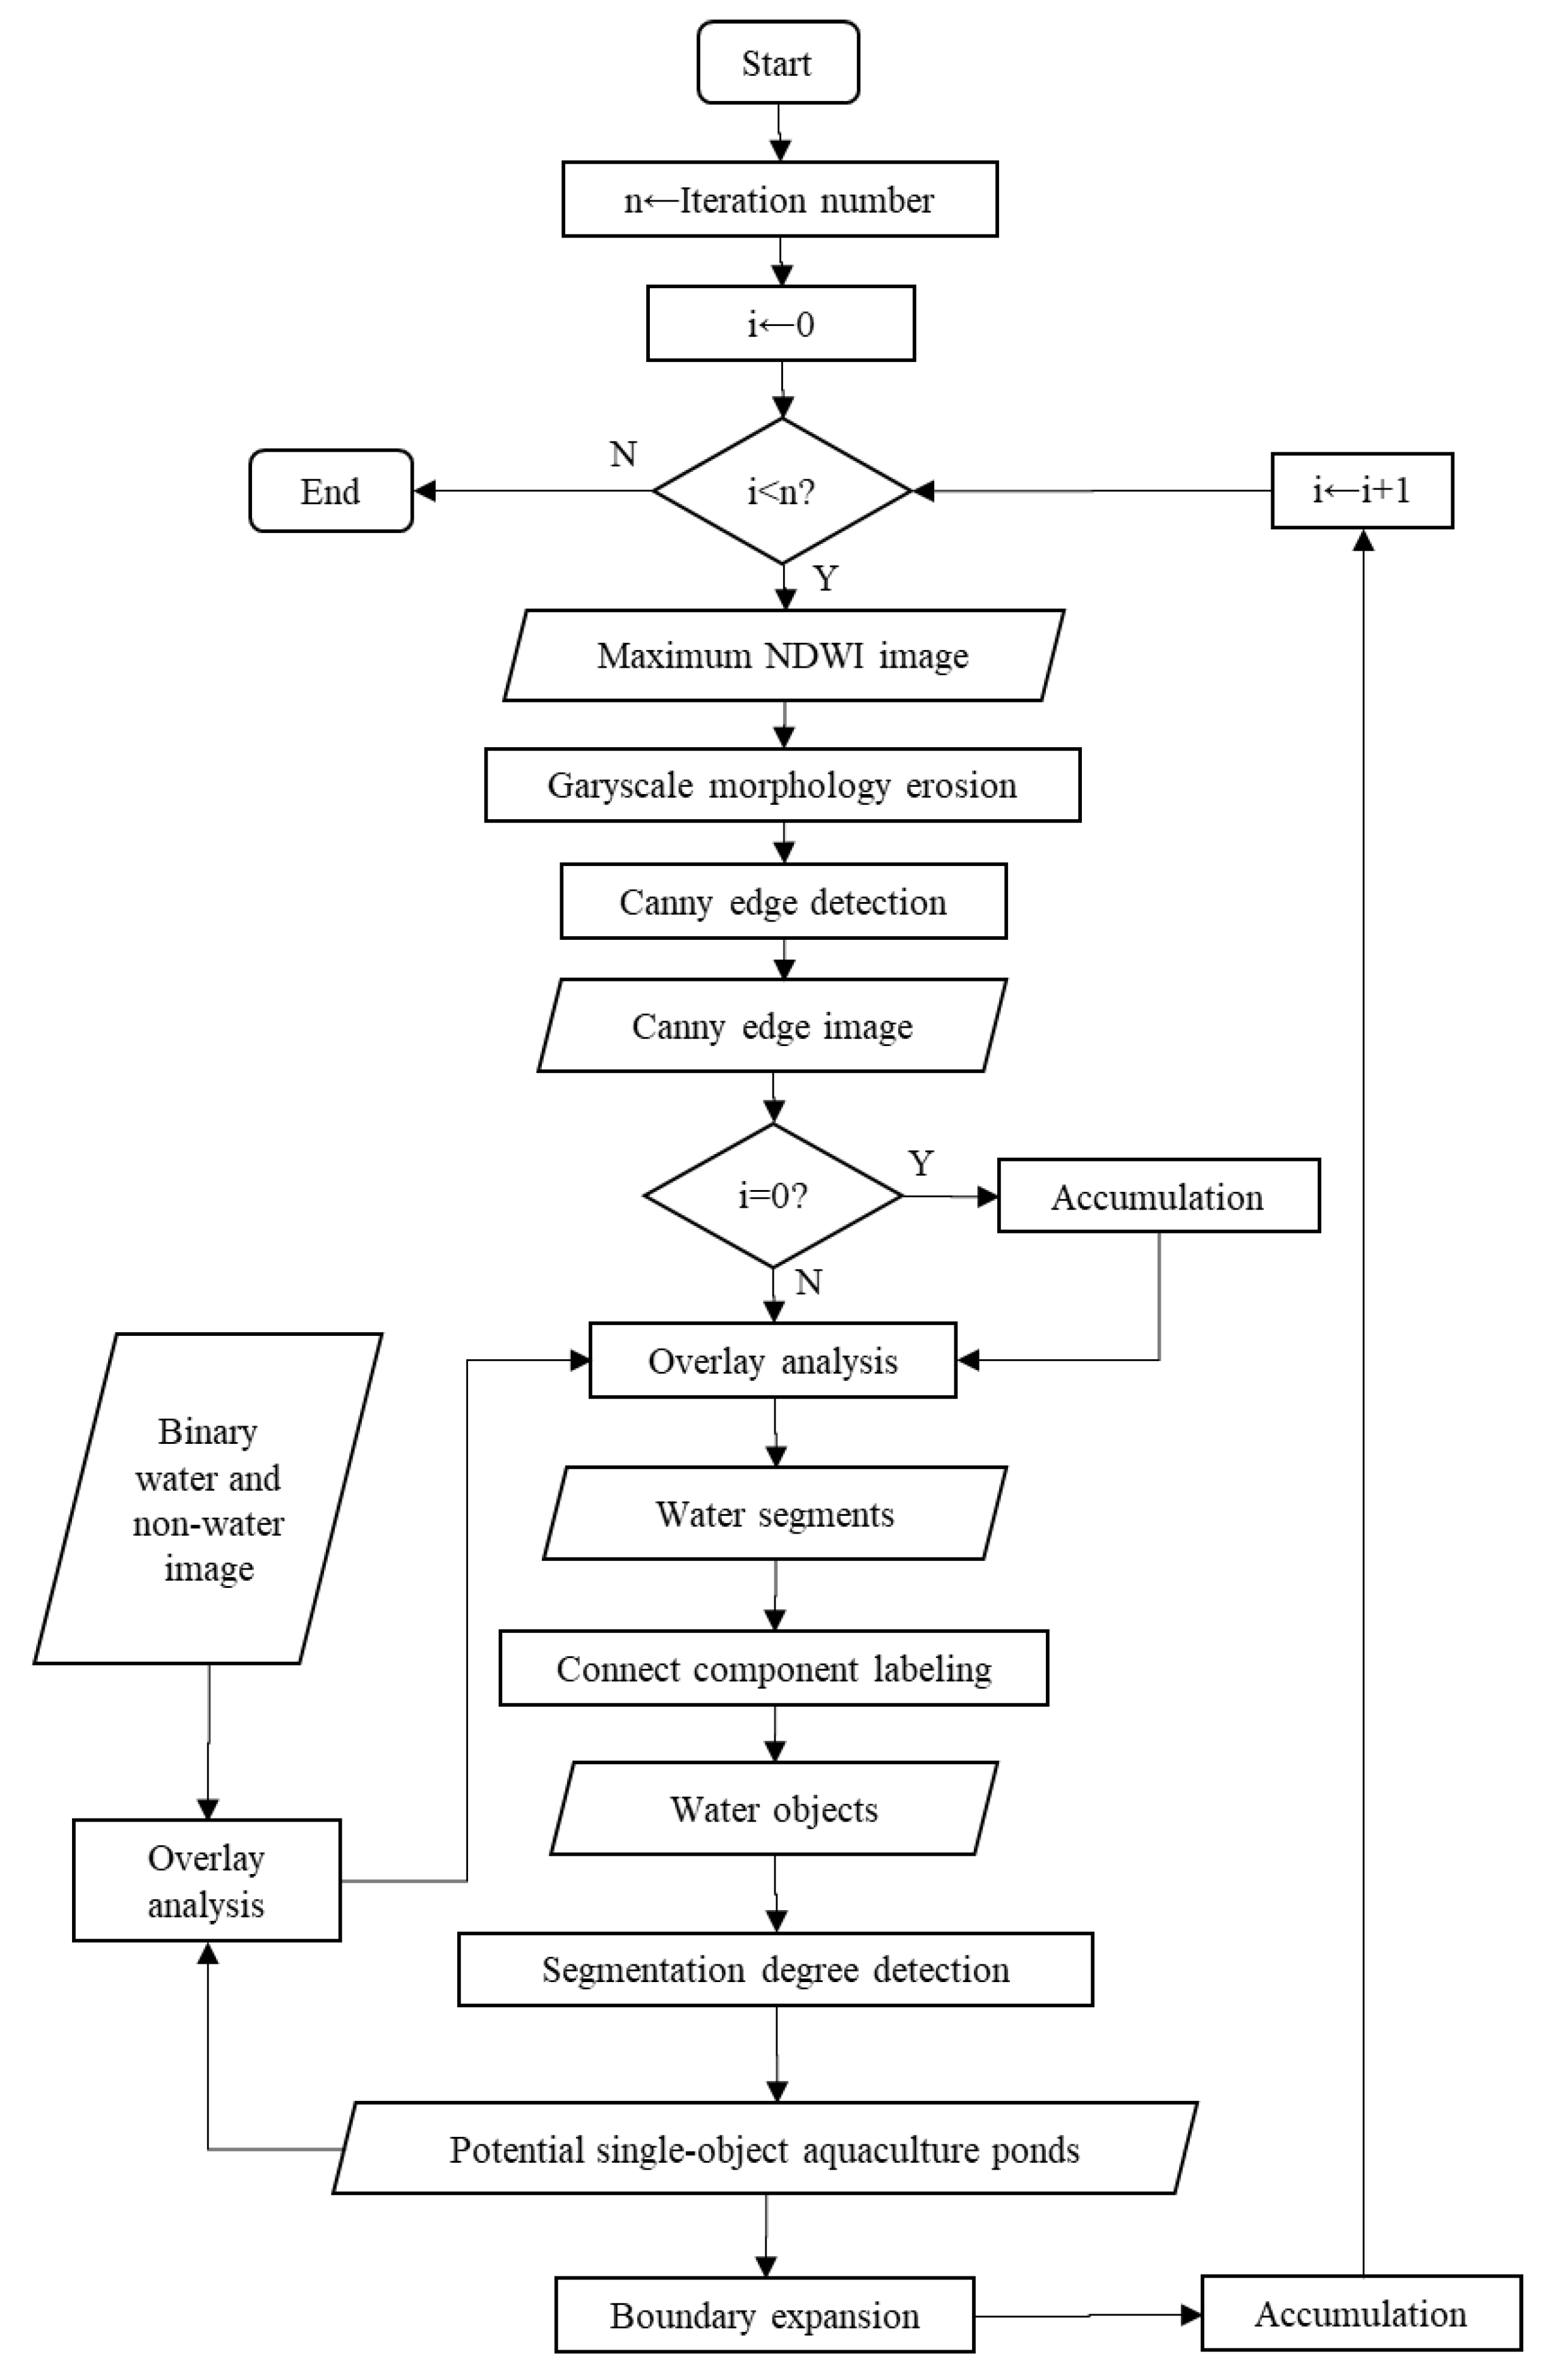
3.2. Water Segmentation and Selection
- Inputs: MNI and BWI.
- Output: potential SOAPs.
- Parameters: is the total number of iterations; is the sequence number during the iteration.
- Step 1: Set the value of to 0.
- Step 2: Compare the values of and . If , then go to Step 3; otherwise, end the procedure and output the potential SOAPs.
- Step 3: Use a 3 3 square kernel to implement the GM erosion operation on the MNI and output a processed MNI.
- Step 4: Implement the CED operation (threshold = 0.2) on the processed MNI and output a Canny edge image (CEI).
- Step 5: If i = 0, then go to Step 6; otherwise, overlay the CEI with the previously output CEIs and output an accumulated CEI.
- Step 6: For the BWI, remove the intersected pixels between the output CEI and the BWI and then output a segmented BWI with water segments.
- Step 7: Implement the connect component labeling operation on the segmented BWI and mark all water segments as unique water objects based on pixel connectivity (four-connected).
- Step 8: Implement segmentation degree detection on all water objects and select those passing this detection as potential SOAPs.
- Step 9: Remove the pixels belonging to potential SOAPs from the BWI and output a new BWI for Step 6.
- Step 10: Expand the boundaries of the newly acquired potential SOAPs and set the distance to expand these SOAPs equal to .
- Step 11: Set to , then go to Step 2.
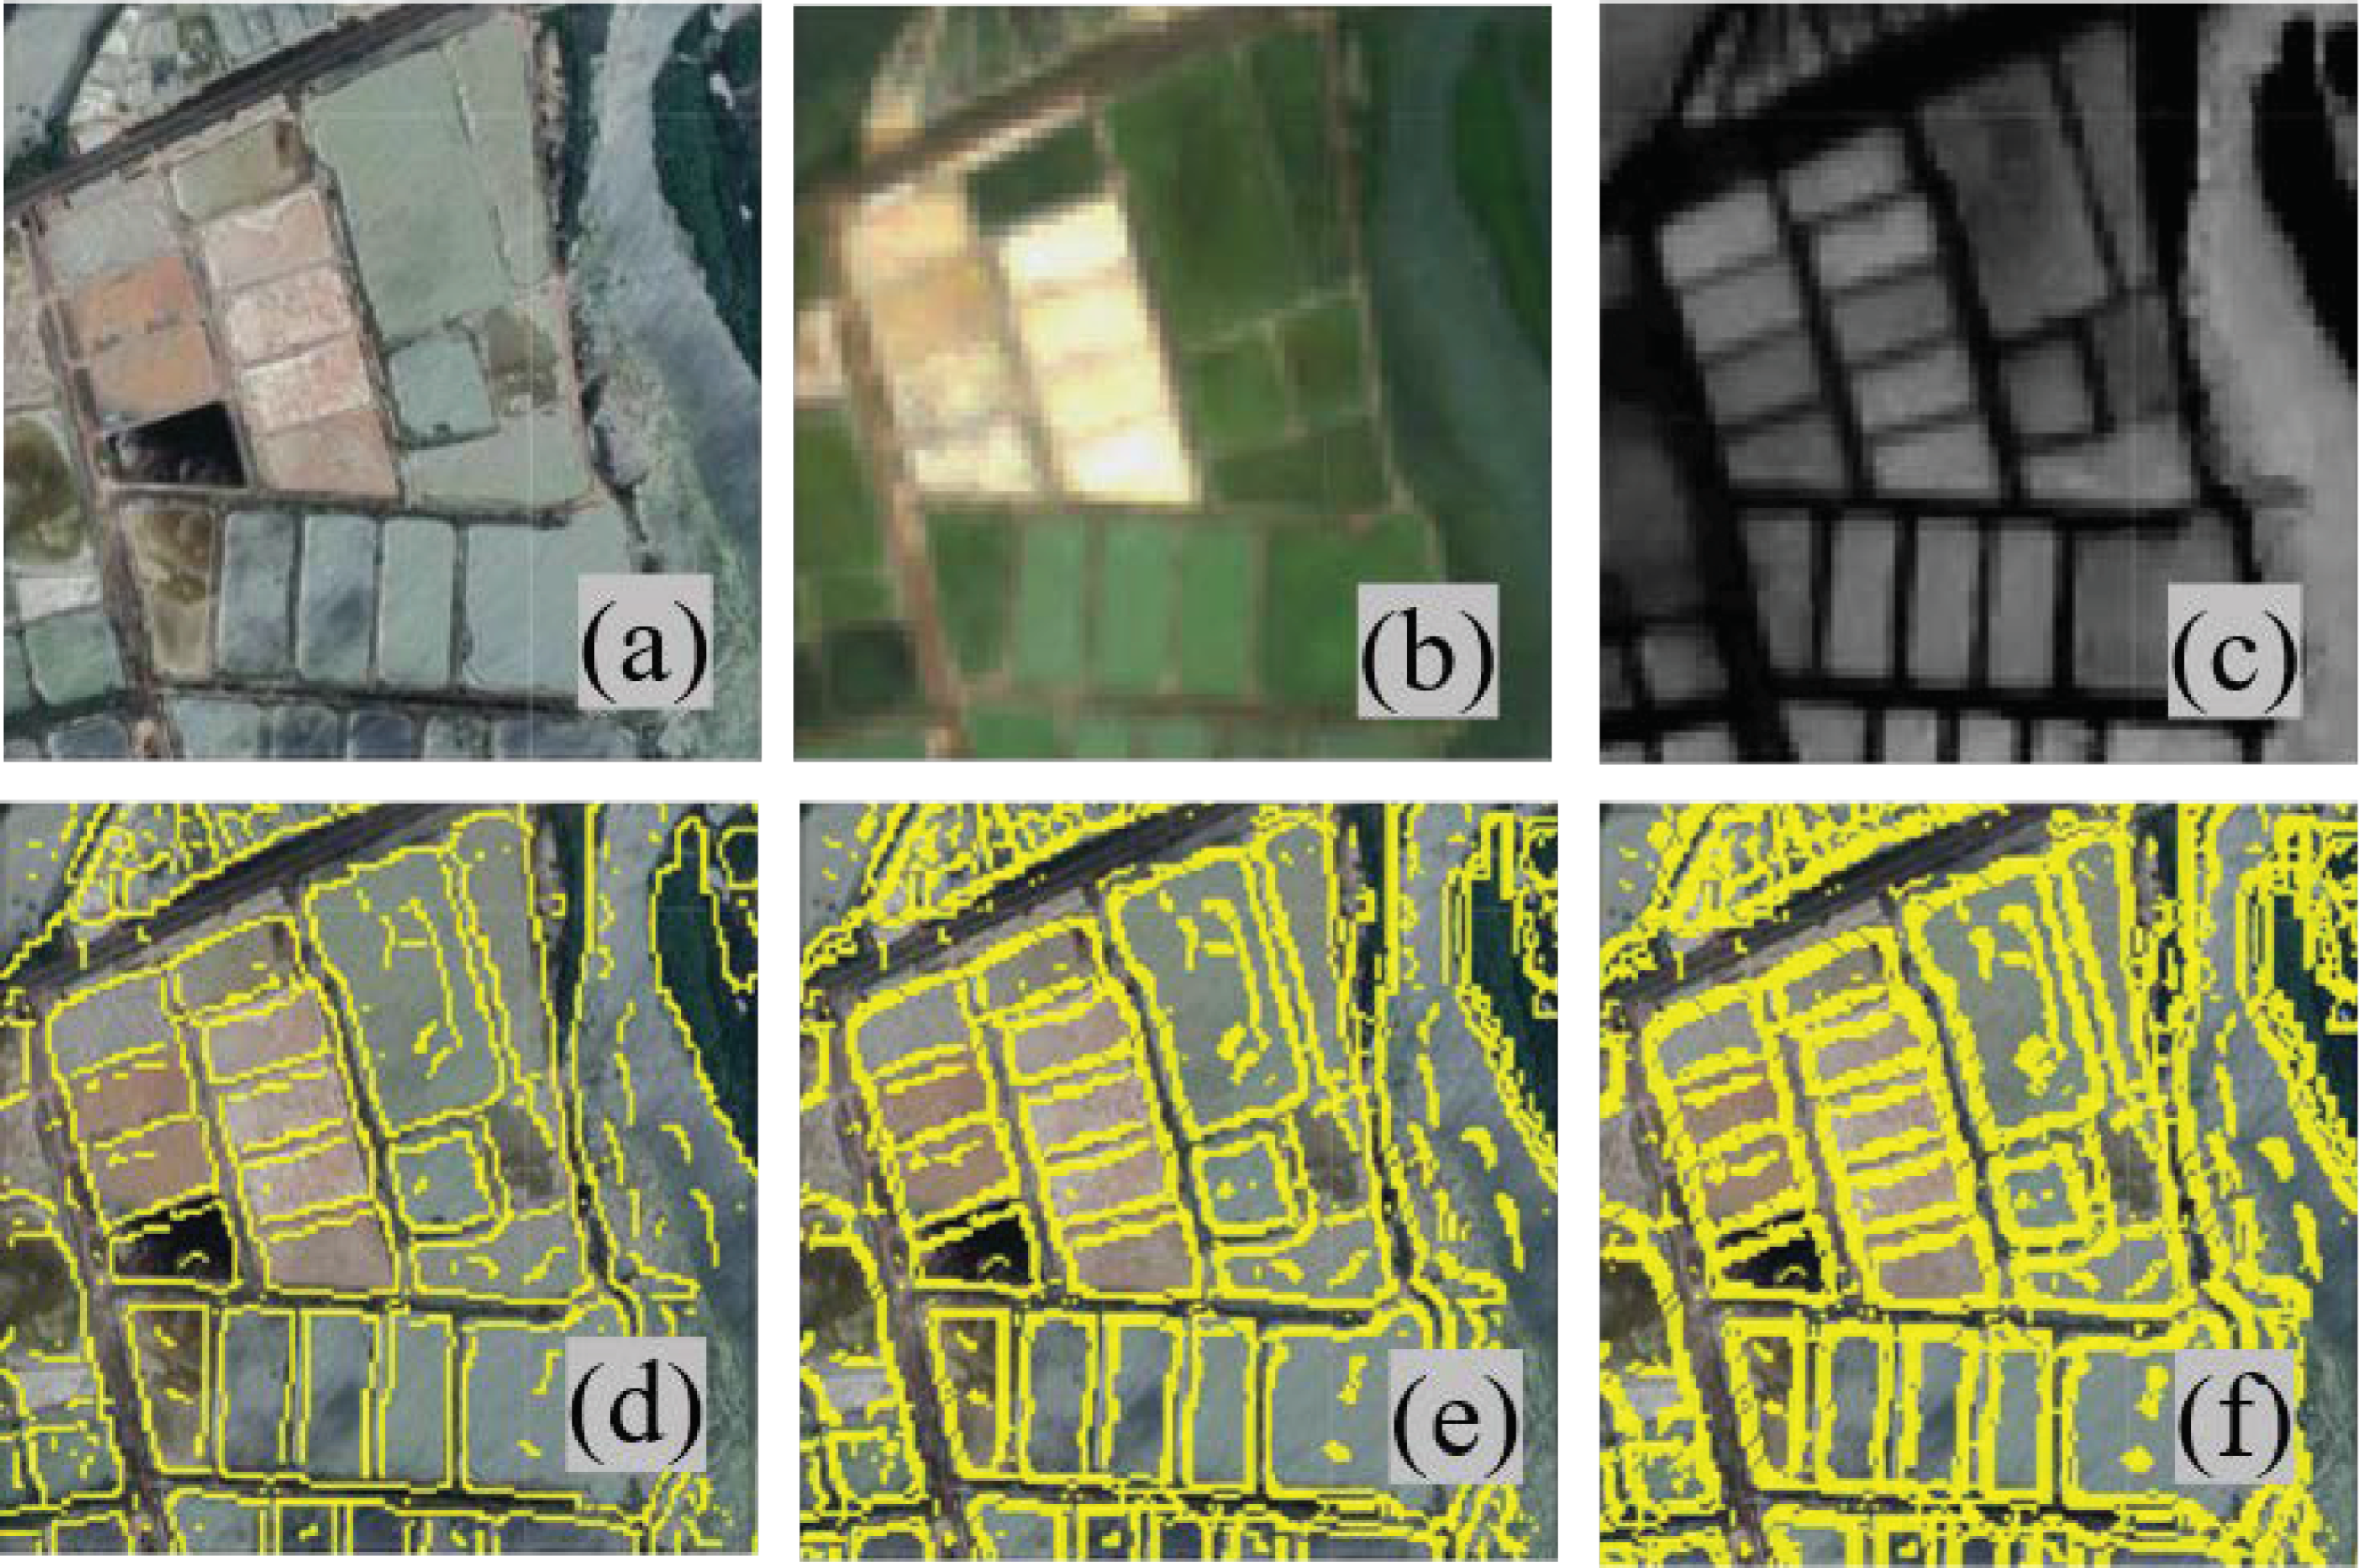
3.2.1. Grayscale Morphology and Canny Edge Detection
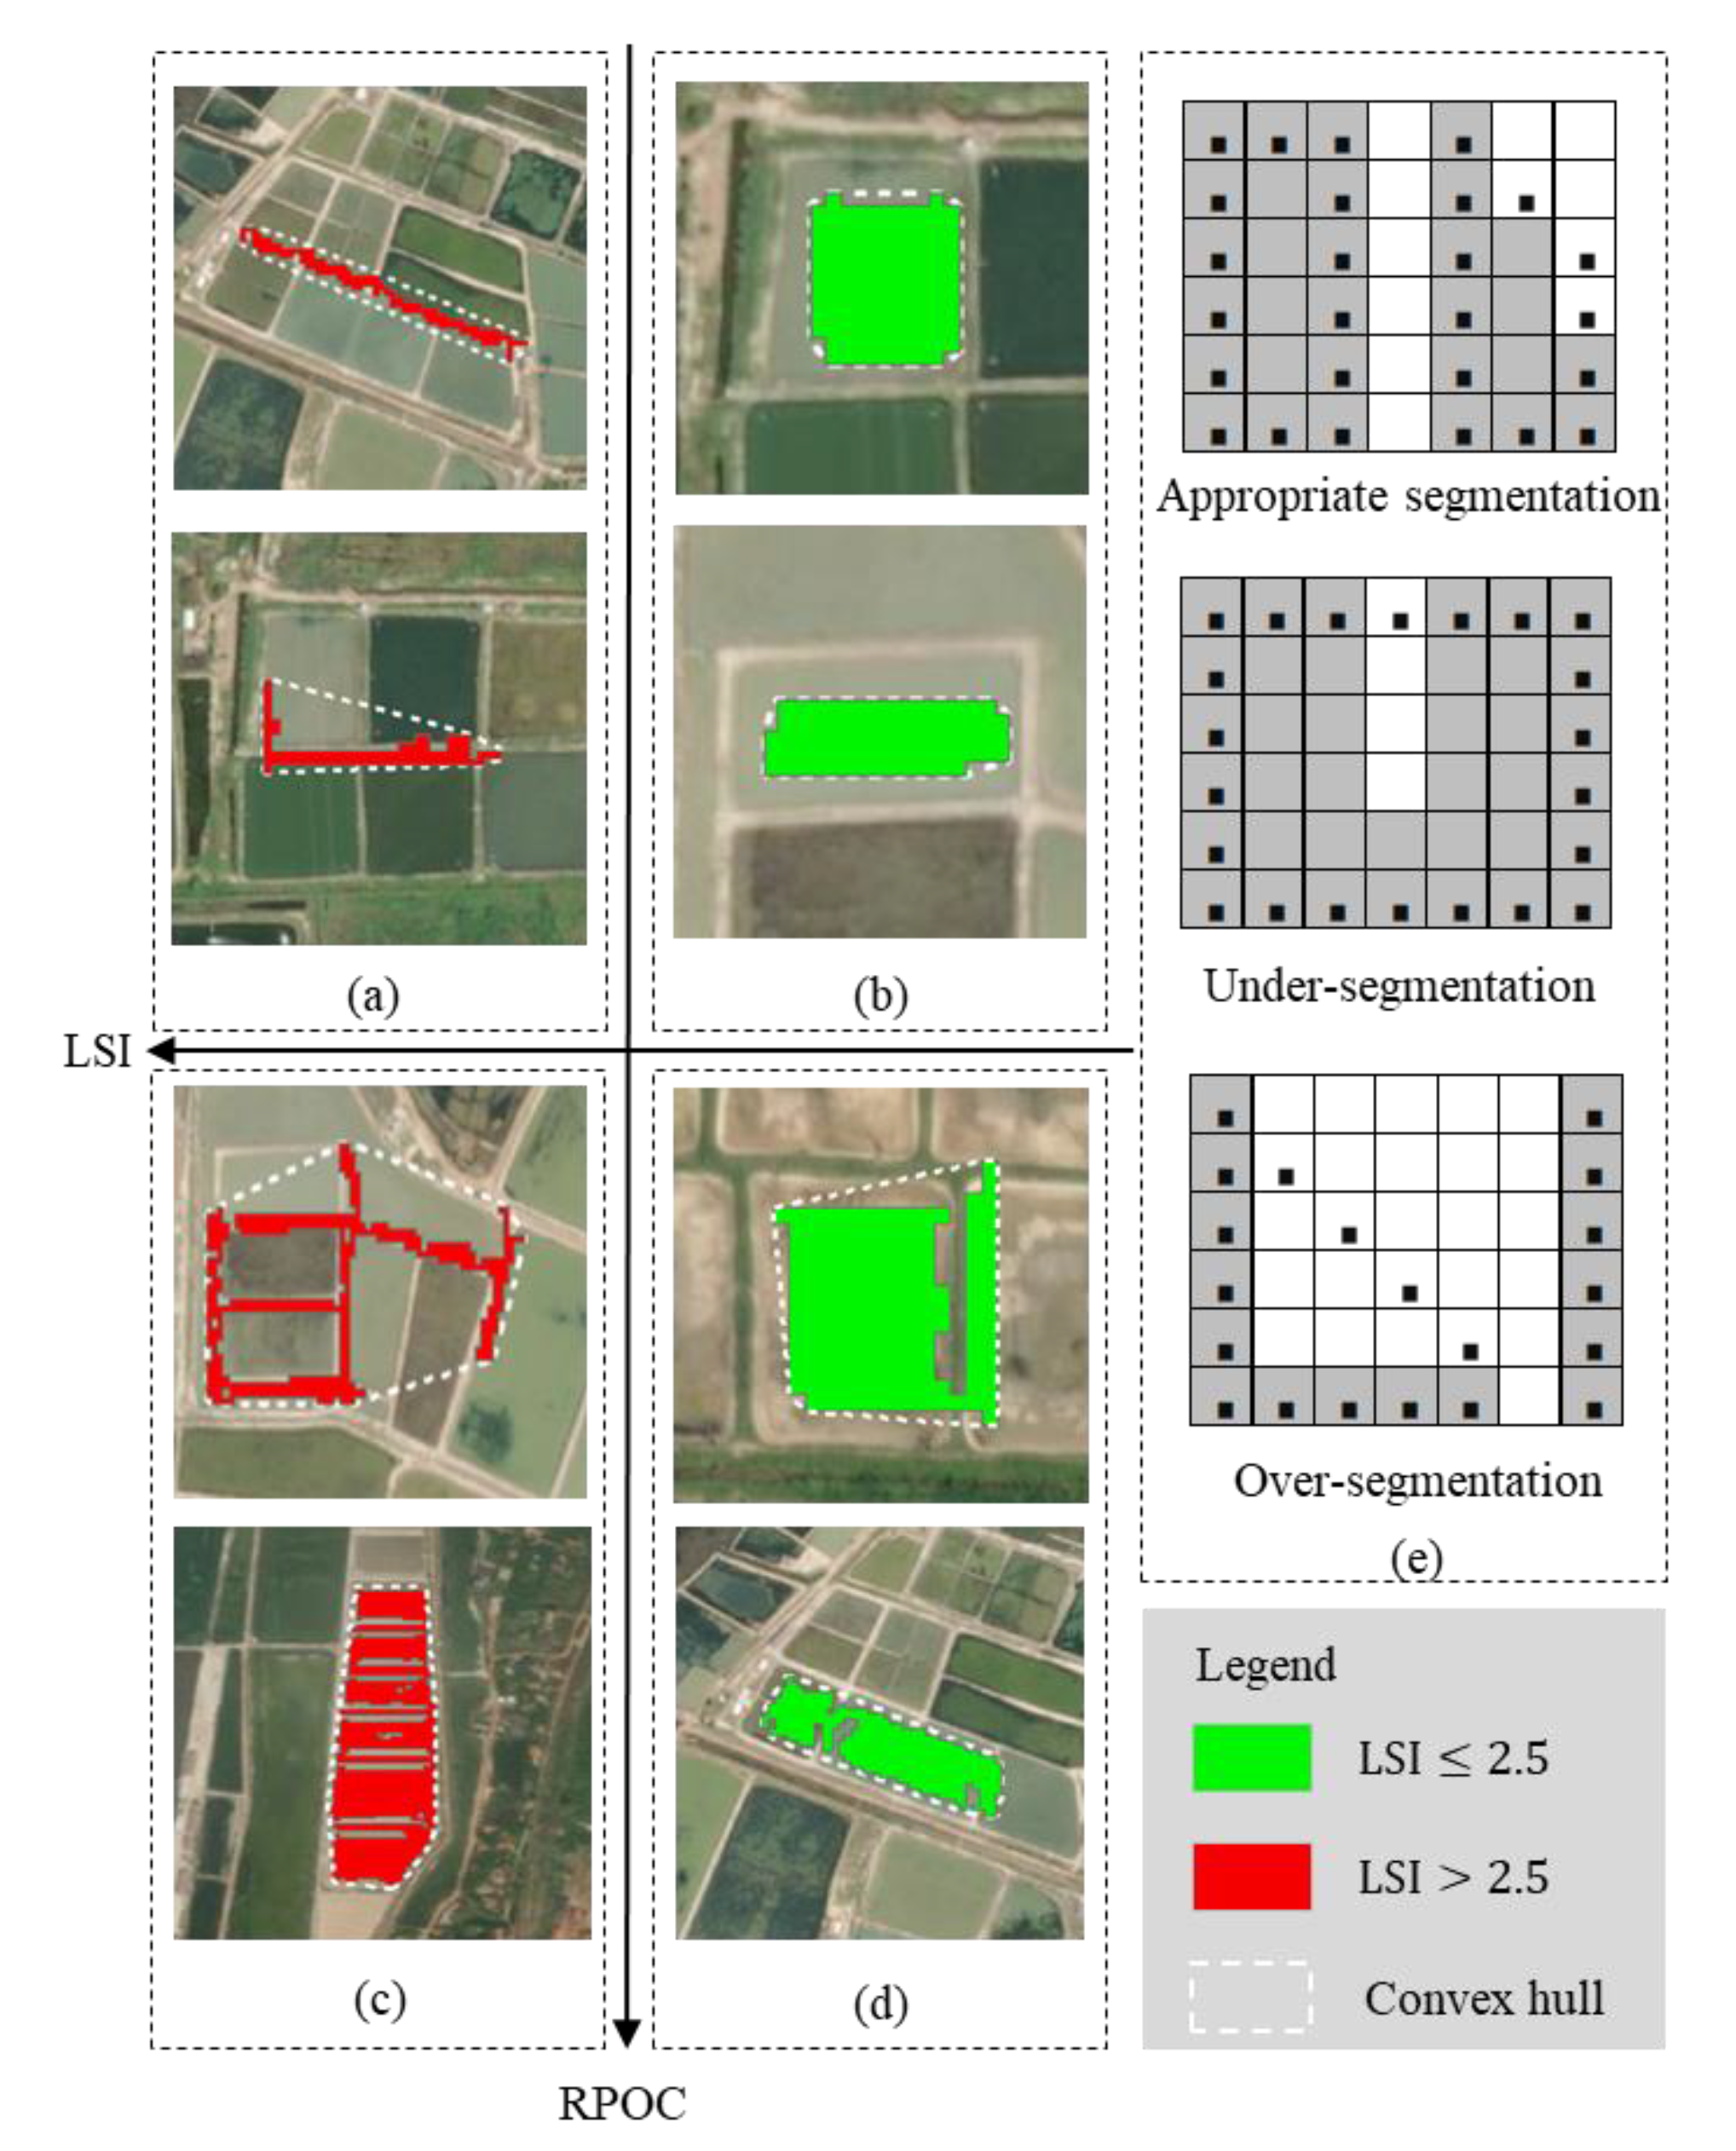
3.2.2. Segmentation Degree Detection
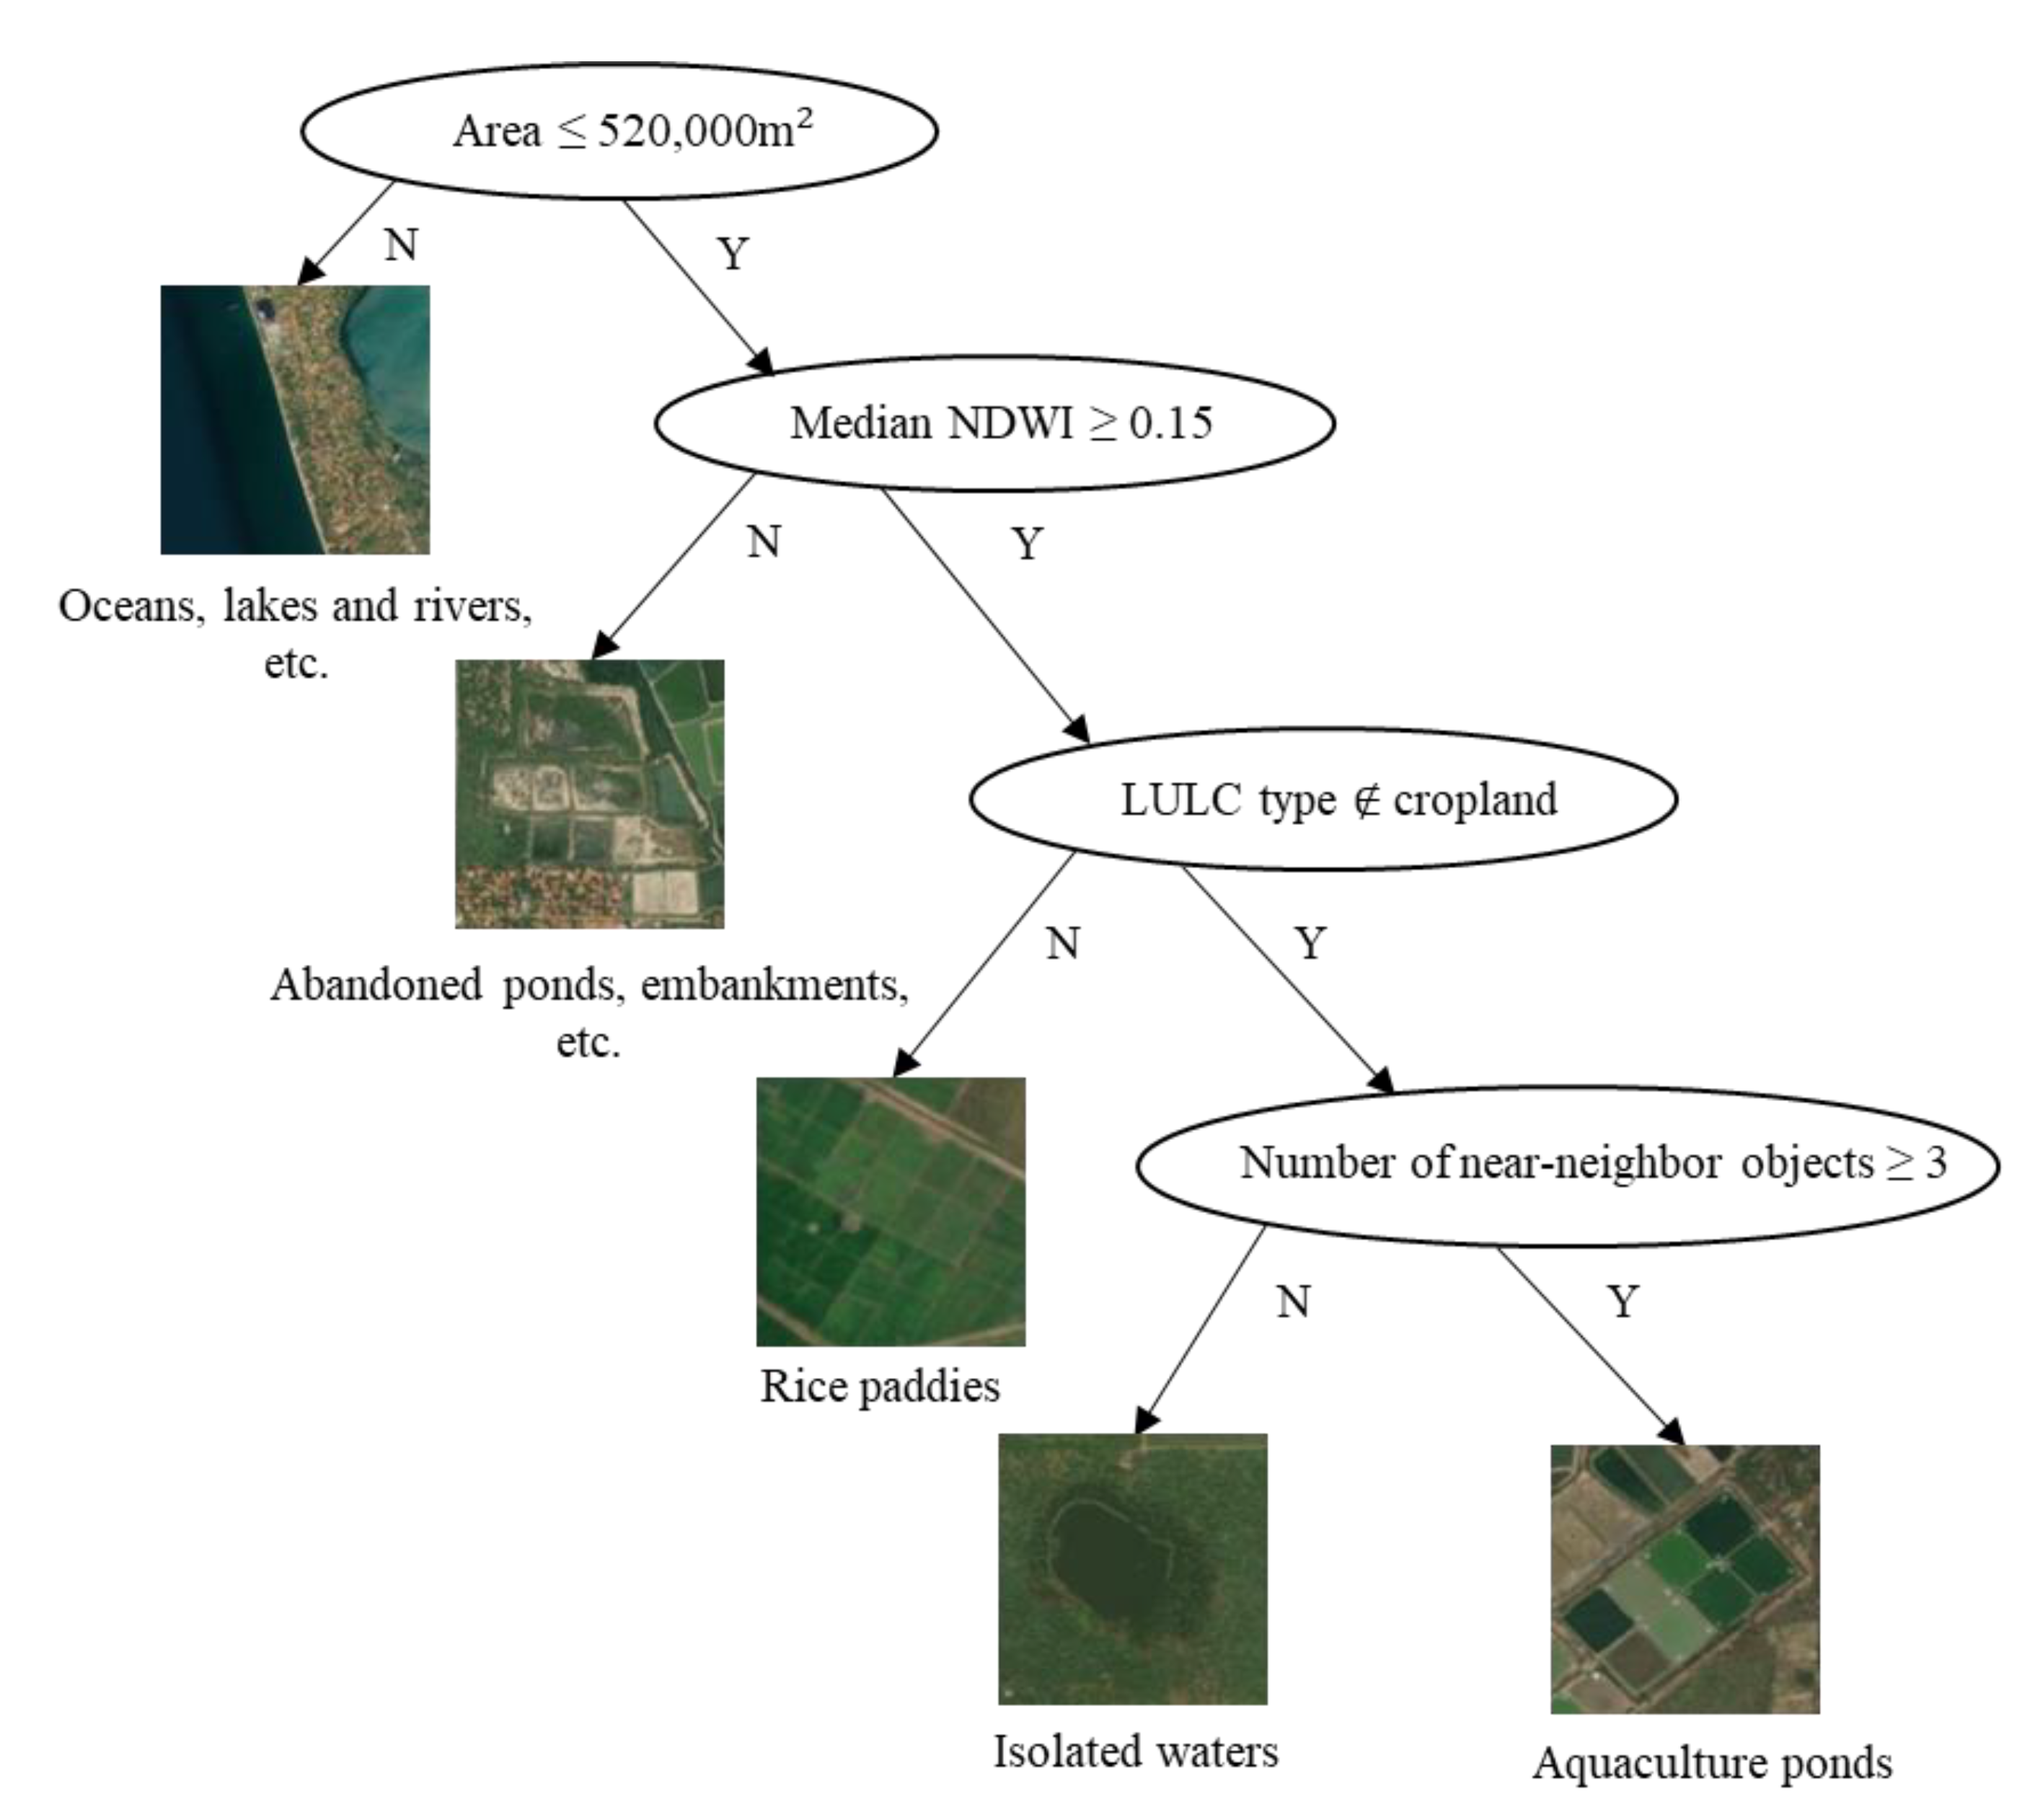
3.3. Aquaculture Ponds Extraction
4. Results
4.1. Mapping Aquaculture Ponds
4.2. SOAPs Extraction Accuracy Assessment
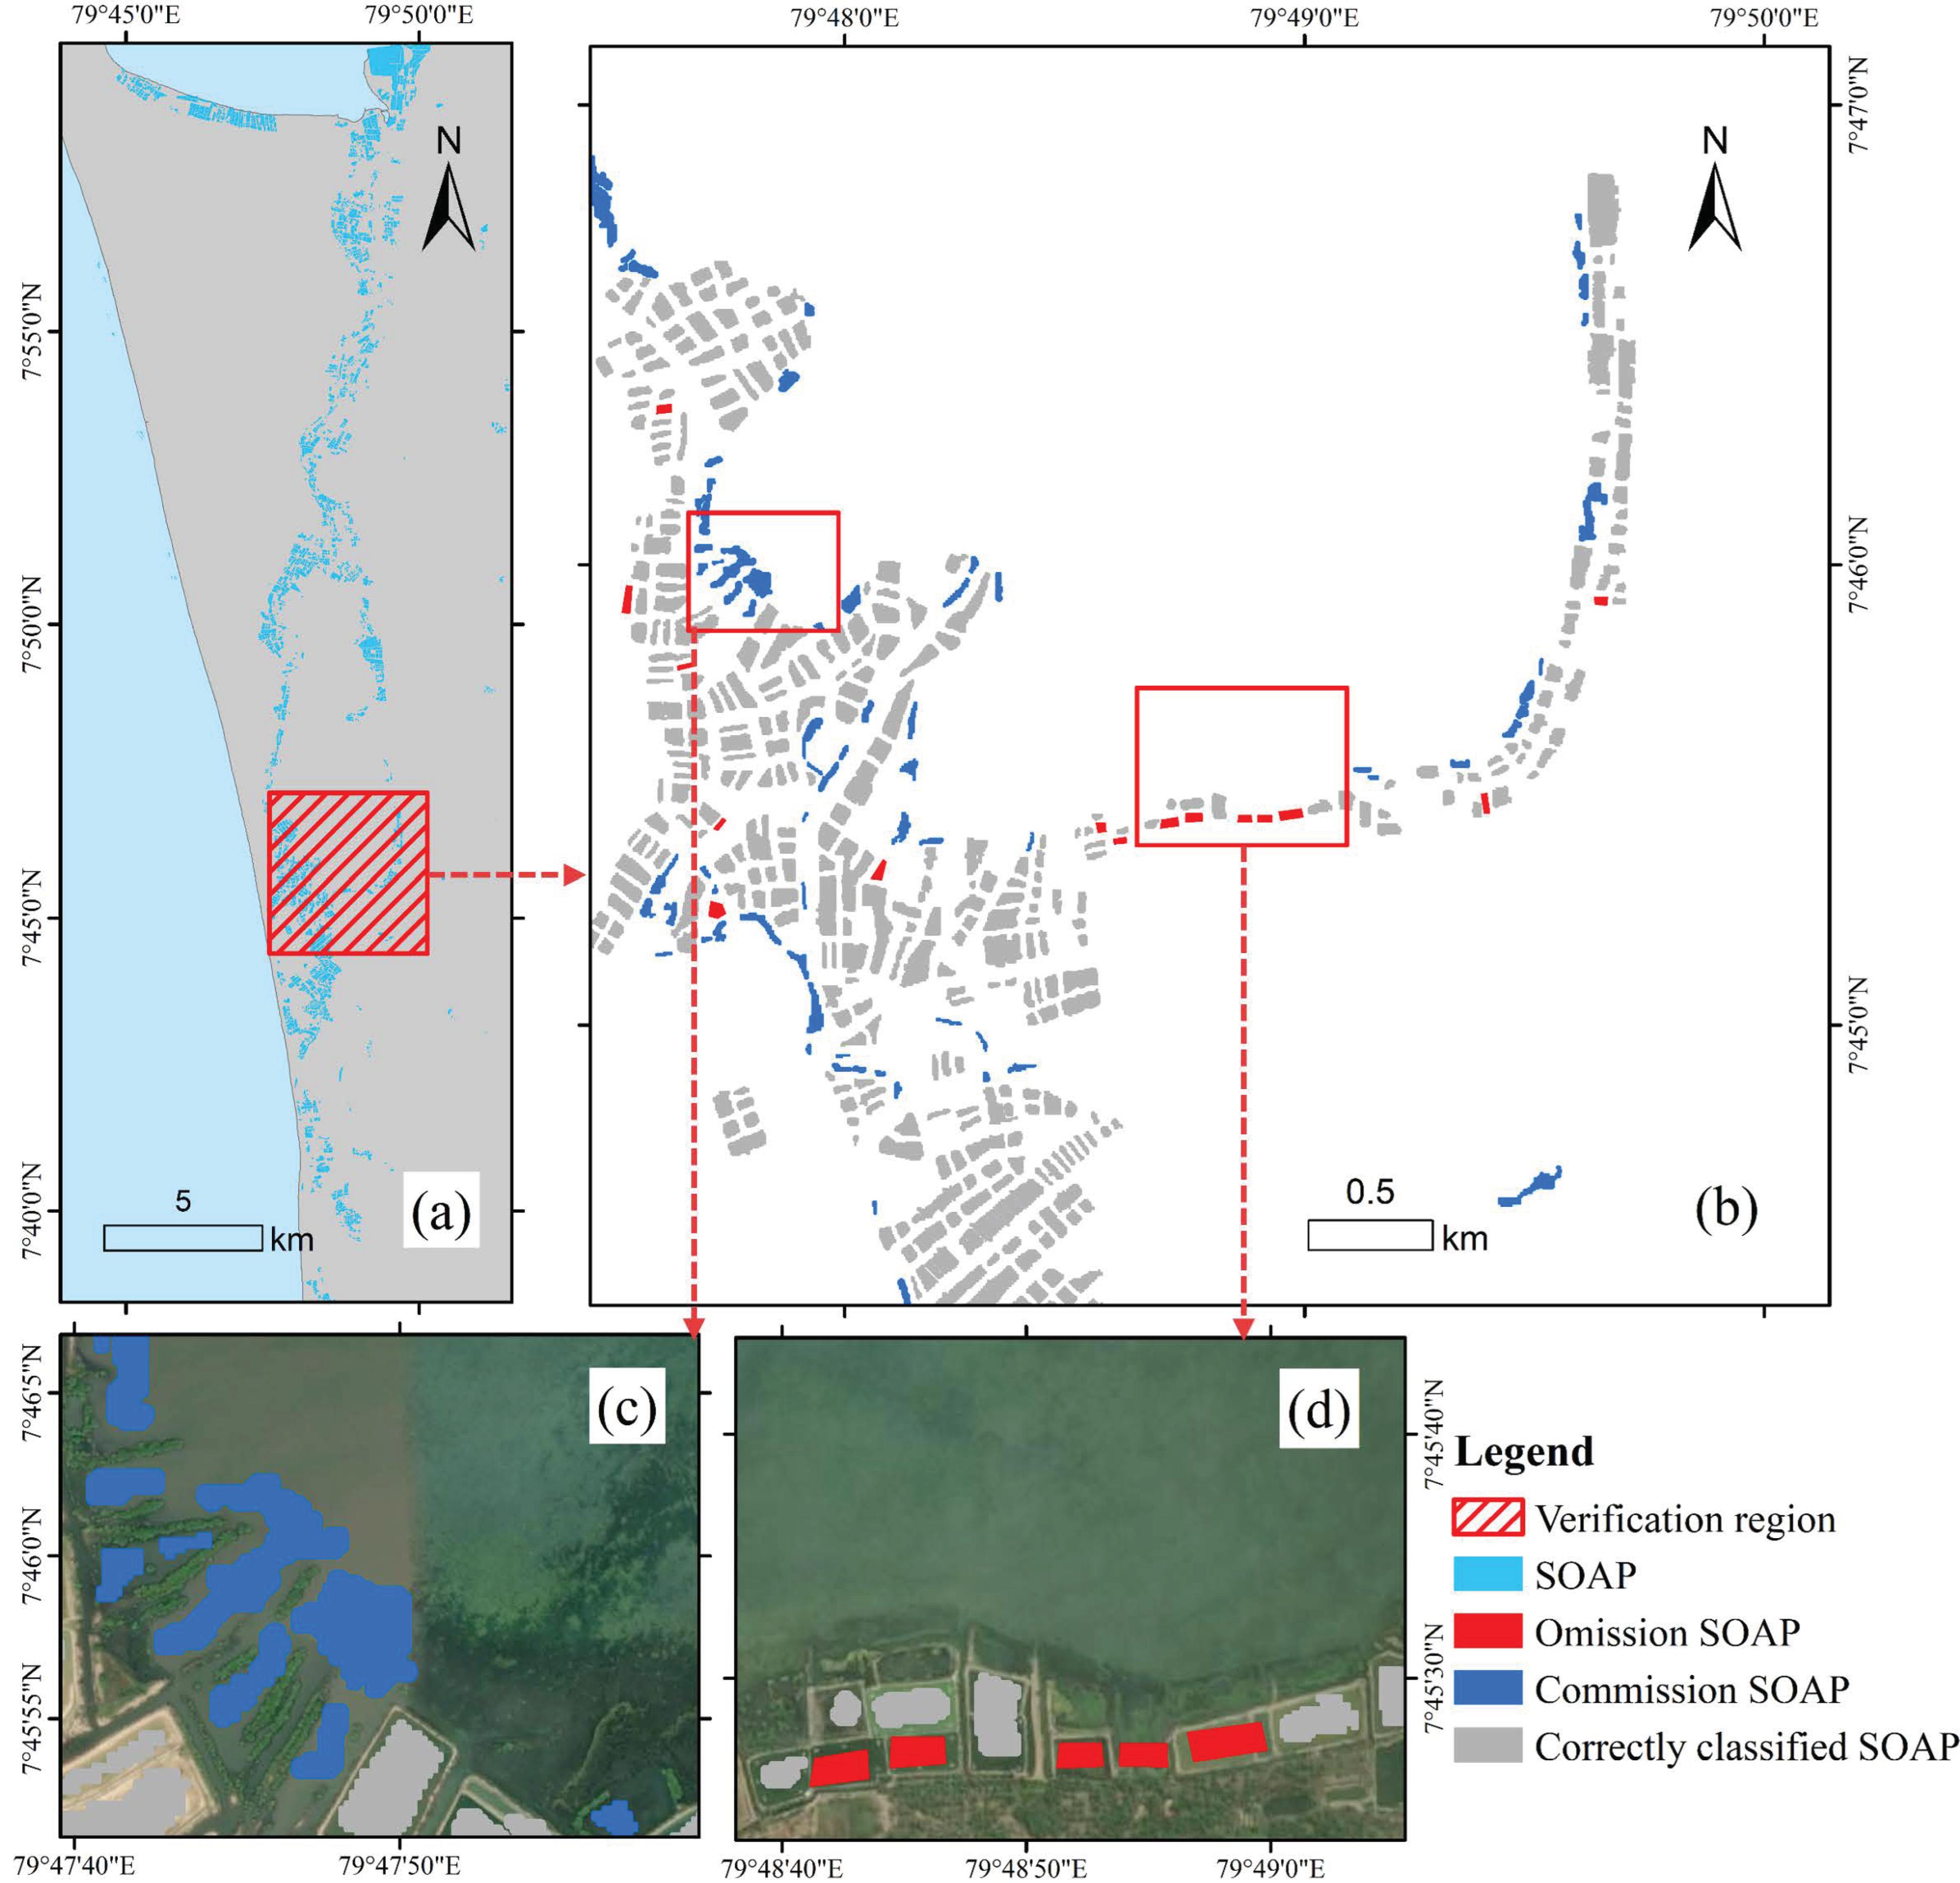
4.2.1. Classification Accuracy Assessment
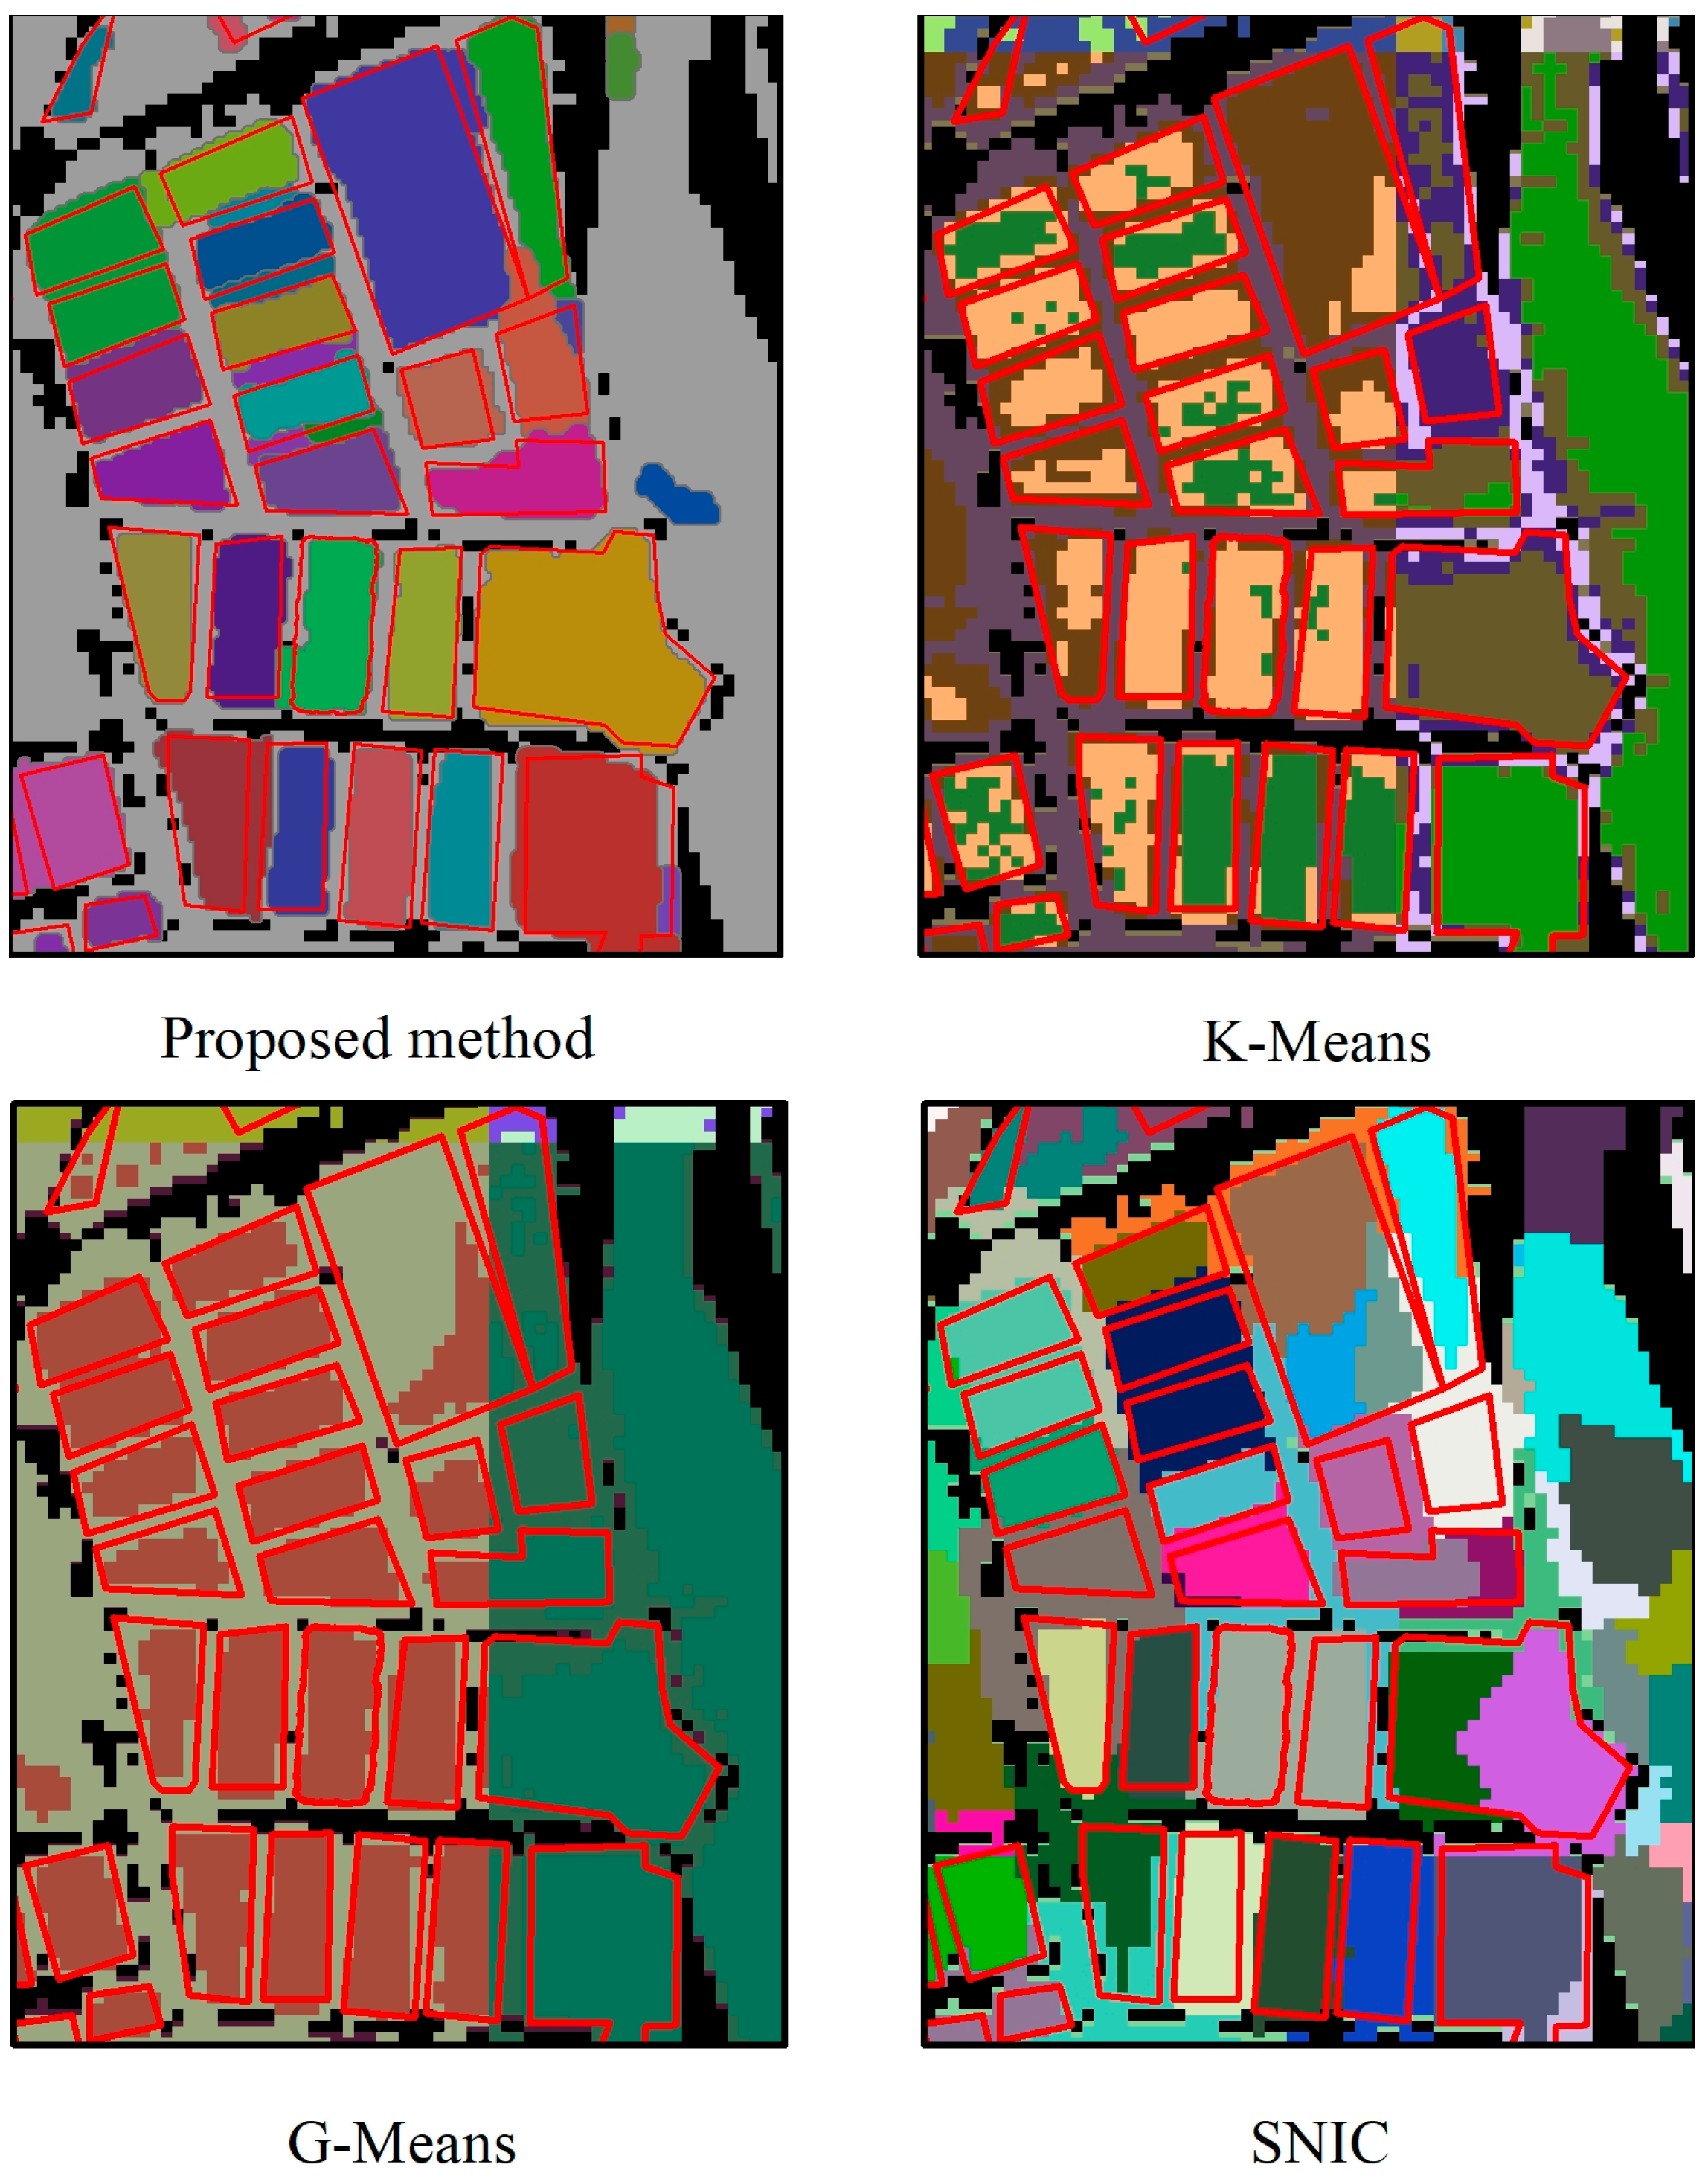
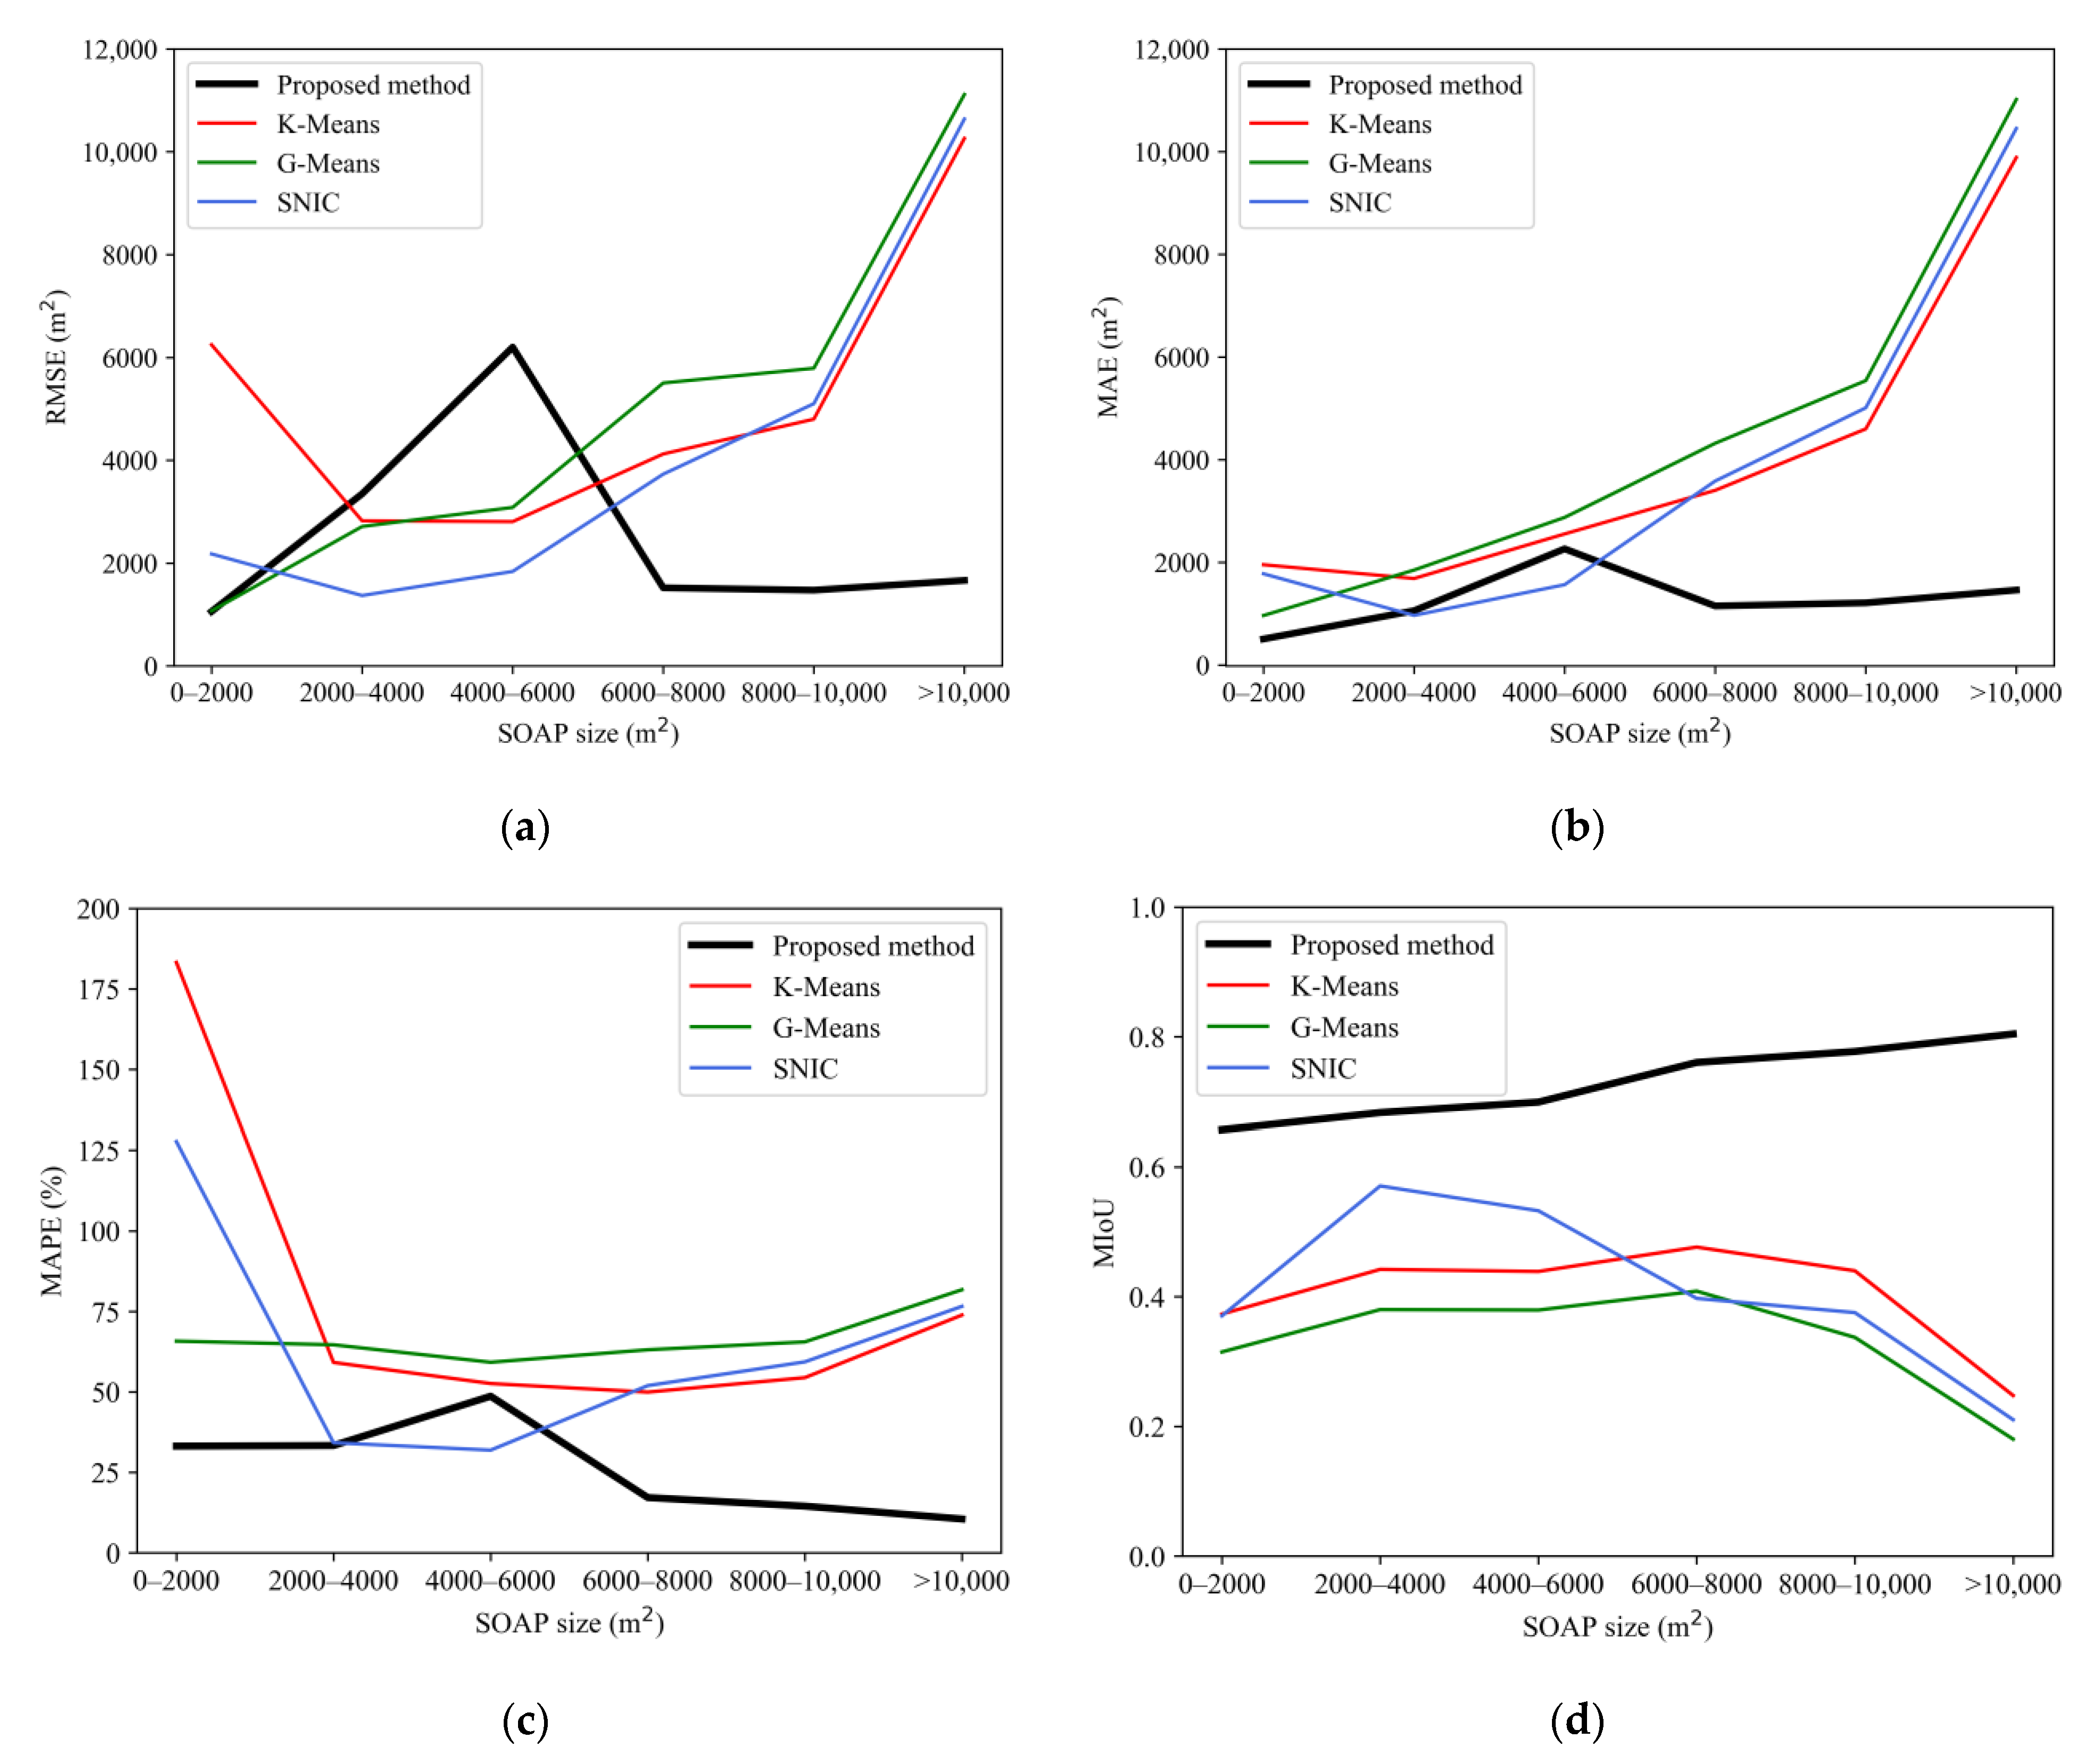
4.2.2. Segmentation Accuracy Assessment and Comparison
5. Discussion
5.1. A Transferable Approach
5.2. Future Work
6. Conclusions
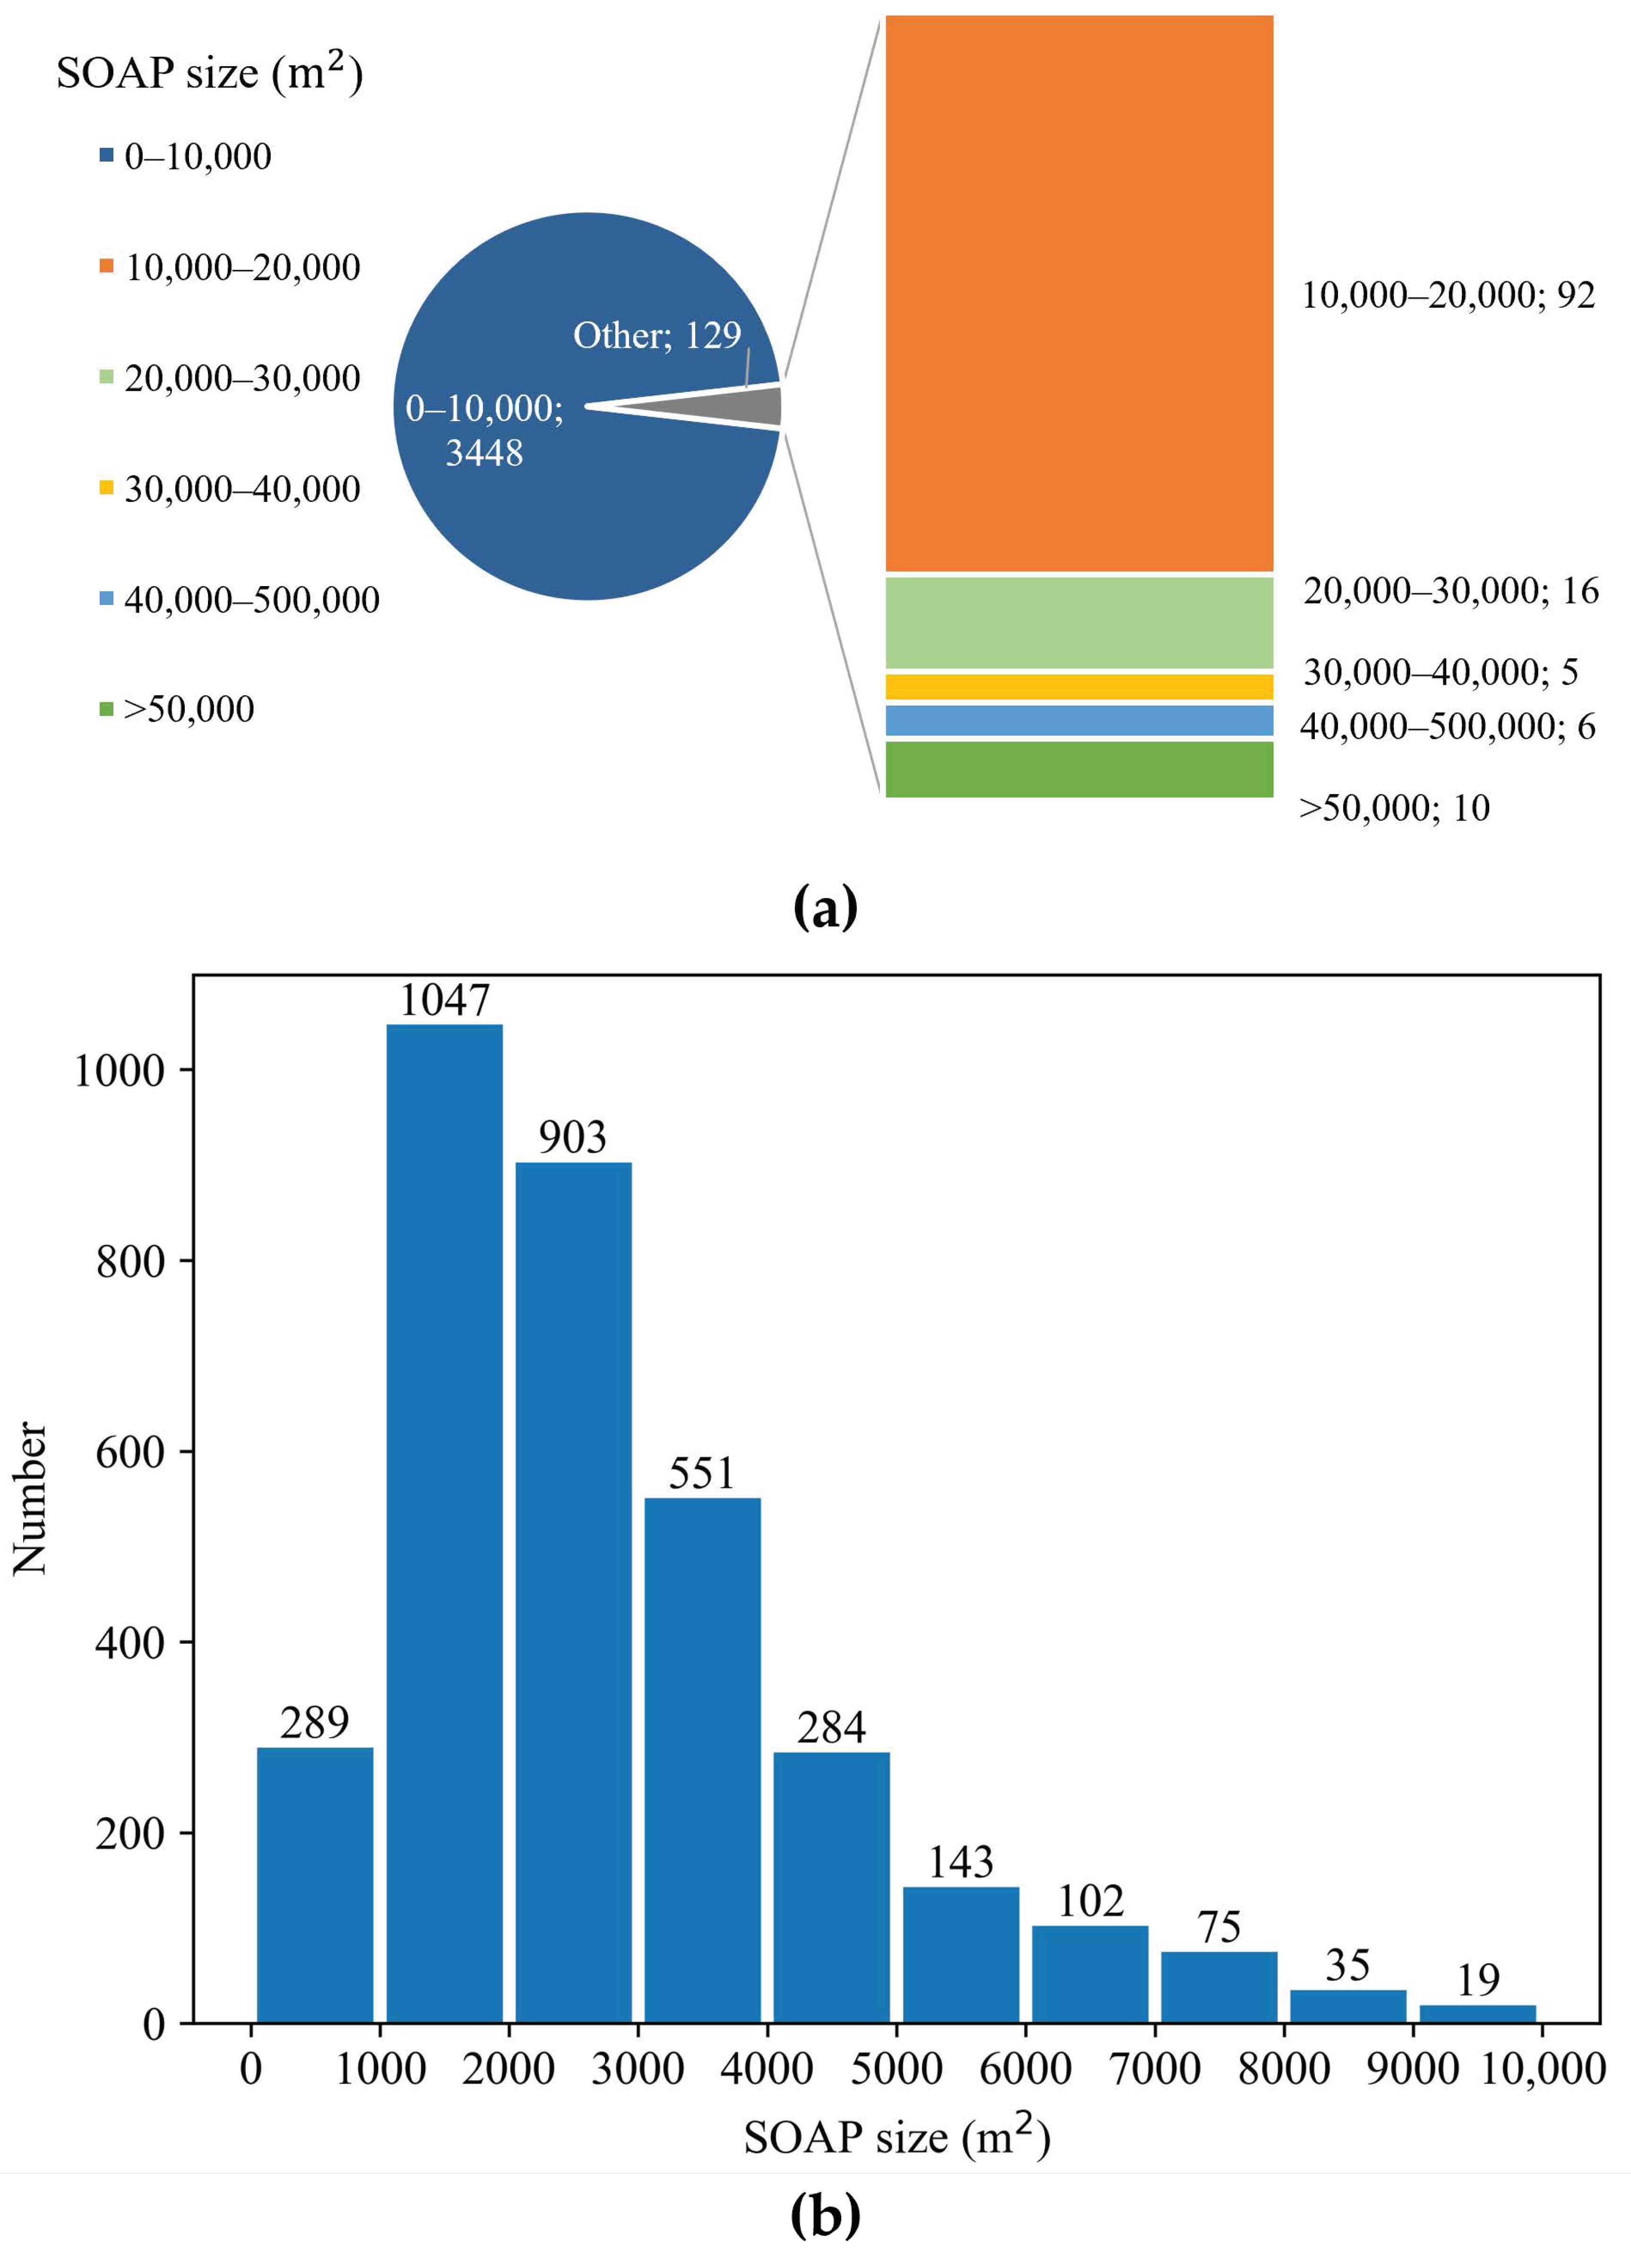
- A total of 3577 aquaculture ponds were extracted in the study region, with a total area of 13,208,439.33 . Most aquaculture ponds were 0–10,000 in size, accounting for 96.39% of all SOAPs extracted in this study, indicating that the aquaculture industry in the study region is dominated by small-scale ponds.
- The proposed method could extract SOAPs with high accuracy. The relative error of the total areas between labeled SOAPs and extracted SOAPs was 1.13%, and the omission errors of labeled SOAPs were 3.46% in number and 1.95% in area, revealing that our method could effectively map aquaculture ponds.
- The proposed method showed better performance in segmenting SOAPs than K-Means, G-Means, and SNIC methods provided by GEE. The MIoU of our method was 0.6965, representing an improvement of between 0.1925 and 0.3268 over the comparative methods. The MIoUs of the proposed methods at all SOAP size classes were higher than those of the comparative methods, indicating that our method is superior to widely used image segmentation algorithms in segmenting SOAPs.
Author Contributions
Funding
Data Availability Statement
Acknowledgments
Conflicts of Interest
Appendix A
References
- Zhang, W.; Belton, B.; Edwards, P.; Henriksson, P.J.; Little, D.C.; Newton, R.; Troell, M. Aquaculture Will Continue to Depend More on Land than Sea. Nature 2022, 603, E2–E4. [Google Scholar] [CrossRef] [PubMed]
- Sandström, V.; Chrysafi, A.; Lamminen, M.; Troell, M.; Jalava, M.; Piipponen, J.; Siebert, S.; van Hal, O.; Virkki, V.; Kummu, M. Food System By-Products Upcycled in Livestock and Aquaculture Feeds Can Increase Global Food Supply. Nat. Food 2022, 3, 729–740. [Google Scholar] [CrossRef]
- Stiller, D.; Ottinger, M.; Leinenkugel, P. Spatio-Temporal Patterns of Coastal Aquaculture Derived from Sentinel-1 Time Series Data and the Full Landsat Archive. Remote Sens. 2019, 11, 1707. [Google Scholar] [CrossRef]
- Ottinger, M.; Bachofer, F.; Huth, J.; Kuenzer, C. Mapping Aquaculture Ponds for the Coastal Zone of Asia with Sentinel-1 and Sentinel-2 Time Series. Remote Sens. 2021, 14, 153. [Google Scholar] [CrossRef]
- Nasr-Allah, A.; Gasparatos, A.; Karanja, A.; Dompreh, E.B.; Murphy, S.; Rossignoli, C.M.; Phillips, M.; Charo-Karisa, H. Employment Generation in the Egyptian Aquaculture Value Chain: Implications for Meeting the Sustainable Development Goals (SDGs). Aquaculture 2020, 520, 734940. [Google Scholar] [CrossRef]
- Food and Agriculture Organization (FAO). The State of World Fisheries and Aquaculture 2020. Sustainability in Action; FAO: Rome, Italy, 2020; ISBN 978-92-5-132692-3. [Google Scholar]
- Wu, X.; Fu, B.; Wang, S.; Song, S.; Li, Y.; Xu, Z.; Wei, Y.; Liu, J. Decoupling of SDGs Followed by Re-Coupling as Sustainable Development Progresses. Nat. Sustain. 2022, 5, 452–459. [Google Scholar] [CrossRef]
- Wang, B.; Cao, L.; Micheli, F.; Naylor, R.L.; Fringer, O.B. The Effects of Intensive Aquaculture on Nutrient Residence Time and Transport in a Coastal Embayment. Environ. Fluid Mech. 2018, 18, 1321–1349. [Google Scholar] [CrossRef]
- Neofitou, N.; Papadimitriou, K.; Domenikiotis, C.; Tziantziou, L.; Panagiotaki, P. GIS in Environmental Monitoring and Assessment of Fish Farming Impacts on Nutrients of Pagasitikos Gulf, Eastern Mediterranean. Aquaculture 2019, 501, 62–75. [Google Scholar] [CrossRef]
- Herbeck, L.S.; Krumme, U.; Andersen, T.J.; Jennerjahn, T.C. Decadal Trends in Mangrove and Pond Aquaculture Cover on Hainan (China) since 1966: Mangrove Loss, Fragmentation and Associated Biogeochemical Changes. Estuar. Coast. Shelf Sci. 2020, 233, 106531. [Google Scholar] [CrossRef]
- Emenike, E.C.; Iwuozor, K.O.; Anidiobi, S.U. Heavy Metal Pollution in Aquaculture: Sources, Impacts and Mitigation Techniques. Biol. Trace Elem. Res. 2022, 200, 4476–4492. [Google Scholar] [CrossRef]
- United Nations for Disaster Risk Reduction (UNISDR) Technical Guidance for Monitoring and Reporting on Progress in Achieving the Global Targets of the Sendai Framework for Disaster Risk Reduction. Available online: https://www.preventionweb.net/publication/technical-guidance-monitoring-and-reporting-progress-achieving-global-targets-sendai (accessed on 30 May 2022).
- Duan, Y.; Li, X.; Zhang, L.; Chen, D.; Liu, S.; Ji, H. Mapping National-Scale Aquaculture Ponds Based on the Google Earth Engine in the Chinese Coastal Zone. Aquaculture 2020, 520, 734666. [Google Scholar] [CrossRef]
- Food and Agriculture Organization (FAO). The State of World Fisheries and Aquaculture 2022. Towards Blue Transformation; FAO: Rome, Italy, 2022; ISBN 978-92-5-136364-5. [Google Scholar]
- Duan, Y.; Tian, B.; Li, X.; Liu, D.; Sengupta, D.; Wang, Y.; Peng, Y. Tracking Changes in Aquaculture Ponds on the China Coast Using 30 Years of Landsat Images. Int. J. Appl. Earth Obs. Geoinf. 2021, 102, 102383. [Google Scholar] [CrossRef]
- Hukom, V.; Nielsen, R.; Asmild, M.; Nielsen, M. Do Aquaculture Farmers Have an Incentive to Maintain Good Water Quality? The Case of Small-Scale Shrimp Farming in Indonesia. Ecol. Econ. 2020, 176, 106717. [Google Scholar] [CrossRef]
- Isikdogan, F.; Bovik, A.C.; Passalacqua, P. Surface Water Mapping by Deep Learning. IEEE J. Sel. Top. Appl. Earth Obs. Remote Sens. 2017, 10, 4909–4918. [Google Scholar] [CrossRef]
- Mayer, T.; Poortinga, A.; Bhandari, B.; Nicolau, A.P.; Markert, K.; Thwal, N.S.; Markert, A.; Haag, A.; Kilbride, J.; Chishtie, F.; et al. Deep Learning Approach for Sentinel-1 Surface Water Mapping Leveraging Google Earth Engine. ISPRS Open J. Photogramm. Remote Sens. 2021, 2, 100005. [Google Scholar] [CrossRef]
- Orusa, T.; Cammareri, D.; Borgogno Mondino, E.B. A Possible Land Cover EAGLE Approach to Overcome Remote Sensing Limitations in the Alps Based on Sentinel-1 and Sentinel-2: The Case of Aosta Valley (NW Italy). Remote Sens. 2022, 15, 178. [Google Scholar] [CrossRef]
- Ottinger, M.; Clauss, K.; Kuenzer, C. Opportunities and Challenges for the Estimation of Aquaculture Production Based on Earth Observation Data. Remote Sens. 2018, 10, 1076. [Google Scholar] [CrossRef]
- Rajitha, K.; Mukherjee, C.K.; Vinu Chandran, R. Applications of Remote Sensing and GIS for Sustainable Management of Shrimp Culture in India. Aquac. Eng. 2007, 36, 1–17. [Google Scholar] [CrossRef]
- Gong, P.; Niu, Z.; Cheng, X.; Zhao, K.; Zhou, D.; Guo, J.; Liang, L.; Wang, X.; Li, D.; Huang, H.; et al. China’s wetland change (1990–2000) determined by remote sensing. Sci. China Earth Sci. 2010, 53, 1036–1042. [Google Scholar] [CrossRef]
- Wang, Z.; Zhang, J.; Yang, X.; Huang, C.; Su, F.; Liu, X.; Liu, Y.; Zhang, Y. Global Mapping of the Landside Clustering of Aquaculture Ponds from Dense Time-Series 10 m Sentinel-2 Images on Google Earth Engine. Int. J. Appl. Earth Obs. Geoinf. 2022, 115, 103100. [Google Scholar] [CrossRef]
- Hou, Y.; Zhao, G.; Chen, X.; Yu, X. Improving Satellite Retrieval of Coastal Aquaculture Pond by Adding Water Quality Parameters. Remote Sens. 2022, 14, 3306. [Google Scholar] [CrossRef]
- Peng, Y.; Sengupta, D.; Duan, Y.; Chen, C.; Tian, B. Accurate Mapping of Chinese Coastal Aquaculture Ponds Using Biophysical Parameters Based on Sentinel-2 Time Series Images. Mar. Pollut. Bull. 2022, 181, 113901. [Google Scholar] [CrossRef] [PubMed]
- Gusmawati, N.F.; Zhi, C.; Soulard, B.; Lemonnier, H.; Selmaoui-Folcher, N. Aquaculture Pond Precise Mapping in Perancak Estuary, Bali, Indonesia. J. Coast. Res. 2016, 75, 637–641. [Google Scholar] [CrossRef]
- Gusmawati, N.; Soulard, B.; Selmaoui-Folcher, N.; Proisy, C.; Mustafa, A.; Le Gendre, R.; Laugier, T.; Lemonnier, H. Surveying Shrimp Aquaculture Pond Activity Using Multitemporal VHSR Satellite Images-Case Study from the Perancak Estuary, Bali, Indonesia. Mar. Pollut. Bull. 2018, 131, 49–60. [Google Scholar] [CrossRef] [PubMed]
- Shi, T.; Zou, Z.; Shi, Z.; Chu, J.; Zhao, J.; Gao, N.; Zhang, N.; Zhu, X. Mudflat Aquaculture Labeling for Infrared Remote Sensing Images via a Scanning Convolutional Network. Infrared Phys. Technol. 2018, 94, 16–22. [Google Scholar] [CrossRef]
- Zou, Z.; Chen, C.; Liu, Z.; Zhang, Z.; Liang, J.; Chen, H.; Wang, L. Extraction of Aquaculture Ponds along Coastal Region Using U2-Net Deep Learning Model from Remote Sensing Images. Remote Sens. 2022, 14, 4001. [Google Scholar] [CrossRef]
- Daw, A.; Karpatne, A.; Watkins, W.; Read, J.; Kumar, V. Physics-Guided Neural Networks (PGNN): An Application in Lake Temperature Modeling. arXiv 2021, arXiv:1710.11431. [Google Scholar]
- Sun, Z.; Luo, J.; Yang, J.; Yu, Q.; Zhang, L.; Xue, K.; Lu, L. Nation-Scale Mapping of Coastal Aquaculture Ponds with Sentinel-1 SAR Data Using Google Earth Engine. Remote Sens. 2020, 12, 3086. [Google Scholar] [CrossRef]
- Wen, K.; Yao, H.; Huang, Y.; Chen, H.; Liao, P. Remote Sensing Image Extraction for Coastal Aquaculture Ponds in the Guangxi Beibu Gulf based on Google Earth Engine. Trans. Chin. Soc. Agric. Eng. 2021, 37, 280–288. [Google Scholar] [CrossRef]
- Asbjorn, D. Aquaculture in Sri Lanka: History, Current Status and Future Potential. Int. J. Aquac. Fish. Sci. 2020, 6, 102–105. [Google Scholar] [CrossRef]
- Ahmed, N.; Azra, M.N. Aquaculture Production and Value Chains in the COVID-19 Pandemic. Curr. Environ. Health Rep. 2022, 9, 423–435. [Google Scholar] [CrossRef] [PubMed]
- Gorelick, N.; Hancher, M.; Dixon, M.; Ilyushchenko, S.; Thau, D.; Moore, R. Google Earth Engine: Planetary-Scale Geospatial Analysis for Everyone. Remote Sens. Environ. 2017, 202, 18–27. [Google Scholar] [CrossRef]
- Bao, W.; Gong, A.; Zhang, T.; Zhao, Y.; Li, B.; Chen, S. Mapping Population Distribution with High Spatiotemporal Resolution in Beijing Using Baidu Heat Map Data. Remote Sens. 2023, 15, 458. [Google Scholar] [CrossRef]
- Yang, L.; Mansaray, L.; Huang, J.; Wang, L. Optimal Segmentation Scale Parameter, Feature Subset and Classification Algorithm for Geographic Object-Based Crop Recognition Using Multisource Satellite Imagery. Remote Sens. 2019, 11, 514. [Google Scholar] [CrossRef]
- McFeeters, S.K. The Use of the Normalized Difference Water Index (NDWI) in the Delineation of Open Water Features. Int. J. Remote Sens. 1996, 17, 1425–1432. [Google Scholar] [CrossRef]
- Xu, H. Modification of Normalised Difference Water Index (NDWI) to Enhance Open Water Features in Remotely Sensed Imagery. Int. J. Remote Sens. 2006, 27, 3025–3033. [Google Scholar] [CrossRef]
- Feyisa, G.L.; Meilby, H.; Fensholt, R.; Proud, S.R. Automated Water Extraction Index: A New Technique for Surface Water Mapping Using Landsat Imagery. Remote Sens. Environ. 2014, 140, 23–35. [Google Scholar] [CrossRef]
- Pukelsheim, F. The Three Sigma Rule. Am. Stat. 1994, 48, 88–91. [Google Scholar] [CrossRef]
- Deng, Y.; Jiang, W.; Tang, Z.; Ling, Z.; Wu, Z. Long-Term Changes of Open-Surface Water Bodies in the Yangtze River Basin Based on the Google Earth Engine Cloud Platform. Remote Sens. 2019, 11, 2213. [Google Scholar] [CrossRef]
- Canny, J.F. A Computational Approach to Edge Detection. IEEE Trans. Pattern Anal. Mach. Intell. 1986, 8, 679–698. [Google Scholar] [CrossRef]
- Rishikeshan, C.A.; Ramesh, H. An Automated Mathematical Morphology Driven Algorithm for Water Body Extraction from Remotely Sensed Images. ISPRS J. Photogramm. Remote Sens. 2018, 146, 11–21. [Google Scholar] [CrossRef]
- Nachtegael, M.; Kerre, E.E. Connections between Binary, Gray-Scale and Fuzzy Mathematical Morphologies. Fuzzy Sets Syst. 2001, 124, 73–85. [Google Scholar] [CrossRef]
- Samet, H. Connected Component Labeling Using Quadtrees. J. ACM 1981, 28, 487–501. [Google Scholar] [CrossRef]
- Zeng, Z.; Wang, D.; Tan, W.; Huang, J. Extracting Aquaculture Ponds from Natural Water Surfaces around Inland Lakes on Medium Resolution Multispectral Images. Int. J. Appl. Earth Obs. Geoinf. 2019, 80, 13–25. [Google Scholar] [CrossRef]
- Gyenizse, P.; Bognár, Z.; Czigány, S.; Elekes, T. Landscape Shape Index, as a Potencial Indicator of Urban Development in Hungary. Landsc. Environ. 2014, 8, 78–88. [Google Scholar]
- Hou, X.; Feng, L.; Tang, J.; Song, X.-P.; Liu, J.; Zhang, Y.; Wang, J.; Xu, Y.; Dai, Y.; Zheng, Y. Anthropogenic Transformation of Yangtze Plain Freshwater Lakes: Patterns, Drivers and Impacts. Remote Sens. Environ. 2020, 248, 111998. [Google Scholar] [CrossRef]
- Krishna, K.; Murty, M.N. Genetic K-Means Algorithm. IEEE Trans. Syst. Man Cybern. Part B 1999, 29, 433–439. [Google Scholar] [CrossRef]
- Hamerly, G.; Elkan, C. Learning the k in K-Means. Adv. Neural Inf. Process. Syst. 2003, 16. [Google Scholar] [CrossRef]
- Achanta, R.; Susstrunk, S. Superpixels and Polygons Using Simple Non-Iterative Clustering. In Proceedings of the IEEE Conference on Computer Vision and Pattern Recognition, Honolulu, HI, USA, 21–26 July 2017; pp. 4651–4660. [Google Scholar]
- Cui, B.; Fei, D.; Shao, G.; Lu, Y.; Chu, J. Extracting Raft Aquaculture Areas from Remote Sensing Images via an Improved U-Net with a PSE Structure. Remote Sens. 2019, 11, 2053. [Google Scholar] [CrossRef]
- Li, B.; Gong, A.; Zeng, T.; Bao, W.; Xu, C.; Huang, Z. A Zoning Earthquake Casualty Prediction Model Based on Machine Learning. Remote Sens. 2021, 14, 30. [Google Scholar] [CrossRef]
- Bao, W.; Gong, A.; Zhao, Y.; Chen, S.; Ba, W.; He, Y. High-Precision Population Spatialization in Metropolises Based on Ensemble Learning: A Case Study of Beijing, China. Remote Sens. 2022, 14, 3654. [Google Scholar] [CrossRef]


| Band Name | Description | Spatial Resolution (m) | Wavelength (nm) |
|---|---|---|---|
| B2 | Blue | 10 | 496.6 (S2A)/492.1 (S2B) |
| B3 | Green | 10 | 560 (S2A)/559 (S2B) |
| B4 | Red | 10 | 664.5 (S2A)/665 (S2B) |
| B8 | NIR 1 | 10 | 835.1 (S2A)/833 (S2B) |
| B11 | SWIR 2 1 | 20 | 1613.7 (S2A)/1610.4 (S2B) |
| B12 | SWIR 2 | 20 | 2202.4 (S2A)/2185.7 (S2B) |
| QA60 3 | Cloud mask | 60 | —— |
| SOAP Size | Number | Omission | Omission (%) | Omission % from Total Number | Omission Area (%) | Omission (%) from Total Area | ||
|---|---|---|---|---|---|---|---|---|
| All | 433 | 15 | 3.46 | 3.46 | 1,737,425.02 | 33,919.10 | 1.95 | 1.95 |
| ≤2000 | 63 | 7 | 11.11 | 1.62 | 91,731.57 | 10,979.46 | 11.97 | 0.63 |
| 2000–4000 | 202 | 8 | 3.96 | 1.85 | 603,841.49 | 22,939.64 | 3.80 | 1.32 |
| 4000–6000 | 100 | 0 | 0.00 | 0.00 | 485,161.17 | 0.00 | 0.00 | 0.00 |
| 6000–8000 | 47 | 0 | 0.00 | 0.00 | 324,497.41 | 0.00 | 0.00 | 0.00 |
| 8000–10,000 | 12 | 0 | 0.00 | 0.00 | 102,317.70 | 0.00 | 0.00 | 0.00 |
| >10,000 | 9 | 0 | 0.00 | 0.00 | 129,875.68 | 0.00 | 0.00 | 0.00 |
| SOAP Size | Number | Commission | Commission% | Commission % from Total Number | Area (m2) | Commission Area (m2) | Commission Area (%) | Commission (%) from Total Area |
|---|---|---|---|---|---|---|---|---|
| All | 526 | 94 | 17.87 | 17.87 | 17,57,058.66 | 231,476.63 | 13.17 | 13.17 |
| ≤2000 m2 | 171 | 52 | 30.41 | 9.89 | 236,285.85 | 64,936.18 | 27.48 | 3.70 |
| 2000–4000 | 208 | 26 | 12.50 | 4.94 | 595,886.07 | 75,470.61 | 12.67 | 4.30 |
| 4000–6000 | 90 | 12 | 13.33 | 2.28 | 433,611.42 | 60,642.55 | 13.99 | 3.45 |
| 6000–8000 | 37 | 2 | 5.41 | 0.38 | 252,144.04 | 13,836.04 | 5.49 | 0.79 |
| 8000–10,000 | 8 | 2 | 25.00 | 0.38 | 68,465.23 | 16,591.25 | 24.23 | 0.94 |
| >10,000 | 12 | 0 | 0.00 | 0.00 | 170,666.05 | 0.00 | 0.00 | 0.00 |
| Method | Parameters |
|---|---|
| Proposed method | Canny threshold = 0.2; LSI threshold = 2.5; RPOC threshold= 1.5; area threshold = 520,000; median NDWI threshold = 0.15; number threshold of near-neighbor objects = 3 |
| K-Means | numClusters = 6; numIterations = 20; neighborhoodSize = 0; forceConvergence = false; uniqueLabels = true |
| G-Means | numIterations = 10; pValue = 582; neighborhoodSize = 0; uniqueLabels = true |
| SNIC | size = 5; compactness = 1; connectivity = 4 |
| Method | MAPE (%) | MIoU | ||
|---|---|---|---|---|
| Proposed method | 3850.47 | 1286.04 | 34.23 | 0.6965 |
| K-Means | 3907.93 | 2355.55 | 72.64 | 0.4326 |
| G-Means | 3556.88 | 2533.89 | 63.70 | 0.3697 |
| SNIC | 2610.18 | 1803.92 | 49.21 | 0.5040 |
Disclaimer/Publisher’s Note: The statements, opinions and data contained in all publications are solely those of the individual author(s) and contributor(s) and not of MDPI and/or the editor(s). MDPI and/or the editor(s) disclaim responsibility for any injury to people or property resulting from any ideas, methods, instructions or products referred to in the content. |
© 2023 by the authors. Licensee MDPI, Basel, Switzerland. This article is an open access article distributed under the terms and conditions of the Creative Commons Attribution (CC BY) license (https://creativecommons.org/licenses/by/4.0/).
Share and Cite
Li, B.; Gong, A.; Chen, Z.; Pan, X.; Li, L.; Li, J.; Bao, W. An Object-Oriented Method for Extracting Single-Object Aquaculture Ponds from 10 m Resolution Sentinel-2 Images on Google Earth Engine. Remote Sens. 2023, 15, 856. https://doi.org/10.3390/rs15030856
Li B, Gong A, Chen Z, Pan X, Li L, Li J, Bao W. An Object-Oriented Method for Extracting Single-Object Aquaculture Ponds from 10 m Resolution Sentinel-2 Images on Google Earth Engine. Remote Sensing. 2023; 15(3):856. https://doi.org/10.3390/rs15030856
Chicago/Turabian StyleLi, Boyi, Adu Gong, Zikun Chen, Xiang Pan, Lingling Li, Jinglin Li, and Wenxuan Bao. 2023. "An Object-Oriented Method for Extracting Single-Object Aquaculture Ponds from 10 m Resolution Sentinel-2 Images on Google Earth Engine" Remote Sensing 15, no. 3: 856. https://doi.org/10.3390/rs15030856