Technical Note

Maize Yield Prediction with Machine Learning, Spectral Variables and Irrigation Management

by
Fábio Henrique Rojo Baio
1,
Dthenifer Cordeiro Santana
2,
Larissa Pereira Ribeiro Teodoro
1,
Izabela Cristina de Oliveira
2,
Ricardo Gava
1,
João Lucas Gouveia de Oliveira
1,
Carlos Antonio da Silva Junior
3,
Paulo Eduardo Teodoro
1,2 and
Luciano Shozo Shiratsuchi
4,*
1
Federal University of Mato Grosso do Sul (UFMS), Chapadão do Sul 79560-000, MS, Brazil
2
Department of Agronomy, State University of São Paulo (UNESP), Ilha Solteira 15385-000, SP, Brazil
3
Department of Geography, State University of Mato Grosso (UNEMAT), Sinop 78550-000, MT, Brazil
4
LSU Agcenter, School of Plant, Environmental and Soil Sciences, Louisiana State University, 307 Sturgis Hall, Baton Rouge, LA 70726, USA
*
Author to whom correspondence should be addressed.
Remote Sens. 2023, 15(1), 79; https://doi.org/10.3390/rs15010079
Submission received: 27 October 2022 / Revised: 5 December 2022 / Accepted: 17 December 2022 / Published: 23 December 2022
(This article belongs to the Special Issue High-Throughput Phenotyping in Plants Using Remote Sensing)

Abstract

:
Predicting maize yield using spectral information, temperature, and different irrigation management through machine learning algorithms provide information in a fast, accurate, and non-destructive way. The use of multispectral sensor data coupled with irrigation management in maize allows further exploration of water behavior and its relationship with changes in spectral bands presented by the crop. Thus, the objective of this study was to evaluate, by means of multivariate statistics and machine learning techniques, the relationship between irrigation management and spectral bands in predicting maize yields. Field experiments were carried out over two seasons (first and second seasons) in a randomized block design with four treatments (control and three additional irrigation levels) and eighteen sample repetitions. The response variables analyzed were vegetation indices (IVs) and crop yield (GY). Measurement of spectral wavelengths was performed with the Sensefly eBee RTK, with autonomous flight control. The eBee was equipped with the Parrot Sequoia multispectral sensor acquiring reflectance at the wavelengths of green (550 nm ± 40 nm), red (660 nm ± 40 nm), red-edge (735 nm ± 10 nm), and NIR (790 nm ± 40 nm). The blue length (496 nm) was obtained by additional RGB imaging. Data were subjected to Pearson correlations (r) between the evaluated variables represented by a correlation and scatter plot. Subsequently, the canonical analysis was performed to verify the interrelationship between the variables evaluated. Data were also subjected to machine learning (ML) analysis, in which three different input dataset configurations were tested: using only irrigation management (IR), using irrigation management and spectral bands (SB+IR), and using irrigation management, spectral bands, and temperature (IR+SB+Temp). ML models used were: Artificial Neural Network (ANN), M5P Decision Tree (J48), REPTree Decision Tree (REPT), Random Forest (RF), and Support Vector Machine (SVM). A multiple linear regression (LR) was tested as a control model. Our results revealed that Random Forest has higher accuracy in predicting grain yield in maize, especially when associated with the inputs SB+IR and SB+IR+Temp.

1. Introduction

Maize (Zea mays L.) is an agricultural crop of worldwide importance, subsidizing animal and human food to biofuel production. The required increase in the crop’s yields due to the global population growth, which is expected to rise to more than 9 billion by 2050 (ONU, 2019), is one of the main challenges of modern agriculture. Additionally, the global climate change scenario raises the need to adopt tools and management practices that ensure yield gains with more efficient use of natural resources, such as adopting strategic irrigation systems in critical crop stages [1]. Irrigation management represents one of the major strains on water resources because of the high consumption and low efficiency in most irrigation systems [2]. Thus, with the increasing demand for this finite resource, alternatives are needed to minimize water use in irrigation by improving its management [3].
Water deficit in the crop tends to increase leaf temperature and begins to negatively impact plant development [4,5]. C4 plants, such as maize, have higher water-use efficiency and higher tolerance to increased leaf temperature [6]. Crop leaf temperature is a physiological characteristic and can be used to monitor the plant’s water status [7]. In the presence of high atmospheric water demand or low soil water availability, the plant triggers its primary mechanism to control water loss, which is stomatal closure [8]. Activating this mechanism triggers a series of harmful processes in grain production, such as a decrease in photosynthetic activity by preventing the entry of CO2 and an increased leaf temperature due to the retraction of evaporative cooling by water. This increase in temperature can be on the order of many degrees centigrade, depending on the crop and the water supply and demand conditions of the soil–atmosphere system [9].
Remote sensing, coupled with high-throughput phenotyping techniques, is a tool that can be used to provide fast and non-destructive information on crop status [10,11,12]. Multispectral images captured by the sensors make it possible to know the canopy reflectance values in the spectral bands of blue, green, red, red-edge, and near-infrared. Leaf reflectance allows us to detect parameters and relate them to plant water status due to the emission of canopy wavelengths in the near-infrared and short-wave infrared ranges, which are influenced by various internal leaf structures, such as water content [13].
Despite the advantages mentioned above, the information obtained from spectral imagery is very complex and generates a large amount of data, which makes the use of Machine Learning (ML) techniques an excellent alternative to spectral data processing [14]. Algorithms such as Artificial Neural Networks (ANNs), Decision Trees, Random Forests (RFs), and Support Vector Machines (SVMs) can be used in studies for yield prediction [15,16,17], nutritional status monitoring [18,19], drought stress detection [20,21,22], and irrigation mapping [23] using spectral imagery.
Advances in high-throughput phenotyping techniques are crucial to evaluate the crop water status and making inferences about future crop conditions, such as associations with grain yield. Plant responses to photosynthetic efficiency under adequate water supply conditions are reflected in the crop yield, and to measure these photosynthetic and yield traits, traditional laboratory methods using sampling and leaf analysis are employed and provide highly accurate information. However, these methods are costly and time-consuming and require skilled labor, giving an advantage to using spectral data associated with ML modeling [24,25,26].
The use of multispectral sensor data combined with irrigation management in maize crops allows further exploration of water behavior and its relationship with changes in the spectral bands reflected by the crop canopy. Thus, the objective of this study was to test different machine learning techniques and input configurations on the dataset (considering irrigation management, leaf temperature, and spectral variables) for predicting maize grain yield.

2. Materials and Methods
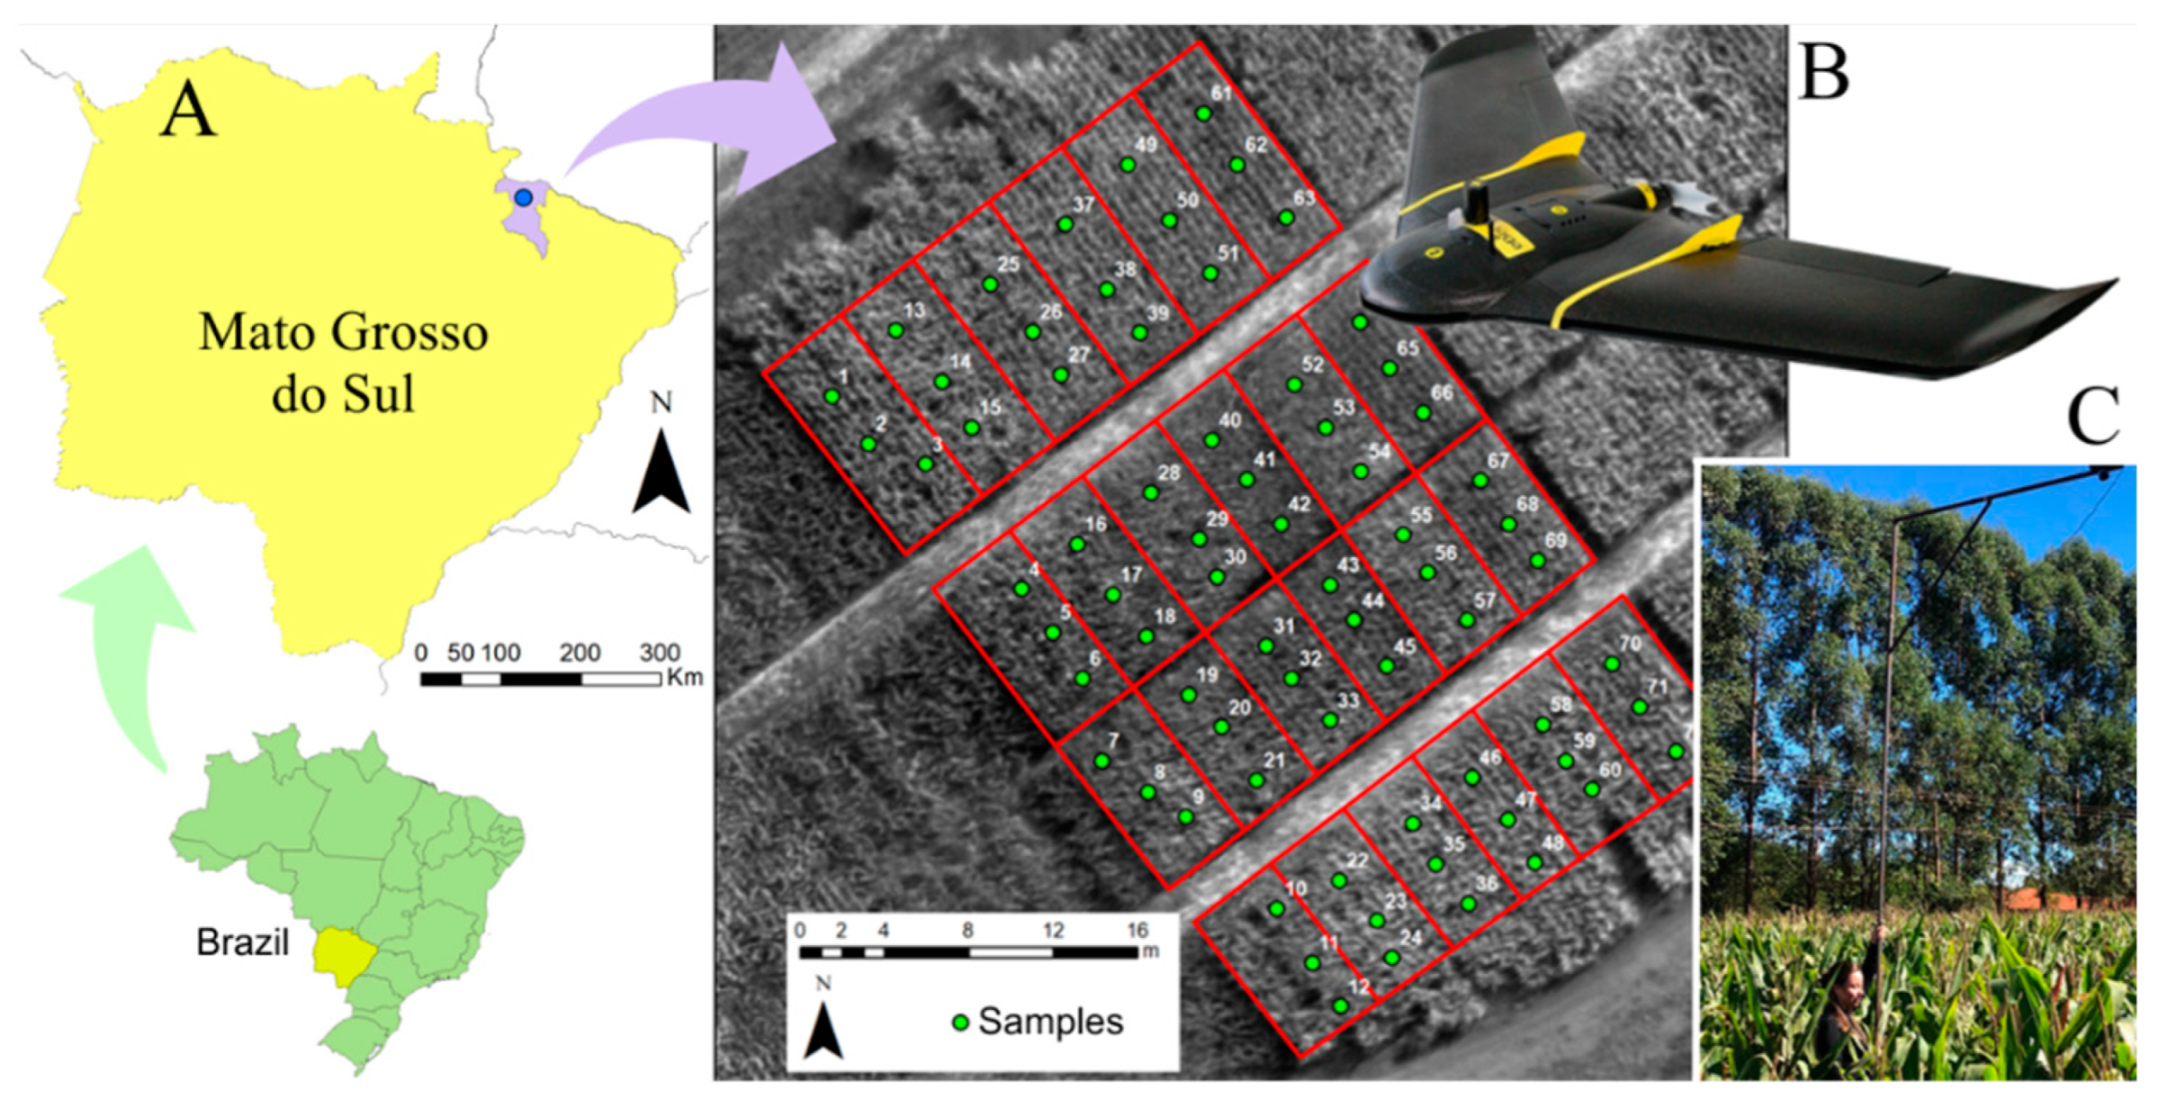
2.1. Study Area

Field experiments were carried out at the experimental area of the Federal University of Mato Grosso do Sul, in the municipality of Chapadão do Sul-MS, Brazil, with coordinates 18°46′17.9″ S and 52°37′25.0″ W, and with an altitude of 810.2 m (Figure 1), during two crop seasons: 2020/2021 (first season, characterized by a summer harvest) and 2021 (the second season, characterized by an autumn harvest). The climate of the region is characterized as a tropical climate with a dry season in winter (Aw). The area had a history of fifteen years of non-tillage system, and soybean was previously cultivated as the first crop in the same agricultural year. Soil samples were collected at the experimental field, at 0.0–0.2 m depth, for soil chemical analysis. Ten sub-samples were taken. The results of the soil analysis are shown in Table 1.

2.2. Experiment Installation

The dimensions of the experimental plots were 20 × 5 m, totaling 24 plots. Each plot was cultivated with maize (Zea mays L.), hybrid SYN 555 VIP 3, from Syngenta® (Formosa, Brazil). The maize crop was cultivated as a second crop, sown in the third ten-day period of February of each experimental year after the harvest of soybean was installed as a first crop. This type of crop succession is the most common in Brazil, especially in the Cerrado region.
Soil served as a basis for the interpretation and recommendation of fertilization [27]. Limestone application was carried out in August according to the need for both crops in the study areas, raising the base saturation to 65%. Fertilizing was performed in the sowing furrow at rates of 30 kg ha−1 of N (Urea 45% N), 120 kg ha−1 of Phosphorus (Single Superphosphate 20% P2O5), and 60 kg ha−1 of Potassium (Potassium Chloride 58% K2O). Maize was grown as a second crop due to the lower rainfall in the region, allowing for a higher probability of water deficit in non-irrigated treatments or with less irrigation level.
The spacing used between sowing rows was 0.45 m, and the crop population was estimated at 65,000 plants ha−1. The seeder used in this process was the Jumil model 2670 (Batatais, Brazil), with a vacuum seed metering mechanism. At the V4 crop phenological stage, the topdressing fertilization with urea (45% N) was carried out at a dosage of 150 kg ha−1, according to the recommendation for the soil condition and region

2.3. Experimental Design

The experimental design applied was in randomized blocks, containing four treatments (control and three additional irrigation levels) and eighteen sampling repetitions. The response variables analyzed were vegetation indices (VI) and crop yield (GY). The variables were measured at three different sampling points within each plot. The four outer rows were discarded as borders to avoid possible interference from other treatments. The four treatments influencing the response variables were 0 (no supplemental irrigation), 30, 60, and 100% of crop evapotranspiration (ETc).
Supplementary irrigation levels were applied to achieve sampling variability among the measured values, mainly leaf temperature (Temp). This procedure made it possible to measure the leaf temperature in a situation of turgidity and some level of water deficit.

2.4. Irrigation Management

The data on the weather conditions during the experimental period were obtained through an automatic station installed at the experimental field (RX3000 Remote Monitoring Station, Bourne, MA, USA). Crop evapotranspiration was calculated by the Penman–Monteith FAO method [28]. Conventional sprinkler irrigation was performed using Plonas KS 1500 sprinklers (Curitiba, Brazil), operating at a 360-degree angle, with a flow rate of 7 m3 h−1, totaling 10 mm h−1. The variation of the irrigation levels was initiated in the crop only after its establishment, 15 days after emergence (DAE). Irrigation was 100% of the requirement up to that moment in all plots. The climate balance containing irrigation and rainfall over the two crop seasons is contained in Supplementary Figure S1.

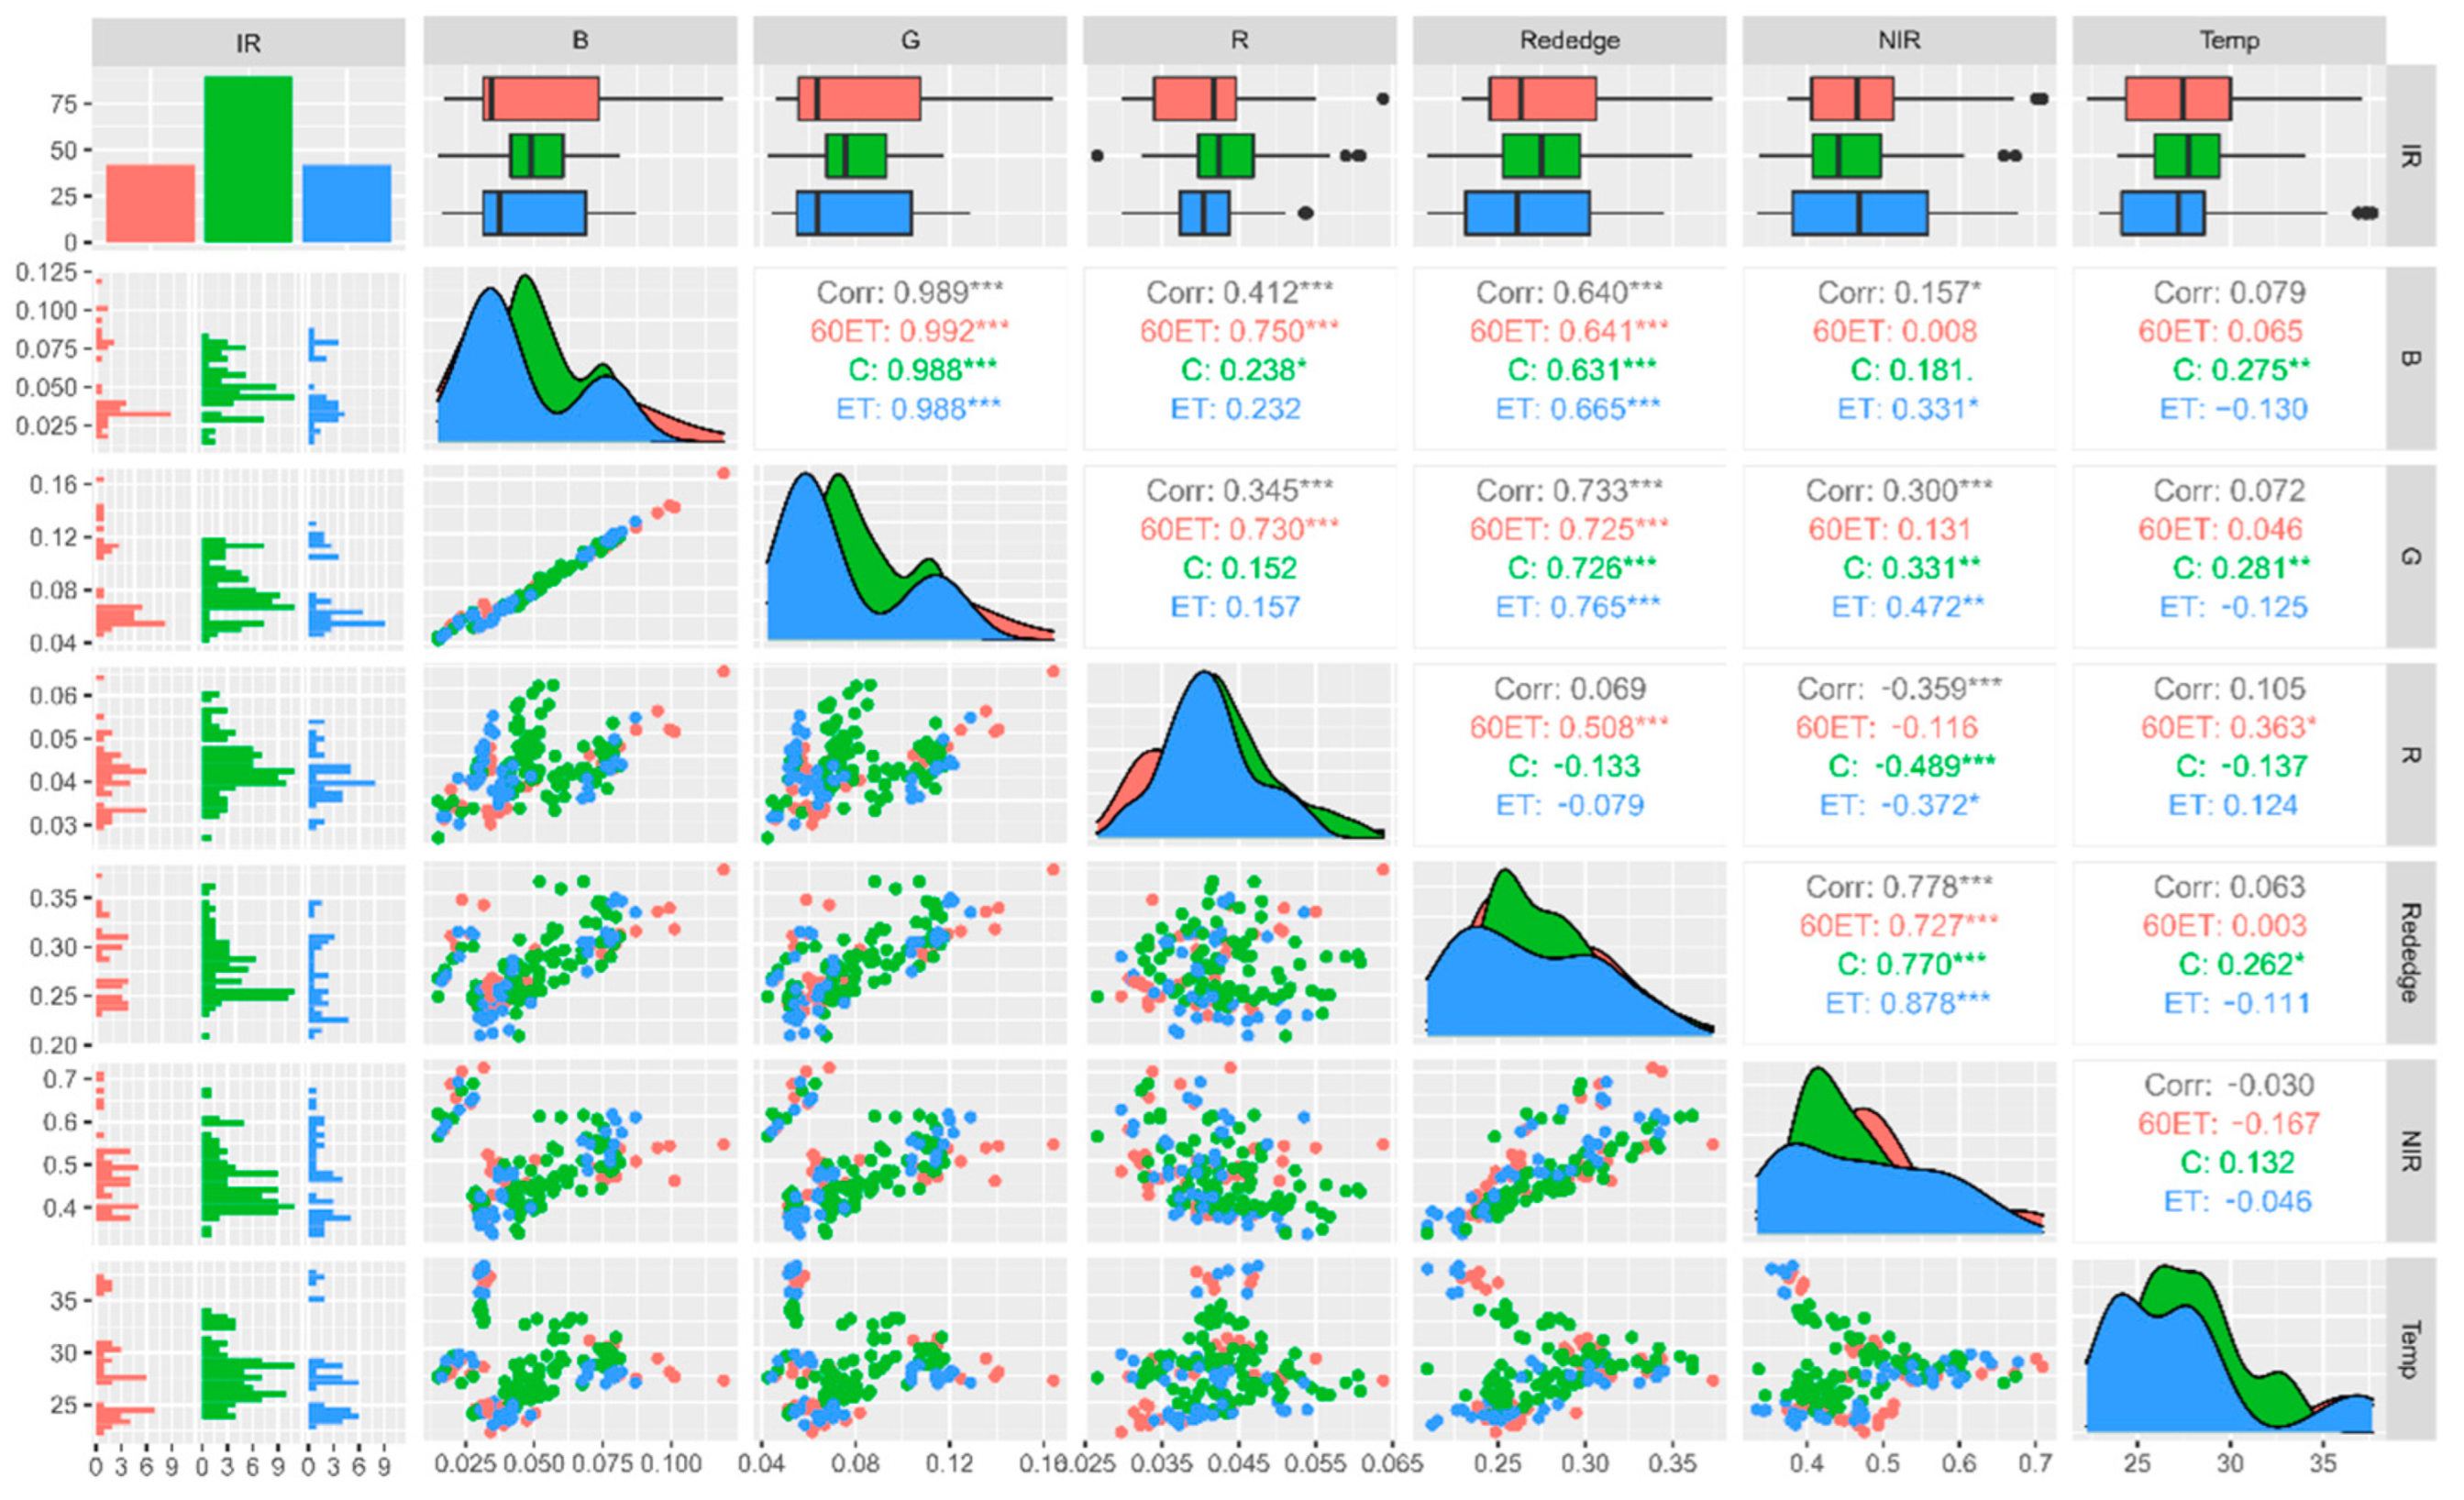
2.5. Obtaining Spectral Variables and Plant Assessments

Spectral wavelengths reflected by the crop canopy were measured from flights carried out with the Sensefly eBee RTK fixed-wing UAV. The eBee has autonomous flight control and was equipped with the Parrot Sequoia multispectral sensor. Sequoia multispectral sensor acquired reflectance at the wavelengths of green (550 nm ± 40 nm), red (660 nm ± 40 nm), blue (496 nm), red-edge (735 nm ± 10 nm), and near-infrared (790 nm ± 40 nm). This sensor also captures an RGB image at the same scene.
Overflights were performed at 100 m height of the local soil level, allowing a 0.10 m spatial resolution. In the first crop season, the overflights were performed on 30 October 2020, 7 December 2020, and 28 December 2020, and in the second crop season, they were carried out on 13 March 2021, 10 April 2021, and 08 May 2021. The overflights were carried out near the zenith due to the minimization of the shadows of the plants at 11 a.m., given that the multispectral sensor is a passive type (i.e., dependent on solar luminosity). The images were mosaic and orthorectified by the computer program Pix4Dmapper. The images were acquired with 80% longitudinal and 60% lateral overlaps. Radiometric correction of the images was performed using the Pix4D program and the use of the camera’s reflective target, in addition to the radiometric sensor coupled to the multispectral camera. The multispectral maps were processed using ArcGIS 10.5 program.
The calculation of maize grain yield (GY) was performed by harvesting the ears manually at the end of the crop cycle, at each sampling point, and in a harvested area of 4.05 m2. Sample weighing was performed, correcting the moisture content to 14%.
Thermal camera Fotric model 222 s (Shanghai, China) was used in the sampling acquisition of the thermal images. This camera has a spatial resolution of 320 × 240 pixels, capable of reading within the range of −20 °C ~ 650 °C, with thermal sensitivity of ≤0.06 °C and accuracy of ±2%, under the conditions of environment temperature 10 °C ~ 35 °C. The images were shot through a mobile application called LinkIR. A cell phone with an Android operating system must be coupled to the camera, and it makes an RGB image of the same Thermal image (Figure 2). Three evaluations were carried out at different phenological stages of the maize crop (V5, V8, and R1), at 23 DAE, 31 DAE, and 52 DAE, when data on canopy temperature (TEMP) and vegetation indices were collected. All variables were measured at ten points in the center of each experimental plot, and their average was used in the statistical evaluation.

2.6. Statistical Analysis and Machine Learning

Pearson correlations (r) between the variables grain yield (GY), Temperature (Temp), and the spectral bands (red, green, NIR, and red-edge) were estimated and represented by a correlation and scatter plot. The analyses were performed on the Rbio [29] and R [30] software using the GGEBiplotGUI package. Subsequently, canonical variable analysis was performed on the Rbio software to verify the interrelationship between the variables evaluated.
Data were subjected to regression analysis by multiple linear regression (used as control) and ML models (Table 2). ANN has been tested using the default Weka’s architecture, consisting of a Multilayer Perceptron with a unique hidden layer formed by many neurons equal to the number of attributes plus the number of classes, all divided by two [31]. LR has been tested with the Akaike information criteria for attribute selection during linear regression [32]. The M5P algorithm is a classifier for generating a C4.5 decision tree with an additional pruning step based on a reduced-error strategy [33]. REPTree is an adaptation of the C4.5 classifier that can be used in regression problems with an additional pruning step based on an error reduction strategy [34]. The RF model is able to produce multiple decision trees for the same dataset and uses a voting scheme among all these learned trees to classify new instances [35]. SVM performs classification tasks by building hyperplanes in multidimensional space to distinguish different classes [36]. All model parameters were set according to the default setting of the Weka 3.8.5 software (Waikato, New Zeland). For all regression models, three different input dataset configurations were tested: using only irrigation management (IR), using irrigation management and spectral bands (SB+IR), and using irrigation management, spectral bands, and temperature (IR+SB+Temp). Grain yield (GY) was used as the output variable. All models were performed using stratified cross-validation with k-fold = 10 and ten repetitions (100 runs for each model).
Pearson correlation coefficient (r) and Mean Absolute Error (MAE) metrics were used to evaluate the performance of the tested prediction models. An analysis of variance was performed to verify the significance of the tested inputs, ML techniques, and the interaction between both. When significant, boxplots were generated with the means of r and MAE grouped by the Scott–Knott test [37] at a 5% probability level. The grouping of means was performed using the Rbio software (Viçosa, Brazil), while the boxplots were generated using the ggplot2 and ExpDes.pt packages of the R software.

3. Results

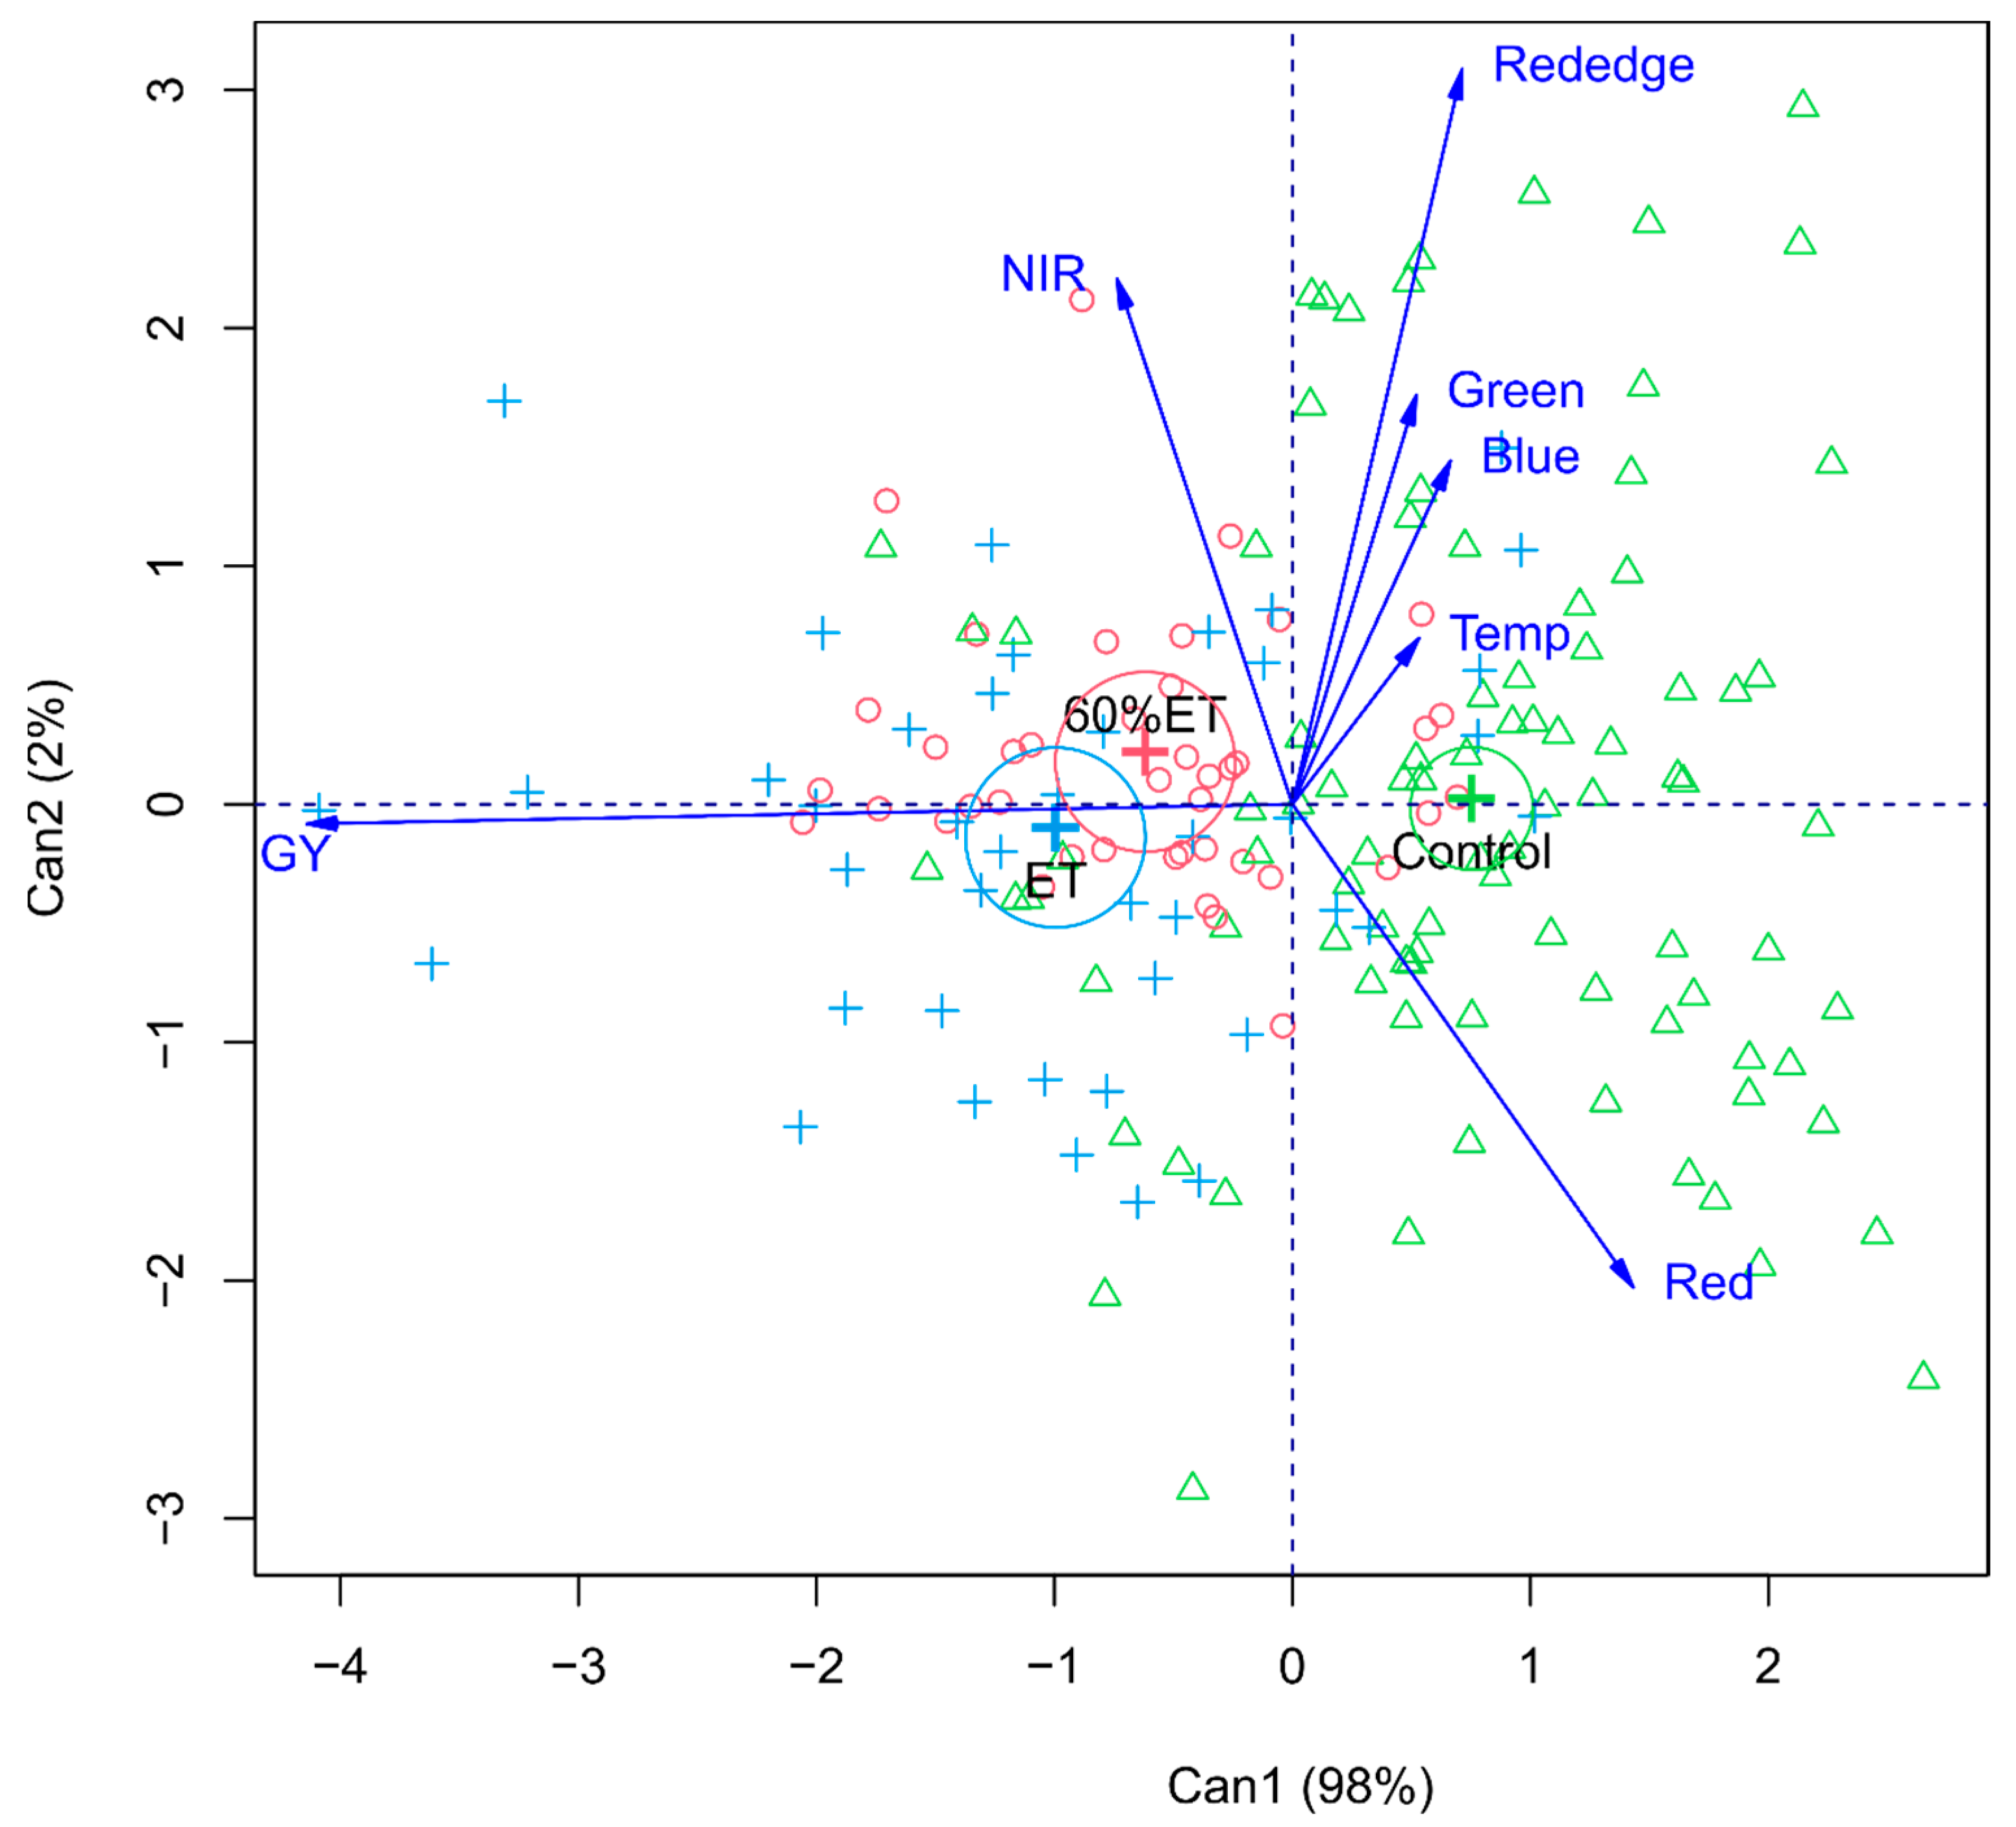
3.1. Impact of Irrigation Management on Grain Yield and Leaf Temperature in Maize

According to the boxplots in the upper portion of Figure 2, higher yield values were obtained with 60% or 100% ET. The other variables reached higher values with 100% ET followed by 60% ET, except for red. Under control irrigation, the yield was low, as well as for the other variables, except the red spectral band.
The correlations were high between spectral variables, which is expected due to the use of spectral bands in the calculations of vegetation indices. The low or no correlation between the spectral variables, yield, and temperature, is due to the lack of linearity between them. Thus, non-conventional analyses such as Machine Learning (ML) techniques should be used to evaluate correlations between such variables.
Maize yield was higher when irrigation was 100% ET or 60% of ET. This relationship can be seen by the graph of canonical variables (Figure 3), in which the GY vector was close to the mentioned irrigation management. Red wavelength was close to the control ET vector, i.e., when plants are not adequately irrigated, there is a higher reflectance of red wavelength by the canopy. The temperature variable was also close to the control irrigation management.

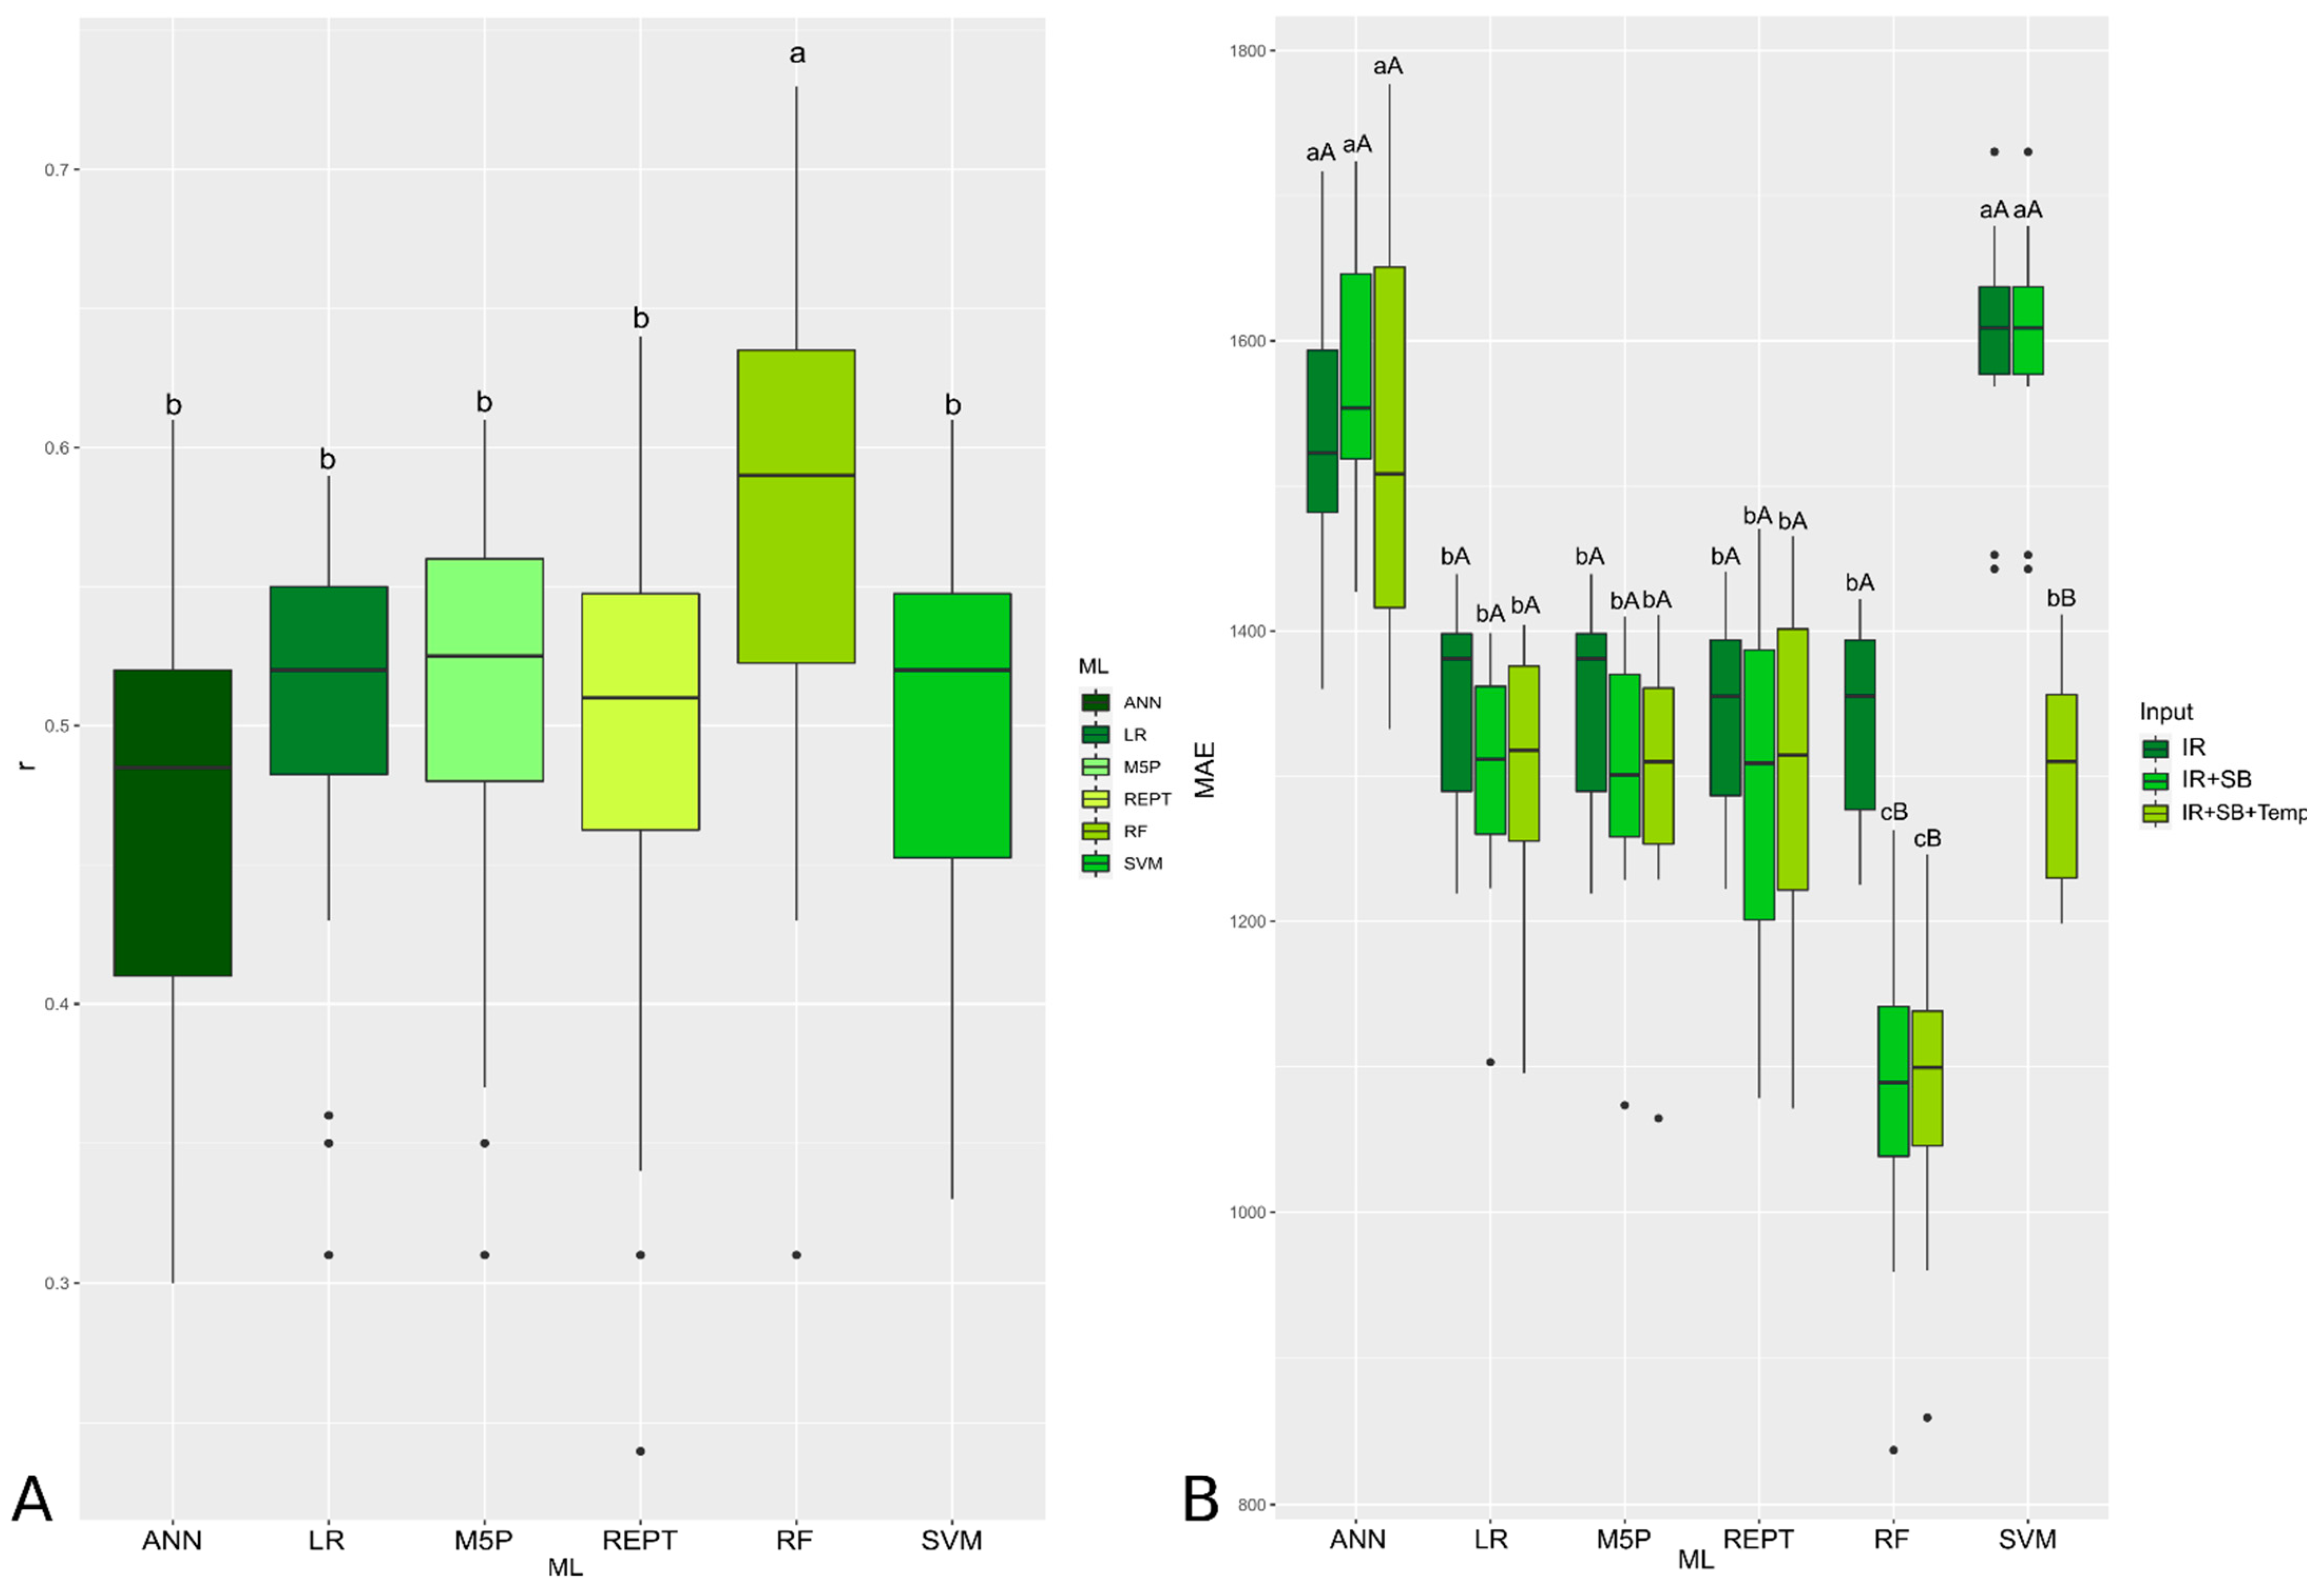
3.2. Prediction of Grain Yield in Maize by Machine Learning Models

Table 3 presents p-values obtained by ANOVA for r and MAE considering the different ML models and inputs. Regarding r, there was significance (p < 0.05) for the ML models tested, while for MAE, there was a significant interaction between the models and inputs tested, requiring the unfolding of the interaction.
The best ML algorithm for predicting maize yield under the different irrigation treatments was Random Forest (Figure 4A), according to the Pearson correlation coefficient, reaching an average of 0.58. All other algorithms did not differ from each other. The lowest MAE found using IR as input was found using the LR, M5P, REPT, and RF models. Using IR+SB and IR+SB+Temp as input, the lowest MAE was found using the RF models. When comparing each ML with the tested inputs, LR, ANN, M5P, and REPT showed no statistical difference. SVM showed lower MAE when the input tested was IR+SB+Temp, and RF showed lower MAE using IR+SB and IR+SB+Temp (Figure 4B). The RF model using IR+SB and IR+SB+Temp inputs outperformed the other algorithms by achieving higher r and lower MAE values.

4. Discussion

4.1. Impact of Irrigation Management on Grain Yield and Leaf Temperature in Maize

It is remarkable the proximity of the variable GY with the irrigation management 60% ET and ET (Figure 3) because the irrigation management has expressive impacts on the crop. The effects of water deficit reflect directly on maize grain yield, especially in three stages of plant development: (a) blooming and inflorescence development, when the potential number of grains is determined; (b) fertilizing time, when the production potential is fixed; in this step, the water availability is also fundamental to avoid the dehydration of the pollen grain and to guarantee the development and penetration of the pollen tube; (c) grain filling, when there is an increase in dry matter deposition, which is closely related to photosynthesis since stress will result in lower carbohydrate production, which would imply a lower volume of dry matter in the grains [4,6,7]. Water stress at 31 DAE, when the crop was at approximately V8, may affect the length of internodes, probably by inhibiting the elongation of developing cells, thus contributing to a decrease in the sugar storage capacity of the stem. Water deficit will also lead to thinner stems, shorter plants, and reduced leaf area [38].
The use of information obtained by multispectral imaging enables the fast and non-destructive monitoring of several physiological and structural characteristics of different crops [39]. The behavior of the spectral reflectance of leaves differs according to internal plant characteristics. For example, the reflectance in the visible and red-edge bands when plants are under adequate hydration and water stress are different [40]. When plants are subjected to water stress for a short time, they use mechanisms to avoid further damage, which leads to heat emission and altered wavelength reflectance processes. When the stress is prolonged, the damage is at the level of chlorophyll detriment, which increases the interference with leaf reflectance [41,42].
The reflectances emitted by a plant with its biological activity fully active and another one going through drought stress showed distinct proximities with the vectors for VIs and SB. Red was close to the control ET vector because drought stress leads the plant to reduce green reflectance and increase blue and red reflectances [43].

4.2. Prediction of Grain Yield in Maize with Machine Learning Models

Yield prediction supports improved crop monitoring and policy management, and Yield prediction supports improved crop monitoring, policy management, and decision-making before the crop is harvested [44]. However, yield data encompass many variables intrinsic to crop, management, and climate conditions. Using technologies such as machine learning techniques allied to spectral data has an essential role in contributing to the productive improvement of farming systems [15].
ML models make it possible to process a large and highly complex dataset, circumventing the lack of linearity that exists between data [45]. RF proves to be a highly accurate algorithm in many agricultural applications [15]. In Figure 4, both for r and MAE, RF presented better results than the other techniques used, showing good performance in predicting maize yield. Marques Ramos et al. [15] verified the high accuracy of maize yield prediction obtained by the RF algorithm using UAV-based imagery. In addition to good performance in maize yield prediction, RF has better data generalization [46].
When evaluating the inputs tested, those with SB+IR and SB+IR+Temp performed better. As both inputs showed similar performance, from the point of view of acquiring and processing information, using the spectral bands and irrigation management is more advantageous than using the input containing temperature. This is because measuring temperature requires a thermal camera, time investment, and increased data processing. Another shortcoming of using canopy temperature information is that it is greatly influenced by solar radiation, weather conditions, and intrinsic leaf characteristics, such as canopy architecture, making it difficult to obtain only the shoot temperature, especially when it is affected by water conditions [47,48,49]. As plant canopy temperature is directly related to the crop water status, it can be elevated by up to 2.3 °C under drought stress conditions [50]; it is not necessary to use the temperature as an input variable.
Using spectral bands as input in machine learning algorithms also generates accurate outputs for many studies, such as the identification of soybean cultivars [51] and in the prediction of agronomic traits such as plant height and maturity [17]. According to specific characteristics of the chlorophyll pigments, the wavelengths reflected by plants, especially red, are sensitive to chlorophyll alteration and allow correlation with crop characteristics [52,53]. Irrigation management strongly influences these characteristics. One of the explanations for this effect is that the closure of the stomata by plants undergoing drought stress leads to a decrease in net photosynthesis, fluorescence and chlorophyll content of the leaves [54].
Physiological changes that occur in plants due to water and temperature variations can assist in predicting crop yields when leaf area is taken into consideration because it can determine the amount of chlorophyll in the leaves and thus estimate the photosynthetic potential [55] and correlate this information with the crop’s yield potential.
According to the results presented here, the superior performance of the RF algorithm may be more evident when the response is the product of multiple complex interactions between several predictors, such as in agricultural systems where the interactions between biophysical, ecological, physiological, and agronomic management can complicate modeling. Herrero-Huerta [56] also tested ML models in soybean yield prediction using data obtained by a UAV multispectral sensor and verified high accuracy (90.7%) by RF. In a study to predict leaf nitrogen concentration (LNC) and plant height (PH) with machine learning techniques and UAV-based multispectral imagery in maize crops in Brazil, Osco et al. [18] also verified superior performance by RF, which archived r and RMSE, respectively, of 0.91 and 1.9 g.kg¹ for LNC, and 0.86 and 0.17 m for PH.
Most RF applications have focused on its utility as a classification tool [51,57]. However, recent studies exploring the regression capabilities of the RF algorithm to predict crop productivity in tropical territories are very limited. Various studies have pointed out numerous advantages of RF as a regression tool over traditional regression models [18,56,57]. To date, the applications of RF regression in the fields of agronomy and crop science remain scarce. Therefore, the results presented here could constitute the basis for initiating new contributions to agricultural sciences.

5. Conclusions

Our study tested different machine learning models and inputs for grain yield prediction in maize. Among the inputs tested are spectral bands (SB) obtained with a UAV multispectral sensor, leaf temperature (Temp) obtained with a thermal sensor, and irrigation management (IR). Random Forest achieved higher accuracy in predicting maize grain yield, especially when associated with inputs SB+IR and SB+IR+Temp.
Given the results obtained, there are no gains in accuracy with the use of leaf temperature obtained with a thermal sensor for predicting grain yield in maize.
This manuscript reports a promising result for estimating grain yield in maize using a multispectral UAV sensor with a thermal sensor associated with the random forest algorithm. However, it is important to highlight that grain yield is a complex trait governed by many genes and with a strong environmental effect. Therefore, future research can be carried out with hyperspectral sensors aiming to increase the prediction accuracy of this variable in maize.

Supplementary Materials

The following supporting information can be downloaded at: https://www.mdpi.com/article/10.3390/rs15010079/s1, Figure S1. Water balance during the experiment periods (1st crop season and 2nd crop season), residual water content (RWD), readily available water (RAW) and water storage (Storage) for supplemented irrigation (1A and 2A) and rainfed condition (1B and 2B).

Author Contributions

Conceptualization, F.H.R.B. and R.G; methodology, F.H.R.B. and R.G.; software, D.C.S. and L.P.R.T.; validation, P.E.T. and C.A.d.S.J.; formal analysis, D.C.S.; investigation, F.H.R.B.; resources, L.S.S.; data curation, L.S.S.; writing—original draft preparation, F.H.R.B. and D.C.S.; writing—review and editing, P.E.T., L.P.R.T. and P.E.T.; visualization, I.C.d.O., J.L.G.d.O. and C.A.d.S.J.; supervision, P.E.T. All authors have read and agreed to the published version of the manuscript.

Funding

This research received no external funding.

Data Availability Statement

Data are available with corresponding author upon reasonable request.

Acknowledgments

The authors would like to thank the Universidade Federal de Mato Grosso do Sul (UFMS), Conselho Nacional de Desenvolvimento Científico e Tecnológico (CNPq)–Grant numbers 303767/2020-0, 309250/2021-8 and 306022/2021-4, and Fundação de Apoio ao Desenvolvimento do Ensino, Ciência e Tecnologia do Estado de Mato Grosso do Sul (FUNDECT) TO numbers 88/2021, and 07/2022, and SIAFEM numbers 30478 and 31333. This study was financed in part by the Coordenação de Aperfeiçoamento de Pessoal de Nível Superior-Brazil (CAPES)–Financial Code 001.

Conflicts of Interest

The authors declare no conflict of interest.

References

  1. Battisti, R.; Sentelhas, P.C.; Pascoalino, J.A.L.; Sako, H.; de Sá Dantas, J.P.; Moraes, M.F. Soybean Yield Gap in the Areas of Yield Contest in Brazil. Int. J. Plant Prod. 2018, 12, 159–168. [Google Scholar] [CrossRef]
  2. Venancio, L.P.; Mantovani, E.C.; do Amaral, C.H.; Neale, C.M.U.; Gonçalves, I.Z.; Filgueiras, R.; Eugenio, F.C. Potential of Using Spectral Vegetation Indices for Corn Green Biomass Estimation Based on Their Relationship with the Photosynthetic Vegetation Sub-Pixel Fraction. Agric. Water Manag. 2020, 236, 106155. [Google Scholar] [CrossRef]
  3. Paul, M.; Negahban-Azar, M.; Shirmohammadi, A.; Montas, H. Assessment of Agricultural Land Suitability for Irrigation with Reclaimed Water Using Geospatial Multi-Criteria Decision Analysis. Agric. Water Manag. 2020, 231, 105987. [Google Scholar] [CrossRef]
  4. Santos, R.F.; Carlesso, R. Water Deficit and Morphologic and Physiologic Behavior of the Plants. Rev. Bras. Eng. Agrícola E Ambient. 1998, 2, 287–294. [Google Scholar] [CrossRef] [Green Version]
  5. Loresco, P.J.M.; Africa, A.D. ECG Print-out Features Extraction Using Spatial-Oriented Image Processing Techniques. J. Telecommun. Electron. Comput. Eng. 2018, 10, 15–20. [Google Scholar]
  6. Killi, D.; Bussotti, F.; Raschi, A.; Haworth, M. Adaptation to High Temperature Mitigates the Impact of Water Deficit during Combined Heat and Drought Stress in C3 Sunflower and C4 Maize Varieties with Contrasting Drought Tolerance. Physiol. Plant 2017, 159, 130–147. [Google Scholar] [CrossRef]
  7. Xu, S.; Liu, Z.; Zhao, L.; Zhao, H.; Ren, S. Diurnal Response of Sun-Induced Fluorescence and PRI to Water Stress in Maize Using a near-Surface Remote Sensing Platform. Remote Sens. 2018, 10, 1510. [Google Scholar] [CrossRef] [Green Version]
  8. Agurla, S.; Gahir, S.; Munemasa, S.; Murata, Y.; Raghavendra, A.S. Mechanism of Stomatal Closure in Plants Exposed to Drought and Cold Stress. Surviv. Strateg. Extrem. Cold Desiccation 2018, 1081, 215–232. [Google Scholar]
  9. Quebrajo, L.; Perez-Ruiz, M.; Pérez-Urrestarazu, L.; Martínez, G.; Egea, G. Linking Thermal Imaging and Soil Remote Sensing to Enhance Irrigation Management of Sugar Beet. Biosyst. Eng. 2018, 165, 77–87. [Google Scholar] [CrossRef]
  10. Campos, I.; González-Gómez, L.; Villodre, J.; González-Piqueras, J.; Suyker, A.E.; Calera, A. Remote Sensing-Based Crop Biomass with Water or Light-Driven Crop Growth Models in Wheat Commercial Fields. Field Crops Res. 2018, 216, 175–188. [Google Scholar] [CrossRef]
  11. Tahir, M.N.; Naqvi, S.Z.A.; Lan, Y.; Zhang, Y.; Wang, Y.; Afzal, M.; Cheema, M.J.M.; Amir, S. Real Time Estimation of Chlorophyll Content Based on Vegetation Indices Derived from Multispectral UAV in the Kinnow Orchard. Int. J. Precis. Agric. Aviat. 2018, 1, 24–31. [Google Scholar]
  12. Fu, Z.; Jiang, J.; Gao, Y.; Krienke, B.; Wang, M.; Zhong, K.; Cao, Q.; Tian, Y.; Zhu, Y.; Cao, W. Wheat Growth Monitoring and Yield Estimation Based on Multi-Rotor Unmanned Aerial Vehicle. Remote Sens. 2020, 12, 508. [Google Scholar] [CrossRef] [Green Version]
  13. El-Hendawy, S.E.; Al-Suhaibani, N.A.; Elsayed, S.; Hassan, W.M.; Dewir, Y.H.; Refay, Y.; Abdella, K.A. Potential of the Existing and Novel Spectral Reflectance Indices for Estimating the Leaf Water Status and Grain Yield of Spring Wheat Exposed to Different Irrigation Rates. Agric. Water Manag. 2019, 217, 356–373. [Google Scholar] [CrossRef]
  14. Eugenio, F.C.; Grohs, M.; Venancio, L.P.; Schuh, M.; Bottega, E.L.; Ruoso, R.; Schons, C.; Mallmann, C.L.; Badin, T.L.; Fernandes, P. Estimation of Soybean Yield from Machine Learning Techniques and Multispectral RPAS Imagery. Remote Sens. Appl. 2020, 20, 100397. [Google Scholar] [CrossRef]
  15. Ramos, A.P.M.; Osco, L.P.; Furuya, D.E.G.; Gonçalves, W.N.; Santana, D.C.; Teodoro, L.P.R.; da Silva Junior, C.A.; Capristo-Silva, G.F.; Li, J.; Baio, F.H.R.; et al. A Random Forest Ranking Approach to Predict Yield in Maize with Uav-Based Vegetation Spectral Indices. Comput. Electron. Agric. 2020, 178, 105791. [Google Scholar] [CrossRef]
  16. Schwalbert, R.A.; Amado, T.; Corassa, G.; Pott, L.P.; Prasad, P.V.V.; Ciampitti, I.A. Satellite-Based Soybean Yield Forecast: Integrating Machine Learning and Weather Data for Improving Crop Yield Prediction in Southern Brazil. Agric. For. Meteorol. 2020, 284, 107886. [Google Scholar] [CrossRef]
  17. Teodoro, P.E.; Teodoro, L.P.R.; Baio, F.H.R.; da Silva Junior, C.A.; dos Santos, R.G.; Ramos, A.P.M.; Pinheiro, M.M.F.; Osco, L.P.; Gonçalves, W.N.; Carneiro, A.M. Predicting Days to Maturity, Plant Height, and Grain Yield in Soybean: A Machine and Deep Learning Approach Using Multispectral Data. Remote Sens. 2021, 13, 4632. [Google Scholar] [CrossRef]
  18. Osco, L.P.; Junior, J.M.; Ramos, A.P.; Furuya, D.E.; Santana, D.C.; Teodoro, L.P.; Gonçalves, W.N.; Baio, F.H.; Pistori, H.; Junior, C.A.; et al. Leaf Nitrogen Concentration and Plant Height Prediction for Maize Using UAV-Based Multispectral Imagery and Machine Learning Techniques. Remote Sens. 2020, 12, 3237. [Google Scholar] [CrossRef]
  19. Grieco, M.; Schmidt, M.; Warnemünde, S.; Backhaus, A.; Klück, H.-C.; Garibay, A.; Moya, Y.A.T.; Jozefowicz, A.M.; Mock, H.-P.; Seiffert, U. Dynamics and Genetic Regulation of Leaf Nutrient Concentration in Barley Based on Hyperspectral Imaging and Machine Learning. Plant Sci. 2022, 315, 111123. [Google Scholar] [CrossRef]
  20. Behmann, J.; Schmitter, P.; Steinrücken, J.; Plümer, L. Ordinal Classification for Efficient Plant Stress Prediction in Hyperspectral Data. Int. Arch. Photogramm. Remote Sens. Spat. Inf. Sci. 2014, 40, 29. [Google Scholar] [CrossRef] [Green Version]
  21. Raza, S.-A.; Smith, H.K.; Clarkson, G.J.J.; Taylor, G.; Thompson, A.J.; Clarkson, J.; Rajpoot, N.M. Automatic Detection of Regions in Spinach Canopies Responding to Soil Moisture Deficit Using Combined Visible and Thermal Imagery. PLoS ONE 2014, 9, e97612. [Google Scholar] [CrossRef] [PubMed] [Green Version]
  22. Zhou, J.; Zhou, J.; Ye, H.; Ali, M.L.; Nguyen, H.T.; Chen, P. Classification of Soybean Leaf Wilting Due to Drought Stress Using UAV-Based Imagery. Comput. Electron. Agric. 2020, 175, 105576. [Google Scholar] [CrossRef]
  23. Ren, J.; Shao, Y.; Wan, H.; Xie, Y.; Campos, A. A Two-Step Mapping of Irrigated Corn with Multi-Temporal MODIS and Landsat Analysis Ready Data. ISPRS J. Photogramm. Remote Sens. 2021, 176, 69–82. [Google Scholar] [CrossRef]
  24. Zhou, J.J.; Zhang, Y.H.; Han, Z.M.; Liu, X.Y.; Jian, Y.F.; Hu, C.G.; Dian, Y.Y. Evaluating the Performance of Hyperspectral Leaf Reflectance to Detect Water Stress and Estimation of Photosynthetic Capacities. Remote Sens. 2021, 13, 2160. [Google Scholar] [CrossRef]
  25. Osco, L.P.; Ramos, A.P.M.; Pinheiro, M.M.F.; Moriya, É.A.S.; Imai, N.N.; Estrabis, N.; Ianczyk, F.; de Araújo, F.F.; Liesenberg, V.; de Castro Jorge, L.A.; et al. A Machine Learning Framework to Predict Nutrient Content in Valencia-Orange Leaf Hyperspectral Measurements. Remote Sens. 2020, 12, 906. [Google Scholar] [CrossRef] [Green Version]
  26. Long, S.P.; Bernacchi, C.J. Gas Exchange Measurements, What Can They Tell Us about the Underlying Limitations to Photosynthesis? Procedures and Sources of Error. J. Exp. Bot. 2003, 54, 2393–2401. [Google Scholar] [CrossRef] [Green Version]
  27. Lobato, E.; de SOUSA, D.M.G. Cerrado: Correção Do Solo e Adubação; Embrapa Cerrados: Brasília, Brazil, 2004; ISBN 8573832304. [Google Scholar]
  28. Kamali, M.I.; Nazari, R. Determination of Maize Water Requirement Using Remote Sensing Data and SEBAL Algorithm. Agric. Water Manag. 2018, 209, 197–205. [Google Scholar] [CrossRef]
  29. Bhering, L.L. Rbio: A Tool for Biometric and Statistical Analysis Using the R Platform. Crop Breed. Appl. Biotechnol. 2017, 17, 187–190. [Google Scholar] [CrossRef] [Green Version]
  30. Team, R.C. R: A Language and Environment for Statistical Computing; R Foundation for Statistical Computing: Vienna, Austria, 2013. [Google Scholar]
  31. Egmont-Petersen, M.; de Ridder, D.; Handels, H. Image Processing with Neural Networks—A Review. Pattern Recognit. 2002, 35, 2279–2301. [Google Scholar] [CrossRef]
  32. Štepanovský, M.; Ibrová, A.; Buk, Z.; Velemínská, J. Novel Age Estimation Model Based on Development of Permanent Teeth Compared with Classical Approach and Other Modern Data Mining Methods. Forensic Sci. Int. 2017, 279, 72–82. [Google Scholar] [CrossRef]
  33. Quinlan, J.R. C4. 5: Programming for Machine Learning. Morgan Kauffmann 1993, 38, 49. [Google Scholar]
  34. Al Snousy, M.B.; El-Deeb, H.M.; Badran, K.; Khlil, I.A.A. Suite of Decision Tree-Based Classification Algorithms on Cancer Gene Expression Data. Egypt. Inform. J. 2011, 12, 73–82. [Google Scholar] [CrossRef] [Green Version]
  35. Belgiu, M.; Drăguţ, L. Random Forest in Remote Sensing: A Review of Applications and Future Directions. ISPRS J. Photogramm. Remote Sens. 2016, 114, 24–31. [Google Scholar] [CrossRef]
  36. Nalepa, J.; Kawulok, M. Selecting Training Sets for Support Vector Machines: A Review. Artif. Intell. Rev. 2019, 52, 857–900. [Google Scholar] [CrossRef]
  37. Scott, A.J.; Knott, M. A Cluster Analysis Method for Grouping Means in the Analysis of Variance. Biometrics 1974, 30, 507–512. [Google Scholar] [CrossRef] [Green Version]
  38. Magalhaes, P.C.; Durães, F.O.M. Fisiologia Da Produção de Milho. Circ. Técnica 2006, 76, 1–10. [Google Scholar]
  39. Gerhards, M.; Rock, G.; Schlerf, M.; Udelhoven, T. Water Stress Detection in Potato Plants Using Leaf Temperature, Emissivity, and Reflectance. Int. J. Appl. Earth Obs. Geoinf. 2016, 53, 27–39. [Google Scholar] [CrossRef]
  40. Sun, J.; Yang, L.; Yang, X.; Wei, J.; Li, L.; Guo, E.; Kong, Y. Using Spectral Reflectance to Estimate the Leaf Chlorophyll Content of Maize Inoculated With Arbuscular Mycorrhizal Fungi Under Water Stress. Front. Plant Sci. 2021, 12, 646173. [Google Scholar] [CrossRef]
  41. Lichtenthaler, H.K. Vegetation Stress: An Introduction to the Stress Concept in Plants. J. Plant Physiol. 1996, 148, 4–14. [Google Scholar] [CrossRef]
  42. Zhang, F.; Zhou, G. Estimation of Vegetation Water Content Using Hyperspectral Vegetation Indices: A Comparison of Crop Water Indicators in Response to Water Stress Treatments for Summer Maize. BMC Ecol. 2019, 19, 18. [Google Scholar] [CrossRef] [Green Version]
  43. Zarco-Tejada, P.J.; Ustin, S.L. Modeling Canopy Water Content for Carbon Estimates from MODIS Data at Land EOS Validation Sites. In Proceedings of the IGARSS 2001. Scanning the Present and Resolving the Future. Proceedings. IEEE 2001 International Geoscience and Remote Sensing Symposium (Cat. No. 01CH37217), Sydney, NSW, Australia, 9–13 July 2001; Volume 1, pp. 342–344. [Google Scholar]
  44. Wan, L.; Cen, H.; Zhu, J.; Zhang, J.; Zhu, Y.; Sun, D.; Du, X.; Zhai, L.; Weng, H.; Li, Y. Grain Yield Prediction of Rice Using Multi-Temporal UAV-Based RGB and Multispectral Images and Model Transfer–a Case Study of Small Farmlands in the South of China. Agric. For. Meteorol. 2020, 291, 108096. [Google Scholar] [CrossRef]
  45. Roell, Y.E.; Beucher, A.; Møller, P.G.; Greve, M.B.; Greve, M.H. Comparing a Random Forest Based Prediction of Winter Wheat Yield to Historical Yield Potential. Agronomy 2020, 10, 395. [Google Scholar] [CrossRef] [Green Version]
  46. Meng, L.; Liu, H.; Ustin, S.L.; Zhang, X. Predicting Maize Yield at the Plot Scale of Different Fertilizer Systems by Multi-Source Data and Machine Learning Methods. Remote Sens. 2021, 13, 3760. [Google Scholar] [CrossRef]
  47. Costa, J.M.; Grant, O.M.; Chaves, M.M. Thermography to Explore Plant–Environment Interactions. J. Exp. Bot. 2013, 64, 3937–3949. [Google Scholar] [CrossRef] [PubMed] [Green Version]
  48. Hsiao, T.C. Plant Responses to Water Stress. Annu. Rev. Plant Physiol. 1973, 24, 519–570. [Google Scholar] [CrossRef]
  49. Sobejano-Paz, V.; Mikkelsen, T.N.; Baum, A.; Mo, X.; Liu, S.; Köppl, C.J.; Johnson, M.S.; Gulyas, L.; García, M. Hyperspectral and Thermal Sensing of Stomatal Conductance, Transpiration, and Photosynthesis for Soybean and Maize under Drought. Remote Sens. 2020, 12, 3182. [Google Scholar] [CrossRef]
  50. Carroll, D.A.; Hansen, N.C.; Hopkins, B.G.; DeJonge, K.C. Leaf Temperature of Maize and Crop Water Stress Index with Variable Irrigation and Nitrogen Supply. Irrig. Sci. 2017, 35, 549–560. [Google Scholar] [CrossRef]
  51. Gava, R.; Santana, D.C.; Cotrim, M.F.; Rossi, F.S.; Teodoro, L.P.R.; da Silva Junior, C.A.; Teodoro, P.E. Soybean Cultivars Identification Using Remotely Sensed Image and Machine Learning Models. Sustainability 2022, 14, 7125. [Google Scholar] [CrossRef]
  52. Curran, P.J.; Dungan, J.L.; Gholz, H.L. Exploring the Relationship between Reflectance Red Edge and Chlorophyll Content in Slash Pine. Tree Physiol. 1990, 7, 33–48. [Google Scholar] [CrossRef]
  53. Xu, M.; Liu, R.; Chen, J.M.; Liu, Y.; Shang, R.; Ju, W.; Wu, C.; Huang, W. Retrieving Leaf Chlorophyll Content Using a Matrix-Based Vegetation Index Combination Approach. Remote Sens. Environ. 2019, 224, 60–73. [Google Scholar] [CrossRef]
  54. Zhu, M.; Li, F.H.; Shi, Z.S. Morphological and Photosynthetic Response of Waxy Corn Inbred Line to Waterlogging. Photosynthetica 2016, 54, 636–640. [Google Scholar] [CrossRef]
  55. Nemeskéri, E.; Helyes, L. Physiological Responses of Selected Vegetable Crop Species to Water Stress. Agronomy 2019, 9, 447. [Google Scholar] [CrossRef] [Green Version]
  56. Herrero-Huerta, M.; Rodriguez-Gonzalvez, P.; Rainey, K.M. Yield prediction by machine learning from UAS-based multi-sensor data fusion in soybean. Plant Methods 2020, 16, 78. [Google Scholar] [CrossRef] [PubMed]
  57. Jeong, J.H.; Resop, J.P.; Mueller, N.D.; Fleisher, D.H.; Yun, K.; Butler, E.E.; Timlin, D.J.; Shim, K.-M.; Gerber, J.S.; Reddy, V.R.; et al. Random Forests for Global and Regional Crop Yield Predictions. PLoS ONE 2016, 11, e0156571. [Google Scholar] [CrossRef] [PubMed]
Figure 1. Location of the municipality of Chapadão do Sul/Brazil (A), illustration of the experimental field and UAV used (B), and measurement of the temperature of the maize crop canopy (C).
Remotesensing 15 00079 g001
Figure 2. Pearson correlation analysis between the variables grain yield, temperature, spectral bands, and vegetation indices. The values shown in black indicate the overall correlation, while the colored values indicate the correlation between irrigation management. *, ** and ***: significant at 5, 1 and 0.1% probability by t-test, respectively.
Remotesensing 15 00079 g002
Figure 3. Canonical variable analysis for the evaluation of spectral variables (Red, Green, Blue, NIR, red-edge, NDVI, NDRE, SAVI, EVI, GLI), grain yield (GY), and leaf temperature (Temp) with the irrigation managements [control, 60% of the crop evapotranspiration (ET) and 100% of ET].
Remotesensing 15 00079 g003
Figure 4. Boxplot for grouping Pearson correlation means (r) (A) and mean absolute error (MAE) (B). Means followed by the same uppercase letters for the different inputs and the same lowercase letters for the different ML algorithms do not differ by the Scott–Knott test at 5% probability. ML: machine learning models; ANN: artificial neural network; LR: linear regression; M5P: M5P decision tree algorithm; REPT: REPTree decision tree algorithm; RF: Random Forest; SVM: support vector machine; IR: irrigation management; SB: spectral bands; Temp: temperature.
Remotesensing 15 00079 g004
Table 1. Information on soil pH, organic matter, phosphorus, aluminum, potassium, calcium and magnesium, CEC, base saturation (V%), and clay content.
pH (CaCl2)Ca + Mg
(cmolc dm−3)
Ca
(cmol dm−3)
Mg (cmol dm−3)H + Al (cmolc dm−3)K
(cmol dm−3)
5.14.415.60.93.30.33
P
(mg dm−3)
V%Clay
(g dm−3)
O.M.
(g dm−3)
CEC
(cmolc)
5.0058.9335.0030.18.00
pH CaCl2; H + Al: Potential acidity; Ca: Calcium; Mg: Magnesium; K: Potassium; P: Phosphorus (resin); O.M.: Organic matter; Clay: Clay content; V%: base saturation; and CEC: Cation exchange capacity.
Table 2. List of machine learning models used in maize yield prediction.
AbbreviationRegression ModelReference
ANNMultilayer Perceptron Artificial Neural Network (ANN)[31]
LRMultiple Linear Regression[32]
M5PM5P Decision Tree Algorithm[33]
REPTREPTree Decision Tree Algorithm[34]
RFRandom Forest[35]
SVMSupport Vector Machine[36]
Table 3. Summary of analysis of variance for Pearson correlation coefficients (r) and mean absolute error (MAE) by different inputs and Machine Learning (ML) models tested.
SVDFrMAE
Input20.00475 ns205689.5 *
ML50.039006 *591503.2 *
Input × ML100.009434 ns68399 *
CV (%)16.237.44
ns: non-significant; * significant at 5% probability by F-test; ML: Machine Learning.
Disclaimer/Publisher’s Note: The statements, opinions and data contained in all publications are solely those of the individual author(s) and contributor(s) and not of MDPI and/or the editor(s). MDPI and/or the editor(s) disclaim responsibility for any injury to people or property resulting from any ideas, methods, instructions or products referred to in the content.

