
Thirty-Four-Year Record (1987–2021) of the Spatiotemporal Dynamics of Algal Blooms in Lake Dianchi from Multi-Source Remote Sensing Insights

 , , , and
Abstract
:1. Introduction
2. Materials and Methods
2.1. Study Area
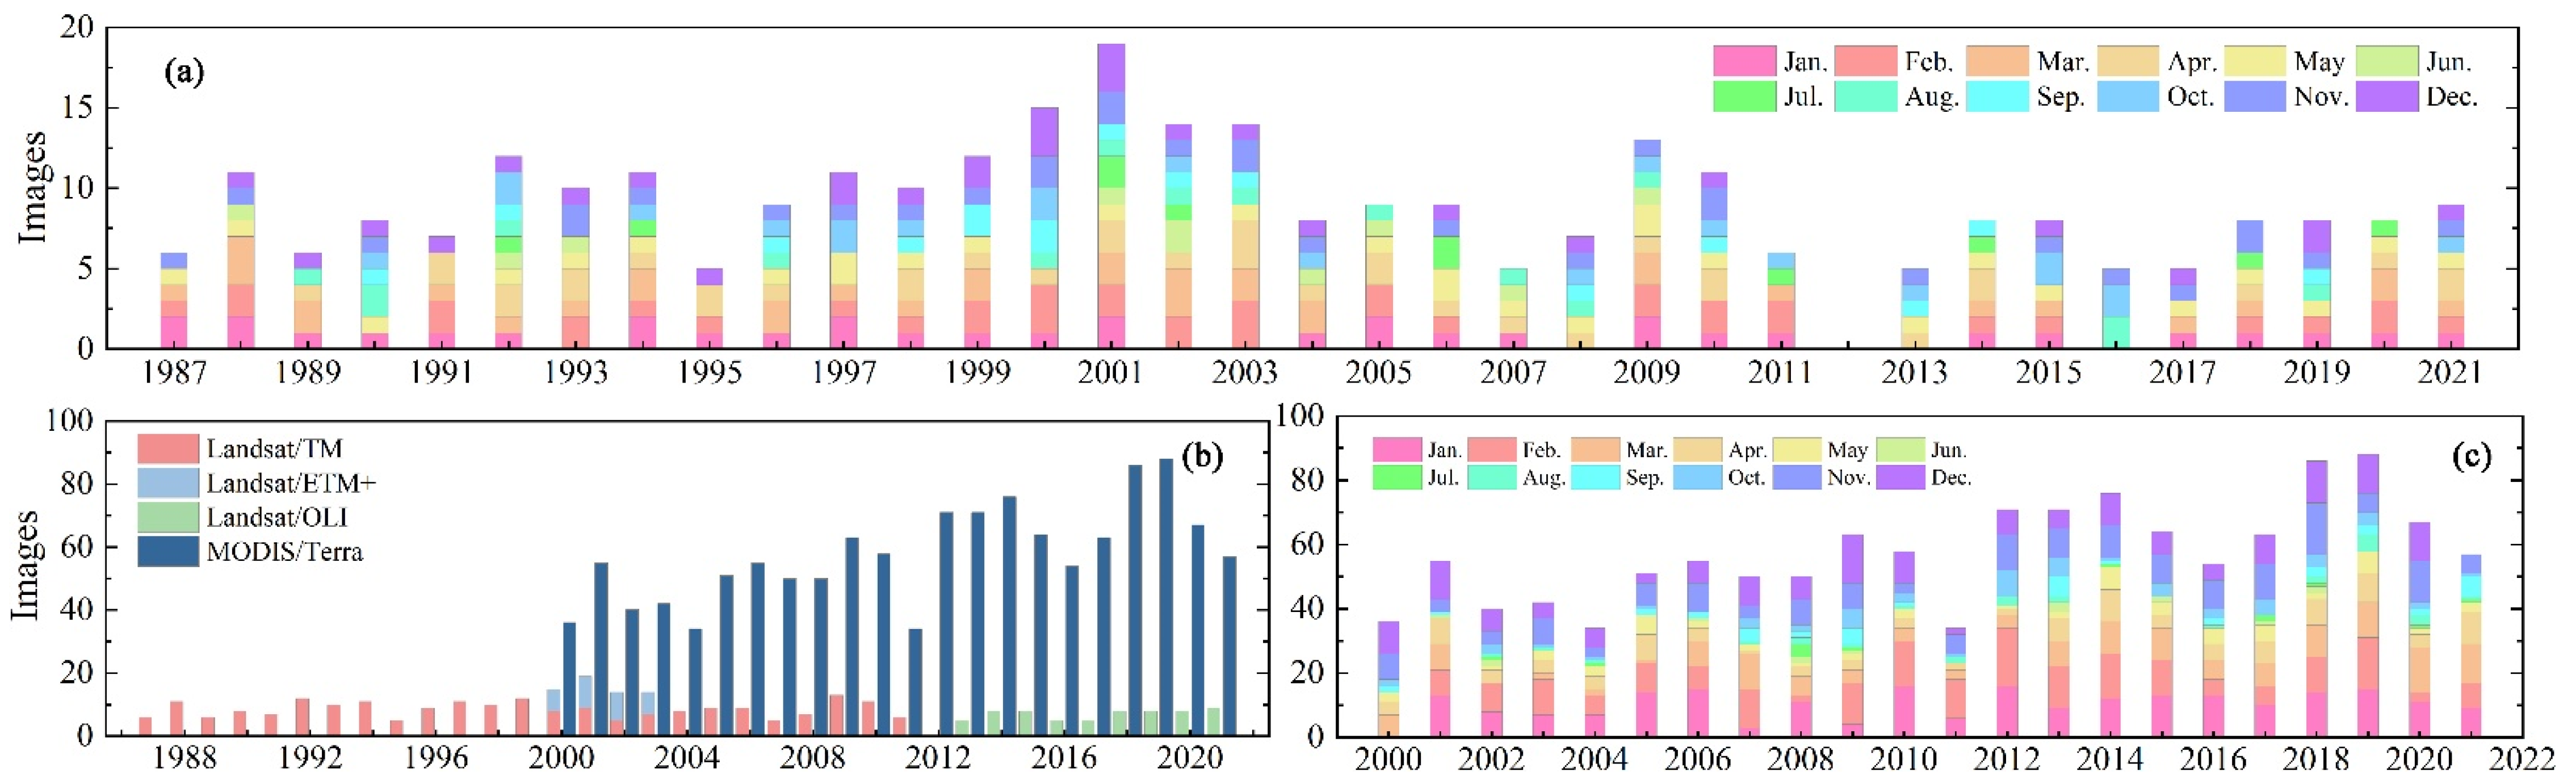
2.2. Satellite Data
2.2.1. Landsat Data
2.2.2. MODIS/Terra Data
2.3. Algal Bloom Extraction
2.3.1. Pre-Processing of Satellite Images
2.3.2. Floating Algae Index
2.3.3. Thresholds for Distinguishing Algal Bloom Pixels
2.4. Environmental Factors
2.5. Statistical Methods
2.5.1. Analysis of Algal Bloom Time Series
2.5.2. Statistics of Environmental Factors
2.5.3. Statistical Metrics
3. Results
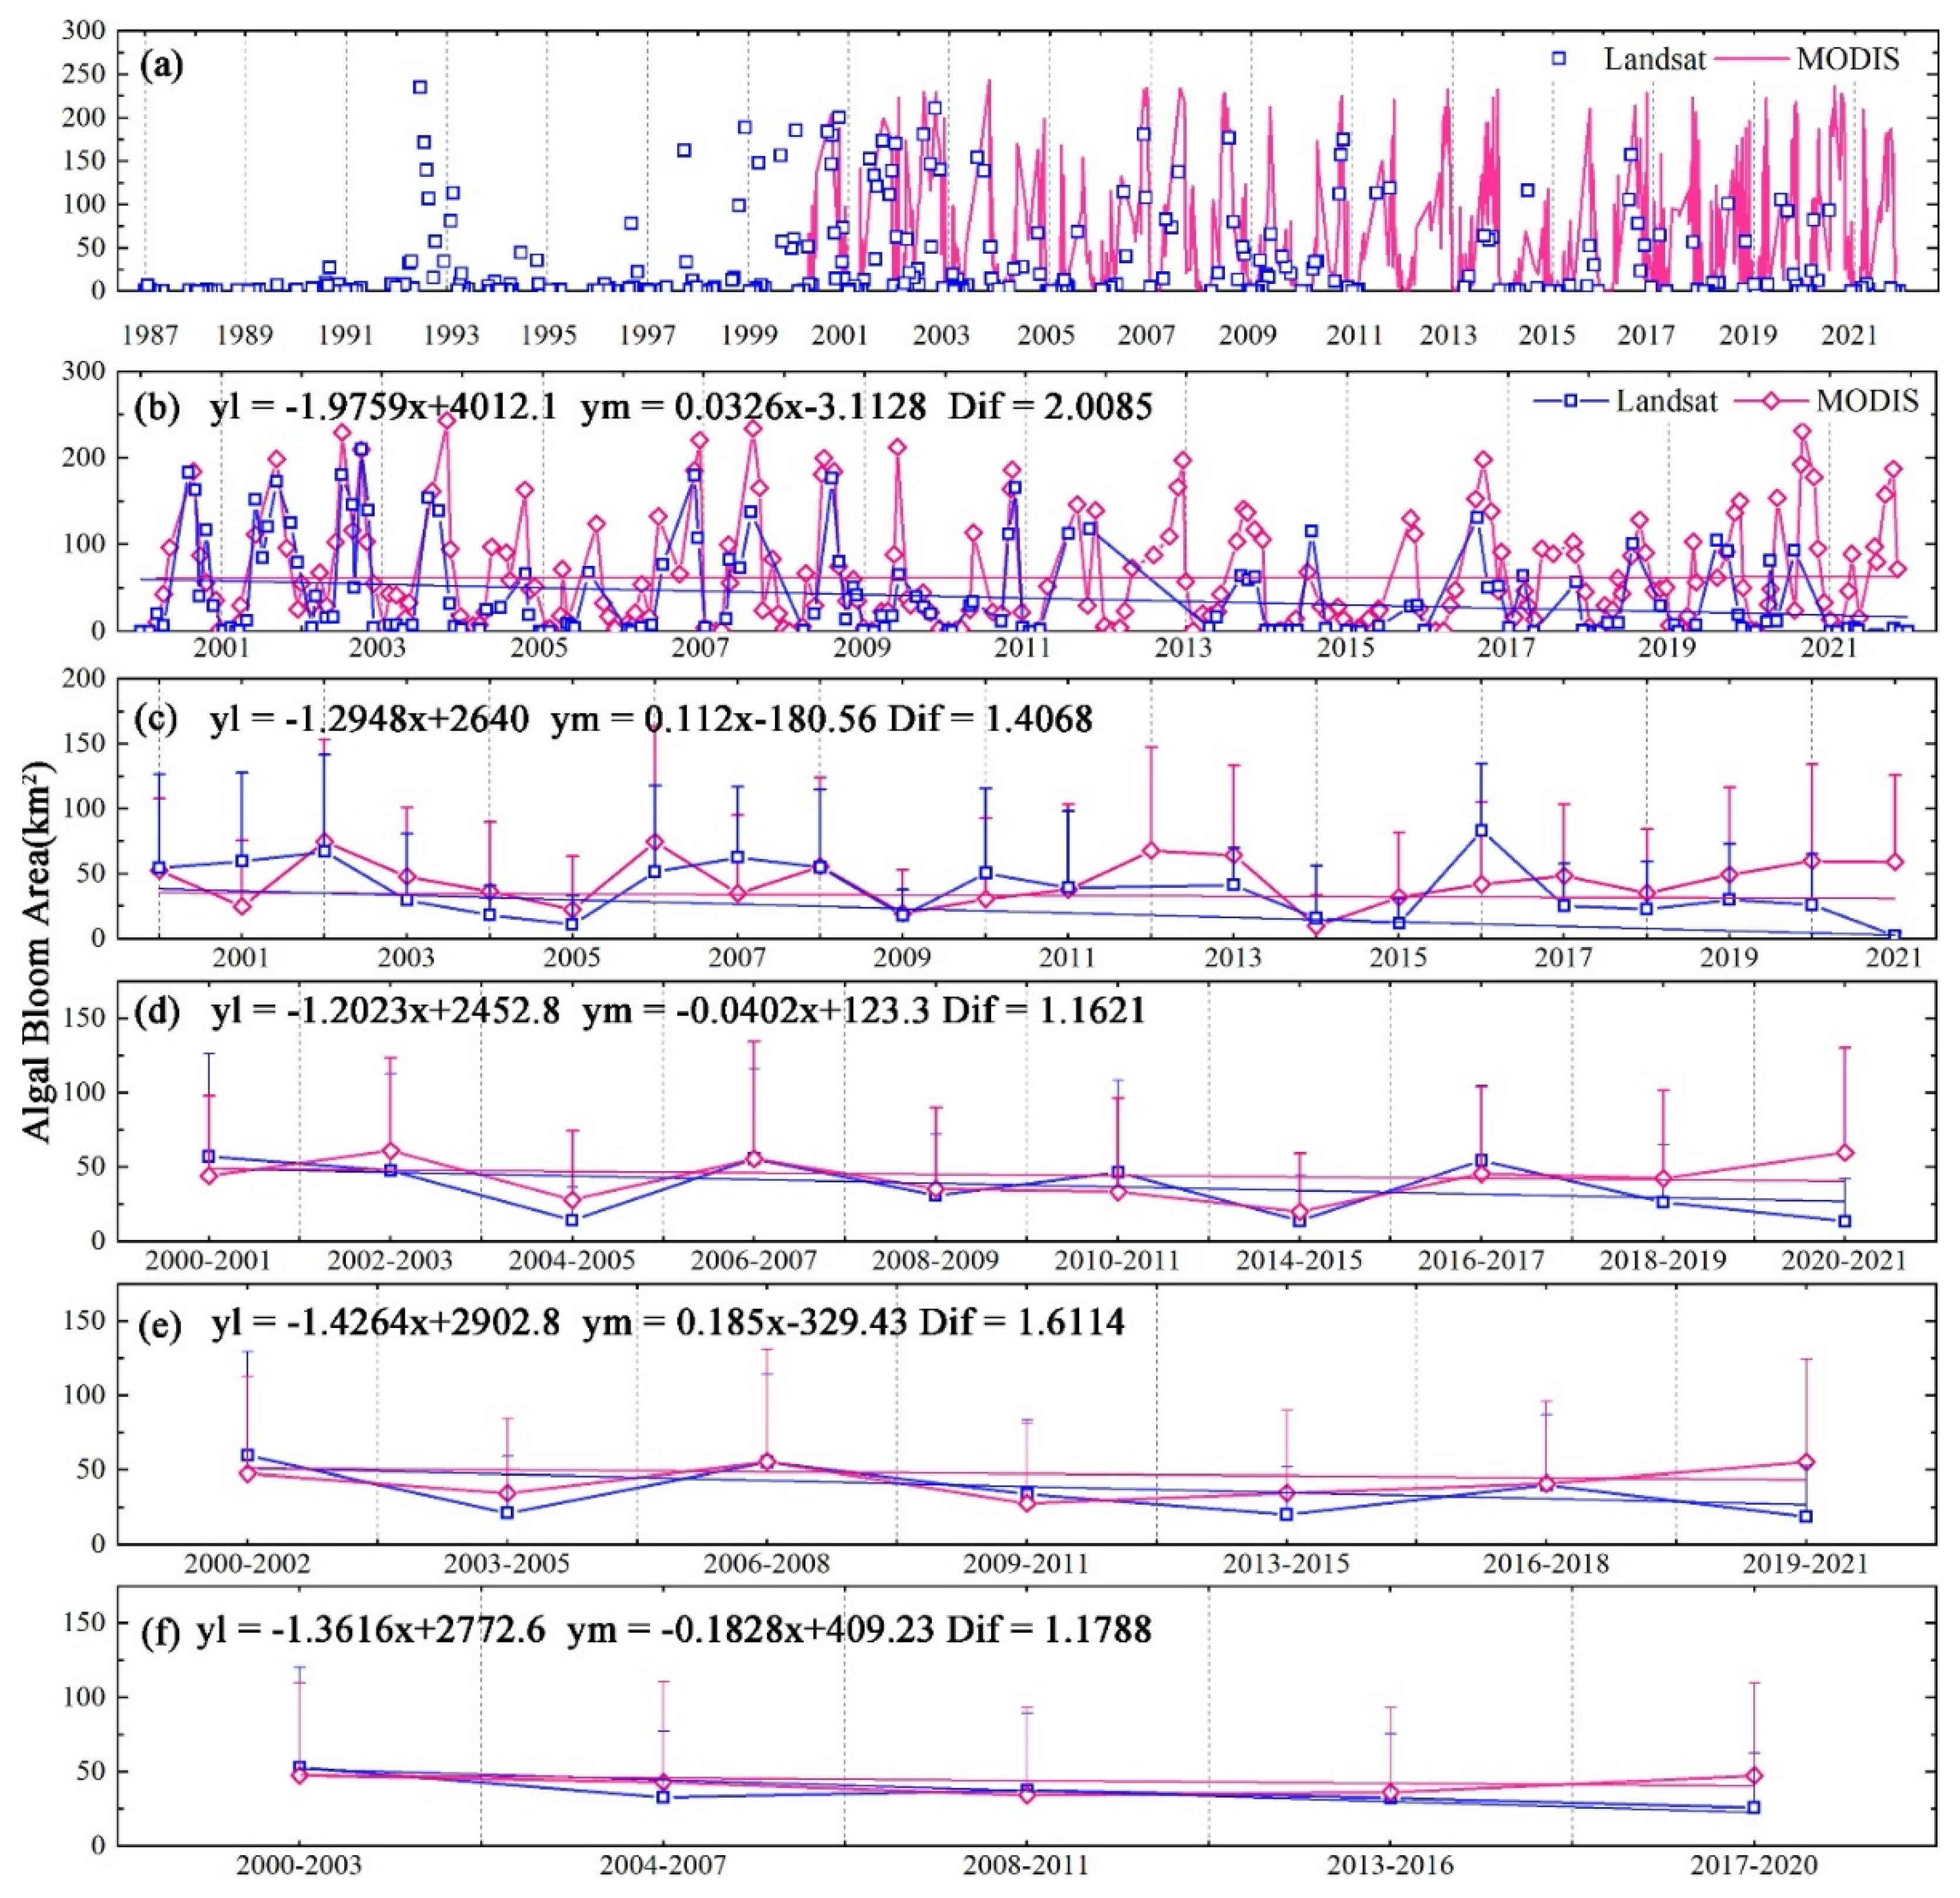
3.1. Combining the Landsat and MODIS/Terra Observations
3.2. Long-Term Records of Algal Blooms since the 1980s
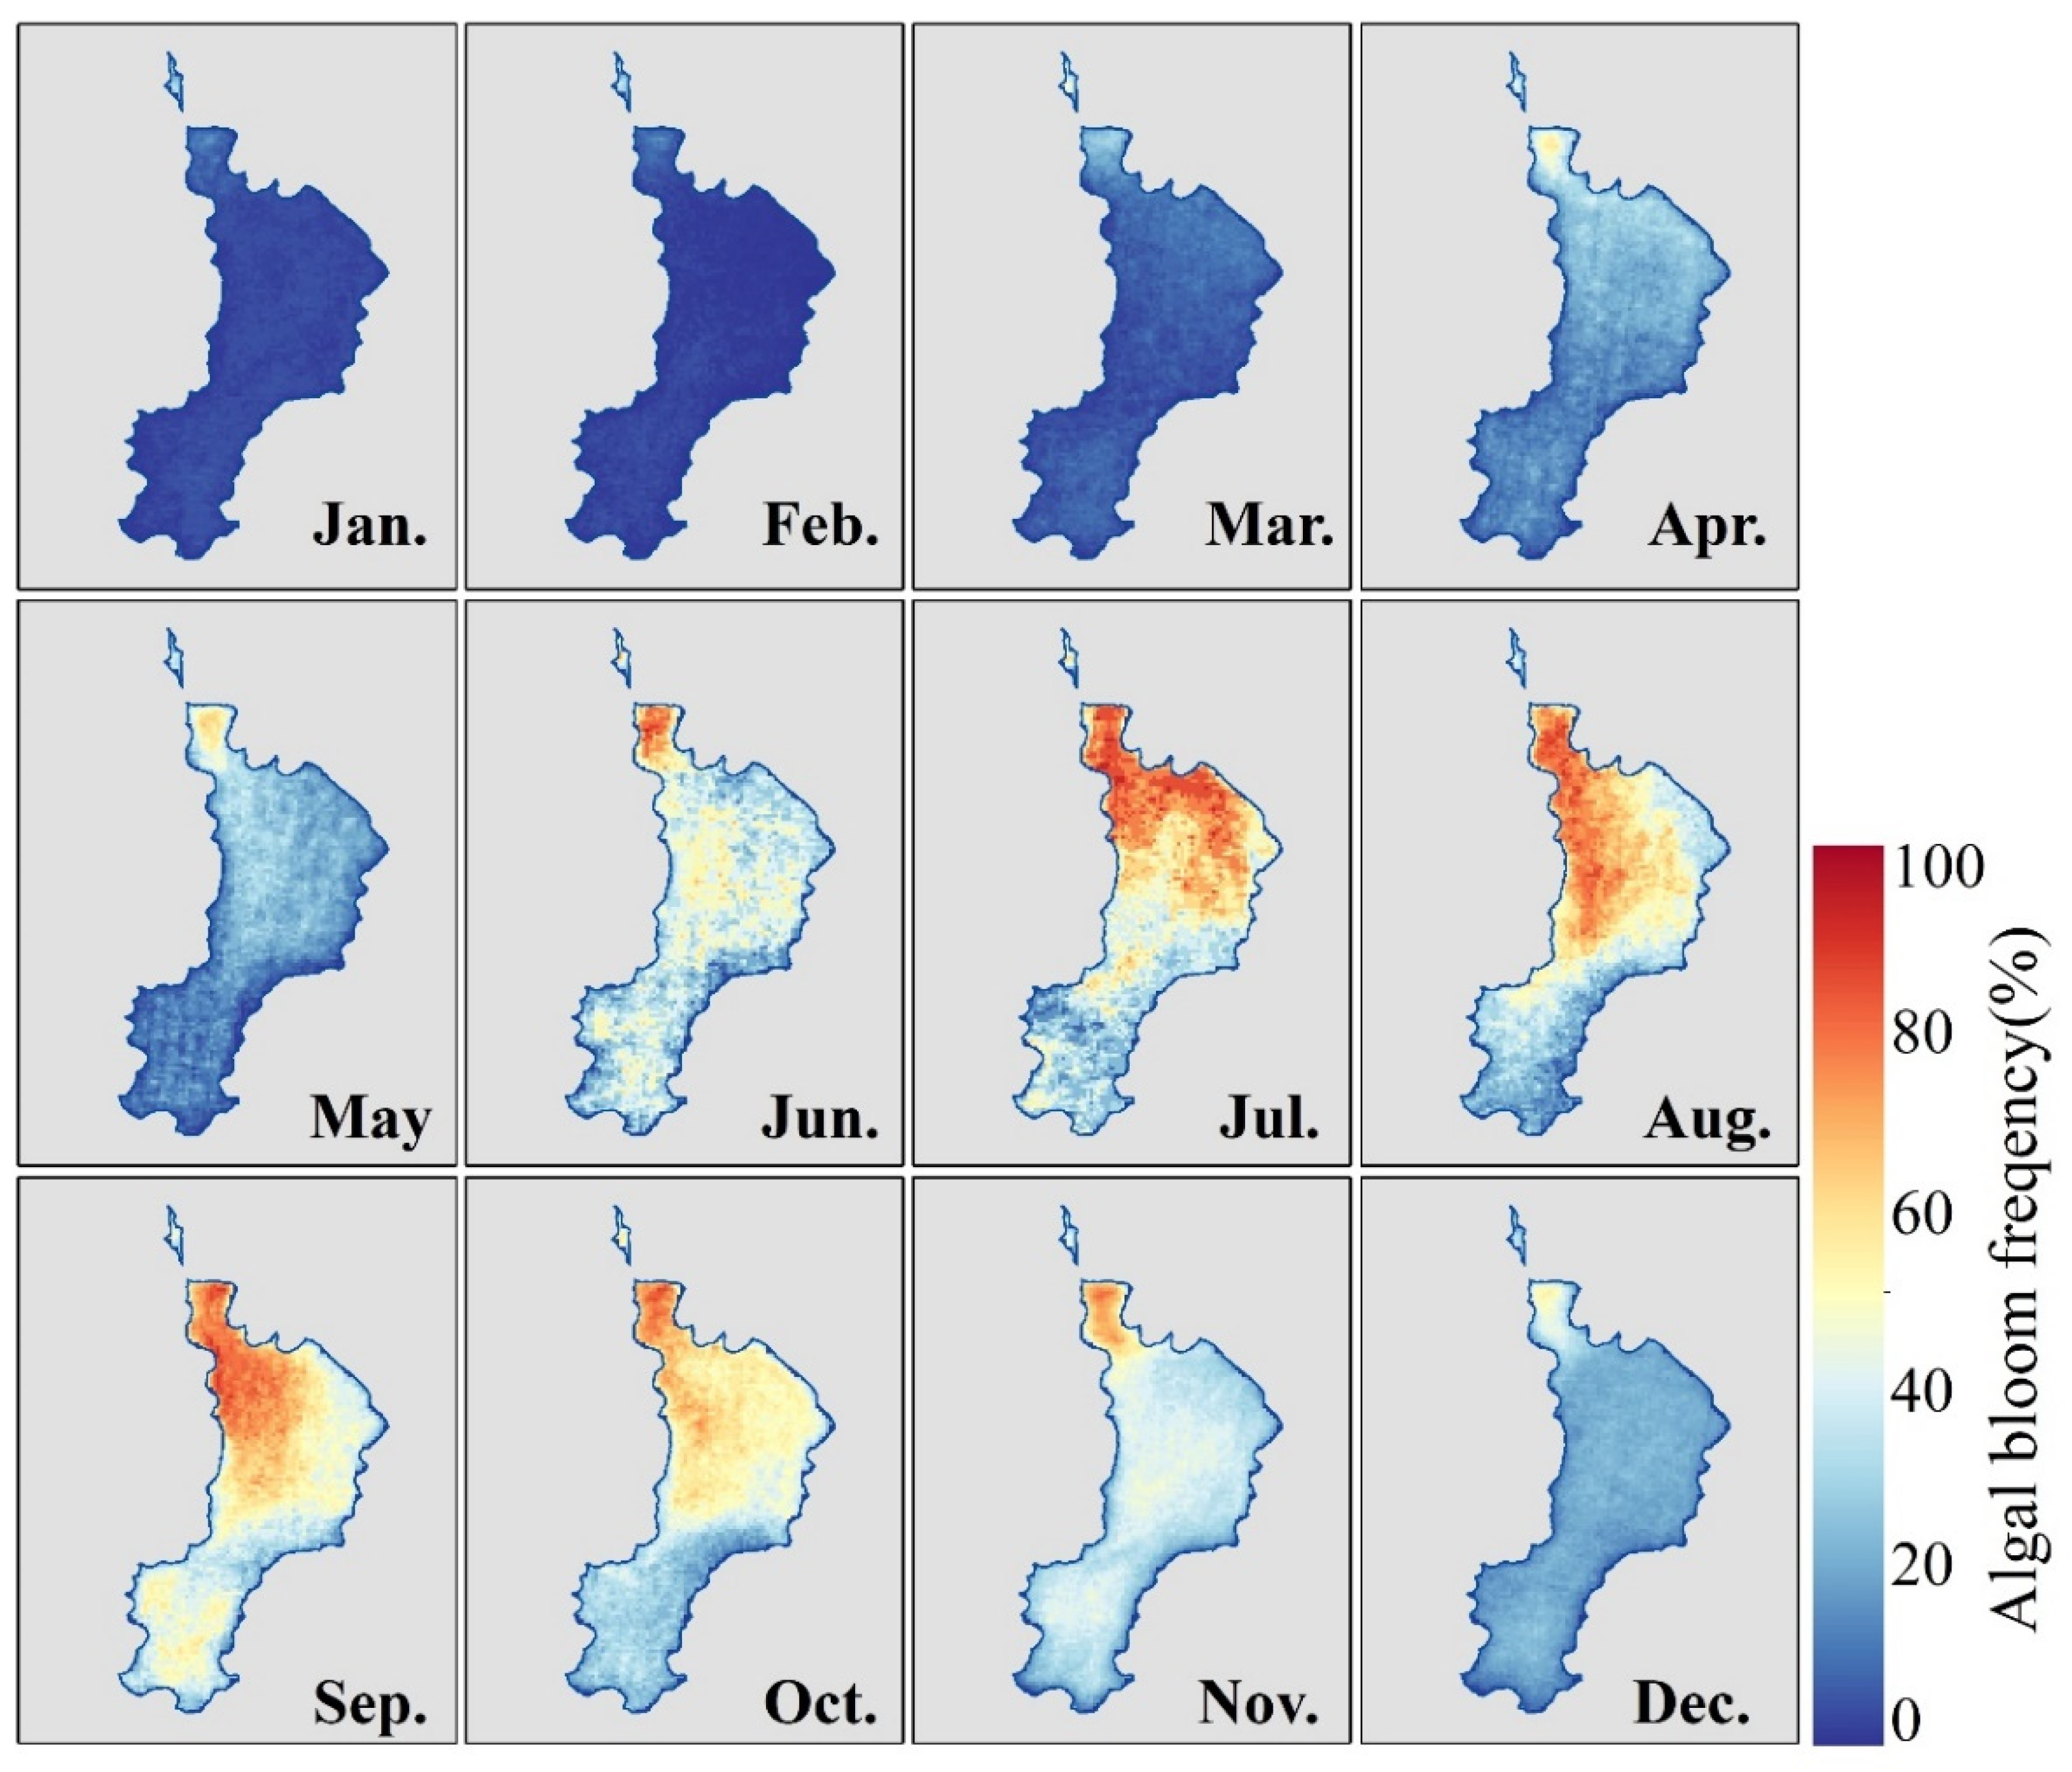
3.3. Spatial Distribution of Algal Blooms
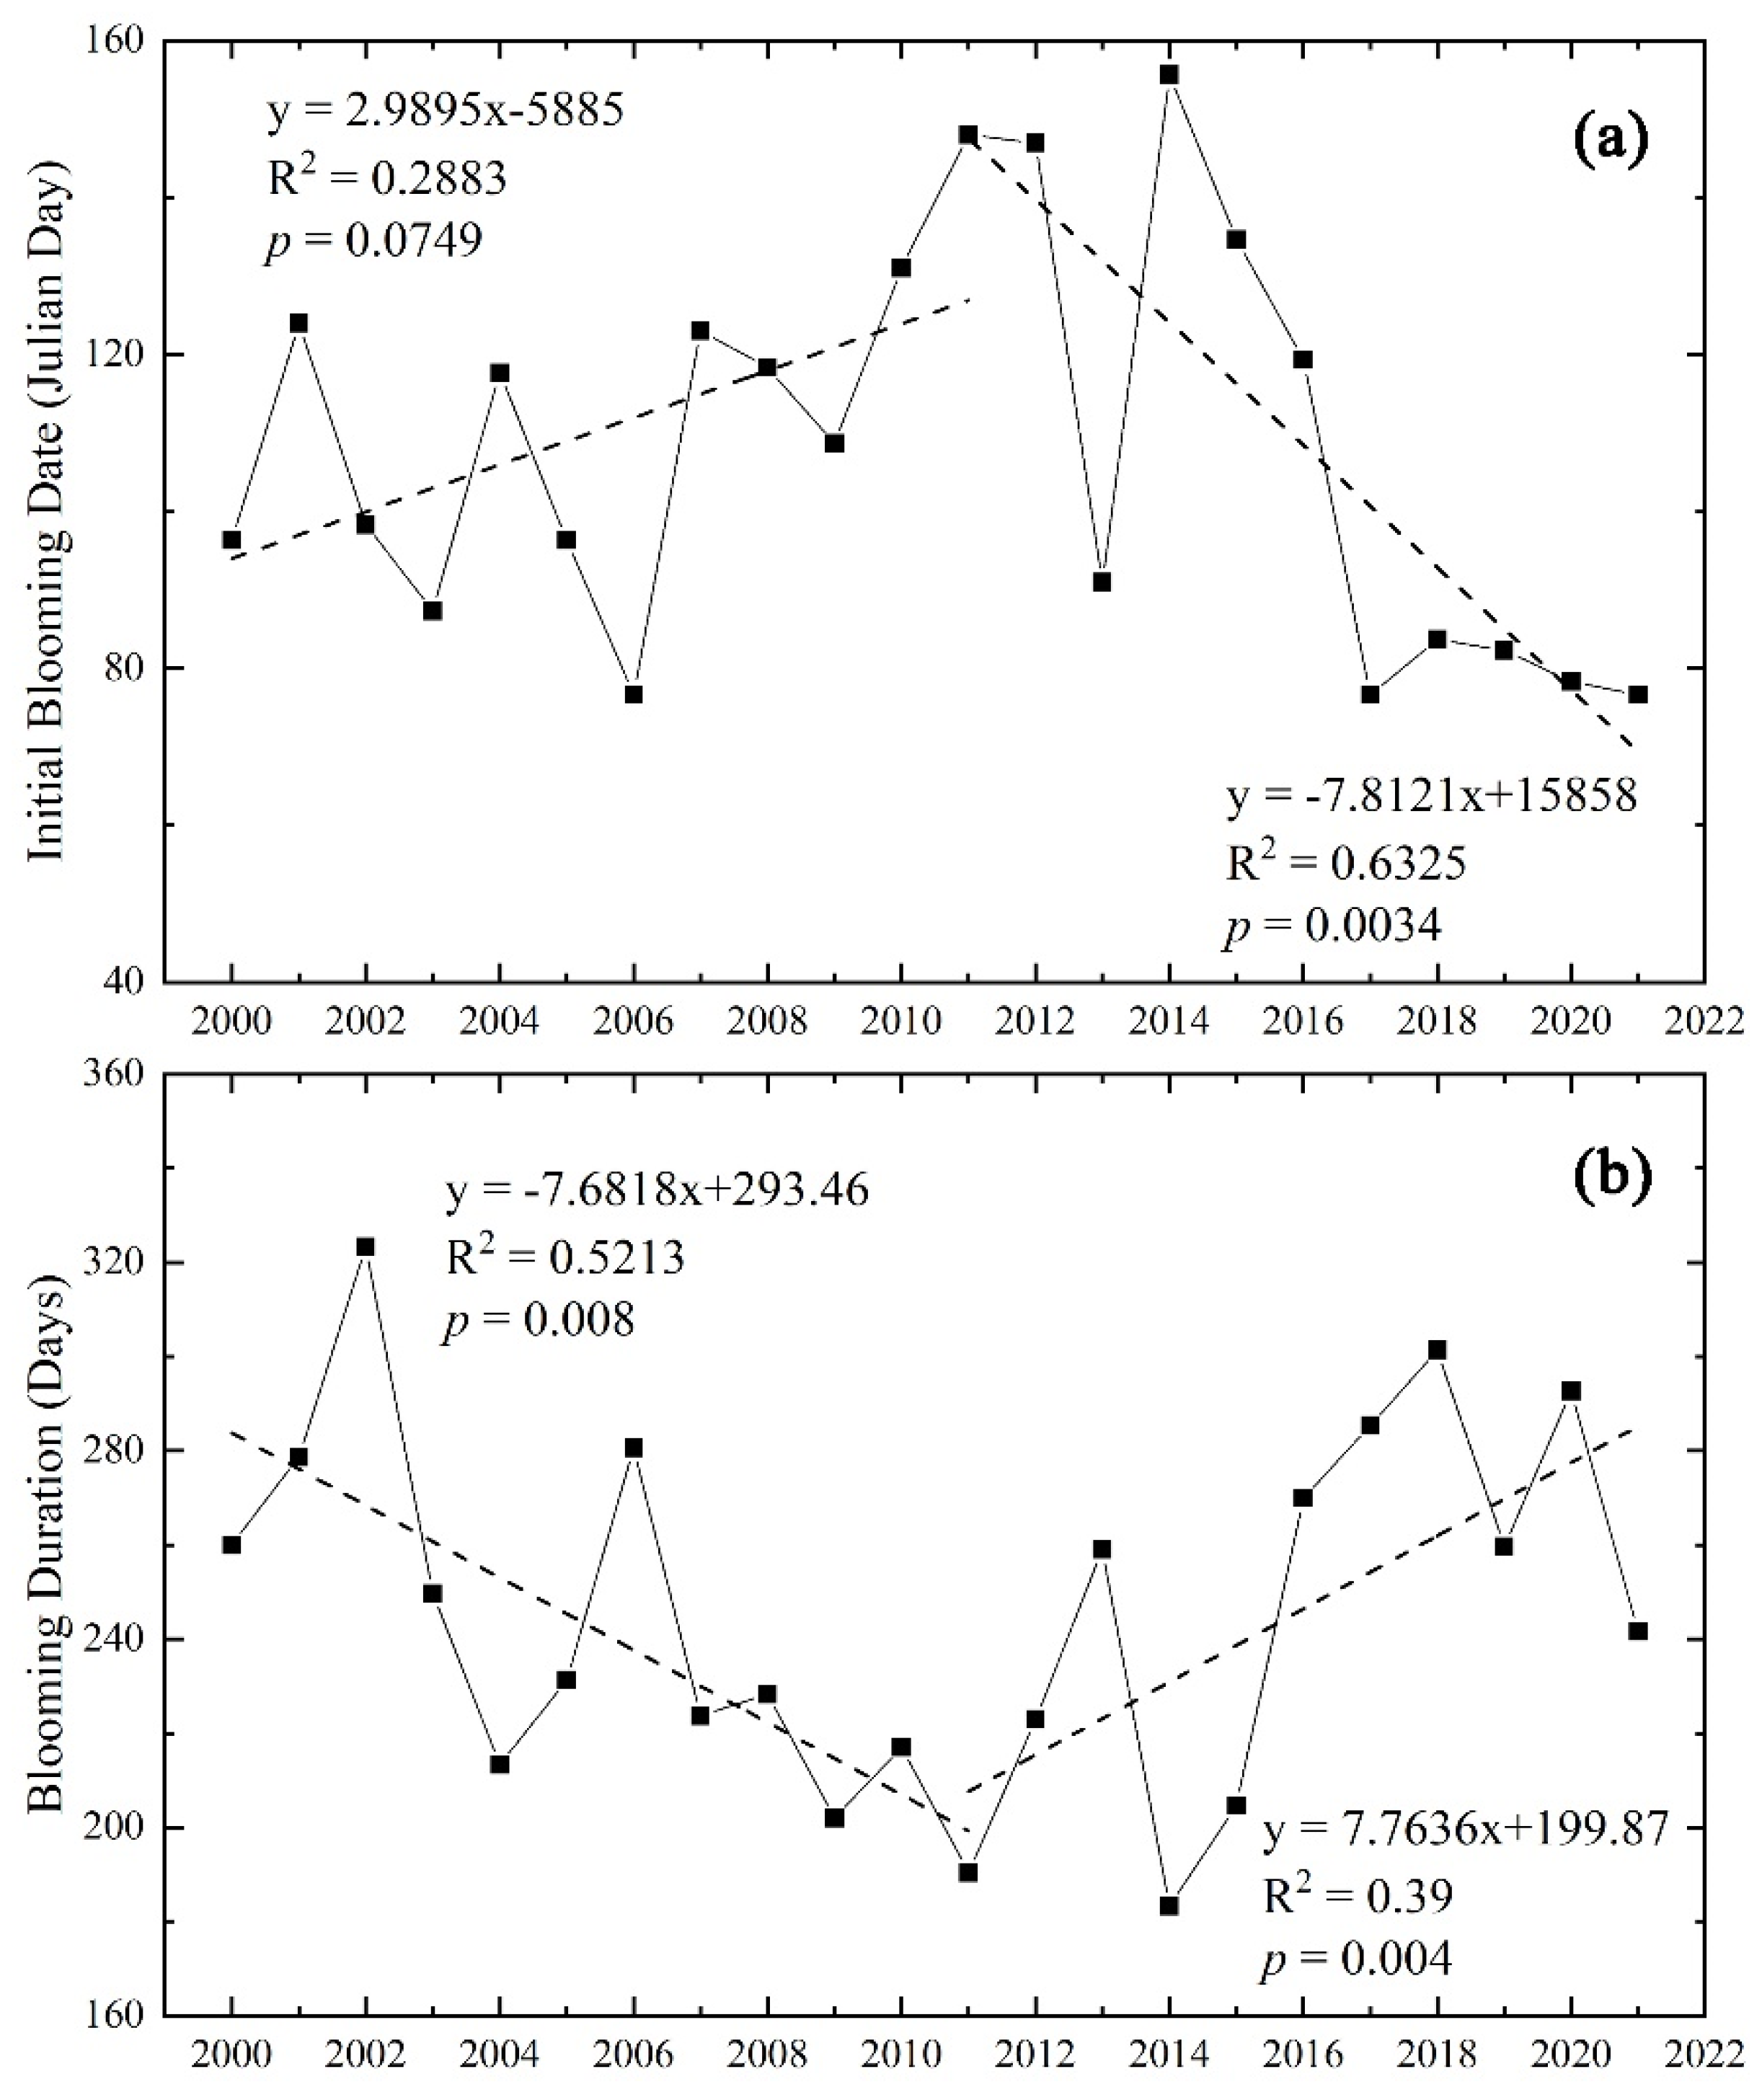
3.4. Temporal Characteristics of Algal Blooms
4. Discussion
4.1. Uncertainty in Long-Term Record Reconstruction Based on Multi-Source Satellite Data
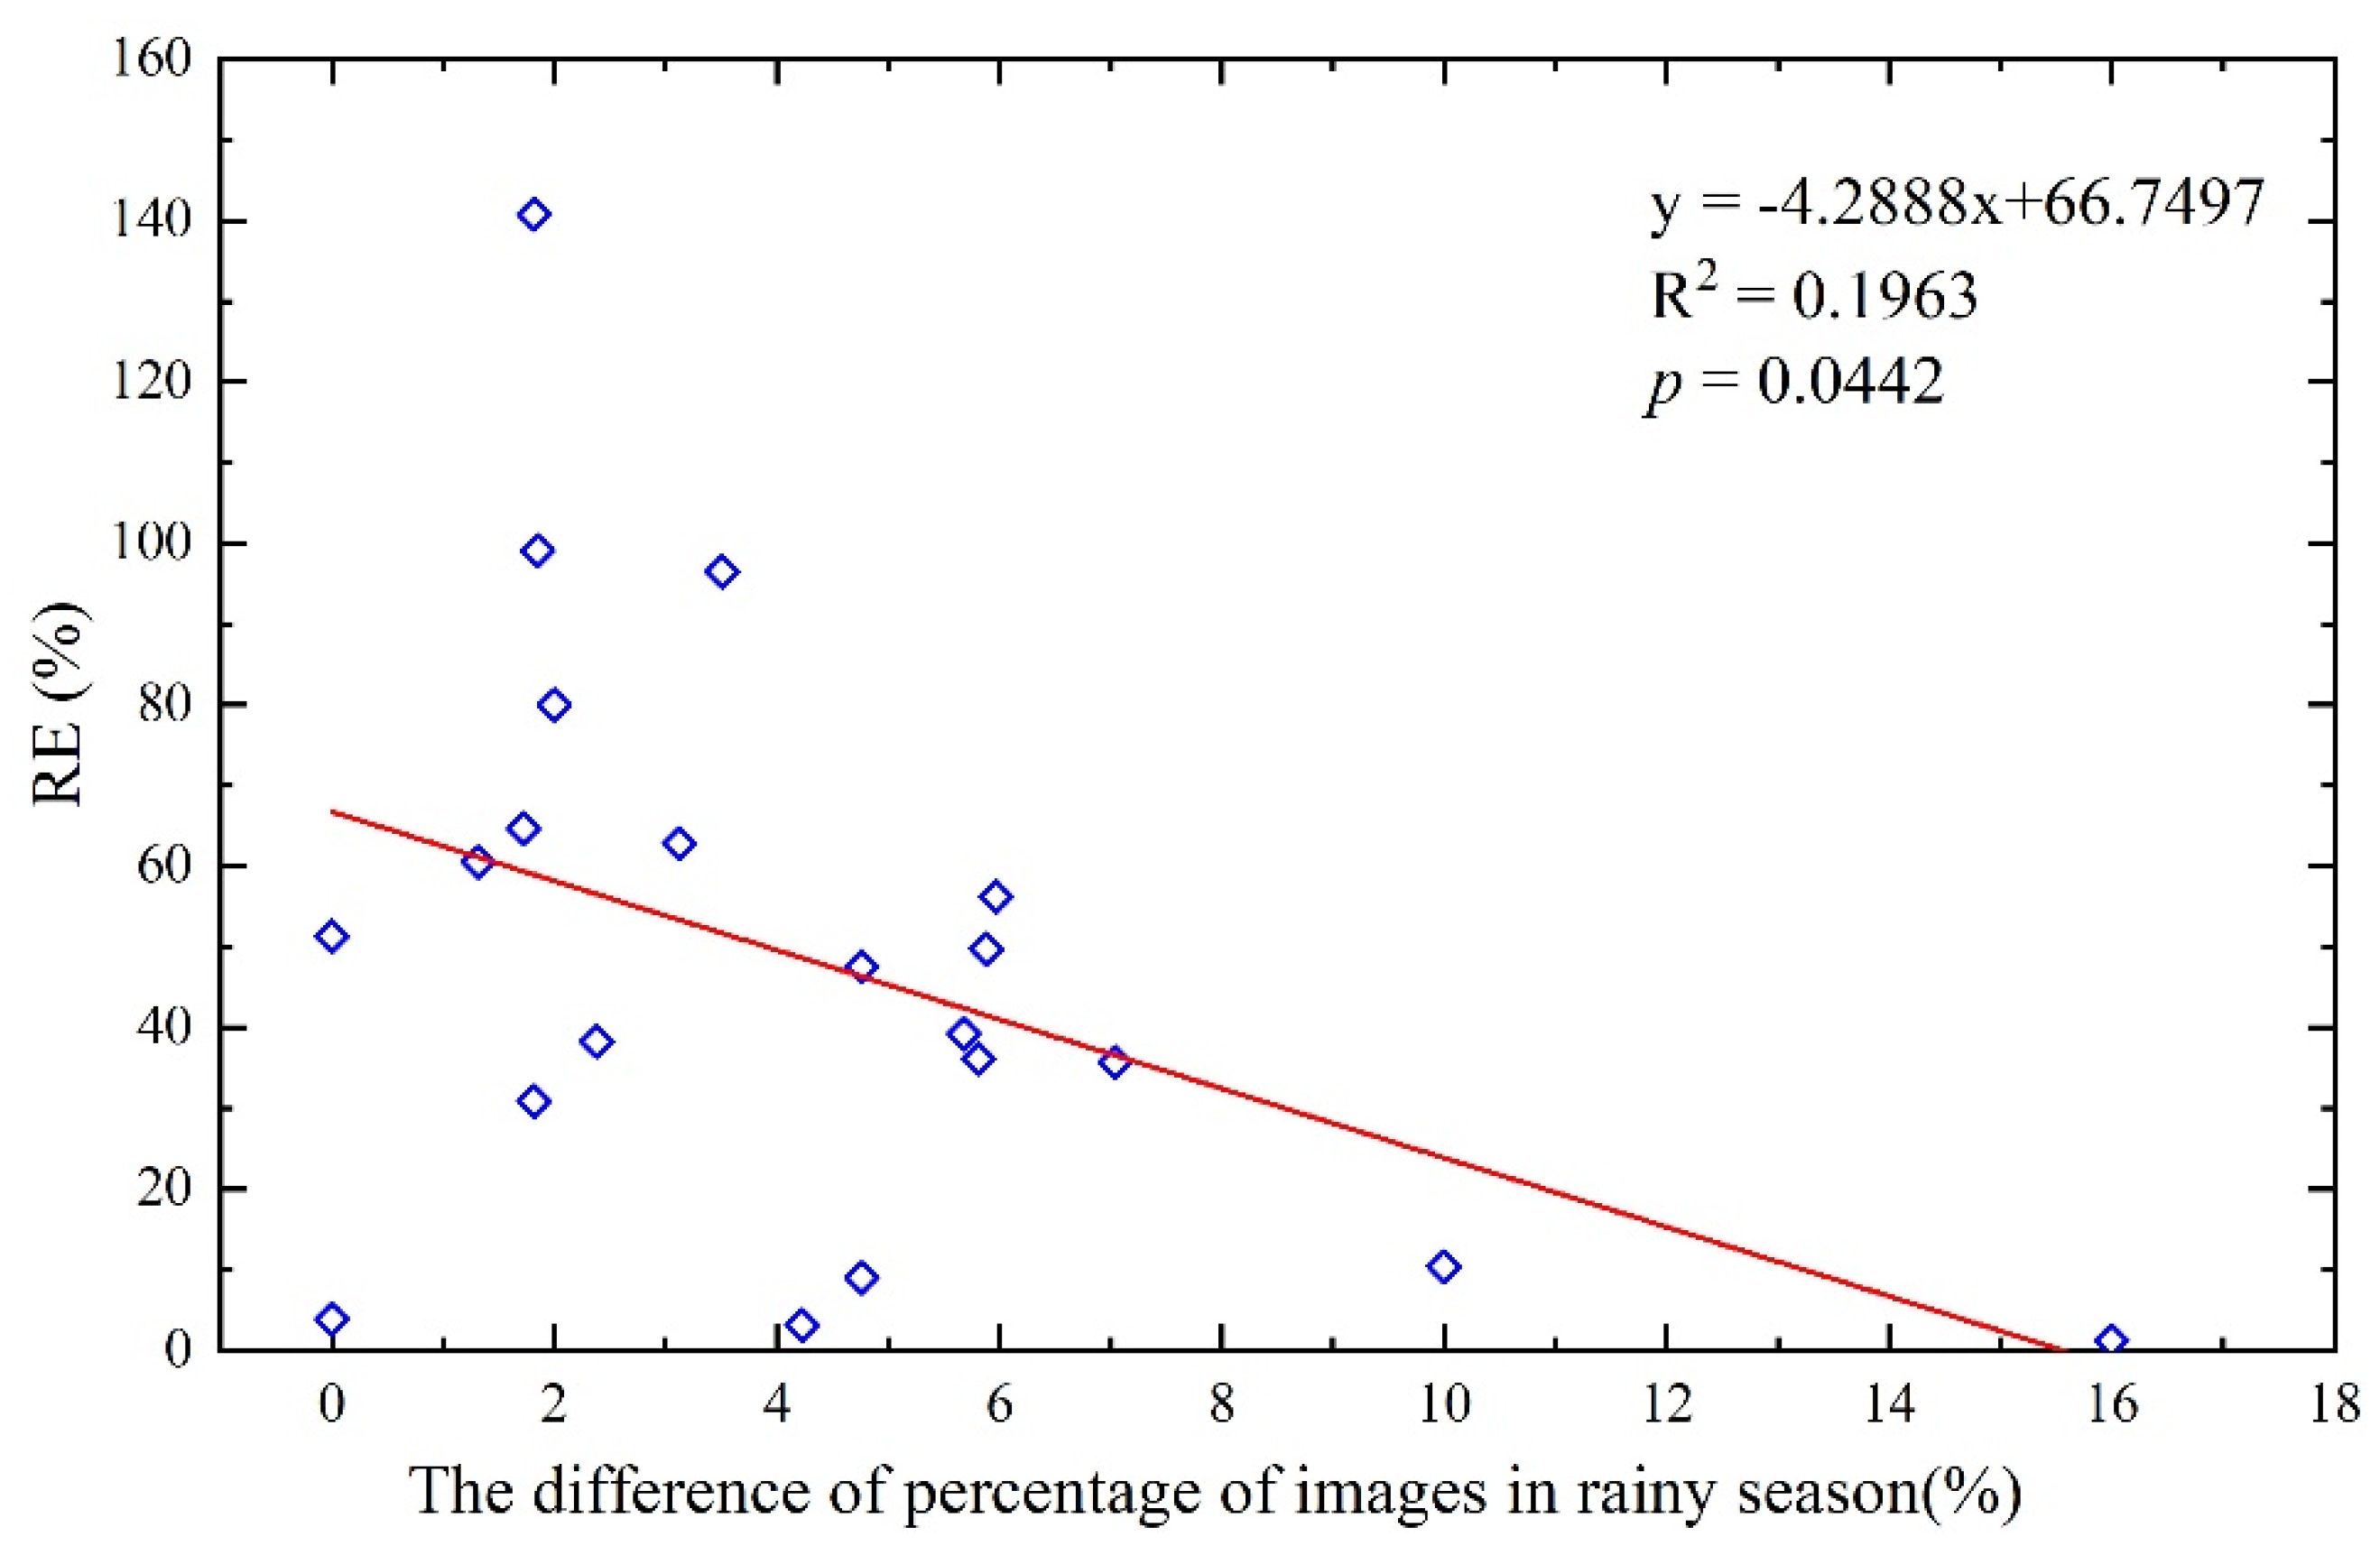
4.1.1. Observation Frequency of Multi-Source Satellites
4.1.2. The Effect of Algal Bloom Indicators
4.1.3. The Effect of the Spatial Resolution of Multi-Source Satellites
4.2. Effect of Environmental Factors on Algal Blooms in Lake Dianchi
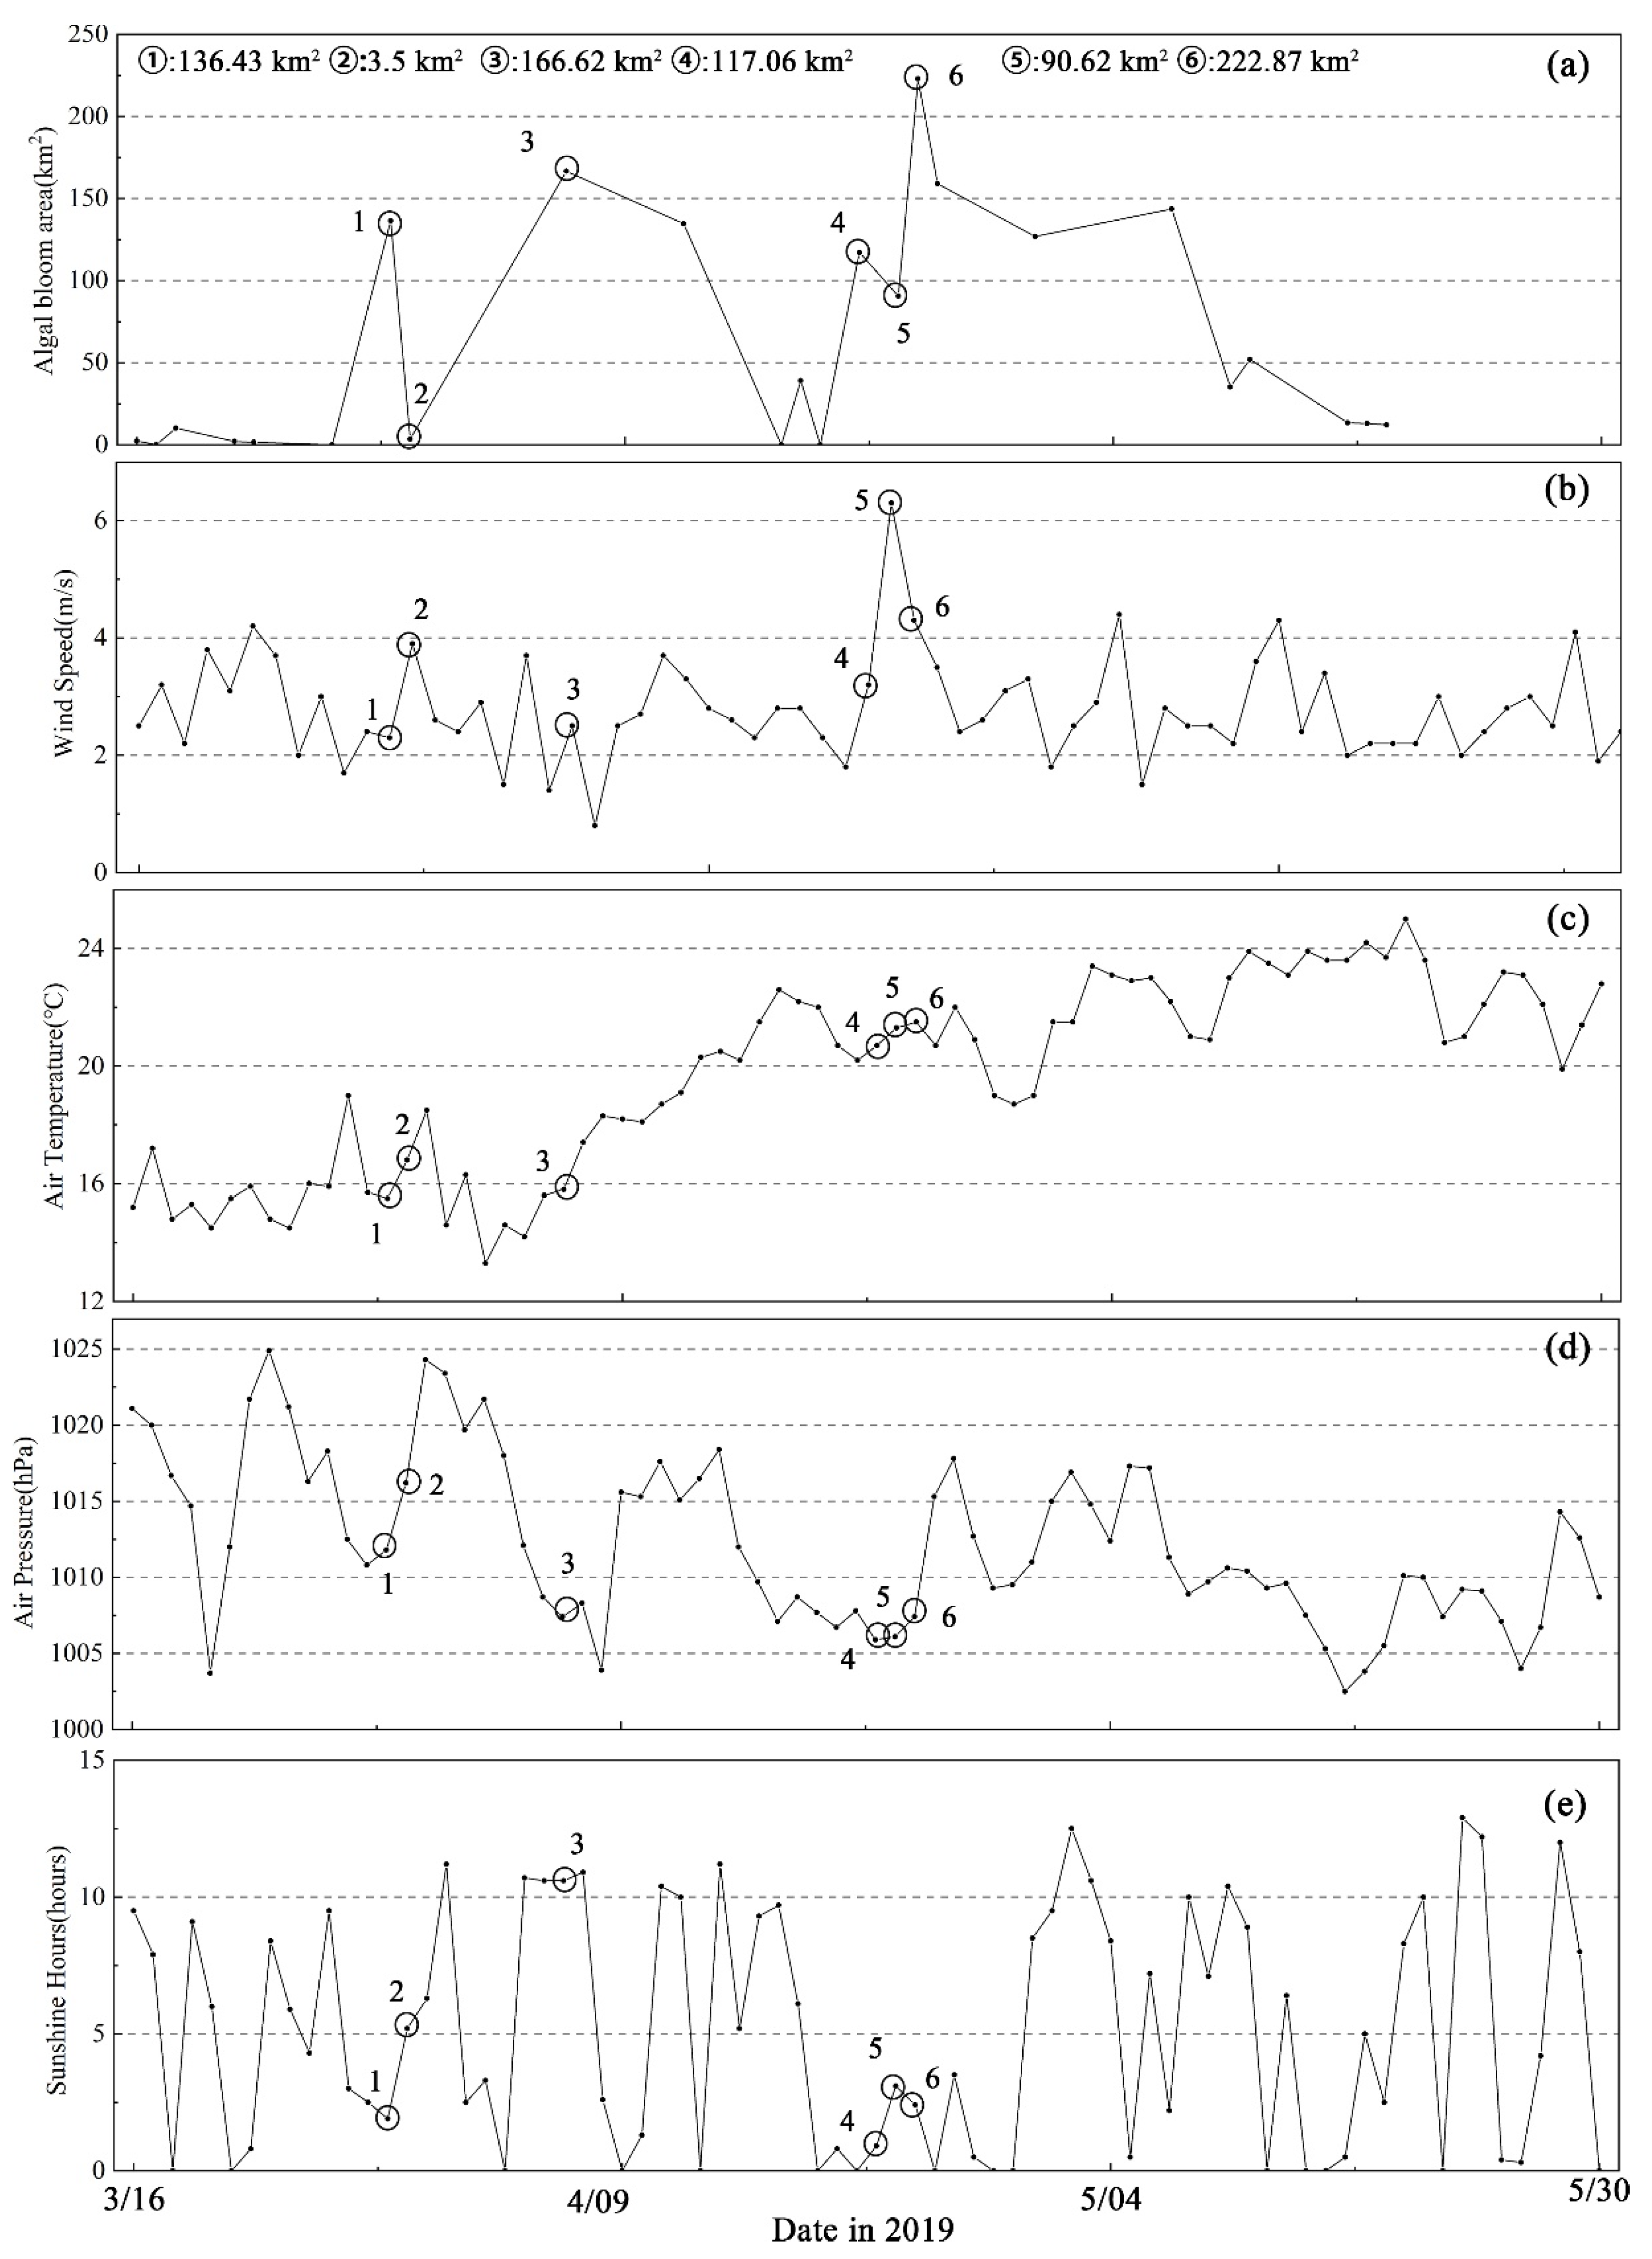
4.2.1. Meteorological Conditions
4.2.2. Nutrient Conditions
5. Conclusions
Supplementary Materials
Author Contributions
Funding
Data Availability Statement
Acknowledgments
Conflicts of Interest
References
- Wang, J.; He, L.; Yang, C.; Dao, G.; Du, J.; Han, Y.; Wu, G.; Wu, Q.; Hu, H. Comparison of algal bloom related meteorological and water quality factors and algal bloom conditions among Lakes Taihu, Chaohu, and Dianchi (1981–2015). J. Lake Sci. 2018, 30, 897–906. [Google Scholar]
- Jing, Y.; Zhang, Y.; Hu, M.; Chu, Q.; Ma, R. MODIS-Satellite-Based Analysis of Long-Term Temporal-Spatial Dynamics and Drivers of Algal Blooms in a Plateau Lake Dianchi, China. Remote Sens. 2019, 11, 2582. [Google Scholar] [CrossRef]
- Wang, J.-H.; Wang, Y.-N.; Dao, G.-H.; Du, J.-S.; Han, Y.-P.; Hu, H.-Y. Decade-long meteorological and water quality dynamics of northern Lake Dianchi and recommendations on algal bloom mitigation via key influencing factors identification. Ecol. Indic. 2020, 115, 106425. [Google Scholar] [CrossRef]
- Hou, X.; Feng, L.; Dai, Y.; Hu, C.; Gibson, L.; Tang, J.; Lee, Z.; Wang, Y.; Cai, X.; Liu, J.; et al. Global mapping reveals increase in lacustrine algal blooms over the past decade. Nat. Geosci. 2022, 15, 130–134. [Google Scholar] [CrossRef]
- Cao, Z.; Ma, R.; Duan, H.; Pahlevan, N.; Melack, J.; Shen, M.; Xue, K. A machine learning approach to estimate chlorophyll-a from Landsat-8 measurements in inland lakes. Remote Sens. Environ. 2020, 248, 111974. [Google Scholar] [CrossRef]
- Shi, K.; Zhang, Y.; Qin, B.; Zhou, B. Remote sensing of cyanobacterial blooms in inland waters: Present knowledge and future challenges. Sci. Bull. 2019, 64, 1540–1556. [Google Scholar] [CrossRef]
- Wang, J.-H.; Yang, C.; He, L.-Q.-S.; Dao, G.-H.; Du, J.-S.; Han, Y.-P.; Wu, G.-X.; Wu, Q.-Y.; Hu, H.-Y. Meteorological factors and water quality changes of Plateau Lake Dianchi in China (1990–2015) and their joint influences on cyanobacterial blooms. Sci. Total Environ. 2019, 665, 406–418. [Google Scholar] [CrossRef]
- Wang, J.-H.; Li, C.; Xu, Y.-P.; Li, S.-Y.; Du, J.-S.; Han, Y.-P.; Hu, H.-Y. Identifying major contributors to algal blooms in Lake Dianchi by analyzing river-lake water quality correlations in the watershed. J. Clean. Prod. 2021, 315, 128144. [Google Scholar] [CrossRef]
- Sheng, H.; Guo, H.; Liu, H.; Yang, Y. Reversion and analysis on cyanobacteria bloom in Waihai of Lake Dianchi. Acta Ecol. Sinica 2012, 32, 56–63. [Google Scholar] [CrossRef]
- Strong, A.E. Remote sensing of algal blooms by aircraft and satellite in Lake Erie and Utah Lake. Remote Sens. Environ. 1974, 3, 99–107. [Google Scholar] [CrossRef]
- Richardson, L.L. Remote sensing of algal bloom dynamics. Bioscience 1996, 46, 492–501. [Google Scholar] [CrossRef]
- Vincent, R.K.; Qin, X.M.; McKay, R.M.L.; Miner, J.; Czajkowski, K.; Savino, J.; Bridgeman, T. Phycocyanin detection from LANDSAT TM data for mapping cyanobacterial blooms in Lake Erie. Remote Sens. Environ. 2004, 89, 381–392. [Google Scholar] [CrossRef]
- Hu, C.M.; Muller-Karger, F.E.; Taylor, C.; Carder, K.L.; Kelble, C.; Johns, E.; Heil, C.A. Red tide detection and tracing using MODIS fluorescence data: A regional example in SW Florida coastal waters. Remote Sens. Environ. 2005, 97, 311–321. [Google Scholar] [CrossRef]
- Kutser, T.; Metsamaa, L.; Strombeck, N.; Vahtmae, E. Monitoring cyanobacterial blooms by satellite remote sensing. Estuar. Coast. Shelf Sci. 2006, 67, 303–312. [Google Scholar] [CrossRef]
- Wynne, T.; Stumpf, R.; Tomlinson, M.; Warner, R.; Tester, P.; Dyble, J.; Fahnenstiel, G. Relating spectral shape to cyanobacterial blooms in the Laurentian Great Lakes. Int. J. Remote Sens. 2008, 29, 3665–3672. [Google Scholar] [CrossRef]
- Hu, C. A novel ocean color index to detect floating algae in the global oceans. Remote Sens. Environ. 2009, 113, 2118–2129. [Google Scholar] [CrossRef]
- Kutser, T. Quantitative detection of chlorophyll in cyanobacterial blooms by satellite remote sensing. Limnol. Oceanogr. 2004, 49, 2179–2189. [Google Scholar] [CrossRef]
- Hu, L.; Gan, S.; Yuan, X.; Li, R.; Bi, R. Study on the spatial distribution characteristics of cyanobacteria bloom in Dianchi Lake based on GF-5. Laser Infrared 2021, 51, 237–243. [Google Scholar]
- Zhu, L.; Wu, C.; Ya, Y.; Zhang, Y.; IEEE. Spatial and temporal distribution variation and meteorological factors analyzing of algal blooms based on HJ-1 satellites in Lake Dianchi, China, 2009. In Proceedings of the IEEE International Geoscience and Remote Sensing Symposium, Honolulu, HI, USA, 25–30 June 2010; pp. 2769–2772. [Google Scholar]
- Zhao, D.; Li, J.; Hu, R.; Shen, Q.; Zhang, F. Landsat-satellite-based analysis of spatial-temporal dynamics and drivers of CyanoHABs in the plateau Lake Dianchi. Int. J. Remote Sens. 2018, 39, 8552–8571. [Google Scholar] [CrossRef]
- Feng, L.; Dai, Y.; Hou, X.; Xu, Y.; Liu, J.; Zheng, C. Concerns about phytoplankton bloom trends in global lakes. Nature 2021, 590, E35–E47. [Google Scholar] [CrossRef]
- Zhang, T.; Zeng, W.H.; Wang, S.R.; Ni, Z.K. Temporal and spatial changes of water quality and management strategies of Dianchi Lake in southwest China. Hydrol. Earth Syst. Sci. 2014, 18, 1493–1502. [Google Scholar] [CrossRef]
- Luo, Y.; Yang, K.; Yu, Z.; Chen, J.; Xu, Y.; Zhou, X.; Yang, Y. Dynamic monitoring and prediction of Dianchi Lake cyanobacteria outbreaks in the context of rapid urbanization. Environ. Sci. Pollut. Res. 2017, 24, 5335–5348. [Google Scholar] [CrossRef] [PubMed]
- Mu, M.; Wu, C.; Li, Y.; Lyu, H.; Fang, S.; Yan, X.; Liu, G.; Zheng, Z.; Du, C.; Bi, S. Long-term observation of cyanobacteria blooms using multi-source satellite images: A case study on a cloudy and rainy lake. Environ. Sci. Pollut. Res. 2019, 26, 11012–11028. [Google Scholar] [CrossRef]
- Huang, C.; Wang, X.; Yang, H.; Li, Y.; Wang, Y.; Chen, X.; Xu, L. Satellite data regarding the eutrophication response to human activities in the plateau lake Dianchi in China from 1974 to 2009. Sci. Total Environ. 2014, 485–486, 1–11. [Google Scholar] [CrossRef] [PubMed]
- Ma, J.; Duan, H.; He, L.; Tiffany, M.; Cao, Z.; Qi, T.; Shen, M.; Biggs, T.; Xu, X. Spatiotemporal pattern of gypsum blooms in the Salton Sea, California, during 2000-2018. Int. J. Appl. Earth Obs. Geoinf. 2020, 89, 102090. [Google Scholar] [CrossRef]
- Wang, M.; Shi, W. Cloud Masking for Ocean Color Data Processing in the Coastal Regions. IEEE Trans. Geosci. Remote Sens. 2006, 44, 3105–3196. [Google Scholar] [CrossRef]
- Hu, C.; Lee, Z.; Ma, R.; Yu, K.; Li, D.; Shang, S. Moderate Resolution Imaging Spectroradiometer (MODIS) observations of cyanobacteria blooms in Taihu Lake, China. J. Geophys. Res. 2010, 115, C04002. [Google Scholar] [CrossRef]
- Zhang, Y.; Ma, R.; Duan, H.; Loiselle, S.A.; Xu, J.; Ma, M. A Novel Algorithm to Estimate Algal Bloom Coverage to Subpixel Resolution in Lake Taihu. IEEE J. Sel. Top. Appl. Earth Obs. Remote Sens. 2014, 7, 3060–3068. [Google Scholar] [CrossRef]
- Chen, X.; Shang, S.; Lee, Z.; Qi, L.; Yan, J.; Li, Y. High-frequency observation of floating algae from AHI on Himawari-8. Remote Sens. Environ. 2019, 227, 151–161. [Google Scholar] [CrossRef]
- Feng, L.; Hu, C.; Chen, X.; Cai, X.; Tian, L.; Gan, W. Assessment of inundation changes of Poyang Lake using MODIS observations between 2000 and 2010. Remote Sens. Environ. 2012, 121, 80–92. [Google Scholar] [CrossRef]
- Duan, H.; Cao, Z.; Shen, M.; Liu, D.; Xiao, Q. Detection of illicit sand mining and the associated environmental effects in China’s fourth largest freshwater lake using daytime and nighttime satellite images. Sci. Total Environ. 2019, 647, 606–618. [Google Scholar] [CrossRef] [PubMed]
- Ho, J.; Michalak, A.; Pahlevan, N. Widespread global increase in intense lake phytoplankton blooms since the 1980s. Nature 2019, 574, 667–670. [Google Scholar] [CrossRef] [PubMed]
- Binding, C.E.; Pizzolato, L.; Zeng, C. EOLakeWatch; delivering a comprehensive suite of remote sensing algal bloom indices for enhanced monitoring of Canadian eutrophic lakes. Ecol. Indic. 2021, 121, 106999. [Google Scholar] [CrossRef]
- Wang, M.; Hu, C.; Cannizzaro, J.; English, D.; Han, X.; Naar, D.; Lapointe, B.; Brewton, R.; Hernandez, F. Remote Sensing of Sargassum Biomass, Nutrients, and Pigments. Geophys. Res. Lett. 2018, 45, 12359–12367. [Google Scholar] [CrossRef]
- Qi, L.; Hu, C.; Visser, P.M.; Ma, R. Diurnal changes of cyanobacteria blooms in Taihu Lake as derived from GOCI observations. Limnol. Oceanogr. 2018, 63, 1711–1726. [Google Scholar] [CrossRef]
- Cao, H.Y.; Han, L. Hourly remote sensing monitoring of harmful algal blooms (HABs) in Taihu Lake based on GOCI images. Environ. Sci. Pollut. Res. 2021, 28, 35958–35970. [Google Scholar] [CrossRef] [PubMed]
- Feng, C.; Ishizaka, J.; Saitoh, K.; Mine, T.; Zhou, Z. Detection and Tracking of Chattonella spp. and Skeletonema spp. Blooms Using Geostationary Ocean Color Imager (GOCI) in Ariake Sea, Japan. J. Geophys. Res. Ocean. 2021, 126, e2020JC016924. [Google Scholar] [CrossRef]
- Li, J.; Li, Y.; Bi, S.; Xu, J.; Guo, F.; Lyu, H.; Dong, X.; Cai, X. Utilization of GOCI data to evaluate the diurnal vertical migration of Microcystis aeruginosa and the underlying driving factors. J. Environ. Manag. 2022, 310, 114734. [Google Scholar] [CrossRef]
- Wang, M.; Hu, C. Automatic Extraction of Sargassum Features From Sentinel-2 MSI Images. IEEE Trans. Geosci. Remote Sens. 2021, 59, 2579–2597. [Google Scholar] [CrossRef]
- Wang, M.; Hu, C. Satellite remote sensing of pelagic Sargassum macroalgae: The power of high resolution and deep learning. Remote Sens. Environ. 2021, 264, 112631. [Google Scholar] [CrossRef]
- Duan, H.; Tao, M.; Loiselle, S.A.; Zhao, W.; Cao, Z.; Ma, R.; Tang, X. MODIS observations of cyanobacterial risks in a eutrophic lake: Implications for long-term safety evaluation in drinking-water source. Water Res. 2017, 122, 455–470. [Google Scholar] [CrossRef] [PubMed]
- Paerl, H.W.; Otten, T.G. Harmful cyanobacterial blooms: Causes, consequences, and controls. Microb. Ecol. 2013, 65, 995–1010. [Google Scholar] [CrossRef] [PubMed]
- Huisman, J.; Codd, G.A.; Paerl, H.W.; Ibelings, B.W.; Verspagen, J.M.H.; Visser, P.M. Cyanobacterial blooms. Nat Rev Microbiol 2018, 16, 471–483. [Google Scholar] [CrossRef] [PubMed]
- Xu, H.; Qin, B.; Paerl, H.W.; Peng, K.; Zhang, Q.; Zhu, G.; Zhang, Y. Environmental controls of harmful cyanobacterial blooms in Chinese inland waters. Harmful Algae 2021, 110, 102127. [Google Scholar] [CrossRef] [PubMed]
- Paerl, H.W.; Huisman, J. Blooms like it hot. Science 2008, 320, 57–58. [Google Scholar] [CrossRef]
- Wang, Q.; Sun, L.; Zhu, Y.; Wang, S.; Duan, C.; Yang, C.; Zhang, Y.; Liu, D.; Zhao, L.; Tang, J. Hysteresis effects of meteorological variation-induced algal blooms: A case study based on satellite-observed data from Dianchi Lake, China (1988–2020). Sci. Total Environ. 2022, 812, 152558. [Google Scholar] [CrossRef]
- Visser, P.M.; Verspagen, J.M.H.; Sandrini, G.; Stal, L.J.; Matthijs, H.C.P.; Davis, T.W.; Paerl, H.W.; Huisman, J. How rising CO2 and global warming may stimulate harmful cyanobacterial blooms. Harmful Algae 2016, 54, 145–159. [Google Scholar] [CrossRef]
- Qin, B.Q.; Deng, J.M.; Shi, K.; Wang, J.; Brookes, J.; Zhou, J.; Zhang, Y.L.; Zhu, G.W.; Paerl, H.W.; Wu, L. Extreme Climate Anomalies Enhancing Cyanobacterial Blooms in Eutrophic Lake Taihu, China. Water Resour. Res. 2021, 57, 12. [Google Scholar] [CrossRef]
- Chen, J.; Wang, J.; Lv, J.; Liu, X.; Chen, J.; Li, N. Common fate of sister lakes in Hulunbuir Grassland: Long-term harmful algal bloom crisis from multi-source remote sensing insights. J. Hydrol. 2021, 594, 125970. [Google Scholar] [CrossRef]
- Fang, C.; Song, K.; Paerl, H.W.; Jacinthe, P.-A.; Wen, Z.; Liu, G.; Tao, H.; Xu, X.; Kutser, T.; Wang, Z.; et al. Global divergent trends of algal blooms detected by satellite during 1982–2018. Glob. Change Biol. 2022, 28, 2327–2340. [Google Scholar] [CrossRef]
- Song, K.; Fang, C.; Jacinthe, P.-A.; Wen, Z.; Liu, G.; Xu, X.; Shang, Y.; Lyu, L. Climatic versus Anthropogenic Controls of Decadal Trends (1983–2017) in Algal Blooms in Lakes and Reservoirs across China. Environ. Sci. Technol. 2021, 55, 2929–2938. [Google Scholar] [CrossRef] [PubMed]
- Zhang, Y.; Ma, R.; Zhang, M.; Duan, H.; Loiselle, S.; Xu, J. Fourteen-Year Record (2000–2013) of the Spatial and Temporal Dynamics of Floating Algae Blooms in Lake Chaohu, Observed from Time Series of MODIS Images. Remote Sens. 2015, 7, 10523–10542. [Google Scholar] [CrossRef]
- Kubryakov, A.A.; Lishaev, P.N.; Aleskerova, A.A.; Stanichny, S.V.; Medvedeva, A.A. Spatial distribution and interannual variability of cyanobacteria blooms on the North-Western shelf of the Black Sea in 1985-2019 from satellite data. Harmful Algae 2021, 110, 102128. [Google Scholar] [CrossRef]
- Zhang, Y.; Ma, R.; Duan, H.; Loiselle, S.; Xu, J. Satellite analysis to identify changes and drivers of CyanoHABs dynamics in Lake Taihu. Water Sci. Technol. -Water Supply 2016, 16, 1451–1466. [Google Scholar] [CrossRef]
- Xu, H.; Paerl, H.W.; Qin, B.; Zhu, G.; Gaoa, G. Nitrogen and phosphorus inputs control phytoplankton growth in eutrophic Lake Taihu, China. Limnol. Oceanogr. 2010, 55, 420–432. [Google Scholar] [CrossRef]
- Paerl, H.W.; Hall, N.S.; Calandrino, E.S. Controlling harmful cyanobacterial blooms in a world experiencing anthropogenic and climatic-induced change. Sci. Total Environ. 2011, 409, 1739–1745. [Google Scholar] [CrossRef]
- Paerl, H.W.; Scott, J.T. Throwing Fuel on the Fire: Synergistic Effects of Excessive Nitrogen Inputs and Global Warming on Harmful Algal Blooms. Environ. Sci. Technol. 2010, 44, 7756–7758. [Google Scholar] [CrossRef]
- Qin, B.; Yang, G.; Ma, J.; Wu, T.; Li, W.; Liu, L.; Deng, J.; Zhou, J. Spatiotemporal Changes of Cyanobacterial Bloom in Large Shallow Eutrophic Lake Taihu, China. Front. Microbiol. 2018, 9, 451. [Google Scholar] [CrossRef]
- Qin, B.; Paerl, H.W.; Brookes, J.D.; Liu, J.; Jeppesen, E.; Zhu, G.; Zhang, Y.; Xu, H.; Shi, K.; Deng, J. Why Lake Taihu continues to be plagued with cyanobacterial blooms through 10 years (2007–2017) efforts. Sci. Bull. 2019, 64, 354–356. [Google Scholar] [CrossRef]
- Yan, K.; Yuan, Z.; Goldberg, S.; Gao, W.; Ostermann, A.; Xu, J.; Zhang, F.; Elser, J. Phosphorus mitigation remains critical in water protection: A review and meta-analysis from one of China’s most eutrophicated lakes. Sci. Total Environ. 2019, 689, 1336–1347. [Google Scholar] [CrossRef]
- Tilman, D.; Kilham, S.S.; Kilham, P. Phytoplankton community ecology—The role of limiting nutrients. Annu. Rev. Ecol. Syst. 1982, 13, 349–372. [Google Scholar] [CrossRef]
- Yang, S.; Chen, X.; Lu, J.; Hou, X.; Li, W.; Xu, Q. Impacts of agricultural topdressing practices on cyanobacterial bloom phenology in an early eutrophic plateau Lake, China. J. Hydrol. 2021, 594, 125952. [Google Scholar] [CrossRef]
- Smith, V.H. Low nitrogen to phosphorus ratios favor dominance by blue-green algae in lake phytoplankton. Science 1983, 221, 669–671. [Google Scholar] [CrossRef] [PubMed]


| Mean | Minimum | Maximum | Median | |
|---|---|---|---|---|
| Water Temperature (°C) | 17.96 | 7.20 | 28.70 | 18.00 |
| pH | 8.82 | 6.27 | 9.95 | 8.75 |
| NH3-N (mg/L) | 0.26 | 0.03 | 1.32 | 0.27 |
| TP (mg/L) | 0.16 | 0.03 | 3.28 | 0.16 |
| TN (mg/L) | 1.86 | 0.40 | 6.46 | 2.04 |
| TN/TP ratio (mass) | 16.46 | 4.31 | 59.35 | 13.16 |
| Precipitation (mm) | 81.68 | 0.00 | 474.90 | 45.50 |
| Air Pressure (hPa) | 810.60 | 805.30 | 816.50 | 810.27 |
| Wind Speed (m/s) | 2.15 | 0.80 | 4.40 | 2.10 |
| Air Temperature (°C) | 15.59 | 5.60 | 21.90 | 16.65 |
| Sunshine Hours (h) | 180.45 | 44.50 | 322.00 | 44.50 |
| WS | AT | ATmax | ATmin | PP | SH | AP | ||
|---|---|---|---|---|---|---|---|---|
| Initial Bloom Time | r | 0.39 | −0.21 | 0.09 | −0.14 | −0.11 | −0.19 | −0.27 |
| Duration of Bloom | r | −0.50 * | −0.01 | −0.25 | 0.04 | 0.36 | 0.03 | 0.25 |
| Bloom Area | r | 0.25 | 0.36 * | 0.38 * | 0.39 * | 0.03 | 0.26 | −0.28 |
| WT | pH | NH3-N | TN | TP | TN/TP | ||
|---|---|---|---|---|---|---|---|
| Initial Bloom Time | r | −0.07 | −0.12 | 0.04 | 0.22 | 0.06 | 0.05 |
| Duration of Bloom | r | 0.04 | −0.29 | −0.17 | −0.31 | −0.12 | 0.00 |
| Bloom Area | r | 0.32 | 0.19 | 0.21 | 0.16 | −0.02 | 0.39 |
Publisher’s Note: MDPI stays neutral with regard to jurisdictional claims in published maps and institutional affiliations. |
© 2022 by the authors. Licensee MDPI, Basel, Switzerland. This article is an open access article distributed under the terms and conditions of the Creative Commons Attribution (CC BY) license (https://creativecommons.org/licenses/by/4.0/).
Share and Cite
Ma, J.; He, F.; Qi, T.; Sun, Z.; Shen, M.; Cao, Z.; Meng, D.; Duan, H.; Luo, J. Thirty-Four-Year Record (1987–2021) of the Spatiotemporal Dynamics of Algal Blooms in Lake Dianchi from Multi-Source Remote Sensing Insights. Remote Sens. 2022, 14, 4000. https://doi.org/10.3390/rs14164000
Ma J, He F, Qi T, Sun Z, Shen M, Cao Z, Meng D, Duan H, Luo J. Thirty-Four-Year Record (1987–2021) of the Spatiotemporal Dynamics of Algal Blooms in Lake Dianchi from Multi-Source Remote Sensing Insights. Remote Sensing. 2022; 14(16):4000. https://doi.org/10.3390/rs14164000
Chicago/Turabian StyleMa, Jinge, Feng He, Tianci Qi, Zhe Sun, Ming Shen, Zhigang Cao, Di Meng, Hongtao Duan, and Juhua Luo. 2022. "Thirty-Four-Year Record (1987–2021) of the Spatiotemporal Dynamics of Algal Blooms in Lake Dianchi from Multi-Source Remote Sensing Insights" Remote Sensing 14, no. 16: 4000. https://doi.org/10.3390/rs14164000