
Progress and Monitoring Opportunities of Skid Resistance in Road Transport: A Critical Review and Road Sensors

 ,
,  , , , , and
Abstract
:
1. Introduction of Skid Resistance
1.1. Background
1.2. Objectives
- The state of the art in terms of skid resistance, particularly the concept of minimum thresholds, is elaborated.
- Factors influencing skid resistance are classified, and environmental conditions are also explored.
- New skid resistance measurement techniques are illustrated, with consideration of new challenges and methodologies related to contactless and semi-contactless techniques.
- Current methodologies, European research projects, and new advances in data analysis and interoperability are discussed.
1.3. Review Methodology
- Numerous studies are considered in relation to skid resistance methodologies (see reference list).
- This review research paper covers more than 80 years, between 1939 and 2021, and considers more than 80 papers (see Figure 2), in which updates to skid resistance test methods are elaborated upon.
- Key words are used to search for papers (skid resistance methodologies, skid resistance models, new trends in skid resistance, current challenges in skid resistance, factors affecting skid resistance, and road-based sensors) in different databases such as Scopus, Science direct and Web of Science in order to select relevant papers.
- Selected papers are based on different criteria (see Figure 1).
- Factors affecting skid resistance, the concept of skid resistance thresholds, and skid resistance requirements are listed.
- New European research project results are included, which are related to infrastructure assessment and, in particular, to the challenges related to skid resistance on surface pavements.
- New trends and future directions are also given.
2. Factors Influencing Skid Resistance
2.1. Category A: Pavement Surface Characteristics
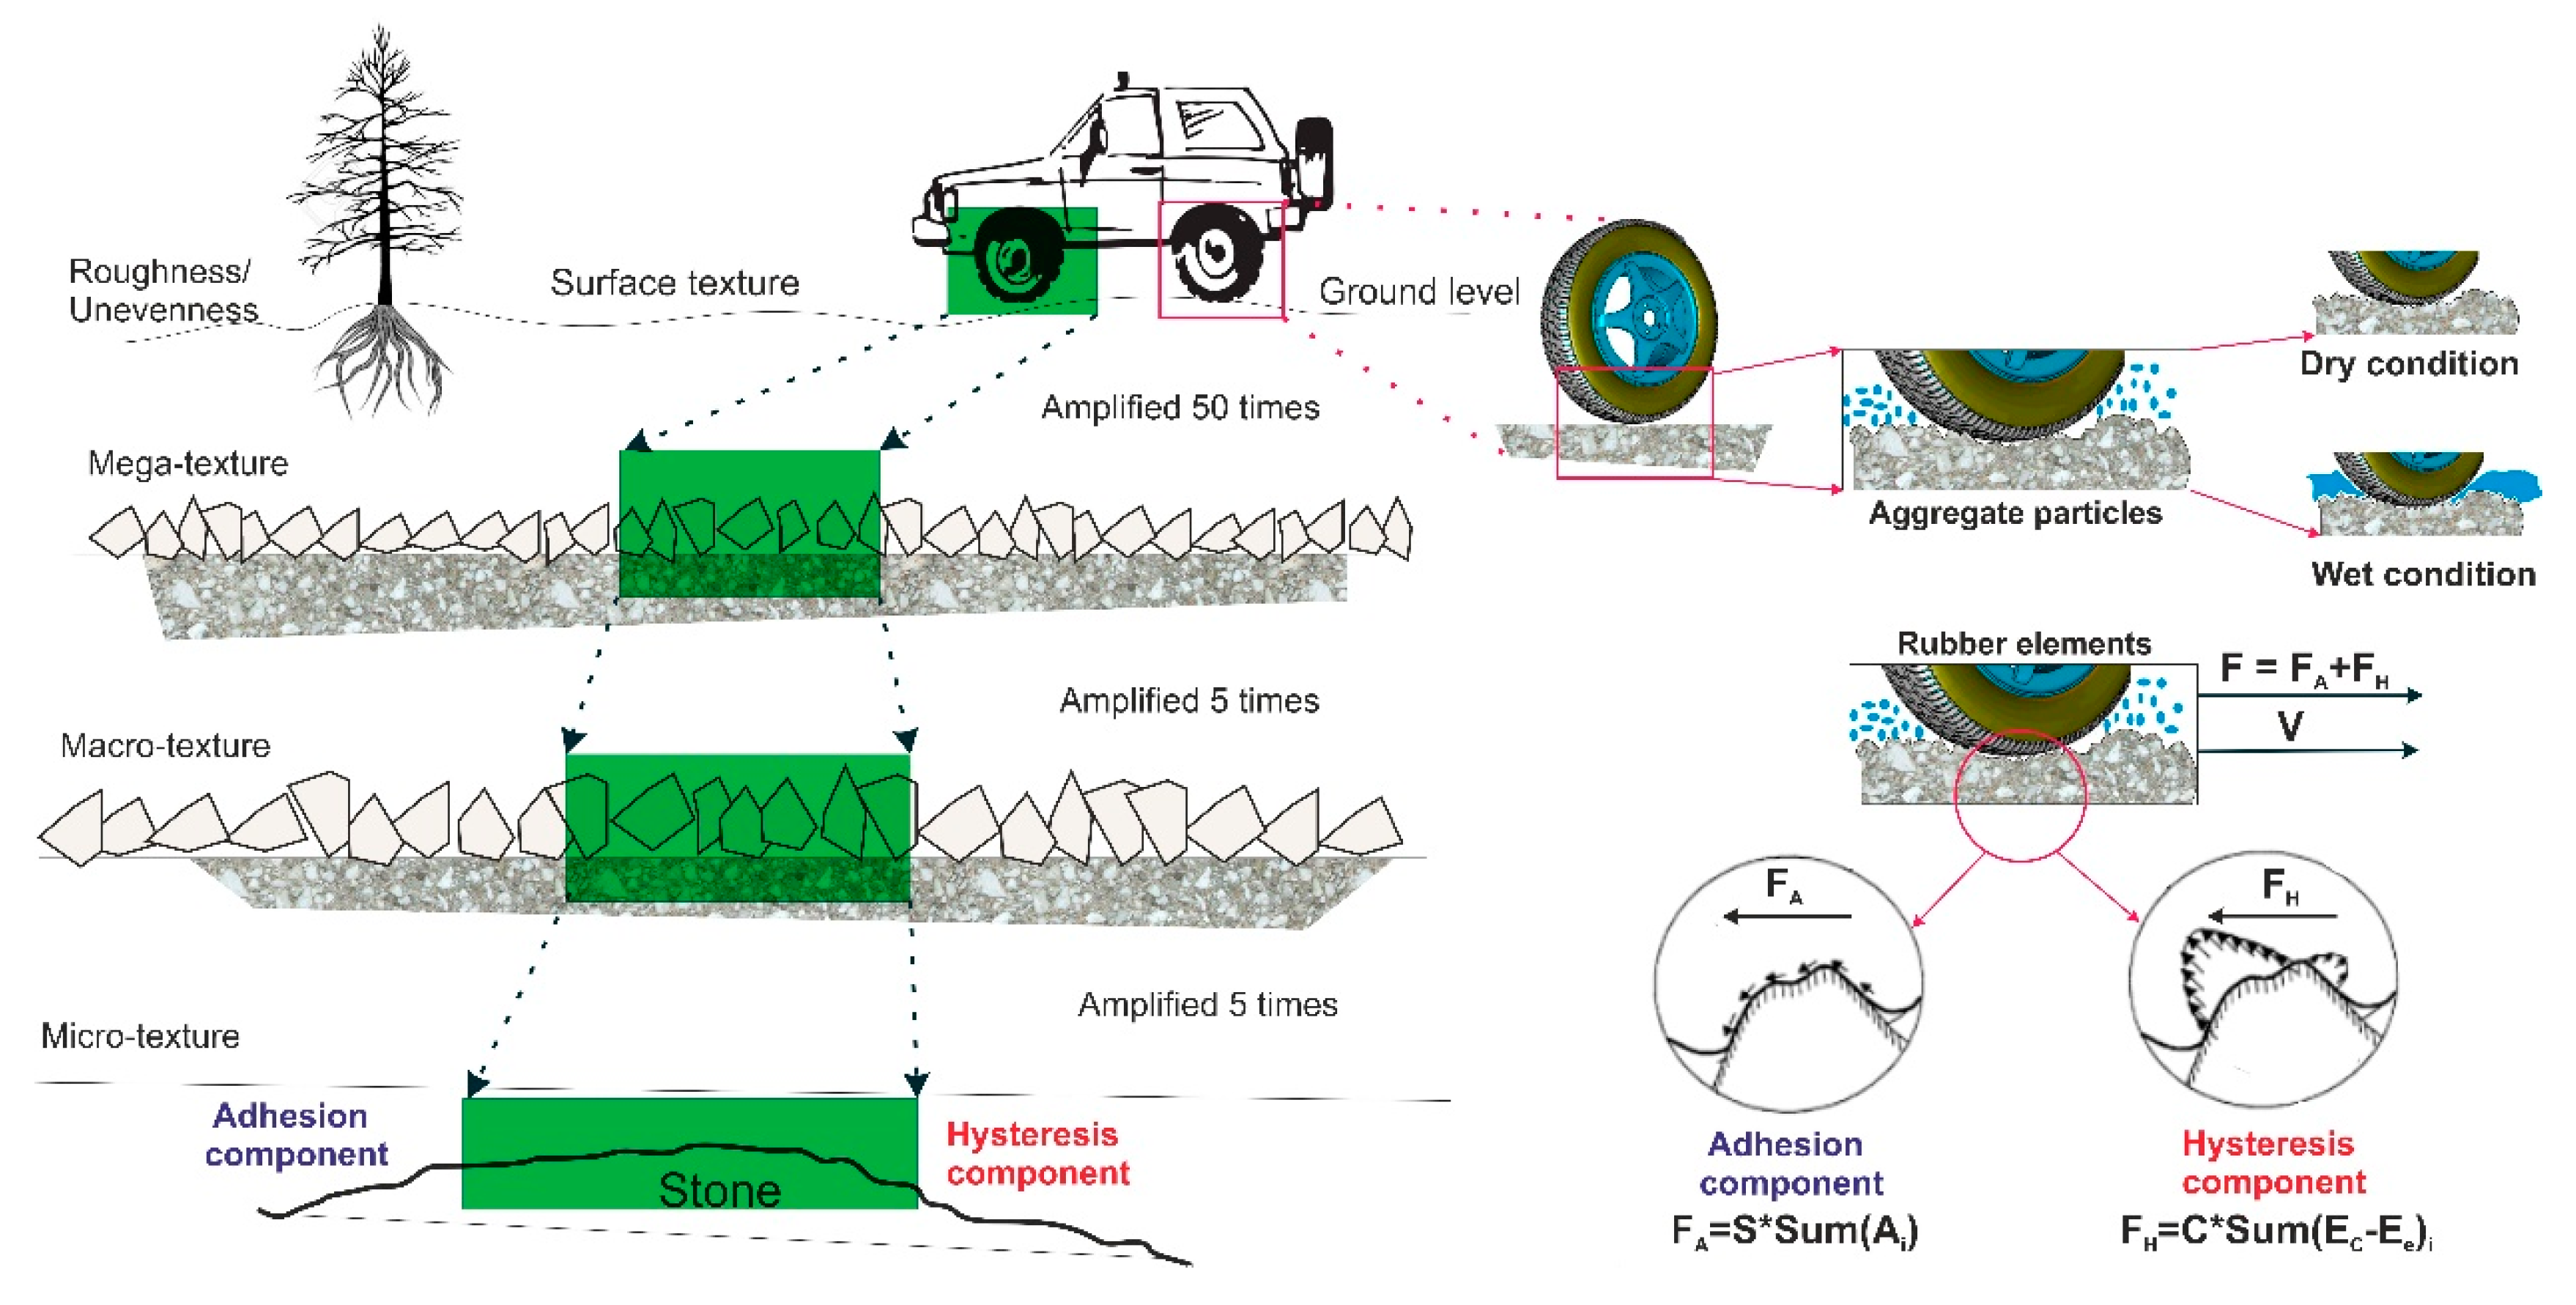
- Microtexture is a fine-scale texture characteristic that is based on the surface properties of the asphalt mix, which include its size and shape, as well as the gradient of the aggregate, and on the asphalt/bitumen materials used to generate molecular adhesion (see Figure 4). The microtexture depends on the roughness of the aggregate surface [27,28]. It is considered to be one of the main features that can affect the skid resistance on the pavement surface. The level of texture of the microtexture is assumed according to its wavelength (0 < λ < 0.5) (measured in mm) and its amplitude (0.001 < A < 0.5) [6].
- Macrotexture is a larger (coarse) scale texture characteristic, which is based on the existence of voids between aggregate particles and takes into account the larger size, shape, and gradient of the coarse aggregate in the asphalt mix. The macrotexture is the main characteristic that produces a loss of hysteresis (see Figure 4). Water can escape from channels at the macrotexture level of the surface pavement, thus decreasing hydroplaning. This texture level is assessed according to its wavelength (0.5 < λ < 50) (measured in mm) and its amplitude (0.1 < A <20) [12,26].
- Megatexture is a texture that corresponds to the irregularities (e.g., distress, defects, or waviness) associated with rutting, potholes, patching, surface stone loss, and major joints and cracks in the road surface [27,28,29]. The megatexture influences the noise level and the rolling resistance more than the skid resistance of the road pavements. The texture level considered in this category is (50 < λ < 500) and (1 < A <50) in terms of wavelength and amplitude, respectively [12,29].
- Roughness (unevenness) is a larger texture than the megatexture, and it can also influence the rolling resistance as well as the driving quality and the operation costs of the vehicles. Computing the overall measure of the surface pavement condition is usually based on the International Roughness Index (IRI). This texture level is (λ > 500) for wavelength and (1 < A < 200) for amplitude [27,28]
2.2. Category B: Traffic Conditions
2.3. Category C: Vehicle Operation Conditions
2.4. Category D: Road Users Behaviour
2.5. Category E: Tire Properties
2.6. Category F: Environmental Conditions
2.6.1. Impact of Temperature
2.6.2. Impact of Rainfall
2.6.3. Impact of Snow and Ice/Freezing Conditions
2.6.4. Impact of Contamination
2.6.5. Impact of Wind
3. Skid Resistance Measurement Requirements and Methodologies
3.1. Skid Resistance Methodologies
- Set up a reliable skid resistance policy and set of guidelines across Europe and worldwide;
- Standardize feasible thresholds for traffic management procedures;
- Establish measurement techniques and parameters;
- Develop a common scale;
- Implement the developed techniques;
- Compare the results with other sensor-based and non-destructive techniques;
- Validate the results with other possible simulations, as well as with data analysis and machine learning;
- Conduct real-time monitoring through the application of novel technologies such as Building Information Modelling (BIM).
- Field techniques to measure in-situ skid resistance;
- Laboratory tests based on samples taken from the site or designed for research purposes;
- New technology-based techniques, namely contactless sensors to collect data covering various aspects, from surface pavements to environmental conditions, which can be used in large-scale laboratory experiments or directly in field-based case studies.
3.2. Concept of the Skid Resistance Threshold Approaches
- The investigatory level is the level of the skid resistance threshold, according to which authorities and road pavement system owners have to take action in order to monitor the skid resistance and accident rates of highways for the purpose of furthering plans related to necessary preventive or/and maintenance work related to roadway systems.
- The intervention level is the level at which skid resistance is low due to various factors that influence the road pavement system; at this level, urgent action (e.g., maintenance, restoration, and rehabilitation processes) is strongly recommended to be taken by roadway authorities and owners to provide safe driving conditions for road users. If needed, an important action such as provisionally closing a specific section of highway for a certain period is essential to prevent high accident rates during wet conditions, since an urgent restoration process is required.
3.3. Current Skid Resistance Thresholds
4. New Trends and Future Research
4.1. Challenges in the Skid Resistance Data Analysis and Interpretability
- Since the 1990s, Artificial Neural Network approaches (ANN) have been widely applied with machine learning algorithms for maintenance prediction problems including those related to the condition or life expectancy of transport infrastructure assessments (particularly in road pavements). In traditional ANNs, not only are the selection of training algorithms and optimal model architectures challenging; they are also time-consuming training processes and the instability of skid resistance models, in terms of local minimum points, limits the performance of the models and/or their validation [92].
- Numerical modeling (e.g., the finite-difference time-domain method (FDTD)) of various parameters involved in the skid resistance of the surface pavements is essential in two contexts: (a) The design of possible surface pavements and the further understanding of skid resistance before any experimental sample designs or sample scans are produced. (b) Simulated data or synthetic data can be a significant tool to support the validation of the results from laboratory or field case studies. Numerical modeling can be also used as a complementary methodology for integration with analytical approaches in order to advance the existing knowledge on skid resistance [15,16,17,18,19].
- Application of Building Information Modelling (BIM) [93]: results from processed analytical models or sensors could be integrated with BIM models (e.g., IFC models, 3D Spatial models, or integrated approaches) to provide real-time monitoring of skid resistance, to ensure a reliable decision-making tool for skid resistance of the surface pavement, and to support traffic management procedures.
- To overcome the current challenges, a rapid inspection approach is strongly recommended to provide reliable action requirements for repairs, maintenance, and traffic management procedures. Augmented Reality (AR) [94] can be an efficient approach to provide on-site 3D real monitoring of dynamic roadway system environments.
- Most studies focus on highway roads and interstate highways for skid resistance assessment, and there are a few studies on rural roadways. Henceforward, the accuracy and precise prediction of the skid resistance in roadways is still a challenge [95,96,97]. Further studies are essential to overcome Road Infrastructure (RI) assessment challenges with new methodologies and approaches.
4.2. PANOPTIS Project and Current Developments
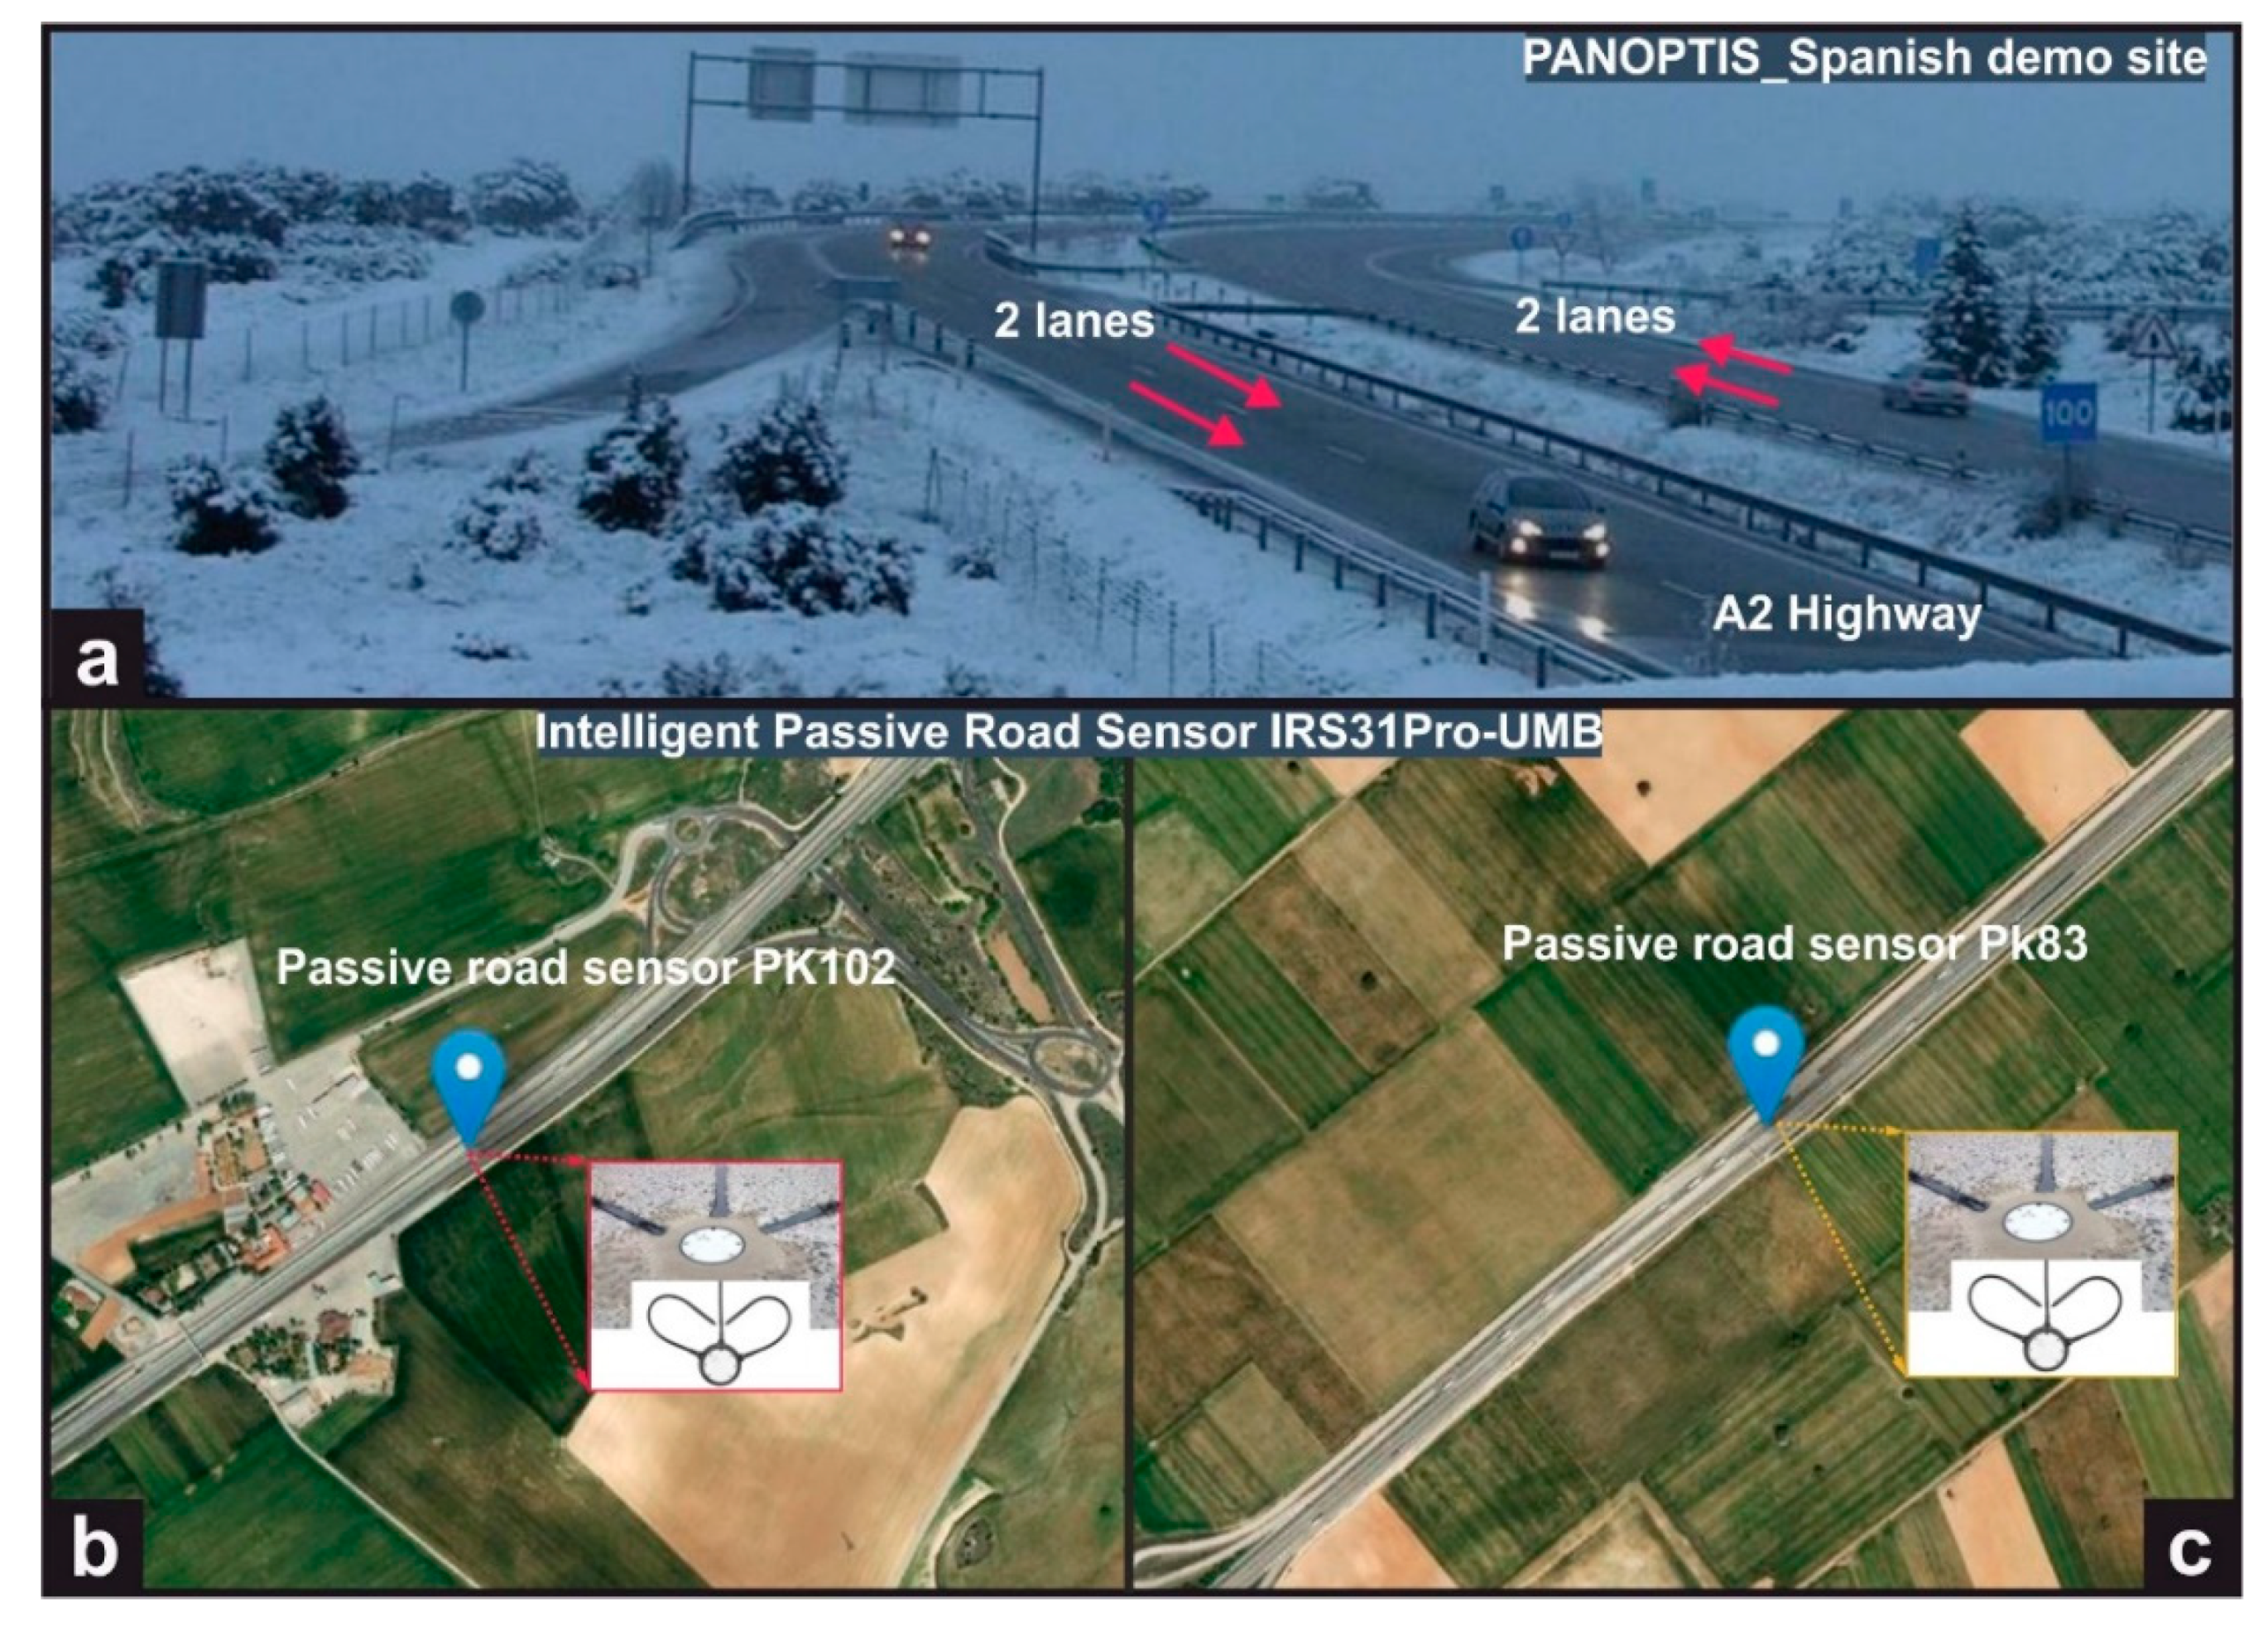
- The first stage of the project is data collection by two main road sensors, namely MARWIS (the Mobile Advanced Road Weather Information Sensor), based on the macrotexture of the surface pavements, and the IRS31Pro-UMB Intelligent Passive Road Sensor, based on the ice percentages of climate changes on the surfaces of pavements, which consists of two passive sensors in different sections: PK83 and PK103 (see Figure 4). This project is implemented on a demo case study section of the Spanish A2 Highway that connects two major cities in Spain, which is the public highway between Madrid with Barcelona. Operation and maintenance are managed by the Concessions Division of the ACCIONA. The Spanish site is selected due to the potential influence of the weather at this location, which can cause severe infrastructure damage, such as damage to bridges. The highway length is about 77.5 km; it is located in the province of Guadalajara, consists of four lanes (two per traffic direction), and crosses a Continental–Mediterranean climate region with long, severe winters, and dry, hot summers [96] (see Figure 5). Climate Change is based on an increase in the maximum temperature in summer (~5 °C by the end of the century) and a decrease in minimum temperature in winter (~3 °C by the end of the century).
- The second stage of the project is to develop an advanced tool to monitor the changes and skid resistance of the surface pavement of roads, which is mainly affected by weather conditions such as water content on the road surface due to rainfall, ice, and also seasonal changes in the temperature. Thus, these conditions can influence the traffic management procedures through the standardization or establishment of a robust analysis of the skid resistance thresholds against other parameters of the traffic system to minimize accident rates, or/and increase safe driving task for road users.
4.3. TYROSAFE Project
5. Discussions and Conclusions
- The current state-of-the-art in skid resistance measurements techniques is illustrated while highlighting new sensor-based methodologies.
- A list of factors that influence the skid resistance of the surface pavement is given. More particularly, the effect of the environmental conditions such as rainfall, snow, ice, contamination, temperature, and wind are elaborated upon.
- Skid resistance requirements and the concept of the standardization, minimum acceptable levels, thresholds, and necessary action are discussed.
- New trends in methodologies and data treatment, and new challenges, are elaborated upon.
- Current research projects are considered, which are related to tasks that deal with the skid resistance of pavement surfaces and traffic management procedures.
- Better choices of pavement mixtures;
- The development of new pavement mixtures;
- An appropriate link between factors (such as tires or environmental conditions) and skid resistance;
- Better traffic management: speed limits, distances between vehicles, interdiction of vehicles;
- Better road management (maintenance, repair of surfaces, and improvement of coating methods);
- Better road usage (de-icing salt, optimization of sustainable environmental solution).
Author Contributions
Funding
Institutional Review Board Statement
Informed Consent Statement
Acknowledgments
Conflicts of Interest
References
- AASHTO. Pavement Management Guide, 2nd ed.; AASHTO: Washington, DC, USA, 2012. [Google Scholar]
- Li, Q.J.; Zhan, Y.; Yang, G.; Wang, K.C.P. Pavement skid resistance as a function of pavement surface and aggregate texture properties. Int. J. Pavement Eng. 2020, 21, 1159–1169. [Google Scholar] [CrossRef]
- Najafi, S.; Flintsch, G.W.; Khaleghian, S. Pavement friction management–artificial neural network approach. Int. J. Pavement Eng. 2019, 20, 125–135. [Google Scholar] [CrossRef]
- Zhenning, L.; Yusheng, C.; Cong, C.; Guohui, Z.; Qiong, W.; Qian, Z.S.; Prevedouros, P.D.; Ma, D.T. Investigation of driver injury severities in rural single-vehicle crashes under rain conditions using mixed logit and latent class models. Accid. Anal. Prev. 2019, 124, 219–229. [Google Scholar] [CrossRef]
- Åström, H.; Wallman, C.-G. Friction Measurement Methods and the Correlation between Road Friction and Traffic Safety. A Literature Review; Swedish National Rode and Transport Research Institute: Linköping, Sweden, 2001; p. 47.
- Ahammed, M.A.; Tighe, S.L. Asphalt pavements surface texture and skid resistance-Exploring the reality. Can. J. Civ. Eng. 2012, 39, 1–9. [Google Scholar] [CrossRef]
- Snyder, M.B. Pavement Surface Characteristics a Synthesis and Guide; Skokie, A., Ed.; American Concrete Pavement Association: Skokie, IL, USA, 2006. [Google Scholar]
- Araujo, V.M.C.; Bessa, I.S.; Castelo Branco, V.T.F. Measuring skid resistance of hot mix asphalt using the aggregate image measurement system (AIMS). Constr. Build. Mater. 2015, 98, 476–481. [Google Scholar] [CrossRef]
- Eurostat, 2018. Available online: https://ec.europa.eu/eurostat/statistics-explained/index.php?title=Road_accident_fatalities_-_statistics_by_type_of_vehicle (accessed on 9 September 2021).
- Ivan, J.N.; Ravishanker, N.; Jackson, E.; Aronov, B.; Guo, S. A Statistical Analysis of the Effect of Wet-Pavement Friction on Highway Traffic Safety. J. Transp. Saf. Secur. 2012, 4, 116–136. [Google Scholar] [CrossRef]
- McGovern, C.; Rusch, P.; Noyce, D.A. State Practices to Reduce Wet Weather Skidding Crashes. U.S. Department of Transportation. 2011. Available online: https://rosap.ntl.bts.gov/view/dot/49268 (accessed on 9 September 2021).
- Pérez-Acebo, H.; Gonzalo-Orden, H.; Findley, D.J.; Rojí, E. A skid resistance prediction model for an entire road network. Constr. Build. Mater. 2020, 262, 120041. [Google Scholar] [CrossRef]
- Highway Research Board. Skid Resistance. National Cooperative Highway Research Program. Synthesis of Highway Practice 14; Highway Research Board, National Academy of Sciences: Washington, DC, USA, 1972. [Google Scholar]
- Peng, Y.; Li, J.Q.; Zhan, Y.; Wang, K.C.; Yang, G. Finite Element Method-Based Skid Resistance Simulation Using In-Situ 3D Pavement Surface Texture and Friction Data. Materials 2019, 12, 3821. [Google Scholar] [CrossRef] [Green Version]
- Rasol, M.A.; Pérez-Gracia, V.; Fernandes, F.M.; Pais, J.C.; Santos-Assunçao, S.; Santos, C.; Sossa, V. GPR laboratory tests and numerical models to characterize cracks in cement concrete specimens, exemplifying damage in rigid pavement. Measurement 2020, 158, 107662. [Google Scholar] [CrossRef]
- Marecos, V.; Solla, M.; Fontul, S.; Antunes, V. Assessing the pavement subgrade by combining different non-destructive methods. Constr. Build. Mater. 2017, 135, 76–85. [Google Scholar] [CrossRef] [Green Version]
- Rasol, M.A.; Pérez-Gracia, V.; Solla, M.; Pais, J.C.; Fernandes, F.M.; Santos, C. An experimental and numerical approach to combine Ground Penetrating Radar and computational modelling for the identification of early cracking in cement concrete pavements. NDT E Int. 2020, 115, 102293. [Google Scholar] [CrossRef]
- Rasol, M. Development of New GPR Methodologies for Soil and Cement Concrete Pavement Assessment Mezgeen Abdulrahman Rasol Rasol; Polytechnic University of Catalonia (UPC): Barcelona, Spain, 2021. [Google Scholar]
- Rasol, M.A.; Pérez-Gracia, V.; Fernandes, F.M.; Pais, J.C.; Solla, M.; Santos, C. NDT assessment of rigid pavement damages with ground penetrating radar: Laboratory and field tests. Int. J. Pavement Eng. 2020, 1–16. [Google Scholar] [CrossRef]
- Hall, J.W. Guide for Pavement Friction; The National Academies Press: Washington, DC, USA, 2009. [Google Scholar] [CrossRef] [Green Version]
- Kane, M.; Edmondson, V. Long-term skid resistance of asphalt surfacings and aggregates’ mineralogical composition: Generalisation to pavements made of different aggregate types. Wear 2020, 454, 203339. [Google Scholar] [CrossRef]
- Cairney, P.T. ARRB Transport Research. In Skid Resistance and Crashes: A Review of the Literature; ARRB Transport Research, Limited.: Melbourne, Australia, 1997. [Google Scholar]
- Rith, M.; Kim, Y.K.; Lee, S.W. Characterization of long-term skid resistance in exposed aggregate concrete pavement. Constr. Build. Mater. 2020, 256, 119423. [Google Scholar] [CrossRef]
- Pérez-Acebo, H.; Gonzalo-Orden, H.; Rojí, E. Skid resistance prediction for new two-lane roads. Proc. Inst. Civ. Eng. Transp. 2019, 172, 264–273. [Google Scholar] [CrossRef]
- Khasawneh, M.A. Laboratory Study on the Frictional Properties of HMA Specimens Using a Newly Developed Asphalt Polisher. Int. J. Civ. Eng. 2017, 15, 1007–1017. [Google Scholar] [CrossRef]
- Permanent International Association of Road Congresses (PIARC). Report of the Committee on Surface Characteristics. In Proceedings of the XVII World Road Congress, Brussels, Belgium, 13–19 September 1987. [Google Scholar]
- Jayawickrama, P.W.; Prasanna, R.; Senadheera, S.P. Survey of State Practices to Control Skid Resistance on Hot-Mix Asphalt Concrete Pavements. Transp. Res. Rec. 1996, 1536, 52–58. [Google Scholar] [CrossRef]
- Widyatmoko, D.; Kingdom, U. The importance of Road Surface Texture in Active Safety Design and The Importance of Road Surface Texture in Active Road Safety Design and Assessment. In Proceedings of the International Conference Road Safety and Simulation (RSS2013), Rome, Italy, 22–25 October 2013. [Google Scholar]
- Meegoda, J.N.; Gao, S. Evaluation of pavement skid resistance using high speed texture measurement. J. Traffic Transp. Eng. 2015, 2, 382–390. [Google Scholar] [CrossRef] [Green Version]
- Bazlamit, S.M.; Reza, F. Changes in asphalt pavement friction components and adjustment of skid number for temperature. J. Transp. Eng. 2005, 131, 470–476. [Google Scholar] [CrossRef]
- Shafii, M.A. Skid Resistance and the Effect of Temperature; Universiti Teknologi Malaysia: Skudai, Malaysia, 2009. [Google Scholar]
- Yager, T. Runway Grooving and Surface Friction Management. 2016. Available online: https://www.icao.int/NACC/Documents/Meetings/2013/ALACPA10/ALACPA10-P23.pdf (accessed on 9 September 2021).
- Wang, C.; Quddus, M.A.; Ison, S.G. The effect of traffic and road characteristics on road safety: A review and future research direction. Saf. Sci. 2013, 57, 264–275. [Google Scholar] [CrossRef]
- Katz, B.; O’Donnell, C.; Donoughe, K.; Atkinson, J.; Finley, M.; Balke, K.; Kuhn, B.; Warren, D. Variable Speed Limit Systems in Wet Weather; 2012; pp. 1–40. Available online: http://safety.fhwa.dot.gov/speedmgt/ref_mats/fhwasa12022/ (accessed on 9 September 2021).
- Öberg, G. Friction and Journey Speed on Roads with Various Winter Road Maintenance (Friktion och Reshastighet på Vägar Med Olika Vinterväghållning); VTI Rapport: Linköping, Sweeden, 1981; p. 218. [Google Scholar]
- Dhir, R.K.; Ghataora, G.S.; Lynn, C.J. A Review on Acoustic and Skid Resistance Solutions for Road Pavements. Sustain. Constr. Mater. 2017, 6, 209–223. [Google Scholar] [CrossRef]
- Bergman, W. Skid Resistance Properties of Tires and Their Influence on Vehicle Control. Transp. Res. Rec. 1976, 621, 8–18. [Google Scholar]
- Beautru, Y.; Kane, M.; Cerezo, V.; Do, M.-T. Effect of thin water film on tire/road friction. In Proceedings of the Young Researchers Seminar (YRS 2011), Copenhagen, Denmark, 8–10 June 2011. [Google Scholar]
- Tyfour, W.R. Tire Skid Resistance on Contaminated Wet Pavements. Jordan J. Mech. Ind. Eng. 2009, 3, 119–124. [Google Scholar]
- Srirangam, S.K.; Anupam, K.; Kasbergen, C.; Scarpas, A.; Cerezo, V. Study of Influence of Operating Parameters on Braking Friction and Rolling Resistance. Transp. Res. Rec. J. Transp. Res. Board 2015, 2525, 79–90. [Google Scholar] [CrossRef]
- Cesbron, J.; Anfosso-Lédée, F.; Yin, H.P.; Duhamel, D.; le Houédec, D. Influence of road texture on tyre/road contact in static conditions numerical and experimental comparison. Road Mater. Pavement Des. 2008, 9, 689–710. [Google Scholar] [CrossRef]
- Kane, M.; Cerezo, V. A contribution to tire/road friction modeling: From a simplified dynamic frictional contact model to a ‘Dynamic Friction Tester’ model. Wear 2015, 342, 163–171. [Google Scholar] [CrossRef]
- Asi, I.M. Evaluating skid resistance of different asphalt concrete mixes. Build. Environ. 2007, 42, 325–329. [Google Scholar] [CrossRef]
- Runkle, S.N.; Mahone, D.C. Variations in Skid Resistance Over Time. Part. 1. Final Report. 1980. Available online: https://books.google.fr/books/about/Variations_in_Skid_Resistance_Over_Time.html?id=jGIyg7Y367wC&redir_esc=y (accessed on 9 September 2021).
- Hill, B.J.; Henry, J.J. Surface Materials and Properties Related to Seasonal Variations in Skid Resistance. In Pavement Surface Characteristics and Materials; Hayden, C.M., Ed.; ASTM International: West Conshohocken, PA, USA, 1982; pp. 45–60. [Google Scholar]
- Jayawickrama, P.W.; Thomas, B. Correction of Field Skid Measurements for Seasonal Variations in Texas. Transp. Res. Rec. 1998, 1639, 147–154. [Google Scholar] [CrossRef]
- Khasawneh, M.A.; Liang, R.Y. Temperature effect on frictional properties of HMA at different polishing stages. Jordan J. Civ. Eng. 2012, 6, 39–53. [Google Scholar]
- van Bijsterveld, W.; del Val, M.A. Towards quantification of seasonal variations in skid resistance measurements. Road Mater. Pavement Des. 2016, 17, 477–486. [Google Scholar] [CrossRef]
- Kogbara, R.B.; Masad, E.A.; Kassem, E.; Scarpas, A.; Anupam, K. A state-of-the-art review of parameters influencing measurement and modeling of skid resistance of asphalt pavements. Constr. Build. Mater. 2016, 114, 602–617. [Google Scholar] [CrossRef]
- Ella, S.; Formagne, P.Y.; Koutsos, V.; Blackford, J.R. Investigation of rubber friction on snow for tyres. Tribol. Int. 2013, 59, 292–301. [Google Scholar] [CrossRef]
- Rødland, E.S.; Okoffo, E.D.; Rauert, C.; Heier, L.S.; Lind, O.C.; Reid, M.; Thomas, K.V.; Meland, S. Road de-icing salt: Assessment of a potential new source and pathway of microplastics particles from roads. Sci. Total Environ. 2020, 738, 139352. [Google Scholar] [CrossRef] [PubMed]
- Bowden, F.P.; Hughes, T.P. The mechanism of sliding on ice and snow. Proc. R. Soc. Lond. Ser. A Math. Phys. Sci. 1939, 172, 280–298. [Google Scholar] [CrossRef]
- Trenouth, W.R.; Gharabaghi, B.; Perera, N. Road salt application planning tool for winter de-icing operations. J. Hydrol. 2015, 524, 401–410. [Google Scholar] [CrossRef]
- Colbeck, S.C. The kinetic friction of snow. J. Glaciol. 1988, 34, 78–86. [Google Scholar] [CrossRef] [Green Version]
- Sladen, W.E.; Wolfe, S.A.; Morse, P.D. Evaluation of threshold freezing conditions for winter road construction over discontinuous permafrost peatlands, subarctic Canada. Cold Reg. Sci. Technol. 2019, 170, 102930. [Google Scholar] [CrossRef]
- Lubis, A.S.; Muis, Z.A.; Gultom, E.M. The effect of contaminant on skid resistance of pavement surface. IOP Conf. Ser. Earth Environ. Sci. 2018, 126, 012040. [Google Scholar] [CrossRef] [Green Version]
- Abaza, O.A.; Chowdhury, T.D.; Arafat, M. Comparative Analysis of Skid Resistance for Different Roadway Surface Treatments. Am. J. Eng. Appl. Sci. 2017, 10, 890–899. [Google Scholar] [CrossRef] [Green Version]
- Mataei, B.; Zakeri, H.; Zahedi, M.; Nejad, F.M. Pavement Friction and Skid Resistance Measurement Methods: A Literature Review. Open J. Civ. Eng. 2016, 6, 537–565. [Google Scholar] [CrossRef] [Green Version]
- Yu, M.; You, Z.; Wu, G.; Kong, L.; Liu, C.; Gao, J. Measurement and modeling of skid resistance of asphalt pavement: A. review. Constr. Build. Mater. 2020, 260, 119878. [Google Scholar] [CrossRef]
- Saliminejad, S.; Gharaibeh, N.G. Impact of error in pavement condition data on the output of network-level pavement management systems. Transp. Res. Rec. 2013, 2366, 110–119. [Google Scholar] [CrossRef]
- Flintsch, G.; McGhee, K.; Izeppi, E.D.L.; Najafi, S. The Little Book of Tire Pavement Friction. 2012. Available online: https://www.apps.vtti.vt.edu/1-pagers/CSTI_Flintsch/The%20Little%20Book%20of%20Tire%20Pavement%20Friction.pdf (accessed on 9 September 2021).
- Yager, T. Good Pavement Texture=Good Tire Friction. In Proceedings of the 4th International Safer Roads Conference, Cheltenham, UK, 18–21 May 2014; pp. 1–11. [Google Scholar]
- Available online: https://www.lufft.com/products/road-runway-sensors-292/marwis-umb-mobile-advanced-road-weather-information-sensor-2308/ (accessed on 9 September 2021).
- Pavemetrics. 2021. Available online: https://www.pavemetrics.com/ (accessed on 9 September 2021).
- Iwanowski, P.; Blacha, K.; Wesołowski, M. Review of modern methods for continuous friction measurement on airfield pavements. IOP Conf. Ser. Mater. Sci. Eng. 2018, 356, 012002. [Google Scholar] [CrossRef] [Green Version]
- Nitsche, P.; Stuetz, R.; Helfert, M. A simulation-based concept for assessing the effectiveness of forgiving roadside treatments. Adv. Transp. Stud. 2011, 87–98. [Google Scholar] [CrossRef]
- SARSYS-ASFT. 2021. Available online: https://www.sarsys-asft.com/t2go (accessed on 9 September 2021).
- Kouchaki, S.; Roshani, H.; Prozzi, J.A.; Garcia, N.Z.; Hernandez, J.B. Field Investigation of Relationship between Pavement Surface Texture and Friction. Transp. Res. Rec. 2018, 2672, 395–407. [Google Scholar] [CrossRef]
- Comfort, G. Runway Friction Characteristics Measurement and Aircraft Braking (RuFAB); European Aviation Safety Agency (EASA): Cologne, Germany; BMT Fleet Technology Limited.: Cologne, Germany, 2010; pp. 99–117. [Google Scholar]
- Acikgoz, T. Research to Methods for Skid Resistance Measurements; EMIB, University of Antwerp: Antwerpen, Belgium, 2016. [Google Scholar] [CrossRef]
- Georg, H. Skid resistance and durability of coated and uncoated concrete floors in dairy cattle buildings. In Proceedings of the 7th International Symposium on Cement Based Materials for a Sustainable Agriculture, Quebec City, QC, Canada, 18–21 September 2011. [Google Scholar]
- Camps-Valls, G. Machine learning in remote sensing dataprocessing. In Proceedings of the 2009 IEEE International Workshop on Machine Learning for Signal Processing, Grenoble, France, 1–4 September 2009; IEEE: Piscataway, NJ, USA, 2009. [Google Scholar] [CrossRef]
- Carmon, N.; Ben-Dor, E. Mapping asphaltic roads’ skid resistance using imaging spectroscopy. Remote Sens. 2018, 10, 430. [Google Scholar] [CrossRef] [Green Version]
- Cañas-Guerrero, I.; Mazarrón, F.R.; Pou-Merina, A.; Calleja-Perucho, C.; Suárez-Tejero, M.F. Analysis of research activity in the field ‘Engineering, Civil’ through bibliometric methods. Eng. Struct. 2013, 56, 2273–2286. [Google Scholar] [CrossRef]
- Available online: https://www.lufft.com/products/road-runway-sensors-292/intelligent-passive-road-sensor-irs31pro-umb-2306/ (accessed on 9 September 2021).
- Petitclerc, B.; Laurent, J.; Habel, R. Optimising 3D surface characteristics data collection by re-using the data for project level road design. In Proceedings of the 8th Symposium of Pavement Surface Characteristics-Vehicle to Road Connectivity, Brisbane, Australia, 2–4 May 2018; p. 12. [Google Scholar]
- Fwa, T.F. Skid resistance determination for pavement management and wet-weather road safety. Int. J. Transp. Sci. Technol. 2017, 6, 217–227. [Google Scholar] [CrossRef]
- Sandberg, U. Influence of Road Surface Texture on Traffic Characteristics Related to Environment, Economy and Safety: A State-Of-The-Art Study Regarding Measures and Measuring Methods; Swedish National Road and Transport Research Institute (VTI): Linkoping, Sweden, 1998. Available online: https://books.google.fr/books?id=7E3iSgAACAAJ (accessed on 9 September 2021).
- Chu, L.J.; Fwa, T.F. Pavement skid resistance consideration in rain-related wet-weather speed limits determination. Road Mater. Pavement Des. 2018, 19, 334–352. [Google Scholar] [CrossRef]
- Henry, J.J. Evaluation of Pavement Friction Characteristics; NCHRP, Transportation Research Board: Washignton, DC, USA, 2000. [Google Scholar]
- Slimane, A.B.; Khoudeir, M.; Brochard, J.; Do, M.T. Characterization of road microtexture by means of image analysis. Wear 2008, 264, 464–468. [Google Scholar] [CrossRef] [Green Version]
- Zhan, Y.; Li, J.Q.; Liu, C.; Wang, K.C.P.; Pittenger, D.M.; Musharraf, Z. Effect of aggregate properties on asphalt pavement friction based on random forest analysis. Constr. Build. Mater. 2021, 292, 123467. [Google Scholar] [CrossRef]
- Chu, L.J.; Fwa, T.F. A functional approach for determining skid resistance threshold state of porous pavement. Int. J. Pavement Eng. 2019, 20, 481–489. [Google Scholar] [CrossRef]
- ASTM. E274/E274M–11 Standard Test Method for Skid Resistance of Paved Surfaces Using a Full-Scale Tire; ASTM International: West Conshohocken, PA, USA, 2011. [Google Scholar]
- Larson, K.D.; Smith, R.N. Relationship between Skid Resistance Numbers Wet-Accident Locations; no. 134323; Ohio Department of Transportation, U.S. Department of Transportation Federal Highway Administartion (FHWA): Columbus, OH, USA, 2008.
- Speir, R.; Barcena, T.P.R.; Desaraju, P. Development of Friction Improvement Policies and Guidelines for the Maryland State Highway Administration; Rep. No. MD-07-SP708B4F; Maryland Department of Transporation, State Highway Adminstartion (SHA): Hanover, MD, USA, 2009.
- NZ Transport Agency. Specification for State Highway Skid Resistance Management Status of Specification Pecification and Notes Skid Resistance Esistance Measurement, Investigatory Threshold Levels Investigatory Levels: Skid Resistance; NZ Transport Agency: Waka Kotahi, New Zealand, 2013; no. Il; pp. 1–21.
- DMRB. CS 228 Skidding Resistance; Design Manual for Roads and Bridges; England Standards for Highway: London, UK, 2020. [Google Scholar]
- Zuniga-garcia, N.; Prozzi, J.A. Contribution of Micro-and Macro-Texture for Predicting Friction on Pavement Surfaces (CHPP Report-UTA#3-2016-12), 2016; p. 106. Available online: http://www.chpp.egr.msu.edu/wp-content/uploads/2018/03/CHPP-Report-UTA3-2017_Texture.pdf (accessed on 9 September 2021).
- Solla, M.; Lagüela, S.; González-Jorge, H.; Arias, P. Approach to identify cracking in asphalt pavement using GPR and infrared thermographic methods: Preliminary findings. NDT E Int. 2014, 62, 55–65. [Google Scholar] [CrossRef]
- Scuro, C.; Sciammarella, P.F.; Lamonaca, F.; Olivito, R.S.; Carni, D.L. IoT for structural health monitoring. IEEE Instrum. Meas. Mag. 2018, 21, 4–14. [Google Scholar] [CrossRef]
- Karimzadeh, A.; Shoghli, O. Predictive analytics for roadway maintenance: A review of current models, challenges, and opportunities. Civ. Eng. J. 2020, 6, 602–625. [Google Scholar] [CrossRef] [Green Version]
- Tang, F.; Ma, T.; Zhang, J.; Guan, Y.; Chen, L. Integrating three-dimensional road design and pavement structure analysis based on BIM. Autom. Constr. 2020, 113, 103152. [Google Scholar] [CrossRef]
- Fenais, A.S.; Ariaratnam, S.T.; Ayer, S.K.; Smilovsky, N. A review of augmented reality applied to underground construction. J. Inf. Technol. Constr. 2020, 25, 308–324. [Google Scholar] [CrossRef]
- Panoptis. PANOPTIS Horizon 2020 Project (Grant No. 769129). 2021. Available online: http://www.panoptis.eu/ (accessed on 9 September 2021).
- Sevilla, I.; Chrobocinski, P.; Barmpas, F.; Schmidt, F.; Kerle, N.; Kostaridis, A.; Doulamis, A.; Russotto, R. Improving Resilience of Transport Instrastructure to Climate Change and other Natural and Manmande Events Based on the Combined Use of Terrestrial and Airbone Sensors and Advanced Modelling Tools. 2018. Available online: https://hal.archives-ouvertes.fr/hal-02280917v2 (accessed on 9 September 2021).
- Vamvatsikos, D. Decision Support for Road Infrastructure Resilience: The Panoptis Perspective Modeling of Assets. In Proceedings of the 2019 Earthqauke Risk and Engineering towards a Resillient World Conference, Greenwich, UK, 9–10 September 2019; pp. 1–6. [Google Scholar]
- Ientile, S.; Schmidt, F.; Chevalier, C.; Orcesi, A.; Adelaide, L.; Nedjar, B. Road network analysis for risk and resilience assessment framework of road infrastructure systems. WIT Trans. Eng. Sci. 2020, 129, 197–206. [Google Scholar] [CrossRef]
- TYROSAFE. 2008. Available online: http://tyrosafe.fehrl.org/ (accessed on 9 September 2021).
- ROSANNE. 2010. Available online: https://rosanne-project.eu/ (accessed on 9 September 2021).


| Road Surface Characteristics | Traffic Conditions | Vehicle Operations | Road Users | Tire Properties | Environmental Conditions |
|---|---|---|---|---|---|
| 1. Microtexture | 1. Traffic load | 1. Slip speed (SP) as a function of: | 1. Lack of knowledge about skid resistance reduction | Tread design and conditions | 1. Temperature (°C) |
| 2. Macrotexture | 2. Traffic density | 1.a. Vehicle speed, V | 2. Inattention | Inflation pressure | 2. Water content; |
| 3. Material characteristics | 3. Congestion | 1.b. Slip ratio % (G) | 3. Applied conditions of road pavement due to extreme weather conditions | Rubber configuration and rigidity | 2.a. Rainfall |
| 4. Megatexture | 1.c. Braking System | 4. Stopping distance | Foot print | 2.b. Condensation | |
| 5. Roughness/ unevenness | 1.d. Vehicle age | 5. Driving manoeuvre | Tire load | 3. Snow and ice/freezing conditions | |
| 6. Geometric of pavements | 1.e. Capacity of engine | 5.a. Turning | Tire temperature | 4. Contamination | |
| 6.a. Curves | 1.f. Suspension stability | 5.b. Overtaking | 4.a. Sand/dust | ||
| 6.b. Slopes | 1.g. Vehicle load | 4.b. Salt | |||
| 7. Temperature (°C) | 1.h. Electronic stability control | 4.c. Dirt | |||
| d. Mud | |||||
| 4.e. Organic materials | |||||
| 4.f. Organic debris | |||||
| 4.g. Rubber particles | |||||
| 4.h. Wind |
| No. | Level of Texture | Wavelength, λ (mm) | Amplitude, A (mm) | Texture View |
|---|---|---|---|---|
| 1 | Micro-texture | 0 < λ < 0.5 | 0.001 < A < 0.5 |  |
| 2 | Macro-texture | 0.5 < λ < 50 | 0.1 < A <20 |  |
| 3 | Mega-texture | 50 < λ < 500 | 1 < A <50 |  |
| 4 | Roughness or unevenness | λ > 500 | 1 < A < 200 |  |
| No. | Pavement Condition | Skid Resistance | Vehicle Speed | Additional Causes or Extreme Conditions | Actions that Need to Be Taken by Road Users |
|---|---|---|---|---|---|
| 1 | Dry | High | Low | Normal dry condition |
|
| 2 | Wet | Low | High | Normal wet condition |
|
| 3 | Low | High | Tire age, or damaged tires (both wet and dry conditions) |
| |
| 4 | Low | High | Curves, steep hills, edges, and junctions (both wet and dry conditions) |
| |
| 5 | Low | High | Snow or Ice |
| |
| 7 | Low | High | Contamination |
|
| No. | Method-Operation Principles | Abbreviation | Description | Test Type | Reference |
|---|---|---|---|---|---|
| 1 | Longitudinal friction coefficient | LFC | Sliding process control of the tires using the braking force system. | [27,30] | |
| 2 | Sideway force coefficient | SFC | The ratio of the sideways force to the vertical force between the tire and the road surface. | [30,31] | |
| 3 | Friction measuring equipment | CFME | Spatial variability of tire–pavement frictional properties. | [30,32] | |
| 4 | Sliders or stationery or slow-moving measurement principles | Sliders | Using rubber sliders that are attached either to the foot of a pendulum arm or to a rotating head, which slow down on contact with the pavement surface. They are thus used in the lab and stationary tests. | Direct (contact or semi-contact) measurement | [30,31] |
| 5 | Sensors-based methodologies (optical measurement system) | Sensors | Measurement of the pavement texture or ice percentage using an optical measuring system. | Indirect (contactless) measurement | [33,34] |
| No. | Test Types | Device Name | Main Outputs/Parameters | Tire and Wheel Load | Device View | Employed in | Reference |
|---|---|---|---|---|---|---|---|
| A. | Measurement principles based on Longitudinal Friction Coefficient (LFC) | ||||||
| A.1 | Field-based test | ADHERA | Water film thickness: 1.0 mm; Measures macrotexture; Measurement speed: 40, 60, 90, 120 km/h; Measurement interval: 20 m | PIARC smooth profile tire 165R15 (180 kPa); Wheel load: 2500 N |  | France | [65] |
| A.2 | BV-11 | Slip ratio: 0.17 or 17%; Water film thickness: 0.5–1.0 mm; Measurement speed: 70 km/h; Measurement interval: 20 m | Trelleborg type T49 tire (140 kPa); Wheel load: 1000 N |  | England, Sweden, and Finland | [31] | |
| A.3 | GripTester | Slip ratio: 0.15 or 15%; Water film thickness: 0.5 mm; Measurement speed: 5–100 km/h; Measurement interval: 10–20 m or other | 254 mm diameter smooth profile ASTM-tire (140 kPa); Wheel load: 250 N |  | United States, United Kingdom, and others | [36] | |
| A.4 | RoadSTAR | Slip ratio: 0.18 or 18%; Water film thickness: 0.5 mm; Measures macrotexture; Measurement speed: 30, 60 km/h; Measurement interval: 50 m | PIARC tire with tread; Wheel load: 3500 N |  | Australia | (modified from [66]) | |
| A.5 | ROAR DK | Slip ratio: 0.2 or 20%; Water film thickness: 0.5 mm; Measures macrotexture; Measurement speed: 60, 80 km/h; Measurement interval: >5 m | ASTM 1551 tire (207 kPa); Wheel load: 1200 N |  | Denmark | [49] | |
| A.6 | ROAR NL | Slip ratio: 0.86 or 86%; Water film thickness: 0.5 mm; Measures macrotexture; Measurement speed: 50, 70 km/h; Measurement interval: 5–100 m | ASTM 1551 tire (200 kPa); Wheel load: 1200 N |  | Netherlands | (modified from [67,68]) | |
| A.7 | RWS NL Skid resistance tailor | Slip ratio: 0.86 or 86%; Water film thickness: 0.5 mm; Measurement speed: 50, 70 km/h; Measurement interval: 5–100 m | PIARC smooth profile tire 165R15 (200 kPa); Wheel load: 1962 N |  | Netherlands | [37] | |
| A.8 | Skiddo-meter (BV-8) | Slip ratio: 100% or 14%; Water film thickness: 0.5 mm; Measurement speed: 40, 60, 80 km/h; Measurement interval: 30–50 m | AIPCR tire with longitudinal tread 165R15; Wheel load: 3500 N |  | Sweden | (modified from [66,67]) | |
| A.9 | SRM | Slip ratio: 15% or 100%; Water film thickness: 0.5 mm; Measurement speed: 40, 60, 80 km/h; Measurement interval: 20 m or other | AIPCR tire with longitudinal tread 165R15; Wheel load: 3500 N |  | Germany | (modified from [68]) | |
| A.10 | TRT | Slip ratio: 25%; Water film thickness: 0.5 mm; Measurement speed: 40–140 km/h; Measurement interval: 20 m or other | Smooth profile ASTM tire; Wheel load: 1000 N |  | Czech Republic | [66] | |
| A.11 | SRT-3 | Slip ratio: 100%; Water film thickness: 0.5 mm; Measurement speed: 60 km/h | Tire with tread (200 kPa) |  | Poland | [31,38] | |
| A.12 | IMAG | Slip ratio: 100%; Water film thickness: 1.0 mm; Measurement speed: 65 km/h | PIARC smooth profile tire; Wheel load: 1500 N |  | France | [31] | |
| A.13 | MU-Meter | Friction; Self-wet trailer | Three small-wheeled trailers; Wheel load: 250 N |  | Germany | [39] | |
| B. | Measurement principles based on slow-moving Longitudinal Friction Coefficient (LFC) | ||||||
| B.1 | Laboratory and field-based test | T2GO | Slip ratio: 20%; Used for pedestrian/bicycle paths and road marking | Two 75 mm width tires |  | Switzerland | [31,40,67] |
| B.2 | VTI Portable Friction Tester (PFT) | Used for pedestrian/bicycle paths | Three small wheels |  | United Kingdom | [41] | |
| C. | Measurement principles based on Sideway Friction Coefficient (SFC) | ||||||
| C.1 | Field-based test | SCRIM | Slip angle: 20°; Water film thickness: 0.5 mm; Measures macrotexture; Measurement speed: 50 km/h; Measurement interval: >10m | Avon SCRIM smooth profile tire 76/ 508 (350 kPa); Wheel load: 1960 N |  | United Kingdom, France, Germany, Netherlands, and New Zealand | (modified from [49]) |
| C.2 | (SKM) Skid resistance measurement method | Slip angle: 20°; Water film thickness: 0.5 mm; Measurement speed: 50 km/h; Measurement interval: 100 m or other | Smooth profile tire; Wheel load: 1960 N |  | Germany | (modified from [49]) | |
| D. | Measurement principles based on Rotating Friction | ||||||
| D.1 | Laboratory-based test | DFT Dynamic Friction Tester | For stationary measurements | - |  | Japan | [22] |
| E. | Measurement principles based on Pendulum test | ||||||
| E.1 | Laboratory-based test | SRT Pendulum | For stationary measurements | - |  | Switzerland | (modified from [69]) |
| F. | Measurement principles based on optical measurement, and image-based techniques [70,71,72,73,74] | ||||||
| F.1 | Sensors and contactless tests | MARWIS-Mobile Advanced Road Weather Information Sensor | Ambient surface temperature: −50–70 °C; Road surface temperature: −40–70 °C, ±0.8 °C @ 0 °C; Dew points: −50–60 °C; Road conditions: dry, moist, wet, snow, ice; Water film thickness: 0–6000 µm; Ice percentage: 0–100%; Rel. humidity: 0–100%; Friction (frequency of up to 100 times per second and a max. output rate of 10 Hz): 0–1 | Installed on a back of a vehicle |  | Germany | (modified from [63]) |
| F.2 | Intelligent Passive Road Sensor IRS31Pro-UMB | Ambient surface temperature: −50–70 °C; Road surface temperature: −40–80 °C; Freezing point: −40–0 °C; Road conditions: dry, moist, wet, snow, ice; Water film thickness: 0–4 µm; Ice percentage: 0–100 %; Friction: 0–1 | - |  | Germany | (modified [75]) | |
| F.3 | LCMS Sensors | Measurement of macro-texture (MPD, MTD) Measurement of longitudinal prole and calculation of roughness Water-entrapment calculation Pavement type detection (asphalt, chip seal, porous, concrete) Slope, Cross Fall, and Super Elevation Friction Features related to damages | Installed on a back of a vehicle |  | Canada | (modified from [64,73]) | |
| F.4 | SPECIM AisaFenix 1 K airborne system | Friction Can be used in various civil engineering applications | Airborne based Imaging spectroscopy method (hyperspectral imaging or spectral imaging) |  | Finland | [72,73] | |
| No. | Data-Based Approach | Description | Indication | Threshold Level |
|---|---|---|---|---|
| 1 | Historical SK Data | Plot of the historical SK deterioration data over time, which is based on the increase in the deterioration rate of SK. | SK magnitude or percentage | Intervention |
| 2 | AR and Historical SK Data | Plot of the historical SK deterioration data against time and AR, which is based on the increase in the deterioration rate of SK. | SK or increase in AR (crash level) | Intervention |
| 3 | SK Distribution and AR-SK spectrum | Calculation of the standard deviation of SK and the adjustment of this value with the AR ratio from wet-to-dry conditions. | SK and AR ratio based on wet-to-dry conditions. | Intervention |
| No. | Skid Number (SN) | Intervention Level | Roadway Conditions | Required Action |
|---|---|---|---|---|
| 1 | <0.3 | Weak | Any conditions | Urgent preservation |
| 2 | ≥0.3 | Low Acceptable | Low-volume traffic | Frequent monitoring |
| 3 | 0.31–0.34 | Acceptable | Normal-volume traffic | Habitual monitoring |
| 4 | ≥0.35 | High acceptable | Low-volume traffic | Investigation level |
| No. | Skid Number (Sn) Intervention Level | Highway Organization | Roadway Conditions | References |
|---|---|---|---|---|
| 1 | SN40S 1 < 30 | Idaho Dot | Normal highways | [49,50,84] |
| 2 | SN40R 1 < 30 | Illinois Dot | Normal highways | |
| 3 | SN40R < 28 | Kentucky Dot | Normal highways | |
| 4 | SN40R < 32 | New York Dot | Normal highways | |
| 5 | SN40R < 30 | Texas Dot | Normal highways | |
| 6 | SN40R < 32 | Ohio Dot | Normal highways | [85] |
| SN40S < 23 | ||||
| 7 | SN40R < 30 | Maryland State Highway Agency | Undivided highways | [86] |
| SN40R < 25 | Divided highways | |||
| 8 | Low Skidding Crash Risk—ESC 2 < 0.30 | New Zealand Transport Agency | Low-volume traffic | [87] |
| Medium Skidding Crash Risk—ESC < 0.30 | Normal-volume traffic | |||
| High Skidding Crash Risk—ESC < 0.35 | High-volume traffic | |||
| 9 | CSC 3 < 0.30 | England Highways | Motorways: Low-volume traffic | [88] |
| CSC < 0.35 | Motorways: Heavy-volume traffic | |||
| CSC < 0.40 | One-way and Two-way traffic | |||
| CSC < 0.45 | Minor and major junctions | |||
| CSC < 0.50 | High-risk situations; Pedestrian crossings | |||
| CSC < 0.55 | High-risk situations; Pedestrian crossings | |||
| CSC < 0.60 | High-volume traffic | |||
| CSC < 0.65 | High-volume traffic |
Publisher’s Note: MDPI stays neutral with regard to jurisdictional claims in published maps and institutional affiliations. |
© 2021 by the authors. Licensee MDPI, Basel, Switzerland. This article is an open access article distributed under the terms and conditions of the Creative Commons Attribution (CC BY) license (https://creativecommons.org/licenses/by/4.0/).
Share and Cite
Rasol, M.; Schmidt, F.; Ientile, S.; Adelaide, L.; Nedjar, B.; Kane, M.; Chevalier, C. Progress and Monitoring Opportunities of Skid Resistance in Road Transport: A Critical Review and Road Sensors. Remote Sens. 2021, 13, 3729. https://doi.org/10.3390/rs13183729
Rasol M, Schmidt F, Ientile S, Adelaide L, Nedjar B, Kane M, Chevalier C. Progress and Monitoring Opportunities of Skid Resistance in Road Transport: A Critical Review and Road Sensors. Remote Sensing. 2021; 13(18):3729. https://doi.org/10.3390/rs13183729
Chicago/Turabian StyleRasol, Mezgeen, Franziska Schmidt, Silvia Ientile, Lucas Adelaide, Boumediene Nedjar, Malal Kane, and Christophe Chevalier. 2021. "Progress and Monitoring Opportunities of Skid Resistance in Road Transport: A Critical Review and Road Sensors" Remote Sensing 13, no. 18: 3729. https://doi.org/10.3390/rs13183729