
GIS-Based Forest Fire Risk Model: A Case Study in Laoshan National Forest Park, Nanjing


1
College of Information Science and Technology, Nanjing Forestry University, Nanjing 210037, China
2
National Laboratory of Radar Signal Processing, Xidian University, Xi’an 710071, China
*
Author to whom correspondence should be addressed.
Remote Sens. 2021, 13(18), 3704; https://doi.org/10.3390/rs13183704
Submission received: 9 July 2021
/
Revised: 13 September 2021
/
Accepted: 13 September 2021
/
Published: 16 September 2021
(This article belongs to the Special Issue Remote Sensing of Forest Fire: Data, Science and Operational Applications)
Abstract
:Fire risk prediction is significant for fire prevention and fire resource allocation. Fire risk maps are effective methods for quantifying regional fire risk. Laoshan National Forest Park has many precious natural resources and tourist attractions, but there is no fire risk assessment model. This paper aims to construct the forest fire risk map for Nanjing Laoshan National Forest Park. The forest fire risk model is constructed by factors (altitude, aspect, topographic wetness index, slope, distance to roads and populated areas, normalized difference vegetation index, and temperature) which have a great influence on the probability of inducing fire in Laoshan. Since the importance of factors in different study areas is inconsistent, it is necessary to calculate the significance of each factor of Laoshan. After the significance calculation is completed, the fire risk model of Laoshan can be obtained. Then, the fire risk map can be plotted based on the model. This fire risk map can clarify the fire risk level of each part of the study area, with 16.97% extremely low risk, 48.32% low risk, 17.35% moderate risk, 12.74% high risk and 4.62% extremely high risk, and it is compared with the data of MODIS fire anomaly point. The result shows that the accuracy of the risk map is 76.65%.
1. Introduction
Forests are not only important strategic resources for social development, but also have great influence on the protection of species diversity [1]. Climate and human activities are important factors that can cause forest fires, such as temperature, precipitation, sacrifice [2,3]. Combustibles are also significant for fires, which are trees and turf in the forest. Different trees have different probabilities of fire ignition due to the difference in moisture content [4]. In the past ten years, forest fires have occurred frequently, causing huge losses to forest resources, biology, and property [5,6]. Recently, with the rise of Geographic Information System (GIS) and computer science, forest fire risk prediction is becoming popular in the evolving fire management scenarios [7,8]. The combination of these two technologies can accurately predict regional fires.
The forest coverage area of china is 195.45 million hectares, and the coverage of forest accounts for 21.6% of the land area. The area of natural forest is about 122 million hectares, and the area of plantation forest is 72 million hectares. According to the data of the China Forestry Statistics Bureau, an average of 6000 fires occurred annually, causing hundreds of thousands of hectares of forest to have burned and tens of billions of dollars of financial losses in ten years from 2004 to 2014 [9]. Accurate fire risk maps and good fire warning equipment can help firefighting agencies allocate fire prevention resources throughout the forest in advance and take emergency measures to control the fire within a small area. Then, more forest resources and human property can be better protected [10,11].
The fire risk map is made based on the geographic information of the study area, combined with advanced tools and methods, which has a great impact on fire prevention and control. The geographic information acquisition of the study area is mainly in view of the regional image of remote sensing. The data required for fire analysis can be obtained by analyzing and extracting the images. Topography, meteorological factor, vegetation, and human activities are recognized as four types of fire ignition factors [12,13,14,15,16,17,18,19].
Topography is a primary factor that effects the fire ignition because topographic factors influence the distribution of local climate (e.g., sunlight, temperature, etc.) [12,13,14]. Affected by the convective heat and the radiant heat, fires may spread rapidly along the steep and upward slope, but slow in areas with downward slope [12]. The speed and direction of the wind could be influenced by the aspect, which may result in unintended fire spreading direction [18]. Due to differences in temperature and vegetation, the probability of fire occurrence may be different in different altitudes [13]. The topographic wetness index (TWI) indicates the effects of topography and soil characteristics on soil moisture distribution to some extent [15]. The forest fire can be affected by hydrological conditions [16,20]. Recently, TWI has been found as one of the effective factors to predict the fire occurrence [20]. Aspect, altitude, slope, and TWI can be extracted from Digital Elevation Model (DEM) data.
Meteorological factor, such as temperature, is a significant inducement of fire ignition [17]. A high temperature will result in a low soil moisture or even drought, which makes forests prone to fire [18,19,20]. Normalized Difference Vegetation Index () is widely chosen to indicate the vegetation distribution which is commonly considered as a proxy of fuel for the analysis of fire occurrence [14].
The occurrence of fire is related to human behavior and activities [21,22]. Most of the fires caused by human activities are accidental fires. For example, fire may be induced by cigarette butts thrown by pedestrians near the road. Thus, the area where roads and human settlements are located has a high probability of unintended fire ignition, compared with the roadless areas and uninhabited areas [12,20,23].
The methods of establishing a fire model include: logistic regression [20], fuzzy analysis [24,25,26,27], neural network [28], etc. Generally, those methods need historical fire data to validate the accuracy of the model. However, not all areas have complete historical fire data, and the above methods based on incomplete historical fire data will result in inaccurate fire risk maps in some areas [29,30]. Therefore, we need to design a Fire Risk Index () model for the study area where it lacks of historical data. Based on , a forest fire risk map can be constructed, so that an accurate fire risk map can be obtained in the area that lacks data.
The probability assessment model is often used for cartographical forest fire modeling, which is used with GIS. After the has been determined, and the map can be drawn, the accuracy of the generated map need to be verified. Since the study area lacks of fire data, we need to find a method to extract the fire data of the area. In this paper, we select MODerate-resolution Imaging Spectroradiometer (MODIS) temperature anomaly/fire products to obtain the location of the fire points by calculating the Normalized Difference Thermal Index (NDTI) of the data. The fire location obtained by this method can be used as fire data. Compared with the real fire data, the accuracy of fire location extraction is over 90% [31]. In our study, we extract fire locations based on the data from 2013 to 2016. We extracted 304 fire points in Laoshan Forest Park. These fire points are used to analyze the accuracy of the fire risk model.
Nanjing Laoshan National Forest Park is a famous tourist attraction, which is the largest national forest park in Jiangsu Province. It has many precious animal and plant resources. Currently, the way of fire prevention in the study area is mainly depending on human patrol and watchtower monitoring methods [32]. The patrol paths are mainly based on practical experience. Recently, the number of fires has gradually increased in China, it is urgent to update and optimize fire management methods. The fire risk map is recognized as an effective tool to allocate fire management resources. This paper aims to construct a forest fire risk model so that the fire department can improve the fire management ability based on the generated fire risk map.
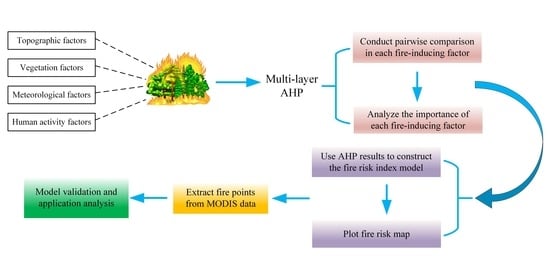
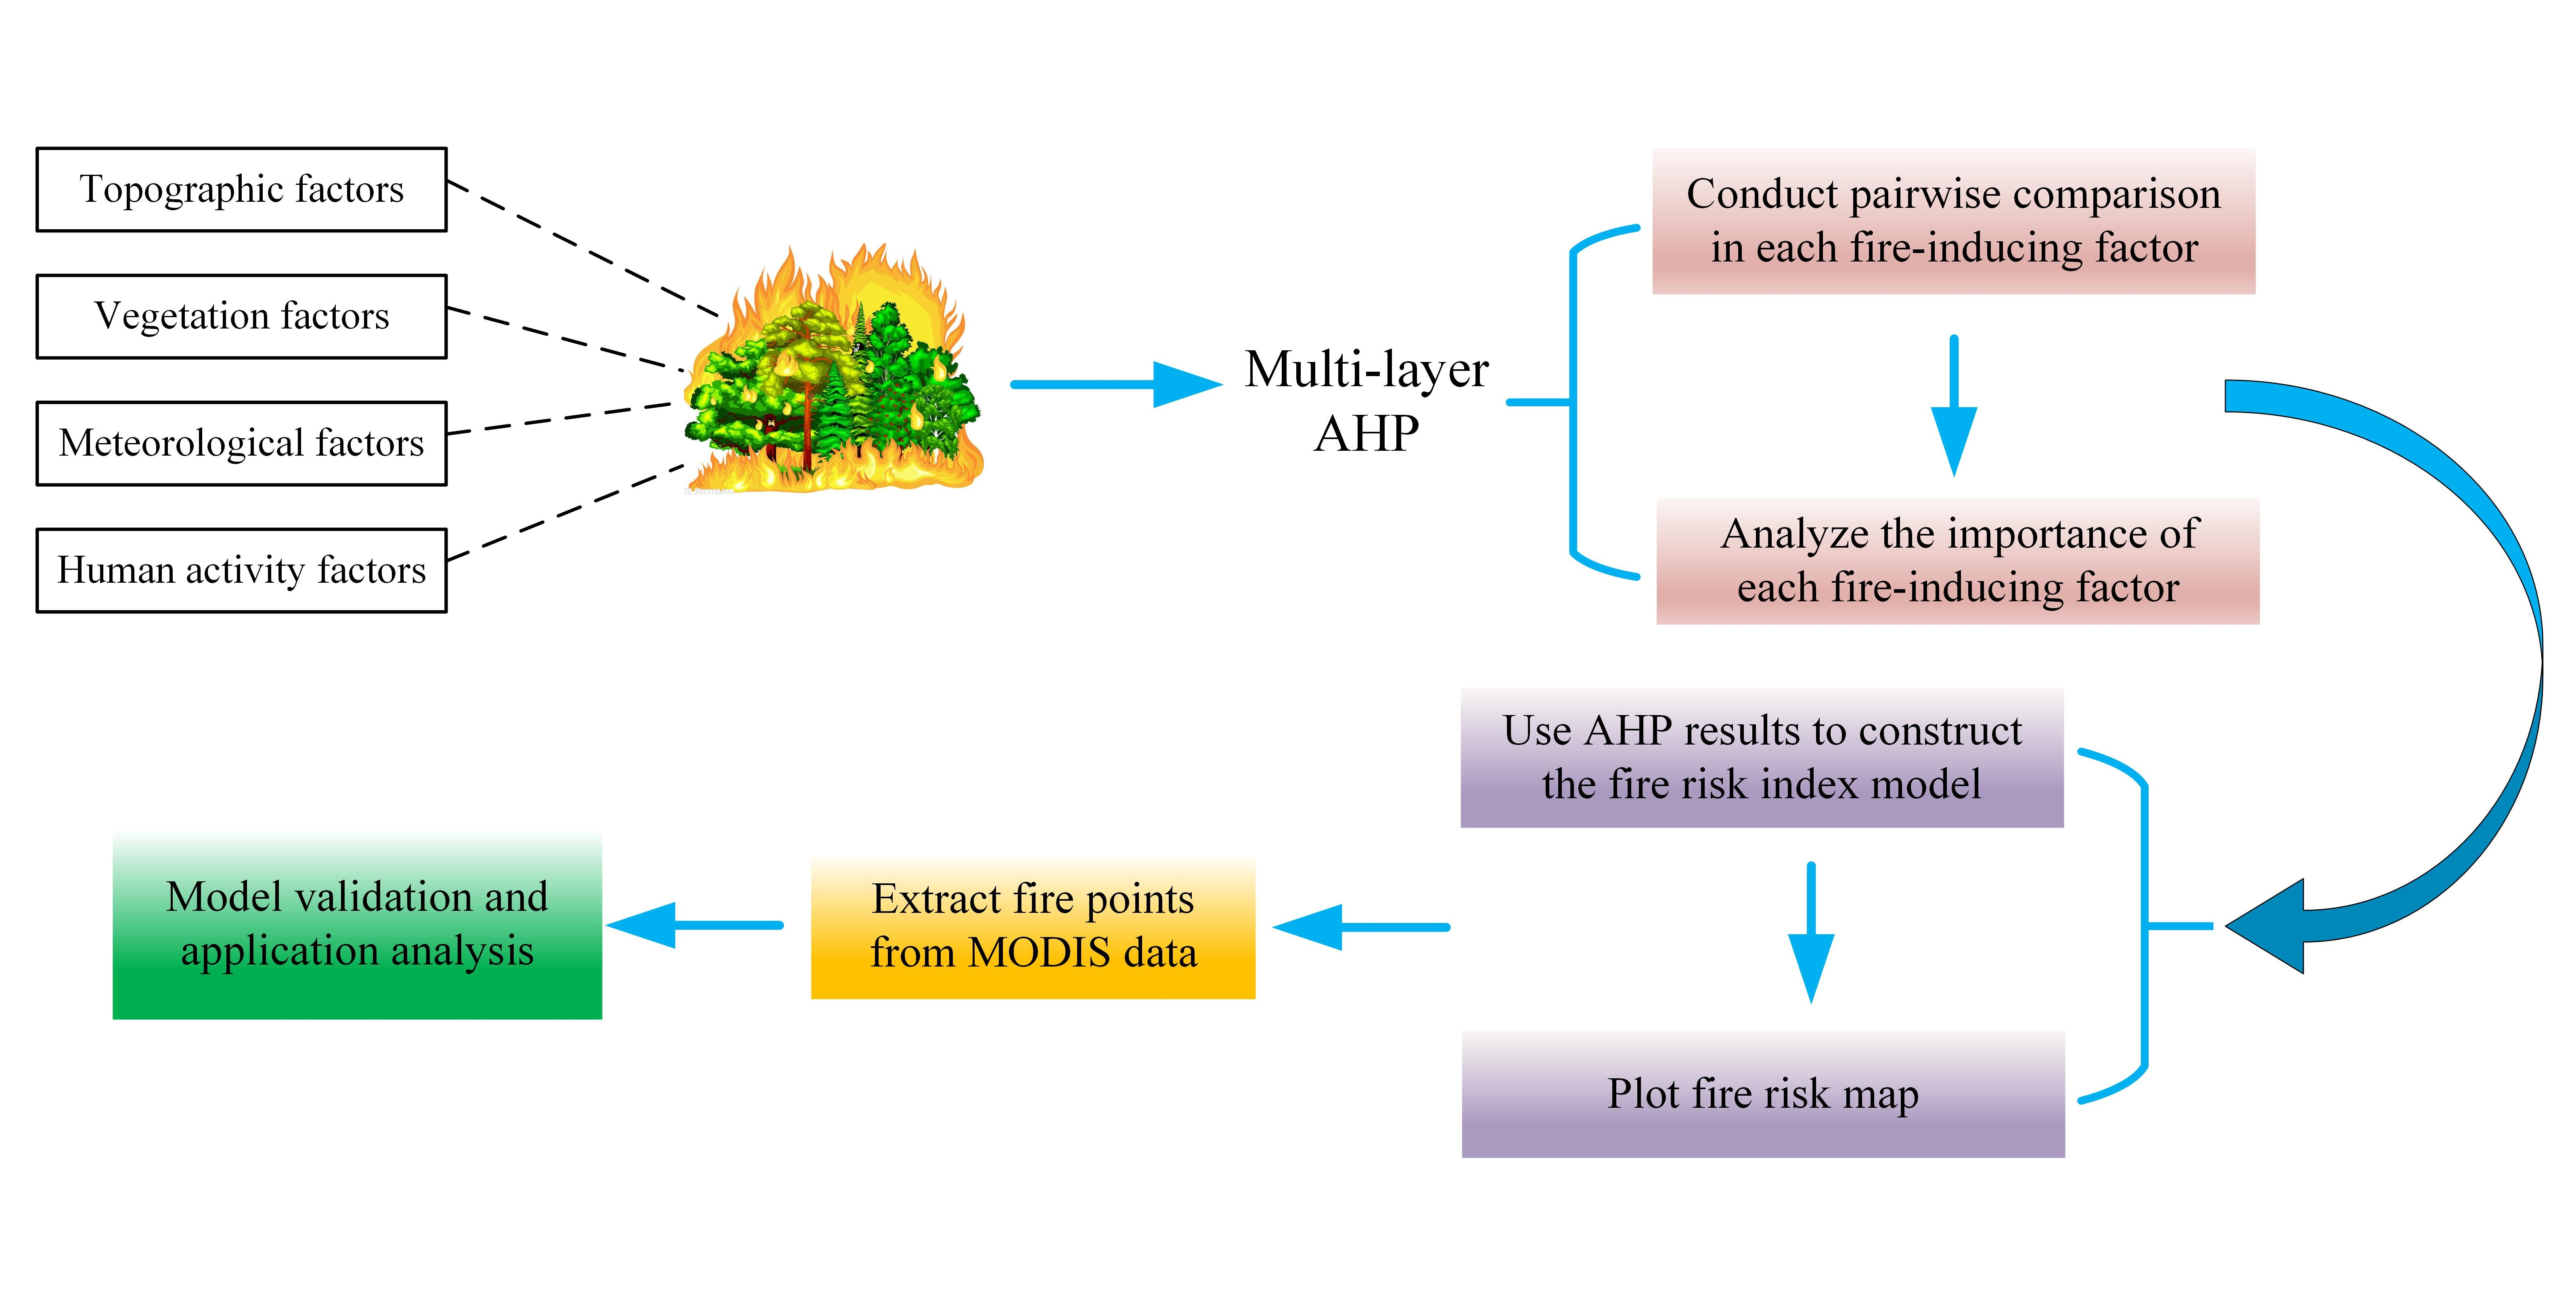
The fire risk model is constructed with GIS and a multi-layer hierarchical analysis [33,34]. The multi-layer analytic method can evaluate the impact of various factors on fire occurrence in a more precise manner [35]. Four types of factors (topography, meteorological factor, vegetation, and human activities) are considered in the multi-layer analytic process. First, we conduct a pairwise analysis of the factors contained in each type of fire-inducing factor, and then analyze the importance of each type, so that the results obtained are more reasonable than single-layer analysis [20,23,35].
After the weight of each factor that indicates the importance of fire ignition obtained by multi-layer analysis, the fire risk model can be constructed. At last, we conduct crossing between the area of the Laoshan forest risk map obtain by with the heat spots [23], and the accuracy of our model is close to 77%. The environment of each study area is different, so each fire risk model is unique for a specific area [26,36,37]. The main contributions are as follows:
- It is the first time to construct a fire risk model with actual geographic information for Nanjing Laoshan National Forest Park.
- For each influencing factor, the weights were calculated by multi-layer hierarchical analysis. The weight has passed the verification of consistency ratio, which proves the rationality of weight allocation.
- The validation result shows that the prediction accuracy of our model is close to 77%, which proves that the proposed model has good performance.
2. Study Area and Data Used
2.1. Study Area
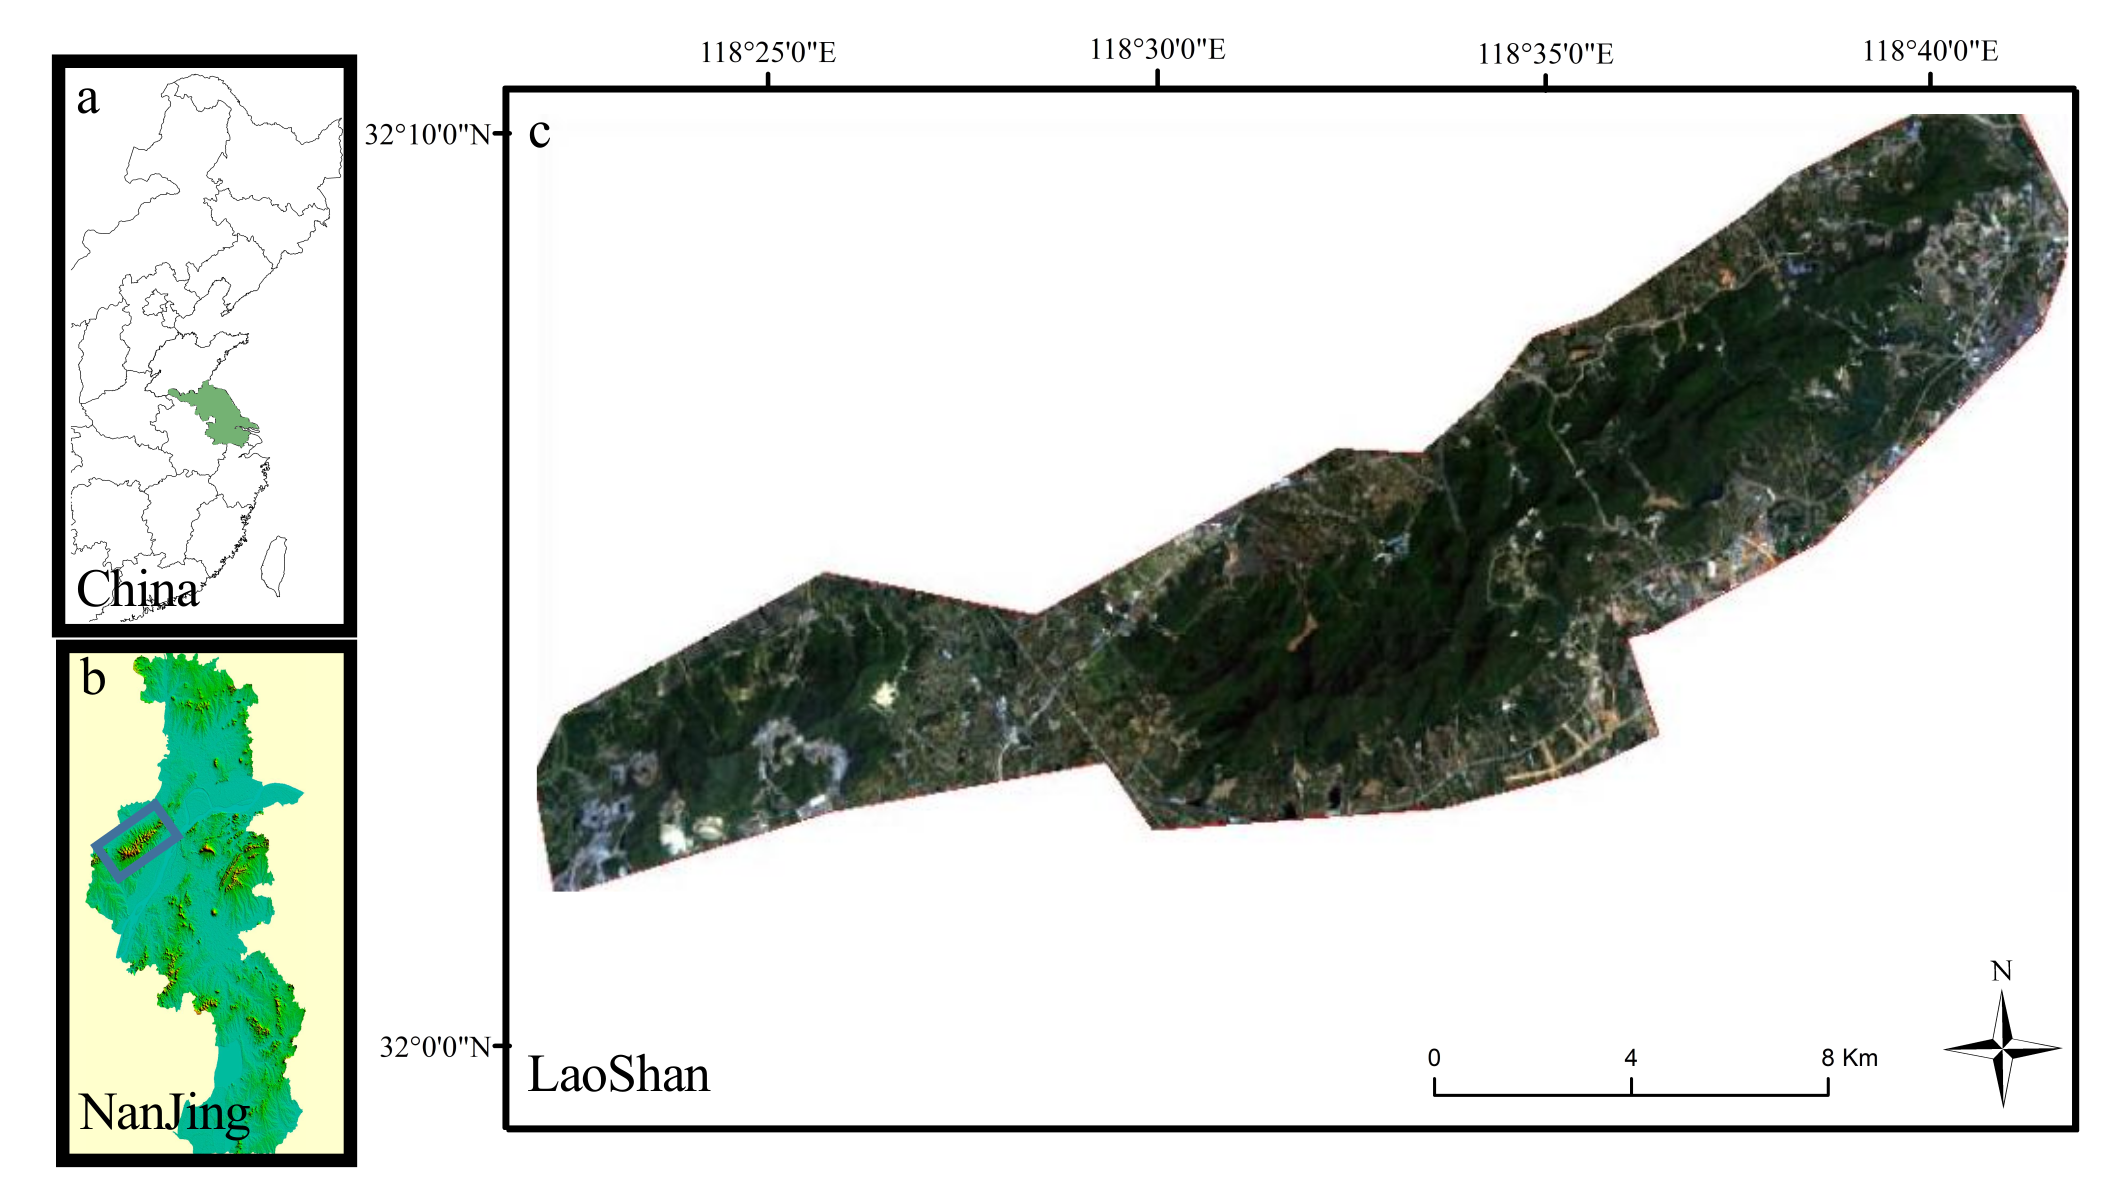
We use Nanjing Laoshan National Forest Park as the study area, which is located in northwestern Nanjing. The map is shown in Figure 1. The Laoshan park is located East and North and covers an area of approximately 80 km. As early as in 1991, it was named as National Forest Park by the former Ministry of Forestry, and later as “Jiangsu Province Science Education Base”, “Jiangsu Province Environmental Education Base” and “National AAA Scenic Spot”. It is known as the “natural oxygen bar”. The altitude of Laoshan park is ranging from 4.5 to 414.7 m. The climate in Laoshan park is warm and humid. The average annual temperature is and an annual precipitation of 1000 mm. The area belongs to subtropical monsoon climate. The area has a frost-free period of 228 days. There are seven springs that have been exploited and utilized, such as Wuliu Spring and Pearl Spring. The amount of water ranges from 1000 to 2000 tons, and is rich in minerals and radioactive substances, so it has medical value. The natural vegetation type of Laoshan Mountain is a mixed forest of deciduous broad-leaved and evergreen broad-leaved. There are 148 species of ferns and seed plants. The forest coverage rate is 80%, and the forest volume is 330 thousand cubic meters. There have been few large-scale fires in Laoshan National Forest Park, so it lacks fire data. The latest fire occurred in a subway station near the park. The cause of the fire was an electric vehicle battery.
2.2. Data Used
A 30 m-resolution DEM data can be downloaded from Geospatial Data Cloud (GDC) (http://www.gscloud.cn, accessed on 10 January 2021). Altitude, TWI, aspect, and slope can be extracted from DEM by ArcGIS 10.5. The scale of DEM data is 1:25,000.
The MODIS data can be used to extract the location of fire points, which can be found by Terra and Aqua satellites which belong to the National Aeronautics and Space Administration (NASA). These satellites monitor active fire data four times a day. MODIS is a 7-day composite data. In this paper, the active fire data that we used from NASA (https://ladsweb.modaps.eosdis.nasa.gov/, accessed on 15 March 2021) covered 3 years (2013–2016). We converted the MODIS data into a 30m grid in order to match other raster layers. In this paper, a total of 304 fire points were extracted from the MODIS data. Around 80% of fires every year occurred from July to September, whereas 20% occurred in March and November. Compared with the map of Laoshan, the location of fire points mainly in tourist attractions and areas with high foot traffic near the forest.
We use Landsat-8 data to extract the temperature and . The selected data are 7-day satellite data. The temperature inversion method was used to eliminate the influence of clouds in the image and get the temperature of the study area.
3. Methods
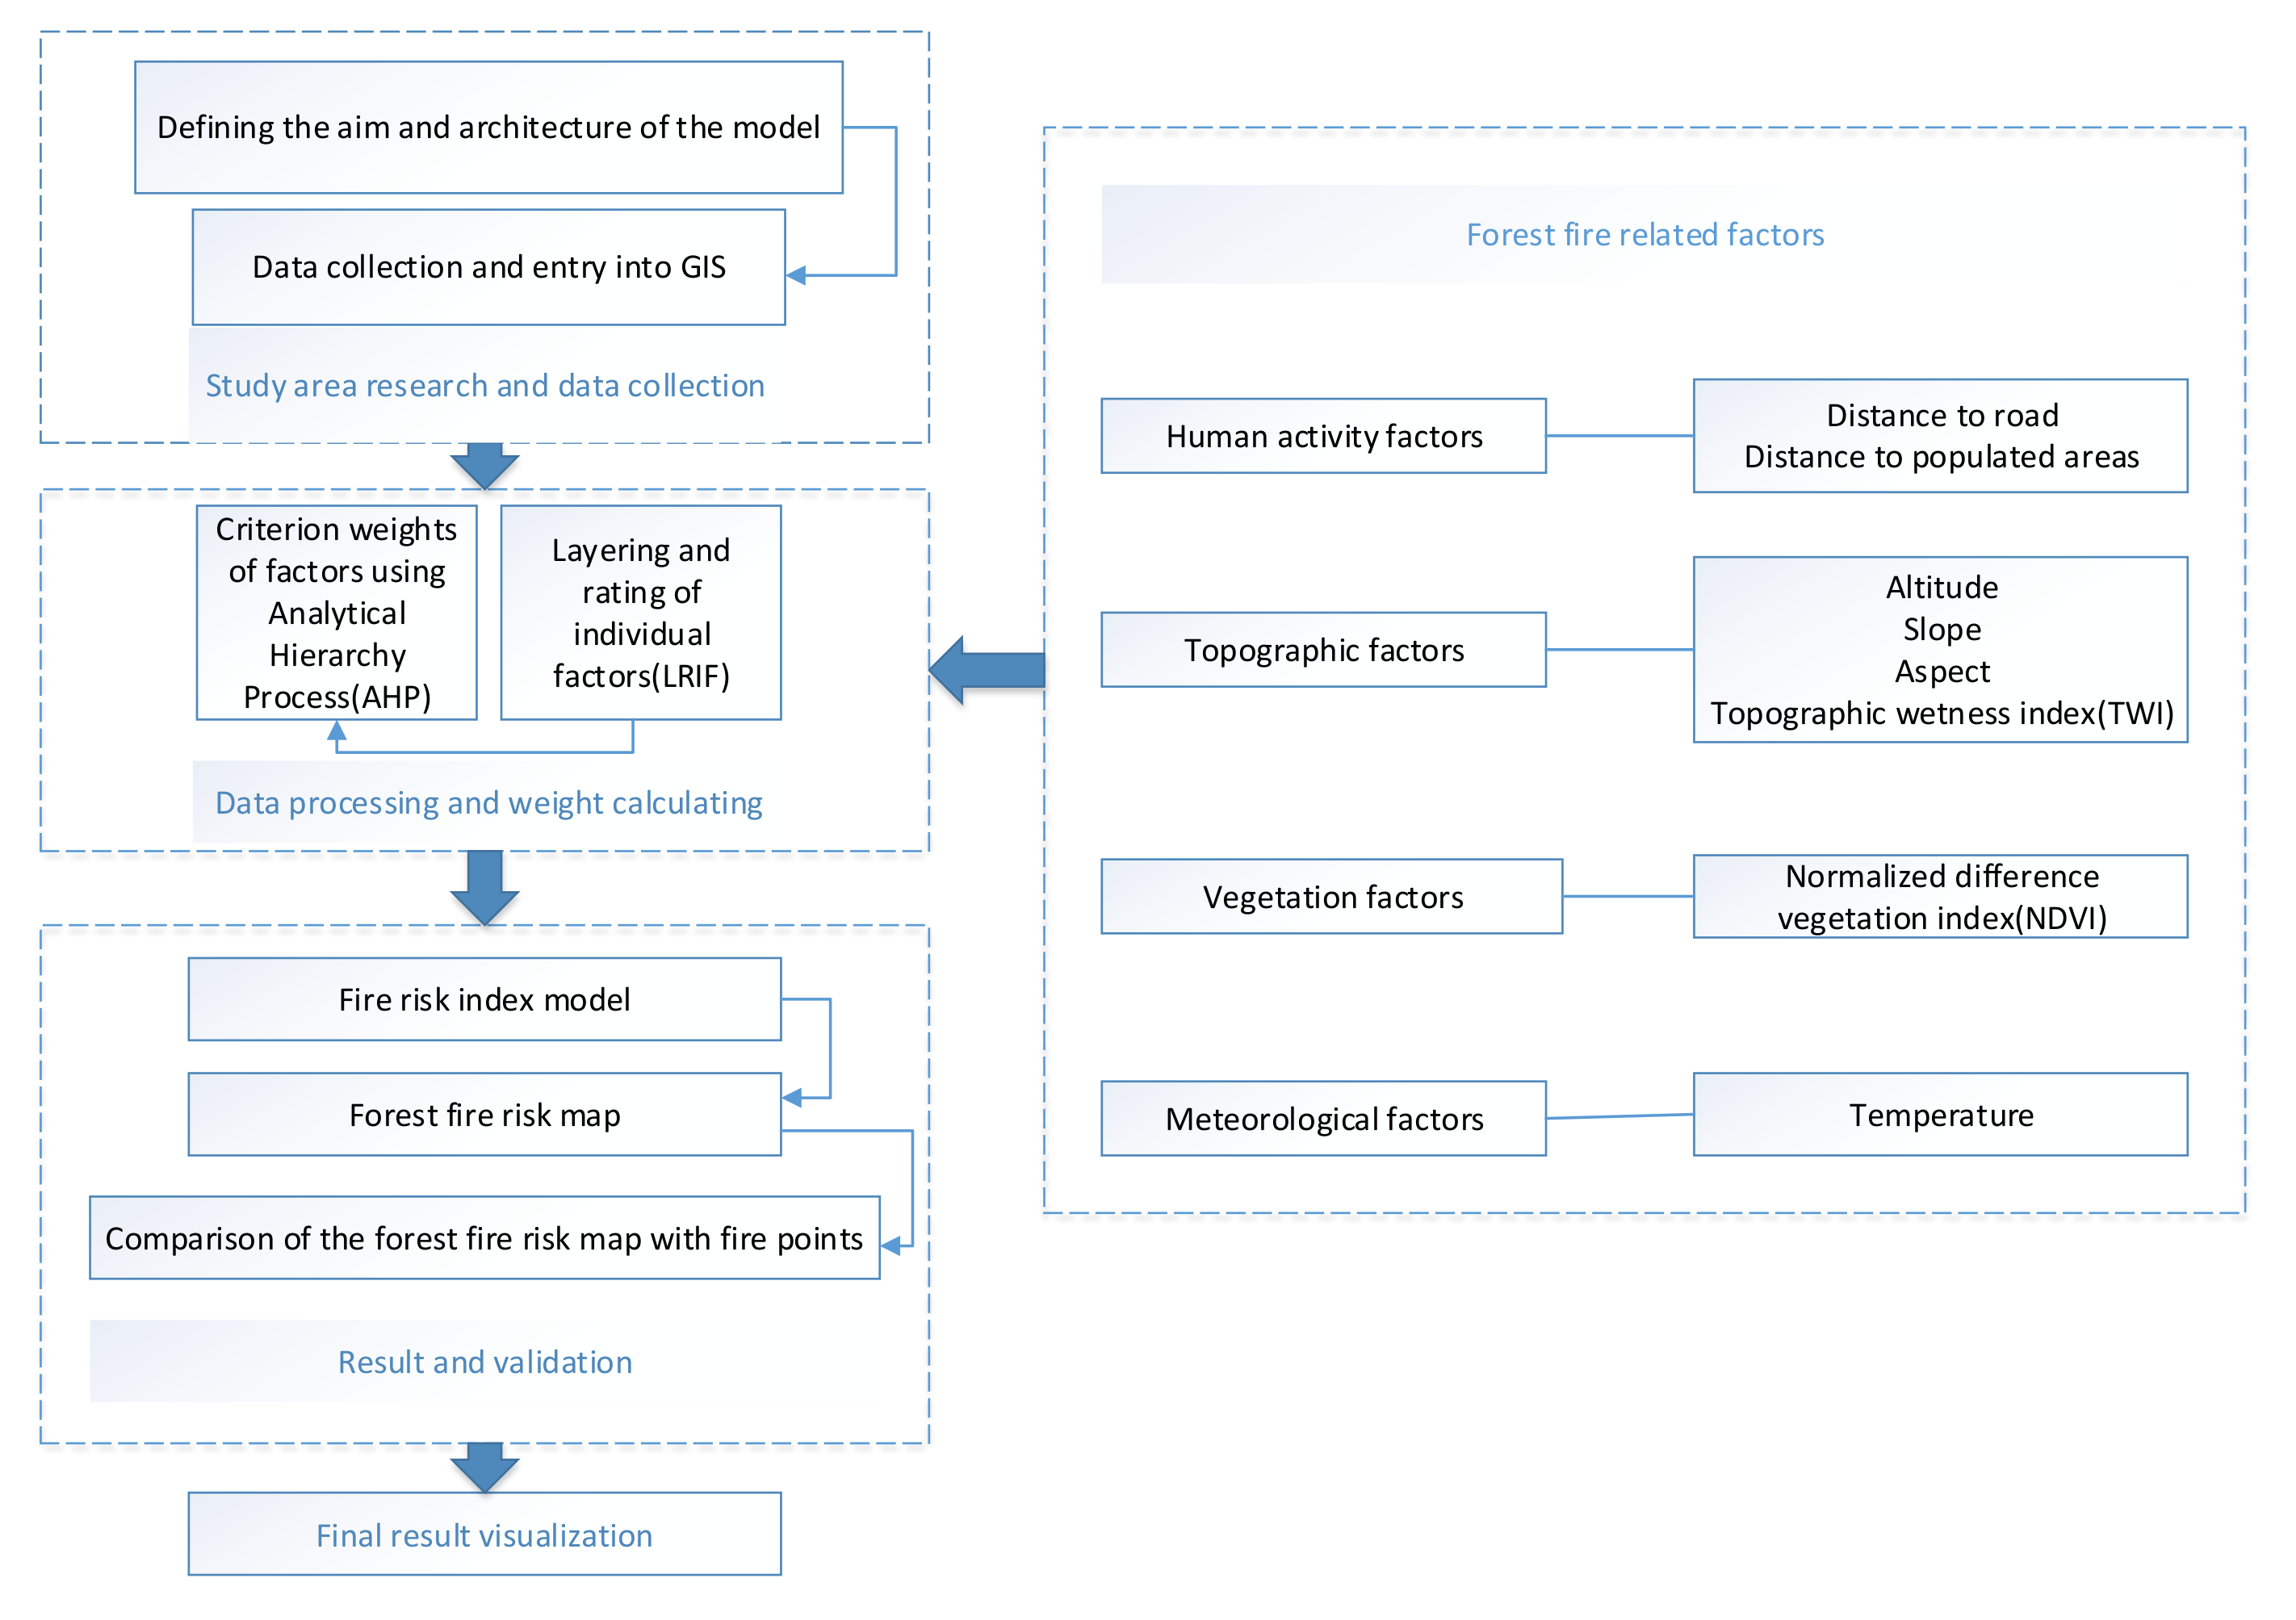
In this section, we analyze each factor and draw a base map for each one. Each factor has its unique way of affecting the occurrence of forest fires. The fire occurrence is affected by topographic factors (e.g., altitude, slope, aspect, TWI), meteorological factor (e.g., temperature), human activity factors (e.g., distance to roads and populated areas), and vegetation factor (e.g., ). Based on the expert’s experience and the literature, these factors are divided into different categories and assigned acceptable risk levels. Variables that appear in the literature are obtained according to the expert’s analysis. According to the literature and the study area, each factor has been split into five levels [38]: extremely low, low, moderate, high, extremely high [27,39,40,41]. Then, we use the analytic hierarchy process to assign appropriate weights to the eight factors. Finally, the accuracy of the fire risk model can be verified by conducting a crossing between the areas of the fire risk map with the heat map constructed by fire points. The specific process is shown in Figure 2.
3.1. Layering and Rating of Fire Ignition Factors
3.1.1. Topographic Factors
Regional topography influences the probability of fire occurrence, such as altitude, orientation, and hydrological conditions [42]. Therefore, we can get the information of altitude, slope, aspect, and TWI from DEM, and these factors have been selected as influencing factors of fire [43]. Four types of DEM data are divided into the following categories:
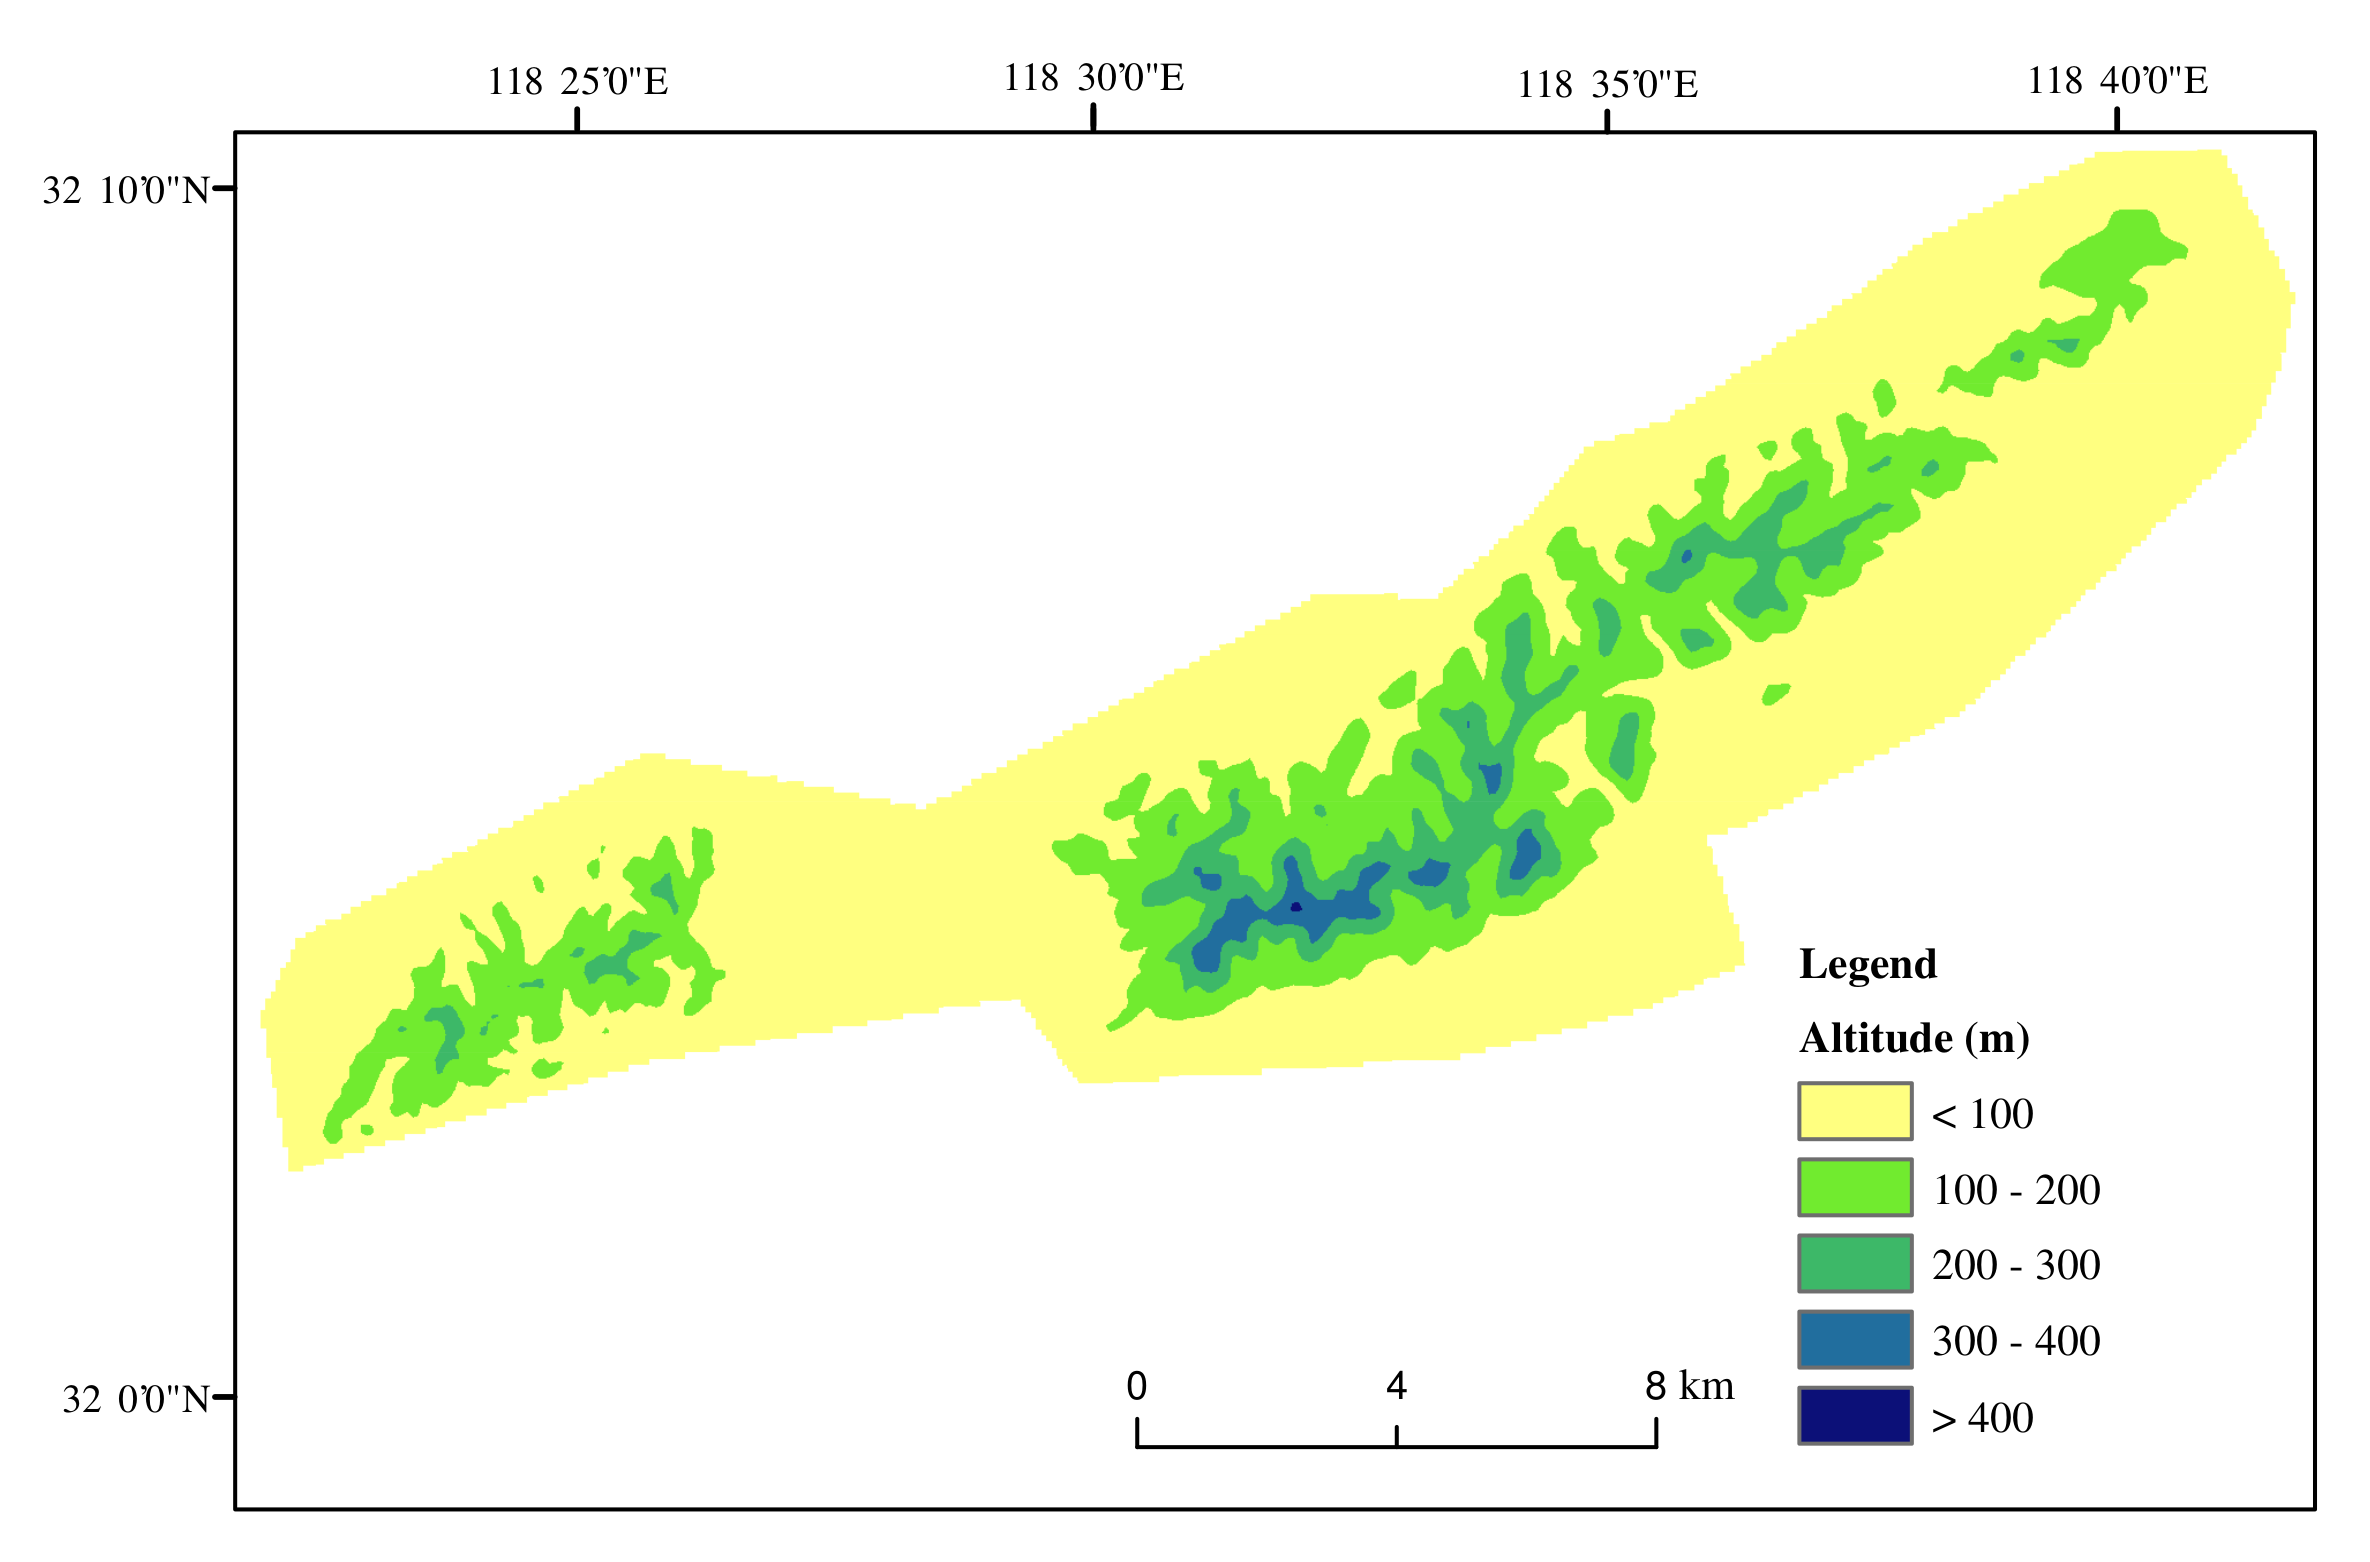
- (a) Altitude: The altitude data are reclassified to generate a new classification standard, which is divided into the following levels: extremely high, high, moderate, low, extremely low. The corresponding weight is allocated to the five classes [44]. It is shown in Table 1. The result of altitude is obtained through the elevation extraction of DEM data by ArcGIS10.5, and Figure 3 shows the based map of altitude.
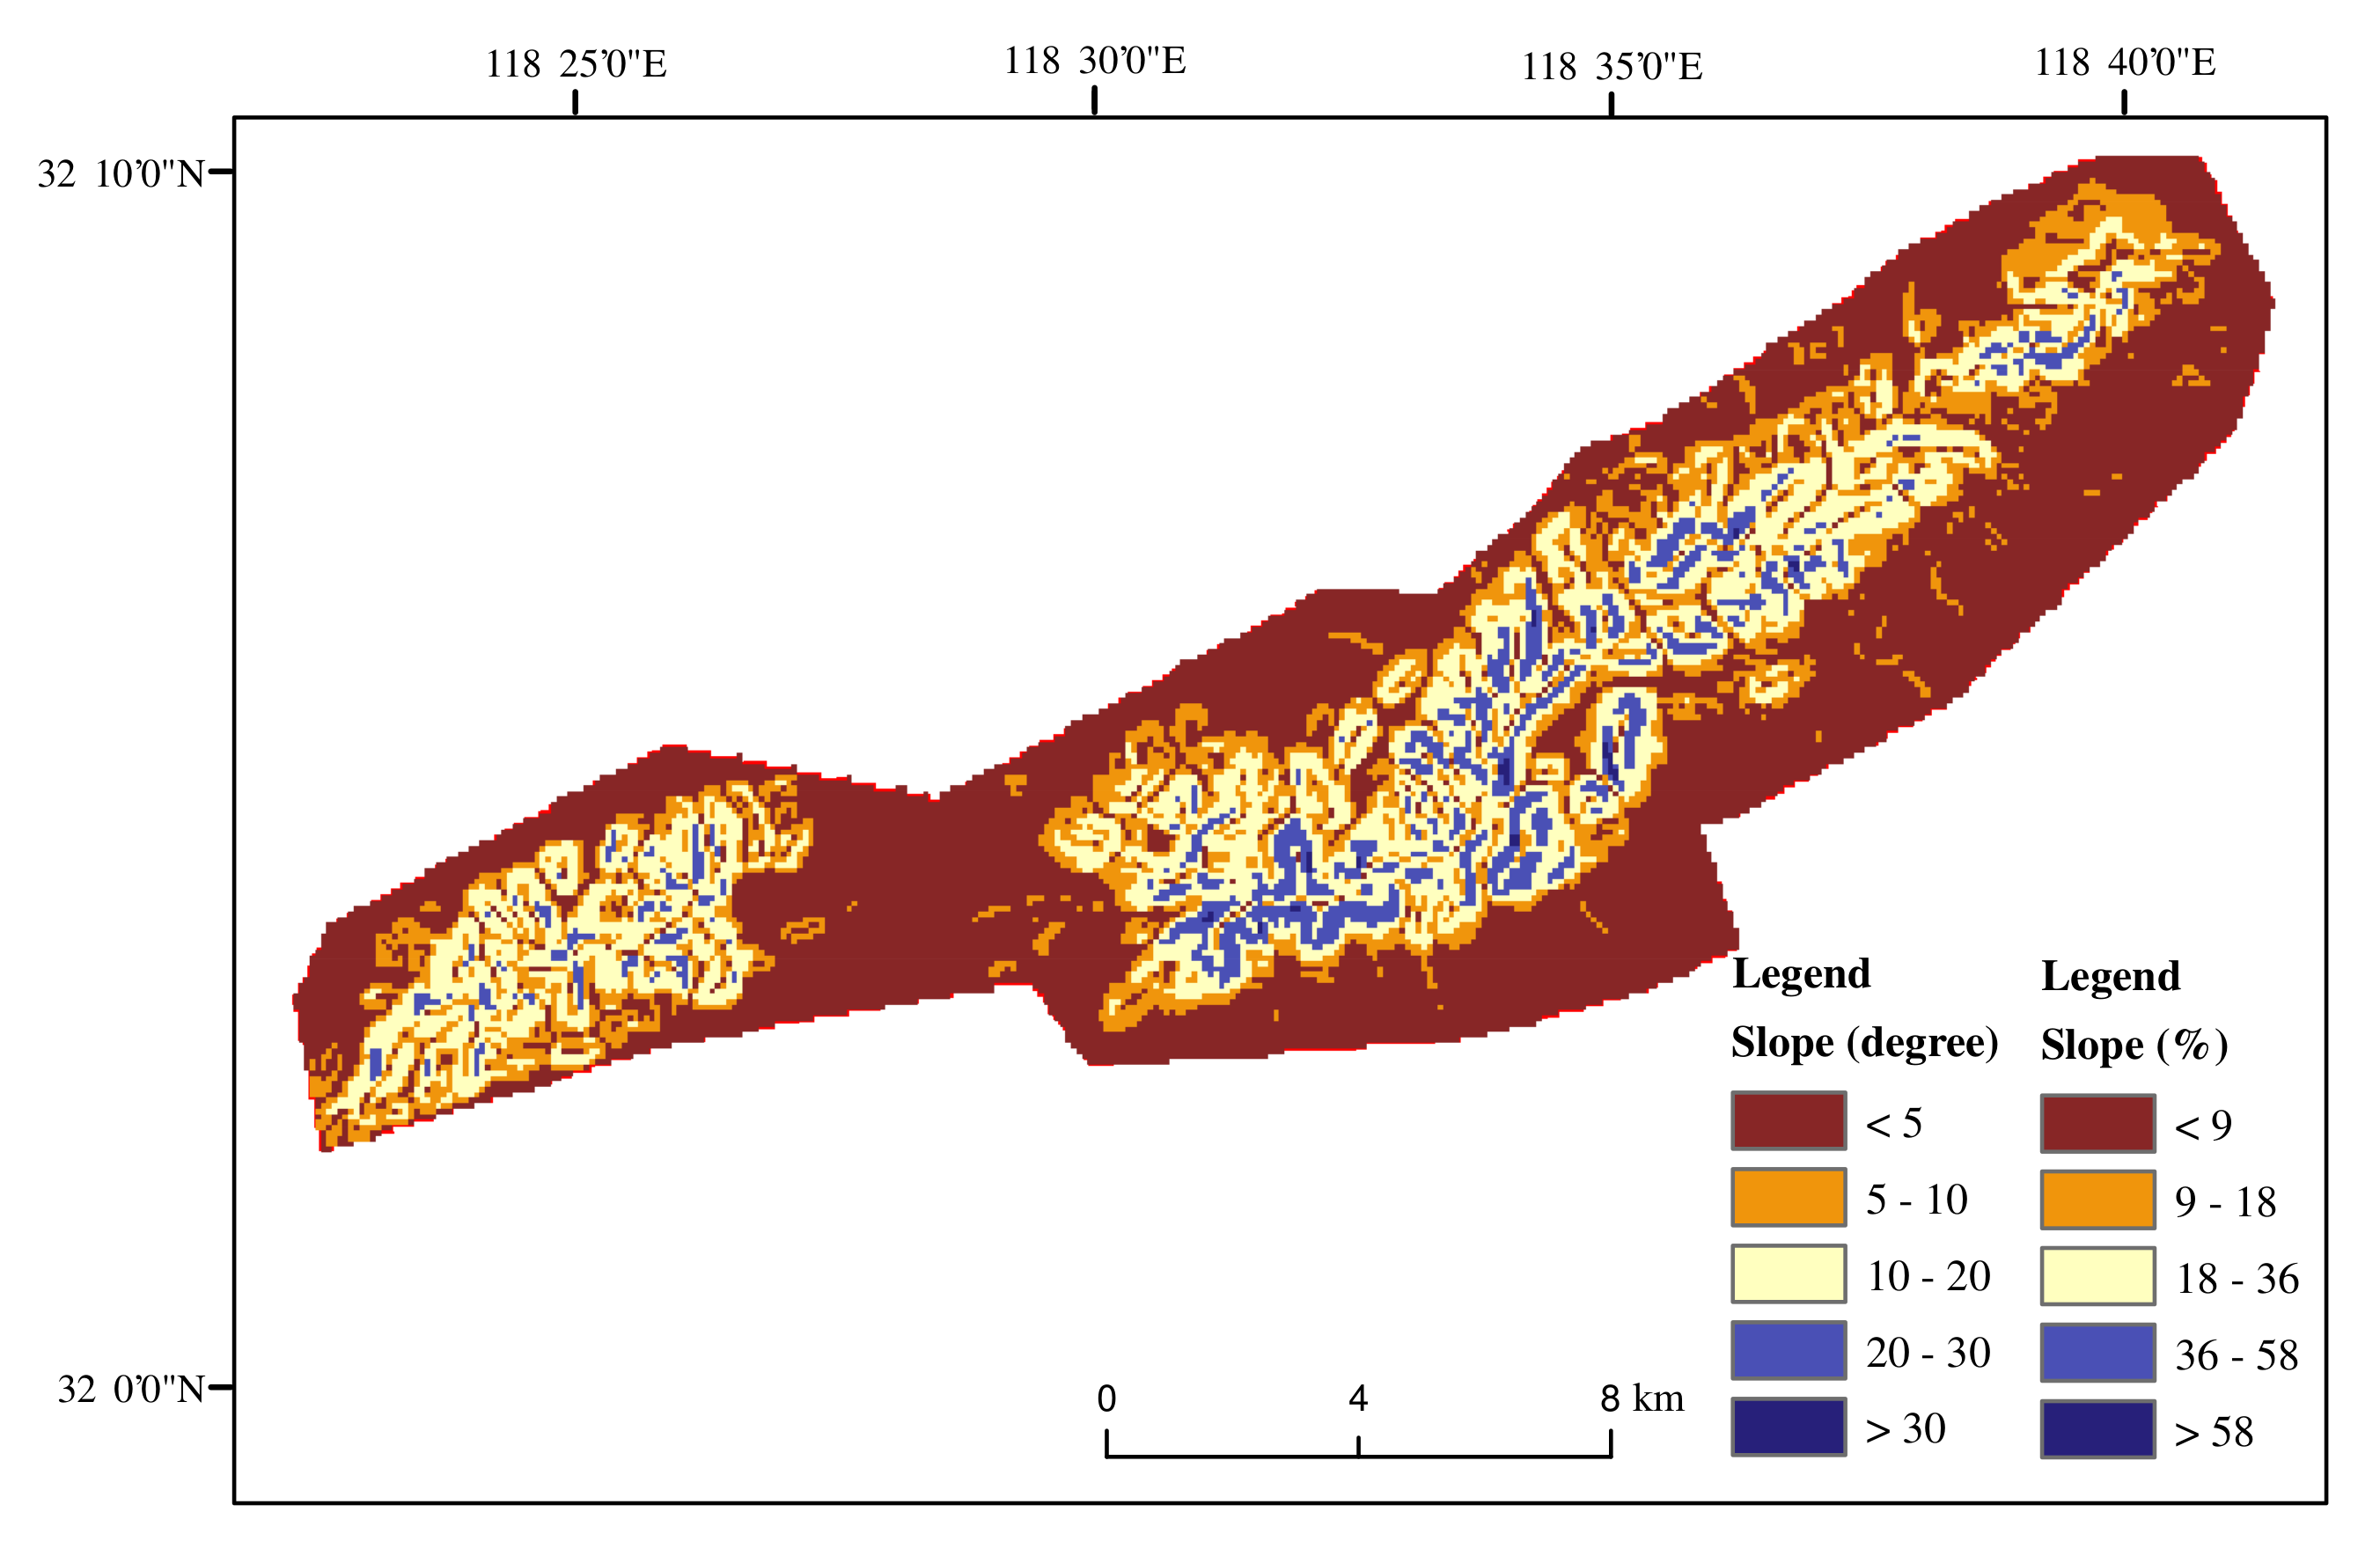
- (b) Slope: The slope of the study area is calculated by the slope function that comes with ArcGIS. Meanwhile, we also calculate the slope as a percentage. Figure 4 is the base map of the slope. The slope data is reclassified to generate a new standard, the classification standard is the same as that of altitude. The weight is allocated to the five classes in Table 2.
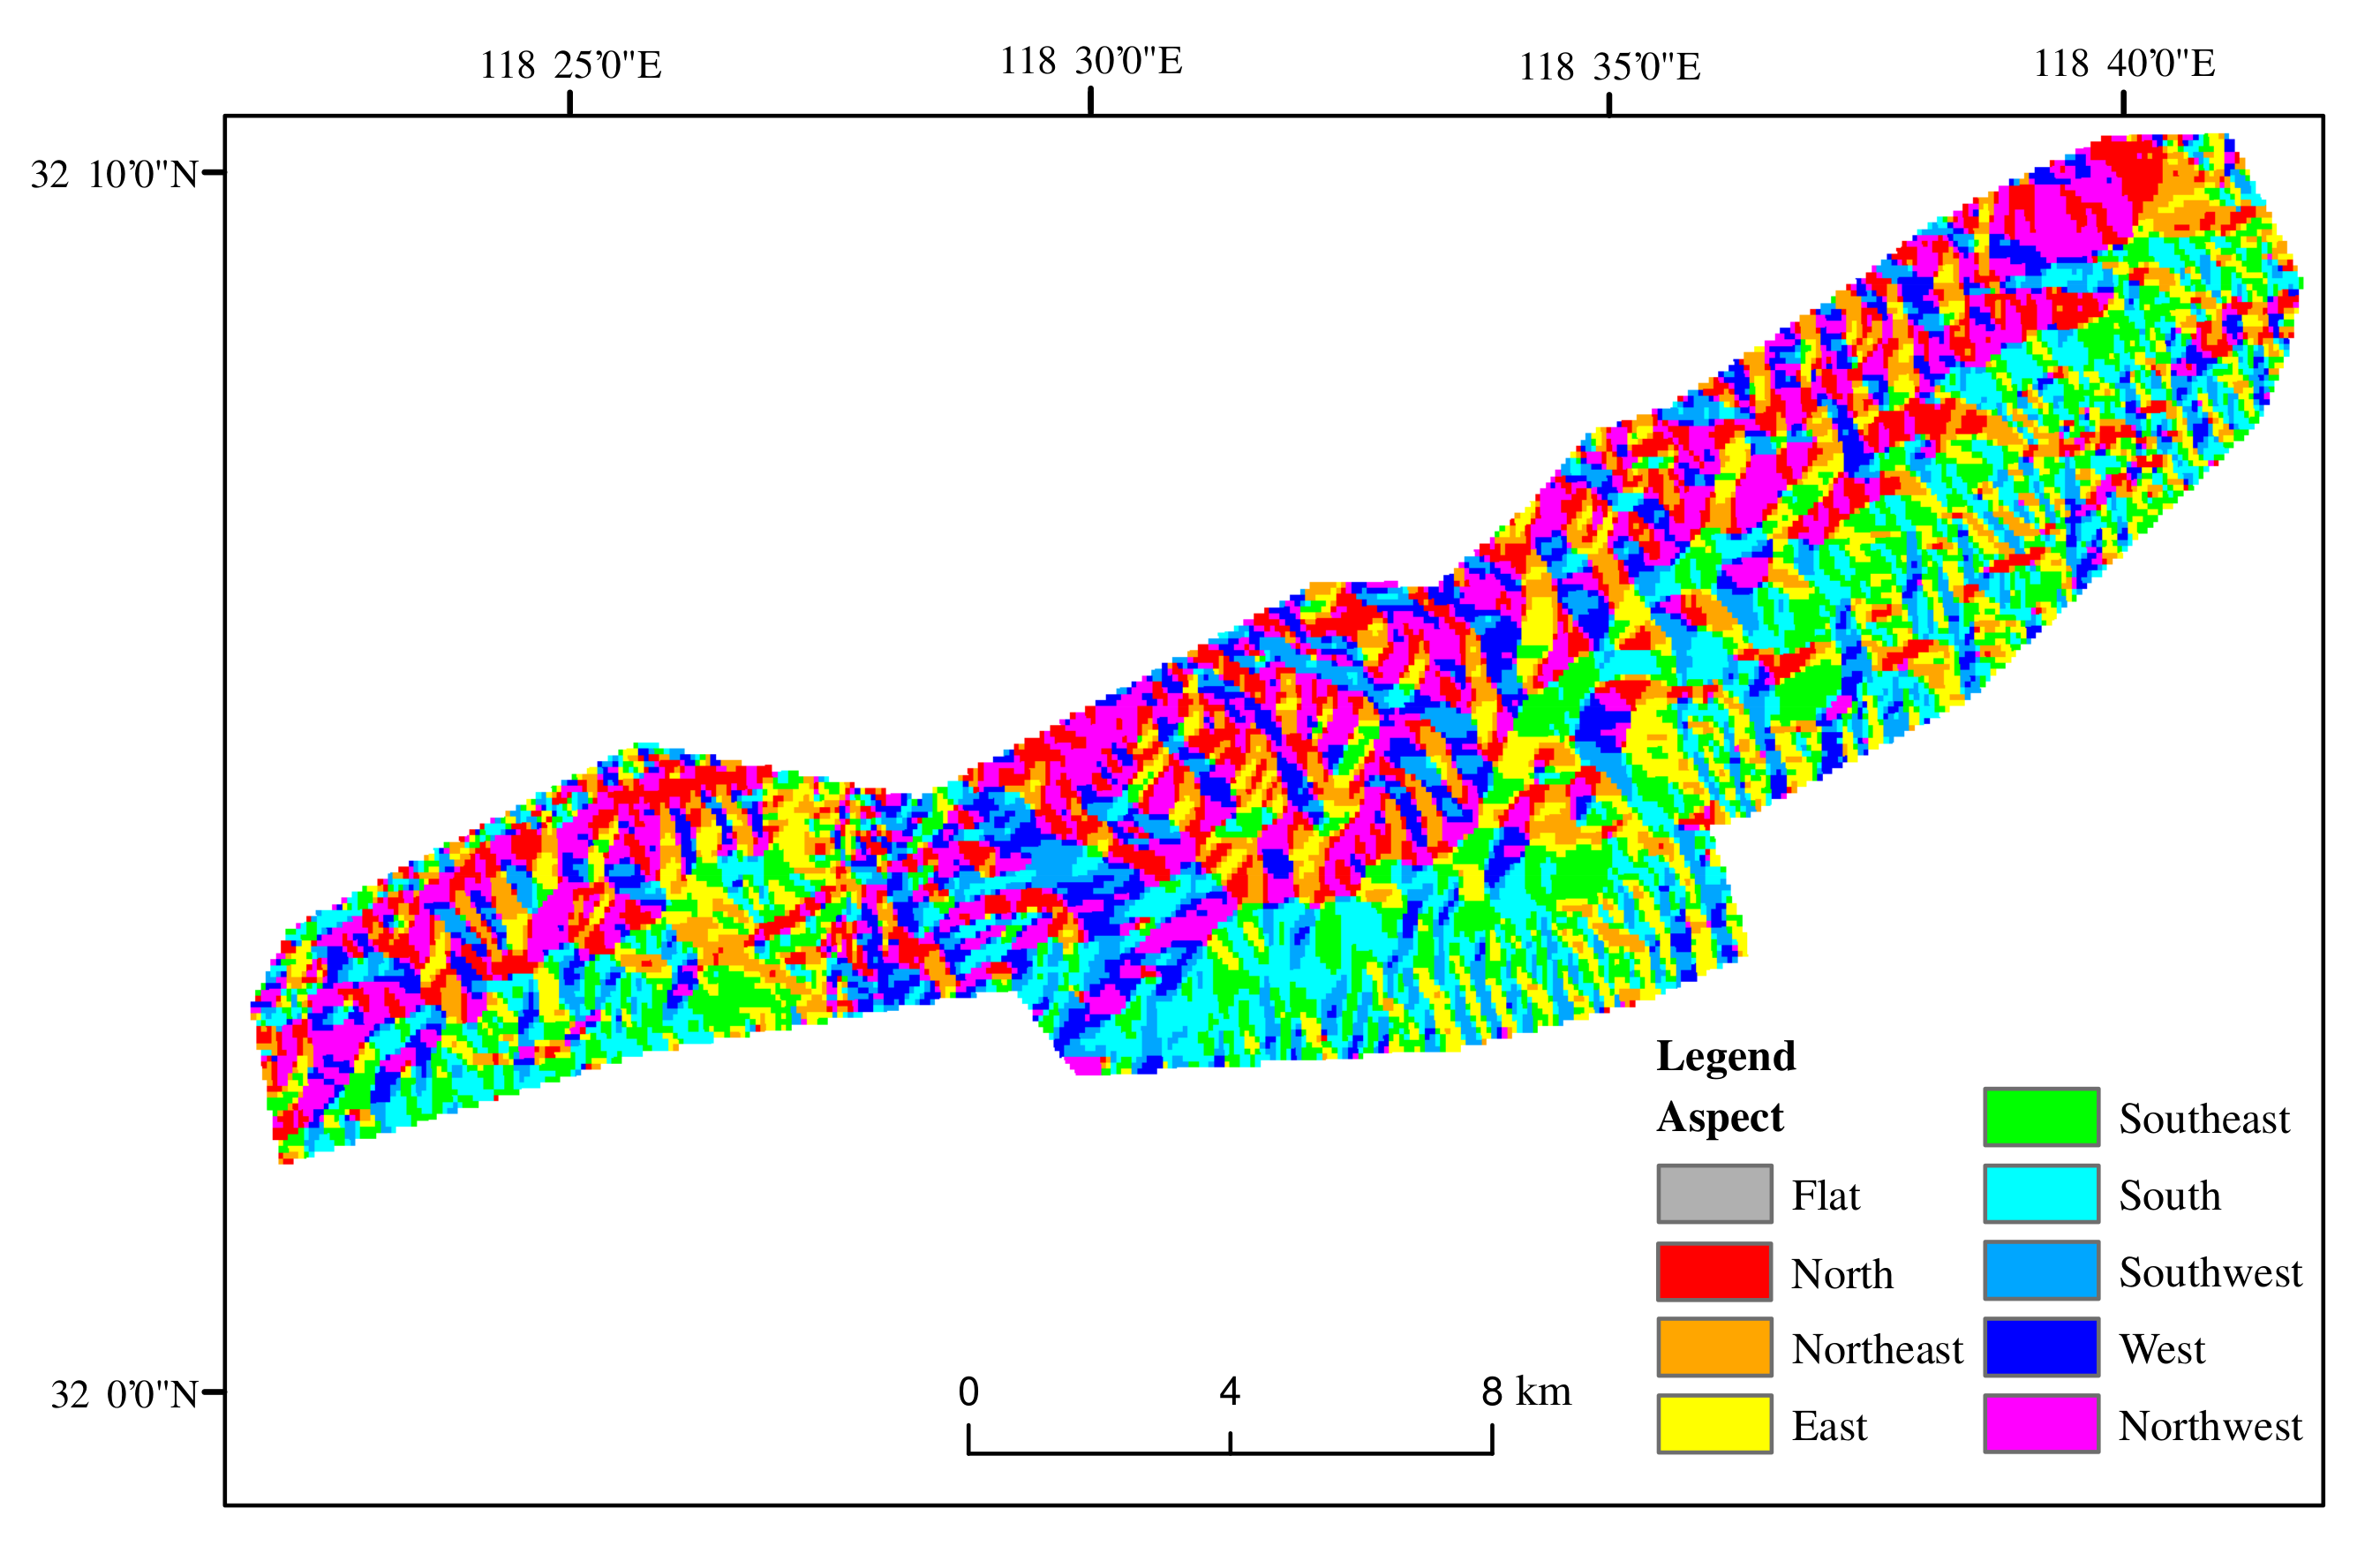
- (c) Aspect: The aspect matrix was calculated using the DEM. The aspect was classified into eight classes [19,45], which is shown in Table 3. In the northern hemisphere, the sunny slope has higher temperature and is prone to fire. Except for the tropic of cancer, the sun in other latitudes is in the south. Therefore, based on this characteristic, the slopes are divided into five grades. Figure 5 shows the base map of aspect and the weight of aspect has been listed in Table 4.
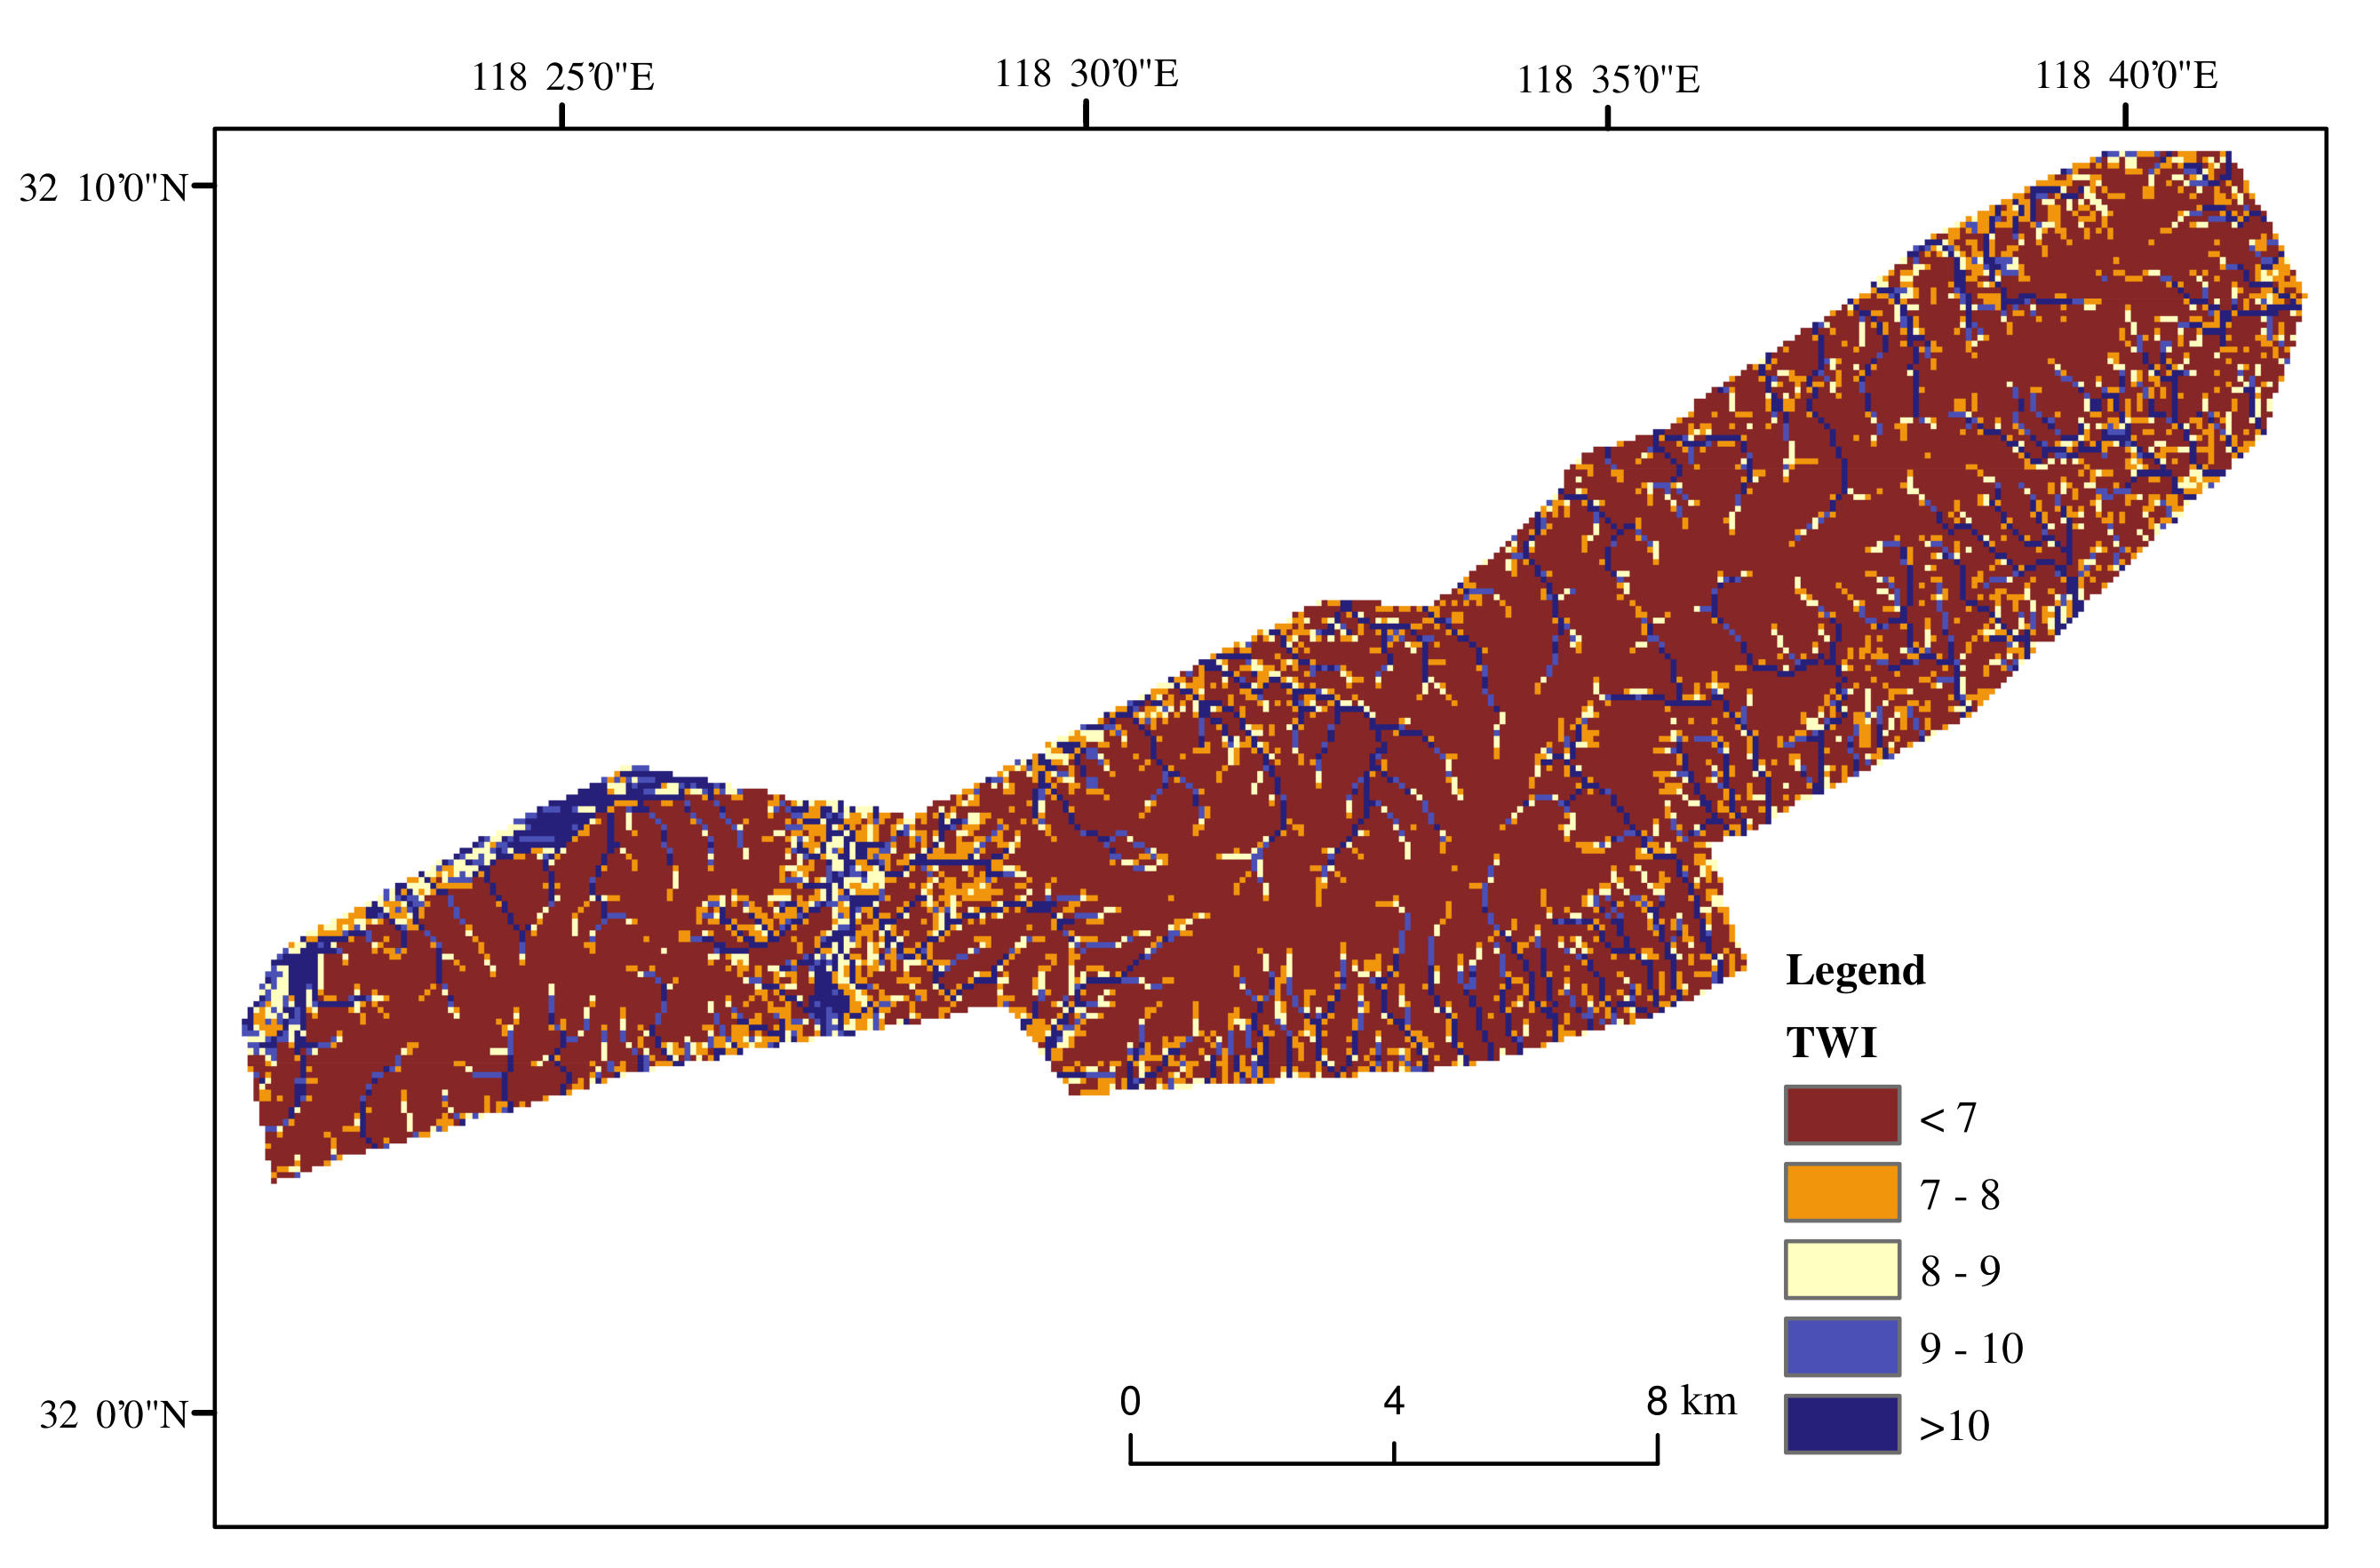
- (d) TWI: TWI is a hydrological analysis of DEM data. It considers the effects of topography and soil characteristics on soil moisture distribution [15]. Firstly, according to the actual topographic needs, the topography of the study area is filled with depressions. After filling depressions, the direction of water flow and the total amount of water flow needs to be calculated. Finally, the topographic humidity index is calculated based on the above-mentioned data. These calculations are completed in ArcGIS 10.5. The topographic wetness index has an important influence on fire occurrence and spread. Dry areas are prone to fire and spread rapidly, while wet areas are hard to cause fires [16,20]. Figure 6 shows the base map of TWI and the weight of factors is listed in Table 5.
3.1.2. Meteorological Factor
Meteorological factor [17] is a significant inducement of fire ignition. The temperature has a great impact on regional hydrology [18]. The high-temperature areas are more prone to fire [19].
Temperature data can usually be obtained from the Meteorological Bureau or extracted by Landsat data. Due to the lack of temperature data in our study area. We use atmospheric correction methods to derive surface temperature data. The infrared radiation is composed of the upward radiation of the atmosphere, the downward radiation, and the atmospheric radiation when it reaches the ground. The infrared heat radiation value can be calculated by the following formula:
where = surface specific emissivity, = blackbody thermal radiation brightness, = the real surface temperature (K), = atmospheric transmittance in thermal infrared band. and are downward radiation and upward radiation, respectively. can be calculated as follows:
where = the function of Planck’s formula.
where , K.
Firstly, it is necessary to calculate the radiometric calibration of remote sensing data. Since the cloud influences the accuracy of remote sensing data extraction, atmospheric correction is needed. Then, we can extract the vegetation coverage, and the surface specific emissivity is calculated by vegetation coverage. Finally, the temperature of the study area is retrieved by the surface specific emissivity and the relative radiance ratio [46,47]. Temperature is retrieved from Landsat-8 by ENVI, and we use ArcGIS 10.5 to construct the base map of temperature. The base map is shown in Figure 7. Table 6 lists the weight of different temperature levels.
3.1.3. Vegetation Factor
There are many trees in the forest, and wood is flammable, so vegetation has a great influence on fire ignition. The moisture content of each vegetation is different, and the probability of each kind of vegetation being ignited is not the same. Therefore, it is necessary to analyze the vegetation coverage in the study area [48,49]. Since it is difficult to obtain the specific types of vegetation cover in the study area, we use as a substitute.
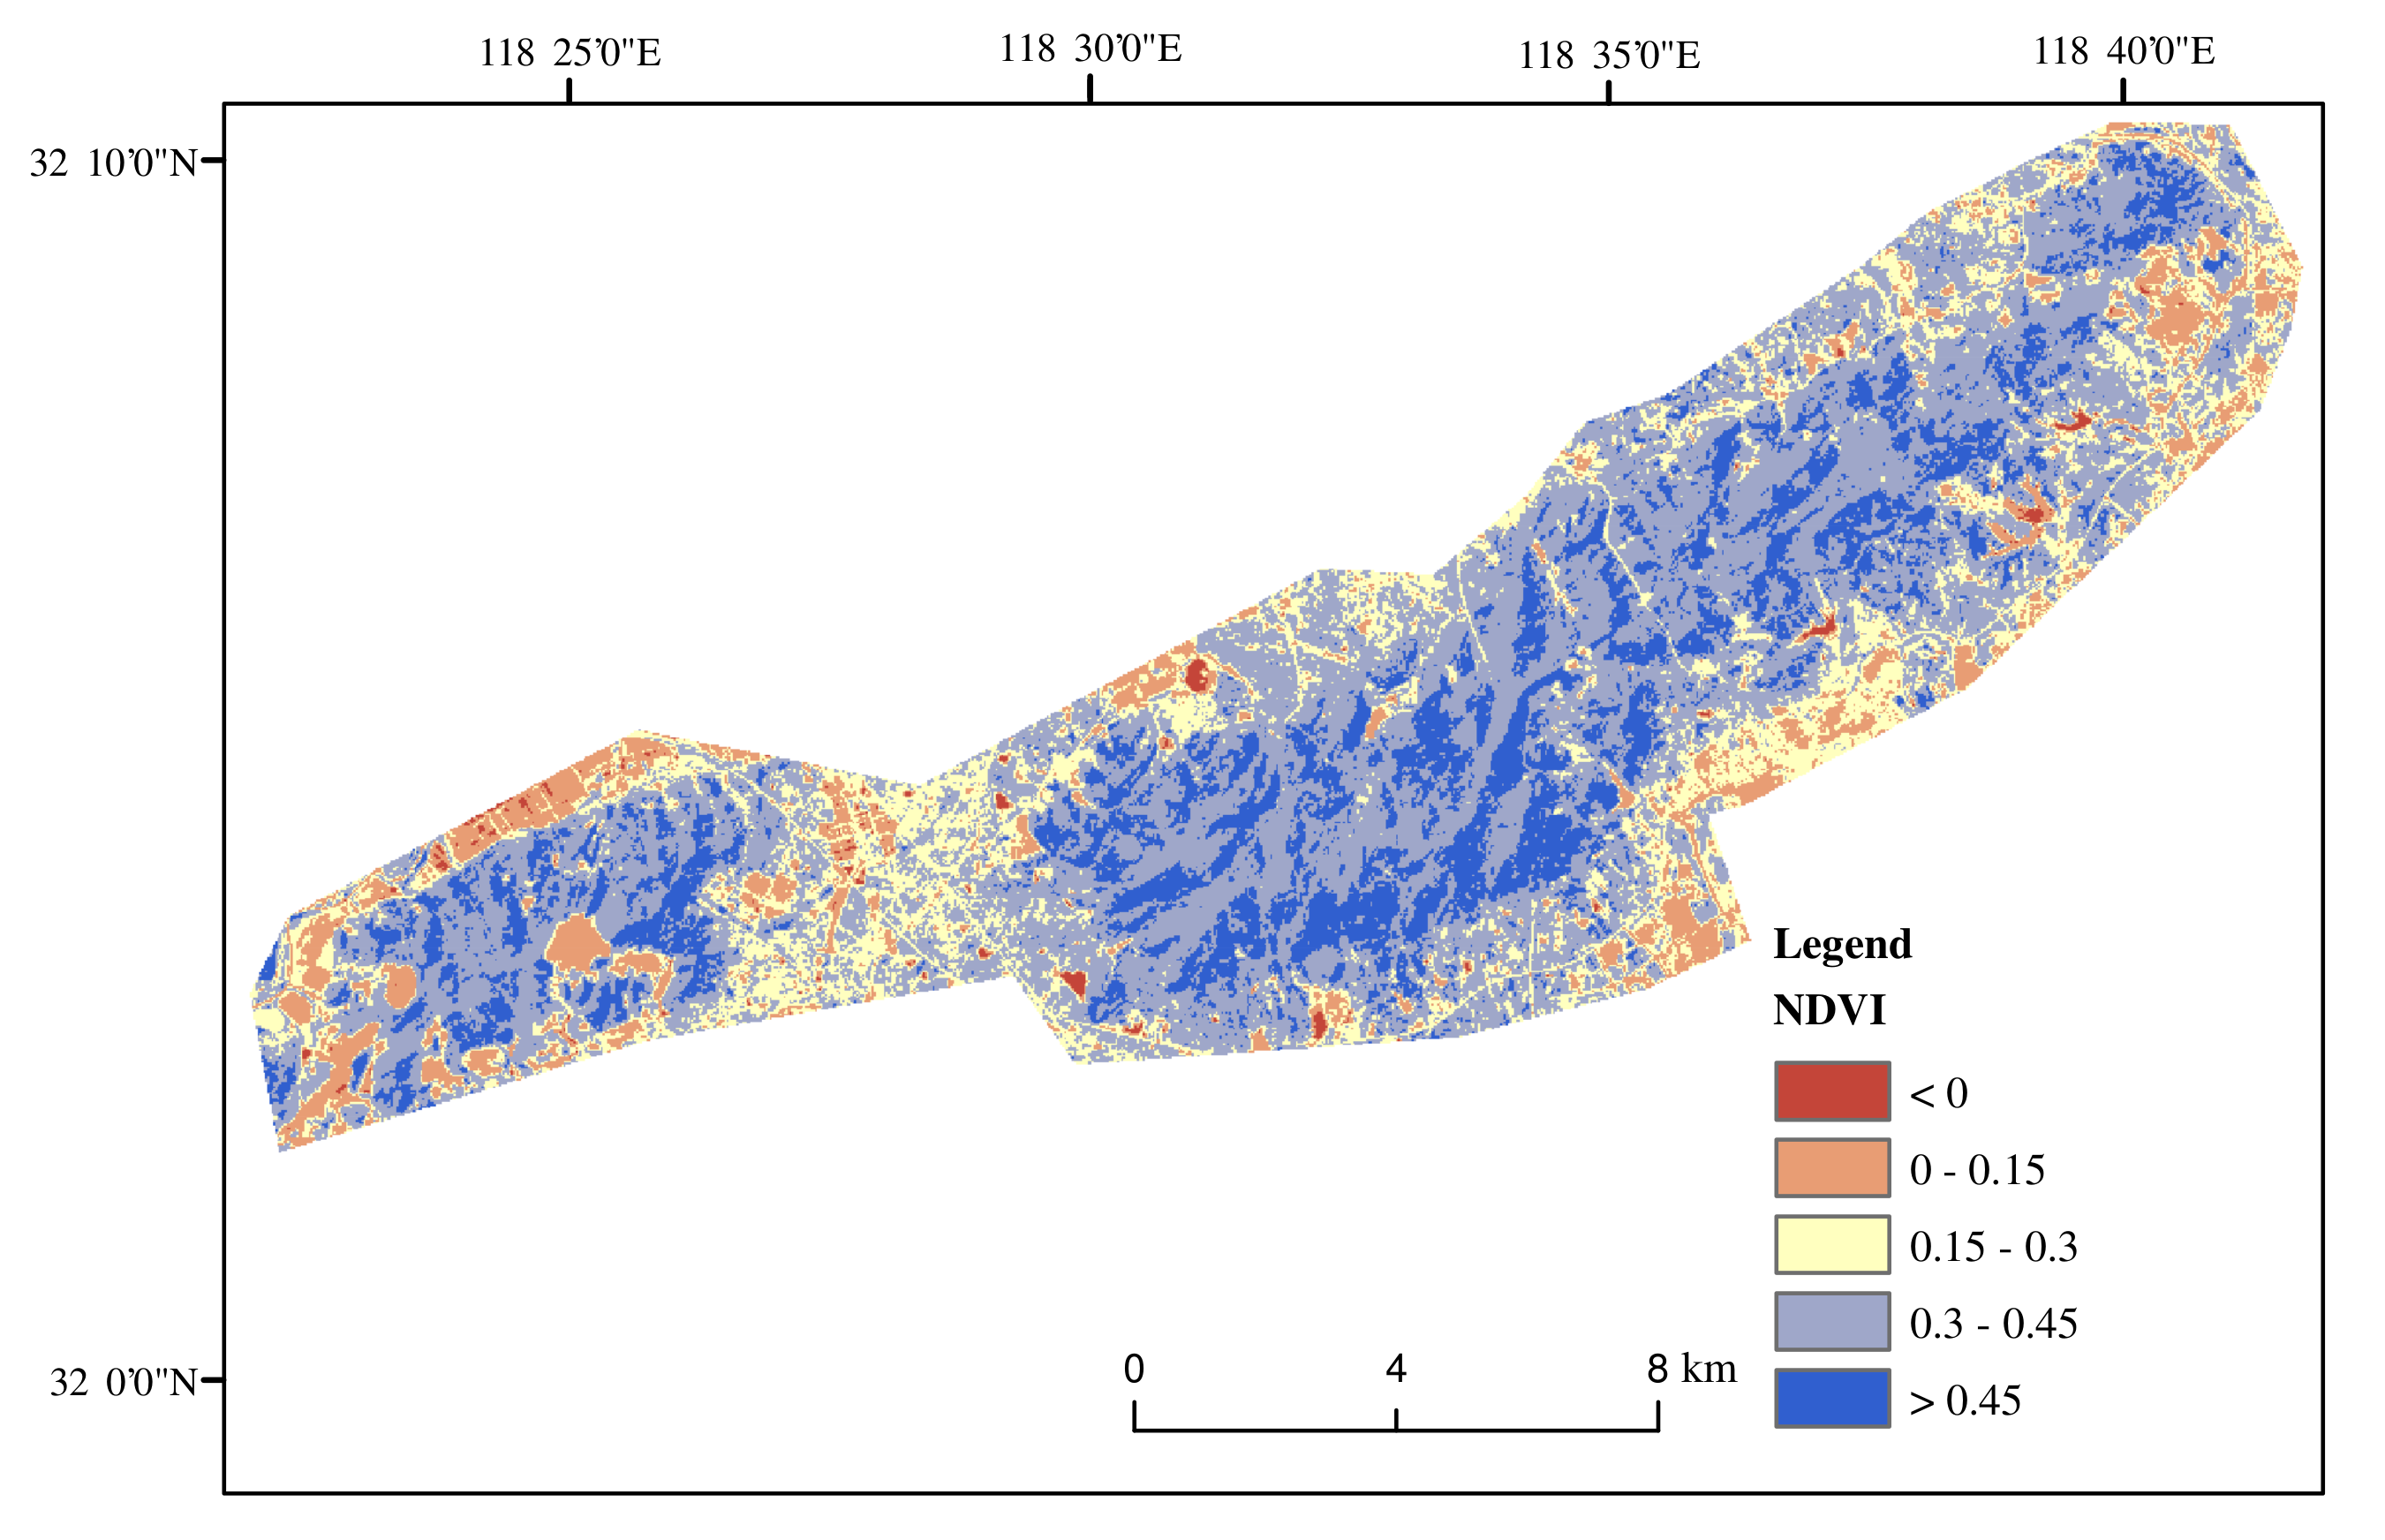
can eliminate the radiation changes related to atmospheric conditions, such as the solar altitude angle, topography, and cloud. The vegetation index is normalized so that the result is between −1 and 1, which can eliminate the excessive fluctuation of the result caused by the large difference in the data. Non-linear transformation can be used to enhance the low-value part of and suppress the high value, and reduce the sensitivity of to areas with high vegetation density. is the best indicator for evaluating vegetation growth and coverage.
We use bands 4 and 5 in Landsat-8 images to extract , and it can be calculated as follows:
where Band 5 is the near-infrared band (0.76–0.9 µm), Band 4 is the red band (0.63–0.69 µm) [20]. According to the classification criteria and weight [20,50], can be divided into the following five levels and the weight is listed in Table 7. The base map of is shown in Figure 8.
3.1.4. Human Activity Factors
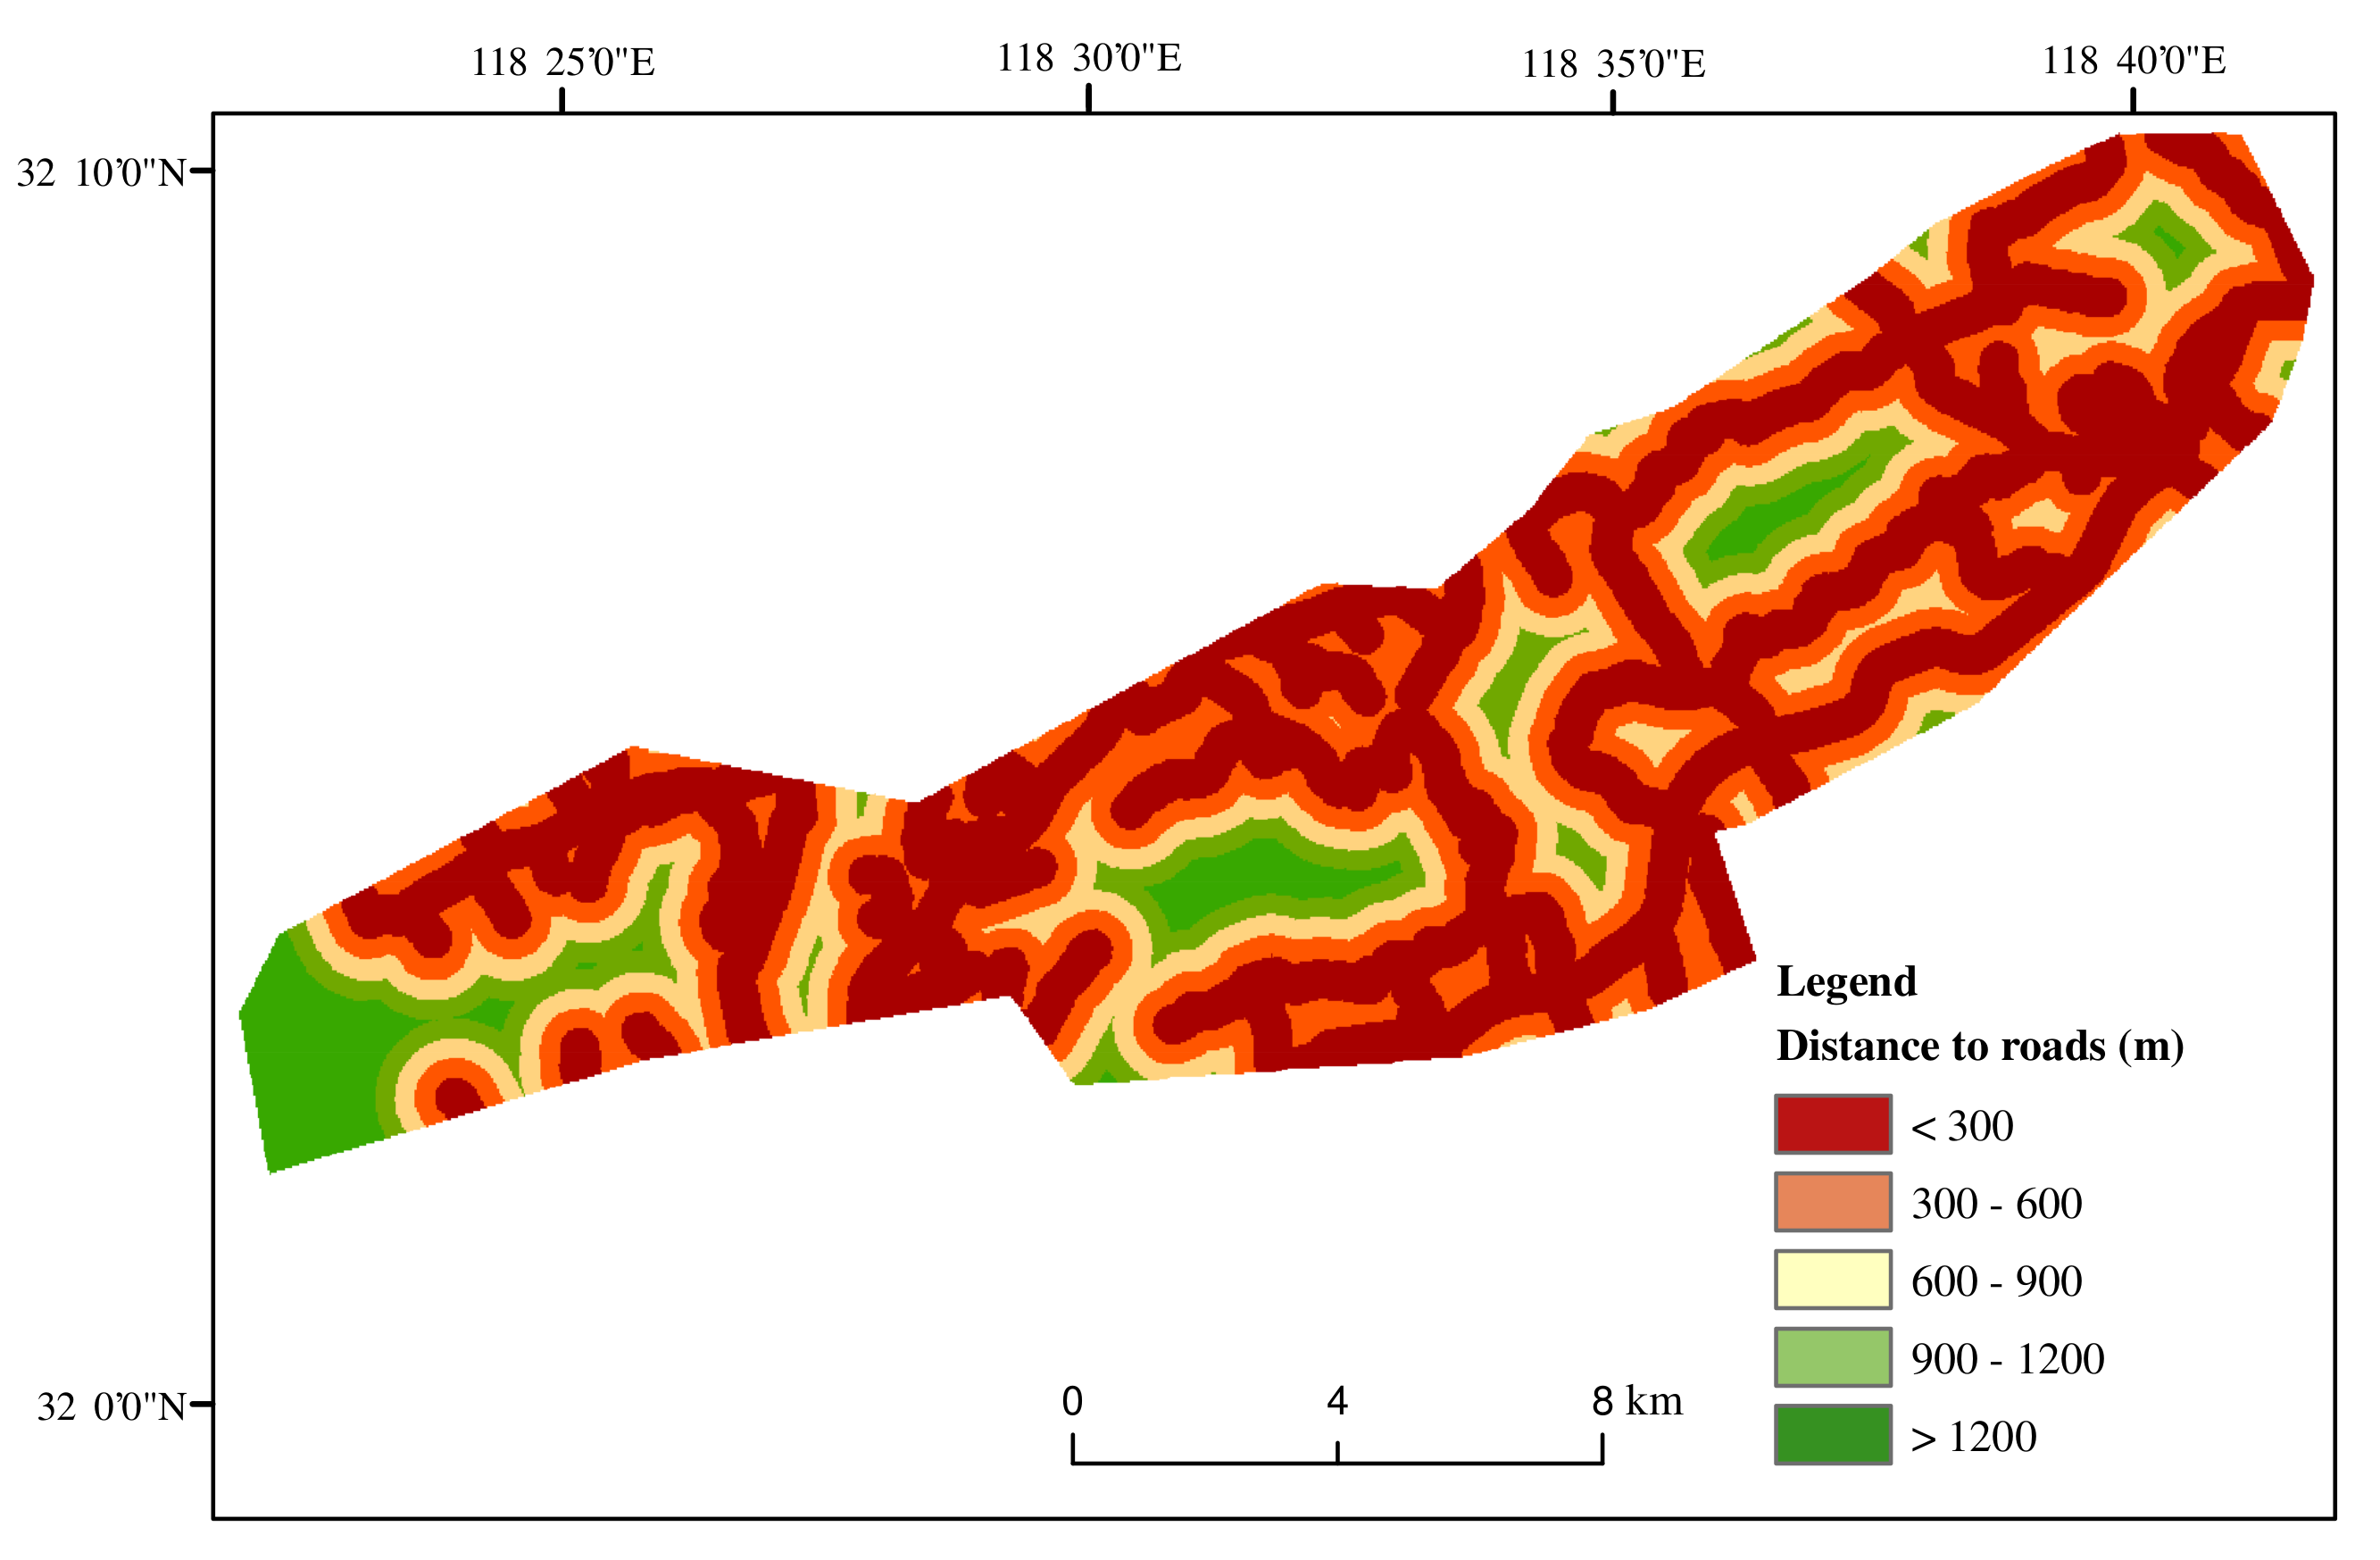
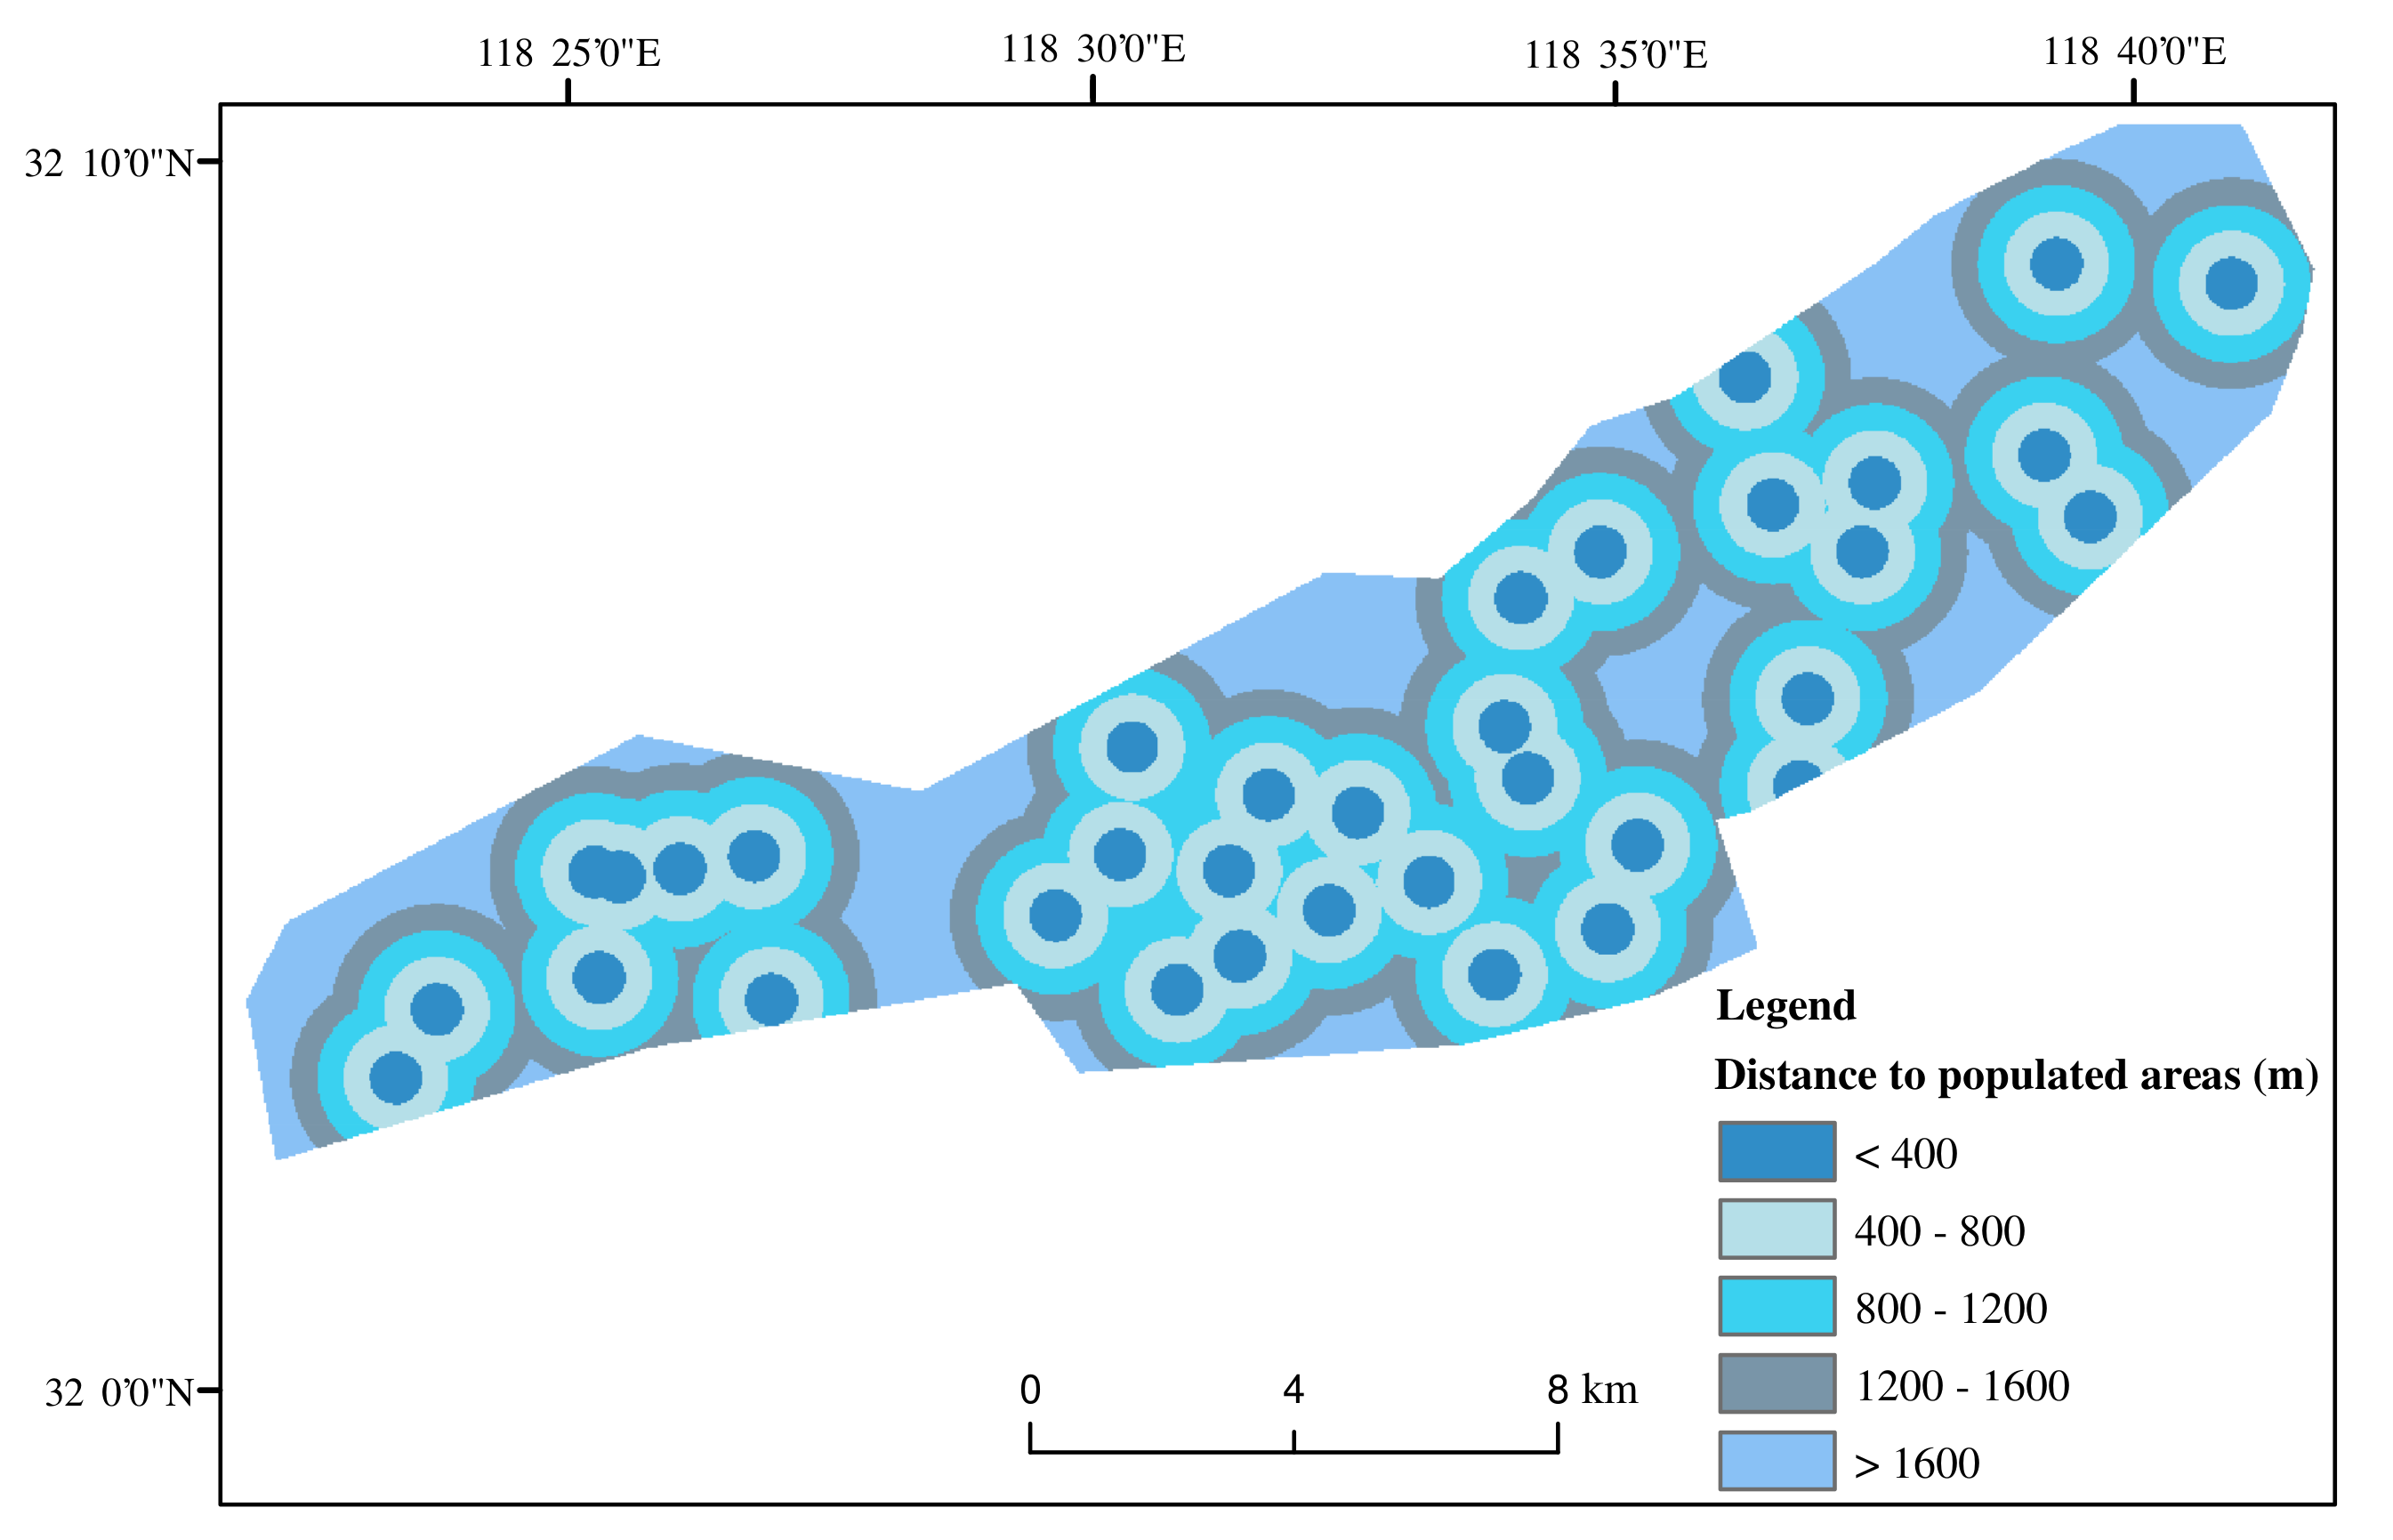
Most forest fires are related to human behavior, cigarette butts thrown by people or residual fires from sacrifices may cause forest fires [23,51]. In tourist spots or populated areas, human activities are prone to generating fire sources that trigger forest fires [20,52]. Therefore, roads and populated areas can be taken as ignition factors. According to previous researches, combined with the actual situation of Laoshan forest park and the layout of roads and population, 300 m is chosen as the distribution limit of road distance, and the closer to roads, the higher the risk of fire. Due to the frequent activities of residents in the populated areas, the affected area is higher than roads, so the influence area of the residence is defined as 400 m. Figure 9 and Figure 10 show the base map of distance to roads and populated areas. The weight of factors is listed in Table 8 and Table 9.
3.2. Generation of Weights for the Fire Risk Model
We choose Analytic Hierarchy Process (AHP) [53] to evaluate the weight distribution of each factor. By prioritizing the importance of each factor and comparing the significance of two factors, the relative significance of each factor and the priority ranking in all factors can be determined. We analyze four types of factors: topography (altitude, slope, aspect, and TWI), vegetation (), meteorological (temperature), and human activities (distance to roads and populated areas). In order to evaluate the impact of various factors on fire occurrence in a more precise manner, we adopted a multi-layer analytic method.
These factors are assembled into a table. Experts analyze the possibility of each factor that can cause a fire based on their research results and cognition. According to the scoring results of each factor in all tables, the weight of each factor is obtained by discussion [54,55]. Finally, we can divide the weight of each factor by all column elements. Then, the mean weight can be obtained, which can be represented as the weight of the factor [8].
Generally, the AHP uses a consistency ratio () to verify whether the calculated weight meets the requirement. It is called consistency verification, and needs to be lower than 0.1. The was calculated as follows [19,56]:
where is the consistency index, is the value of the random consistency index, is a matrix obtained by multiplying a paired comparison matrix and a weight matrix .
4. Result
4.1. Base Layer Classification
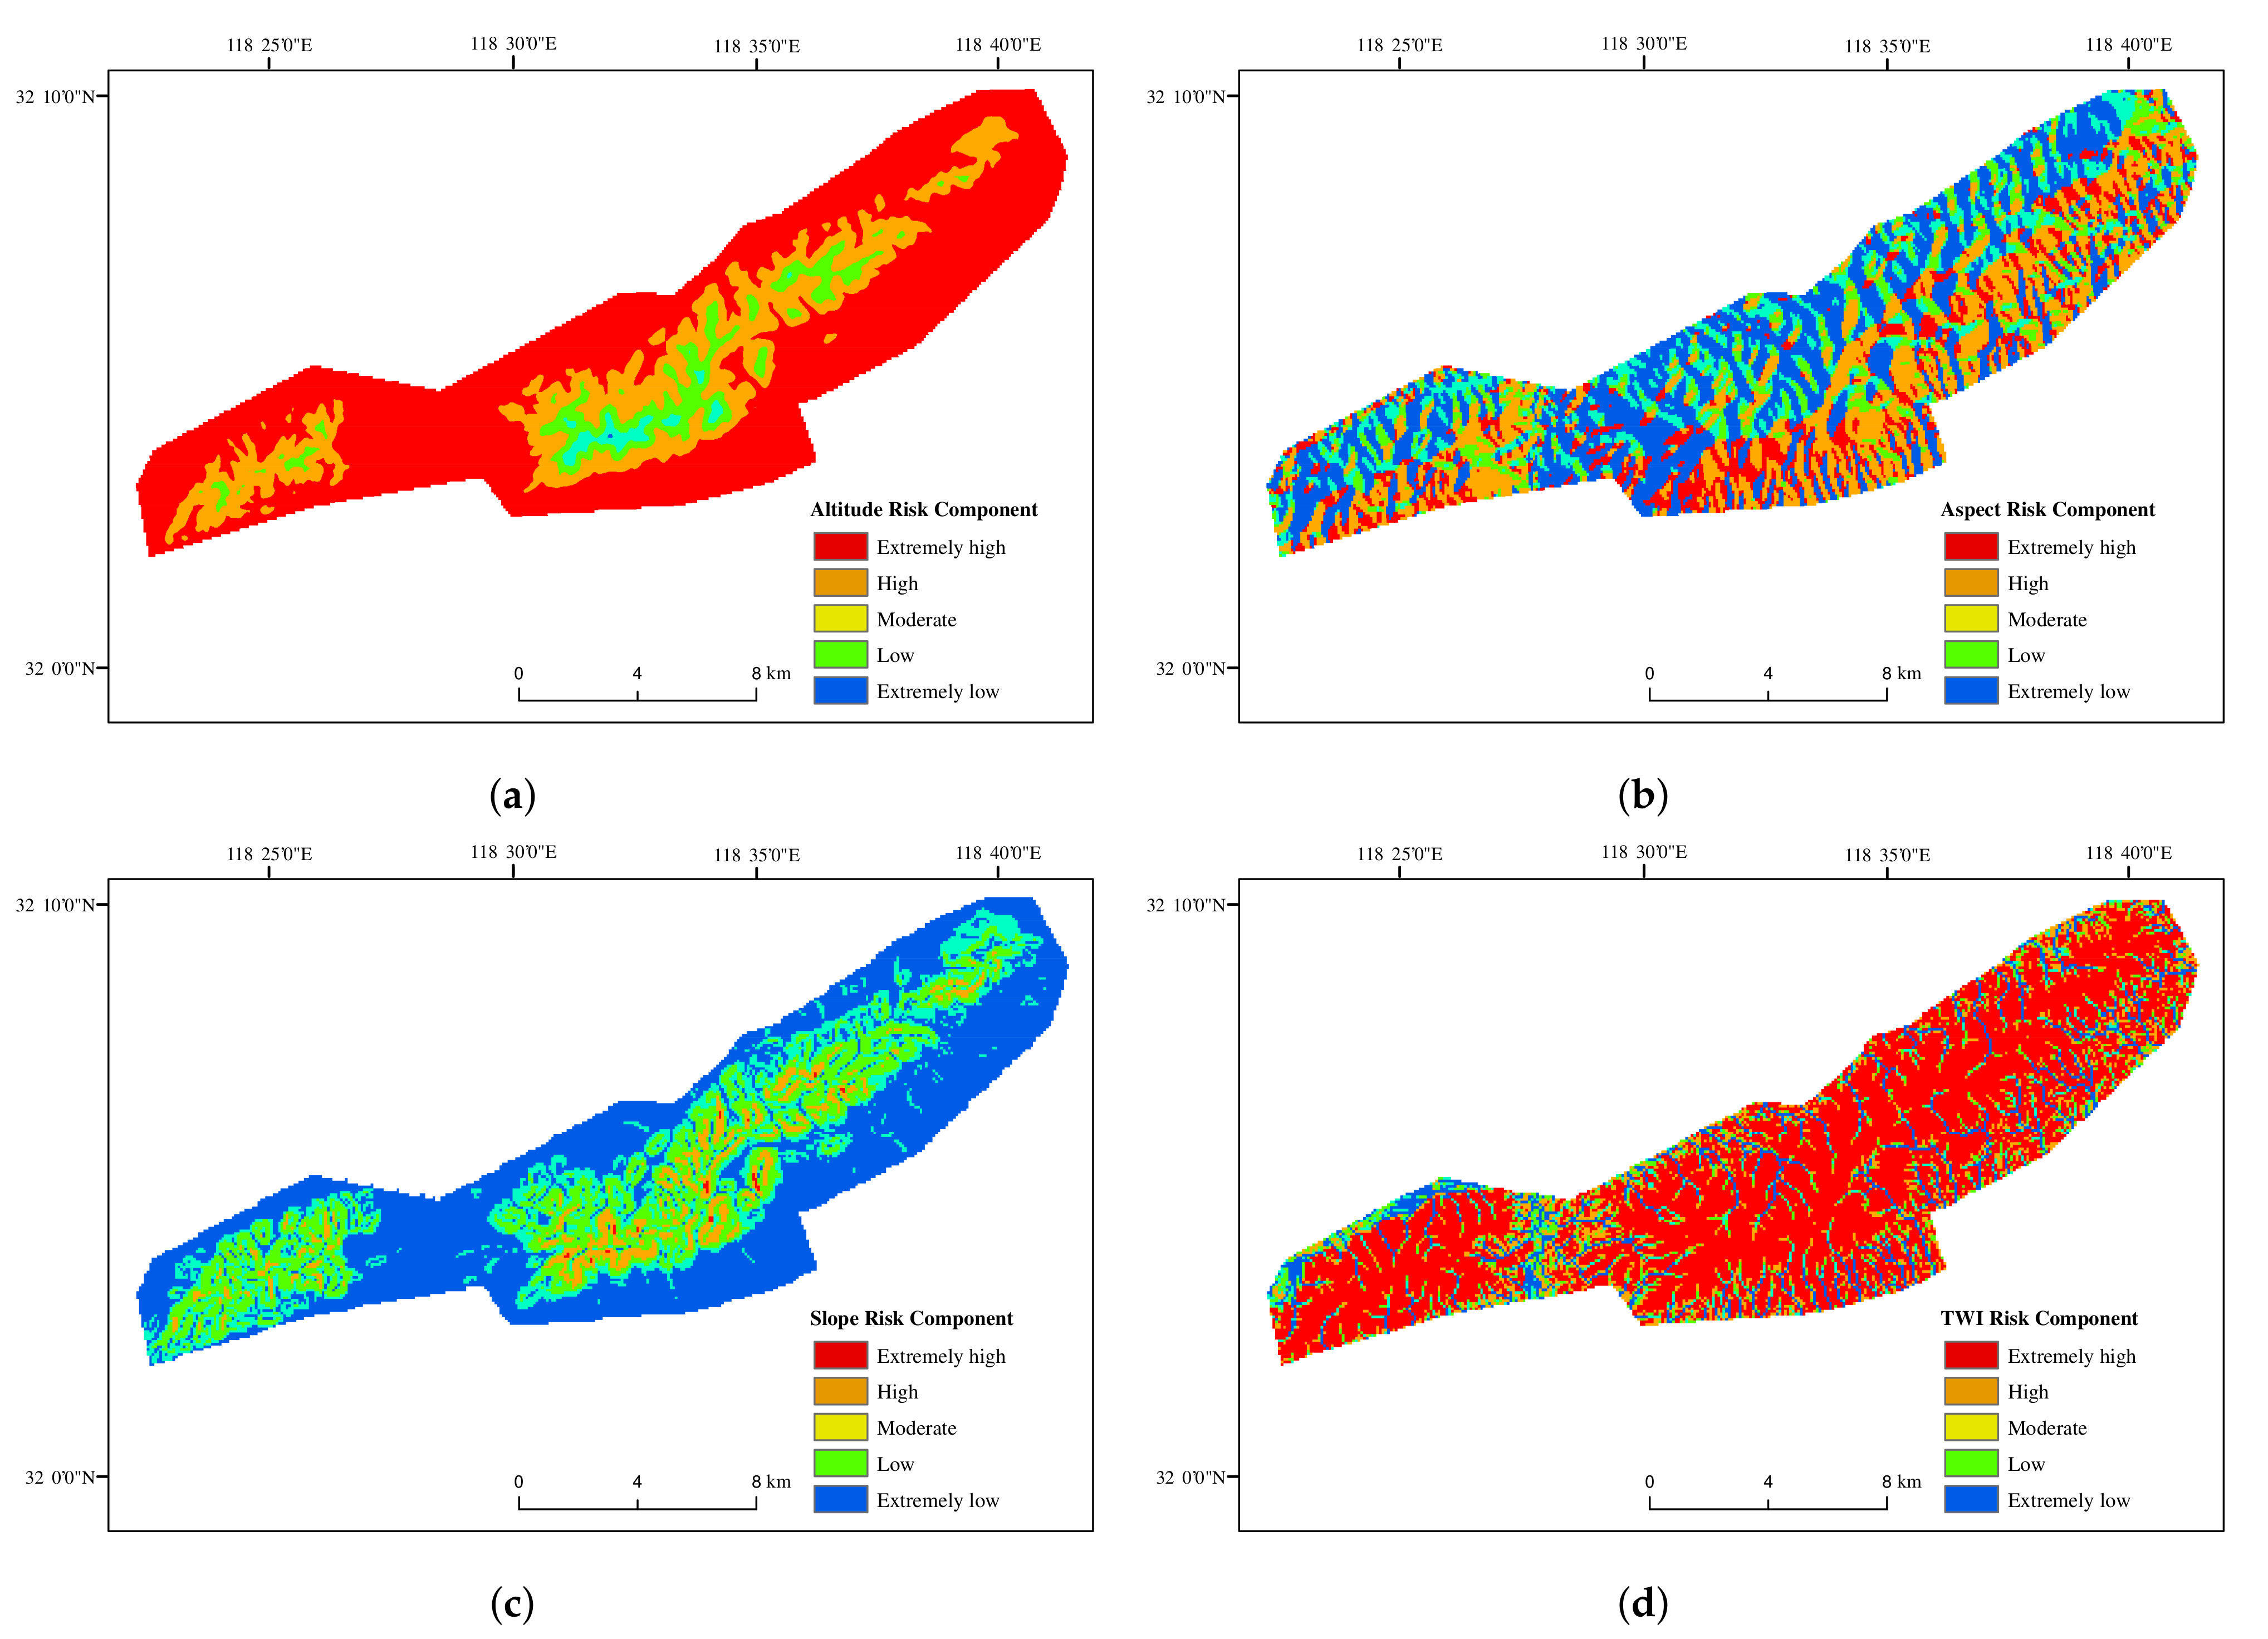
As shown in Table 1, Table 2, Table 3, Table 4, Table 5, Table 6, Table 7, Table 8 and Table 9, the weight of eight factors can be divided into five levels which range from 1 to 5. The five levels correspond to the risk level of extremely low, low, moderate, high, and extremely high, respectively. We can obtain the base layer of each factor based on the base maps and risk classification. As shown in Figure 3, areas with an altitude of lower than 300m account for 70% of the study area. Meanwhile, this area contains the populated areas and tourist spots. Thus, it is at high risk; see Figure 11a. Figure 11b,c show the base layer classification of aspect and slope, respectively. It can be seen that most of the steep areas are at a place which has a high elevation, and the surrounding areas are flat, the maximum slope of these areas is . As the terrain of Laoshan National Forest Park is relatively flat and there are few steep areas in high-risk areas, it can be seen from Figure 11c that most areas are in low-risk level. Laoshan park is located in the northern hemisphere, and the south side is easier to receive sunlight. Thus, the water content of vegetation is less, and the temperature is higher, so areas in this direction are at high-risk level. TWI is a hydrological analysis of DEM data, it considers the effects of topography and soil characteristics on soil moisture distribution. The higher the TWI, the higher the moisture content in the soil, the more humid the land, the lower the probability of fire triggering. Therefore, the fire risk of area where has high TWI is low. It is shown in Figure 11d.
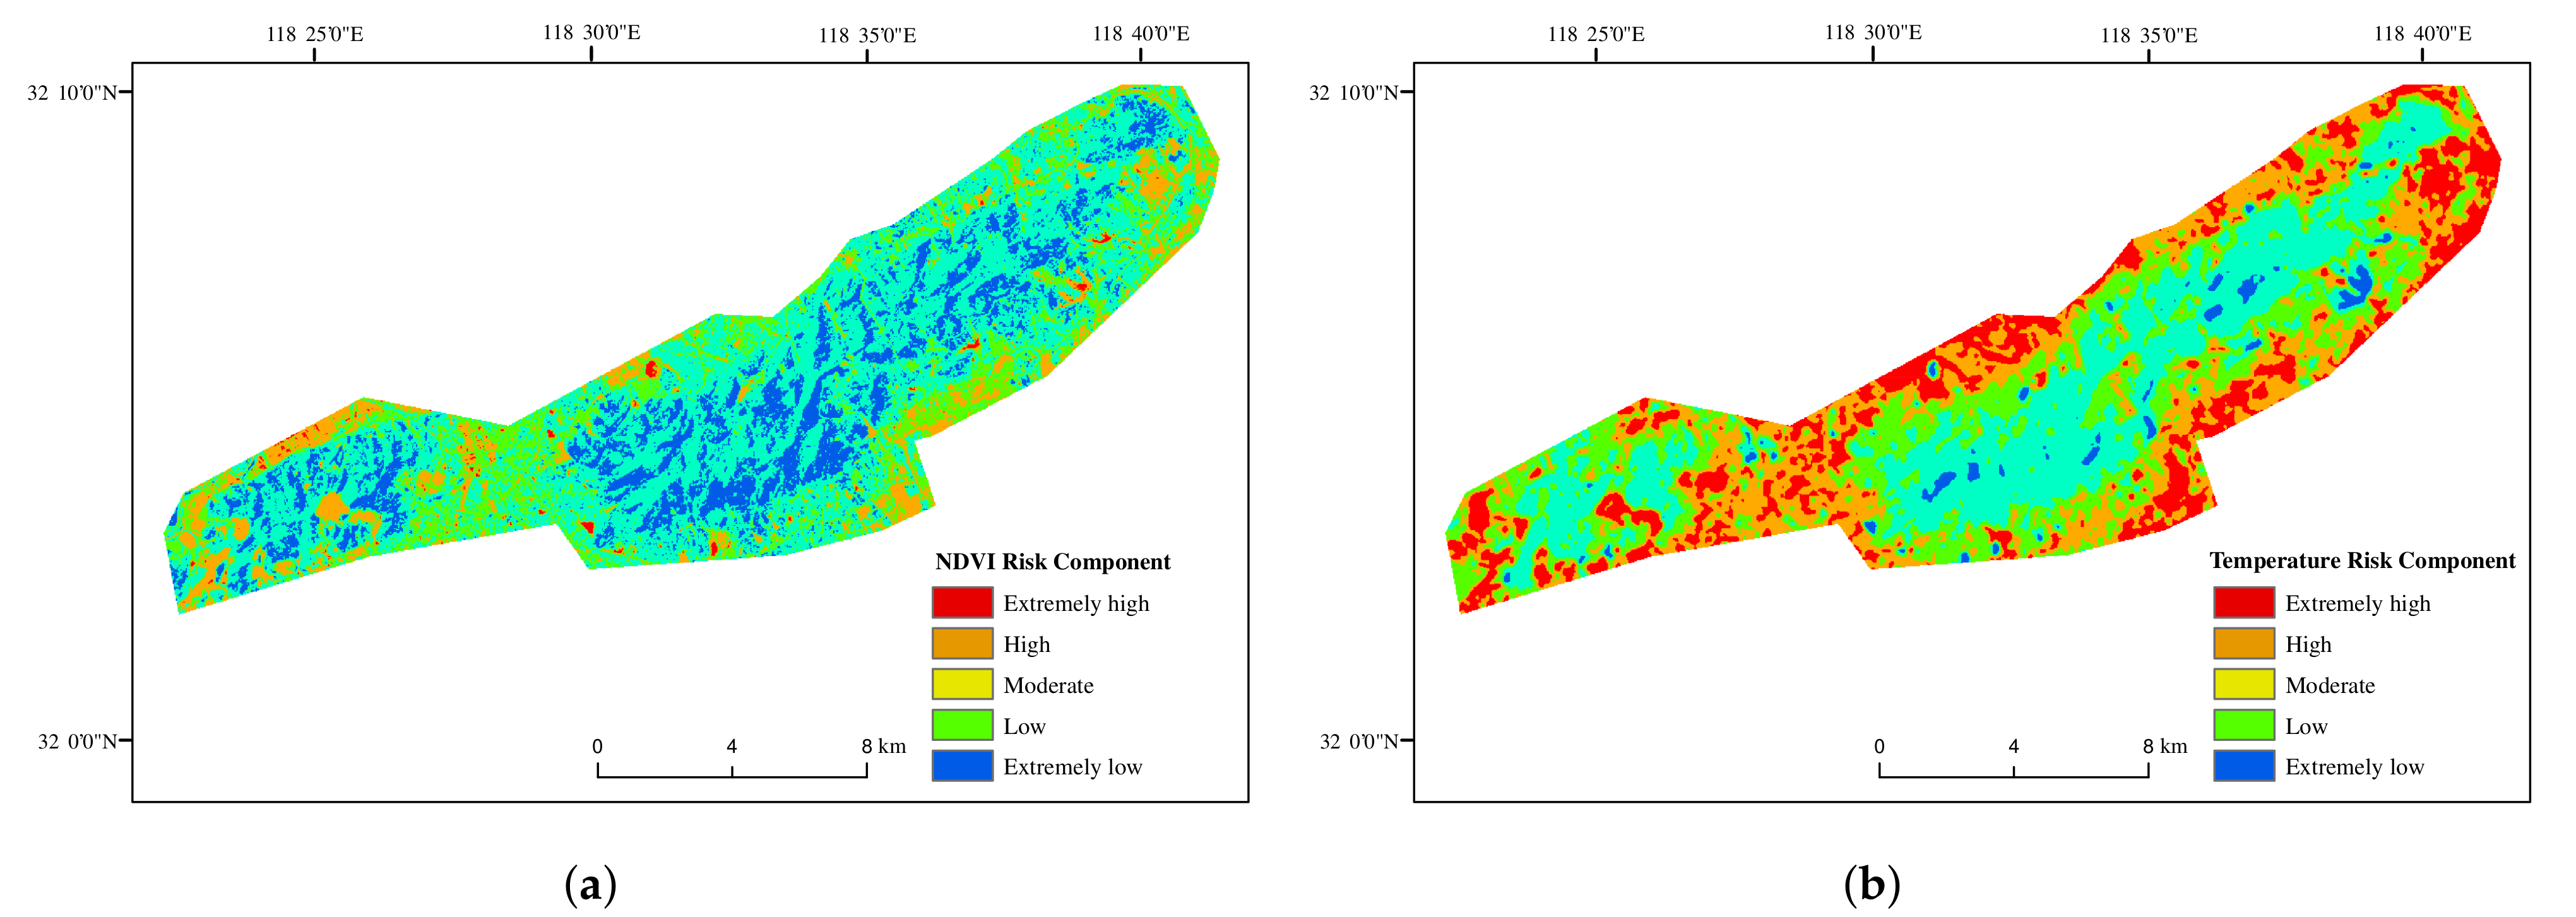
is the normalized vegetation index, with a value ranging from −1 to 1. A value less than 0 means that the area is covered by water, snow, etc. If is 0, it indicates that the area is covered by rocks and bare soil, and a value greater than 0 means that this area is covered by vegetation. The higher the vegetation coverage, the greater the value. The central part of Laoshan National Forest Park is a forest area with full vegetation coverage, which is shown in Figure 8. The marginal areas of the central rear are roads and populated areas, so the vegetation coverage is low. Thus, the fire risk of this area is high. The base layer is shown in Figure 12a.
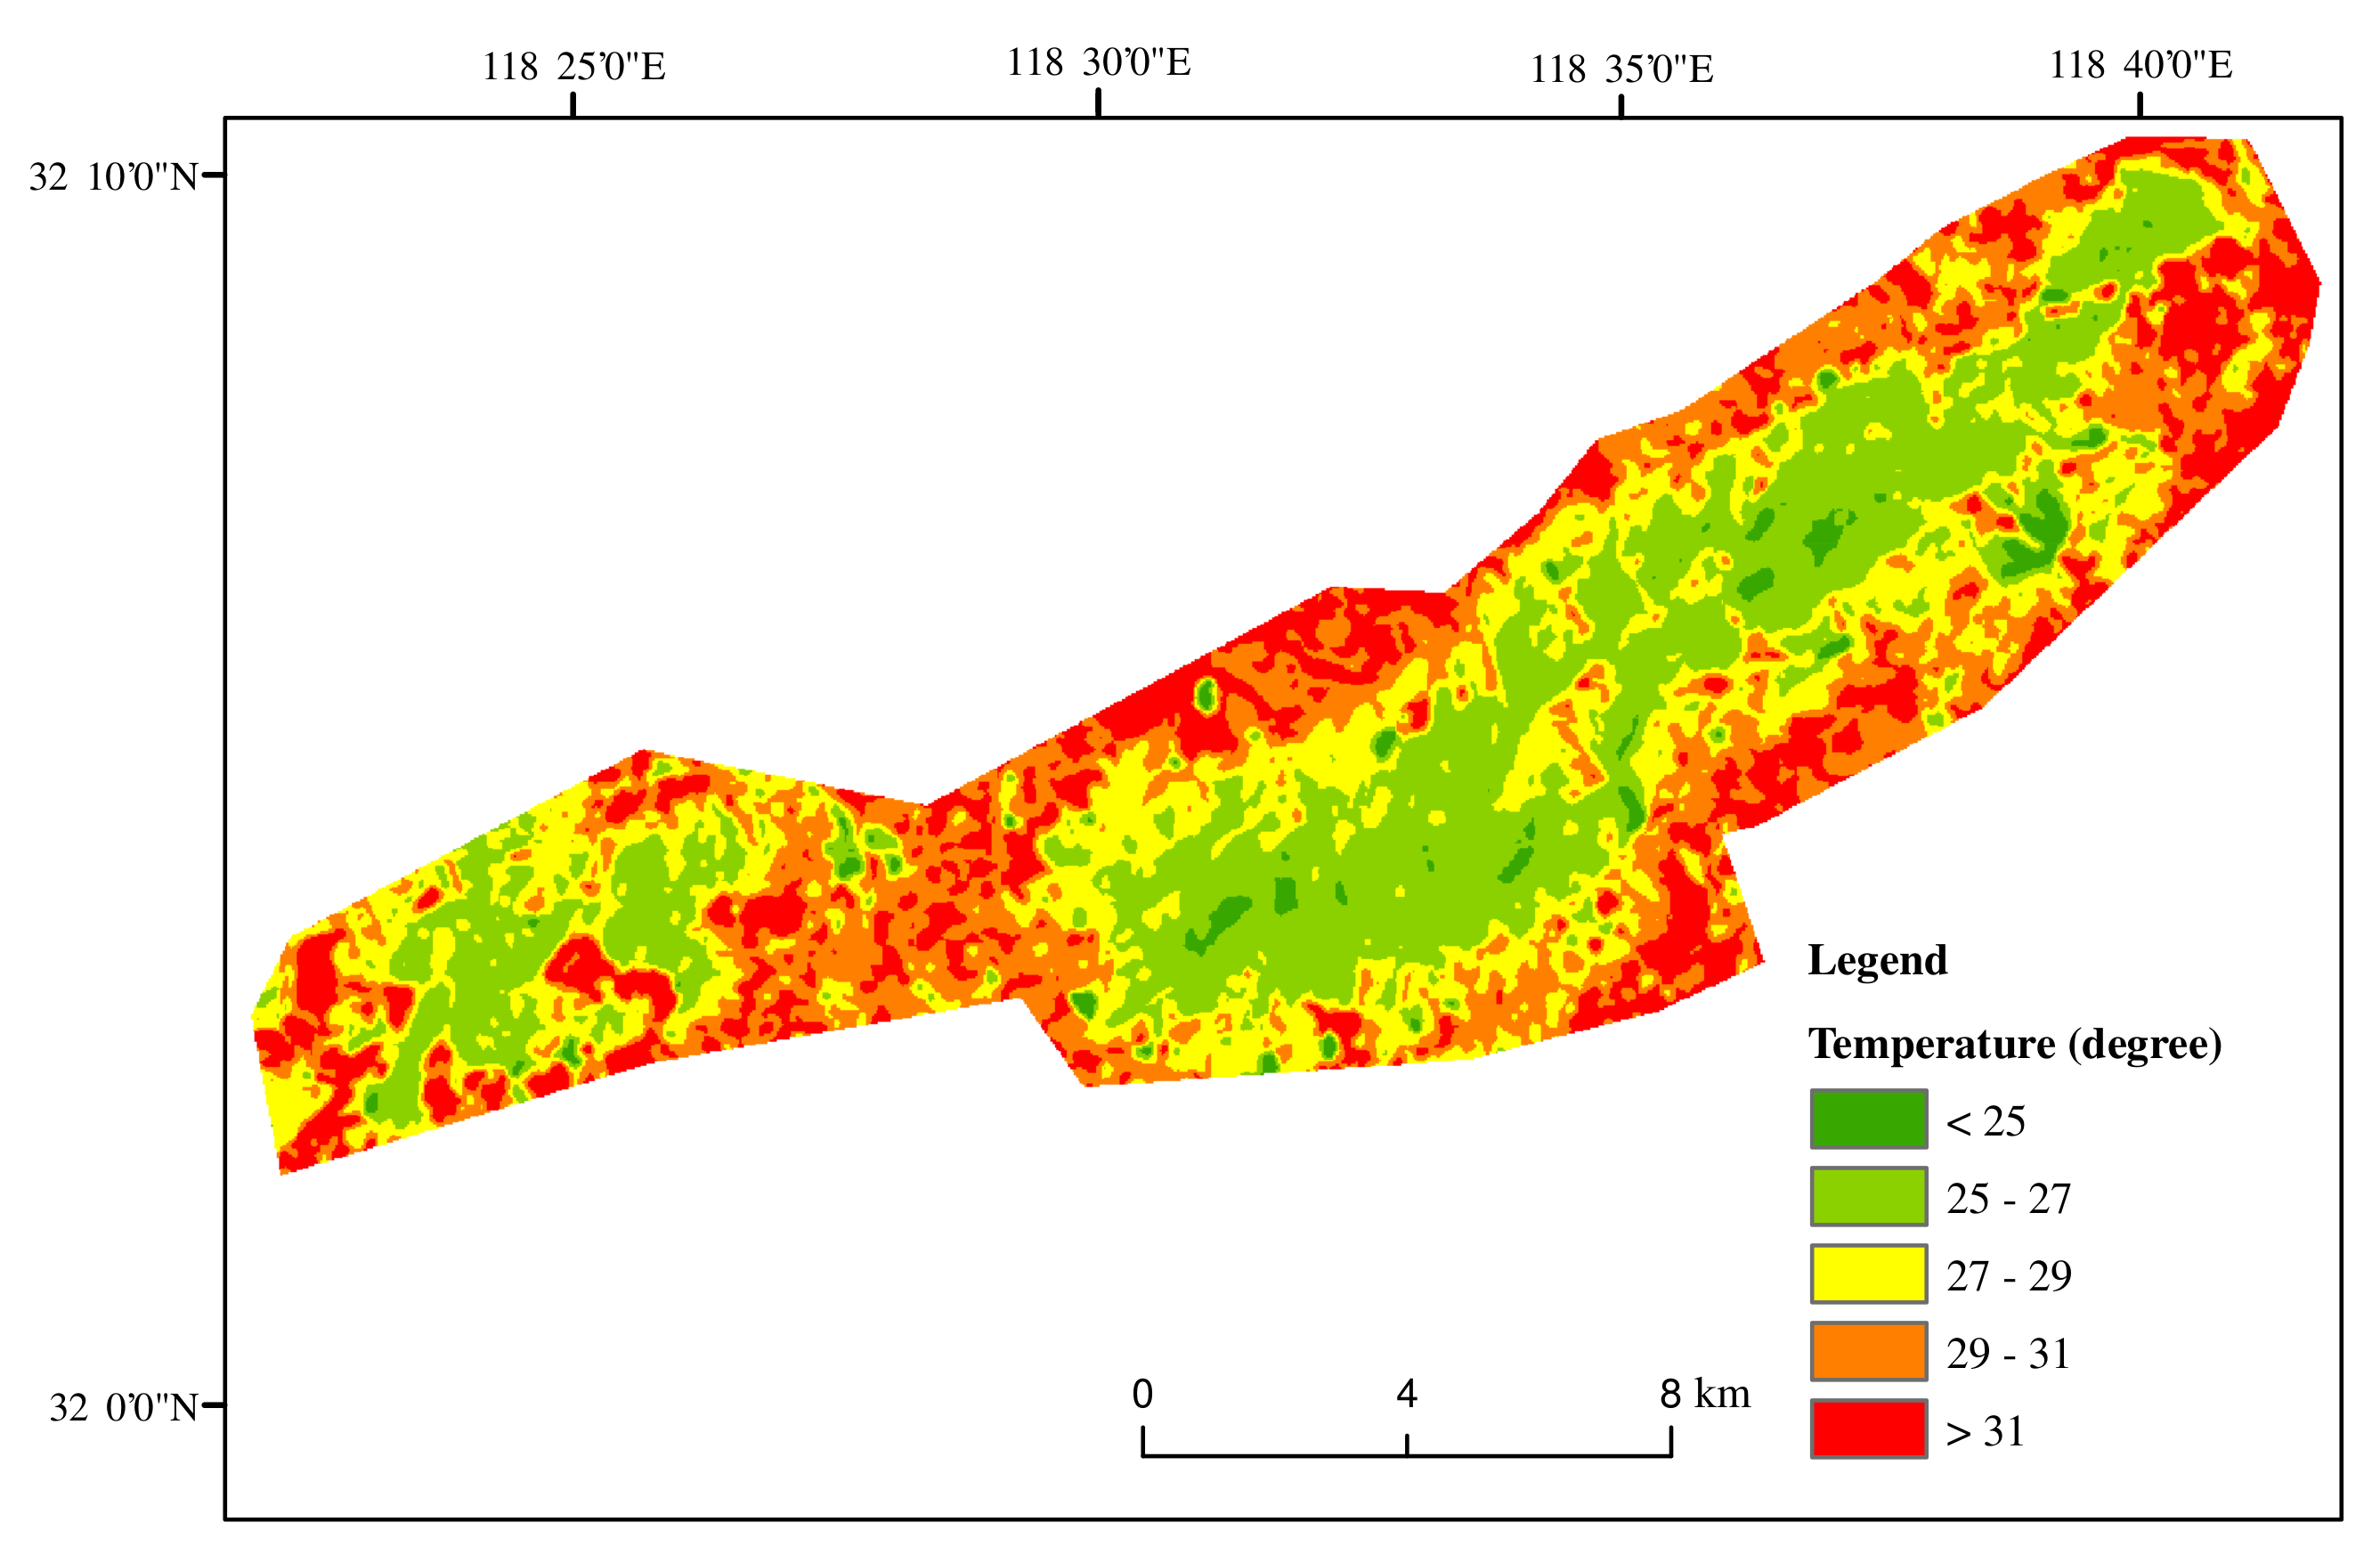
Temperature is one of the significant factors which can cause forest fires. Compared with cold areas, tropical areas are more prone to forest fires. Laoshan National Forest Park belongs to subtropical monsoon climate. Its average annual temperature is . Higher temperature can easily cause forest fires. We can know from Figure 7 that the temperature over of this areas is close to 50%. Therefore, the fire risk in Laoshan park is high. According to the temperature division in Figure 7, we divide the risk level of temperature in this area into five levels, and the distribution result is shown in Figure 12b.
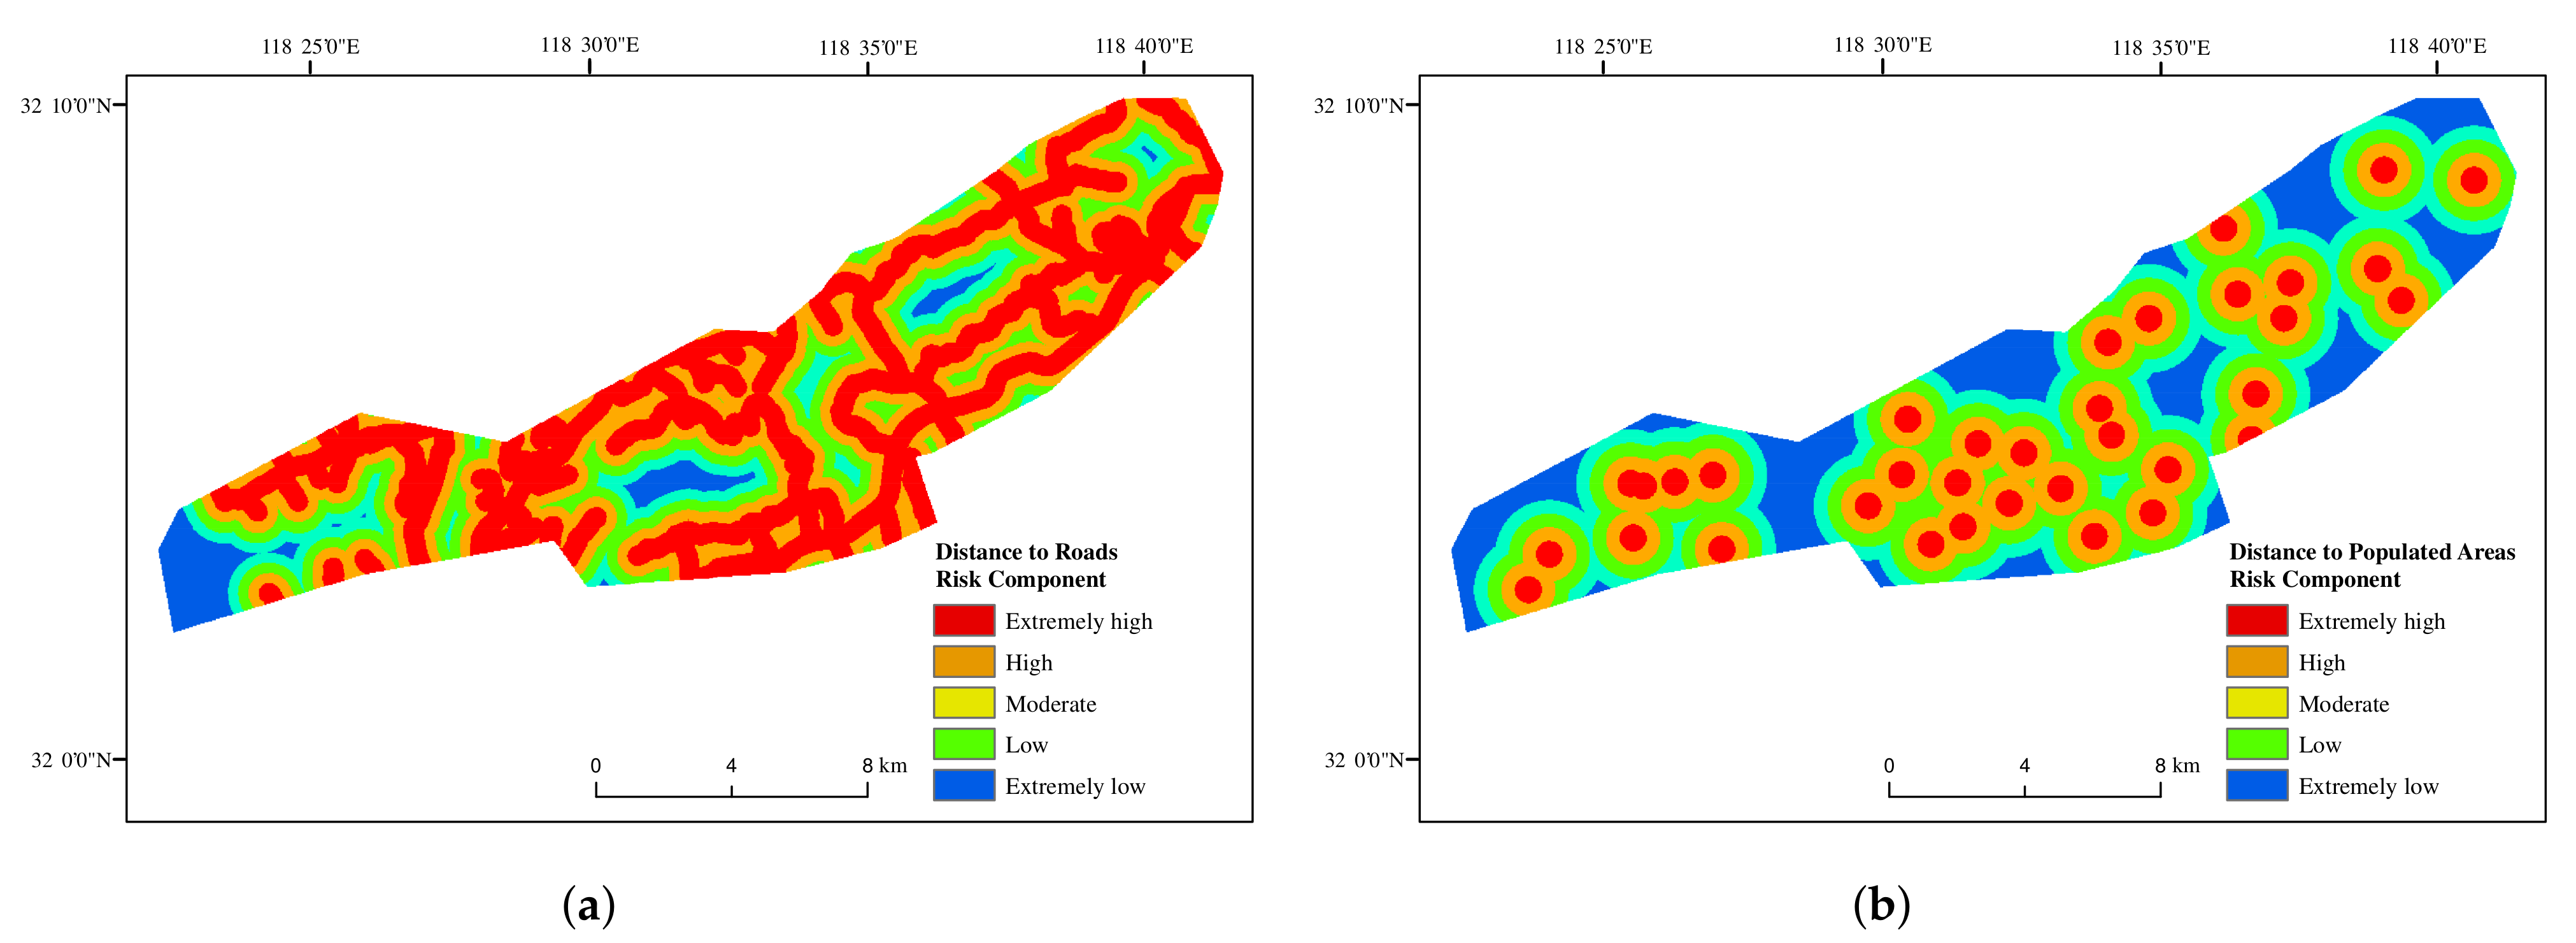
Human activities are one of the important causes of forest fires. Human activities, such as cigarette butts thrown by pedestrians near the roads, burning incense, etc., are likely to cause unintended forest fires [12,20,23]. Therefore, forests close to roads and human settlements will increase the risk of forest fire occurrence. In this study, we simplified human activities as the distance between forests and roads and populated areas. Figure 9 shows the main roads in Laoshan, and is split into five levels according to the distance to roads. The closer the distance, the more vehicles and frequent human activities, which is easier to cause fires. Based on the actual situation of Laoshan National Forest Park, we choose 300 m as the threshold for dividing the road distance. Most human activities areas are not more than 1200 m away from the road, so this division method is reasonable in this area. The base layer classification of Figure 9 is shown in Figure 13a. Figure 10 is an example based on the distance between the forest and the populated areas. The areas with a distance of less than 400 m in Figure 10 are mostly scenic spots in the forest park where human activities are frequently. Cigarette butts and sparks from burning incense are easy to ignite the surrounding forest. The areas with a distance greater than 1600 m, most of these areas are densely forested areas with less human activities, so the risk of fire is lower. Figure 13b is the fire risk analysis of Figure 10.
4.2. Forest Fire Risk Model of Laoshan
In Section 3.2, we have proposed the method which is used to construct the fire risk model—AHP. AHP mainly uses the score proposed by experts to determine the importance of fire risk factors. Then, we use the importance matrix to calculate the weight of each element. The paper divides eight elements into four types. We firstly score and weight the factors in each type, and then determine the weight of each type. Finally, we can obtain the final weight of each factor. Then the fire risk model can be constructed with the weight.
Table 10 shows the weight allocation of each factor in a type. DTP is Distance To Roads and DTR is Distance To the Populated areas. Table 11 shows the weight determination of each type.
After the weight we have obtained from Table 10 and Table 11, the weight of each factor can be obtained by combined these two tables. The results of the weight are listed in Table 12.
For verifying whether the weight of each factor in Table 12 meets the consistency requirement, it is necessary to calculate the . The of our research was 0.0263, which is lower than 0.1. Thus, the weight of each factor in Table 12 is reasonable.
After the weight of each factor is determined, the model can be obtained [57]. The of the study area is as follows:
where = Aspect, = Slope, = Altitude, = Topographic Wetness Index, = Distance to roads, = Temperature, = Distance to populated areas, = Normalized Difference Vegetation Index.
All matrix images are computed by generating data weight and map algebra of GIS, the development of this model utilizes the matrix image and mathematical model. The weights of different variables are obtained, and the appropriate mathematical model is established by the classification and processing of matrix images and the hierarchical analysis of factors. Finally, based on the model, we can get the forest fire risk map of Laoshan.
It is similar to the classification of the previous single factor, we also divide the map into five risk levels: Extremely low (0–0.2), Low (0.2–0.4), Moderate (0.4–0.6), High (0.6–0.8), Extremely high (0.8–1).
Although this fire risk model is developed for Laoshan National Forest Park, these factors can be adapted to other areas with similar topography and climate conditions. However, in different regions, the topography and climate have unique characteristics, so the relevant importance matrix requires to modify based on its specific requirements.
4.3. Generation of Forest Fire Risk Map
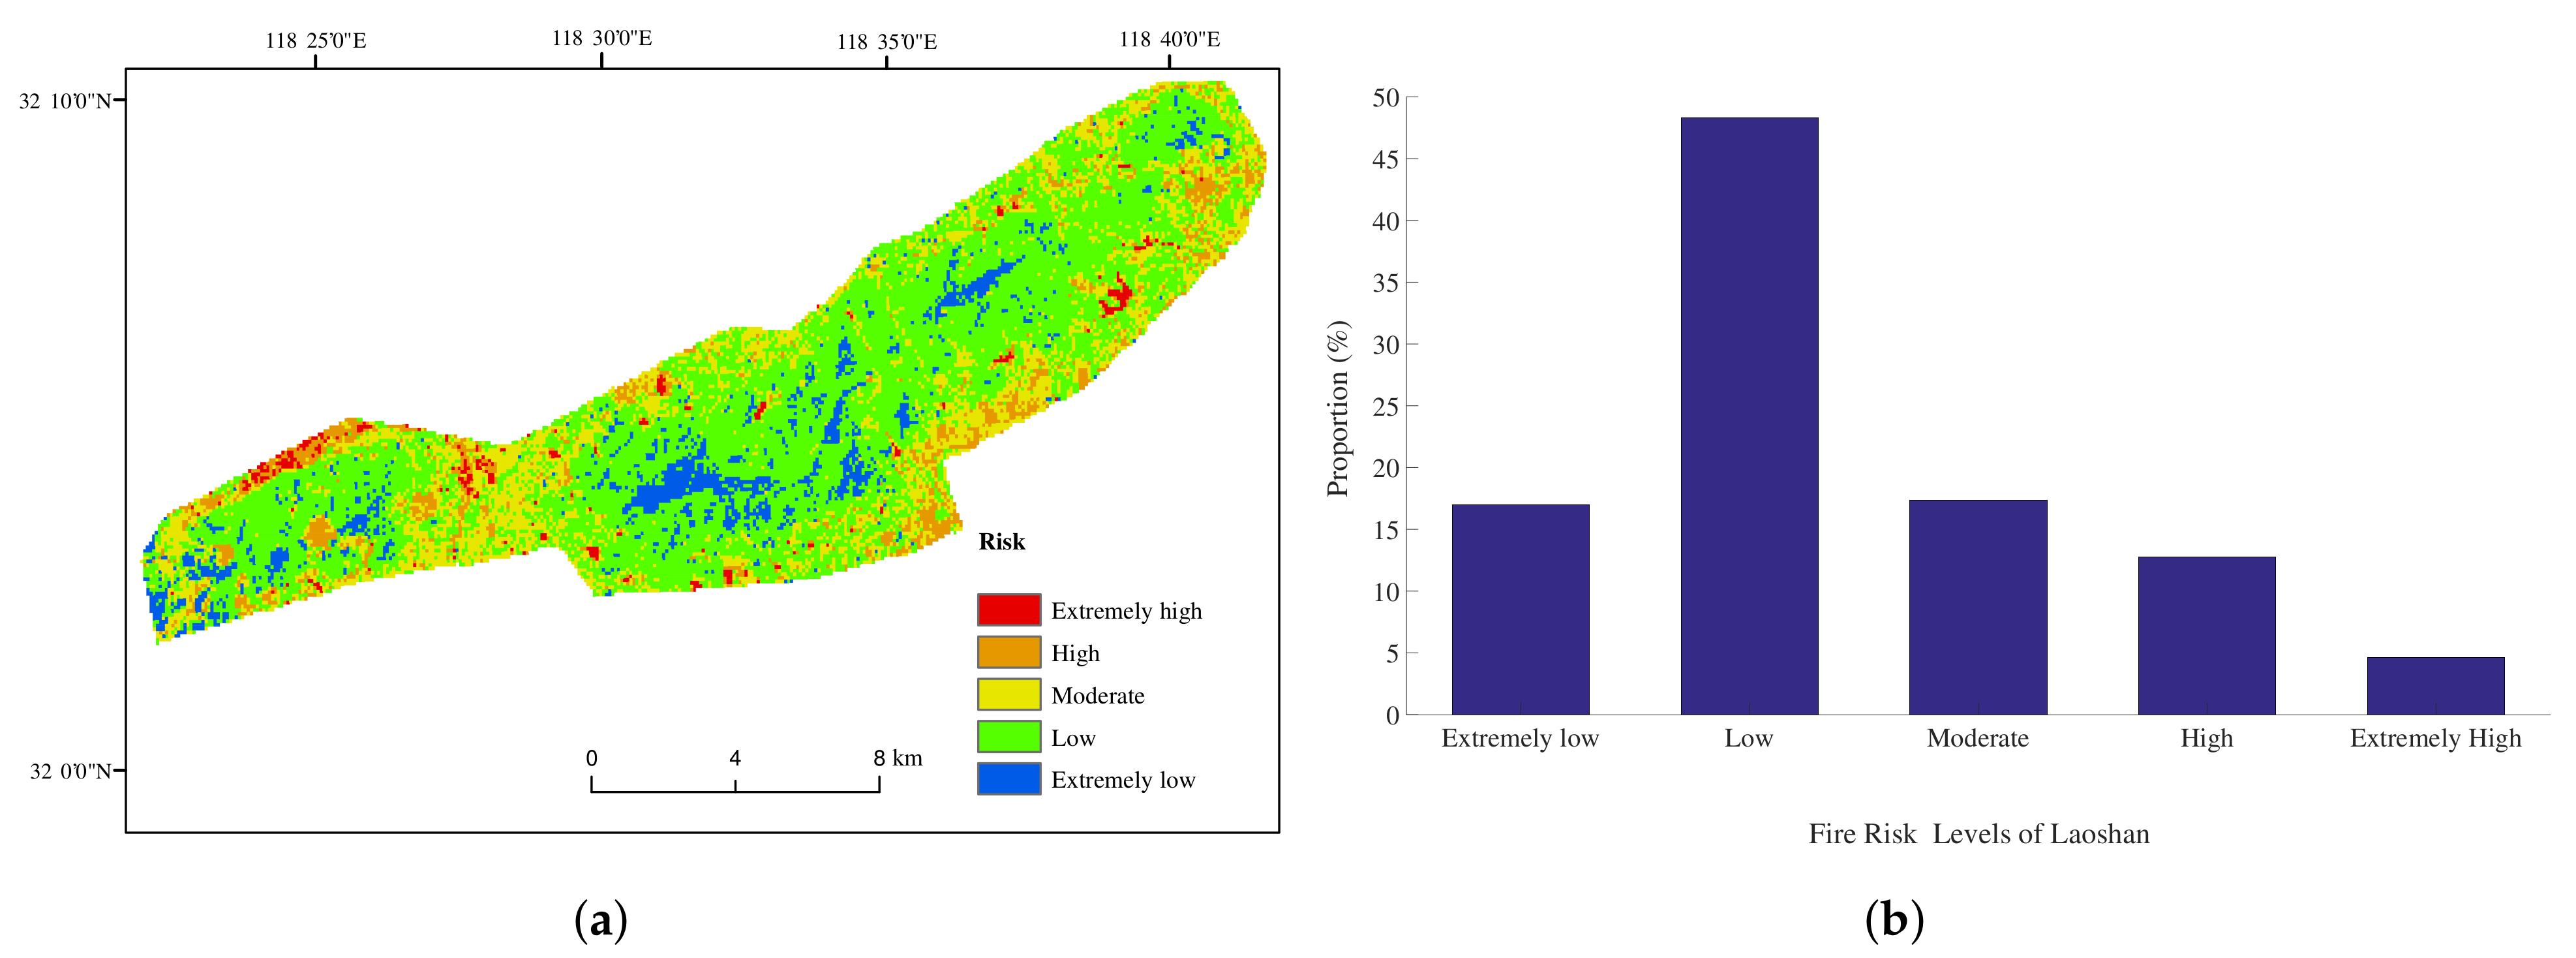
The forest fire risk map of Nanjing Laoshan National Forest Park is shown in Figure 14a. Comparing Figure 7, Figure 8 and Figure 14a, we can find that the area with high fire risk has higher temperature and lower vegetation coverage and the surface water content in this area is lower. It can also be seen from Table 12 that the weight of these three factors is large, this means that these three factors account for a larger proportion in the fire risk model of Laoshan.
As can be seen from Figure 14b, the area of low risk accounts for 48.32% of the total area. High risk and extremely high risk areas cover about 17.36% of the total area. Thus, more fire prevention resources need to be allocated to the high-risk areas so that we can respond to possible fires in a timely manner.
4.4. Validation of Forest Fire Risk Map
To verify the accuracy of the generated fire risk map, we extracted historical fire points from MODIS data from 04.19.2013 to 09.25.2016. Total 304 fire points were extracted. Then, we conduct the crossing between the areas of the fire risk map obtained by the fire risk model with the heat spots [23].
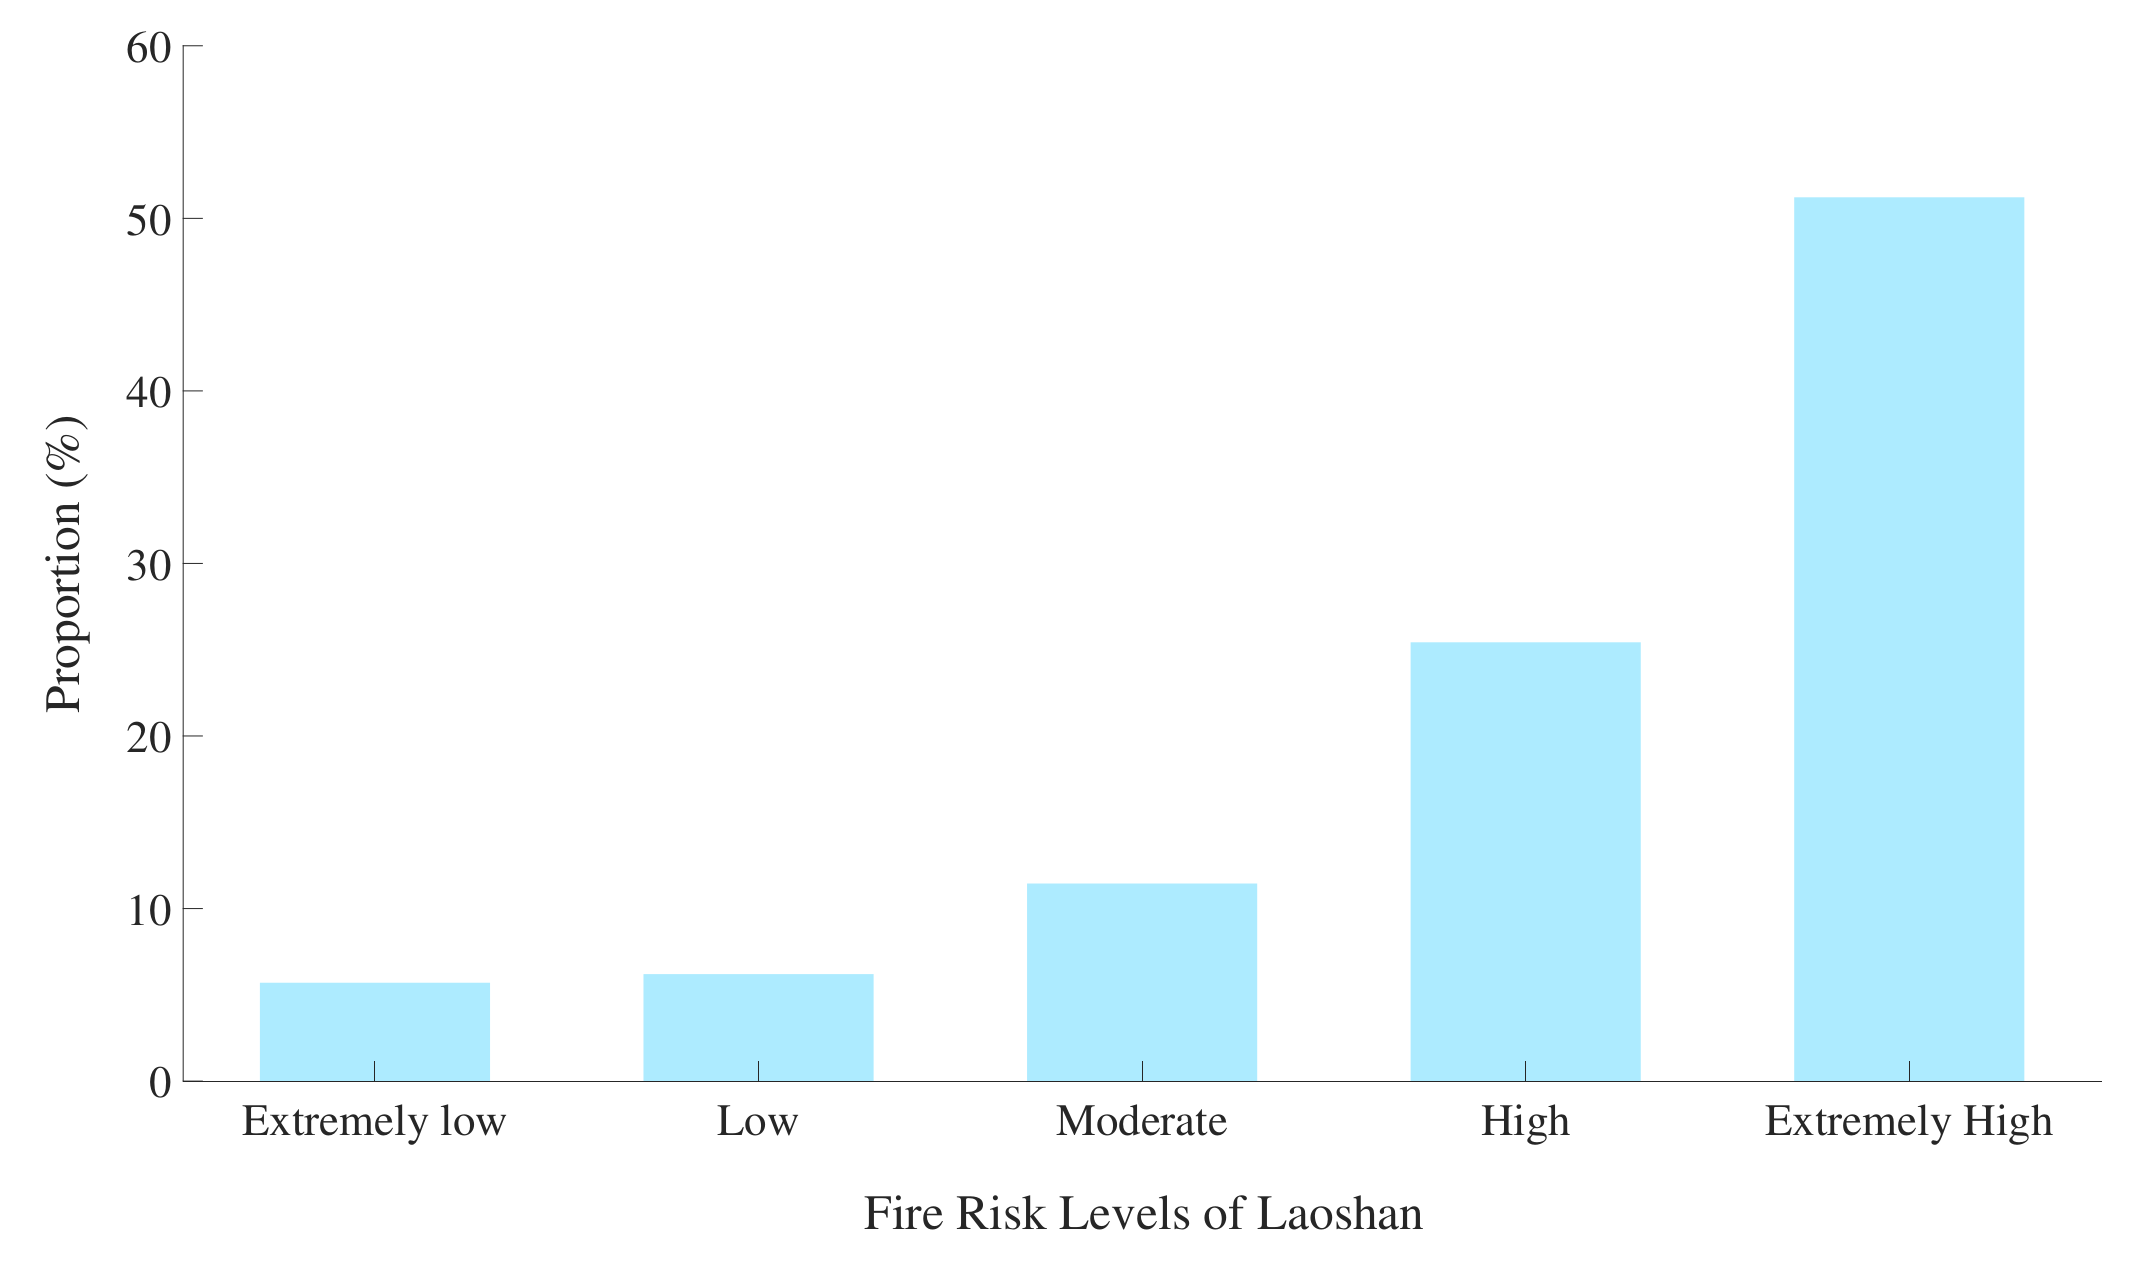
Through the comparison results, we can find that among the 304 fire points in the period, the areas that identified as high and extremely high totaled 233 heat spots. Therefore, the accuracy of the fire risk model proposed in this paper is 76.65%. The result of the validation is shown in Figure 15. The percentage in Figure 15 shows the proportion of the area of heap spots covered by the forest risk map.
5. Discussion
5.1. Fire-Inducing Factors and Fire Risk Map
The forest risk map is an effective method for fire risk management [12,13,14,15,17,18,19]. Forest fire occurrence is not only affected by the natural factors of the area (i.e., topography, vegetation, climate, etc.) [13,14,17,42], but also influenced by human activity [12,21,22]. This paper proposes a method to obtain the fire risk model of the study area by weight analysis, which is based on the geographic, meteorological factor, vegetation, and human activity of the study area.
A specific fire risk model may not be widely applicable on a global scale due to the different environmental conditions under which the model is developed [58]. Utilizing appropriate publicly available data to develop a model, the generality of the model application and developing method may be enhanced to some extent [59,60,61]. In other words, the model development method could be applied in other places when developing such a model with its publicly available data.
Due to the easily accessed and high temporal resolution data, MODIS data have been widely used in forest fire analysis and modelling. MODIS Terra images have been used to assess fire susceptibility of vegetation [62]. The MODIS time series can be used for near real-time land cover change detection [58], which can also be used with a particle filter to explain the change in the vegetation growth cycle caused by forest fire [63]. In this paper, fire points were extracted from MODIS data.
Based on the information acquisition situation of the study area, we choose four types of fire-inducing factors (topography, meteorological, vegetation, and human activities) to derive the fire risk model. These four types of factors consist of eight specific elements (e.g., aspect, altitude, temperature, vegetation, etc.), which have been identified as effective elements for fire risk modeling [20,33,43].
The analytic hierarchical analysis is an effective method to determine the weight of each factor [33,34,45]. In order to improve the accuracy, we use multi-layer analytic hierarchical analysis to calculate the weight of the factors. Table 12 shows the result of weight analysis, which is calculated by the AHP decision-making method. The eight factors show different importance in predicting forest fire. Based on the proposed model, the fire risk map (Figure 14a) can be plotted. Finally, we made crossings between the areas of the fire risk map obtained by the fire risk model with heat spots. The result indicates that the identification of the variables and derivations from those variables are appropriate [20,23].
5.2. The Influence of Factors on Fire Risk Model
The vegetation element is considered the most important factor in our paper. The weight assigned to vegetation is 0.4476, while the topographic factor is assigned the lowest weight of 0.1059. Human activities are the second most important factor. When the forest vegetation coverage is determined, whether there are human activities in the area influences the probability of fire.
Topographic factors are considered to be effective among the fire-inducing factors [13,14,42]. Altitude, slope, and aspect are commonly used. TWI is an indicator of surface water content [15]. Surface water content represents the degree of humidity in the area. The humidity area has a low probability to be fire [16]. Recently, TWI has been identified as one of the effective factors to model the fire occurrence [20]. In this paper, it has a high weight within four topographic factors, this is consistent with the observation in the relevant works [20,20]. Compared with aspect and slope, altitude has a great impact on the probability of forest fire in Laoshan, because low elevation areas have higher human accessibility, which may result in unintended fire by fire sources (for example: cigarette butts thrown by pedestrians) [64]. In our study, area, most of the Laoshan area is flat, and the influence of slope is lower. Meanwhile, the sunny slope has higher temperature and is prone to fire in the northern hemisphere [20]. Due to the specific situation in our study area, we set low weight for slope and aspect, which are 0.1820 and 0.0969, respectively.
The fire ignition is greatly influenced by human activities [12,23,35,51]. In populated areas and roads, the flowrate of visitors is large, and human activities may cause carelessness fires [20,52,65]. In this paper, human activity factors have a value of 0.2829. In the group of human activity factors, we also score DTP and DTR, respectively. In Laoshan Forest Park, most of the surrounding populated areas are residential areas and tourist attractions. Human activities in these areas include cooking, sacrifices, smoking, etc., which can cause fires. The roads in the forest are mostly driven by vehicles, so the stay time is relatively short. Thus, the probability of fire caused by human activities is lower than that in populated areas. So when we assess the importance of these two factors, we choose to assign a larger weight to the populated areas.
Temperature and precipitation have an important influence on fire ignition [17,23]. Since precipitation data cannot be obtained in this area, we can only consider temperature. Higher temperature tends to reduce the water content of the surface and vegetation in the area, and increases the probability of forest fires [18,19]. Since Laoshan Forest Park belongs to a subtropical monsoon climate. The higher average temperature makes Laoshan prone to fire, especially in summer. Thus, temperature occupies a large proportion of fire inducing-factors. In this article, we assign a weight of 0.1636 to the temperature, which is higher than the influence of terrain factors on the area.
Vegetation is significant in fire induction in most fire research articles [48,49,50,66]. is commonly chosen to indicate the distribution of vegetation which is commonly considered as a proxy of fuel for analyses of fire occurrence. If more detailed and precise data, such as tree species, combustibility and flammability, can be obtained, it would be helpful to construct a more accurate model. In the future work, we would like to obtain and consider using more precise vegetation species, combustibility and flammability data for modeling [67]. Currently, is still widely used when more precise data are not available. In this paper, is divided into different intervals to quantify the vegetation coverage, and a weight of 0.4476 is assigned. In the future, we would like to consider different division methods.
5.3. Accuracy and Application Analysis
This article uses the AHP method to assign weights to the factors. There are other methods such as fuzzy AHP [26], logistic regression [20], artificial neural networks (ANN) [61], etc. These methods need to verify the established model and use fire data to verify the accuracy of the model. For example, in [61], the deep recurrent Elman neural network performs well in determining the relationship between climate and fire incidence. The experiment was based on monthly climatic data surfaces of Australia and the accuracy was over 90%. Kayet [68] used the frequency ratio for verification, and the verification accuracy rate is 81%. Fernando [23] made a crossing between the areas of risk of forest fires with the heat spots, and the accuracy rate is 78.92%. This paper uses the method of fire point extraction, by extracting fire points as historical fire data, and comparing them with the model for verification (details in Section 4.4). The result shows that the accuracy of the fire risk model in this paper is close to 77%. This means that the method proposed in this article and the weights assigned to each factor are reasonable. The generated map can be used as a reference for fire management in Laoshan Forest Park.
A challenging and critical problem in fire management is how to timely detect and report the fire breakout. Human patrol according to the fire risk map may be an effective way. However, it is still hard to perform routine patrol tasks to fully cover a large forest area [32,69,70].
With the recent technological advances in forest fire management and the increasing popularity of using Unmanned Aircraft Vehicle (UAV) and wireless video monitoring devices [69,70,71], the generated forest fire risk map is expected to play an increasingly important role in future detection of forest fire. The generality of our method and the generated fire risk map open the possibility to plan a short and accurate patrol path of future UAV applications by utilizing mobility and fire risk level.
6. Conclusions
It can be seen from the research in this paper, Laoshan has approximately 11.879 km of the area at extremely low risk, 33.824 km at low risk, 12.145 km at moderate risk, 8.918 km at high risk and 3.234 km at extremely high risk, representing 16.97%, 48.32%, 17.35%, 12.74% and 4.62% of Laoshan, respectively. According to the above statistics, about 17.36% of Laoshan is at a high risk of fire occurrence, and 4.62% are at extremely high risk. It is necessary to take protective measures for extremely high-risk areas, increase the deployment of fire prevention resources and environmental monitoring. For example: Strengthen the monitoring intensity of the area, set up fire belts, restrict entry into the dangerous area, and regularly inspect the fire protection facilities in the dangerous area. Due to the limited number of fire protection resources, high-risk areas should prioritize the allocation of resources. We used heat spots and areas of the fire risk map for cross-validation, and found that the prediction accuracy of the fire risk map was nearly 77%. It proves that the model is effective and can be used as a reference for actual resource allocation. For the prospect of future work, we will try to obtain more fire impact factors related to Laoshan Forest Park (e.g., precipitation, land types, etc.), and use more advanced methods (e.g., machine learning, reinforcement learning, etc.) to build fire risk models to obtain a more accurate risk model. Based on the risk model, the current fire-fighting facilities and fire-fighting resources can be more rationally scheduled. How to schedule fire prevention resources so that the fire can be detected in time and quickly extinguished is also one of the future research directions.
Author Contributions
Conceptualization, F.Z. and H.L.; methodology, P.Z.; software, P.Z.; validation, P.Z.; investigation, H.L. and S.X.; resources, F.Z.; data curation, P.Z.; writing—original draft preparation, P.Z.; writing—review and editing, F.Z. and P.Z.; visualization, P.Z.; funding acquisition, F.Z. and H.L. All authors have read and agreed to the published version of the manuscript.
Funding
This research was funded by Jiangsu Agriculture Science and Technology Innovation Fund Grant No.CX (20)3038, Key Research and Development plan of Jiangsu Province (Social Development) No.BE2021716, and National Natural Science Foundation of China Grant No. 31670554.
Institutional Review Board Statement
Not applicable.
Informed Consent Statement
Not applicable.
Data Availability Statement
A 30 m-resolution DEM data can be downloaded from Geospatial Data Cloud (GDC) (http://www.gscloud.cn, accessed on 10 January 2021). The MODIS data can be used to extract the location of fire points, which can be found by Terra and Aqua satellites which belong to the National Aeronautics and Space Administration (NASA). These satellites monitor active fire data four times a day. MODIS is a 7-day composite data. The active fire data that we used from NASA (https://ladsweb.modaps.eosdis.nasa.gov/, accessed on 15 March 2021).
Acknowledgments
We would like to thank the editor and the anonymous reviewers for their valuable comments, suggestions and feedback to improve this manuscript.
Conflicts of Interest
The authors declare no conflict of interest.
References
- Martin, D.A. At the nexus of fire, water and society. Philos. Trans. R. Soc. Lond. 2016, 371, 20150172. [Google Scholar] [CrossRef] [Green Version]
- Flannigan, M.D.; Stocks, B.J.; Wotton, B.M. Climate change and forest fires. Sci. Total Environ. 2000, 262, 221–229. [Google Scholar] [CrossRef]
- Woolford, D.G.; Martell, D.L.; McFayden, C.B.; Evens, J.; Stacey, A.; Wotton, B.M.; Boychuk, D. The development and implementation of a human-caused wildland fire occurrence prediction system for the province of Ontario, Canada. Can. J. For. Res. 2021, 51, 303–325. [Google Scholar] [CrossRef]
- Carvalho, F.P.; Oliveira, J.M.; Malta, M. Exposure to radionuclides in smoke from vegetation fires. Sci. Total Environ. 2014, 472, 421–424. [Google Scholar] [CrossRef] [PubMed]
- Martins, V.; Miranda, A.I.; Carvalho, A.; Schaap, M.; Borrego, C.; Sá, E. Impact of forest fires on particulate matter and ozone levels during the 2003, 2004 and 2005 fire seasons in Portugal. Sci. Total Environ. 2012, 414, 53–62. [Google Scholar] [CrossRef] [PubMed]
- Guo, F.; Su, Z.; Wang, G.; Sun, L.; Tigabu, M.; Yang, X.; Hu, H. Understanding fire drivers and relative impacts in different Chinese forest ecosystems. Sci. Total Environ. 2017, 605–606, 411–425. [Google Scholar] [CrossRef] [PubMed]
- Pham, B.T.; Jaafari, A.; Avand, M.; Al-Ansari, N.; Dinh Du, T.; Yen, H.P.H.; Phong, T.V.; Nguyen, D.H.; Le, H.V.; Mafi-Gholami, D.; et al. Performance evaluation of machine learning methods for forest fire modeling and prediction. Symmetry 2020, 12, 1022. [Google Scholar] [CrossRef]
- Nuthammachot, N.; Stratoulias, D. Multi-criteria decision analysis for forest fire risk assessment by coupling AHP and GIS: Method and case study. Environ. Dev. Sustain. 2021, 1–16. [Google Scholar] [CrossRef]
- ChinaForestryDatabase. 2018. Available online: http://cfdb.forestry.gov.cn/lysjk/indexJump.do?url=view/moudle/index (accessed on 12 October 2020).
- Said, S.N.B.M.; Zahran, E.S.M.M.; Shams, S. Forest fire risk assessment using hotspot analysis in GIS. Open Civ. Eng. J. 2017, 11, 786–801. [Google Scholar] [CrossRef]
- Surya, L. Risk Analysis Model That Uses Machine Learning to Predict the Likelihood of a Fire Occurring at A Given Property. Int. J. Creat. Res. Thoughts IJCRT 2017, 5, 2320–2882. [Google Scholar]
- Erten, E.; Kurgun, V.; Musaolu, N. Forest Fire Risk Zone Mapping From Satellite Imagery and GIS: A Case Study. In Proceedings of the XXth Congress of the International Society for Photogrammetry and Remote Sensing, Istanbul, Turkey, 12–23 July 2004; pp. 222–230. [Google Scholar]
- Vasilakos, C.; Kalabokidis, K.; Hatzopoulos, J.; Matsinos, I. Identifying wildland fire ignition factors through sensitivity analysis of a neural network. Nat. Hazards 2009, 50, 125–143. [Google Scholar] [CrossRef]
- Oliveira, S.; Oehler, F.; San-Miguel-Ayanz, J.; Camia, A.; Pereira, J.M. Modeling spatial patterns of fire occurrence in Mediterranean Europe using Multiple Regression and Random Forest. For. Ecol. Manag. 2012, 275, 117–129. [Google Scholar] [CrossRef]
- Pourtaghi, Z.S.; Pourghasemi, H.R.; Aretano, R.; Semeraro, T. Investigation of general indicators influencing on forest fire and its susceptibility modeling using different data mining techniques. Ecol. Indic. 2016, 64, 72–84. [Google Scholar] [CrossRef]
- Çolak, E.; Sunar, F. Evaluation of forest fire risk in the Mediterranean Turkish forests: A case study of Menderes region, Izmir. Int. J. Disaster Risk Reduct. 2020, 45, 101479. [Google Scholar] [CrossRef]
- Tian, X.; Zhao, F.; Shu, L.; Wang, M. Distribution characteristics and the influence factors of forest fires in China. For. Ecol. Manag. 2013, 310, 460–467. [Google Scholar] [CrossRef]
- Sánchez, J.M.; Bisquert, M.; Rubio, E.; Caselles, V. Impact of Land Cover Change Induced by a Fire Event on the Surface Energy Fluxes Derived from Remote Sensing. Remote Sens. 2015, 7, 14899–14915. [Google Scholar] [CrossRef] [Green Version]
- Lloyd, H.G. Influence of altitude and aspect on daily variations in factors of forest-fire danger. Remote Sens. Environ. 2006, 105, 142–154. [Google Scholar]
- Dieu, T.B.; Le, K.T.; Van, N.; Le, H.; Inge, R. Tropical Forest Fire Susceptibility Mapping at the Cat Ba National Park Area, Hai Phong City, Vietnam, Using GIS-Based Kernel Logistic Regression. Remote Sens. 2016, 8, 347. [Google Scholar]
- Balch, J.K.; Bradley, B.A.; Abatzoglou, J.T.; Nagy, R.C.; Fusco, E.J.; Mahood, A.L. Human-started wildfires expand the fire niche across the United States. Proc. Natl. Acad. Sci. USA 2017, 114, 2946–2951. [Google Scholar] [CrossRef] [PubMed] [Green Version]
- Parisien, M.A.; Miller, C.; Parks, S.A.; Delancey, E.R.; Robinne, F.N.; Flannigan, M. The spatially varying influence of humans on fire probability in North America. Environ. Res. Lett. 2016, 11, 075005. [Google Scholar] [CrossRef] [Green Version]
- Eugenio, F.C.; dos Santos, A.R.; Fiedler, N.C.; Ribeiro, G.A.; da Silva, A.G.; dos Santos, Á.B.; Paneto, G.G.; Schettino, V.R. Applying GIS to develop a model for forest fire risk: A case study in Espírito Santo, Brazil. J. Environ. Manag. 2016, 173, 65–71. [Google Scholar] [CrossRef]
- Abedi Gheshlaghi, H.; Feizizadeh, B.; Blaschke, T. GIS-based forest fire risk mapping using the analytical network process and fuzzy logic. J. Environ. Plan. Manag. 2020, 63, 481–499. [Google Scholar] [CrossRef]
- Li, S.Y.; Tao, G.; Zhang, L.J. Fire Risk Assessment of High-rise Buildings Based on Gray-FAHP Mathematical Model. Procedia Eng. 2018, 211, 395–402. [Google Scholar] [CrossRef]
- Eskandari, S. A new approach for forest fire risk modeling using fuzzy AHP and GIS in Hyrcanian forests of Iran. Arab. J. Geosci. 2017, 10, 190. [Google Scholar] [CrossRef]
- Pourghasemi, H.R.; Beheshtirad, M.; Pradhan, B. A comparative assessment of prediction capabilities of modified analytical hierarchy process (M-AHP) and Mamdani fuzzy logic models using Netcad-GIS for forest fire susceptibility mapping. Geomat. Nat. Hazards Risk 2016, 7, 861–885. [Google Scholar] [CrossRef] [Green Version]
- Dimuccio, L.A.; Figueiredo, R.F.; Cunha, L.; Almeida, A.C.D. Regional forest-fire susceptibility analysis in central Portugal using a probabilistic ratings procedure and artificial neural network weights assignment. Int. J. Wildland Fire 2011, 20, 776–791. [Google Scholar] [CrossRef]
- Finney, M.A. The challenge of quantitative risk analysis for wildland fire. For. Ecol. Manag. 2005, 211, 97–108. [Google Scholar] [CrossRef]
- Matin, M.A.; Chitale, V.S.; Murthy, M.S.R.; Uddin, K.; Bajracharya, B.; Pradhan, S. Understanding forest fire patterns and risk in Nepal using remote sensing, geographic information system and historical fire data. Int. J. Wildland Fire 2017, 26, 276. [Google Scholar] [CrossRef] [Green Version]
- Zhao, W.H.; Shan, H.B.; Zhong, R.X. A new model for the MODIS fire monitoring:normalized difference thermal index. J. Nat. Disasters 2008, 17, 152–157. [Google Scholar]
- Zhang, F.; Zhao, P.; Thiyagalingam, J.; Kirubarajan, T. Terrain-Influenced Incremental Watchtower Expansion for Wildfire Detection. Sci. Total Environ. 2019, 654, 164–176. [Google Scholar] [CrossRef] [PubMed]
- Lee, C.; Kim, K.; Lee, H. GIS based optimal impervious surface map generation using various spatial data for urban nonpoint source management. J. Environ. Manag. 2018, 206, 587–601. [Google Scholar] [CrossRef]
- Semeraro, T.; Mastroleo, G.; Aretano, R.; Facchinetti, G.; Zurlini, G.; Petrosillo, I. GIS Fuzzy Expert System for the assessment of ecosystems vulnerability to fire in managing Mediterranean natural protected areas. J. Environ. Manag. 2016, 168, 94–103. [Google Scholar] [CrossRef]
- Jakovljević, G.; Gigović, L.; Sekulovic, D.; Regodić, M. GIS Multi-Criteria Analysis for Identifying and Mapping Forest Fire Hazard: Nevesinje, Bosnia and Herzegovina. Teh. Vjesn. 2018, 25, 891–897. [Google Scholar]
- Kavlak, M.O.; Cabuk, S.N.; Cetin, M. Development of forest fire risk map using geographical information systems and remote sensing capabilities: Ören case. Environ. Sci. Pollut. Res. 2021, 28, 33265–33291. [Google Scholar] [CrossRef] [PubMed]
- Alcasena, F.J.; Salis, M.; Ager, A.A.; Castell, R.; Vega-García, C. Assessing wildland fire risk transmission to communities in northern Spain. Forests 2017, 8, 30. [Google Scholar] [CrossRef] [Green Version]
- Konkathi, P.; Shetty, A.; Kolluru, V.; Yathish, P.; Pruthviraj, U. Static Fire Risk Index for the Forest Resources of Karnataka. In Proceedings of the IGARSS 2019—2019 IEEE International Geoscience and Remote Sensing Symposium, Yokohama, Japan, 28 July–2 August 2019; pp. 6716–6719. [Google Scholar]
- You, W.; Li, L.; Wu, L.; Ji, Z.; Yu, J.; Zhu, J.; Fan, Y.; He, D. Geographical information system-based forest fire risk assessment integrating national forest inventory data and analysis of its spatiotemporal variability. Ecol. Indic. 2017, 77, 176–184. [Google Scholar] [CrossRef]
- Yue, Y.; Dong, K.; Zhao, X.; Ye, X. Assessing wild fire risk in the United States using social media data. J. Risk Res. 2019, 1–15. [Google Scholar] [CrossRef]
- Akay, A.; Erdoğan, A. GIS-based multi-criteria decision analysis for forest fire risk mapping. ISPRS Ann. Photogramm. Remote Sens. Spat. Inf. Sci. 2017, 4, 25. [Google Scholar] [CrossRef] [Green Version]
- Conedera, M.; Peter, L.; Marxer, P.; Forster, F.; Rickenmann, D.; Re, L. Consequences of forest fires on the hydrogeological response of mountain catchments: A case study of the Riale Buffaga, Ticino, Switzerland. Earth Surf. Process. Landf. 2010, 28, 117–129. [Google Scholar] [CrossRef]
- Lira, P.K.; Tambosi, L.R.; Ewers, R.M.; Metzger, J.P. Land-use and land-cover change in Atlantic Forest landscapes. For. Ecol. Manag. 2012, 278, 80–89. [Google Scholar] [CrossRef]
- Ribeiro, L.; de Paulo Koproski, L.; Stolle, L.; Lingnau, C.; Soares, R.V.; Batista, A.C. Zoneamento de riscos de incêndios florestais para a Fazenda Experimental do Canguiri, Pinhais (PR) ([Fire risk map for the Canguiri Experimental Farm, Pinhais (PR)]). Floresta 2008, 28, 561–572. [Google Scholar]
- Nelson, N.A.; Pierce, J. Late-Holocene relationships among fire, climate and vegetation in a forest-sagebrush ecotone of southwestern Idaho, USA. Holocene 2010, 20, 1179–1194. [Google Scholar] [CrossRef]
- Walawender, J.P.; Szymanowski, M.; Hajto, M.J.; Bokwa, A. Land Surface Temperature Patterns in the Urban Agglomeration of Krakow (Poland) Derived from Landsat-7/ETM+ Data. Pure Appl. Geophys. 2014, 171, 913–940. [Google Scholar] [CrossRef] [Green Version]
- Brabyn, L.; Zawar-Reza, P.; Stichbury, G.; Cary, C.; Storey, B.; Laughlin, D.C.; Katurji, M. Accuracy assessment of land surface temperature retrievals from Landsat 7 ETM + in the Dry Valleys of Antarctica using iButton temperature loggers and weather station data. Environ. Monit. Assess. 2014, 186, 2619–2628. [Google Scholar] [CrossRef] [PubMed]
- Rossa, C.G. The effect of fuel moisture content on the spread rate of forest fires in the absence of wind or slope. Int. J. Wildland Fire 2017, 26, 24–31. [Google Scholar] [CrossRef]
- Bilgili, E.; Coskuner, K.A.; Usta, Y.; Goltas, M. Modeling surface fuels moisture content in Pinus brutia stands. J. For. Res. 2019, 30, 577–587. [Google Scholar] [CrossRef]
- Hong, H.; Tsangaratos, P.; Ilia, I.; Liu, J.; Zhu, A.X.; Chong, X. Applying genetic algorithms to set the optimal combination of forest fire related variables and model forest fire susceptibility based on data mining models. The case of Dayu County, China. Sci. Total Environ. 2018, 630, 1044–1056. [Google Scholar] [CrossRef]
- Ricotta, C.; Bajocco, S.; Guglietta, D.; Conedera, M. Assessing the influence of roads on fire ignition: Does land cover matter? Fire 2018, 1, 24. [Google Scholar] [CrossRef] [Green Version]
- Wu, Z.; He, H.S.; Jian, Y.; Liu, Z.; Yu, L. Relative effects of climatic and local factors on fire occurrence in boreal forest landscapes of northeastern China. Sci. Total Environ. 2014, 493, 472–480. [Google Scholar] [CrossRef]
- Saaty, T.L. A scaling method for priorities in hierarchical structures. J. Math. Psychol. 1977, 15, 234–281. [Google Scholar] [CrossRef]
- Kang, H.; Zhai, F.; Gao, W. Construction of Rural Fire Risk Assessment System Based on Analytic Hierarchy Process: A Case Study of Tuyang Village in Shenzhen. In Proceedings of the International Conference on Construction and Real Estate Management (ICCREM 2017), Guangzhou, China, 10–12 November 2017; pp. 353–359. [Google Scholar]
- Taridala, S.; Yudono, A.; Ramli, M.; Akil, A. Expert system development for urban fire hazard assessment. Study case: Kendari City, Indonesia. IOP Conf. Ser. Earth Environ. Sci. 2017, 79, 012035. [Google Scholar] [CrossRef] [Green Version]
- Chen, J.J.; Fang, Z.; Wang, J.H.; Guo, X.J. Research on building fire risk assessment based on analytic hierarchy process (AHP). In Proceedings of the International Conference on Intelligent Computation Technology &Automation, Changsha, China, 25–26 October 2014. [Google Scholar]
- Nuthammachot, N.; Stratoulias, D. A GIS- and AHP-based approach to map fire risk: A case study of Kuan Kreng peat swamp forest, Thailand. Geocarto Int. 2021, 36, 212–225. [Google Scholar] [CrossRef]
- Anees, A.; Aryal, J.; O’Reilly, M.M.; Gale, T.J. A Relative Density Ratio-Based Framework for Detection of Land Cover Changes in MODIS NDVI Time Series. IEEE J. Sel. Top. Appl. Earth Obs. Remote Sens. 2016, 9, 3359–3371. [Google Scholar] [CrossRef]
- Szpakowski, D.M.; Jennifer, J.L.R. A Review of the Applications of Remote Sensing in Fire Ecology. Remote Sens. 2019, 11, 2638. [Google Scholar] [CrossRef] [Green Version]
- Costafreda-Aumedes, S.; Comas, C.; Vega-Garcia, C. Human-caused fire occurrence modelling in perspective: A review. Int. J. Wildland Fire 2017, 26, 983–998. [Google Scholar] [CrossRef]
- Dutta, R.; Aryal, J.; Das, A.; Kirkpatrick, J.B. Deep cognitive imaging systems enable estimation of continental-scale fire incidence from climate data. Sci. Rep. 2013, 3, 3188. [Google Scholar] [CrossRef] [Green Version]
- Cheret, V.; Denux, J.P. Analysis of MODIS NDVI Time Series to Calculate Indicators of Mediterranean Forest Fire Susceptibility. GIScience Remote Sens. 2011, 48, 171–194. [Google Scholar] [CrossRef]
- Chakraborty, S.; Banerjee, A.; Gupta, S.; Papandreou-Suppappola, A.; Christensen, P. Estimation of dynamic parameters of MODIS NDVI time series nonlinear model using particle filtering. In Proceedings of the IEEE International Geoscience & Remote Sensing Symposium, Fort Worth, TX, USA, 23–28 July 2017. [Google Scholar]
- Rasooli, S.B.; Bonyad, A.E. Evaluating the efficiency of the Dong model in determining fire vulnerability in Iran’s Zagros forests. J. For. Res. 2019, 30, 1447–1458. [Google Scholar] [CrossRef]
- Giglio, L.; Van der Werf, G.; Randerson, J.; Collatz, G.; Kasibhatla, P. Global estimation of burned area using MODIS active fire observations. Atmos. Chem. Phys. 2006, 6, 957–974. [Google Scholar] [CrossRef] [Green Version]
- Suryabhagavan, K.; Alemu, M.; Balakrishnan, M. GIS-based multi-criteria decision analysis for forest fire susceptibility mapping: A case study in Harenna forest, southwestern Ethiopia. Trop. Ecol. 2016, 57, 33–43. [Google Scholar]
- Chen, X.; Jiang, K.; Zhu, Y.; Wang, X.; Yun, T. Individual Tree Crown Segmentation Directly from UAV-Borne LiDAR Data Using the PointNet of Deep Learning. Forests 2021, 12, 131. [Google Scholar] [CrossRef]
- Kayet, N.; Chakrabarty, A.; Pathak, K.; Sahoo, S.; Dutta, T.; Hatai, B.K. Comparative analysis of multi-criteria probabilistic FR and AHP models for forest fire risk (FFR) mapping in Melghat Tiger Reserve (MTR) forest. J. For. Res. 2020, 31, 565–579. [Google Scholar] [CrossRef]
- Kilic, S.; Ozkan, O. A self-adaptive UAV routing for forest fire risk mitigation: A conceptual model. In Proceedings of the 2019 Summer Simulation Conference, Berlin, Germany, 22–24 July 2019. [Google Scholar]
- Sudhakar, S.; Vijayakumar, V.; Kumar, C.S.; Priya, V.; Ravi, L.; Subramaniyaswamy, V. Unmanned Aerial Vehicle (UAV) based Forest Fire Detection and monitoring for reducing false alarms in forest-fires. Comput. Commun. 2020, 149, 1–16. [Google Scholar] [CrossRef]
- De Vivo, F.; Battipede, M.; Johnson, E. Infra-red line camera data-driven edge detector in UAV forest fire monitoring. Aerosp. Sci. Technol. 2021, 111, 106574. [Google Scholar]
- Bao, S.; Xiao, N.; Lai, Z.; Zhang, H.; Kim, C. Optimizing watchtower locations for forest fire monitoring using location models. Fire Saf. J. 2015, 71, 100–109. [Google Scholar] [CrossRef]
Figure 1.
Laoshan National Forest Park is located in Nanjing, Jiangsu Province, China. (a) Jiangsu Province, China. (b) Laoshan, Nanjing. (c) Longitude and Latitude of Laoshan.
Figure 1.
Laoshan National Forest Park is located in Nanjing, Jiangsu Province, China. (a) Jiangsu Province, China. (b) Laoshan, Nanjing. (c) Longitude and Latitude of Laoshan.

Figure 2.
The process of fire risk model construction, which consists of data collection, data processing and weight calculating, result and validation.
Figure 2.
The process of fire risk model construction, which consists of data collection, data processing and weight calculating, result and validation.

Figure 3.
The base map of altitude in Laoshan. Each level is determined by the fire risk classification.
Figure 3.
The base map of altitude in Laoshan. Each level is determined by the fire risk classification.

Figure 4.
The base map of slope in Laoshan. Each level is determined by the fire risk classification.
Figure 4.
The base map of slope in Laoshan. Each level is determined by the fire risk classification.

Figure 5.
The base map of aspect in Laoshan. Each level is determined by the fire risk classification.
Figure 5.
The base map of aspect in Laoshan. Each level is determined by the fire risk classification.

Figure 6.
The base map of TWI in Laoshan. Each level is determined by the fire risk classification.

Figure 7.
The base map of temperature in Laoshan. Each level is determined by the fire risk classification.
Figure 7.
The base map of temperature in Laoshan. Each level is determined by the fire risk classification.

Figure 8.
The base map of in Laoshan. Each level is determined by the fire risk classification.

Figure 9.
The base map of distance to roads in Laoshan. Each level is determined by the fire risk classification.
Figure 9.
The base map of distance to roads in Laoshan. Each level is determined by the fire risk classification.

Figure 10.
The base map of distance to populated areas in Laoshan. Each level is determined by the fire risk classification.
Figure 10.
The base map of distance to populated areas in Laoshan. Each level is determined by the fire risk classification.

Figure 11.
The fire risk map of topographic factors. (a) The risk map of altitude. (b) The risk map of aspect. (c) The risk map of slope. (d) The risk map of TWI. The fire risk level of each factor is determined by the fire risk classification results.
Figure 11.
The fire risk map of topographic factors. (a) The risk map of altitude. (b) The risk map of aspect. (c) The risk map of slope. (d) The risk map of TWI. The fire risk level of each factor is determined by the fire risk classification results.

Figure 12.
The fire risk map of and temperature. (a) The risk map of . (b) The risk map of temperature. The fire risk level of each factor is determined by the fire risk classification results.
Figure 12.
The fire risk map of and temperature. (a) The risk map of . (b) The risk map of temperature. The fire risk level of each factor is determined by the fire risk classification results.

Figure 13.
The fire risk map of human activity factors. (a) The risk map of distance to roads. (b) The risk map of distance to populated areas. The fire risk level of each factor is determined by the fire risk classification results.
Figure 13.
The fire risk map of human activity factors. (a) The risk map of distance to roads. (b) The risk map of distance to populated areas. The fire risk level of each factor is determined by the fire risk classification results.

Figure 14.
The forest fire risk map and proportion of each level of the risk area. (a) The generated forest fire risk map. (b) The proportion of areas of each fire risk level. The percentage represents the ratio of the area of each risk level to the area of Laoshan Forest Park.
Figure 14.
The forest fire risk map and proportion of each level of the risk area. (a) The generated forest fire risk map. (b) The proportion of areas of each fire risk level. The percentage represents the ratio of the area of each risk level to the area of Laoshan Forest Park.

Figure 15.
Forest fire risk validation.


Table 1.
Fire risk classification of altitude.
| Altitude (m) | Weight | Risk |
|---|---|---|
| <100 | 5 | Extremely high |
| 100–200 | 4 | High |
| 200–300 | 3 | Moderate |
| 300–400 | 2 | Low |
| >400 | 1 | Extremely low |
Table 2.
Fire risk classification of slope.
| Slope () | Slope (%) | Weight | Risk |
|---|---|---|---|
| >30 | >58 | 5 | Extremely high |
| 20–30 | 36–58 | 4 | High |
| 10–20 | 18–36 | 3 | Moderate |
| 5–10 | 9–18 | 2 | Low |
| <5 | <9 | 1 | Extremely low |
Table 3.
Classification of aspect.
| Aspect | Degre |
|---|---|
| N-NE | 0– |
| NE-E | – |
| E-SE | – |
| SE-S | – |
| S-SW | 1 – |
| SW-W | – |
| W-NW | – |
| NW-N | – |
Table 4.
Fire risk classification of aspect.
| Aspect | Weight | Risk |
|---|---|---|
| S | 5 | Extremely high |
| SE and E | 4 | High |
| NE | 3 | Moderate |
| N | 2 | Low |
| W, NW, SW and FLAT | 1 | Extremely low |
Table 5.
Fire risk classification of TWI.
| TWI | Weight | Risk |
|---|---|---|
| <7 | 5 | Extremely high |
| 7–8 | 4 | High |
| 8–9 | 3 | Moderate |
| 9–10 | 2 | Low |
| >10 | 1 | Extremely low |
Table 6.
Fire risk classification of temperature.
| Temperature (C) | Weight | Risk |
|---|---|---|
| >31 | 5 | Extremely high |
| 29–31 | 4 | High |
| 27–29 | 3 | Moderate |
| 25–27 | 2 | Low |
| <25 | 1 | Extremely low |
Table 7.
Fire risk classification of .
| Weight | Risk | |
|---|---|---|
| <0 | 5 | Extremely high |
| 0–0.15 | 4 | High |
| 0.15–0.3 | 3 | Moderate |
| 0.3–0.45 | 2 | Low |
| > | 1 | Extremely low |
Table 8.
Fire risk classification of distance to roads.
| Distance to Roads (m) | Weight | Risk |
|---|---|---|
| <300 | 5 | Extremely high |
| 300–600 | 4 | High |
| 600–900 | 3 | Moderate |
| 900–1200 | 2 | Low |
| >1200 | 1 | Extremely low |
Table 9.
Fire risk classification of distance to populated areas.
| Populated Areas | Weight | Risk |
|---|---|---|
| <400 | 5 | Extremely high |
| 400–800 | 4 | High |
| 800–1200 | 3 | Moderate |
| 1200–1600 | 2 | Low |
| >1600 | 1 | Extremely low |
Table 10.
The comparison matrix of each factor in a type.
| Factors | Factors | Weight | ||||
|---|---|---|---|---|---|---|
| Altitude | Slope | Aspect | TWI | |||
| Altitude | 1 | 2 | 3 | 1/2 | 0.2863 | |
| Topographic | Slope | 1/2 | 1 | 2 | 1/2 | 0.1820 |
| Factors | Aspect | 1/3 | 1/2 | 1 | 1/4 | 0.0969 |
| TWI | 2 | 2 | 4 | 1 | 0.4348 | |
| DTR | DTP | |||||
| Human Activity | DTR | 1 | 3 | 0.75 | ||
| Factors | DTP | 1/3 | 1 | 0.25 |
Table 11.
The weight allocation of each type.
| Topographic | Temperature | Human Activity | Weight | ||
|---|---|---|---|---|---|
| Topographic | 1 | 1/2 | 1/3 | 1/3 | 0.1059 |
| Temperature | 2 | 1 | 1/3 | 1/2 | 0.1636 |
| 3 | 3 | 1 | 2 | 0.4476 | |
| Human Activity | 3 | 2 | 1/2 | 1 | 0.2829 |
Table 12.
The weight distribution result of each factor.
| Influence Factors of Forest Fire | Risk |
|---|---|
| 0.0103 | |
| 0.0193 | |
| 0.0303 | |
| 0.0461 | |
| 0.0707 | |
| 0.1636 | |
| 0.2122 | |
| 0.4476 |
Publisher’s Note: MDPI stays neutral with regard to jurisdictional claims in published maps and institutional affiliations. |
© 2021 by the authors. Licensee MDPI, Basel, Switzerland. This article is an open access article distributed under the terms and conditions of the Creative Commons Attribution (CC BY) license (https://creativecommons.org/licenses/by/4.0/).
Share and Cite
MDPI and ACS Style
Zhao, P.; Zhang, F.; Lin, H.; Xu, S. GIS-Based Forest Fire Risk Model: A Case Study in Laoshan National Forest Park, Nanjing. Remote Sens. 2021, 13, 3704. https://doi.org/10.3390/rs13183704
AMA Style
Zhao P, Zhang F, Lin H, Xu S. GIS-Based Forest Fire Risk Model: A Case Study in Laoshan National Forest Park, Nanjing. Remote Sensing. 2021; 13(18):3704. https://doi.org/10.3390/rs13183704
Chicago/Turabian StyleZhao, Pengcheng, Fuquan Zhang, Haifeng Lin, and Shuwen Xu. 2021. "GIS-Based Forest Fire Risk Model: A Case Study in Laoshan National Forest Park, Nanjing" Remote Sensing 13, no. 18: 3704. https://doi.org/10.3390/rs13183704
Note that from the first issue of 2016, this journal uses article numbers instead of page numbers. See further details here.