
A Study of the Application and the Limitations of GPR Investigation on Underground Survey of the Korean Expressways


1
KEC Research Institute, Korea Expressway Corporation, Hwaseong 18489, Korea
2
KEC Design Evaluation Division, Korea Expressway Corporation, Gimcheon 39660, Korea
3
Department of Civil Engineering, Induk University, Seoul 01878, Korea
*
Author to whom correspondence should be addressed.
Remote Sens. 2021, 13(9), 1805; https://doi.org/10.3390/rs13091805
Submission received: 18 March 2021
/
Revised: 26 April 2021
/
Accepted: 1 May 2021
/
Published: 6 May 2021
(This article belongs to the Special Issue Ground Penetrating Radar (GPR) Applications in Civil Infrastructure Systems)
Abstract
:In this study, the applications and the limitations of the Ground-penetrating radar (GPR) investigation have been addressed with the main objective of improving the efficient GPR application of subsurface surveys on Korean expressways. The depth of investigation and detection performance of anomalous objects have been studied using two different types of multichannel GPR on the Korean Expressway Corporation’s nondestructive testing testbed for subsurface detection. Based on the field survey, it was found that utilizing the plane view by depth, cross-sectional and longitudinal profile data of the multichannel GPR simultaneously, analysis and evaluation of the GPR signals are more efficient and practical. Although there was a difference in the frequency of use, the precision difference between two GPR is almost similar in the investigation depth and detection performance of the pavement subsurface anomaly. Under an asphalt concrete standard pavement section, the effective depth of cavity detection is 1–1.5 m, while detection under concrete pavement is less than 1.0 m. In addition, there is still a need to calibrate depths using field cores when constructing a 3D underground facility map.
1. Introduction
Ground-penetrating radar (GPR) technology is a nondestructive testing (NDT) device used in various fields of civil engineering locally and overseas. Waves of various frequency bands are radiated into the ground by the transmitters and then are reflected back to the receivers. Using the acquired signals, the location and shape of the subsurface anomaly can be determined. GPR has been used in several research projects and practical engineering application for various purposes such as in boreholes where the GPR is used to characterize the ground mass, soil fractures, infill and soil hydraulic properties [1,2]. It has also been used in the identification of soil water content [3,4] detection of voids and sinkholes [5,6] evaluation of the ground structure around tunnels and linings [7,8] foundation assessment and identification of foundation strata [9,10] location and identification of underground utilities [11,12,13] inspection of road pavement [14,15] railway subgrades and ballast characterization [16,17] and bridge deck condition assessments [18,19,20].
In Korea, GPR is widely used in detecting subsurface cavities beneath the pavement. In recent years, people’s anxiety has risen due to the damage caused by sudden sinking and subsidence of roads in old districts [21,22,23,24]. In 2014, large and small road settlements occurred on some urban roads in Seoul. In particular, in the underpass of Seokchon Lake, a huge depression of about 2.5 m in width, 8 m in length and 10 m in depth occurred, and road depressions quickly emerged as a social issue. In Korea, from then on, the road management division of Seoul city has conducted subsurface surveys using GPR. Patterns of GPR data were analyzed from actual road cavities [25]. Kim et al. [26,27] installed artificial voids using expanded polystyrene (EPS) under the asphalt pavement and compared the signals from the impulse- and step-frequency-type GPR to assess the most appropriate tool in detecting cavities. Meanwhile, Lee [28,29] identified the depth of investigation and location of buried objects in a model chamber from the GPR tests. In addition, he developed an image processing program to help in the analysis of the GPR survey data. In the same way, Kim et al. [30] also tried to develop an image processing technique for detecting cavity from the GPR survey data. Moreover, in another study, Lee and Jang [31] estimated the relative permittivity of the ground using 3D-GPR surveys conducted on testbeds and actual roads. It was found that it is beneficial to use the acquired longitudinal, transverse and depth images simultaneously when analyzing GPR signals. The Government quickly enacted and implemented a special law on underground safety management [32], which requires GPR surveys of construction sites with high-risk of subsidence or cave-ins and for the public roads above ground facilities such as tunnels, underpasses and buried pipes. With those national efforts, GPR technology has contributed to the reduction of cavities beneath roads that occur across the country [33]. Several studies have also been conducted to improve the efficiency of GPR in subsurface surveys. The results of these studies were rapidly applied in practice. In addition, a method of acquiring spatial information of underground facilities from the GPR survey results and using it for an underground spatial integration map is also being discussed [34]. However, most experimental data were obtained in the laboratory using simulated cavity models and pipes while field surveys were limited to asphalt pavements.
As of 2021, the expressway managed by the Korea Expressway Corporation (KEC) has reached about 5000 km [35], and the problem of ground subsidence caused by the cavity under the road has been uncommon [36]. However, expressways use a denser and thicker pavement layer than other roads [37]. Since GPR is an NDT method, data obtained from the field may have several uncertainties [38,39]. The GPR equipment and its data acquisition settings must be carefully selected because the depth of investigation and the detection precision varies depending on the objective and scope of the investigation [6,40]. The interpretation of GPR data also requires information on the electromagnetic properties of the ground such as the dielectric constant and conductivity; however, these parameters vary, depending on the real time survey and the ground conditions [41,42,43]. For these reasons, GPR data should be carefully interpreted considering the characteristics of the GPR equipment and the pavement condition [43,44]. Interpreting and analyzing GPR data based on limited experiences may cause human errors, especially in the detection of subsurface anomalies and depth prediction. In order to verify the investigation performance of GPR under different types of pavements, it is recommended to conduct pavement surveys and evaluation through blind testing [45,46,47,48]. This method is acceptable and valid when evaluating not only the user settings of the GPR equipment but, also, the capability of the engineer to analyze the actual GPR data. It is also necessary to verify the accuracy and precision of the relevant equipment and analysis technology before investigating the dangerous section of the expressway on which the vehicle travels at high speed.
The purpose of this study is to determine the limitations and capacity of the GPR in detecting subsurface abnormalities and determining their depths under the expressway pavement. Two types of 3D GPR are tested on a testbed, which was constructed using various types of pavement simulating Korean Expressways containing subsurface anomalies such as cavity, steel plate, etc. The maximum depth of detection using the 3D GPR according to pavement type is also evaluated. The characteristics of the GPR signals according to the type of anomaly are identified, and the limitations of the GPR are enumerated and elaborated. In addition, a practical and more reliable method in conducting subsurface field surveys in Korean Expressways is recommended.
2. Background
2.1. Principle of GPR
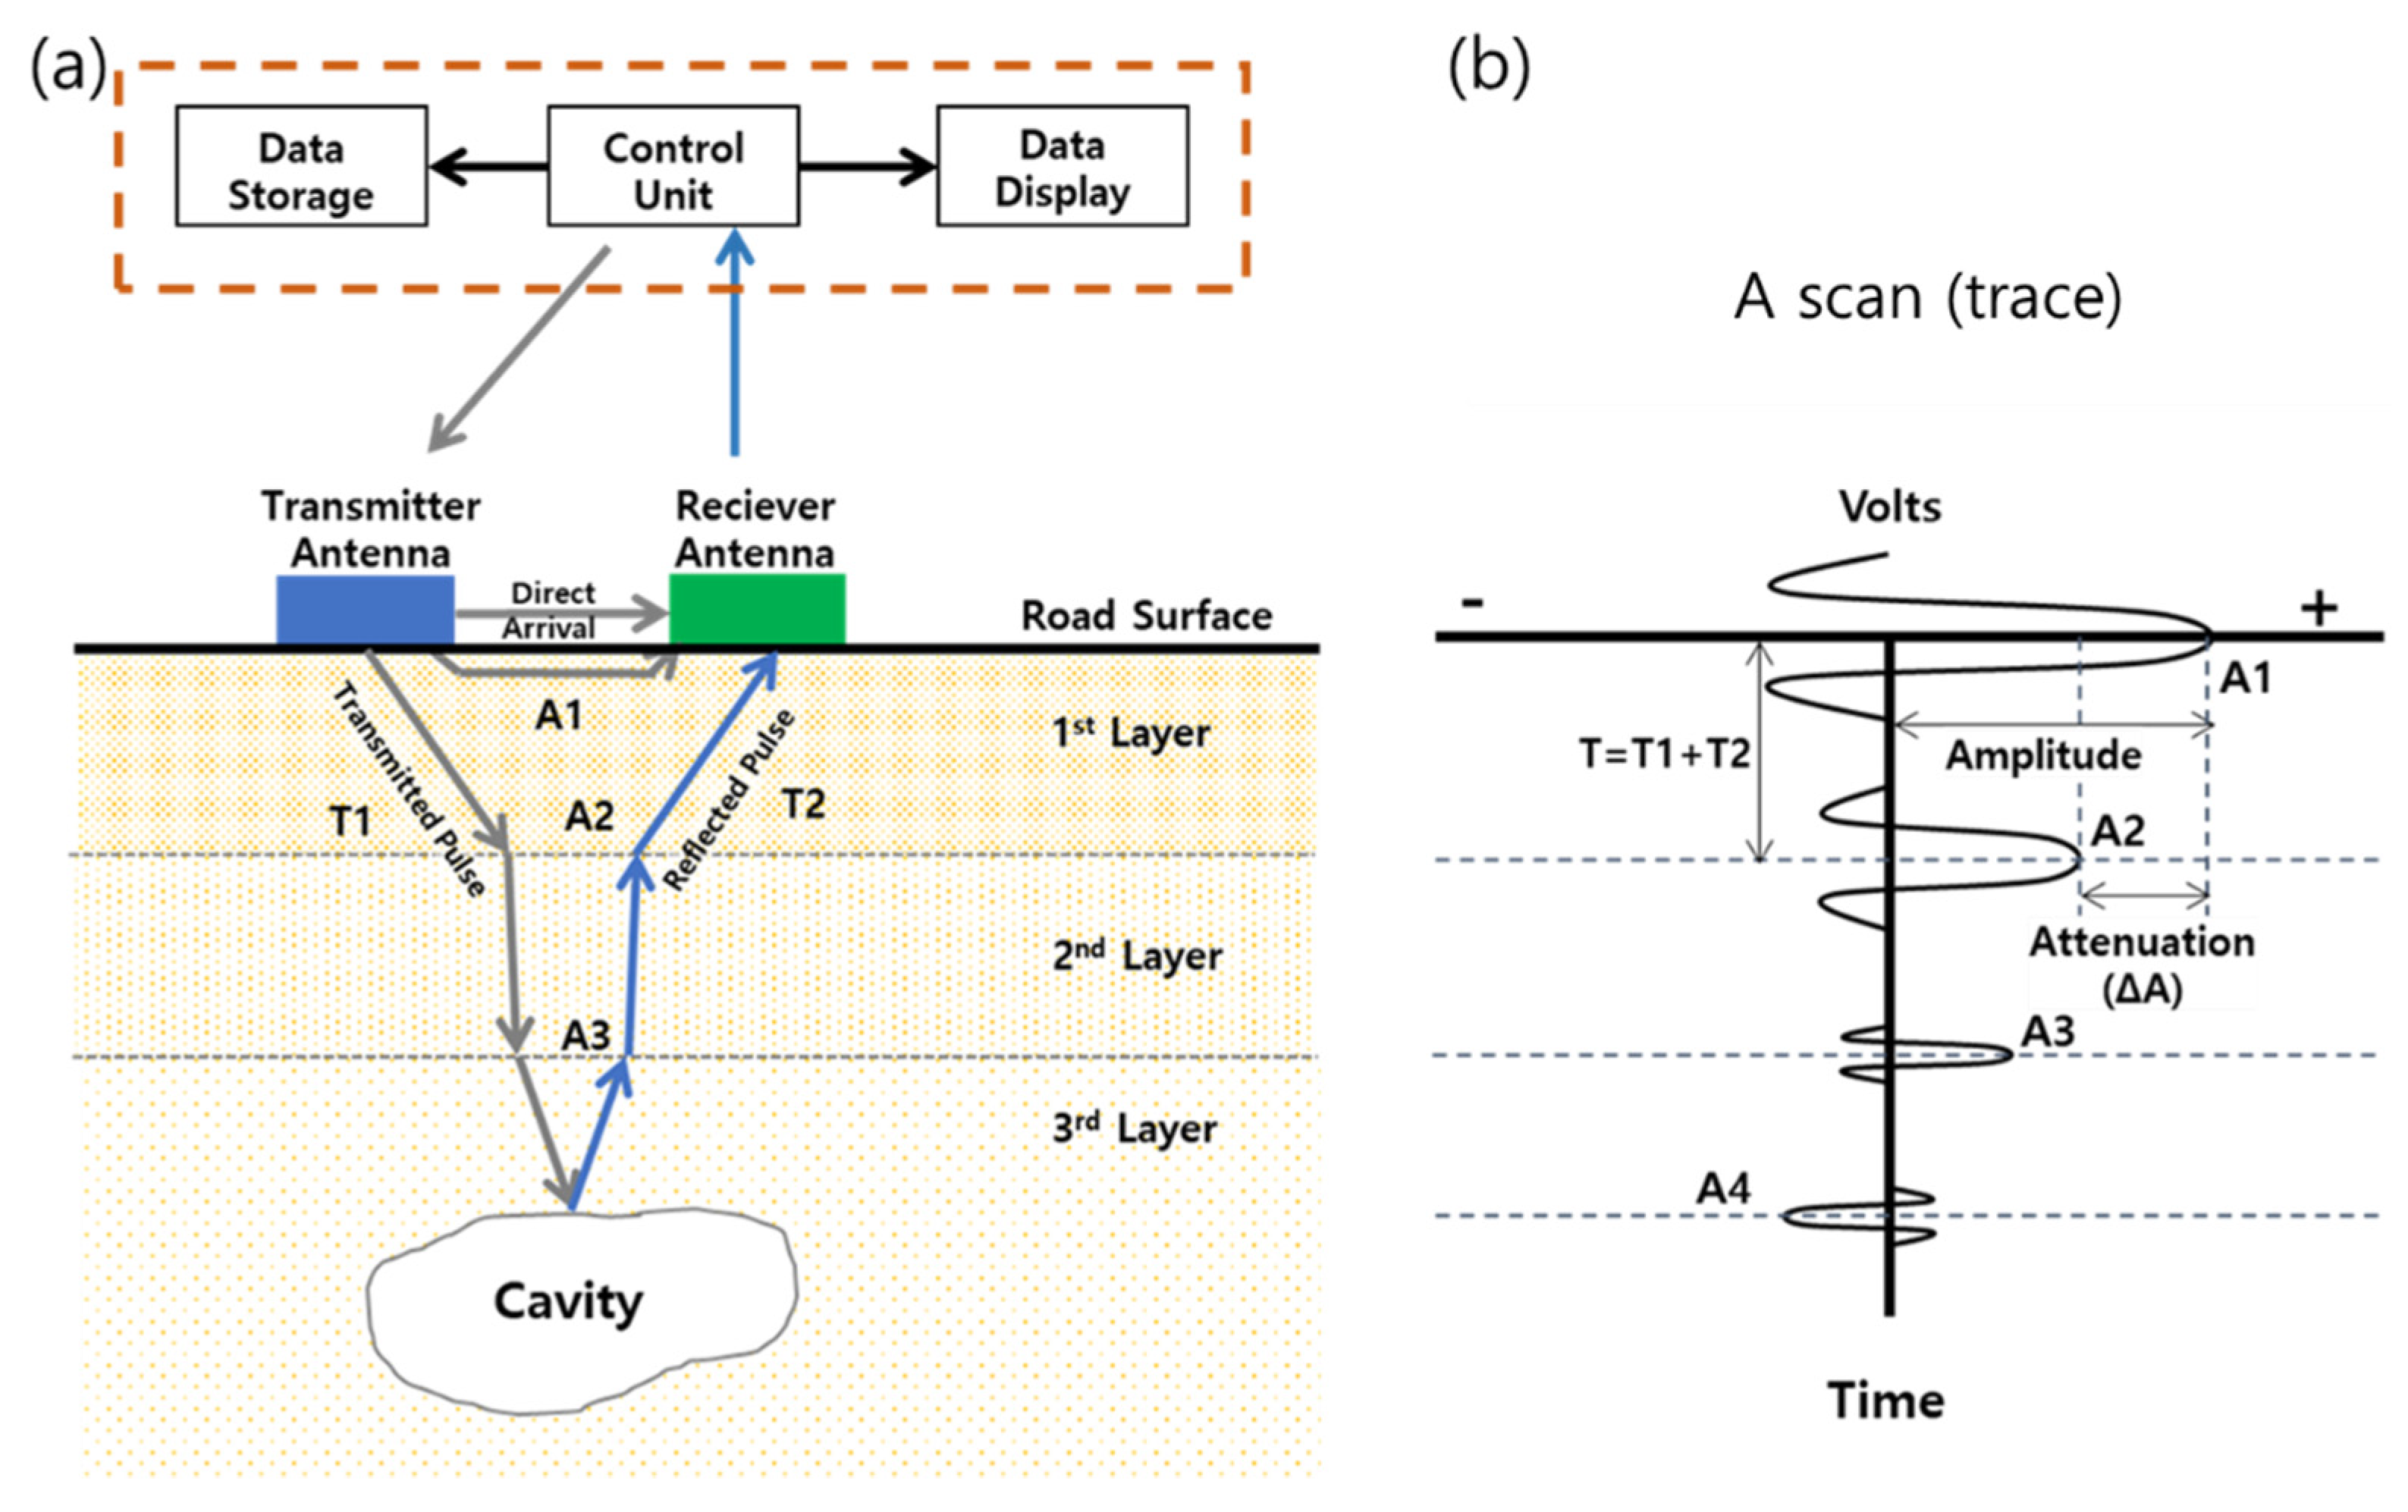
Radar antennas specially designed according to the target medium and scope of investigation are used by GPRs. As shown in Figure 1, a circuit within the radar control unit generates a train of trigger pulses that are sent to the electronic transmitter and receiver. As the radar propagates in the medium, some energy is transmitted and some is reflected at the interface, wherein the electro-magnetic (EM) properties of the material change (air/pavement layer, ground/cavity or utility, etc.). The reflected EM wave is then received by the receiving antenna. Furthermore, the type and condition of the material where the waves passed are evaluated by analyzing the shape and transmission time of the received wave signal. As the antennas are moved along the survey line, a series of scans are collected and positioned side by side to form a profile of the pavement’s subsurface [49,50].
The GPR signal from a cavity under the road can be defined by the characteristics of the waveform that is reflected from it. When there is a change in medium’s dielectric constant, a reflection with a certain amplitude is generated. Meanwhile, when a medium with a small dielectric constant is encountered by the transmitted waveform, the phase (primary amplitude direction) of the reflected waveform will be reversed [51,52]. For example, when a void exists inside concrete, the phase is reversed (in phase) from the (+) direction to the (-) direction, as shown in Figure 1b [53,54].
2.2. Attenuation
It is known that the attenuation of the radar signal is caused by the effect of electrical conductivity, dielectric and magnetic relaxation, scattering and geometric spreading losses [50,55] of the medium.
For electromagnetic waves propagating in a vacuum, the attenuation at a point is proportional to the distance from the source. These are called losses due to geometric spreading losses or distance and should be distinguished from energy loss caused by the condition of the medium. A sound medium is to be considered as homogeneous material with low moisture content in the analysis so it can be generally regarded as a nonconductive medium ignoring the pavement’s conductivity. The attenuation (geometric spreading losses) of the radar wave increases in a certain ratio (linearly proportional relationship) depending on the transmission distance (depth or transmission time). A significant parameter, loss tangent, is used to describe the loss component of material. It helps assess how dielectric is easily loss and, therefore, can provide a guide to the physical effects of attenuation on the GPR wave. The loss tangent is proportional to the reciprocal of the permittivity of the medium as expressed in Equation (1) [40]:
where tan δ is the loss tangent, σ is the conductivity of a medium (S/m), ω is the angular frequency (rad/s) and ε is the permittivity (F/m).
In general, the permittivity (or dielectric constant) of asphalt is in the range of 3 to 5. In the case of concrete, it is in the range of 5 to 10, which is higher than that of asphalt [50]. The conductivity of concrete is typically much higher than asphalt, which means it attenuates GPR signals to a greater degree. In addition, when reinforcing bars are installed in the concrete pavement (CRCP; Continuously Reinforced Concrete Pavement), it is expected that more energy attenuation may occur due to the scattering on the rebar, and the depth of investigation would be smaller.
2.3. Relative Permittivity (Dielectric Constant) and Depth Converting
Relative permittivity (or dielectric constant) is a major factor in determining the propagation speed of electromagnetic waves in a medium in a GPR investigation. Since the propagation speed in vacuum is about 300 mm/ns, the propagation speed in a medium is approximately calculated by Equation (2). Therefore, the depth of the medium could be calculated using Equation (3) [40,56]:
where Vm is the propagation velocity in a medium (m/s), C is the propagation velocity in free space (3 × 10⁸ m/s), εr is the relative permittivity of the medium, D is the measured depth to reflecting interface (m) and T is the two-way travel time of an EM wave (s) (See Figure 1).
The surface reflection method meanwhile can be used to estimate the reflected depth with the air-coupled GPR [57]. In this method, the dielectric constant of the medium can be calculated as the ratio of the amplitude of the reflected wave to the amplitude of the surface incident wave [58]. A traditional method used reference cores to properly define the reference pavement thickness, which is commonly applied when using a ground-coupled GPR system. However, extracting the core on a public road, where many vehicles are running at high speed, may cause an accident and risk the safety of the consumer. Thus, it should be performed only under limited conditions.
On the other hand, the two-way travel time (TWTT) may be converted to depth by assuming the dielectric constant of a medium (velocity of a radar wave). Dielectric constants based on the reliable references or prior experiences has been widely used in on-site measurements. However, one of the limitations of this method is that a series of GPR data could not consistently describe a particular underground condition. For example, even in the case of the same soil, the electromagnetic properties (propagation speed of electromagnetic waves, relative permittivity, etc.) may vary depending on the water content or medium condition [19,43,50]. In other words, there is a concern that the depth evaluation of underground objects by engineering judgement alone may cause significant errors in detection and estimation of depth.
3. Research Targets and Methods
3.1. Testbed
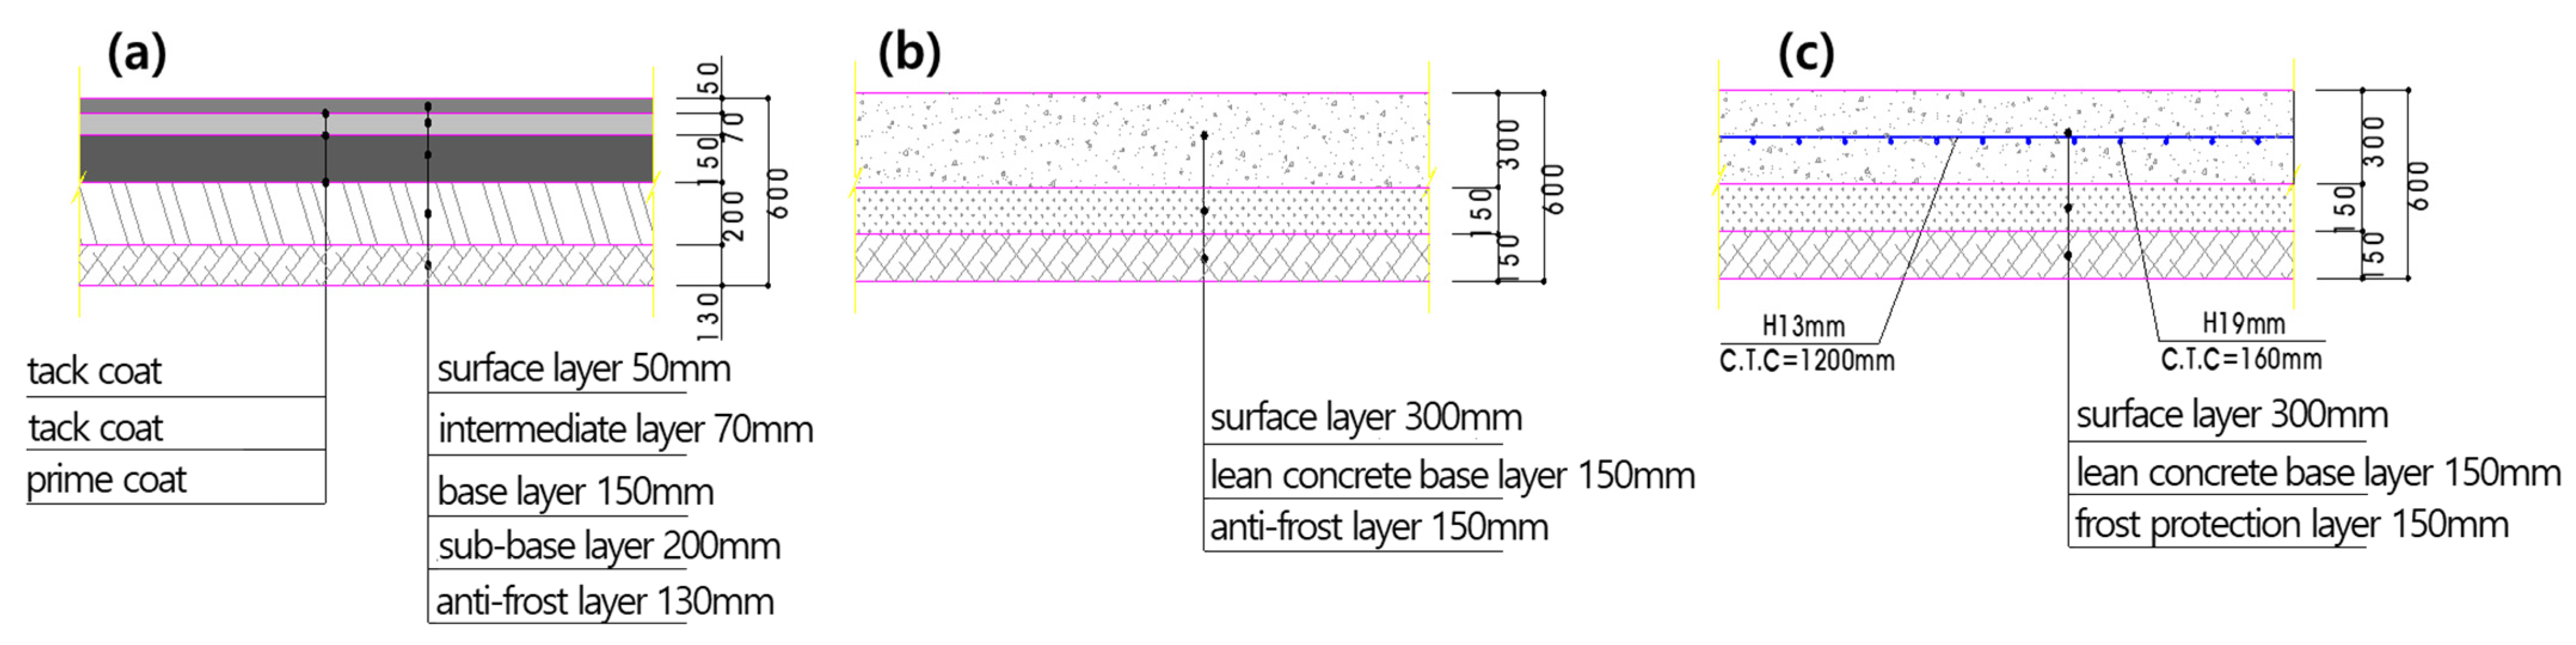
Nondestructive testing using GPR field tests were carried out on the Korea Expressway Corporation (KEC) testbed. The testbed had a total length of 120 m and width of 5 to 6 m, which was constructed in the latter part of 2018 with the objective of establishing evaluation criteria for anomalous conditions under the pavement. The standard pavement design profile of Korean Expressways was applied to the testbed composed of asphalt concrete pavement, cement concrete pavement and CRCP, which are the major type of pavements found on Korean Expressways. The sections of paved road using asphalt and concrete were 30 m each long. The asphalt pavement section is composed of a 50-mm-thick surface layer, 70-mm intermediate layer, 150-mm base layer, 200-mm sub-base layer and 130-mm anti-frost layer. Meanwhile, the concrete pavement section consisted of a 300-mm surface layer, 150-mm lean concrete base layer and a frost protection layer of 150 mm. In the plain concrete section, shrinkage joints were installed at an interval of 6 m, while D16 rebars were installed in the middle of the surface layer in the CRCP section. The detailed view of each section is shown in Figure 2 [36].
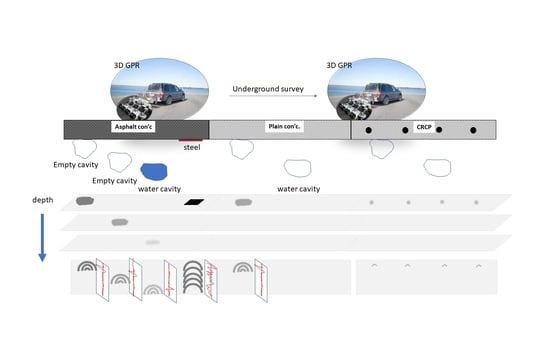
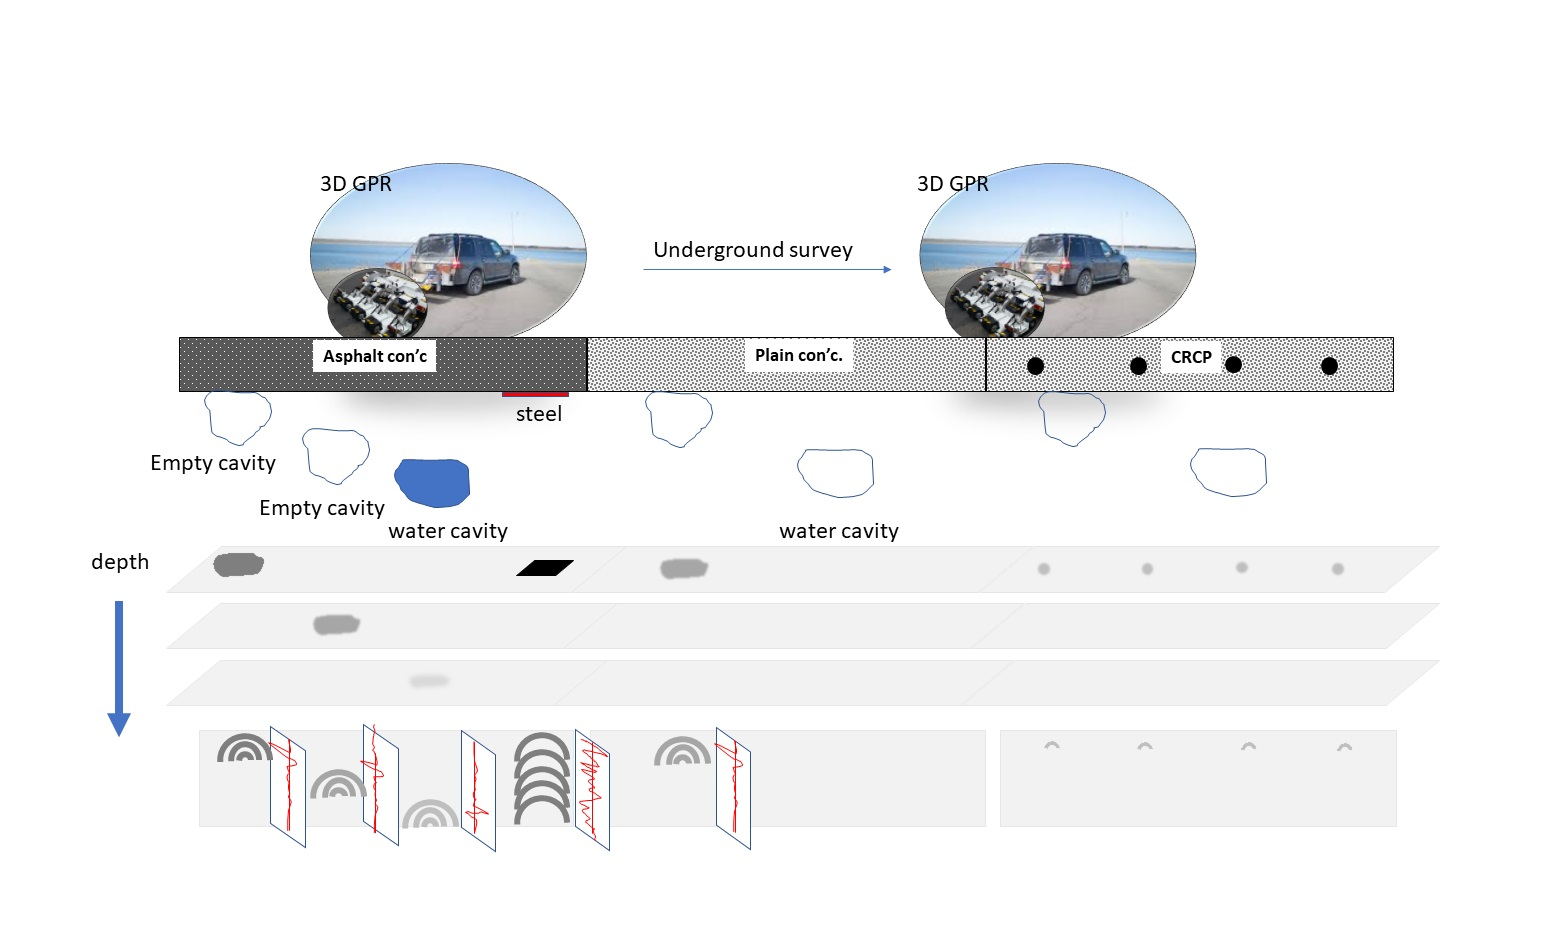
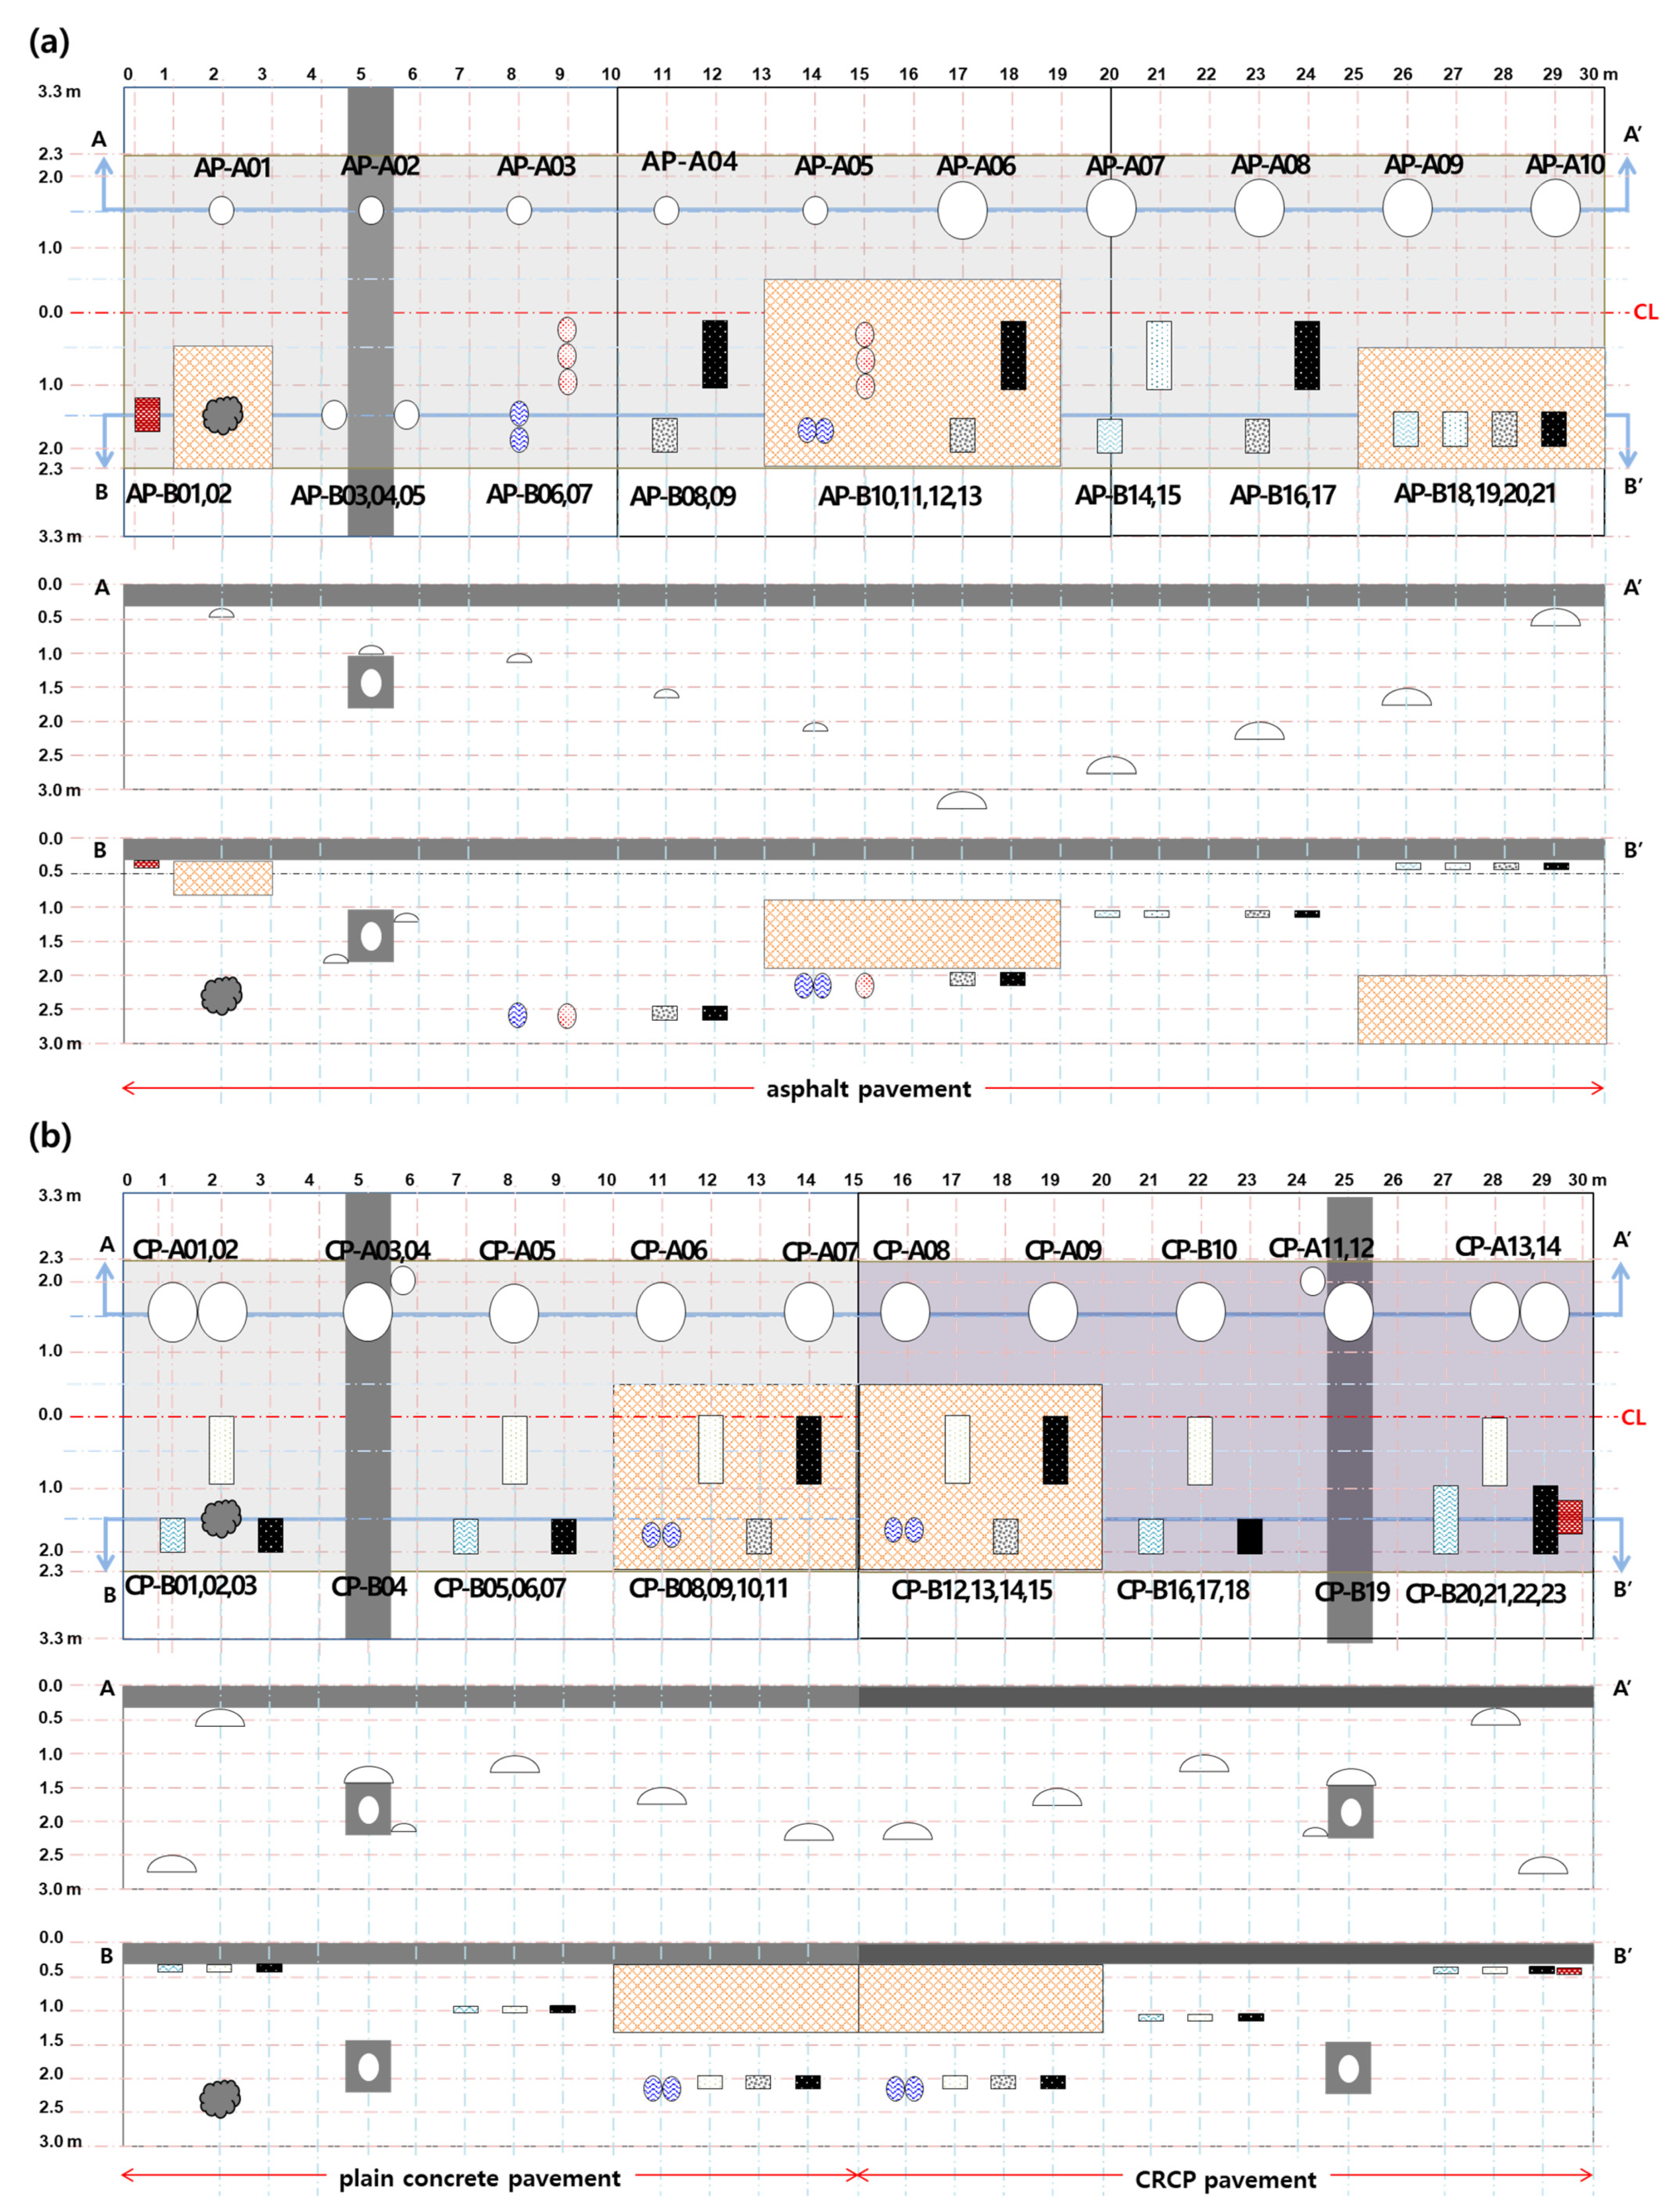
The underlayer of the testbed pavement consists of buried objects to simulate various road defects such as cavity in which EPS (expanded polystyrene), which is known to have similar dielectric constants with air [59], was used. In order to simulate the case of cavity with and without water depending on the weather, polyethylene (PE) bottles and earthenware filled with air and water were installed also in the testbed. In addition, steel plates were installed directly under the pavement for depth monitoring. The testbed is shown in Figure 3, and the buried anomalies are summarized in Table 1.
In Figure 3, CL means centerline, while A-A’ and B-B’ represent lateral lines in which various anomalies are buried. The lateral line A-A’ shows the cross section of the common model EPS hemispheres. Two types of EPS were used, having diameters of 0.5 m and 1m. The top surfaces of the EPS were buried at depths of 0.27–3.0 m in the asphalt section and 0.5–2.5 m in the concrete pavement section. Meanwhile, cross-section B-B’ simulated various buried objects that can be found on road sites, such as filled or empty cavities with EPS, earthenware, and PE bottles, buried rocks, concrete and asphalt blocks and steel plates. In addition, EPS fragments and sand were mixed to simulate loosened ground, and a transverse drainage pipe was also buried. The numbering of buried objects is based on the type of pavement and A and B on the left side of the sideline in the order of A to A’ and B to B’ direction.
The groundwater level was about 2.66 m deep based on the geotechnical survey of the site where the test road will be built. A depth of 1.5 m was excavated from the pavement surface, which is the main area of interest, and then was replaced with objects seen on typical expressway fill materials [60].
The materials used for Korean expressway pavement complied with the construction material standard [60]. The sub-base layer had a liquid limit of 25% or less, abrasion loss of 50% or less, a plasticity index of 6% or less, a modified CBR of 50% or more and a sand equivalent of 25% or more. In addition, anti-frost layer is based on the maximum size of coarse aggregate 100 mm or less, effective particle diameter 0.1 mm or more, 0.08 mm pass rate 8% or less, 2-mm pass rate 45% or less, plasticity index 10% or less, sand equivalent 20% or more and modified CBR of 10% or more were used. For the lean concrete base layer applied to the cement concrete pavement, the maximum size of coarse aggregation is 40 mm. A material having a dry density of 2.45 g/cm2 or more and a wear loss of 40% or less was used. In the case of fine aggregate, a material having a clay mass content of 1% or less, a plasticity index of 9 or less and an aggregate washing test loss rate of 3% or less was used. The concrete pavement was constructed in July 2017.
3.2. GPR Equipment
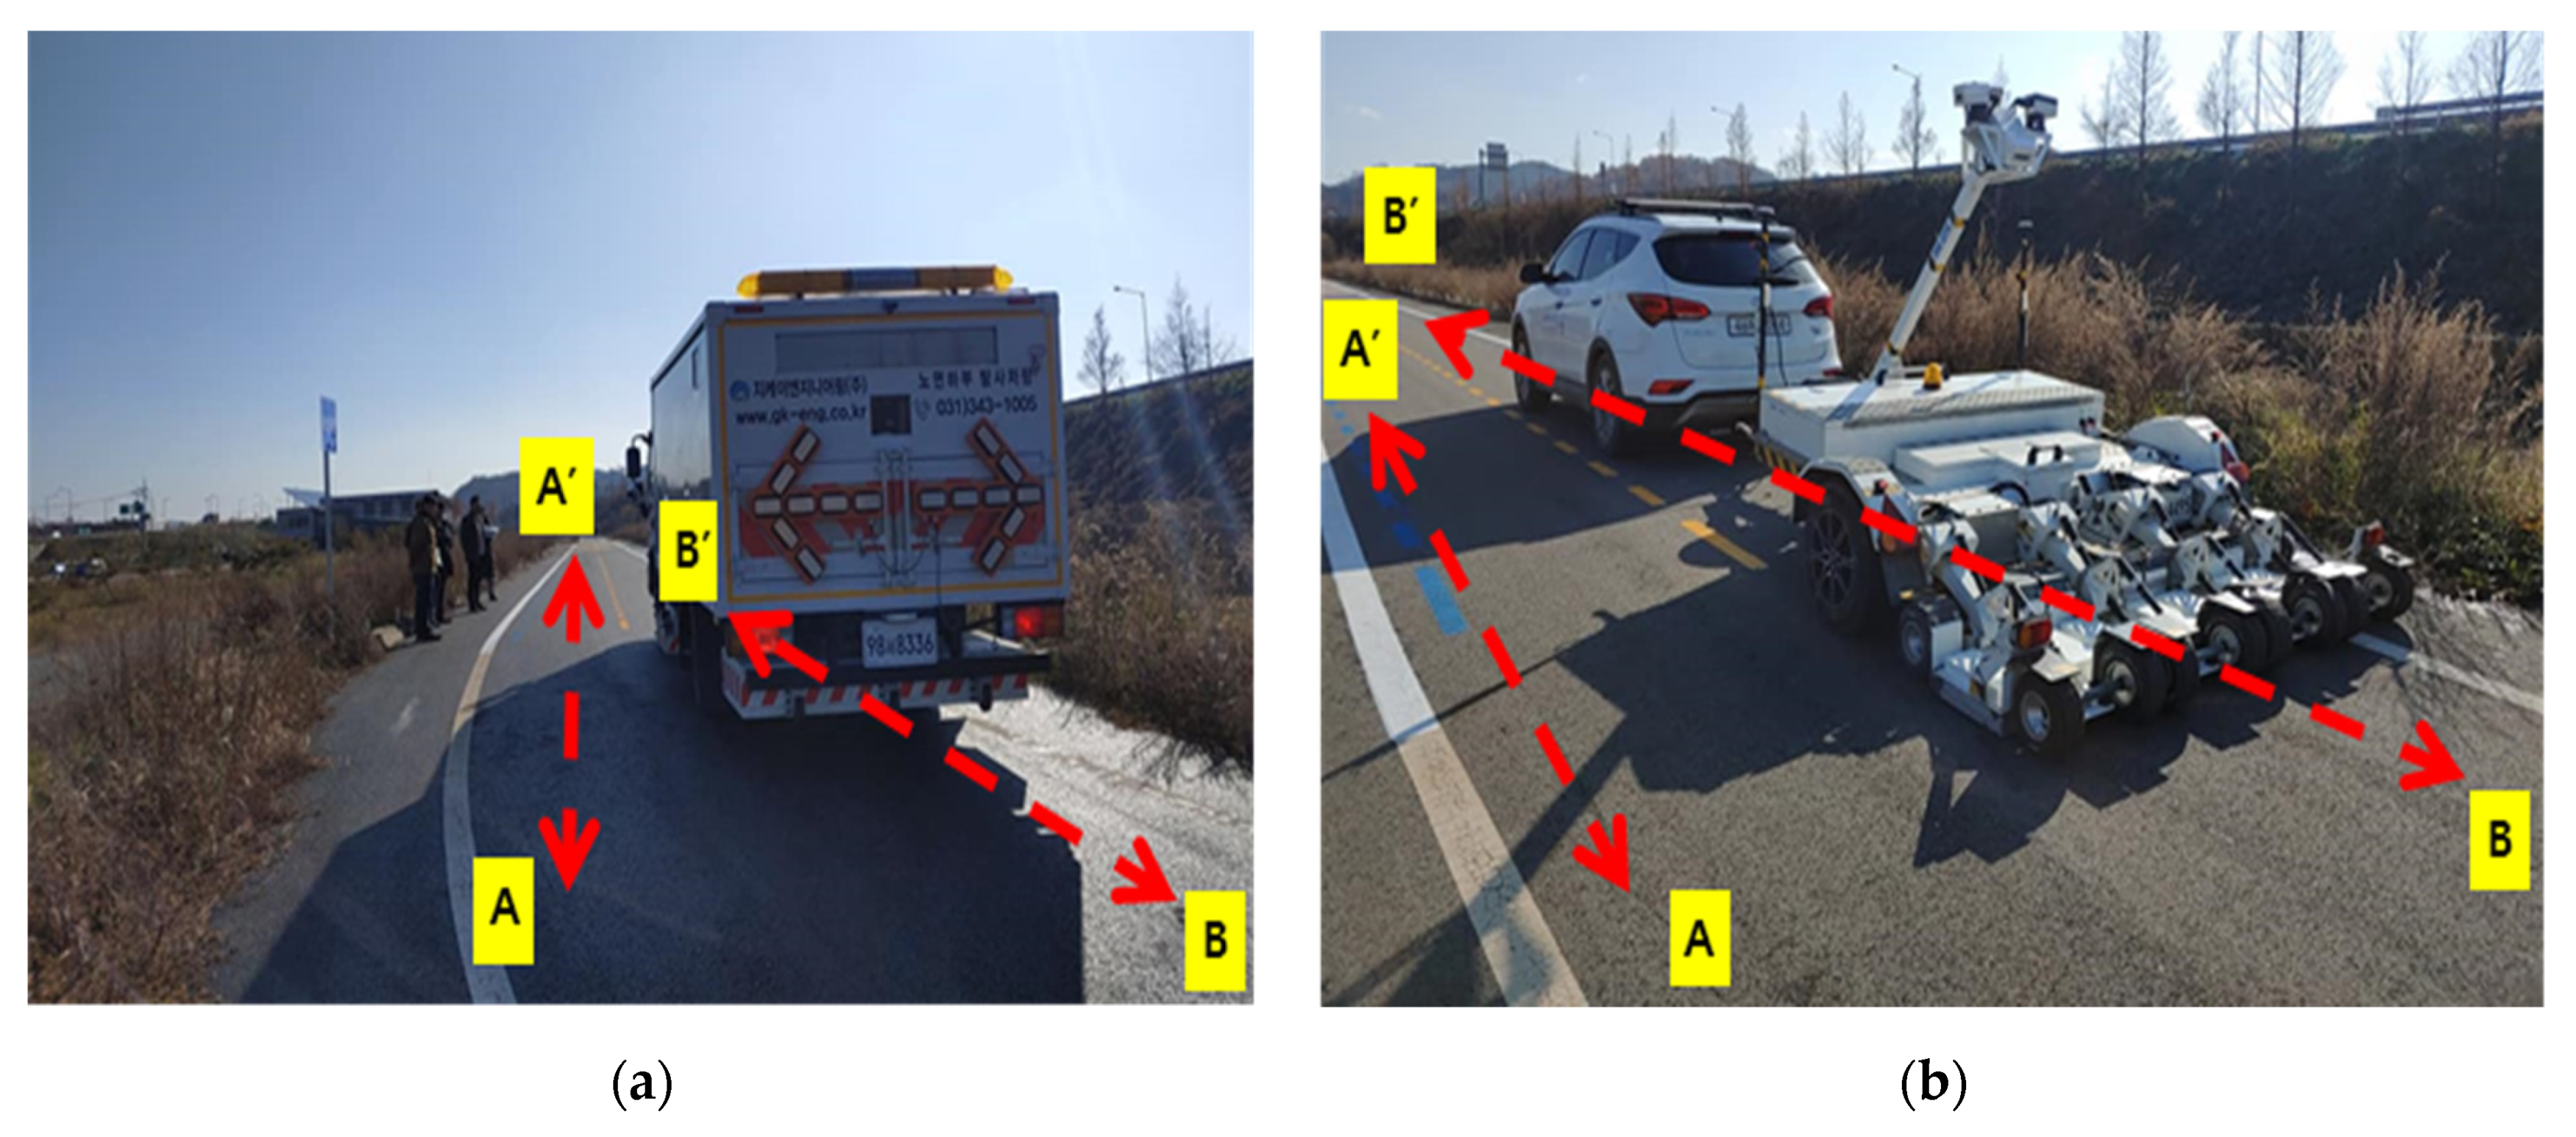
The frequency of the GPR antenna should be carefully selected according to the weather condition and objective. In general, a high-frequency antenna can obtain results with good resolution but has a shallower depth range. On the other hand, a low-frequency antenna can guarantee a relatively deep detection depth, but the resolution is low and the volume of the antenna becomes large, reducing the detection efficiency. Two different types of GPR were used in this study. The first system (A) used an impulse radar with a center frequency of 400 MHz. It also consists of 25 channels of antennas with interval of 100 mm and is attached at the rear of the vehicle. The software used in the analysis was rSlicer and GPRIS system Vision [61,62]. The second system (B) used antenna frequencies ranging from 100 MHz to 4 GHz with digital signal modulation. At the rear of the vehicle, 30 channels of antennas were installed at intervals of about 80 mm. The software used in the analysis is the Radar Portal Control [63]. The specifications of each equipment are summarized in Table 2, while the testing setups are shown in Figure 4.
System A, using a center frequency of a 400-MHz antenna, is expected to be able to explore to depths of about several meters [64]. On the other hand, System B, which uses multiple frequencies, is expected to improve the resolution of acquired data by using a greater frequency range. The estimated depth of detection on Australian roads conducted in previous studies was about 1 m using the GPR system B [65].
Field survey and testing was conducted a day after a light rain. The weather condition during testing is summarized in Table 3 from the AWS at Hongsung [66]. Tests were performed in the middle of the day after the surface was sufficiently dry. The air temperature from 11:00 a.m. to 2:30 p.m. when the field survey was conducted was 1322 °C, and the humidity was 20–50%. The center of the GPR vehicle was positioned along the test line: A-A’ and B-B’, as shown in Figure 3. In addition, the survey vehicle started a few meters before the location of the buried anomalous objects on the asphalt pavement. At the center of the vehicle, GPR data was collected first on the asphalt pavement, the concrete pavement and CRCP pavement with a traveling speed of 50 km/h or less on the test road along the sections A-A’ and B-B’. At the time of investigation, the age of concrete pavement was about 2.4 years.
The location information of the buried objects in the testbed was made known for easier interpretation of the GPR data; meanwhile, the depth was analyzed by assuming the dielectric constant of the medium.
3.3. GPR Data Analysis
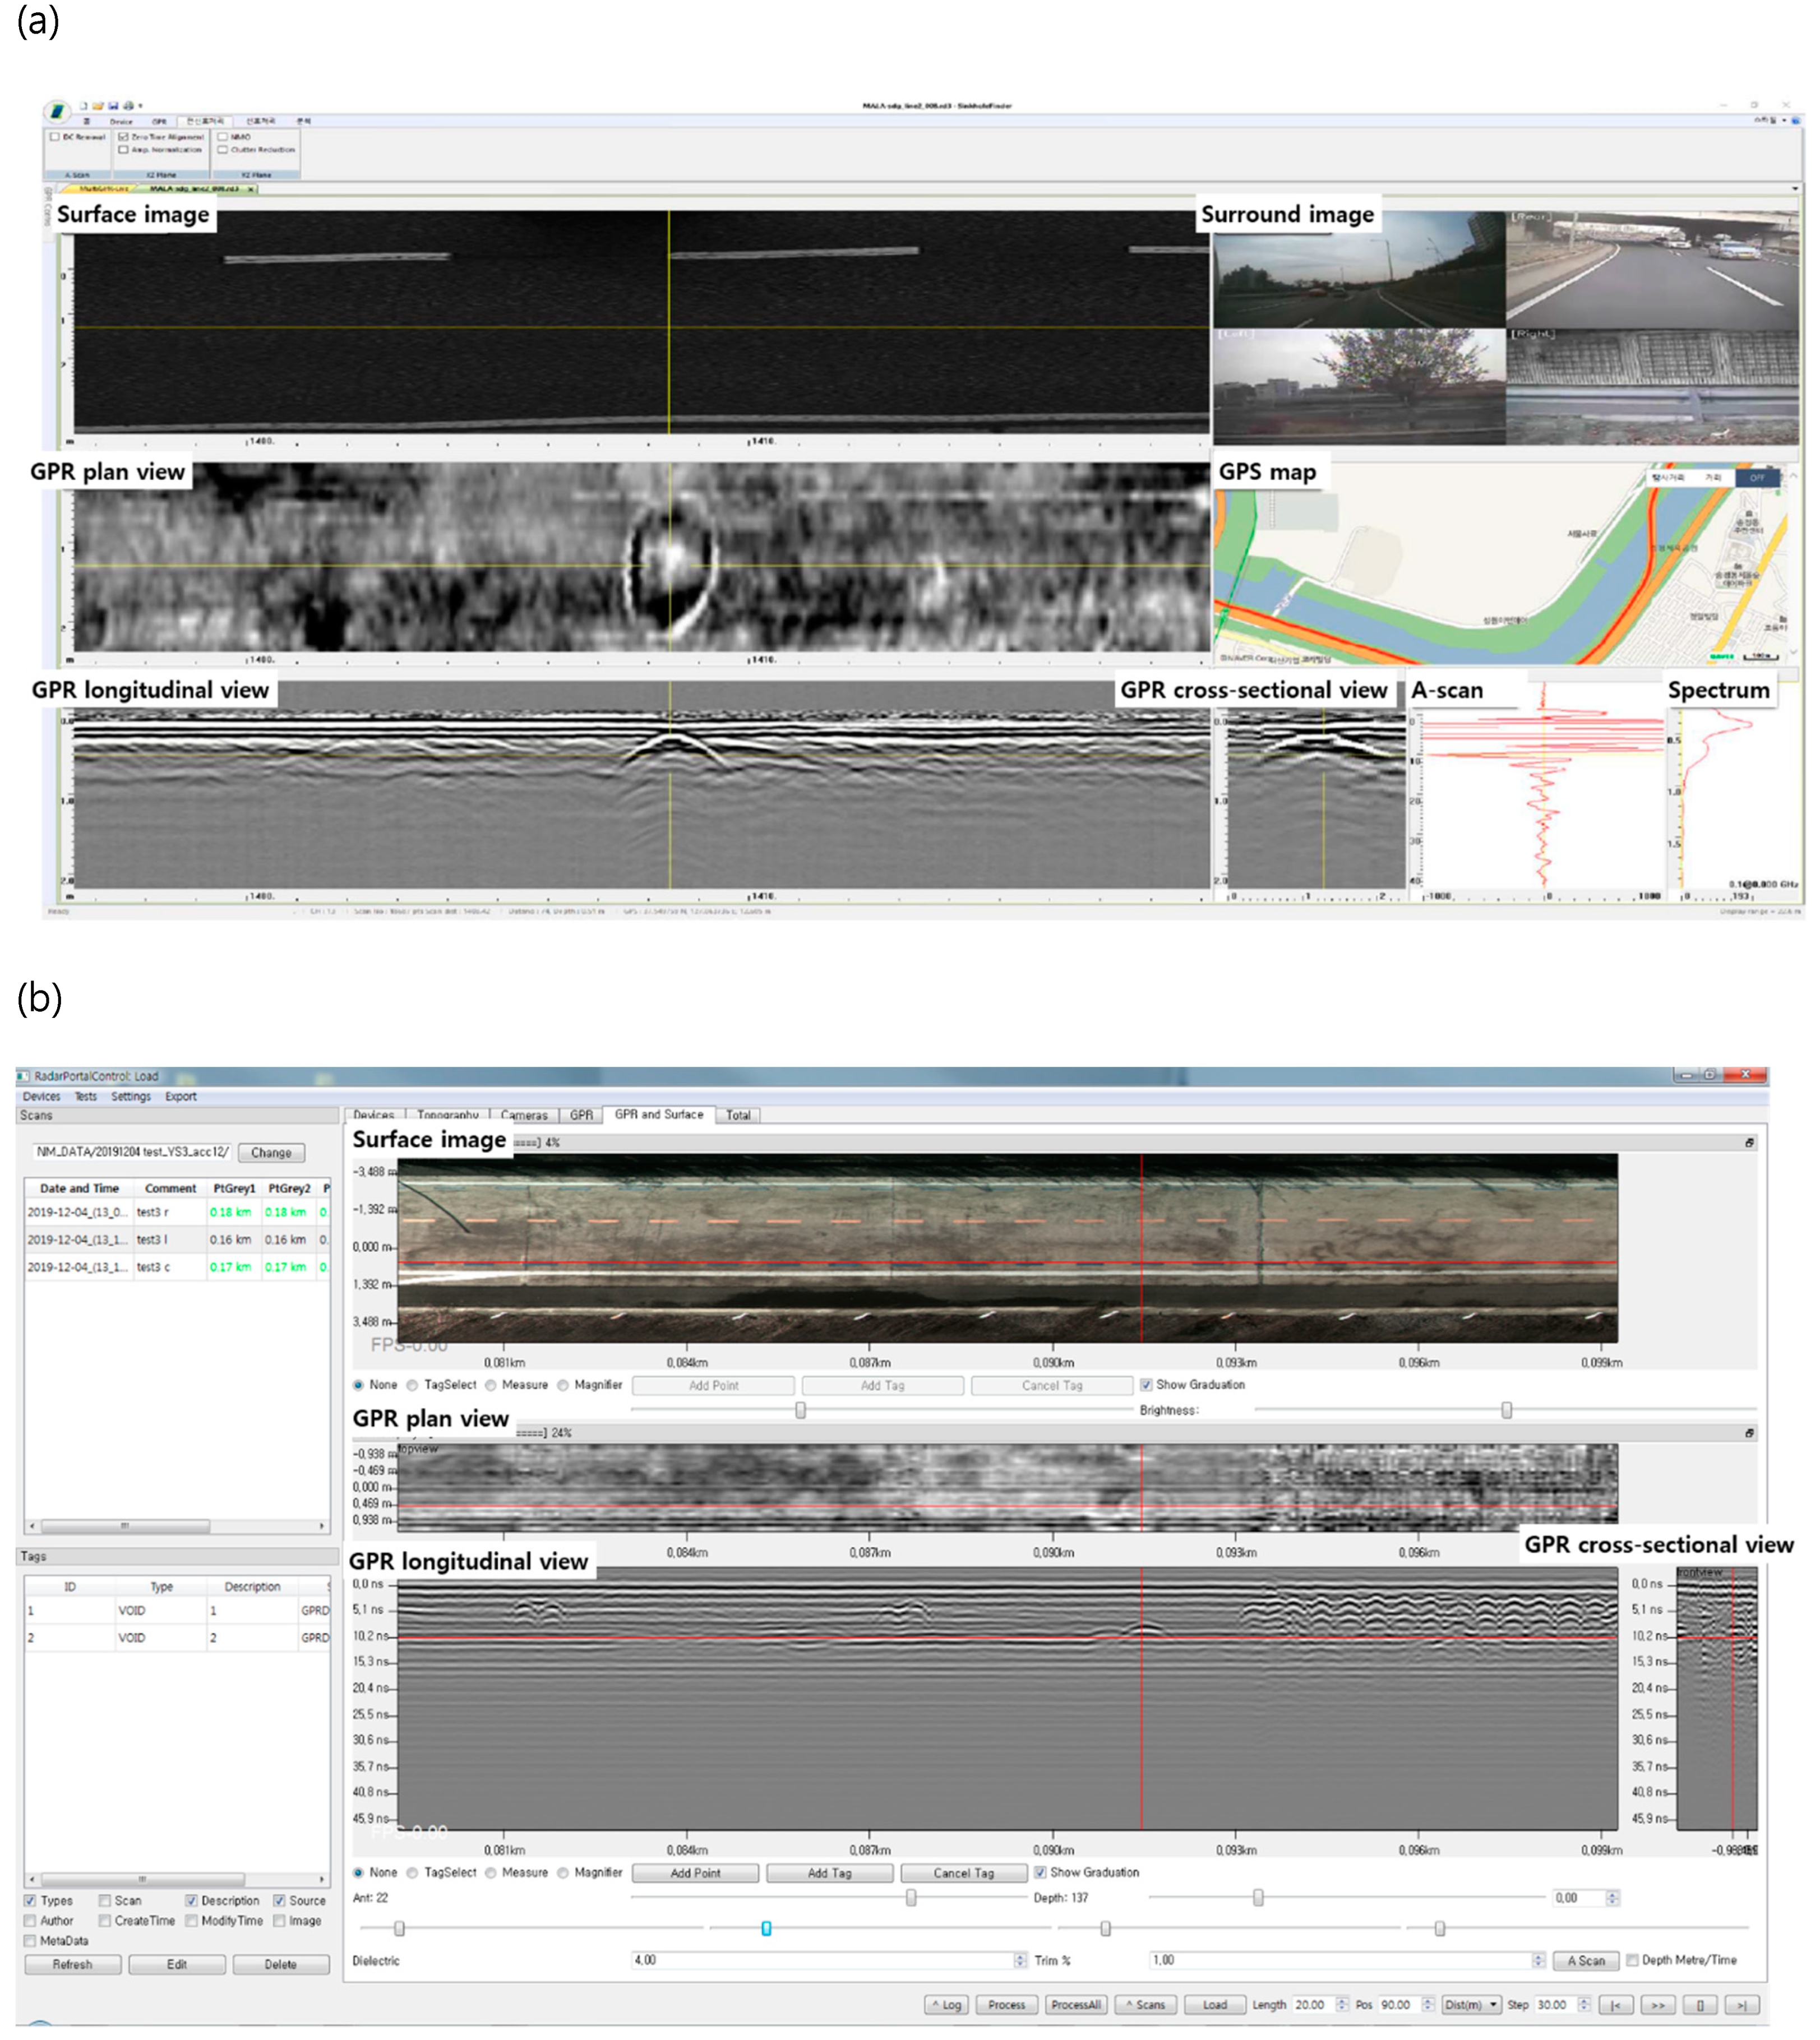
Interpretation of the GPR data obtained from the testbed was analyzed by experts from the equipment suppliers. All GPR data were aligned with the longitudinal and transverse positions using the Global Positioning System (GPS) and Distance Measuring Instruments (DMI) acquired together during the field survey. The depth direction at the origin of survey and the data acquired from the survey, which is perpendicular to the survey direction, wad adjusted. In the case of System A, which acquired about 1800 air-cavity signals on domestic asphalt pavements, background removal and Kalman filter were applied using the manufacturer’s proposed post-processing software to improve the signal, but the migration method was not applied [67,68]. After zero-position and interpolation, data were checked in terms of the linkage of the GPR-received waveform in the top view and cross-section; in addition, the phase inversion and amplitude change of A-scan were analyzed, as shown in Figure 5a. By linking the image information and each waveform, the position of the abnormal signal (circle and square shape in the plan view and hyperbola shape in the cross-section) is identified through careful adjustment of the gain of the GPR signal. The proposed abnormal signals were checked once more by another group of GPR analysts in that company to confirm the abnormal signals and positions. In the case of System B, which was introduced recently (September 2016), efforts have been started in making necessary Korean standards using this system. GPR data in the 200-MHz~3-GHz frequencies band were empirically adapted in the entire frequency range and specific array positions without another post-processing method. After positioning the GPR signals, by linking the image information and each waveform, the position of the abnormal signal is identified through careful adjustment of the gain of GPR signal, which is the same as System A.
Since the purpose of this study is to compare GPR results obtained from different equipment, the analyzed results are limited to the range that can be compared by each type.
In the plan view of the 3D signal, a certain shape was formed along the boundary, and the signal showing the hyperbolic shape in the longitudinal and crossing signals was defined as anomalous objects. The analyzed results submitted by each company were compared selectively for the same type of anomalous objects for reliability. For the depth analysis of the anomalous objects, the dielectric constant was assumed to be 9 for System A and 8 for System B. These values were determined by each operator to minimize the depth error in consideration of the dielectric constant of the road pavement and the lower base layer.
4. Test Results
4.1. Asphalt Pavement
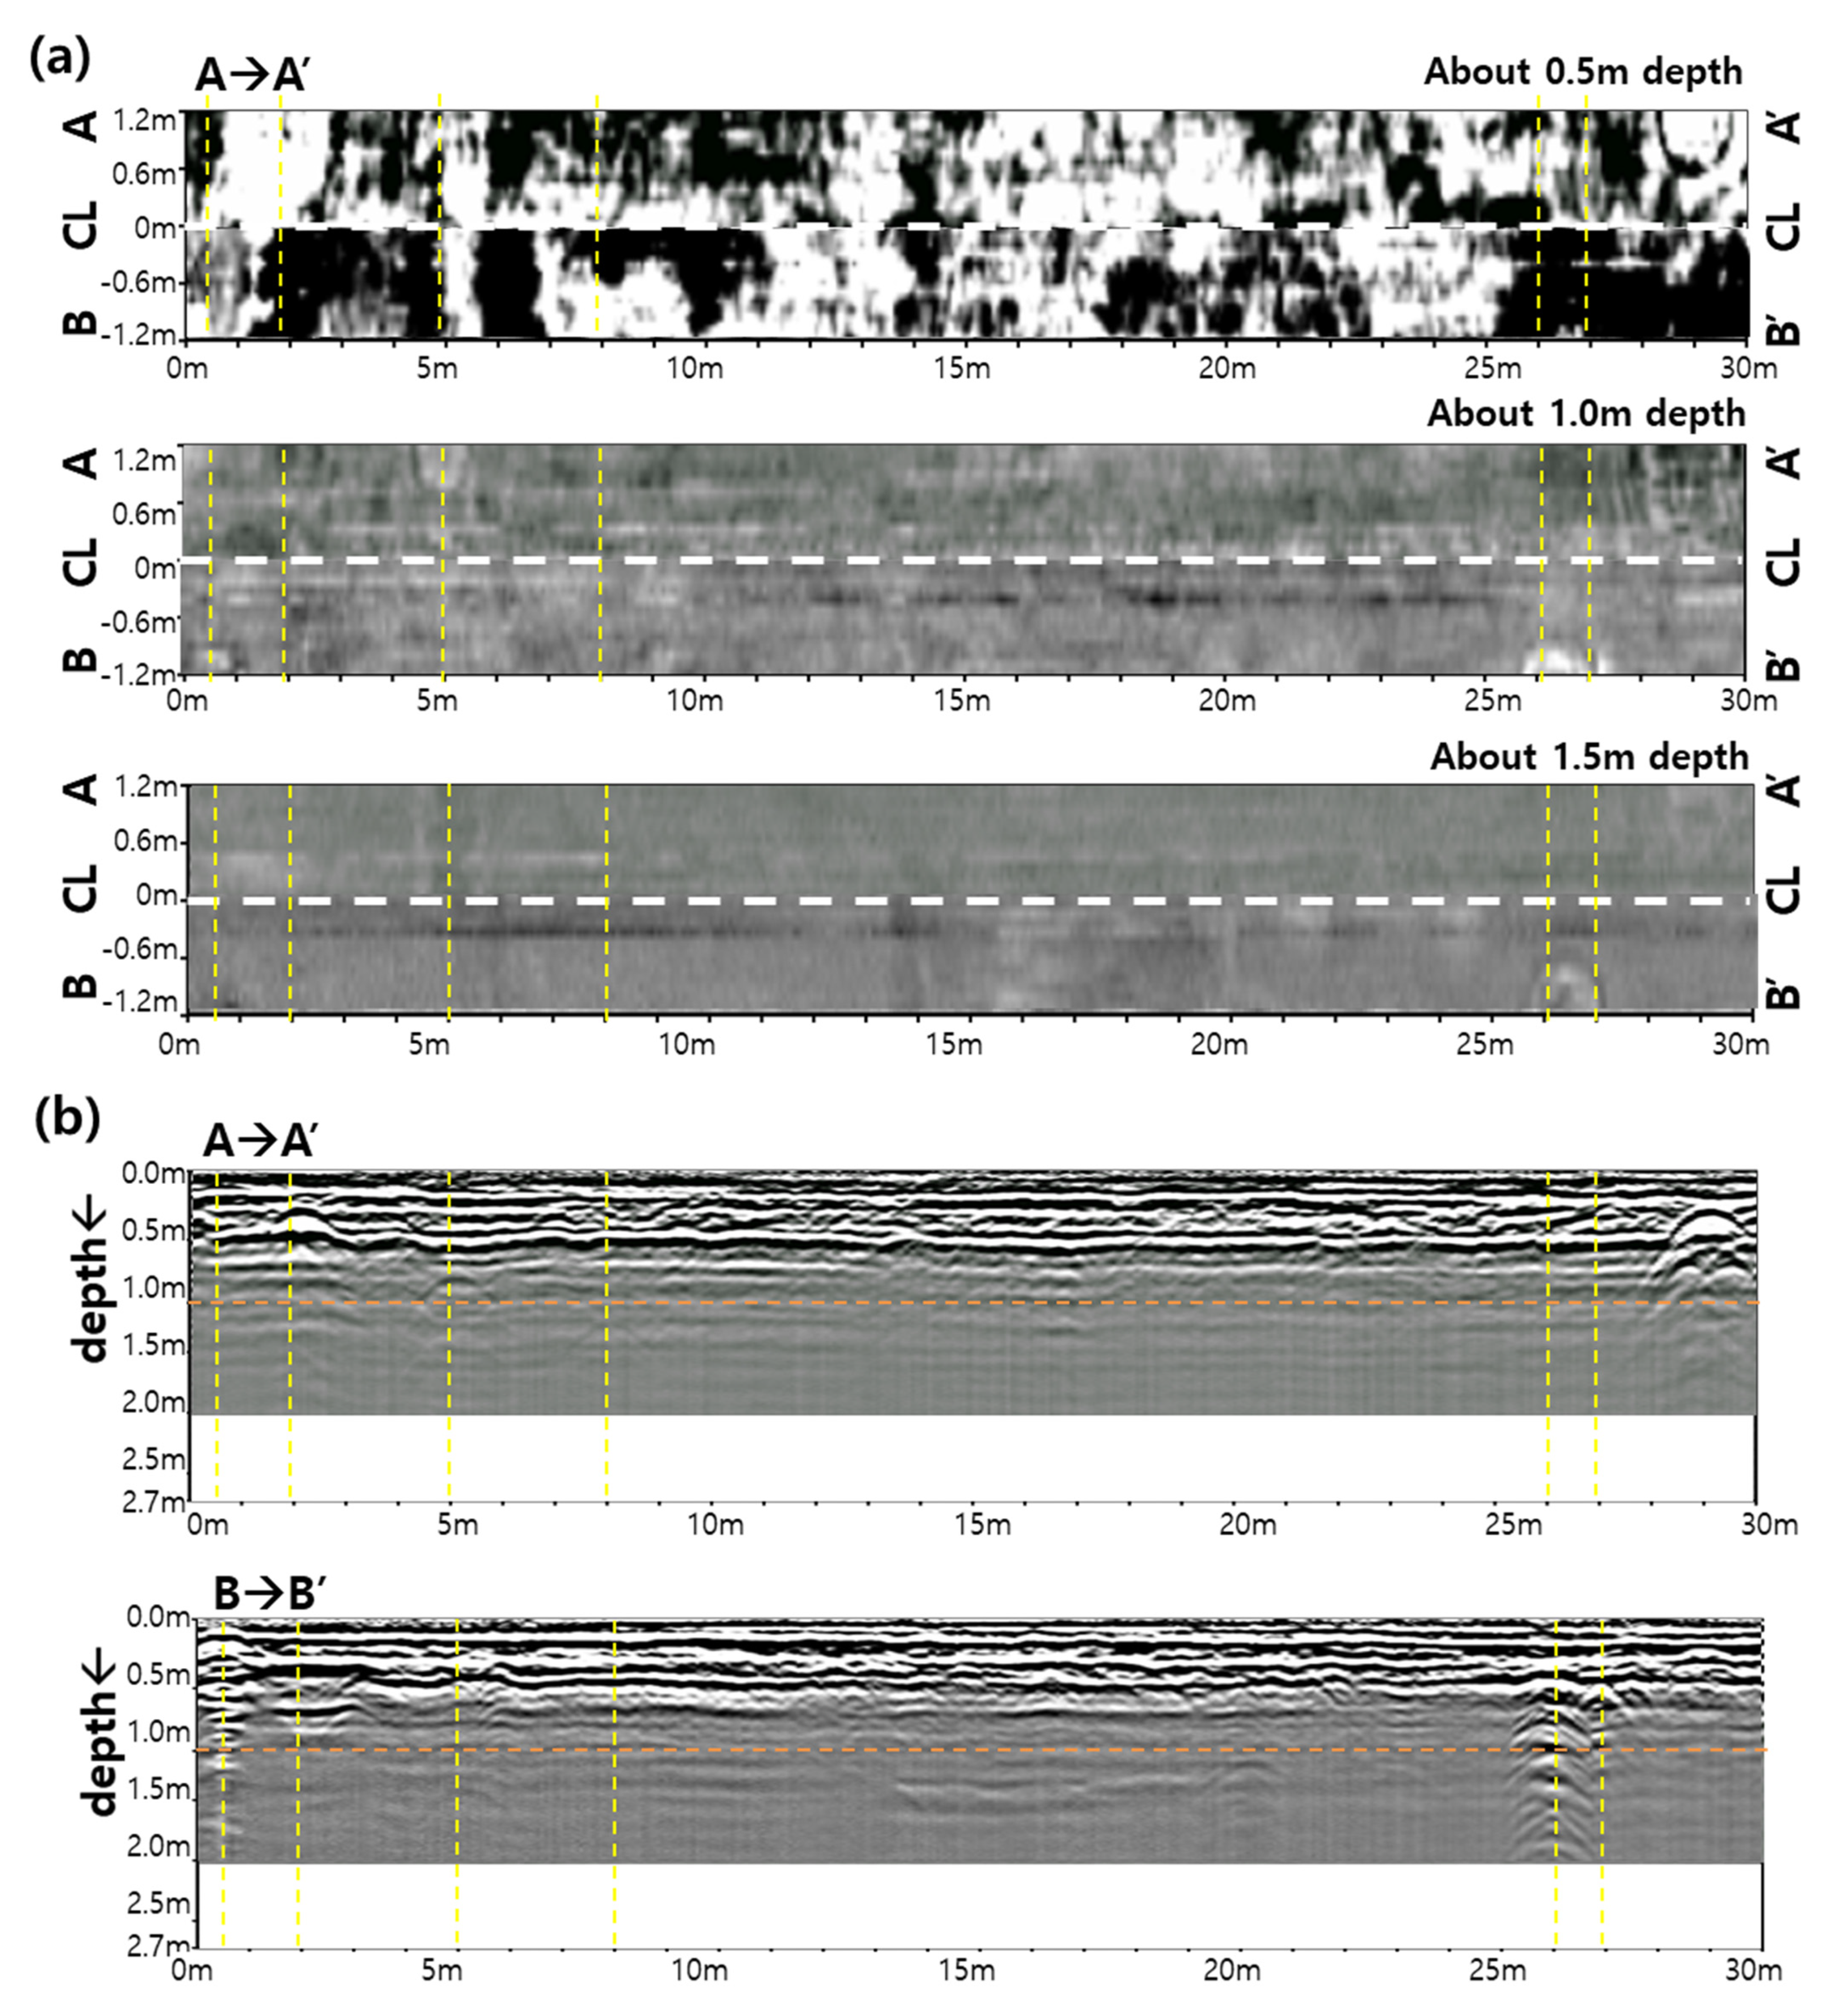
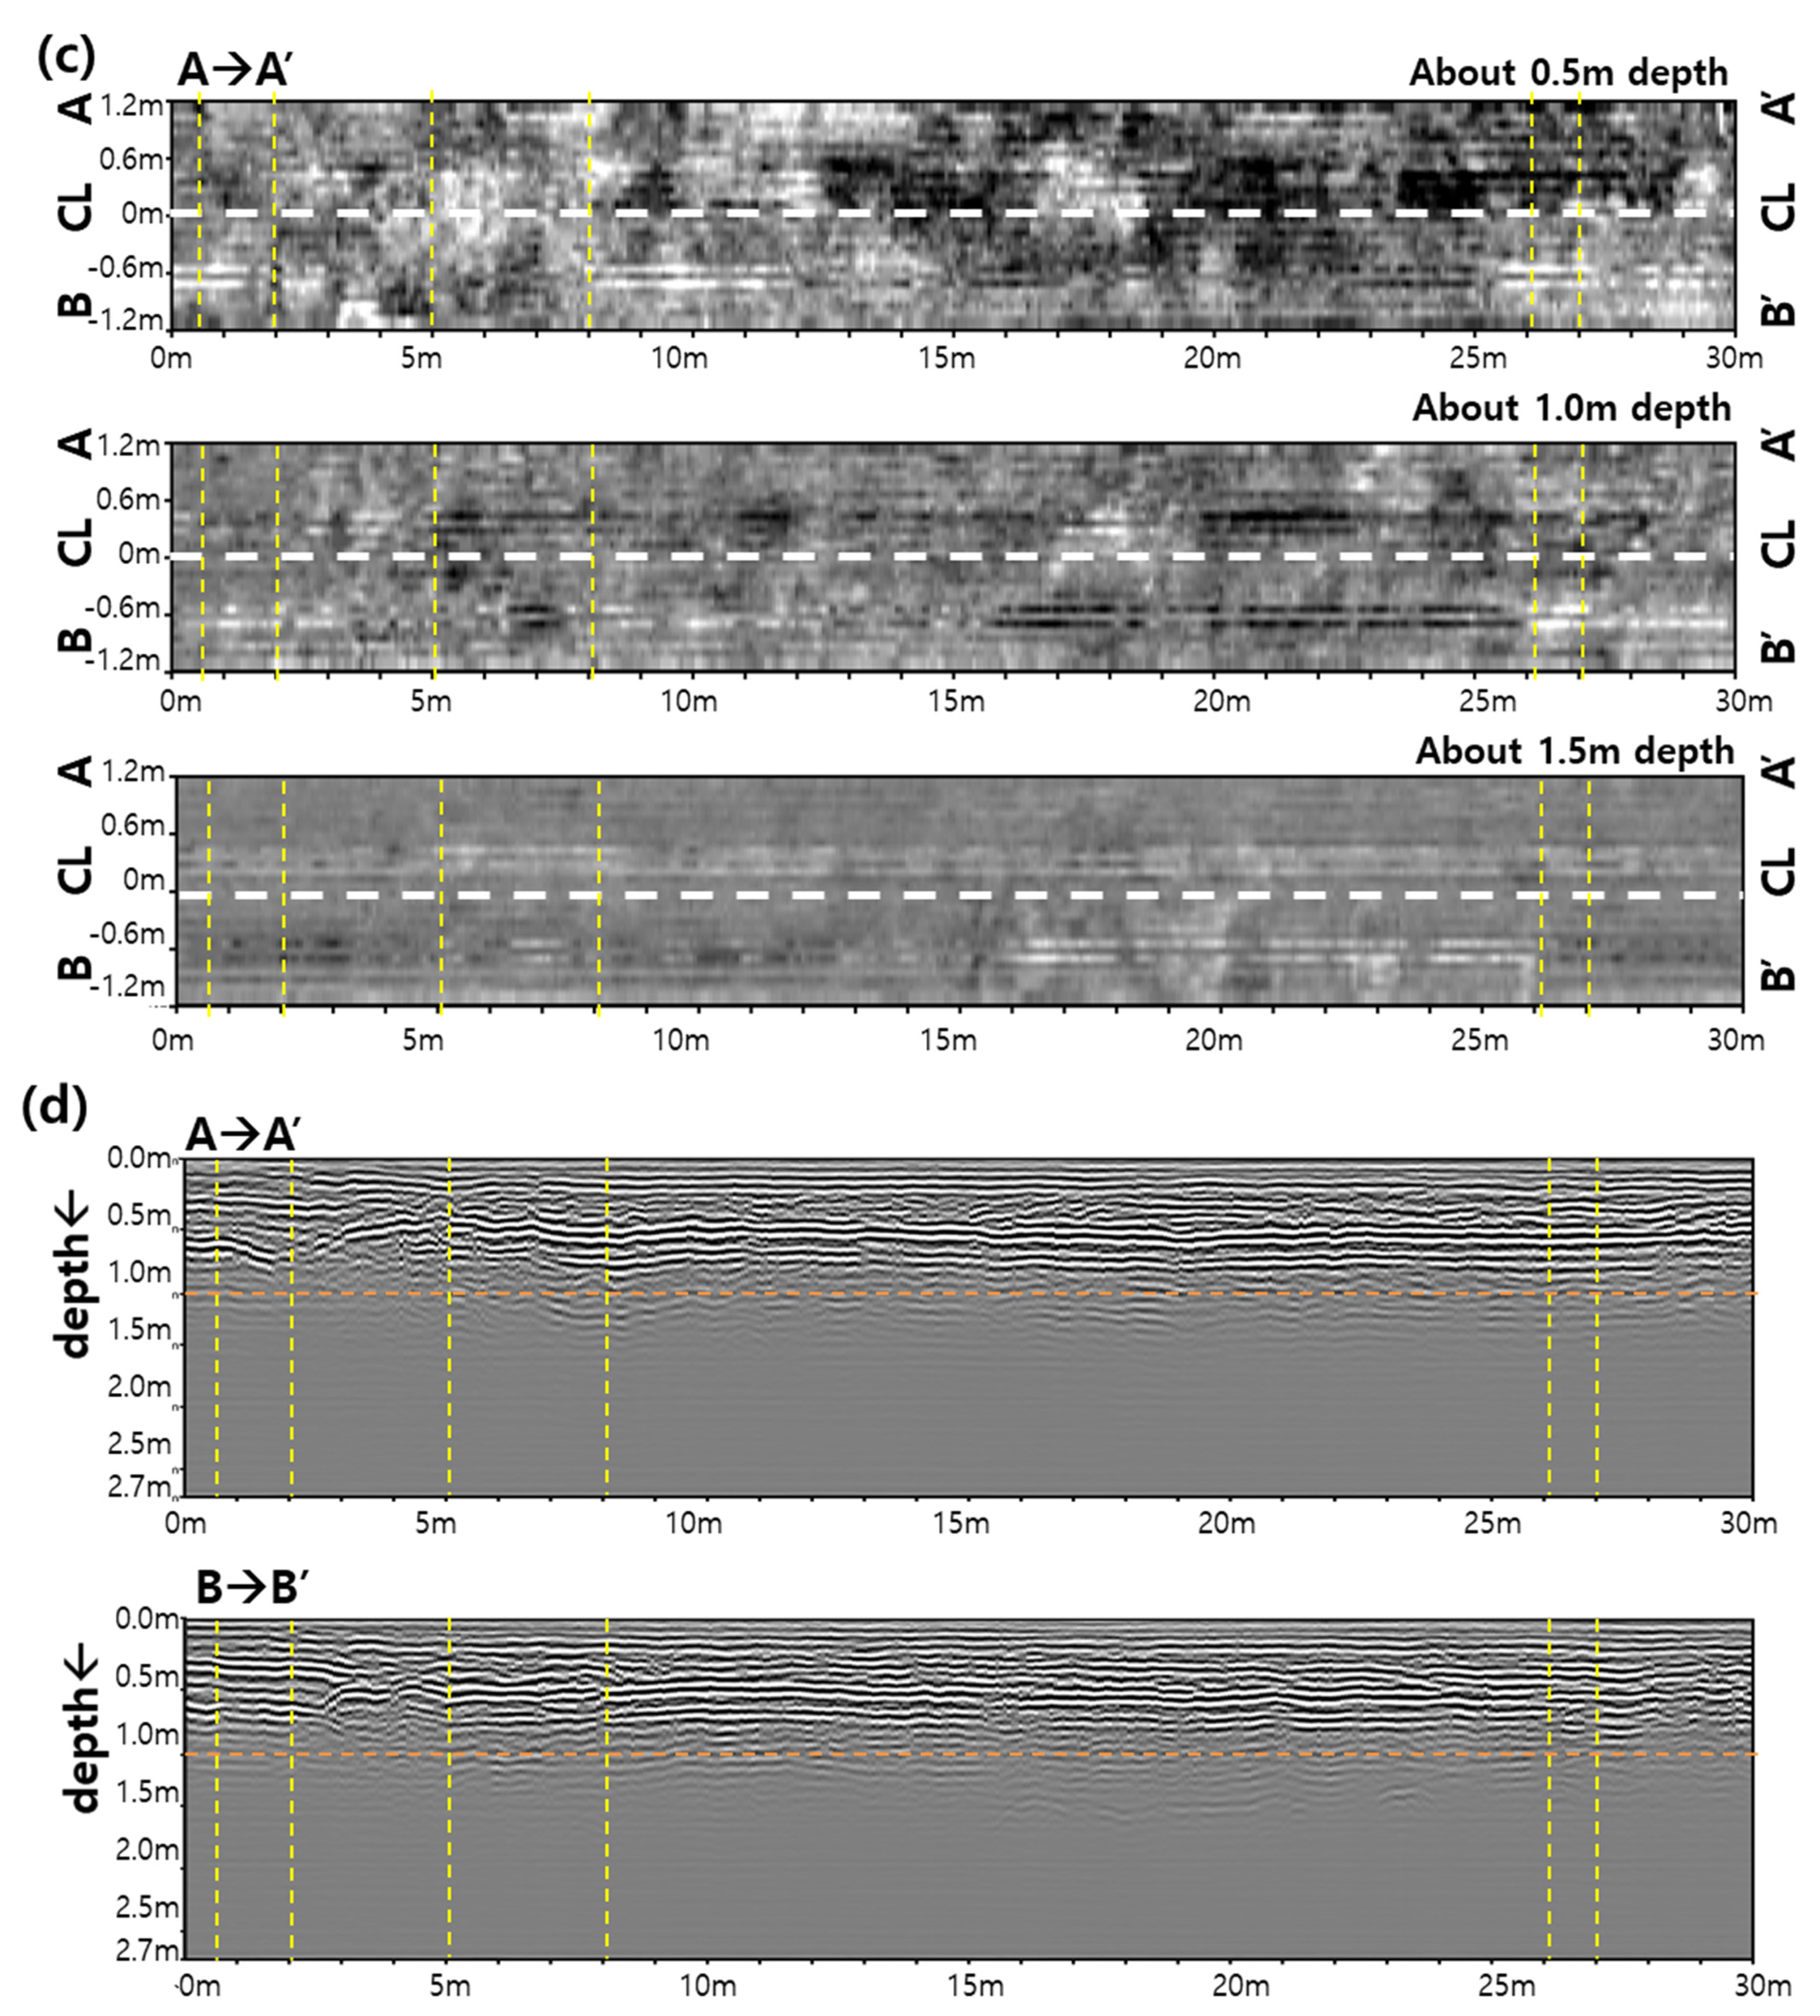
Figure 6 shows the GPR data obtained from the surveyed asphalt pavement. In Figure 6a,c, the plan view of the GPR signal obtained by both GPR systems A and B shows the signals with estimated depths of 0.5, 1.0 and 1.5 m from the pavement surface. As shown, the X-axis is the longitudinal distance from the starting point A (or B) of the survey line A-A’ (or B-B’) (m), and Y axis is the transverse distance (m) around survey line (see Figure 3). The shallower the depth of the GPR signal, the sharper the contrast, but the greater the depth, the softer (blurred) the GPR signal becomes. This is due to signal attenuation (energy reduction) wherein as the GPR wave propagates through the medium, in which the amplitude (energy) of the received wave obtained at shallower depth is greater than the amplitude (energy) of the received wave obtained at deeper depth (see Figure 1).
Figure 6b,d are longitudinal cross-sections of the GPR signals obtained along the A-A’ survey line using the GPR systems A and B. In the figure, X-axis is the longitudinal distance from A (m), and Y-axis is the estimated depth (m) from the road surface. Comparing the longitudinal cross-sectional views of the GPR signals, it can be seen that the contrast difference of the signals suddenly changed at a depth of more than 1 m. At a depth of 2 m or more, there is a difficulty to distinguish reflections from noise. It was assumed that the performance with regards to the pavement depth investigation between the two GPR systems was not that significant.
Figure 6a,b shows the GPR data of the GPR system A using 400-MHz center frequency, meanwhile Figure 6c,d shows the results of the GPR system B using a wide range of frequencies of 200 to 3000 MHz. Compared with the plan view, GPR signals were thicker reflection (horizontal and parabolic) lines and bigger contrast obtained by the center frequency of 400 MHz than of the GPR system B. At 0.5, 2, 5, 8, 26 and 27-m extensions where the anomalies were found (detailed GPR signal shows in Section 4.3), some hyperbolas are seen in the plane and longitudinal views (Figure 6a,b). Meanwhile, the surveyed scans of the GPR system B using the wide frequency band showed higher resolution. In the longitudinal section (Figure 6d), some hyperbolic curves are seen estimated to be the reflected signals from the EPSs or other simulated anomalies, but they are barely noticeable in the plan view.
4.2. Concrete Pavement
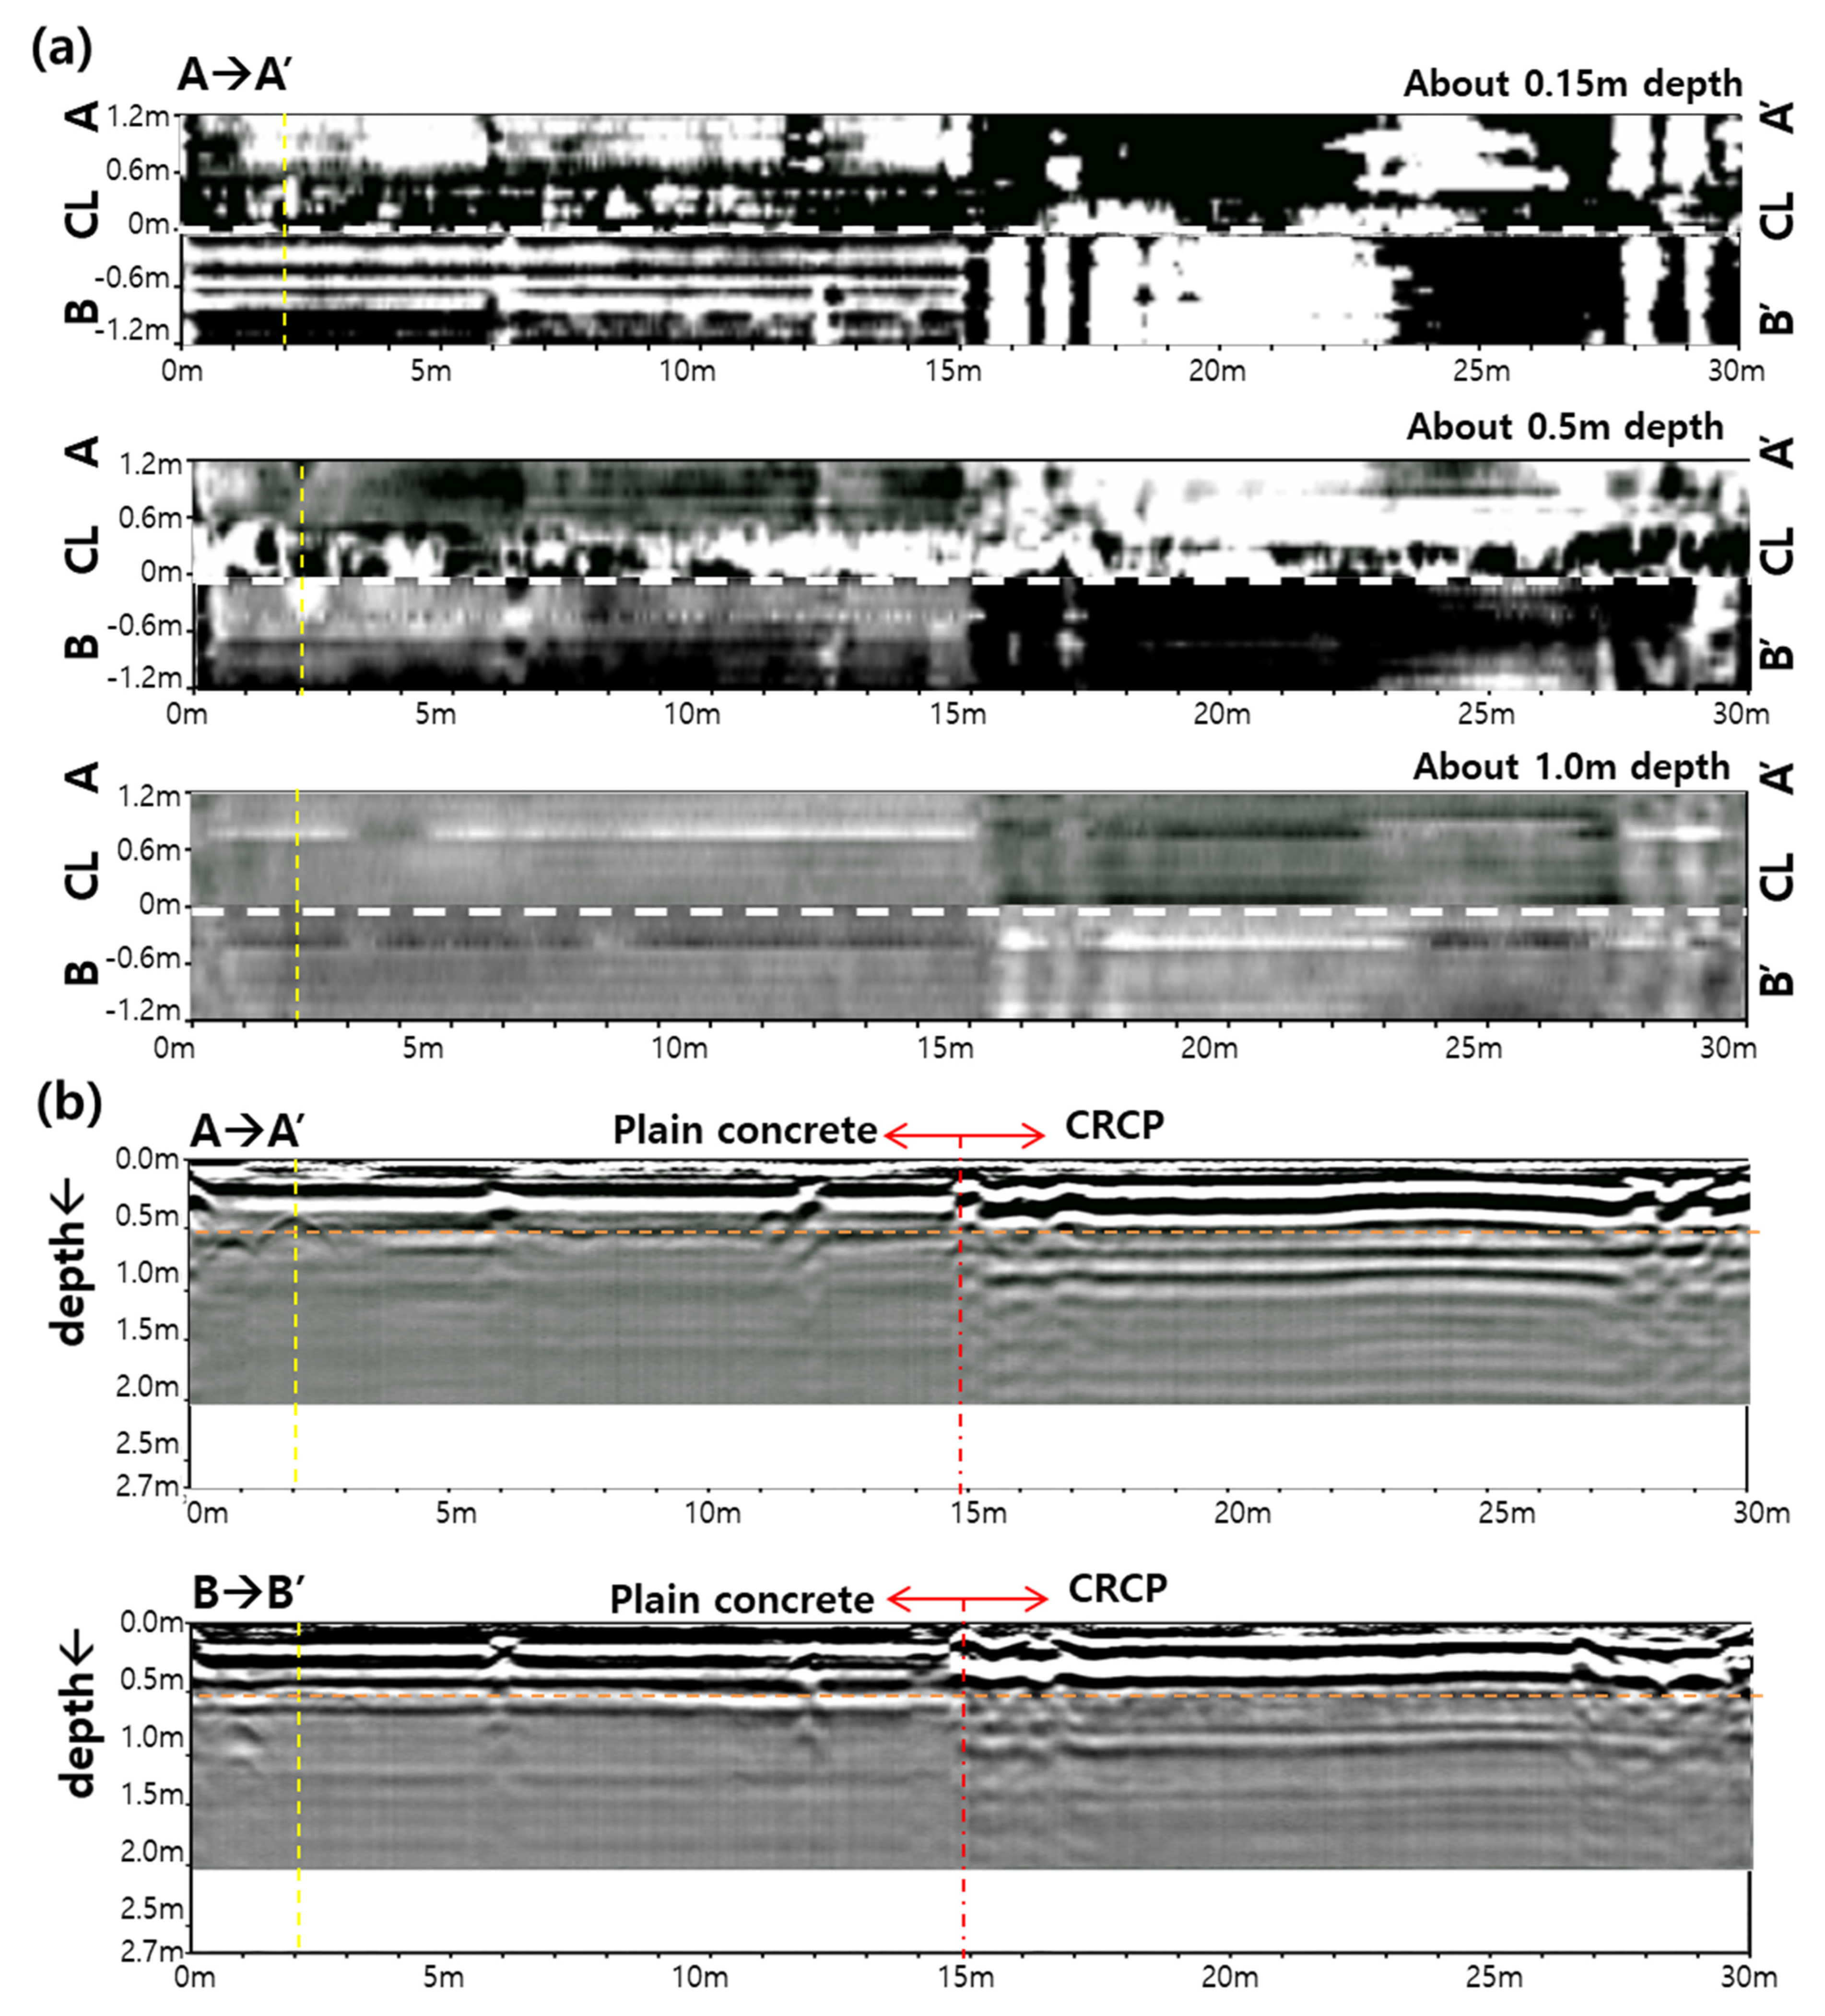
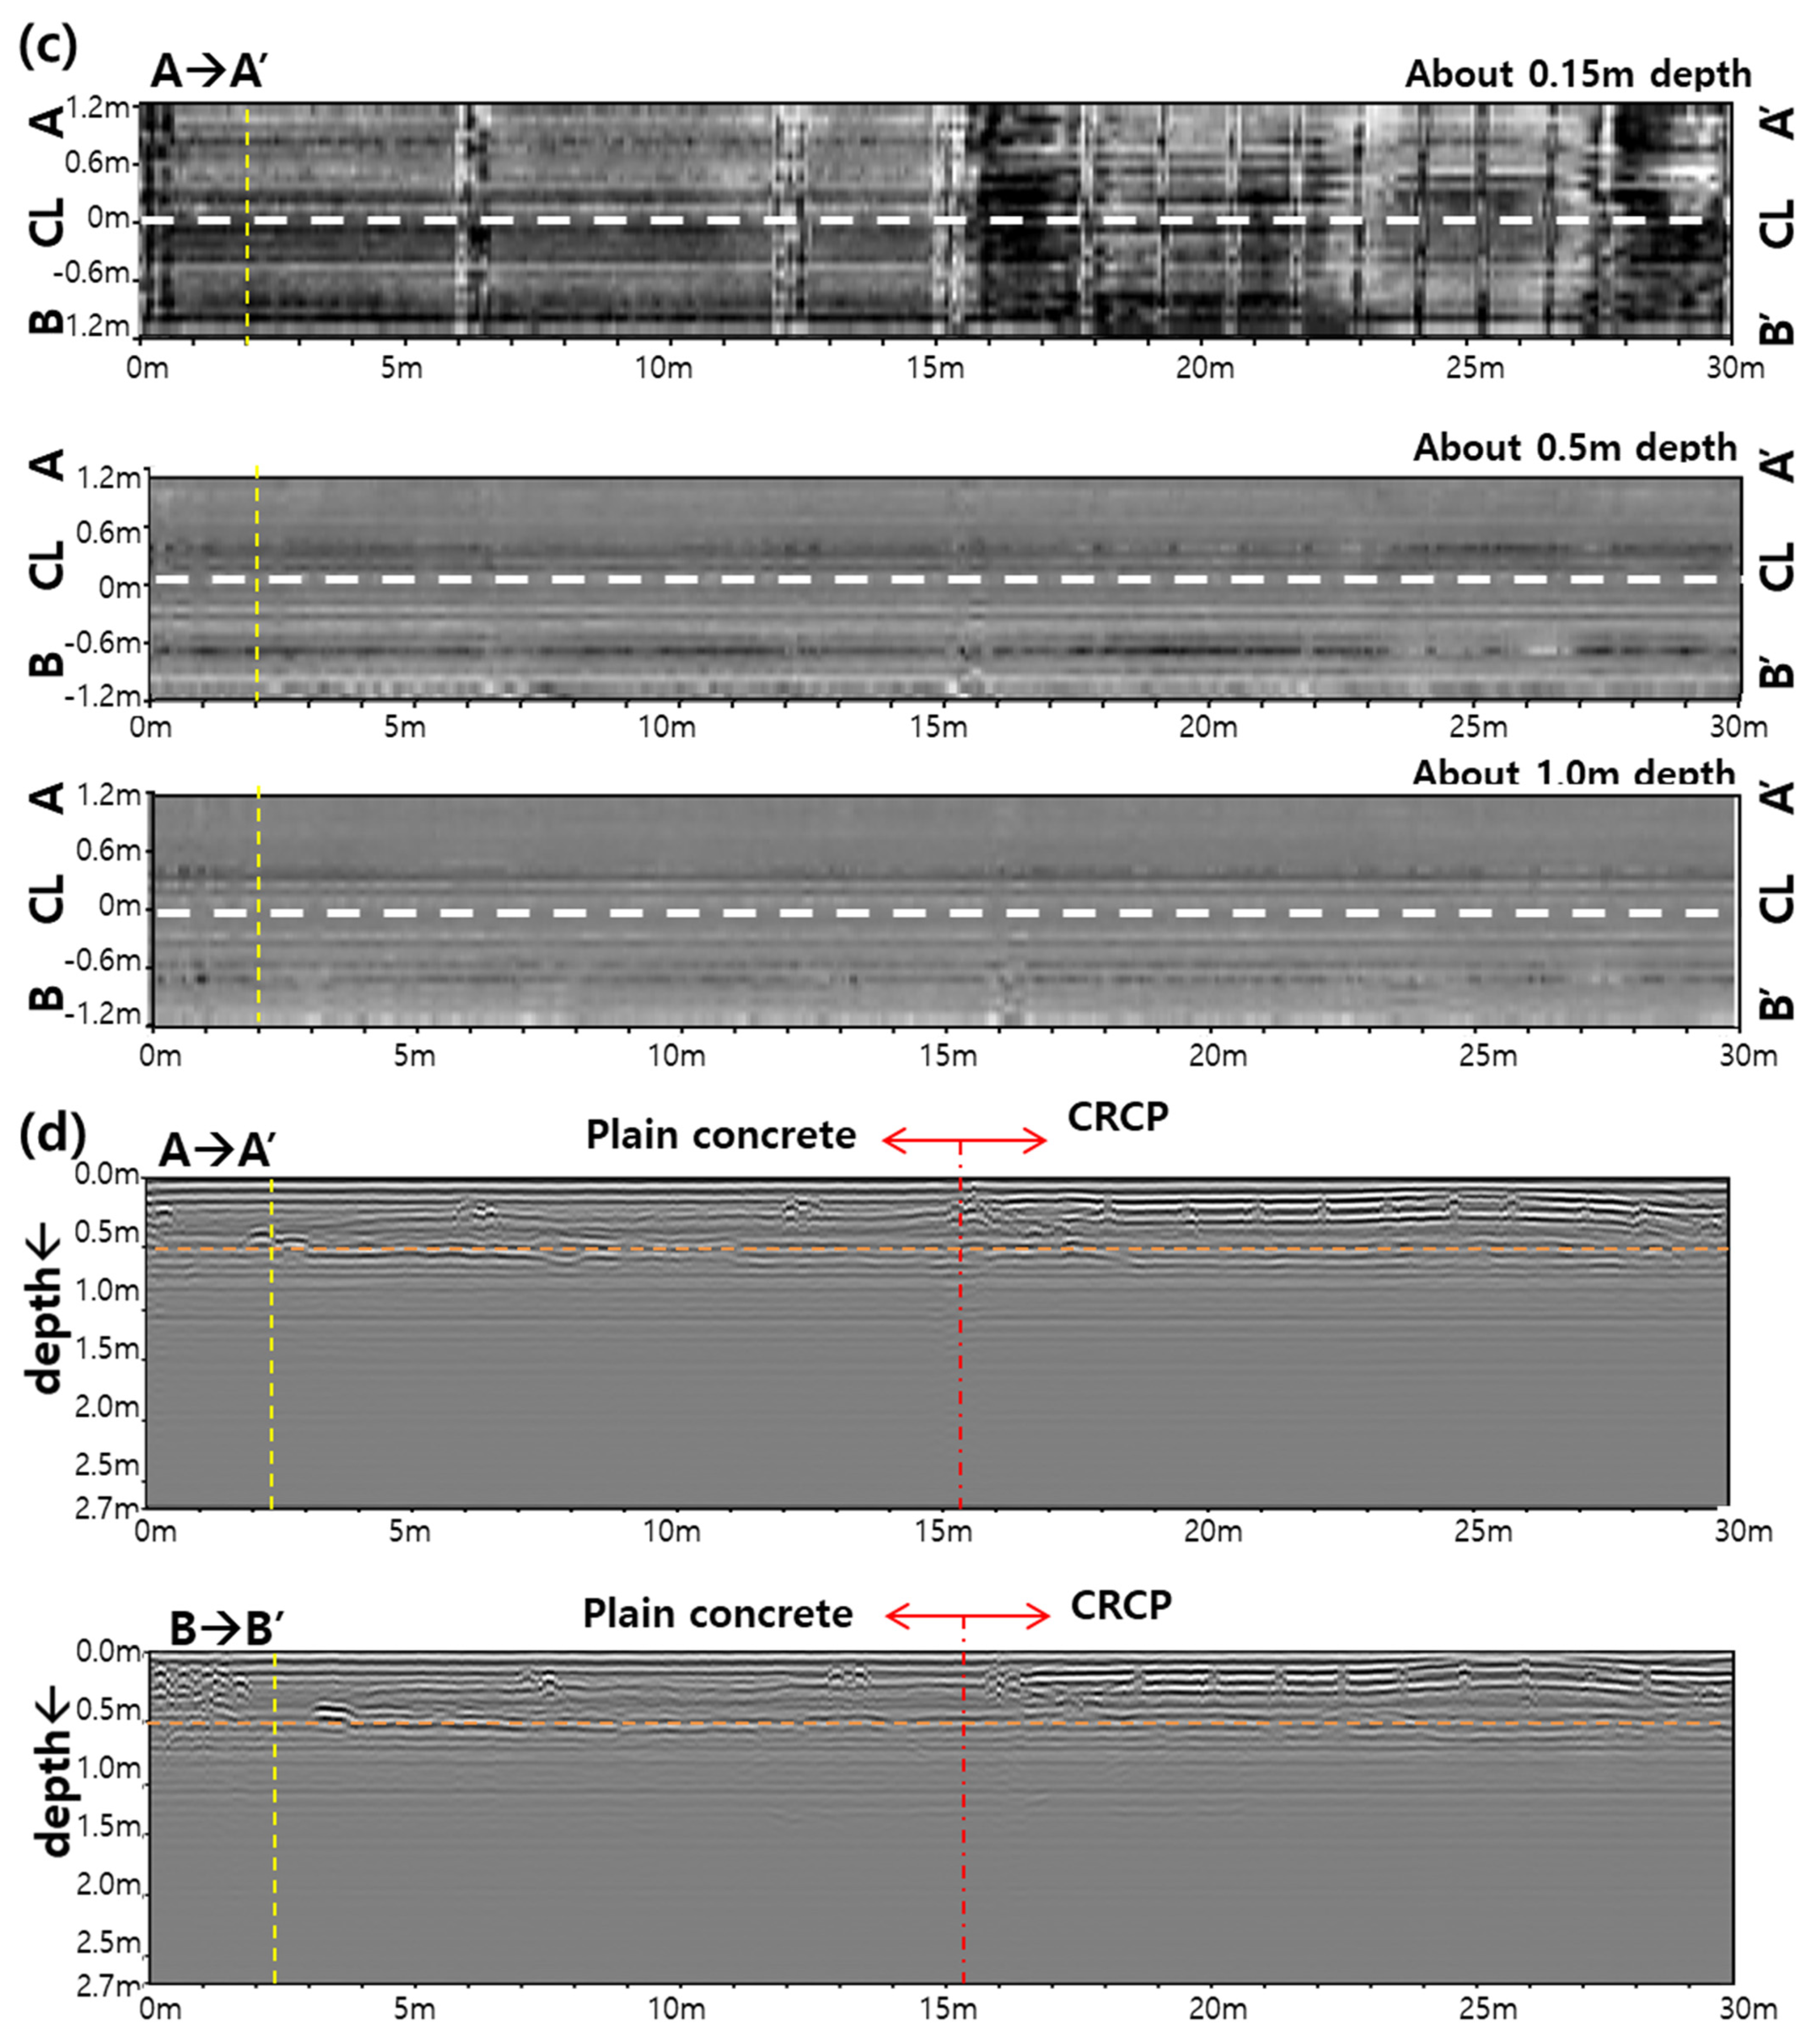
Figure 7 shows the GPR data obtained from the concrete pavement surveys. Figure 7a,c are the plan views of the GPR signal obtained by the GPR systems A and B, showing signals with estimated depths of 0.15, 0.45 and 1.0 m from the top. As shown, the plain concrete pavement is located at 0 to 15 m, while reinforced concrete pavement (CRCP) is placed from 15 to 30 m. The X- and Y axis were the same as in Figure 6. The plan view at the shallowest depth (estimated depth of 0.15 m) shows the shrinkage joint in the plain concrete pavement and rebars installed in the middle of the CRCP section. Compared with Figure 6, the contrast difference of the plan views of the GPR data on the concrete pavement was generally darker than those of the asphalt pavement. The contrast of the signal obtained at the estimated depths of 0.5 and 1.0 m under concrete pavement were similar (GPR system B) or darker (GPR system A) than those under the asphalt pavement at the estimated depth of 1.0 and 1.5 m each. This is due to the different in attenuation of radar waves propagating through the media with different EM properties. In other words, this seems to be the result of greater attenuation per unit depth in propagation through concrete because it has a larger dielectric constant and conductivity of young concrete than asphalt [19,43,50].
Figure 7b,d are longitudinal cross-sections of the GPR on the A-A’ survey line using the GPR systems A and B. Hyperbolic curves are shown, which were reflected from joints and rebars as in the previous plan view. It can be seen that the contrast difference of the signals suddenly decreased at an estimated depth 0.5 m, which is close to the bottom of concrete pavement. Going deeper from 0.5 m, it is almost impossible or difficult to distinguish the reflected signals of the GPR data.
As discussed, Figure 7a,b are from the surveyed data of the GPR system A, and Figure 7c,d are those of the GPR system B. The surveyed GPR data from system B shows each joint and rebars very clearly at the 0.15 m estimated depth at plan view. Meanwhile, even though System A shows those joints also, it is not actually clear in which each rebar is placed or positioned. It was found that the reflected waves are actually affected by the internal rebar in pavement for GPR system A, creating a continuous ringing effect of the signal occurring in CRCP section.
At a distance of 2 m and buried depth of 0.45 m where the EPS was embedded next to the bottom of concrete pavement, the reflected waveform is clearly seen in the plane and vertical plane view from the data of system A. However, it was confirmed only in the longitudinal sectional view in the scale view of system B and not from the plan view. In addition, at deeper depths, the data from GPR system B showed almost similar contrast between the plain and the reinforced concrete section. As with the asphalt pavement in Section 4.1, the difference in the depth of investigation between the two systems was not that significant.
4.3. Signal Characteristics of GPR According by the Type of Abnormality
4.3.1. Investigation Performance According to the Type of Pavement
Table 4 shows the survey results of subsurface anomalies obtained from GPR systems A and B: seven objects under the asphalt pavement, one object in plain concrete and none in CRCP. The types of anomalies detected by both GPR equipment were EPS, PE bottle and the steel plate. The maximum depth of the detected anomaly is 1 m for asphalt pavements and about 0.45 m for the concrete pavement. However, the EPS embedded at the same depth in plain concrete was not detected under CRCP. The reason is presumed due to the reflection and interference of in-placed rebars.
4.3.2. Cavity
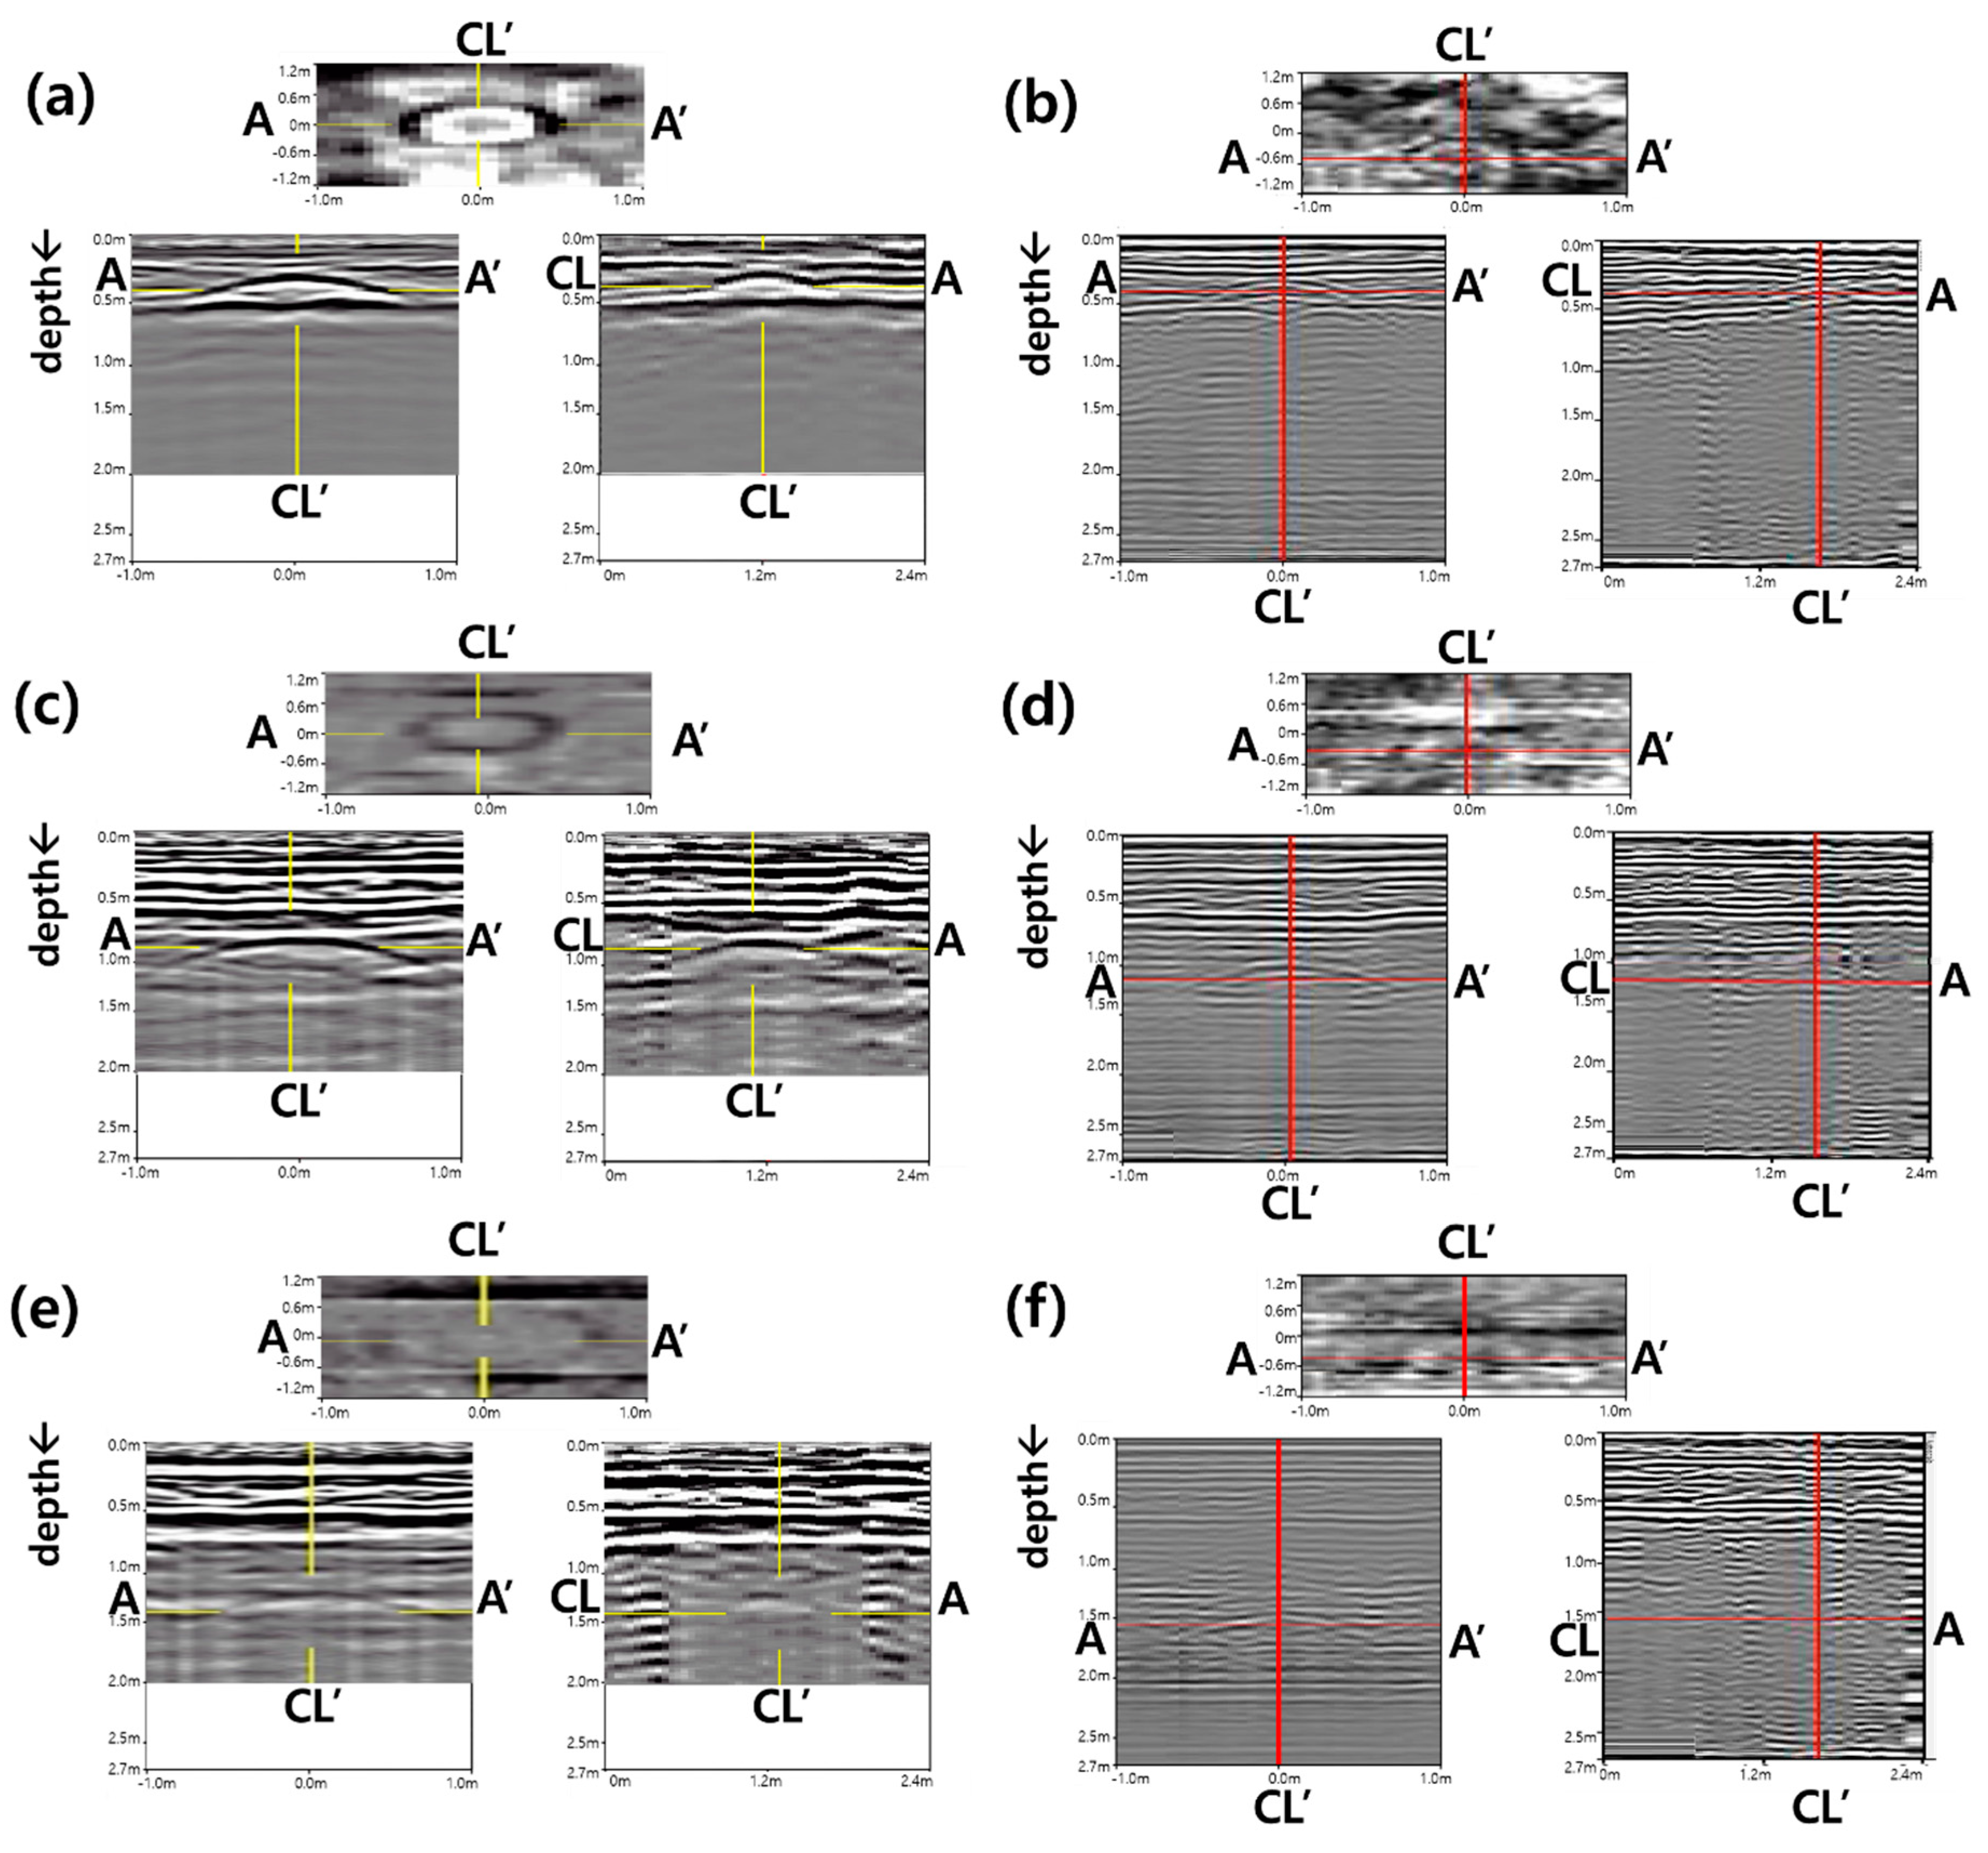
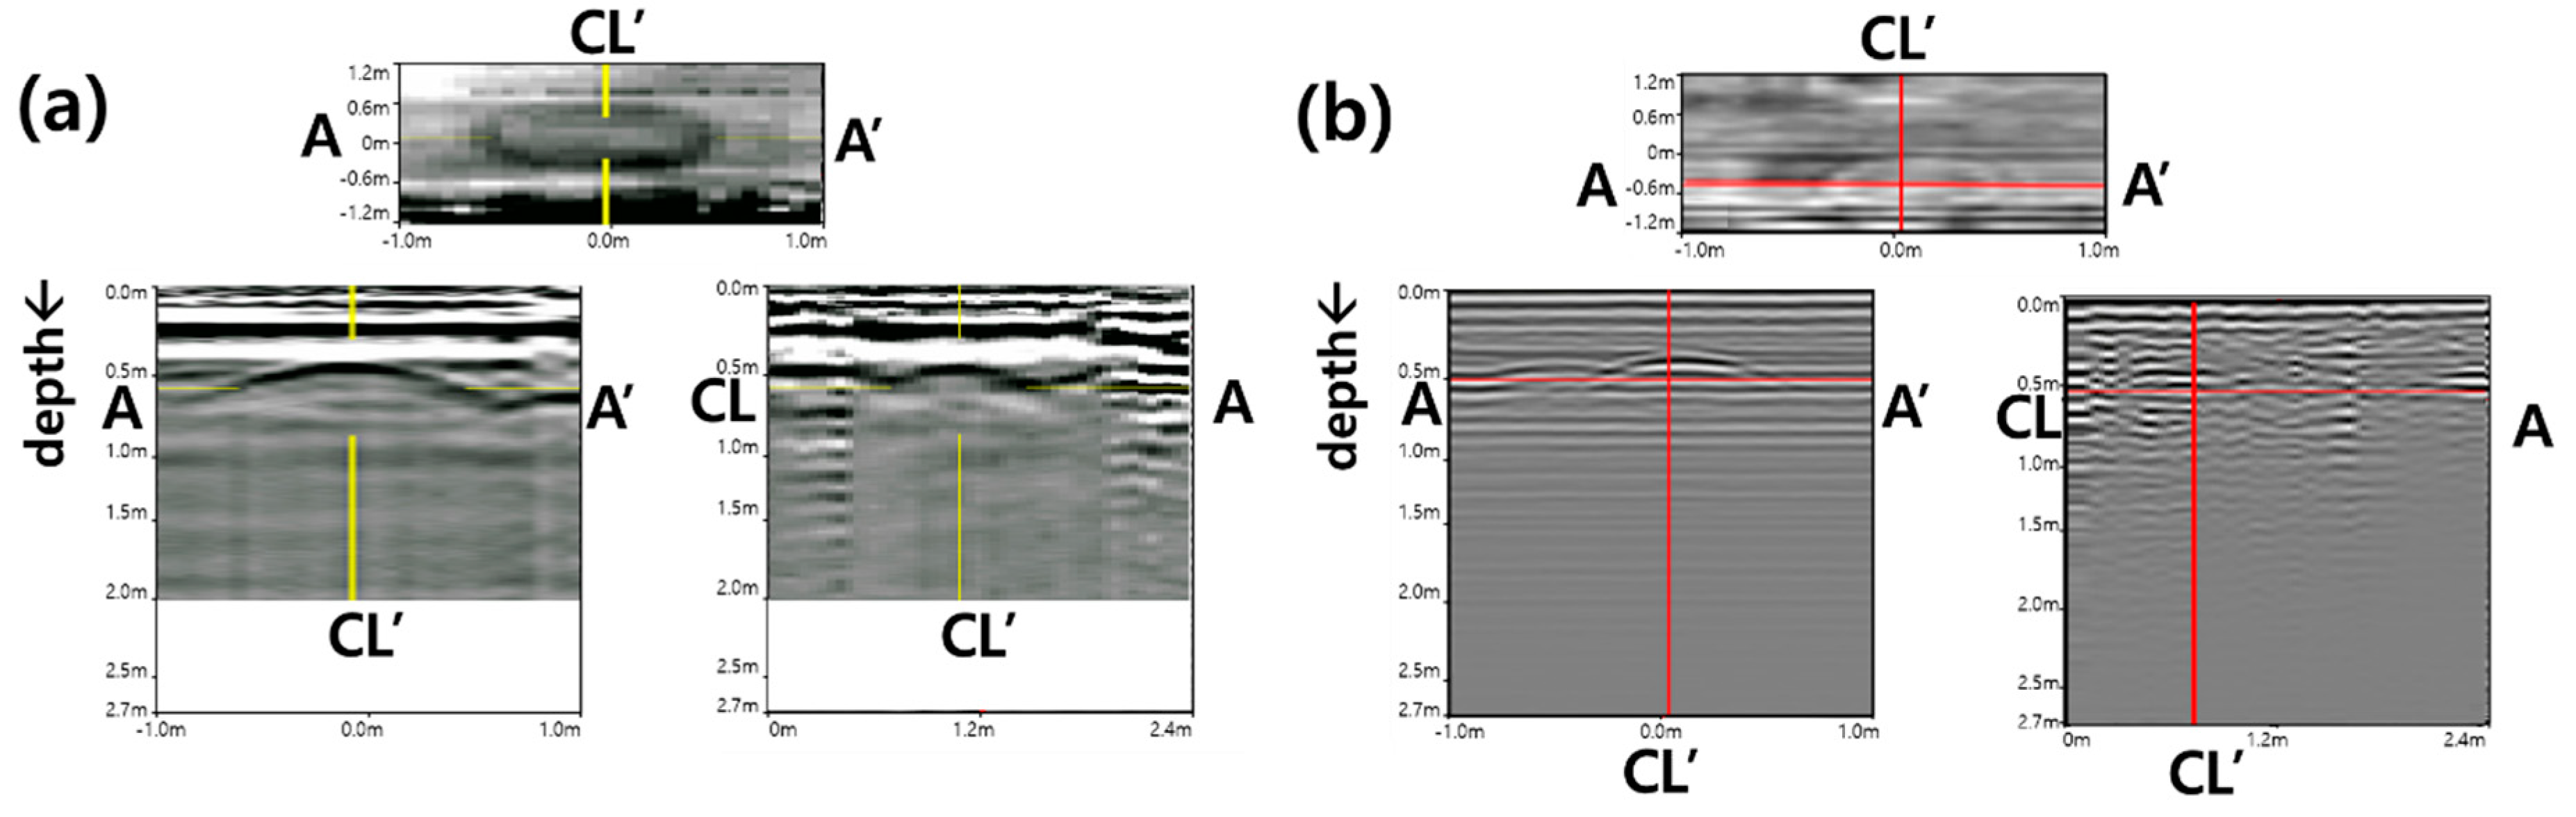
Figure 8 shows the plan, longitudinal and transversal sections of the GPR signal obtained at the locations where EPS were embedded under the asphalt pavement. The reflected GPR signal at 0.27 m deep in Figure 8a shows clear circular shapes in the plan view and parabolas in the longitudinal and transversal sections. However, as the depth increases (Figure 8b,c) at 0.75 and 1.0 m depth, respectively), the GPR signal of the EPSs became blurred, and the shape of the parabola was unrecognizable. If the plan and longitudinal sections were not considered at the same time, it would have been difficult to detect object anomalies.
Figure 9 showed the plan, longitudinal and transversal sections of the GPR signal obtained from the EPS under plain concrete. The depth of EPS was 0.45 m, which is directly below the concrete pavement layer. Looking at the figures, the shape of the round body was relatively clear in the plan view, but it would have been difficult to detect using only the vertical or horizontal cross-sections due to strong reflections from the bottom face of the concrete pavement layer. Even though the replica under concrete pavement is located at 0.45 m deep, the acquired signal was similar to Figure 6b, in which the depth of the object was 0.75 m.
The depths of those EPSs were estimated using both GPR systems, as shown in Table 5; System A used a dielectric constant 9.0 base on the engineering judgement; meanwhile, System B used the value of 8.0 for the same reason (see Equation (2)). The errors of the estimated depth were about 0.03 to 0.27 m (error ratio 7–27%), wherein the error increases with the increase in depth. The error is coming from the assumed single dielectric constant applied to a multi-layered road and, in addition, substituting the same dielectric constant for different media (asphalt and concrete and ground materials). Therefore, it is required to use core data when depth information is required, such as for mapping of 3D underground utilities or underground objects.
4.3.3. PE Bottle
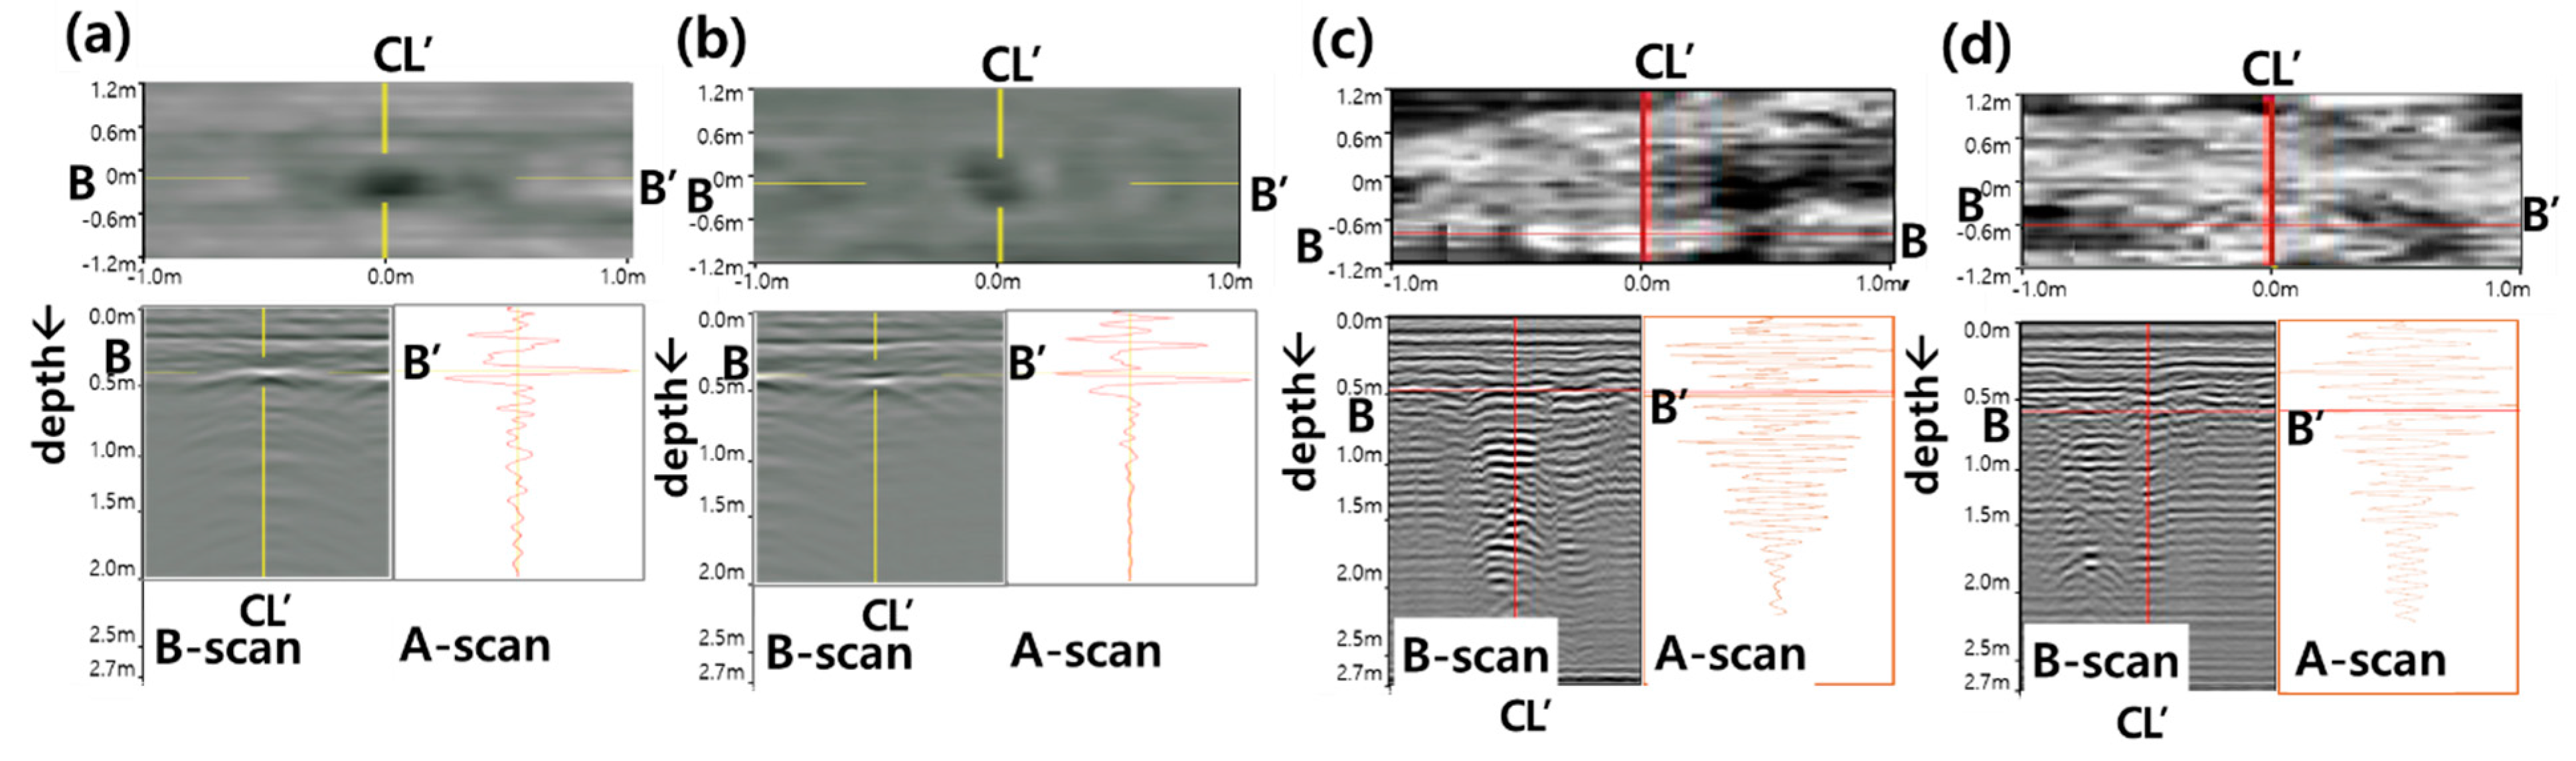
Figure 10 shows the GPR data obtained from the PE bottles filled with water and air (empty), respectively. The gain values were the same between Figure 10a–d respectively. In the case of the water bottle (Figure 10a,c), a positive amplitude reflection of the received GPR signal is seen. In the figures, ringing occurred at the bottom of the hyperbola signal. This is believed to be due to the large reflection of water with a large dielectric constant affecting the overall acquired signal. In the case of the empty bottle (Figure 10b,d), the phase change of the reflected wave (+ amplitude → - amplitude) appeared, because it was filled with air, which has a dielectric value of 1.
Even with the same cavity, the filled material inside the cavity may vary, depending on the weather and drainage characteristics, and thus, the phase of the GPR signal may change [50]. In other words, the GPR reflection profiles can often indicate what features are producing high-amplitude reflections. Moreover, even individual reflection traces can be studied for polarity changes, which can help in identifying the types of buried mediums that are producing such reflections.
4.3.4. Steel Plate
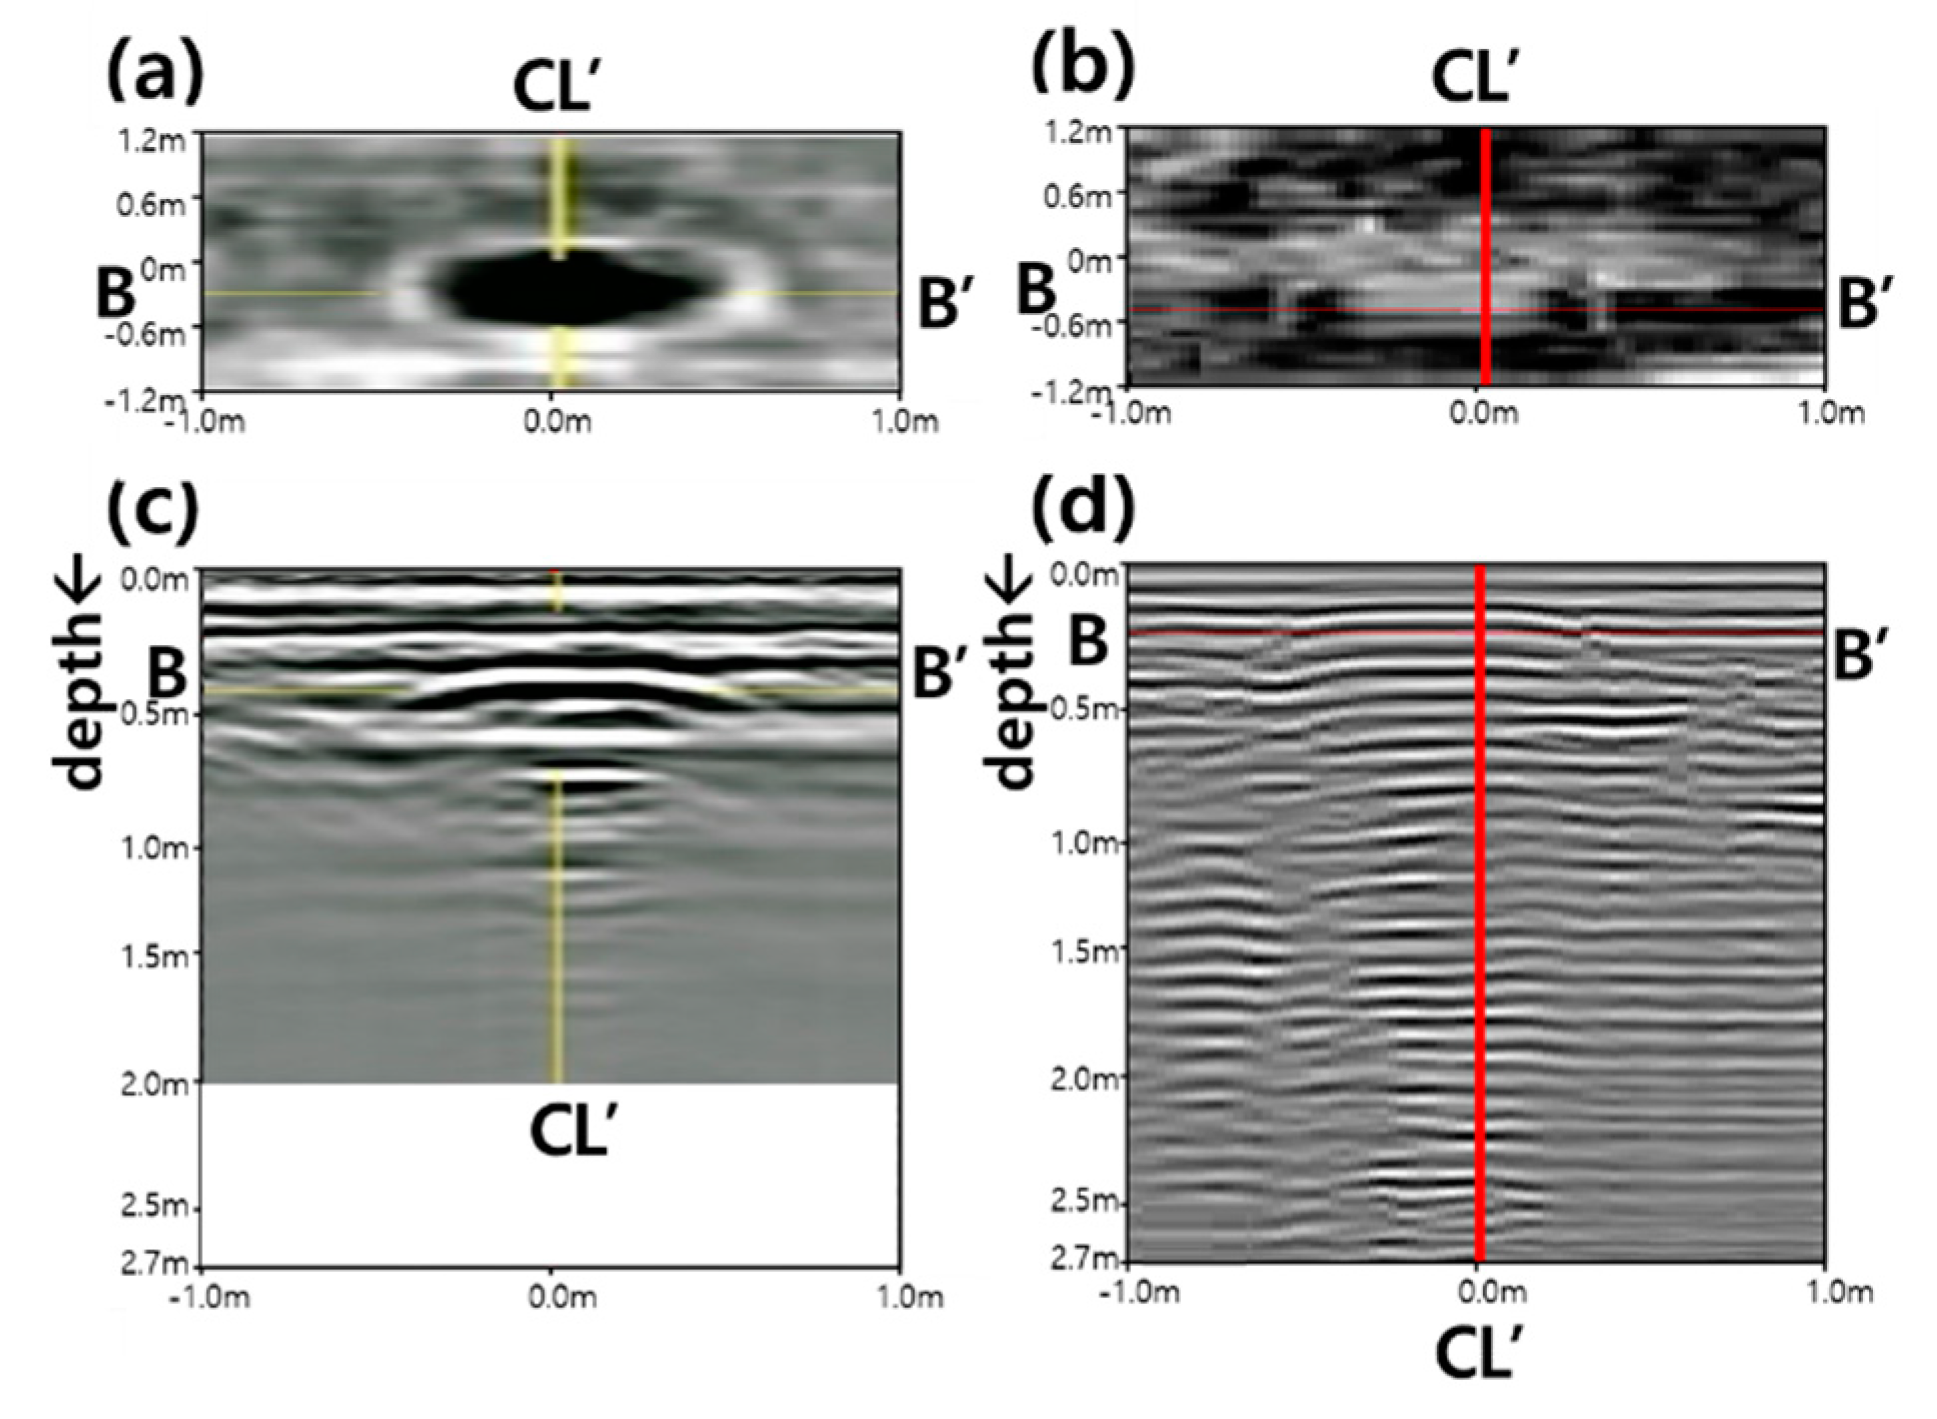
Figure 11 shows the GPR data obtained from the steel plate buried next to the pavement layer. The steel plate is regarded as a complete reflector. It is buried to be used as a reference to check the depth of the pavement. Figure 11a,b shows the amplitude of signals, similar to the case of water filled cavity. Looking at the longitudinal cross-section of the GPR data in Figure 11c,d, a continuous ringing signal was observed, which is a common phenomenon of electromagnetic waves; this occurs when the steel plate is near the surface.
5. Discussion
5.1. The Effective Depth of Investigation
Determining the depth of investigation based on the characteristics of the abnormal objects of the test road in Table 4, the effective survey depth in the expressway asphalt pavement was found to be 1–1.5 m, less than 1.0 m in the case of plain concrete pavement; however, in the case of the RC pavement (CRCP), detection is not feasible. This depth is based on a road constructed in accordance with the expressway construction standards [60] and can vary depending on the material characteristics and condition of pavement, ground materials and field conditions.
Two types of GPR equipment used in this study do not have significant difference in survey depth under the same type of road pavement. It is presumed that the surface pavement layer causes a significant attenuation in the energy of the electromagnetic wave and reduces the signal transmitted inside. Therefore, it can be seen that even under the same ground condition, the depth of survey can varies depending on the characteristics of the surface layer (pavement).
5.2. The Detection Ability on Buried Objects
The accuracy and clarity in detecting anomalies were found to be influenced not only by the characteristics of the equipment but also the expert’s capacity and judgment. Basically, GPR results could vary greatly depending on the type of pavement, geology and environmental conditions. In the case of System A using low frequency, the shapes were relatively clear, but the resolution was relatively low. Meanwhile, for System B, which can utilize a wider frequency band, there was a relatively insufficient signal clarity for the detection of objects. However, it was found that it can be used for detecting reinforcing bars inside the pavements with clear resolution. The analyzed results could be presented better by improving the equipment and analysis methods while incorporating the expert’s know-how and judgment. The acquired signal can be improved by additional post-processing techniques, such as interpolation and filtering, particularly for System B. With the accumulated research data and onsite experiences, abnormal signals could be quickly detected through machine learning or AI techniques. In addition, the expert’s experience can help in the prediction of the condition of an anomaly.
Therefore, it is desirable to evaluate the GPR results for equipment and analysis technique on the test road. To this end, standards to verify and determine reliability of GPR results must be established. In addition, KEC has been allowing the GPR engineer and researcher to use the test road for developing the underground survey technology, evaluating the varying signal characteristics associated with different subsurface anomalies and environmental conditions and development the appropriate analysis.
5.3. The Depth Analysis of Buried Objects
The depth evaluation error by the GPR is in the range of 0.03–0.27 m (7–27%). This result is obtained by investigating anomalies less than 1 m below the road surface of the testbed, and it was found that if the detection depth is greater will eventually cause more errors. Therefore, to know more accurate depth or to be able to create an underground space utility map, it is desirable to correct the depth through design drawings using data obtained from calibrating coring, maintenance work, etc.
The vehicle-mounted multichannel GPR used in this survey is considered to be helpful to the safety of both the investigator, as well as the road users, as it can be used in investigation without traffic interruption. In addition, by providing a plan view, a longitudinal section and a cross-sectional view for each depth, it will be useful for the road cavity survey. Since the investigation of cement concrete road pavement was limited within the scope of this study, it would be recommended to use the separate NDT technologies to support and conduct the investigation or to select the GPR with different specifications and conduct the investigation.
6. Conclusions
The ability of the GPR for subsurface investigation using two types of GPR equipment was evaluated in this study. Several GPR surveys were conducted on a test road simulating Korean Expressway. From the survey results, the depth of investigation under various pavements was evaluated wherein the basic characteristics of the GPR signal according to the type of subsurface anomaly were analyzed to provide suggestions and recommendations for efficient underground surveys in practice. The results of the study are summarized as follows:
- (1)
- The combination of the plan view by depth and cross- and longitudinal sections of the GPR data achieved from the 3D GPR such as the multichannel GPR, which makes analysis easier and more accurate.
- (2)
- The deeper the depth of survey, the greater the attenuation of the received GPR wave, resulting in lower sensitivity of the signal. Signal attenuation occurred more severe in concrete pavements than in the asphalt pavement. This seems to be the result of greater attenuation per unit depth in propagation through concrete, because it has a higher dielectric constant and conductivity of young concrete than asphalt [19,43,50].
- (3)
- The effective depth of cavity investigation under asphalt pavement was estimated to be about 1 to 1.5 m. Reflected GPR signals from subsurface anomalies at shallower depths appeared clearer within this range.
- (4)
- Under the concrete pavement, most of subsurface anomalies could not be detected by the GPR, except for a simulated ground cavity, which is an EPS hemisphere placed next to the pavement layer made of plain concrete. In addition, reflected waves (scattering) were found to be occurring from rebars embedded in the CRCP, which hindered the detection of objects beneath the rebar. Therefore, the GPR survey under the concrete pavement is not reasonable and practical because of high signal attenuation and scattering.
- (5)
- The estimated depth from TWTT converted by assuming one dielectric constant based on experience and engineering judgement could cause significant errors in the actual test in which as the depth increases the error also increases. This is believed to be due to the practice of assuming only one dielectric constant for a multilayered road. Therefore, it is required to use core data when depth information is required, such as for mapping of 3D underground utilities or underground objects.
- (6)
- The negative polarity reflection of the received GPR signal was found to be reflected from a simulated cavity, which is the EPS (cavity), and a PE bottle with air. On the other hand, the positive polarity reflection of the received GPR signal was found in GPR data reflected from a PE bottle filled with water and a steel plate. This is because the GPR signal changed in amplitude direction according to the EM characteristics of the reflector. In other words, the reflection polarity in GPR data can be associated with different relative permittivity objects, i.e., cavities or buried things. Therefore, it is believed that it is helpful to check the reflection polarity in GPR data when estimating the characteristics of the buried materials. Moreover, even individual reflection traces can be studied for polarity changes, which can help in identifying the types of buried mediums that are producing such reflections.
Based on the results of this investigation, for the underground survey of expressways managed by the KEC, the difference in survey performances between the two GPR systems was not that significant within what was done in the scope of this study. For this reason, procedures have been established to verify the GPR equipment and interpretation techniques. In other words, the GPR equipment that is to be applied on Korean expressways must be verified in advance in the KEC test bed (in terms of the depth of investigation, precision, etc.). Currently, performance tests for various GPR equipment used in Korea are in progress. Since the subsurface survey under the concrete pavement by GPR showed very low efficiency, it is being carried out on a limited basis. In particular, in order to detect cavities under concrete roads, the use of FWD is currently being studied.
Author Contributions
Conceptualization, J.-Y.R. and S.-Y.L.; methodology, J.-Y.R.; software, J.-W.C.; validation, J.-Y.R. and S.-Y.L.; formal analysis, J.-Y.R. and S.-Y.L.; investigation, J.-Y.R. and J.-W.C.; resources, J.-Y.R., K.-T.P. and J.-W.C.; data curation, J.-Y.R.; writing—original draft preparation, J.-Y.R.; writing—review and editing, S.-Y.L. and supervision, S.-Y.L. All authors have read and agreed to the published version of the manuscript.
Funding
This research was funded by the Research Institute of Korea Expressway Corporation (KECRI).
Institutional Review Board Statement
Not applicable.
Informed Consent Statement
Not applicable.
Acknowledgments
We are thankful to the KECRI, GK engineering corporation and SHERPA E&C for their field support.
Conflicts of Interest
The authors declare no conflict of interest.
References
- Serzu, M.H.; Kozak, E.T.; Lodha, G.S.; Everitt, R.A.; Woodcock, D.R. Use of borehole radar techniques to characterize fractured granitic bedrock at AECL’s Underground Research Laboratory. J. Appl. Geophys. 2004, 55, 137–150. [Google Scholar] [CrossRef]
- Dorn, C.; Linde, N.; Doetsch, J.; Le Borgne, T.; Bour, O. Borehole GPR fracture imaging of a crystalline rock aquifer, Stang-er-Brune, Brittany, France. In Proceedings of the Near Surface 2010—16th European Meeting of Environmental and Engineering Geophysics, Zurich, Switzerland, 6–8 September 2010. [Google Scholar]
- Schwartz, R.C.; Evett, S.R.; Pelletier, M.G.; Bell, J.M. Complex permittivity model for time domain reflectometry soil water content sensing: I. Theory. Soil Sci. Soc. Am. J. 2009, 73, 886–897. [Google Scholar] [CrossRef]
- Mahmoudzadeh Ardekani, M.R. Off- and on-ground GPR techniques for field-scale soil moisture mapping. Geoderma 2013, 200, 55–66. [Google Scholar] [CrossRef]
- Sevil, J.; Gutiérrez, F.; Zarroca, M.; Desir, G.; Carbonel, D.; Guerrero, J.; Linares, R.; Roqué, C.; Fabregat, I. Sinkhole investigation in an urban area by trenching in combination with GPR, ERT and high-precision leveling. Mantled evaporite karst of Zaragoza city, NE Spain. Eng. Geol. 2017, 231, 9–20. [Google Scholar] [CrossRef]
- Baek, J.; Yoon, J.S.; Lee, C.M.; Choi, Y. A case study on detection of subsurface cavities of urban roads using ground-coupled GPR. In Proceedings of the 2018 17th International Conference on Ground Penetrating Radar, GPR 2018, Rapperswil, Switzerland, 18–21 June 2018. [Google Scholar] [CrossRef]
- Porsani, J.L.; Ruy, Y.B.; Ramos, F.P.; Yamanouth, G.R.B. GPR applied to mapping utilities along the route of the Line 4 (yellow) subway tunnel construction in São Paulo City, Brazil. J. Appl. Geophys. 2012, 80, 25–31. [Google Scholar] [CrossRef]
- Wimsatt, A.; White, J.; Leung, C.; Scullion, T.; Hurlebaus, S.; Zollinger, D.; Grasley, Z.; Nazarian, S.; Azari, H.; Yuan, D.; et al. Mapping Voids, Debonding, Delaminations, Moisture, and other Defects Behind or within Tunnel Linings; SHRP 2 Report S2-R06G-RR-1; Transportation Research Board: Washington, DC, USA, 2014. [Google Scholar] [CrossRef]
- Balasubramaniam, V.R.; Jha, P.C. Imaging for foundation defects using GPR. In Proceedings of the 13th International Conference on Ground Penetrating Radar, GPR 2010, Lecce, Italy, 21–25 June 2010. [Google Scholar] [CrossRef]
- Pupatenko, V.V.; Sukhobok, Y.A.; Stoyanovich, G.M. Lithological profiling of rocky slopes using geo reader software based on the results of ground penetrating radar method. Procedia Eng. 2017, 189, 643–649. [Google Scholar] [CrossRef]
- Ni, S.H.; Huang, Y.H.; Lo, K.F.; Lin, D.C. Buried pipe detection by ground penetrating radar using the discrete wavelet transform. Comput. Geotech. 2010, 37, 440–448. [Google Scholar] [CrossRef]
- Jaw, S.W.; Hashim, M. Locational accuracy of underground utility mapping using ground penetrating radar. Tunn. Undergr. Space Technol. 2013, 35, 20–29. [Google Scholar] [CrossRef]
- Singh, K.K.K.; Kumar, I.; Singh, U.K. Interpretation of voids or buried pipes using ground penetrating radar modeling. J. Geol. Soc. India 2013, 81, 397–404. [Google Scholar] [CrossRef]
- Shangguan, P.; Al-Qadi, I.; Coenen, A.; Zhao, S. Algorithm development for the application of ground-penetrating radar on asphalt pavement compaction monitoring. Int. J. Pavement Eng. 2016, 17, 189–200. [Google Scholar] [CrossRef]
- Zhao, S.; Al-Qadi, I.L. Development of an analytic approach utilizing the extended common midpoint method to estimate asphalt pavement thickness with 3-D ground-penetrating radar. NDT E Int. 2016, 78, 29–36. [Google Scholar] [CrossRef]
- Hugenschmidt, J. Railway track inspection using GPR. Proc. J. Appl. Geophys. 2000, 43, 147–155. [Google Scholar] [CrossRef]
- Tosti, F.; Bianchini Ciampoli, L.; Calvi, A.; Alani, A.M.; Benedetto, A. An investigation into the railway ballast dielectric properties using different GPR antennas and frequency systems. NDT E Int. 2018, 93, 131–140. [Google Scholar] [CrossRef]
- Dinh, K.; Gucunski, N.; Kim, J.; Duong, T.H.; La, H.M. Attenuation-based methodology for condition assessment of concrete bridge decks using GPR. In Proceedings of the 32nd International Symposium on Automation and Robotics in Construction and Mining: Connected to the Future, Proceedings, Oulu, Finland, 15–18 June 2015. [Google Scholar]
- Rhee, J.Y.; Kee, S.H.; Kim, H.S.; Choi, J.J. Seasonal variation and age-related changes in the relative permittivity of concrete bridge decks on Korea expressways. Int. J. Concr. Struct. Mater. 2018, 12, 1–18. [Google Scholar] [CrossRef] [Green Version]
- Rhee, J.Y.; Choi, J.J.; Kee, S.H. Evaluation of the depth of deteriorations in concrete bridge decks with asphalt overlays using air-coupled GPR: A case study from a pilot bridge on Korean expressway. Int. J. Concr. Struct. Mater. 2019, 13, 1–17. [Google Scholar] [CrossRef] [Green Version]
- Hakim, Y. Sinkhole Opens Up Beneath South Korean Pedestrians. BBC News, British Broadcasting Corporation (BBC). Available online: https://www.bbc.com/news/av/world-asia-31602247 (accessed on 29 August 2020).
- Kim, Y.; Park, S.W. Dem simulation on the initiation and development of road subsidence. J. Korean Geotech. Soc. 2017, 7, 43–53. (In Korean) [Google Scholar] [CrossRef]
- ABC News, Sinkhole Swallows Two Pedestrians in SEOUL, Pair Survive Fall with Only Minor Injuries. Australian Broadcasting Corporation. Available online: http://www.abc.net.au/news/2015-02-25/two-pedestrians-rescued-after-falling-into-a-sinkhole/6260590 (accessed on 25 February 2015).
- Seoul Metropolitan Government. White Paper on Road Management: Road Management by Smart System; 51-6110000-001542-10; Seoul Metropolitan Government: Seoul, Korea, 2016. (In Korean)
- Yoon, J.S.; Baek, J.; Choi, Y.W.; Choi, H.; Lee, C.M. Signal pattern analysis of ground penetrating radar for detecting road Cavities. Int. J. Highw. Eng. 2016, 6, 61–67. [Google Scholar] [CrossRef]
- Kim, Y.T.; Kim, B.; Kim, J.W.; Park, H.M.; Yoon, J.S. Determining the optimal frequency of ground penetrating radar for detecting voids in pavements. Int. J. Highw. Eng. 2016, 18, 37–42. [Google Scholar] [CrossRef]
- Kim, Y.T.; Choi, J.Y.; Kim, K.D.; Park, H.M. A study on the selection of GPR type suitable for road cavity detection. Int. J. Highw. Eng. 2017, 19, 69–75. [Google Scholar] [CrossRef]
- Lee, H.H. Image processing of GPR detection data. J. Korea Inst. Struct. Maint. Insp. 2016, 20, 104110. [Google Scholar] [CrossRef] [Green Version]
- Lee, H.H. Pattern template construction of buried pipes and cavities. J. Korea Inst. Struct. Maint. Insp. 2017, 21, 8086. [Google Scholar] [CrossRef]
- Kim, B.; Seol, S.J.; Byun, J. Application of image processing techniques to GPR data for the reliability improvement in subsurface void analysis. Geophys. Geophys. Explor. 2017, 20, 6171. [Google Scholar] [CrossRef]
- Lee, S.H.; Jang, I.H. A study on the underground condition of road using 3D-GPR exploration. J. Korean Geoenviron. Soc. 2019, 20, 49–58. [Google Scholar] [CrossRef]
- Korea Ministry of Government Legislation (KMGL). The Special Law on Underground Safety Act. Law No. 13749; KMGL: Seoul, Korea, 2016. (In Korean)
- Ministry of Land, Infrastructure and Transport (MLIT), Press Release: 192 Cases of Ground Settlement in 2019 Decrease Compared to the Previous Year. Available online: https://www.molit.go.kr/USR/NEWS/m_71/dtl.jsp?lcmspage=2&id=95083566 (accessed on 12 February 2021).
- Park, D.H.; Jang, Y.G.; Choi, H.S. A study on the construction plan of 3D geotechnical information for the support of underground space safety. J. Korean Assoc. Geogr. Inf. Stud. 2018, 21, 23–34. [Google Scholar] [CrossRef]
- Korea Expressway Corporation (KEC). Available online: http://www.ex.co.kr (accessed on 17 March 2021).
- Yoon, W.; Jeong, J.; Lee, J.; Shin, D.; Ko, M. A Study on NDT Techniques for Evaluating Subsurface Condition of Road Pavement; EXTRI-2018-40-534.9607; Expressway & Transportation Research Institute (ETRI): Hwaseong, Korea, 2018. (In Korean) [Google Scholar]
- Expressway & Transportation Research Institute (ETRI). 50 Years of Technology History on Expressways; 0021979; ETRI: Hwaseong, Korea, 2019. (In Korean) [Google Scholar]
- Mostapha, A.M.M.; Faize, A.; Alsharahi, G.; Louzazni, M.; Driouach, A. Effect of external noise on ground penetrating radar ability to detect objects. Int. J. Microw. Opt. Technol. 2019, 14, 124–131. [Google Scholar]
- Quinta-Ferreira, M. Ground penetration radar in geotechnics. advantages and limitations. IOP Conf. Ser. Earth Environ. Sci. 2019, 221, 012019. [Google Scholar] [CrossRef] [Green Version]
- Daniels, D.J. Ground Penetrating Radar: IET Radar, Sonar, Navigation and Avionics Series 15; The Institution of Engineering and Technology: London, UK, 2004. [Google Scholar]
- Rehman, F.; Abouelnaga, H.S.O.; Rehman, F. Estimation of dielectric permittivity, water content, and porosity for environmental engineering and hydrogeological studies using ground penetrating radar, a short review. Arab. J. Geosci. 2016, 9, 312. [Google Scholar] [CrossRef]
- Rhee, J.; Choi, J. Relative permittivity of damaged concrete bridge deck according to the weather condition: A case study. J. Korea Acad.-Ind. Coop. Soc. 2017, 18, 209–215. [Google Scholar] [CrossRef]
- Rhee, J.; Shim, J.; Lee, S.; Lee, K.H. A consideration on the electromagnetic properties of road pavement using ground penetrating radar (GPR). J. Korean Soc. Civ. Eng. 2020, 24, 2049–2062. [Google Scholar] [CrossRef]
- Rhee, J.Y.; Shim, J.; Kee, S.H.; Lee, S.Y. Different characteristics of radar signal attenuation depending on concrete condition of bare bridge deck. KSCE J. Civ. Eng. 2020, 24, 2049–2062. [Google Scholar] [CrossRef]
- Sumiyoshi, T.; Masahashi, H. Outdoor Model Experiment on Exploration Technology for Subsurface Cavity (Deep Part); Tokyo Metropolitan Civil Engineering Assistance and Human Resource Development Center Annual Report; Japan International Cooperation Agency: Tokyo, Japan, 2009; pp. 159–178. [Google Scholar]
- Sumiyoshi, T.; Hashihara, M.; Oishi, M. Outdoor Model Experiment on Subsurface Cavity (Deep) Exploration Technology (Part 2); Tokyo Metropolitan Civil Engineering Technical Support and Human Resource Development Center Annual Report; Japan International Cooperation Agency: Tokyo, Japan, 2011; pp. 101–114. [Google Scholar]
- Lai, W.W.L.; Chang, R.K.W.; Sham, J.F.C. A blind test of nondestructive underground void detection by ground penetrating radar (GPR). J. Appl. Geophys. 2018, 149, 10–17. [Google Scholar] [CrossRef]
- Seoul Metropolitan Government. Seoul Metropolitan Government Announces ‘Bidding for Cavity Exploration Service to Prevent Road Sink’. Press Release, Seoul, Korea. Available online: https://www.seoul.go.kr/news/news_report.do#list/1 (accessed on 25 July 2020).
- Morey, R.M. Ground Penetrating Radar for Evaluating Subsurface Conditions for Transportation Facilities; NCHRP Synthesis Report No. 255. Synth. Highw. Pract.; Transportation Research Board (TRB): Washington, DC, USA, 1998. [Google Scholar]
- ASTM D 6432. Standard Guide for Using the Surface Ground Penetrating Radar Method for Subsurface Investigation; American Society for Testing and Materials (ASTM), ASTM International: West Conshohocken, PA, USA, 2011. [Google Scholar]
- Al-Qadi, I.L.; Lahouar, S.; Loulizi, A. GPR: From the state-of-the-art to the state-of-the-Practice. In Proceedings of the International Symposium of Non-destructive Testing in Civil Engineering, Berlin, Germany, 16–19 September 2003. CD-ROM. [Google Scholar]
- Conyers, L.B. Analysis and interpretation of GPR datasets for integrated archaeological mapping. Near Surface Geophys. 2015, 13, 645–651. [Google Scholar] [CrossRef] [Green Version]
- Park, B.; Kim, J.; Lee, J.; Kang, M.S.; An, Y.K. Underground object classification for urban roads using instantaneous phase analysis of ground-penetrating radar (GPR) data. Remote. Sens. 2018, 10, 1417. [Google Scholar] [CrossRef] [Green Version]
- Duan, C.; Wu, R.; Liu, J. Estimation of airfield pavement void thickness using GPR. In Proceedings of the 2011 3rd International Asia-Pacific Conference, Seoul, Korea, 26–30 September 2011. [Google Scholar]
- Olhoeft, G.R. Applications and limitations of ground penetrating radar. In Proceedings of the 1984 SEG Annual Meeting, SEG Atlanta, Georgia, 26 December 1984. [Google Scholar] [CrossRef]
- Balanis, C.A. Advanced Engineering Electromagnetics; John Wiley & Sons: New York, NY, USA, 1989. [Google Scholar]
- Maser, K.R.; Scullion, T. Automated Detection of Pavement Layer Thicknesses and Subsurface Moisture Using Ground Penetrating Radar; TRB Paper: Washington, DC, USA, 1991. [Google Scholar]
- Saarenketo, T. Electrical Properties of Road Materials and Subgrade Soils and the Use of Ground Penetrating Radar in Traffic Infrastructure Surveys. Doctoral Dissertation, Department of Geosciences, University of Oulu, Oulu, Finland, 2006. [Google Scholar]
- Al-Qadi, I.L.; Leng, Z.; Lahouar, S.; Baek, J. In-place hot-mix asphalt density estimation using ground-penetrating radar. Transp. Res. Rec. 2010, 2152, 19–27. [Google Scholar] [CrossRef] [Green Version]
- Korea Expressway Corporation (KEC). Quality Standards for Highway Construction Materials, 16th ed.; KEC: Hwaseong, Korea, 2016. (In Korean) [Google Scholar]
- MALÅ, Guideline Geo. Available online: https://www.guidelinegeo.com (accessed on 17 March 2021).
- Isung Coporation. Available online: https://www.isung.com:6066 (accessed on 17 March 2021).
- Radar Portal Systems Pty. Ltd. Available online: http://www.radarportal.com/ (accessed on 17 March 2021).
- Baek, J.E.; Choe, J.S. Underground survey technique of the road using GPR. J. Korean Soc. Road Eng. Road. 2014, 16, 11–16. [Google Scholar]
- Reeves, B.A.; Müller, W.B. Traffic-speed 3-D noise modulated ground penetrating radar (NM-GPR). In Proceedings of the In 2012 14th International Conference on Ground Penetrating Radar (GPR), IEEE, Shanghai, China, 4–8 June 2012; pp. 165–171. [Google Scholar]
- Korea Meteorological Administration (KMA). Available online: https://www.weather.go.kr/weather/climate/past_cal.jsp (accessed on 20 August 2020).
- Bianchini Ciampoli, L.; Tosti, F.; Economou, N.; Benedetto, F. Signal processing of GPR data for road surveys. Geosciences 2019, 9, 96. [Google Scholar] [CrossRef] [Green Version]
- Rhee, J.Y.; Jung, J.D.; Kim, N.Y.; Shim, J. Recommendations for Guidelines for Underground Survey on Road Using Ground Penetrating Radar, ETRI-2018-17-534.2; Expressway & Transportation Research Institute (ETRI): Hwaseong, Korea, 2018. (In Korean) [Google Scholar]
Figure 1.
Illustration of GPR scanning on a road: (a) a possible path of EM waves, (b) a scan.

Figure 2.
Testbed pavement profile: (a) asphalt pavement, (b) concrete pavement and (c) CRCP.

Figure 3.
Schematic diagram of the testbed: (a) asphalt pavement and (b) concrete pavement (remarks: ![Remotesensing 13 01805 i009]() EPS,
EPS, ![Remotesensing 13 01805 i010]() empty PE bottle,
empty PE bottle, ![Remotesensing 13 01805 i011]() water PE bottle,
water PE bottle, ![Remotesensing 13 01805 i012]() empty earthenware,
empty earthenware, ![Remotesensing 13 01805 i013]() water earthenware,
water earthenware, ![Remotesensing 13 01805 i014]() ascon block,
ascon block, ![Remotesensing 13 01805 i015]() concrete block,
concrete block, ![Remotesensing 13 01805 i016]() steel plate,
steel plate, ![Remotesensing 13 01805 i017]() sand + EPS particles,
sand + EPS particles, ![Remotesensing 13 01805 i018]() rock and
rock and ![Remotesensing 13 01805 i019]() drainage). CL centerline and A-A’ & B-B’ measuring lines.
drainage). CL centerline and A-A’ & B-B’ measuring lines.
 EPS,
EPS,  empty PE bottle,
  water PE bottle,
  empty earthenware,
  water earthenware,
  ascon block,
  concrete block,
  steel plate,
  sand + EPS particles,
  rock and
  drainage). CL centerline and A-A’ & B-B’ measuring lines.
Figure 3.
Schematic diagram of the testbed: (a) asphalt pavement and (b) concrete pavement (remarks: ![Remotesensing 13 01805 i009]() EPS,
EPS, ![Remotesensing 13 01805 i010]() empty PE bottle,
empty PE bottle, ![Remotesensing 13 01805 i011]() water PE bottle,
water PE bottle, ![Remotesensing 13 01805 i012]() empty earthenware,
empty earthenware, ![Remotesensing 13 01805 i013]() water earthenware,
water earthenware, ![Remotesensing 13 01805 i014]() ascon block,
ascon block, ![Remotesensing 13 01805 i015]() concrete block,
concrete block, ![Remotesensing 13 01805 i016]() steel plate,
steel plate, ![Remotesensing 13 01805 i017]() sand + EPS particles,
sand + EPS particles, ![Remotesensing 13 01805 i018]() rock and
rock and ![Remotesensing 13 01805 i019]() drainage). CL centerline and A-A’ & B-B’ measuring lines.
drainage). CL centerline and A-A’ & B-B’ measuring lines.
EPS, empty PE bottle, water PE bottle, empty earthenware, water earthenware, ascon block, concrete block, steel plate, sand + EPS particles, rock and drainage). CL centerline and A-A’ & B-B’ measuring lines.
Figure 4.
GPR equipment: (a) System A and (b) System B.

Figure 5.
Post-processing software used by (a) System A and (b) System B.

Figure 6.
GPR data achieved on the asphalt pavement of the testbed: (a) plane view (system A), (b) longitudinal cross-section (system A), (c) plane view (system B) and (d) longitudinal cross-section (system B). CL centerline, A-A’ and B-B’ measuring lines and -- discovered objects in this study.
Figure 6.
GPR data achieved on the asphalt pavement of the testbed: (a) plane view (system A), (b) longitudinal cross-section (system A), (c) plane view (system B) and (d) longitudinal cross-section (system B). CL centerline, A-A’ and B-B’ measuring lines and -- discovered objects in this study.


Figure 7.
GPR data achieved on the concrete pavement of the testbed: (a) plane view (system A), (b) longitudinal cross-section (system A), (c) plane view (system B) and (d) longitudinal cross-section (system B). CL centerline, A-A’ and B-B’ measuring lines and -- discovered objects in this study.
Figure 7.
GPR data achieved on the concrete pavement of the testbed: (a) plane view (system A), (b) longitudinal cross-section (system A), (c) plane view (system B) and (d) longitudinal cross-section (system B). CL centerline, A-A’ and B-B’ measuring lines and -- discovered objects in this study.


Figure 8.
GPR data achieved from EPS buried under asphalt pavement: (a) AP-A01 (System A), (b) AP-A01 (System B), (c) AP-A02 (System A), (d) AP-A02 (System B), (e) AP-A03 (System A) and (f) AP-A03 (System B).
Figure 8.
GPR data achieved from EPS buried under asphalt pavement: (a) AP-A01 (System A), (b) AP-A01 (System B), (c) AP-A02 (System A), (d) AP-A02 (System B), (e) AP-A03 (System A) and (f) AP-A03 (System B).

Figure 9.
GPR data achieved from EPS buried under plain concrete pavement: (a) CP-A02 (System A) and (b) CP-A02 (System B).
Figure 9.
GPR data achieved from EPS buried under plain concrete pavement: (a) CP-A02 (System A) and (b) CP-A02 (System B).

Figure 10.
GPR data achieved from PE bottles under asphalt pavement: (a) AP-B18 (water bottle, System A), (b) AP- B19 (empty (air) bottle, System A), (c) AP- B18 (water bottle, System B) and (d) AP- B19 (empty (air) bottle, System B)).
Figure 10.
GPR data achieved from PE bottles under asphalt pavement: (a) AP-B18 (water bottle, System A), (b) AP- B19 (empty (air) bottle, System A), (c) AP- B18 (water bottle, System B) and (d) AP- B19 (empty (air) bottle, System B)).

Figure 11.
GPR data achieved from steel plate (AP-B01): (a) plane view (System A), (b) plane view (System B), (c) longitudinal section (System A) and (d) longitudinal section (System B).
Figure 11.
GPR data achieved from steel plate (AP-B01): (a) plane view (System A), (b) plane view (System B), (c) longitudinal section (System A) and (d) longitudinal section (System B).


Table 1.
Status of the buried objects.
| Division | Cavity | Relaxed Zones | ||
|---|---|---|---|---|
| EPS | Earthenware | PE Bottle | Sand + EPS Fragments | |
| Depth | 0.27–3 m | 2–2.5 m | 0.27–1 m | 0.27–2 m |
| Dimension | Φ 0.5 m, Φ 1 m | Φ 0.4 m | 4 L | 2–6 m |
| Appearance |  |  |  |  |
| Note | Filled with air/water | |||
| Division | Others | |||
| Ascon Block | Concrete Block | Rock | Drainage | |
| Depth | 0.27–2.5 m | 0.27–2.5 m | 2–2.5 m | 1.5 m |
| Dimension | 0.1–1 m | 0.1–0.5 m | Φ 0.6 m | Φ 0.9 m |
| Appearance |  |  |  |  |
Table 2.
Specifications of the GPR.
| Division | System A | System B |
|---|---|---|
| Antenna frequency (MHz) | 400 | 100–4000 |
| Antenna type | Impulse | Coded signal |
| No. of channels | 25 | 30 |
| Survey width(m) | 2.4 | 2.4 |
| Sampling rate(m) | Length 0.08, width 0.1 | Length 0.045, width 0.08 |
| Range(ns) | 40 | 50 |
| Operating software | MIRA Soft ver. 3.82 | Radar Portal Control ver. 2 |
| Analysis software | rSlicer-090902 GPRIS System Vision 1.17.1.11 | Radar Portal Control ver. 2 |
Table 3.
Weather condition for 7 days before the survey day (AWS 1 data at Hongsung) [66].
Table 3.
Weather condition for 7 days before the survey day (AWS 1 data at Hongsung) [66].
| Survey Date | R.H. | Season | Average Temperature | Note |
|---|---|---|---|---|
| 4 December 2019 | About 45% | Winter | 0.8–5.7 °C (min. 3.9–max. 11.2 °C) | 3 raining days 2, 3 foggy days |
1 Automatic Weather System. 2 The amount of rainfall 0–5 mm, including the raining-sensing day.
Table 4.
Survey result for abnormality.
| Division | Asphalt Pavement | Plain Concrete Pavement | CRCP |
|---|---|---|---|
| A-A’ | EPS 4 ea. | EPS 1 ea. | - |
| B-B’ | Steel plate 1 ea., PE bottle 2 ea. | - | - |
| Depth | 0.27–1.0 m | 0.45 m | - |
Table 5.
Test results.
| Division | Status | Test Result | |||||||
|---|---|---|---|---|---|---|---|---|---|
| System A | System B | ||||||||
| Size (m) | Location in Length (m) | Depth (m) | Depth (m) | Error (m) | Ratio (%) | Depth (m) | Error (m) | Ratio (%) | |
| AP-A01 | D0.5 | 2.00 | 0.27 | 0.30 | 0.03 | 11.11 | 0.30 | 0.03 | 11.11 |
| AP-A02 | D0.5 | 5.00 | 0.75 | 0.87 | 0.12 | 16.00 | 0.80 | 0.05 | 6.67 |
| AP-A03 | D0.5 | 8.00 | 1.00 | 1.27 | 0.27 | 27.00 | 1.20 | 0.20 | 20.00 |
| CP-A02 | D1.0 | 2.00 | 0.45 | 0.35 | 0.10 | 22.22 | 0.50 | 0.05 | 11.11 |
| Assumed dielectrics | 9.0 1 | 8.0 1 | |||||||
1 Engineering judgement.
Publisher’s Note: MDPI stays neutral with regard to jurisdictional claims in published maps and institutional affiliations. |
© 2021 by the authors. Licensee MDPI, Basel, Switzerland. This article is an open access article distributed under the terms and conditions of the Creative Commons Attribution (CC BY) license (https://creativecommons.org/licenses/by/4.0/).
Share and Cite
MDPI and ACS Style
Rhee, J.-Y.; Park, K.-T.; Cho, J.-W.; Lee, S.-Y. A Study of the Application and the Limitations of GPR Investigation on Underground Survey of the Korean Expressways. Remote Sens. 2021, 13, 1805. https://doi.org/10.3390/rs13091805
AMA Style
Rhee J-Y, Park K-T, Cho J-W, Lee S-Y. A Study of the Application and the Limitations of GPR Investigation on Underground Survey of the Korean Expressways. Remote Sensing. 2021; 13(9):1805. https://doi.org/10.3390/rs13091805
Chicago/Turabian StyleRhee, Ji-Young, Keon-Tae Park, Jin-Woo Cho, and Sang-Yum Lee. 2021. "A Study of the Application and the Limitations of GPR Investigation on Underground Survey of the Korean Expressways" Remote Sensing 13, no. 9: 1805. https://doi.org/10.3390/rs13091805
Note that from the first issue of 2016, this journal uses article numbers instead of page numbers. See further details here.