
Rapid Mapping of Large-Scale Greenhouse Based on Integrated Learning Algorithm and Google Earth Engine
by
 , , and
Jinhuang Lin
1,2 ,
,
Xiaobin Jin
1,2,3,*,
Jie Ren
1,
Jingping Liu
1,
Xinyuan Liang
1 and
Yinkang Zhou
1,2,3 1
School of Geography and Ocean Science, Nanjing University, 163 Xianlin Avenue, Qixia District, Nanjing 210023, China
2
Key Laboratory of Coastal Zone Exploitation and Protection, Ministry of Land and Resources, 163 Xianlin Avenue, Qixia District, Nanjing 210023, China
3
Natural Resources Research Center, 163 Xianlin Avenue, Qixia District, Nanjing University, Nanjing 210023, China
*
Author to whom correspondence should be addressed.
Remote Sens. 2021, 13(7), 1245; https://doi.org/10.3390/rs13071245
Submission received: 10 February 2021
/
Revised: 8 March 2021
/
Accepted: 17 March 2021
/
Published: 25 March 2021
(This article belongs to the Section Biogeosciences Remote Sensing)
Abstract
:A greenhouse is an important land-use type, which can effectively improve agricultural production conditions and increase crop yields. It is of great significance to obtain the spatial distribution data of greenhouses quickly and accurately for regional agricultural production and food security. Based on the Google Earth Engine cloud platform and Landsat 8 images, this study selected a total of 18 indicators from three aspects of spectral features, texture features and terrain features to construct greenhouse identification features. From a variety of classification algorithms for remote-sensing recognition of greenhouses, this study selected three classifiers with higher accuracy (classification and regression trees (CART), random forest model (randomForest) and maximum entropy model (gmoMaxEnt)) to construct an integrated classification algorithm, and then extracted the spatial distribution data of greenhouses in Jiangsu Province. The results show that: (1) Google Earth Engine with its own massive data and cloud computing capabilities, combined with integrated classification algorithms, can achieve rapid remote-sensing mapping of large-scale greenhouses under complex terrain, and the classification accuracy is higher than that of a single classification algorithm. (2) The combination of different spectral, texture and terrain features has a greater impact on the extraction of regional greenhouses, the combination of all three aspects of features has the highest accuracy. Spectral features are the key factors for greenhouse remote-sensing mapping, but terrain and texture features can also enhance classification accuracy. (3) The greenhouse in Jiangsu Province has significant spatial differentiation and spatial agglomeration characteristics. The most widely distributed greenhouses are mainly concentrated in the agriculturally developed areas such as Dongtai City, Hai’an County, Rudong County and Pizhou City.
1. Introduction
In the past 20 years, with the continuous innovation of agricultural production technology, the yield of crops has been greatly improved, and the application of greenhouse technology is one of the typical representatives [1,2]. As an extremely important land-use type in current agricultural production, the large number of applications of greenhouses enable regional agricultural production to overcome native natural conditions that are not conducive to crop growth, providing good greenhouse conditions for the growth and development of crops, greatly improving the yield of crops [3,4,5]. As of the end of 2016, China’s greenhouse covers an area of 981,000 hectares [6], which is of great significance to ensuring China’s food security. However, the large number of existing greenhouses not only has a huge impact on the current agricultural production efficiency and structure, but also poses a huge threat to the ecological environment, as the waste of greenhouses has caused a lot of “white pollution”. Greenhouses have become more widely used, and have become an important land-use method, but the existing land-use classification system rarely classifies greenhouse independently. Therefore, rapid and accurate large-scale remote-sensing mapping of greenhouses has important practical significance for analyzing the characteristics of land-use transition and guiding regional agricultural production [7,8].
Currently, relevant scholars have conducted research on greenhouses and have achieved fruitful results. However, due to technical limitations, the early extraction was mainly based on a combination of high-resolution images and object-oriented methods [9,10]. Many scholars in the world have carried out research on remote-sensing recognition of greenhouses for different research areas. Among them, a large number of research projects have been conducted on GeoEye-1, WorldView-2, GaoFen-2 and Sentinel-2 images, and obtained fruitful results [11,12,13,14]. Although the extraction accuracy was relatively high, due to the difficulty of obtaining high-resolution images, generally the extraction was performed in a specific typical area. For applied research, most of the research scales are small, and it is difficult to achieve large-scale rapid remote-sensing mapping of the greenhouse [15]. Due to the long observation period and free download, Landsat images can provide the possibility for large-scale remote sensing mapping, and its resolution is relatively high, which can ensure the reliability of the extraction results of greenhouses [8]. At present, with the continuous progress of geographic information systems (GIS) and remote-sensing technology, some scholars have used Landsat images to achieve large-scale remote-sensing extraction of greenhouses [1,16]. Among them, the most representative is the greenhouse recognition index based on Landsat images [9,17], which has good overall accuracy, but the constructed greenhouse index generally has typical regional features that are difficult to avoid. For example, a small area with a dense and large number of greenhouses is generally selected as the case area, and the extraction effect of the algorithm is only good in this area. However, under complex topographic features, the constructed greenhouse extraction model is generally difficult to promote regionally, and the migration accuracy of the greenhouse recognition algorithm constructed in different regions is generally poor. Therefore, how to build a general and efficient large-scale greenhouse recognition algorithm under complex terrain conditions based on medium-high resolution images is a difficult point in current research. It is necessary to ensure the accuracy and efficiency of the research, and to achieve the regional portability of the greenhouse recognition algorithm.
Google Earth Engine is a geographic computing cloud platform launched by Google. It comes with massive remote-sensing images (Landsat, Sentinel, MODIS, etc.) [18,19], and has powerful cloud computing capabilities, which can provide a large amount of basic data and programming platform for rapid and accurate remote-sensing monitoring, and can provide possibility for efficient and accurate large-scale remote-sensing mapping. At present, scholars have performed remote-sensing recognition of ground features based on the Google Earth Engine platform [20,21,22], and have achieved good recognition results, such as the remote-sensing extraction of summer crops in Jiangsu Province based on the Google Earth Engine platform [23]. With the improvement of the recognition of the Google Earth Engine cloud platform in the academic world, the current remote-sensing dynamic monitoring research based on Google Earth Engine has achieved numerous results and greatly improved the efficiency of related research.
However, the current remote-sensing recognition research based on the Google Earth Engine cloud platform mainly uses the single classifier that comes with the platform to classify and extract features, but the applicability of remote-sensing classification of different algorithms is different, and there is no unified optimal classification algorithm in different regions. Therefore, now that Google Earth Engine provides such application conditions and a variety of commonly used classification algorithms, can we rely on the efficient cloud computing capabilities and its massive remote-sensing data of the Google Earth Engine cloud platform, and build a comprehensive classifier that integrates the advantages of different algorithms, and then realize large-scale remote-sensing rapid mapping under complex terrain?
In view of this, with the Google Earth Engine cloud platform and the idea of ensemble learning classification, this study constructs an integrated classification algorithm for greenhouse recognition in Jiangsu Province based on regional terrain characteristics, and replaces the classification results obtained by the original better classifier with the pixel-by-pixel classification probability. Thus, this study realizes the rapid remote-sensing mapping of the large-scale greenhouse, and provides scientific guidance for regional agricultural production activities.
2. Research Data and Methods
2.1. Study Area
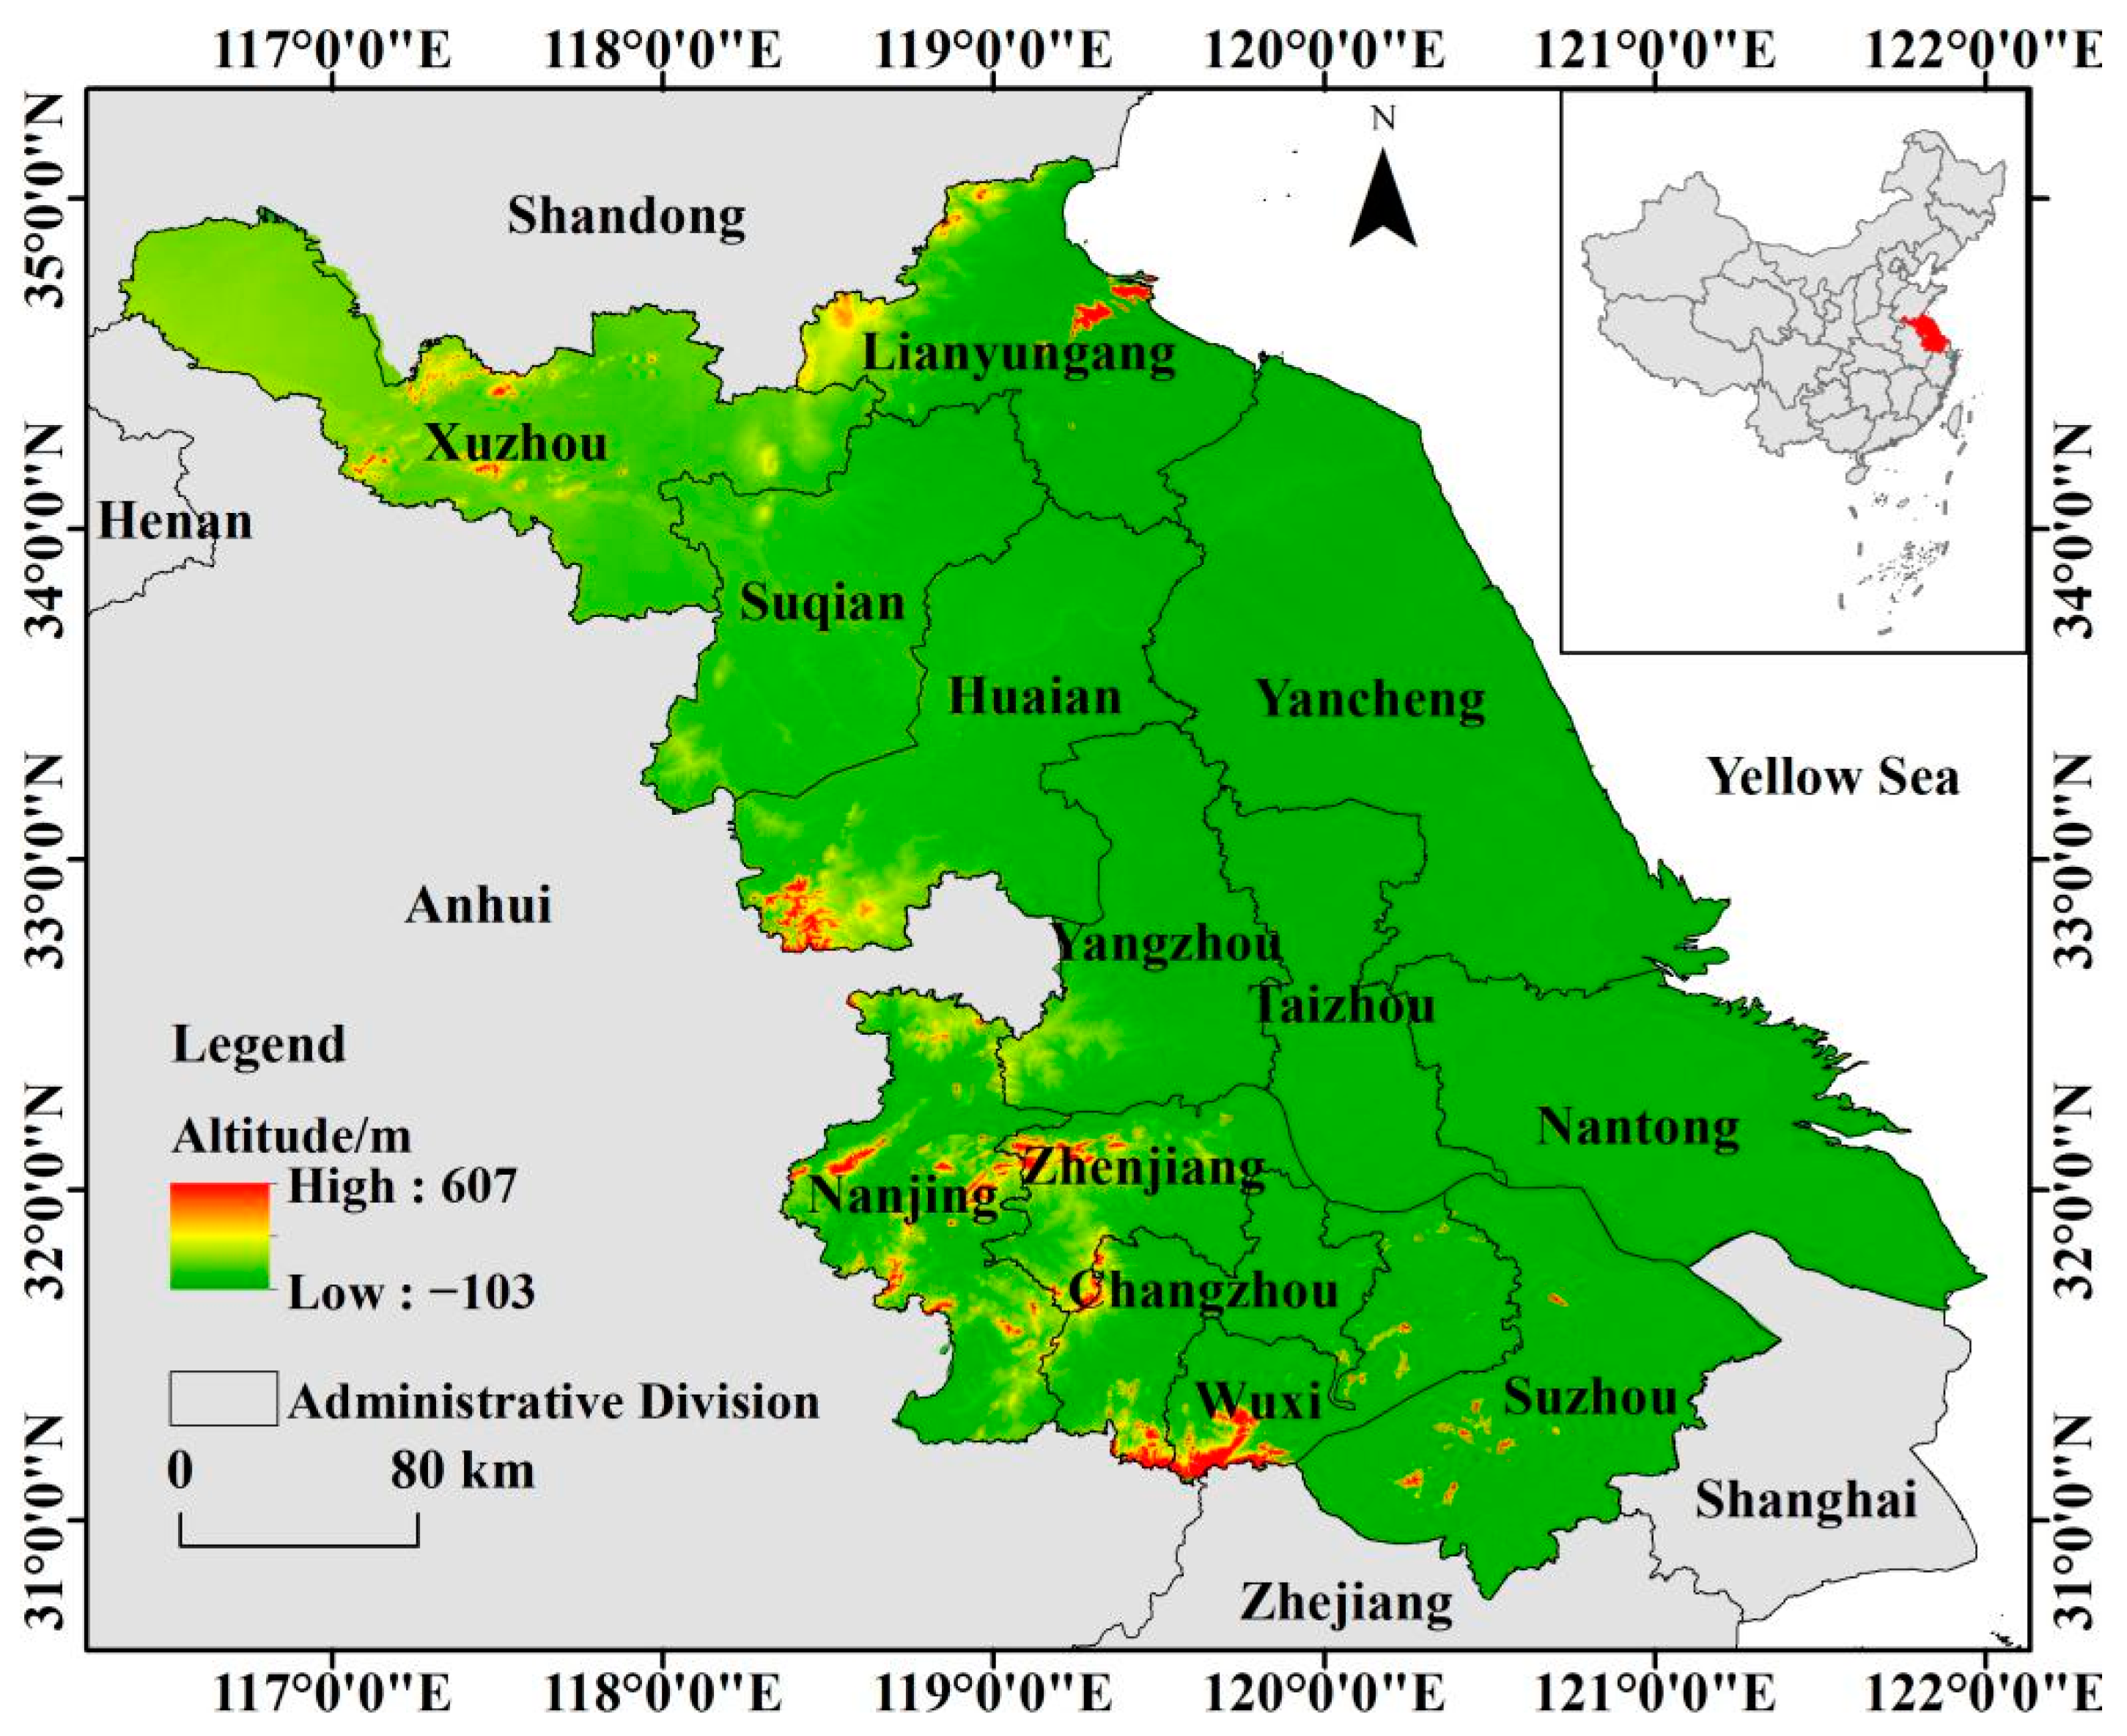
Jiangsu Province is located on the east coast of China, 116°18 E–121°57 E, 30°45 N–35°20 N, with a total area of 107,200 km2, bordering Shandong in the north, Anhui in the west, Zhejiang in the south, and Shanghai in the east, which is an important part of the Yangtze River Delta Economic Zone (Figure 1). In 2018, the regional GDP was 9259.54 billion yuan, with a permanent population of 80.507 million at the end of the year. This area belongs to the transition zone from subtropical to warm temperate zone, with mild climate, moderate rainfall and four distinct seasons. As a major agricultural province in China, Jiangsu Province has the Southern Jiangsu Plain, the Jianghuai Plain, the Huanghuai Plain and the Eastern Coastal Plain. The cultivated land in the region is vast and high in quality, and agricultural production activities are very developed. It is an important crop and vegetable crop cultivation area in the country. Greenhouses have the functions of increasing temperature and moisture, and can provide a good growth environment for crops, thereby increasing crop yields. In recent years, greenhouses have been widely used in this area.
2.2. Data Source
To effectively identify the greenhouse in the research area based on the Google Earth Engine cloud platform, it is necessary to obtain accurate and reliable land sample point data [23]. The classification system of this study is divided into five categories: construction land, water, forest land, farmland and greenhouse. Based on the principle of random and uniform selection, the Google Earth Engine online selection method is used to determine the sample points of each category. The points were selected uniformly within the area, and a total of 12,836 sample points were selected (Table 1). Using the random number algorithm that comes with Google Earth Engine, according to the ratio of 7:3, the various sample points were divided into two categories: training samples and validation samples, which were used in classification algorithm training and accuracy verification later.
2.3. Feature Construction
The selection of feature variables is one of the important prerequisites for remote-sensing land classification recognition and extraction. There are many kinds of feature variables, using multiple feature variables and their combinations can effectively improve the classification accuracy of remote-sensing interpretation [20,24]. This research starts from the current characteristics of the distribution of greenhouses, and fully considers the significant differences between greenhouses and other land types, such as the spectral characteristics and texture characteristics of greenhouses that are clearly different from other ground objects, and the topographical characteristics of greenhouses in spatial distribution. Based on this, the feature bands of spectrum, texture, and terrain that help improve the accuracy of regional greenhouse extraction are selected, and a large-scale greenhouse recognition algorithm based on the integrated algorithm and Google Earth Engine is constructed.
Previous studies have shown that the spectral characteristics of images are the key feature variables for remote-sensing interpretation of ground features [9,25]. This is due to remote-sensing images generally having the phenomenon that the same spectrum on remote-sensing images may actually be different ground features, and the same ground features may also have different spectral features on remote-sensing images [23]. Therefore, selecting a single spectral feature for remote-sensing extraction of land-use types maybe cause partial errors and omissions in the classification results of remote sensing interpretation [24]. Texture features represent the spatial change and repetition of the image gray level, or the repeated local patterns and arrangement rules in the image [26], which can improve the classification accuracy of remote-sensing to a certain extent [27]. In addition, the spatial distribution of greenhouses is closely related to the planting environment of regional agricultural production. Different topographic features determine whether the area is suitable for greenhouses. Therefore, topographic features should be incorporated into the construction of feature variables. In view of this, this study selects 10 spectral features, 6 texture features, and 2 topographic features to construct feature parameters of greenhouse identification, and then realizes the effective identification of greenhouses in the study area (Table 2).
2.3.1. Spectral Features
Current research has found that the remote sensing index can enrich the spectral characteristics of remote-sensing images to a certain extent, and has a certain enhancement effect on the effective identification of ground objects [23]. Therefore, this study selects Band1, Band2, Band3, Band4, Band5, Band6 and Band7 of Landsat 8 images, and calculates the normalized difference vegetation index (NDVI), normalized difference building index (NDBI) and normalized difference water index (NDWI) based on the Google Earth Engine cloud platform, and add these three remote-sensing indexes as additional spectral bands.
where NDVI, NDBI, and NDWI are the normalized difference vegetation index, normalized difference building index, and normalized difference water index, respectively; , , and represent the values of reflectance for near-infrared, infrared, mid-infrared, and green bands, respectively.
2.3.2. Texture Features
The gray-level co-occurrence matrix (GLCM) is a widely used texture statistical analysis method [28]. The Google Earth Engine cloud platform provides a function glcmTexture (size, kernel, average) to calculate GLCM. Because the texture features of different bands of Landsat8 image are basically similar, and previous studies have shown that the blue band (Band2) is the most sensitive to the identification of greenhouses [10], therefore, the blue band was selected for texture feature calculation, and a total of 18 texture feature parameters were obtained. Referring to the results of previous studies, starting from the texture characteristics of the greenhouse in the region, considering the correlation, difference and redundancy between texture parameters, the six most common texture parameters were selected from the aspects of contrast, correlation, and entropy etc. Based on the Google Earth Engine cloud platform, the angular second moment (B2_asm), contrast (B2_contrast), correlation (B2_corr), variance (B2_var), inverse difference moment (B2_idm), and entropy (B2_ent), were selected to construct the characteristic parameters of greenhouse and train the classifier, and to reduce data overlap and redundancy between too many texture features [23].
2.3.3. Topographic Features
The topographic features can be characterized by the two indicators of elevation and slope that can be extracted from the elevation data. This study used the topographic data SRTMGL1_003 with a resolution of 30 m that comes with the Google Earth Engine, and calculated the two parameters of elevation and slope with the ee.Terrain.products (input) function. Then they were added to the synthesized multi-band image as two independent feature bands for remote-sensing recognition of greenhouses.
2.4. Integrated Learning Algorithm
Previous studies have shown that due to the special geographical environment of the region, the classification accuracy of different classification algorithms for different types of land are obviously different [29], and even if the overall classification accuracy of a certain algorithm is the highest, the classification accuracy of a particular type of land may not be the highest [30,31]. In addition, the classification accuracy of different local algorithms in the region also have certain differences [32,33]. The ensemble learning algorithm converts the traditional classification results based on a single superior classifier into an integrated classification result that comprehensively considers multiple classifiers, uses the pixel-by-pixel classification probability under the multi-classification algorithm to determine the final land-use type [34], which can reduce accidental errors caused by a single classification algorithm. The classification results of a single better classification algorithm is replaced by the classification probability of each pixel, which can integrate the advantages of different algorithms to obtain more accurate greenhouse classification results.
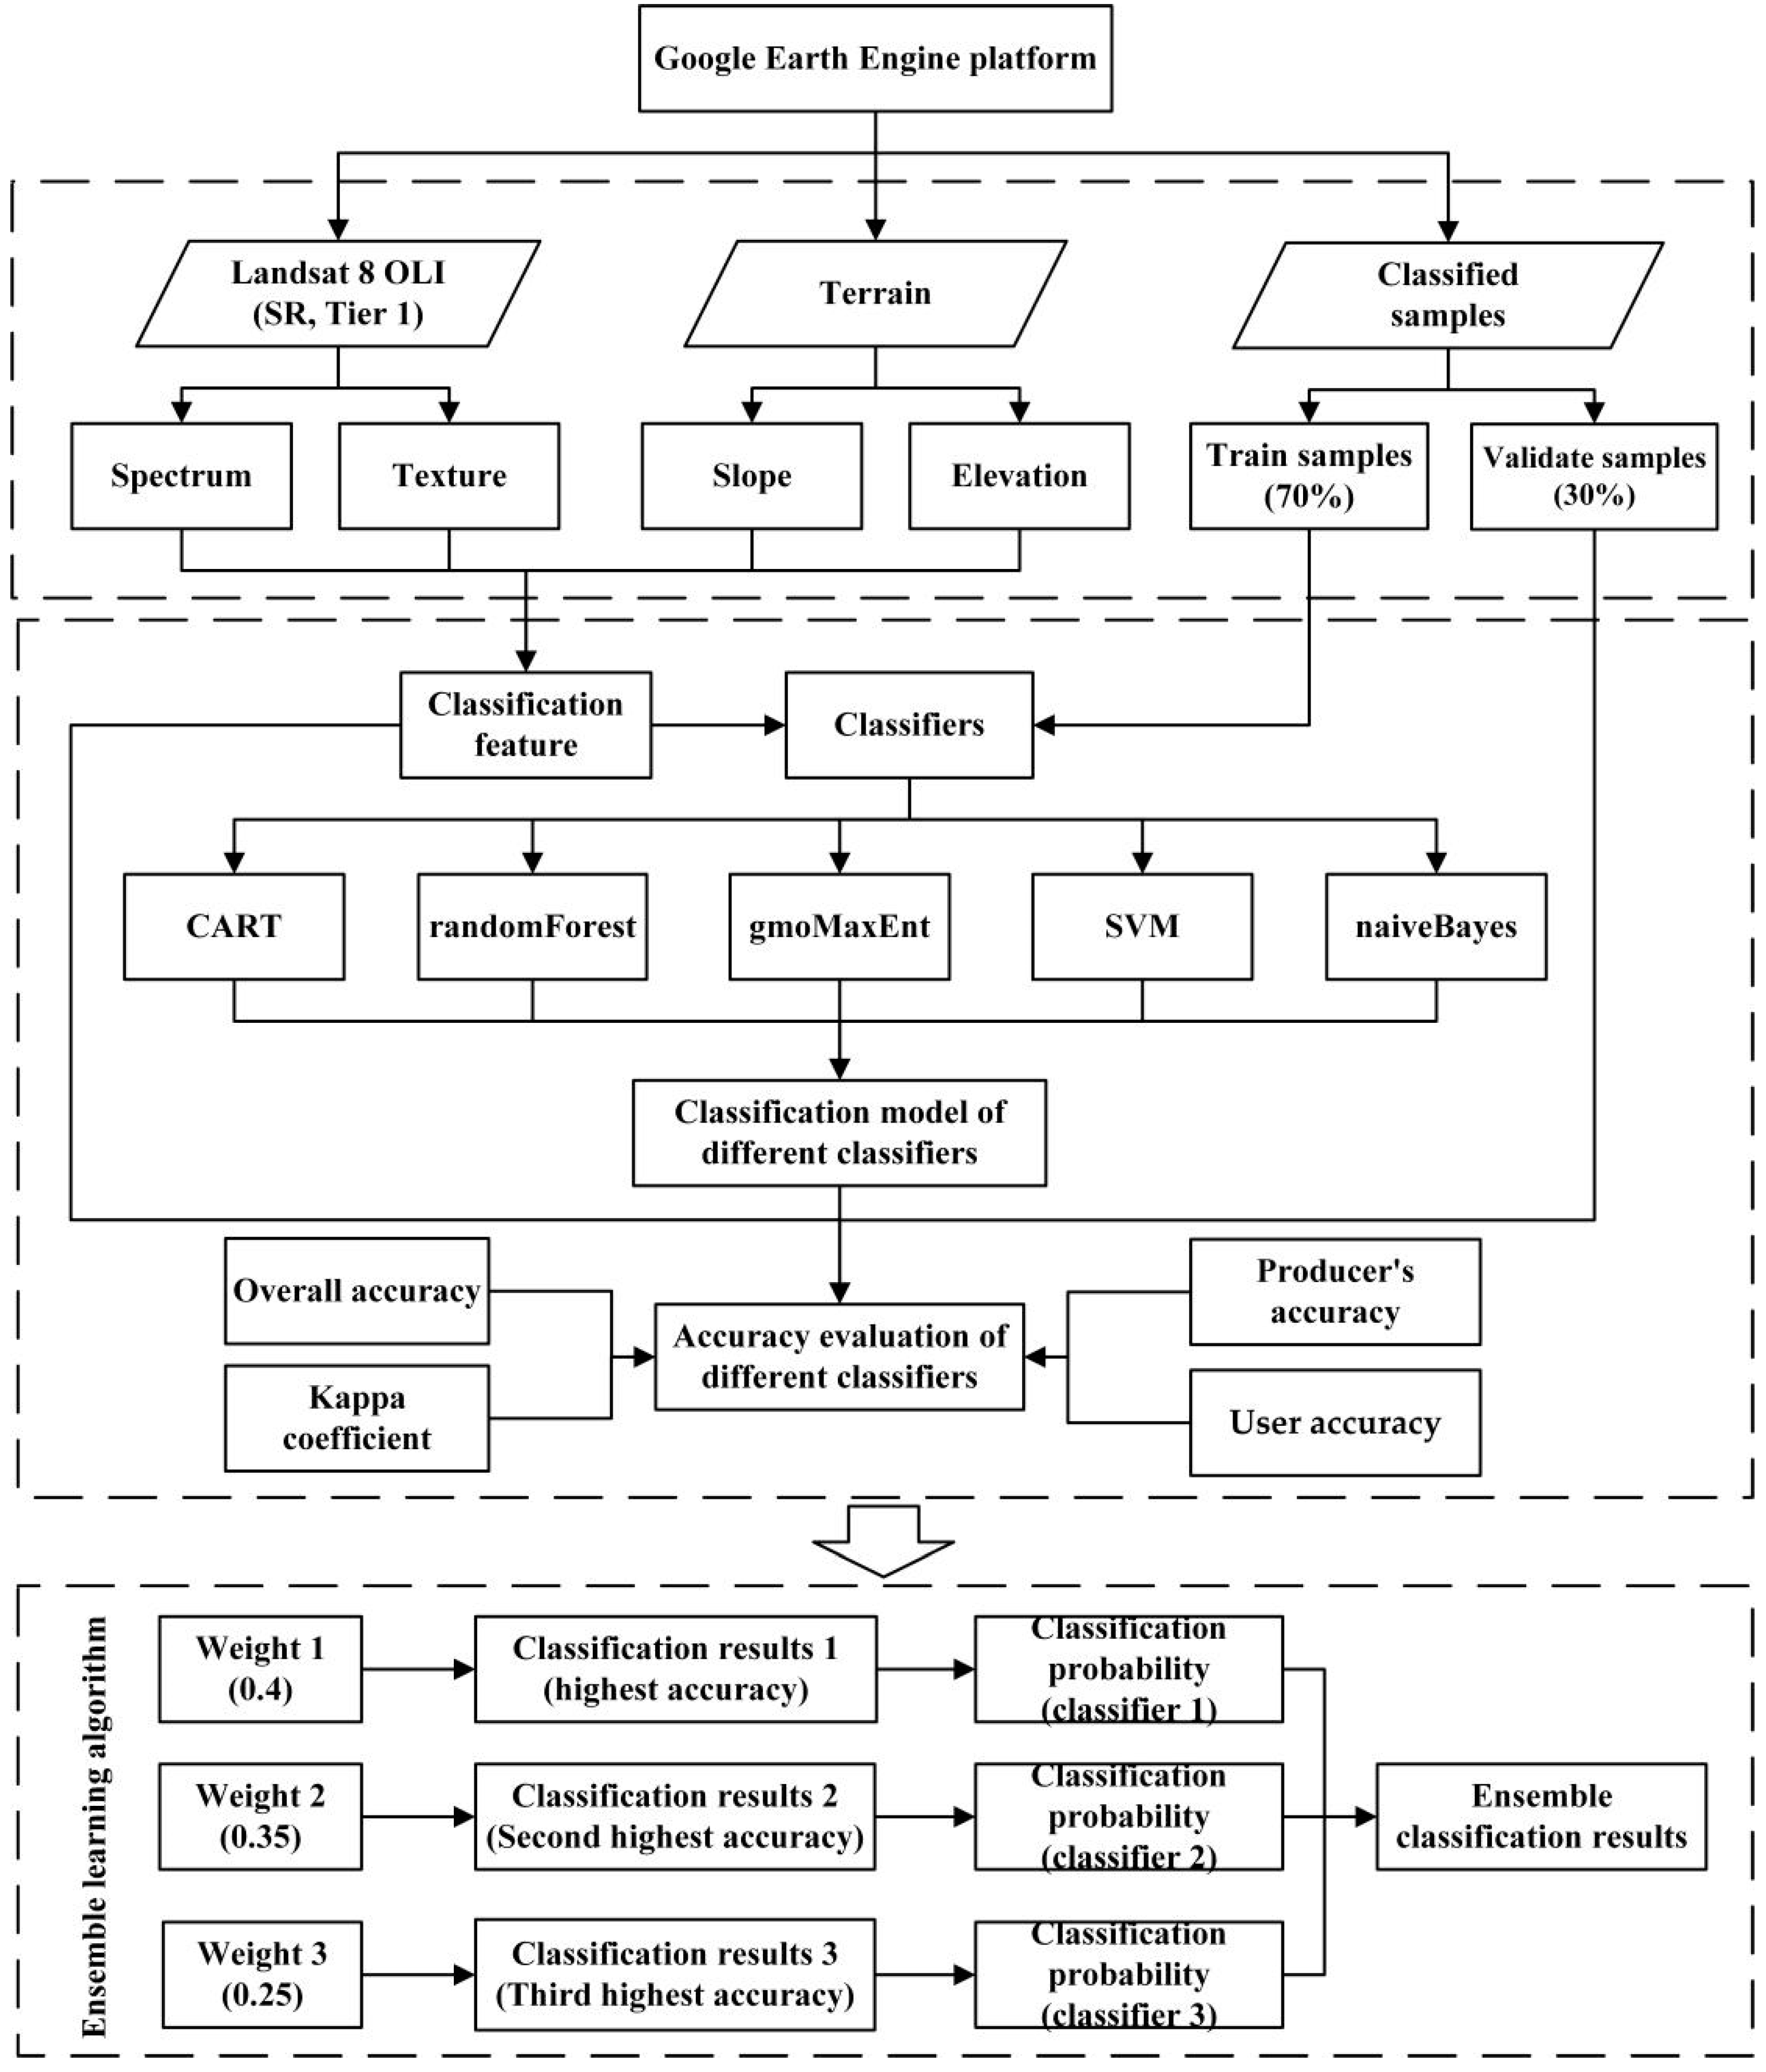
At present, scholars have conducted research on land extraction based on integrated learning algorithms and have achieved fruitful results. According to the natural environment of the region, this research constructed the feature bands based on spectral features, texture features, and topographic features, and selected five classifiers including classification and regression trees model (CART), support vector machines model (SVM), random forest model (randomForest), maximum entropy model (gmoMaxEnt) and naive Bayesian model (naiveBayes), to interpret the spatial distribution of greenhouses in the study area, based on the Google Earth Engine cloud platform and its own Landsat 8 images. On this basis, the recognition accuracy of greenhouses with different classifiers was compared, and the classifier with higher accuracy was selected. In order to better distinguish the accuracy of the different classifiers, and to ensure that the probability of the classification result of a single classifier cannot be higher than the cumulative probability of multiple classifiers, the classification results of different classifiers can be considered comprehensively, and the absolute influence of a single classifier can be avoided, so that the classification results of the integrated learning classification algorithm can obtain the advantages of different classifiers as much as possible. Therefore, this research assigned different weights according to the accuracy from large to small, and built an integrated learning algorithm for greenhouse remote-sensing mapping under complex terrain based on Google Earth Engine. By calculating the probability of land-use type on the pixel-by-pixel classification results, this research replaced the classification result of the original single classification algorithm with the classification probability of land-use type to obtain the spatial distribution of greenhouses in Jiangsu Province. The specific technical process is shown in Figure 2.
2.5. Accuracy Accessment
Due to the differences in the classification principles of different classifiers, there are also certain differences in the classification accuracy of different algorithms. This study evaluated the classification accuracy of different classifiers to select a better classifier. The data were mainly based on the randomly selected verification sample points that account for 30% of the total sample size. The confusion matrix of land recognition under different classification algorithms was calculated, and the overall accuracy (OA), producer’s accuracy (PA), user’s accuracy (UA) and Kappa coefficient (KC) were selected [35] to compare the extraction accuracy of greenhouses under different classification algorithms in Jiangsu Province in 2018, and to construct an integrated learning algorithm for greenhouse recognition. Among them, the PA was the probability that the classifier can classify the pixels of an image as A, assuming that the ground surface was truly class A; the UA was the probability that the ground truth class is A, when the classifier classifies the pixel into the A class; the KC and OA represented the overall classification effect of all land types.
3. Results
3.1. Recognition Accuracy of Each Classifier
Based on the Google Earth Engine, this research used CART, randomForest, gmoMaxEnt, SVM, and naiveBayes to extract the spatial distribution of greenhouses. The user’s accuracy and producer’s accuracy of each classifier were: CART (0.90, 0.87) > randomForest (0.86, 0.83) > gmoMaxEnt (0.85, 0.81) > SVM (0.57, 0.47) > naive Bayes (0.51, 0.39) (Table 3). It can be seen that the greenhouse classification accuracies of CART, randomForest and gmoMaxEnt were high and can be used to construct the greenhouse extraction and classification algorithm in Jiangsu Province, while the greenhouse classification accuracies of SVM and naiveBayes were low, so these two algorithms were not considered for the construction of the greenhouse integration algorithm.
3.2. Greenhouse Extraction of Integrated Learning Algorithm
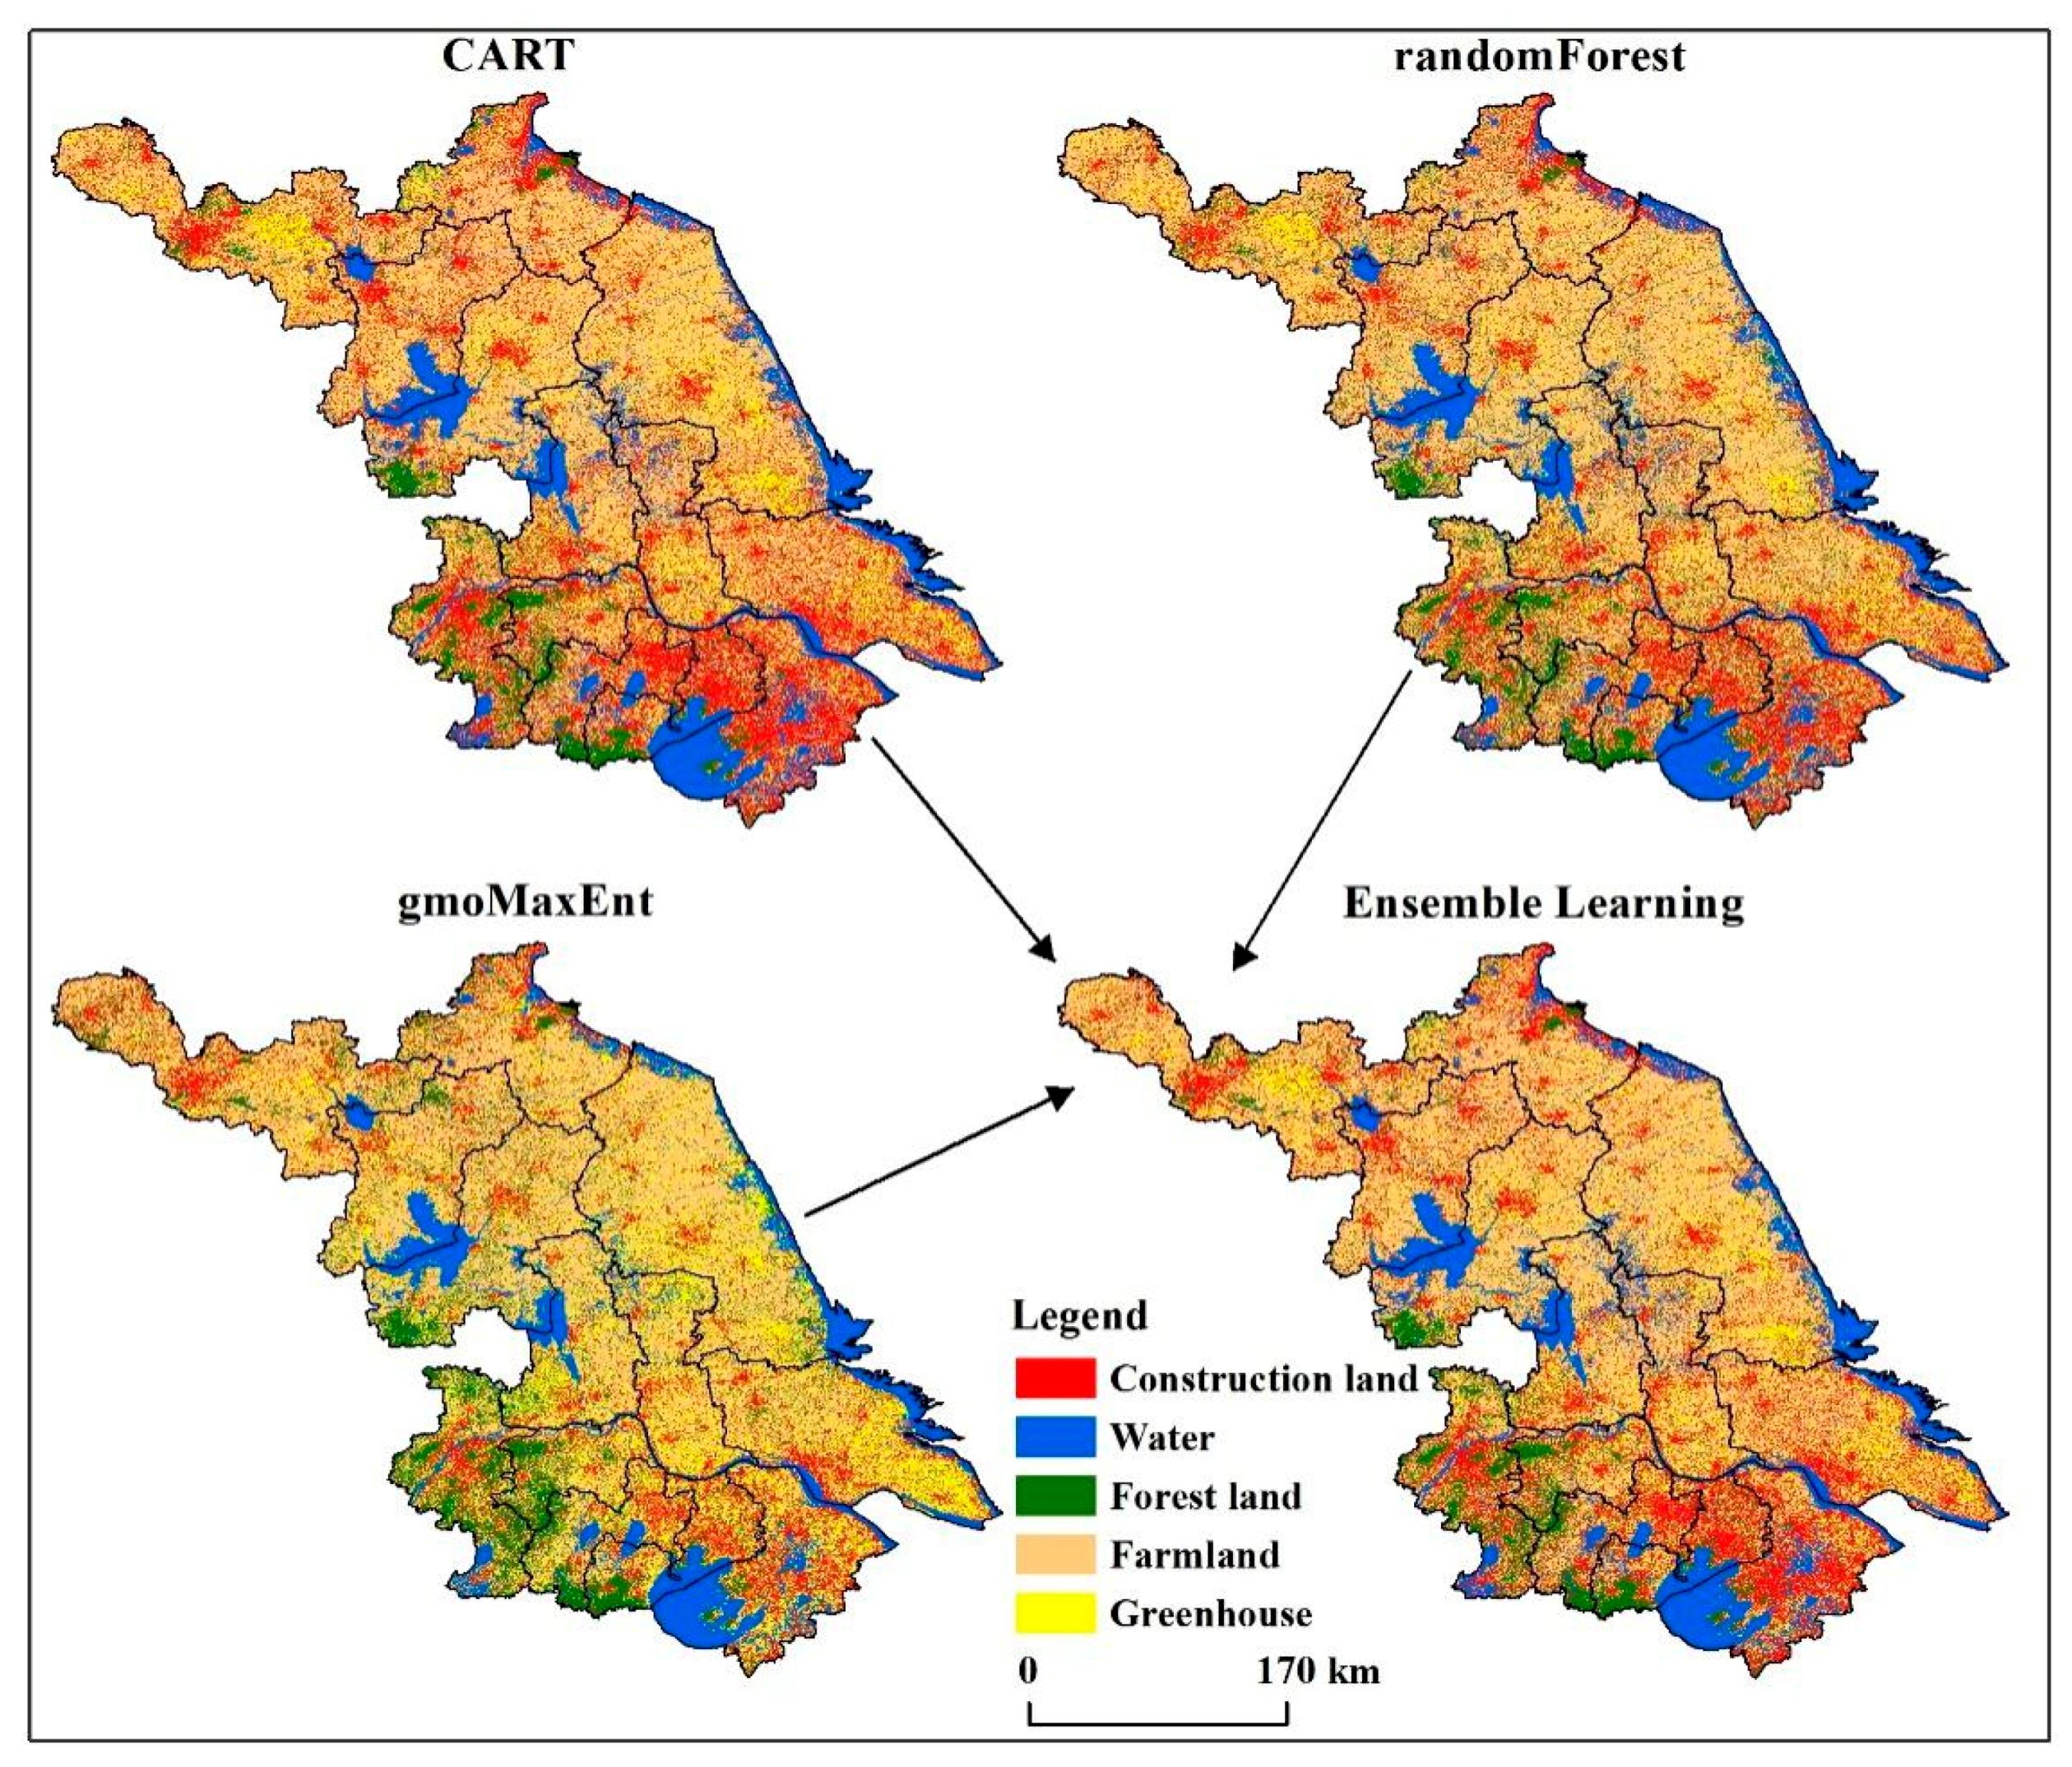
Based on the classification accuracy of each classifier, from the perspective of producer’s accuracy, the accuracy of the three classifiers of CART, randomForest and gmoMaxEnt is high (UA > 0.8), and the accuracy of the SVM and naiveBayes is low (UA < 0.6). Therefore, three classifiers of the CART, randomForest and gmoMaxEnt were selected to construct integrated learning classifier for greenhouse extraction in Jiangsu Province. Due to the high accuracy of the three classifiers, in order to better distinguish the accuracy of the different classifiers, and to ensure the probability of the classification result of a single classifier could not be higher than the cumulative probability of multiple classifiers. In view of this, in the form of hierarchical weighting, weights were assigned according to the producer’s accuracy of the classifiers, according to the classification accuracy from large to small, the classification results under the three algorithms of CART, randomForest and gmoMaxEnt were respectively weighted as 0.4, 0.35 and 0.25, and the classification result under the final integrated learning algorithm was the land-use type with the largest classification probability on the pixel-by-pixel, the land use The classification probability replaced the classification result under the traditional single classifier, then the spatial distribution of greenhouse in Jiangsu was obtained (Figure 3).
On the basis of the identification of the greenhouse, the confusion matrix of the land use types under the algorithm was further calculated based on the verification sample points. As shown in Table 4, from the perspective of producer’s accuracy, the classification accuracy of greenhouses is 0.94, and there are 985 real samples, of which 927 are correctly classified, and 58 are incorrectly classified into other land use types. In addition, from the perspective of user’s accuracy, the classification accuracy of greenhouses is 0.88, which is also high. Overall, the classification accuracy of greenhouses is relatively high. This method can effectively identify the spatial distribution of greenhouse in the region.
3.3. Spatial Distribution Characteristics of Greenhouses
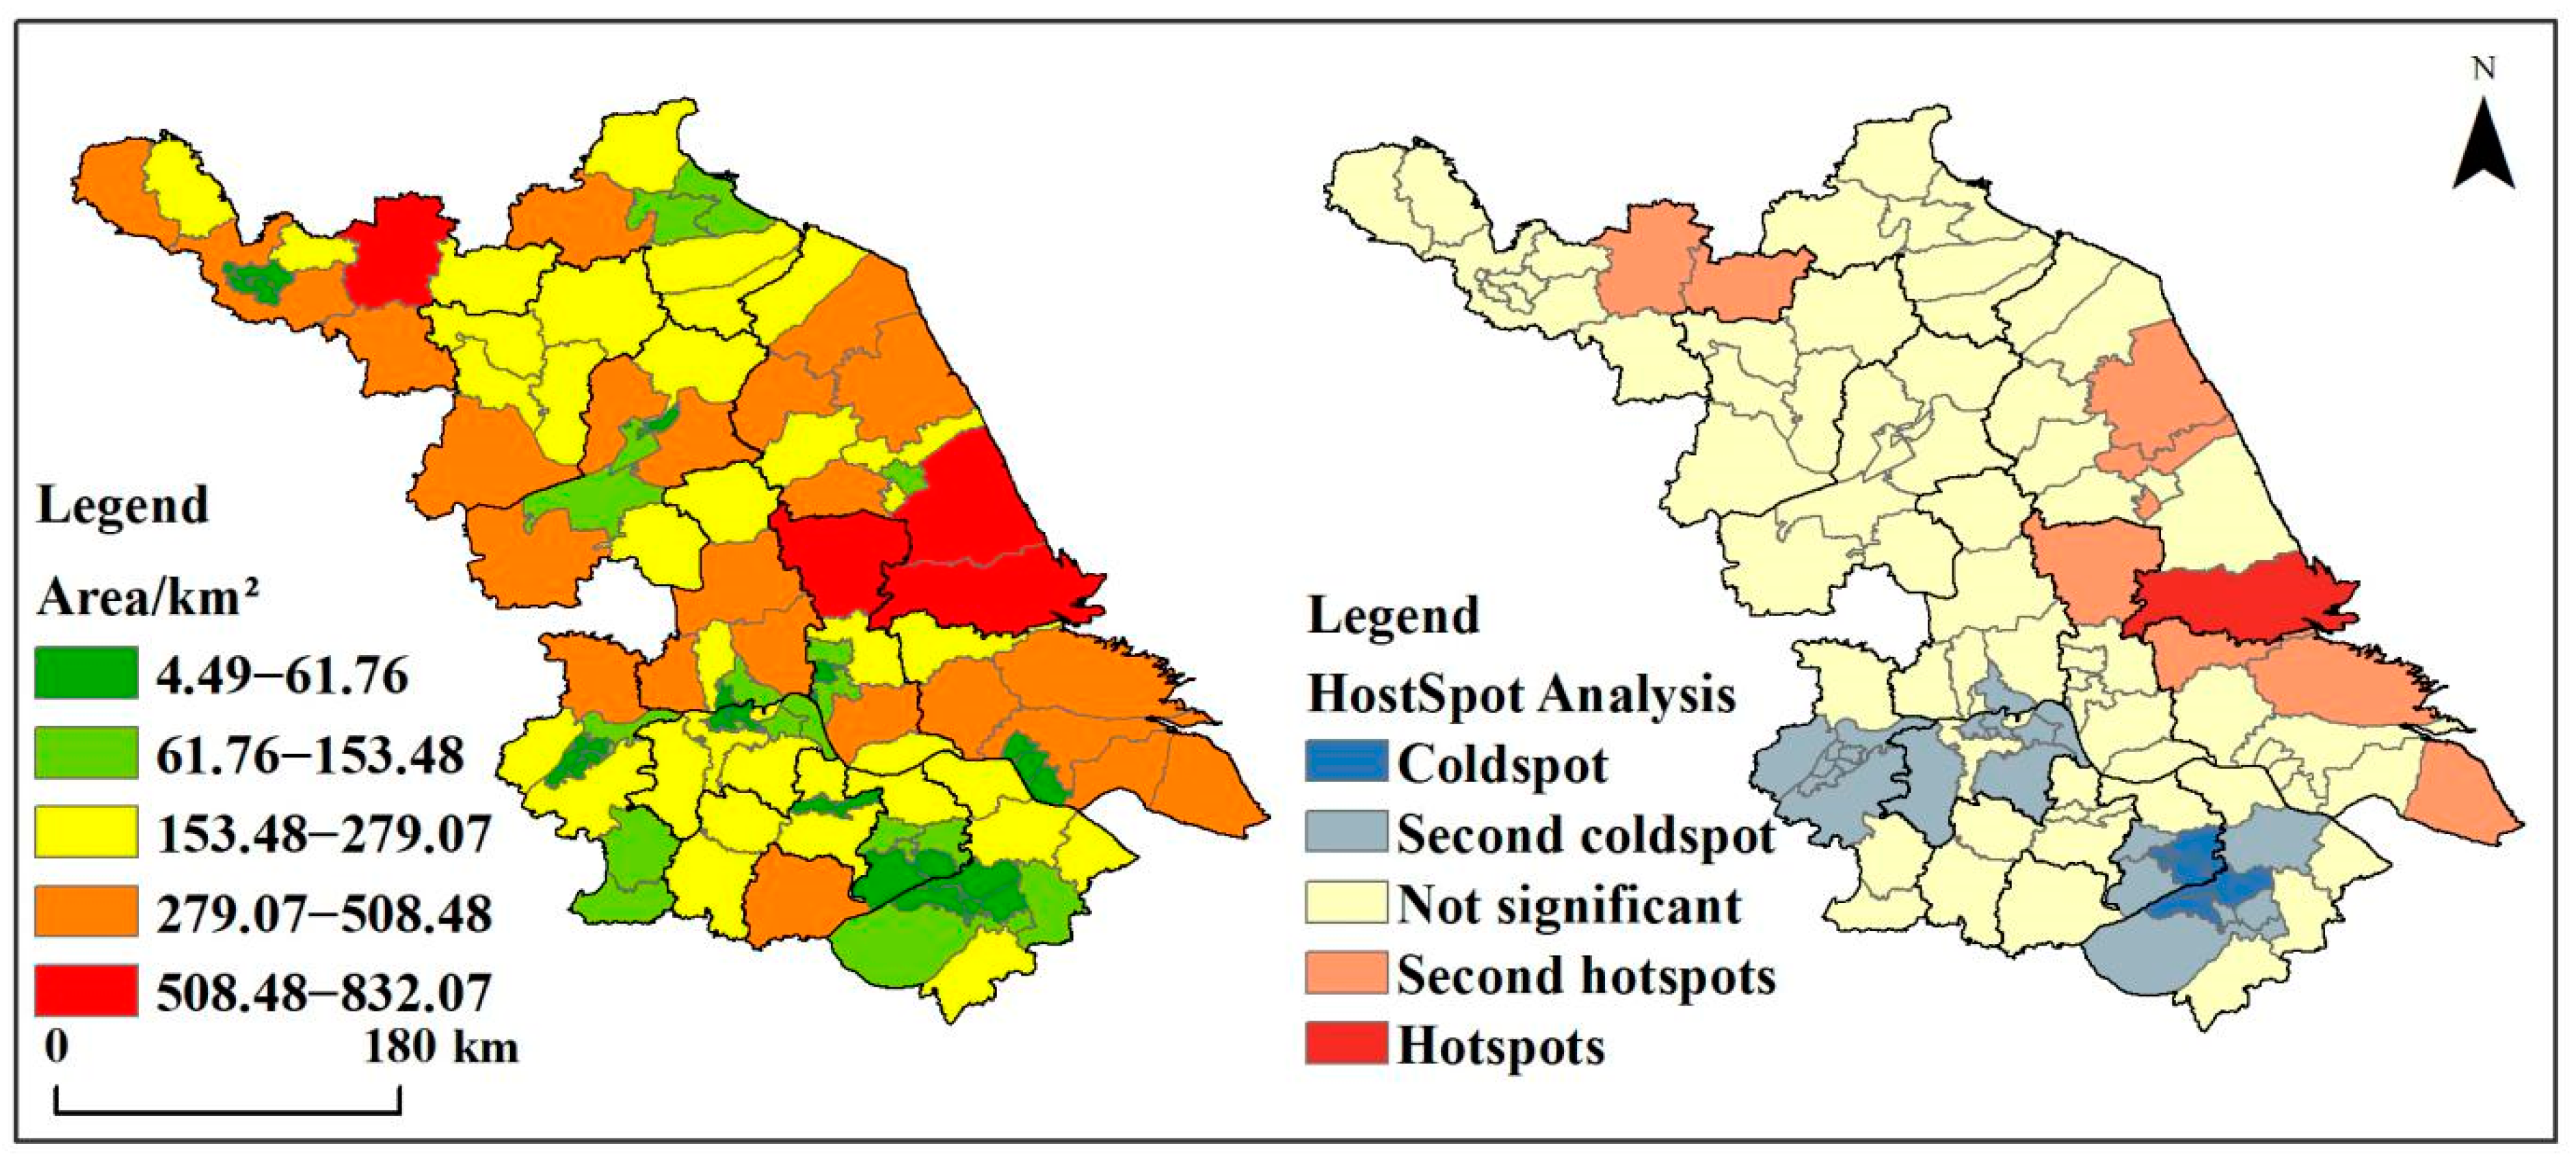
Based on the Google Earth Engine cloud platform, an integrated algorithm was used to extract the spatial distribution of greenhouses in Jiangsu Province in 2018, then the greenhouse area was calculated at the county scale, and the cold spots and hot spots of the greenhouse area distribution in different counties is analyzed (Figure 4). There is obvious spatial differentiation of greenhouses in Jiangsu Province, and the distribution area of greenhouses in different counties is quite different. The most widely distributed greenhouses in the county are mainly concentrated in the agriculturally developed areas such as Dongtai City, Haian County, Rudong County and Pizhou, where the county-level greenhouses are more than 500 km2, and the county-level greenhouses are the most sparsely distributed in the economically developed areas of southern Jiangsu, such as Changshu City, Binhu District, and Wujiang District. From the distribution pattern of cold spots and hot spots of greenhouses at the county level, it can be seen that the spatial distribution of greenhouses in Jiangsu Province has obvious spatial agglomeration characteristics. The hot spots are mainly concentrated in several core distribution areas in the east and north of the study area, where are important food and vegetable production bases in Jiangsu Province, and the wide application of greenhouses has improved the growth conditions of crops. The cold spots are mainly distributed in the urban areas of southern Jiangsu. These areas have high land development intensity and are the most economically developed core of the study area. Therefore, the proportion of agricultural land used for agricultural production is relatively small.
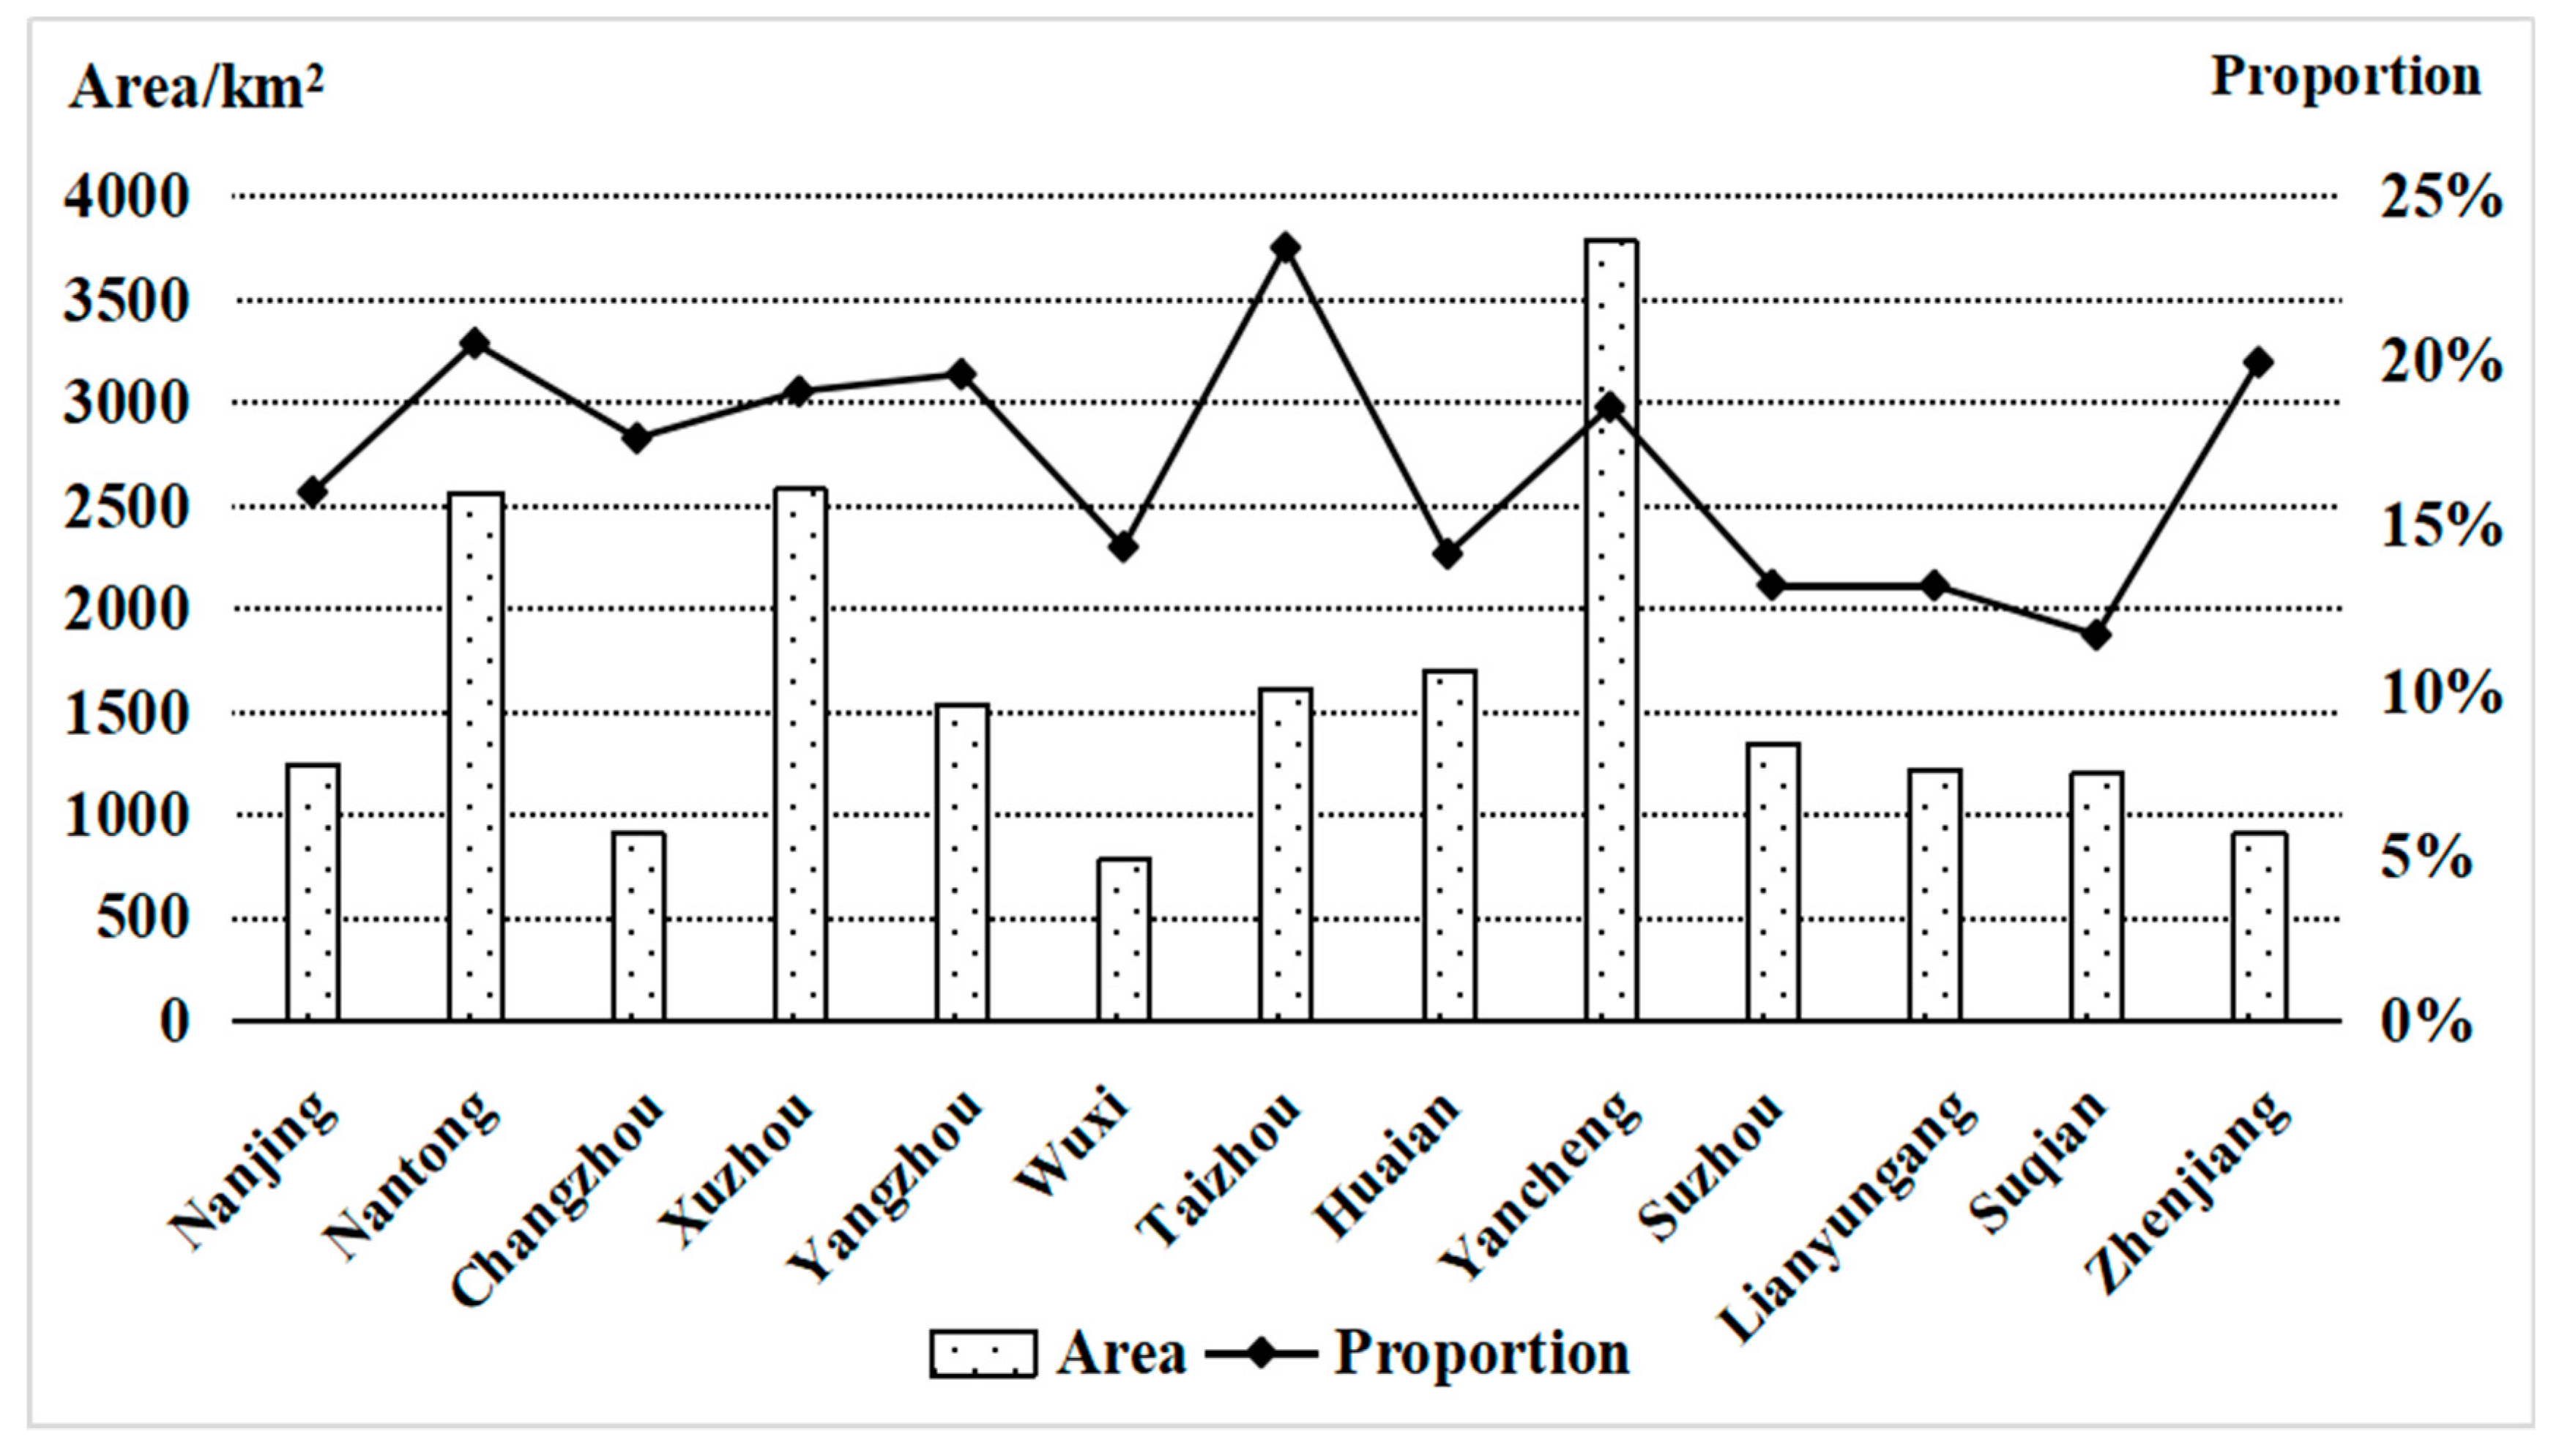
The spatial distribution pattern of greenhouses in different cities of Jiangsu Province is shown in Figure 5. From the perspective of the total area of greenhouses in different cities, there is a large spatial heterogeneity in the spatial distribution of greenhouses in Jiangsu Province. The areas of greenhouses are the largest in Yancheng, Nantong and Xuzhou, while the greenhouse area is the smallest in Wuxi, Changzhou and Zhenjiang. According to the percentage of greenhouses in different cities in the total area of the region, there are also large spatial differences in the proportion of greenhouses in different cities. Taizhou, Zhenjiang, and Nantong have the highest percentages of greenhouses, which are all over 20%, while the proportion of greenhouse area in Suqian, Suzhou and Lianyungang is the smallest. In addition, it is not difficult to find that the proportion of greenhouse area in different regions is not consistent with the overall distribution trend of total greenhouse area. This is mainly related to the proportion of agricultural land in the region. In some regions (such as Yancheng), the total area of greenhouses is the largest, but due to the large total area, the proportion of greenhouses is not the highest.
4. Discussion
4.1. Classification Accuracy under Different Feature Combinations
The construction of feature bands has a great influence on the extraction of regional greenhouses. This study took the CART algorithm with the highest classification accuracy as an example, and combined spectral features, texture features and terrain features to obtain seven different feature combinations of spectral features, texture features, terrain features, spectral + texture features, spectral + terrain features, texture + terrain features, and spectral + texture + terrain features, to explore the accuracy of greenhouse classification under different feature combinations, and to reveal the impact of different features on greenhouse classification. The overall accuracy and kappa coefficients under different feature combinations are shown in Table 5. The extraction accuracy of the greenhouse under the feature combination of spectral + texture + terrain features is the highest, and its overall accuracy and kappa coefficient are 0.90 and 0.87, respectively, which has high credibility. The comprehensive consideration of the visible spectrum, texture and terrain has the best effect on greenhouse extraction. In addition, spectral features are the key factor in the interpretation of greenhouse. The overall classification accuracy of pure spectral features and combinations with spectral features is higher, while the extraction accuracy of the greenhouse with pure topographic features or pure texture features is lower, but they also have a certain enhancement effect on the accuracy of the greenhouse extraction.
4.2. Comparison with Other Greenhouse Extraction Algorithms
With the rapid development of remote-sensing technology, scholars have performed remote-sensing interpretation of greenhouses and achieved fruitful results [36]. However, the current common greenhouse remote sensing interpretation methods are mainly divided into two categories. One is supervised classification based on high-resolution remote-sensing images. For example, based on GaoFen-2 satellite image data, Zhao et al. used the object-oriented nearest neighbor method to extract the information of agricultural greenhouses in Guantao County, Handan City [37]; Aguilar et al. proposed an object-oriented greenhouse identification method for GeoEye-1 and WorldView-2 images [38]. The second is to construct a greenhouse identification index, and determine the division threshold based on the actual sample data, and then extract the spatial distribution data of the greenhouse. For example, Yang et al. used Landsat 7 images as the data basis to construct the plastic greenhouse index from the aspects of spectrum, sensitivity and resolution in Weifang City, Shandong Province, China, and determine the identification thresholds. They applied the rich spectral characteristics of Landsat images to seek large-scale greenhouse extraction methods [9].
Currently, remote-sensing mapping of greenhouses based on high-resolution images can effectively identify the spatial distribution characteristics of greenhouses in specific areas. However, in practical applications, on the one hand, the difficulties in data acquisition, poor data fusion effect and low calculation efficiency will further aggravate the problem of “same object with different spectrum and different object with same spectrum” [23]. The existing methods are only suitable for analysis of small areas, and cannot realize large-scale and long-term remote-sensing monitoring research. Although scholars have conducted research on greenhouse extraction models for specific areas, most of these studies take specific typical areas as cases [9]. The developed extraction algorithms are generally only suitable for small-scale specific areas, and their generalization ability is generally poor. It is difficult to achieve the effective transplantation of these algorithms, and the promotion of the greenhouse recognition algorithm is greatly challenged [3]. In addition, common greenhouse extraction algorithms mainly use better classifiers for greenhouse extraction, ignoring the regional differences under different classifiers [36].
The Google Earth Engine platform is different from the traditional local remote-sensing interpretation process. It can call on hundreds or even thousands of images available in the research area during a specific period of time for stitching. It also comes with cloud removal and classification algorithms, which can be used in a few seconds. It can quickly obtain cloud-free and color-free synthetic images in the research area, and can program algorithms according to our own research needs, which has great operability [20,21,22]. Based on the advantages of Google Earth Engine, this research constructs an integrated classification algorithm of greenhouse extraction based on a classifier with better classification accuracy, and then realizes a long-time sequence and large-scale remote-sensing mapping of the greenhouse, which can quickly and accurately obtain the characteristics of the long-term evolution of the greenhouse in the study area, and provide a reference for guiding regional agricultural production. The results show that the classification accuracy of greenhouse recognition ensemble classifier based on Google Earth Engine is higher. Compared with the traditional greenhouse recognition methods, the research can achieve efficient and large-scale greenhouse remote-sensing rapid mapping, and the algorithm can realize the effective migration of different regions.
4.3. Limitations and Outlook
This research is based on the Google Earth Engine cloud platform and integrated learning algorithm, taking Jiangsu Province as a case area where greenhouses are widely used, constructs an integrated classifier for large-scale remote-sensing recognition of greenhouses under complex terrain, and then realizes rapidly large-scale greenhouse remote sensing mapping. This method is popular in complex terrain with high recognition accuracy, and can achieve efficient and accurate greenhouse remote-sensing monitoring. However, due to the limitation of cloud cover, data accuracy and related auxiliary variables of remote sensing images, the greenhouse identification algorithm adopted in this research still needs to be further improved. For example, although this algorithm comprehensively considers the spectral features, terrain features and texture features, but the accuracy of remote-sensing images is limited to a certain extent, and the extraction of multiple types of greenhouses has not been realized. In addition, this research really lacks consideration of geophysical mechanisms that allow the detection of greenhouses. For example, the spectral characteristics of greenhouses are affected by the comprehensive influence of the atmosphere and the surrounding environment. In the construction of the greenhouse identification algorithm, the parameters of geophysical mechanisms that are closely related to greenhouse identification should be selected, which may further improve the accuracy and reliability of greenhouse identification.
Future studies will classify greenhouses as either small arches, plastic greenhouse, glass greenhouse, and agricultural mulches. The weather in the study area is cloudy and rainy all year round. As the use of greenhouses is closely related to temperature, there is obvious seasonality in the use of greenhouses in the area, and the extraction of seasonal greenhouses has yet to be achieved. These challenges will affect the recognition results of the greenhouse to a certain extent, especially in large-scale complex terrain. In future research on greenhouse identification, further consideration can be given to combining current remote-sensing images with higher temporal and spatial resolution, applying cutting-edge technologies such as machine learning, deep learning and big data, and selecting auxiliary variables closely related to the greenhouse. In addition, deeper consideration of the geophysical parameters that affect the greenhouse and adding it to the identification parameters of the greenhouse will also be an effective way to further improve the accuracy of the identification of the greenhouse in the future. With these considerations, more scientific and effective greenhouse identification parameters and algorithms can be constructed, and greenhouse information with higher temporal and spatial resolution (such as greenhouse sub-categories, seasonal greenhouses, etc.) can be obtained. Rapid remote-sensing mapping of greenhouses with high temporal and spatial resolution under complex terrain provides scientific decision-making basis for regional agricultural production, agricultural structure adjustment, plastic pollution control, and formulation of relevant guiding policies for greenhouse use by local governments.
5. Conclusions
This research selects feature parameters from three aspects of spectral features, texture features, and terrain features based on the Google Earth Engine cloud platform. By comparing with the five classification results, the classification algorithm with higher accuracy is selected to construct an integrated learning classification algorithm for greenhouse identification, and then rapid remote-sensing mapping of greenhouses is achieved. The main conclusions are as follows:
- (1)
- The CART, SVM, and randomForest with higher accuracy are selected to build an integrated classification algorithm of greenhouse identification. The accuracy of the integrated classification algorithm is higher than any single classification algorithm.
- (2)
- The greenhouses have significant spatial differentiation characteristics. The most widely distributed greenhouses are mainly concentrated in developed agricultural areas, and greenhouses have obvious spatial agglomeration characteristics. The hot spots are mainly concentrated in the east and north of the study area.
- (3)
- Different combinations of spectral, texture and terrain features have a greater impact on the extraction of regional greenhouses. Among them, the extraction accuracy of greenhouses under the combination of spectral, texture and terrain features is the highest. Spectral features are the key factors of greenhouse interpretation.
- (4)
- The Google Earth Engine cloud platform provides a large amount of various open source remote-sensing data, and comes with various classification algorithms. An integrated classifier for regional greenhouse recognition was constructed, which can realize efficient remote-sensing mapping of large-scale greenhouses in complex terrain.
Author Contributions
Data curation, J.L. (Jinhuang Lin), J.R., J.L. (Jingping Liu) and X.L.; Funding acquisition, X.J.; Supervision, X.J. and Y.Z.; Writing–original draft, J.L. (Jinhuang Lin), J.L. (Jingping Liu), X.L. and J.R.; Writing-review and editing, J.L. (Jinhuang Lin), X.J. All authors have read and agreed to the published version of the manuscript.
Funding
This research was supported by the Program of National Natural Science Foundation of China (Grant Nos. 41971234, 41971235 and 41901231) and Nanjing University Innovation and Creative Program for PhD Candidate (Grant No. CXYJ21-45).
Institutional Review Board Statement
Not applicable.
Informed Consent Statement
Not applicable.
Data Availability Statement
All relevant data are within the manuscript.
Acknowledgments
We gratefully acknowledge financial supports from the Program of National Natural Science Foundation of China and the Nanjing University Innovation and Creative Program for Ph.D. Candidates. The authors also extend great gratitude to the anonymous reviewers and editors for their help.
Conflicts of Interest
The authors declare no conflict of interest.
References
- Chen, Z.; Wang, L.; Wu, W.; Jiang, Z.; Li, H. Monitoring plastic-mulched farmland by Landsat-8 OLI imagery using spectral and textural features. Remote Sens. 2016, 8, 353. [Google Scholar]
- Briassoulis, D.; Dougka, G.; Dimakogianni, D.; Vayas, I. Analysis of the collapse of a greenhouse with vaulted roof. Biosyst. Eng. 2016, 151, 495–509. [Google Scholar] [CrossRef]
- Picuno, P.; Tortora, A.; Capobianco, R.L. Analysis of plasticulture landscapes in Southern Italy through remote sensing and solid modelling techniques. Landsc. Urban Plan. 2011, 100, 45–56. [Google Scholar] [CrossRef]
- Levin, N.; Lugassi, R.; Ramon, U.; Braun, O.; Ben-Dor, E. Remote sensing as a tool for monitoring plasticulture in agricultural landscapes. Int. J. Remote Sens. 2007, 28, 183–202. [Google Scholar] [CrossRef]
- Picuno, P.; Sica, C.; Laviano, R.; Dimitrijevic’c, A.; Scarascia-Mugnozza, G. Experimental tests and technical characteristics of regenerated films from agricultural plastics. Polym. Degrad. Stab. 2012, 97, 1654–1661. [Google Scholar] [CrossRef]
- National Bureau Statistics. Bulletin of Main Data of the Third National Agricultural Census. 2017. Available online: http://www.stats.gov.cn/tjsj/tjgb/nypcgb/qgnypcgb/201712/t20171215_1563539.html (accessed on 15 December 2017).
- Aguilar, M.; Vallario, A.; Aguilar, F.; Lorca, A.; Parente, C. Object-based greenhouse horticultural crop identification from multi-temporal satellite imagery: A case study in almeria, spain. Remote Sens. 2015, 7, 7378–7401. [Google Scholar] [CrossRef] [Green Version]
- Lanorte, A.; De Santis, F.; Nolè, G.; Blanco, I.; Loisi, R.V.; Schettini, E.; Vox, G. Agricultural plastic waste spatial estimation by Landsat 8 satellite images. Comput. Electron. Agric. 2017, 141, 35–45. [Google Scholar] [CrossRef]
- Yang, D.; Chen, J.; Zhou, Y.; Chen, X.; Chen, X.; Cao, X. Mapping plastic greenhouse with medium spatial resolution satellite data: Development of a new spectral index. ISPRS J. Photogramm. Remote Sens. 2017, 128, 47–60. [Google Scholar] [CrossRef]
- Wu, J.Y.; Liu, X.L.; Bo, Y.C.; Shi, Z.T.; Fu, Z. Plastic greenhouse recognition based on GF-2 data and multi-texture features. Trans. CSAE 2019, 35, 173–183. [Google Scholar]
- Aguilar, M.A.; Bianconi, F.; Aguilar, F.J.; Fernández, I. Object-based greenhouse classification from GeoEye-1 and WorldView-2 stereo imagery. Remote Sens. 2014, 6, 3554–3582. [Google Scholar] [CrossRef] [Green Version]
- Aguilar, M.Á.; Jiménez-Lao, R.; Nemmaoui, A.; Aguilar, F.J.; Koc-San, D.; Tarantino, E.; Chourak, M. Evaluation of the Consistency of Simultaneously Acquired Sentinel-2 and Landsat 8 Imagery on Plastic Covered Greenhouses. Remote Sens. 2020, 12, 2015. [Google Scholar] [CrossRef]
- Koc-San, D. Evaluation of different classifification techniques for the detection of glass and plastic greenhouses from WorldView-2 satellite imagery. J. Appl. Remote Sens. 2013, 7, 073553. [Google Scholar] [CrossRef]
- Shi, L.; Huang, X.; Zhong, T.; Taubenbck, H. Mapping Plastic Greenhouses Using Spectral Metrics Derived from GaoFen-2 Satellite Data. IEEE J. Sel. Top. Appl. Earth Obs. Remote Sens. 2020, 13, 49–59. [Google Scholar] [CrossRef]
- Agüera, F.; Aguilar, F.J.; Aguilar, M.A. Using texture analysis to improve perpixel classification of very high resolution images for mapping plastic greenhouses. ISPRS J. Photogramm. Remote Sens. 2008, 63, 635–646. [Google Scholar] [CrossRef]
- Wu, C.F.; Deng, J.S.; Wang, K.; Ma, L.G.; Tahmassebi, A.R. Object-based classification approach for greenhouse mapping using Landsat-8 imagery. Int. J. Agric. Biol. Eng. 2016, 9, 79–88. [Google Scholar]
- Chen, J.; Shen, R.P.; Li, B.L.; Di, P.C.; Yan, X.Y.; Zhou, M.Y.; Wang, S.W. The development of plastic greenhouse index based on Logistic regression analysis. Remote Sens. Land Resour. 2019, 31, 43–50. [Google Scholar]
- Shelestov, A.; Lavreniuk, M.; Kussul, N.; Novikov, A.; Skakun, S. Exploring google earth engine platform for big data processing: Classification of multi-temporal satellite imagery for cop mapping. Front. Earth Sci. 2017, 5, 1–10. [Google Scholar] [CrossRef] [Green Version]
- Gorelick, N.; Hancher, M.; Dixon, M.; Ilyushchenko, S.; Thau, D.; Moore, R. Google earth engine: Planetary-scale geospatial analysis for everyone. Remote Sens. Environ. 2017, 202, 18–27. [Google Scholar] [CrossRef]
- Dong, J.W.; Xiao, X.M.; Menarguez, M.A.; Zhang, G.L.; Qin, Y.W.; Thau, D.; Biradar, C.; Berrien, M. Mapping paddy rice planting area in northeastern Asia with Landsat 8 images, phenology-based algorithm and google earth engine. Remote Sens. Environ. 2016, 185, 142–154. [Google Scholar] [CrossRef] [Green Version]
- Xiong, J.; Thenkabail, P.S.; Gumma, M.K.; Teluguntla, P.; Poehnelt, J.; Congalton, R.G.; Yadav, K.; Thau, D. Automated cropland mapping of continental Africa using google earth engine cloud computing. ISPRS J. Photogramm. Remote Sens. 2017, 126, 225–244. [Google Scholar] [CrossRef] [Green Version]
- Aguilar, R.; Zurita-Milla, R.; Izquierdo-Verdiguier, E.; de By, R.A. A cloud-based multi-temporal ensemble classifier to map smallholder farming systems. Remote Sens. 2018, 10, 729. [Google Scholar] [CrossRef] [Green Version]
- He, Z.X.; Zhang, M.; Wu, B.F.; Xing, Q. Extraction of summer crop in Jiangsu based on Google Earth Engine. J. Geo-Inf. Sci. 2019, 21, 752–766. [Google Scholar]
- Jia, K.; Li, Q.Z. Review of features selection in crop classification using remote sensing data. Resour. Sci. 2013, 35, 2507–2516. [Google Scholar]
- Liu, G.; Zhang, L.; Zhang, Q.; Musyimi, Z.; Jiang, Q. Spatio-temporal dynamics of wetland landscape patterns based on remote sensing in yellow river delta, China. Wetlands 2014, 34, 787–801. [Google Scholar] [CrossRef]
- Pei, H.; Sun, T.J.; Wang, X.Y. Object-oriented land use/cover classification based on texture features of Landsat 8 OLI image. Trans. Chin. Soc. Agric. Eng. 2018, 34, 248–255. [Google Scholar]
- Haralick, R.M.; Shanmugam, K.; Dinstein, I. Textural features for image classification. IEEE Trans. Syst. Man Cybern. 1973, 3, 610–621. [Google Scholar] [CrossRef] [Green Version]
- Zhang, B. Texture feature extraction analysis of remote sensing image based on gray level co-occurrence matrix. Cult. Geogr. 2017, 22, 190–200. [Google Scholar]
- Breiman, L.; Friedman, J.H.; Olshen, R. Classification and regression trees. Encycl. Ecol. 1984, 40, 582–588. [Google Scholar]
- Alimjan, G.; Sun, T.; Liang, Y.; Jumahun, H.; Guan, Y. A new technique for remote sensing image classification based on combinatorial algorithm of svm and knn. Int. J. Pattern Recognit. Artif. Intell. 2018, 32, 1–23. [Google Scholar] [CrossRef]
- Breiman, L. Random forests. Mach. Learn. 2001, 45, 5–32. [Google Scholar] [CrossRef] [Green Version]
- Feng, Q.; Liu, J.; Gong, J. Uav remote sensing for urban vegetation mapping using random forest and texture analysis. Remote Sens. 2015, 7, 1074–1094. [Google Scholar] [CrossRef] [Green Version]
- Bruzzone, L. An approach to feature selection and classification of remote sensing images based on the bayes rule for minimum cost. IEEE Trans. Geosci. Remote Sens. 2000, 38, 429–438. [Google Scholar] [CrossRef]
- Chen, S.J.; Li, G.L.; Zhang, W.; Cao, W. Land use classification in coal mining area using remote sensing images based on multiple classifier combination. J. China Univ. Min. Technol. 2011, 40, 273–278. [Google Scholar]
- Huang, D.; Xu, S.; Sun, J.; Liang, S.; Wang, Z. Accuracy assessment model for classification result of remote sensing image based on spatial sampling. J. Appl. Remote Sens. 2017, 11, 1–13. [Google Scholar] [CrossRef] [Green Version]
- Zhu, D.H.; Liu, Y.M.; Feng, Q.L.; Ou, C.; Guo, H.; Liu, J.T. Spatial-temporal dynamic changes of agricultural greenhouses in Shandong Province in recent 30 years based on Google Earth Engine. Trans. Chin. Soc. Agric. Mach. 2020, 51, 168–175. [Google Scholar]
- Zhao, L.; Ren, H.Y.; Yang, L.S. Retrievalof Agriculture Greenhouse based on GF-2 Remote Sensing Images. Remote Sens. Technol. Appl. 2019, 34, 677–684. [Google Scholar]
- Aguilar, M.; Nemmaoui, A.; Novelli, A.; Aguilar, F.; García Lorca, A. Object-based greenhouse mapping using very high resolution satellite data and Landsat 8 time series. Remote Sens. 2016, 8, 513. [Google Scholar] [CrossRef] [Green Version]
Figure 1.
Geographical location of the study area.

Figure 2.
Technical flow chart.

Figure 3.
Spatial distribution of greenhouses in Jiangsu Province.

Figure 4.
Distribution of greenhouses and hot spots in the county.

Figure 5.
The area of greenhouses by city and its proportion in the area of the city.


Table 1.
Sample types, data and meaning.
| Type Code | Land Class Name | Number of Samples | Features | Index Connotation |
|---|---|---|---|---|
| 1 | Construction land | 2307 |  | It is the main carrier of human urban construction, and is generally divided into urban construction land, rural residential areas and other construction land. |
| 2 | Water | 2277 |  | Refers to land used for natural terrestrial waters and water conservancy facilities, mainly including oceans, rivers, lakes, tidal flats, reservoirs and pits. |
| 3 | Forest land | 2554 |  | Forestry land with a canopy density of more than 0.4, which mainly includes arbor forest land, sparse forest land, shrub forest land, etc. |
| 4 | Farmland | 2408 |  | Land used for agricultural production, including paddy fields, dry lands, irrigated lands, garden lands, etc. |
| 5 | Greenhouse | 3290 |  | Agricultural facilities that provide a good growth environment for crop growth. |
| Total | 12836 |
Table 2.
Feature selection of greenhouse identification and its connotation.
| Feature Selection | Index Selection | Index Connotation | Resolution |
|---|---|---|---|
| Spectral feature | Band 1 | Coastal | 30 m |
| Band 2 | Blue | 30 m | |
| Band 3 | Green | 30 m | |
| Band 4 | Red | 30 m | |
| Band 5 | Near Infrared (NIR) | 30 m | |
| Band 6 | Short Wave Infrared 1 (SWIR 1) | 30 m | |
| Band 7 | Short Wave Infrared 2 (SWIR 2) | 30 m | |
| NDVI | Normalized Difference Vegetation Index | 30 m | |
| NDBI | Normalized Difference Build-up Index | 30 m | |
| NDWI | Normalized Difference Water Index | 30 m | |
| Texture feature | B2_asm | Angular Second Moment | 30 m |
| B2_contrast | Contrast | 30 m | |
| B2_corr | Correlation | 30 m | |
| B2_var | Variance | 30 m | |
| B2_idm | Inverse Difference Moment | 30 m | |
| B2_ent | Entropy | 30 m | |
| Terrain feature | Slope | Degree of steepness and slowness of surface unit | 30 m |
| Elevation | Altitude, distance from sea level | 30 m |
Table 3.
Producer’s accuracy (PA) and user’s accuracy (UA) of different classification algorithms.
| Land Use Type | CART | randomForest | gmoMaxEnt | SVM | naiveBayes | |||||
|---|---|---|---|---|---|---|---|---|---|---|
| UA | PA | UA | PA | UA | PA | UA | PA | UA | PA | |
| Construction land | 0.88 | 0.80 | 0.80 | 0.80 | 0.77 | 0.83 | 0.56 | 0.34 | 0.46 | 0.61 |
| Water | 0.96 | 0.97 | 0.96 | 0.95 | 0.97 | 0.96 | 0.43 | 0.97 | 0.89 | 0.99 |
| Forest land | 0.94 | 0.95 | 0.91 | 0.93 | 0.91 | 0.92 | 0.95 | 0.98 | 0.19 | 0.50 |
| Farmland | 0.79 | 0.89 | 0.78 | 0.81 | 0.70 | 0.88 | 0.94 | 0.48 | 0.84 | 0.36 |
| Greenhouse | 0.92 | 0.88 | 0.86 | 0.83 | 0.89 | 0.73 | 0.08 | 0.41 | 0.31 | 0.43 |
Table 4.
Confusion matrix of integrated learning algorithm.
| Confusion Matrix | Actual Value | ||||||
|---|---|---|---|---|---|---|---|
| Construction Land | Water | Forest Land | Farmland | Greenhouse | User’s Accuracy | ||
| Predictive Value | Construction land | 593 | 4 | 16 | 64 | 33 | 0.84 |
| Water | 3 | 659 | 5 | 11 | 3 | 0.97 | |
| Forest land | 8 | 5 | 758 | 12 | 2 | 0.97 | |
| Farmland | 17 | 3 | 9 | 624 | 18 | 0.93 | |
| Greenhouse | 71 | 5 | 13 | 38 | 927 | 0.88 | |
| Producer’s accuracy | 0.86 | 0.97 | 0.95 | 0.83 | 0.94 | ||
Table 5.
Classification accuracy under different feature combinations.
| Evaluation of Accuracy | Feature Combinations | ||||||
|---|---|---|---|---|---|---|---|
| Spectral | Texture | Terrain | Spectral + Texture | Spectral + Terrain | Texture + Terrain | Spectral + Texture + Terrain | |
| Overall accuracy | 0.87 | 0.42 | 0.60 | 0.88 | 0.89 | 0.69 | 0.90 |
| Kappa coefficient | 0.84 | 0.27 | 0.49 | 0.85 | 0.86 | 0.61 | 0.87 |
Publisher’s Note: MDPI stays neutral with regard to jurisdictional claims in published maps and institutional affiliations. |
© 2021 by the authors. Licensee MDPI, Basel, Switzerland. This article is an open access article distributed under the terms and conditions of the Creative Commons Attribution (CC BY) license (http://creativecommons.org/licenses/by/4.0/).
Share and Cite
MDPI and ACS Style
Lin, J.; Jin, X.; Ren, J.; Liu, J.; Liang, X.; Zhou, Y. Rapid Mapping of Large-Scale Greenhouse Based on Integrated Learning Algorithm and Google Earth Engine. Remote Sens. 2021, 13, 1245. https://doi.org/10.3390/rs13071245
AMA Style
Lin J, Jin X, Ren J, Liu J, Liang X, Zhou Y. Rapid Mapping of Large-Scale Greenhouse Based on Integrated Learning Algorithm and Google Earth Engine. Remote Sensing. 2021; 13(7):1245. https://doi.org/10.3390/rs13071245
Chicago/Turabian StyleLin, Jinhuang, Xiaobin Jin, Jie Ren, Jingping Liu, Xinyuan Liang, and Yinkang Zhou. 2021. "Rapid Mapping of Large-Scale Greenhouse Based on Integrated Learning Algorithm and Google Earth Engine" Remote Sensing 13, no. 7: 1245. https://doi.org/10.3390/rs13071245
Note that from the first issue of 2016, this journal uses article numbers instead of page numbers. See further details here.