
Modeling and Simulation of Very High Spatial Resolution UXOs and Landmines in a Hyperspectral Scene for UAV Survey


1
Department of IT and Computer Sciences, Zagreb University of Applied Sciences, 10000 Zagreb, Croatia
2
Scientific Council HCR—Center for Testing, Development, and Training, 10000 Zagreb, Croatia
*
Author to whom correspondence should be addressed.
Remote Sens. 2021, 13(5), 837; https://doi.org/10.3390/rs13050837
Submission received: 10 January 2021
/
Revised: 11 February 2021
/
Accepted: 19 February 2021
/
Published: 24 February 2021
(This article belongs to the Special Issue Multi-Sensor Systems and Data Fusion in Remote Sensing)
Abstract
:This paper presents methods for the modeling and simulation of explosive target placement in terrain spectral images (i.e., real hyperspectral 90-channel VNIR data), considering unexploded ordnances, landmines, and improvised explosive devices. The models used for landmine detection operate at sub-pixel levels. The presented research uses very fine spatial resolutions, 0.945 × 0.945 mm for targets and 1.868 × 1.868 cm for the scene, where the number of target pixels ranges from 52 to 116. While previous research has used the mean spectral value of the target, it is omitted in this paper. The model considers the probability of detection and its confidence intervals, which are derived and used in the analysis of the considered explosive targets. The detection results are better when decreased target endmembers are used to match the scene resolution, rather than using endmembers at the full resolution of the target. Unmanned aerial vehicles, as carriers of snapshot hyperspectral cameras, enable flexible target resolution selection and good area coverage.
1. Introduction
1.1. Motivation
“Despite twenty-first-century technological advances by Western militaries for demining and the removal of improvised explosive devices, humanitarian demining relies mostly on mid-twentieth-century technology” [1].
Although we share this opinion—at least, regarding aerial survey technologies—we attempt to contribute to advancement by supporting the deployment of hyperspectral surveys by civilian users exposed to explosive device threats. We consider the following explosive devices: unexploded ordnances (UXOs), landmines (LMs), cluster munition (CM), improvised explosive devices (IEDs), homemade explosive (HME) devices, and explosive remnants of war (ERW). The civilian users that we consider are, among others: Single or group ground vehicles of humanitarian demining organizations, traveling from camp to the working area and returning, logistics convoys, medical, humanitarian aid, Red Cross, reconstruction, security forces, civilian VIP travelers, and others. The level of incidents and casualties for civilian vehicles and convoys dominate, when compared to military or security forces [2]. The focus of the technology reviewed and used in this work mostly considers the platforms, sensors, and software available to the civil sector.
There are several new aspects of these topics, and humanitarian mine action cannot be restricted only to the disposal of the landmines by humanitarian demining. Therefore, we briefly consider hazardous explosive threats, non-technical surveys (NTSs) [3], the technologies in use (based on the aerial survey), and advanced survey technologies under a high level of technical readiness. There are several promising sensor technologies, such as hyperspectral, non-linear junction detection (NLJD), LIDAR, longwave infrared, magnetometer, and ground-penetrating radar (GPR); however, in this article, we focus on passive hyperspectral data. This technology is specific, due to a lack of civilian (or public military) hyperspectral data regarding the considered explosive devices in a realistic and non-laboratory environment. A new positive fact is that hyperspectral imaging sensors used on unmanned aerial vehicles (UAVs) can provide pixel resolutions smaller than the explosive devices on the ground surface (very high spatial resolution), which is not practical when using aerial helicopter platforms.
We consider threats caused by several types of explosive devices: IEDs, UXOs, LMs, and ERW. Data about their spatial distribution are limited and, for IEDs, are typically classified. One possible solution is to predict the emplacement of explosive devices by simulation. Generally, several aspects should be considered in simulations: (1) terrain features, (2) explosive devices, (3) objects, and (4) methods of detection of explosive devices from data collected by sensors on remotely piloted aircraft systems.
Our research aims to derive modeling methods and to simulate explosive targets in a hyperspectral scene, through the use of real hyperspectral data of the considered types of explosive devices.
1.2. Possible Terrain Case
An exciting and valuable example of the situational and spatial behavior of IEDs has been presented in [4] and in a color video acquired from an unmanned aerial vehicle (UAV) [5]. The following photograph (Figure 1) shows a typical large-scale terrain and explosive targets in an arid region in Iraq. It is evident that this explosive hazard scene has a lack of vegetation, and the explosive devices are on the ground surface. The targets in such situations are “ideal” for hyperspectral survey and detection by UAV.
Besides the need for detection and mapping of explosive devices, there exists needs and demands for the non-technical survey (NTS) of larger areas contaminated by various explosive objects. When one considers such areas for NTS, the most critical function of a survey system is the endurance (autonomy) of the UAV. The explosive hazard situation in many afflicted countries is similar to the above description, where the existing differences are mainly in the IED technique and application.
The United Nations peacekeeping forces are exposed to explosive threats; therefore, they have developed guidelines on IED threat mitigation [6]. The European Defense Agency realized the IED Detection Program from 2016 to 2019, in order to improve and to field-test IED detection capabilities to define future Route Clearance and Attack the Network capabilities [7].
1.3. The Civilian Aerial Survey Technologies for Explosive Threats
We have previously actively participated and contributed to the research, development, and operational deployment of a multisensory and multispectral non-technical survey (NTS) [3], mainly based on the detection of secondary indicators of mine presence (IMP) or indicators of the absence (IMA) of landmines in minefields [8,9].
The IMP and IMA depend on the situation, war history, terrain, climate, and vegetation cover, and are specific for each set of mentioned influencing factors. IMP and IMA have been identified in Croatia, Bosnia, and Herzegovina, [9]; similar IMP and IMA could be expected in Ukraine. However, for countries in the Near East (e.g., Iraq, Afghanistan, and Syria) and North Africa (e.g., Libya), the IMP and IMA will be significantly different. Due to a lack of vegetation in the mentioned countries, there exist chances for the direct detection of targets—that is, the explosive devices (UXO, LM, IED, CM, ERW)—on the ground surface by passive electro-optical sensors (see example from Iraq, Figure 1). With active sensors, these targets also can be detected in the soil.
The first UAV for humanitarian mine action appeared in the EU project ARC [8]. In the last 5 to 10 years, the application of UAVs with visible color sensors for humanitarian mine action has increased [4,5,9,10,11,12]. The statement made in Use of Aerial Imagery in Urban Survey & Use of UAVs in Mine Action—Lessons Learned from Six Countries, in simple words, generalizes the experience gained since 2019 regarding UAVs with advanced sensors:
“No export restrictions. Platforms as small as possible. We want to operate equipment ourselves, not rely on external personnel. In the short term, detection capabilities are more important than the interface. Need to see real evidence of value before committing to field trials. Detection is only one stage of the clearance process. The combination of sensors and platforms must offer some advantage in terms of reduced false alarms or detection ability, not just the speed of coverage. Vegetation cover will be a major limiting factor in many places usually we cannot remove this in advance because of safety, cost, or environmental damage. The abilities of the sensor/data processing are what matters. Possible sensors: Thermal IR, Hyperspectral, Magnetometers?”[11].
Three essential facts have enabled the stepwise increase in survey efficiency by UAV: (A) The UAV industry (e.g., DJI) has produced very advanced systems which enable computer planning and automated airborne acquisition missions with several sensors. (B) The sensors industry has provided powerful devices matched to UAVs. (C) The software industry has provided tools for processing recordings collected by UAVs, producing the highest quality outcomes. Yet, only color visible cameras have been used in civilian humanitarian domain operations (as of May 2020). The (A), (B), and (C) changes have been finalized in the last several years; now, the average trained deminer-surveyor can use an UAV for their survey tasks, including preparing and planning field missions, pre-processing data into images, and processing these images into valuable and high-quality products for humanitarian mine action, in a short time. There has been an excellent example of the application of the UAV-based survey technology at the level of an entire country [12].
One exciting and challenging possibility is to detect buried explosive devices through spectral changes and derived indicators of the soil surface, as well as plant spectral changes, if exposed to the influence of landmines and explosives. Even if not applicable to arid surfaces, the hyperspectral assessment of plant spectral stress due to landmines and explosives has given promising initial results. Several research projects have been based on this assumption; one of the first was in 1997 [13]. In this project, a hyperspectral imager, named “casi”, was used for the detection of buried landmines and blocks of explosive, reporting the probability of detection (in the range from 55% to 94%) and a false alarm rate (from 0.17 m−2 to 0.52 m−2). Another research direction was to detect the difference of spectra of plants inside of a minefield, compared to the spectra of plants outside the minefield; that is, in areas that were clean of explosive and agricultural fertilizers. In [14,15,16], airplane platforms have been used, whereas [17] used different hyperspectral sensors onboard a UAV, helicopter, and ground-based vehicle [18]. This research direction considers changes in vegetation (plants, bushes, and trees) spectra after exposure to contamination with explosives [19,20]. Although the described domain is impressive, our feeling is that its operational potential is not high enough yet.
1.4. The Direct Detection of Explosive Targets and Detection of Their Secondary Indicators
Current UAV-based operational surveys for the detection of UXO, LM, IED, CM, and ERW only use (visible) color sensors [4,10,11]. Here, we comment on several other sensor technologies in the development or testing phase; although, we thoroughly only consider hyperspectral technology in later sections.
Longwave infrared (LWIR) or thermal infrared (TIR) sensors are now available as dual sensor units, together with a visible color camera (produced by FLIR and DJI) for application onboard UAVs. The dual-sensor delivers TIR and visible color images, either separated or overlapped. TIR sensors are also now available in a version which is optimized for UAV surveys [21,22]. One interesting solution for a long endurance survey is a tethered UAV [23].
For the active detection, via UAV, of targets in the soil or behind obstacles, non-linear junction detectors or harmonic radar (NLJD) can be used [24,25]. A ground-penetrating radar is under development for the detection of buried targets (GPR) from UAV [26,27,28,29,30].
The magnetometer on an UAV enables the automatic survey and detection of ferromagnetic UXO targets [31,32].
In the following chapters, we present the research results regarding the hyperspectral data of explosive targets. The first possible reference for the hyperspectral detection of landmines is from 1997 [13]. According to the best of our knowledge, there are no available/accessible hyperspectral data of explosive targets (UXO, LM, IED, CM, ERW) collected by UAV or, at least, collected by ground-based hyperspectral sensors in the considered afflicted countries. The exceptions are the cases where a limited amount of hyperspectral data of UXO, LM, and minefields were collected in the European environment, in minefields and exploded ammunition depots, by helicopter-, UAV-, and ground-based acquisition systems [9,17,18,33]. Some data collected by fixed-wing plane are available for Africa [14,15] and in Germany [16]. Ground-based hyperspectral data collection of landmines has also been carried out in Lebanon [34,35,36].
1.5. Hyperspectral Sensors and Platforms
1.5.1. Sensors
For this research, we used two hyperspectral imaging sensors. The first was a Specim ImSpector V9 (see Figure 2), a hyperspectral prism-grating-prism imaging spectrograph [37] which has a spectral range of 430–900 nm, a spectral resolution of 7 nm, sampling 5 nm, and 95 channels (product specifications). The second was a Cubert UHD-185 snapshot camera (see Figure 3), with a spectral range of 450–950 nm, spectral resolution of 8 nm, 125 channels, sampling at 4 nm, and spatial resolution of 1000 × 1000 pixels for panchromatic or 50 × 50 pixels for spectral (product specifications). The third sensor was a point measuring FieldSpec3 Spectroradiometer, from Analytical Spectral Devices, Inc., Boulder, CO, USA (ASD), ranging from 350 to 2500 nm, resolution from 3 to 10 nm, and 512 channels (product specifications); which was used for point measurements of targets and materials
1.5.2. Ground-Based and Aerial Platforms
We have previously used the hyperspectral line scanner V9 to study minefields, landmines, and unexploded ordnances, initially through a ground-based mechanical scanner on a gantry [9,18,38]. We have used the V9 on several aerial platforms, such as the helicopters Mi-8c [39] and Bell-206. Note that the V9 was also used onboard the helicopter Mi-8 for detection of ship-sourced oil pollution on the sea [40].
Since 2012, we have applied the true spectral scanner V9 on UAVs, along with the pan-sharpening snapshot imaging scanner UHD-185 [17,41]. The helicopter Mi-8 platform was skipped in this research, as the spatial resolution was too low for the sake of target detection (due to blurring). Besides this primary purpose, the same mechanical scanner with V9 has been applied for archeological research [42] and in vineyards [43].
1.5.3. Portable Carry-on and Handheld Hyperspectral Cameras
Portable carry-on (or handheld) hyperspectral cameras are novel technological devices, one appearing around 2015–2018 and subsequently disappearing (Headwall Hyperspec® SNAPSHOT VNIR, Headwall Photonics, Inc., Bolton, MA, USA), while the second appeared in 2020 (Specim IQ). The Hyperspec® SNAPSHOT VNIR Sensor can quickly render a high-resolution hyperspectral scene at distances of 1.5 km in the VNIR spectral range (380–1000 nm; Headwall 2014). This makes it an excellent sensor for military hyperspectral reconnaissance. In 2017, the authors asked Headwall to offer this sensor; however, the answer was that it is not in production.
Specim IQ is a portable carry-on hyperspectral camera that contains the features needed for hyperspectral data capturing, data processing, and visualization of results. It has a wavelength band of 400–1000 nm, 204 spectral bands, an image resolution of 512 × 512 pixels, spectral resolution of 7 nm, and 12-bit data output. A full field of view (FOV) is 31 × 31 degrees; at 1 m, it covers 0.55 × 0.55 m. It is equipped with WiFi, GPS, and a 32 GB SD memory card. This camera can serve as an excellent tool for collecting hyperspectral data about explosive targets, landmines, unexploded ordnances, cluster munitions, improvised explosive devices, and neighborhood terrain.
2. Materials and Methods
After the war in 1991–1995, Croatia had become contaminated with minefields, scattered landmines, and unexploded ordnances, cluster munitions, and other explosive remnants of war. When we proposed to apply airborne multi-sensor minefield detection in 2001 [44], the reaction was prompt and productive [45,46]. Our interest in the detection of unexploded ordnances (UXOs) was initiated after an unplanned explosion in 2011 at the ammunition depot at Padjene, Croatia, and the survey of UXOs was included in the project TIRAMISU [18,38,41]. Fifteen different kinds of scattered UXO samples have been measured by V9 in imaging mode. Hyperspectral cubes have been produced and Johnson parameters calculated for each type [47]. The UXO samples appear in different conditions (e.g., intact, damaged, burned, covered by rust, covered by soil, original paint), orientation, and on similar soil types. This set of true hyperspectral cubes is our source for further research on UXOs. While radiance data were collected, we converted them into reflectance using the atmospheric correction QUAC (Quick Atmospheric Correction, ENVI).
We measured several other UXOs with the imaging hyperspectral sensor V9; this is also a set of true hyperspectral data, Figure 4, Figure 5, Figure 6, Figure 7, Figure 8 and Figure 9. The mean values of measured reflectance of UXOs are shown at Figure 10. The conditions of measuring were controlled, Figure 11 and Figure 12. Several landmines and one plastic object were measured using the point measuring spectroradiometer ASD. This data set provides only one value of reflectance for each wavelength, Figure 13, Figure 14, Figure 15, Figure 16 and Figure 17. Both sets are used in the current article.
The main obstacle was to provide hyperspectral cubes of the terrain ground surface, which should have pixel area smaller than the area of the considered UXO and landmines. The solution could be to use hyperspectral imaging of the minefields, which has been done using the V9 and UHD-185, onboard a Bell-206 helicopter or UAVs [17]. In the current article, we use only the terrain ground surface hyperspectral cubes collected by UHD-185 onboard a UAV.
2.1. The True Hyperspectral Data Cubes of UXO on the Ground
UXO samples have been measured by V9 in imaging mode, using the first, small version of the mechanic gantry [18]. The geometry of the acquisition mode is presented in Figure 4b.
The spectral radiance was measured, with vertical length A = 1.1 m, number of pixels M = 1164, and ground resolving distance of 0.945 mm. The horizontal length between Spectralon and the white-black-white panel is B = 2.0 m, the number of pixels is N = 556, and the ground resolving distance is 3.597 mm. The next step was geometric transformation and interpolation. For the interpolation, we tested the nearest neighbor, bilinear, and cubic methods and, as a result, decided to apply the nearest-neighbor method. The mean reflectance spectra values were below 0.280; see Figure 10.
The HR400 Spectrometer was used for irradiance measurements, both relative and absolute μW/(m2nm) to the Sun in the periods when the hyperspectral missions were carried out; see Figure 11 and Figure 12. Its role was to understand the dynamics of the absolute irradiance and to select times which are suitable for hyperspectral measurements.
2.2. Landmines and Plastic Objects, Whose Spectra Are Provided by Point-Like Measurements with ASD
The figures in the following section represent some of the targets that were measured by Point-Like Measurements with ASD. These sensor measures only one position where it is pointed. If we sample 10 or 15 points on target, they do not provide as much information variability as imaging sensor, covering entire target. When we created simulated targets by using ASD, we had available couple of points and simulation was not as realistic as from imaging sensor.
Figure 13.
TMA-4 landmine.

Figure 14.
VTMRP-6 landmine.

Figure 15.
PMR-2A landmine.

Figure 16.
Plastic bottle.

Figure 17.
The reflectance of PMR-2A, TMA-4, and VTMRP-6 landmines, as well as that of a plastic bottle, measured by a point measuring unit ASD.
Figure 17.
The reflectance of PMR-2A, TMA-4, and VTMRP-6 landmines, as well as that of a plastic bottle, measured by a point measuring unit ASD.

2.3. Hyperspectral Cubes of the Terrain Acquired by UHD-185
2.4. Simulation of the Spatial Distribution of the Explosive Objects
Data of the spatial distribution of threat-causing explosive objects are limited and, for IEDs, are classified. One possible solution is predicting their distribution by simulation, using the public sources considered in Section 1.3; we consider this in the current section. Once the spatial distribution is solved, the problem of how to implant the spectral data of targets in the hyperspectral data of terrain arises, which is considered in Section 2.5.
One older minefield simulation system [48] considers and models factors of airborne detection, including the type of background, time of day, swath width, number of steps, overlapping, minefield scenarios, false alarms, and landmine statistics.
Predicting the distribution of improvised explosive devices, in [49], had the purpose of examining how IED placement can be predicted using related historical data processed by artificial neural networks. Monte Carlo simulation and a logic-based examination of publicly available IED sources were performed, in order to simulate a population resembling the real world in relevant respects. Two cases were analyzed: flat terrain features and objects, and mountainous terrain features and objects [49].
The modeling and simulation of the detection of landmines and improvised explosive devices with multiple automatic target detection loops, as presented in [50], provided an example of a military approaches. In [51], the authors stated that a fully automatic target recognition process still fails to satisfy the operational requirements of minefield detection. This necessitates human interaction for verification and decision-making. It has been found that the operator would not be able to handle the number of segments to process effectively when the percentage of minefield segments in ground truth is more than 1% and when the false alarm rate for non-minefield segments is more than 1.5%.
From several promising detection technologies, we only consider passive hyperspectral data in this study. The crucial factor is the lack of civilian (or public military) data regarding explosive devices in a realistic, non-laboratory environment. The hyperspectral imaging sensors used on UAVs can provide pixels smaller than explosive devices on the ground surface, which simplifies the processing of collected hyperspectral data. The positive consequence is that the problems of target detection with sub-pixel dimensions are avoided. Two groups of hyperspectral target detection methods use only spectral information; not the size, shape, or texture of the target [52,53] (p. 066403-1). These are spectral matching detection algorithms and spectral anomaly detection algorithms. More information about both groups can be found in [54,55], and more about anomaly detection in [56], about deep learning classification in [57], and about the application of neural networks for landmine detection in [58]; we will not consider these further.
Consequently, we consider the modeling and simulation of explosive devices (targets) on a ground surface using their hyperspectral data obtained by hyperspectral measurement and their implanting in terrain hyperspectral cubes. We consider the effects of this process by assessing the outcomes of classification by the spectral angle mapping (SAM) method [59].
2.5. The Implanting Spectral Data of Explosive Targets in the Hyperspectral Scene of the Terrain
The analysis [60] by Basener et al., verified that “the utility of a hyperspectral image for target detection can be measured by synthetically implanting target spectra in the image and applying detection algorithms.” Our aim is to implant spectral data of explosive targets, which was done in the following way: We implanted the true hyperspectral data of UXOs and landmines, measured with a ground resolving distance GRDUXO = 0.945 mm, into hyperspectral scenes of terrain surface (GRDterrain = 18.68 mm), after spatial transformation and processing. Note that the ratio of the ground resolving distances, UXO/Terrain, is 0.05058 (or 5.058%). The dimensions of each UXO target are decreased and matched for implanting into pixels of the terrain hyperspectral data, such as in the example presented in Figure 21b.
All operations were done with arrays (stacks) of images having MxNxL pixels, where M = number columns, N = number of rows, and L = number of wavelengths (channels). For processing, we used the ENVI and ImageJ software; see Table 1 and Figure 22. The format of spectral data was floating point 32 bits. The extracted targets contained all real hyperspectral data obtained by measurements, while the decreased targets contained from 0.23% to 0.27% of the data only; see Table 2. The following examples were used: hyperspectral scenes 147 and 227 of terrain (Figure 18 and Figure 19; each 1000 × 1000 × 90 spectral data, 32-bit float); arrays with the same dimensions but zeroed data, named “blackboard”; and arrays of small targets (100 × 100 × 90 spectral data, 32-bit float), named AS-artillery shell, B-bullet, C-cluster munition, MM-mortar mine, UXOX-UXOX, TMA-4, VTMRP-6, PMR-2A, and Plastic bottle.
The targets can be implanted in the hyperspectral data of the terrain in one or two of the following combinations: 1. Without interaction with its neighborhood—the whole area of the target is visible to the imaging hyperspectral sensor. 2. The area of the target is partially hidden, obscured, or covered by terrain. In the following text, we use the term obscured. 3. The spectrum of a target is mixed or overlaid by spectra of the terrain surface (e.g., partially by soil, sand, gravel, or vegetation). In the following text, we use the term overlaid.
2.5.1. Spectral Angle Mapping
From several spectral matching detection algorithms, we selected the Spectral Angle Mapping (SAM) algorithm, introduced in 1993 by F.A. Kruse et al., in The Spectral Image Processing System (SIPS) Interactive Visualization and Analysis of Imaging Spectrometer Data [58]. SAM allows for mapping of the spectral similarity of image spectra ti to reference spectra ri by calculating the angle, γ, between the two spectra, treating them as vectors in a space with dimensionality equal to the number of channels (L); see Figure 23 and Equation (1).
This similarity measure is insensitive to gain factors, as the angle γ between the two vectors is invariant, concerning the lengths of the vectors. More information about SAM is available in many references (see, e.g., [56]).
The number of positive outcomes of SAM classification is a measure of detection success, which depends on the quality and quantity of spectral samples (endmembers) representing objects or materials and their areas; see Figure 24a, Table 2. The largest number of endmembers in the area belonged to Mortar mines (116; 0.040482 m2), while the smallest belonged to UXOX (52; 0.018147 m2). Figure 24a shows the mean SAM values of targets. Figure 24b shows the SAM values of 9 ASR targets obscured 25.7%. Obscured targets have larger dispersion and larger SAM angles. Figure 24c shows the SAM values of 10 ASR targets; their spectra are overlayed with 10% of terrain (scene 147). Targets overlayed with scene spectra have larger dispersion at smaller SAM angles. Similar behaviors appeared with other targets.
2.5.2. Target Simulation Options
Our research aims to develop modeling and simulation of the spectral data of explosive targets, implanting them into spectral terrain scenes for civilian applications. Several approaches were analyzed or tested and considered:
- 1.
- The true spectral data of explosive targets, measured by a hyperspectral imaging scanner, and pixels matched to pixels of terrain scene spectra.
- 2.
- The average spectral data of explosive targets measured by a point measuring spectrometer. This kind of target’s spectral data for land mines has only appeared in the literature.
- 3.
- Modeling the partial random obscuring of explosive targets on the ground surface.
- 4.
- Modeling the partial mixing spectra of the explosive targets and the background.
- 5.
- Simulation of random spectral data in the interval between the maximum and minimum of the spectral data of explosive targets, measured by a point measuring spectrometer. We tested the random generation of data using a uniform probability distribution and considered several other distributions.
In our research, we analyzed options 1, 2, 3, and 4, while 5 was the only one tested. The following conclusions were derived: The use of true spectral data of explosive targets, measured by a hyperspectral imaging scanner (case 1), and processed as described in Table 1 and Figure 22, gave reliable outcomes (Figure 25a,b). The average spectral data, (case 2) produced a high constant response (Figure 25c,d) and, so, should not be used. Histograms of spectral data comparing cases 1 and 2 (see Figure 26) provided additional evidence for this statement. Note that this kind of data has been used in several references, despite its weakness.
The explosive targets in Figure 25 show their views at 550 nm, in the grayscale and artificial color lookup table. Note that case in Figure 26b has a stable constant view, which is not realistic in the natural environment. Figure 25e,f shows the same target’s spectral data, generated by a random data generator with uniform distribution in the interval from minimum to maximum.
2.5.3. Modeling the Obscured Spectra of the Explosive Target and the Overlayed Target’s Spectra and the Spectra of Background
The general model for analysis of the effects of partially obscuring an explosive target and partially mixing its spectra with those of the neighboring terrain is [53]:
where x is the spectrum of the observed pixel, S is the spectrum of the target, V is the spectrum of the background, a ≥ 0 is the fraction of the considered pixel which is filled by the target, and b ≥ 0 is the fraction of the considered pixel filled by the neighboring terrain. If the observed pixel is filled with the target (a = 1, b = 0), it is resolved or a full-pixel target. When part of the pixel is filled with the target (a ≠ 0, b ≠ 0), it is unresolved or a sub-pixel target. Although we mainly analyzed resolved (full-pixel) targets, we tested cases where part of the explosive target was randomly obscured (see Figure 27) and cases where its spectrum was overlaid with the spectrum of the background (i.e., b > 0).
x = aS + bV,
The target and terrain (background) spectral combinations, defined by Equation (2), are indeed summations, although we often use the words “overlaid” and “mixed”. Another combination is the partial obscuring of a target area by the terrain and its spectra (see Figure 27).
The obscuring 25.7% was applied to the areas of targets (ASR, BR, CMR, MMR, UXOXR) in scene 227 (Appendix C).
The mixing (overlaying) of the spectra in terrain scene 147 (Appendix C) with the spectra of the 10 targets (ASR, BR, CMR, MMR, UXOXR) was applied with a = 1.0, and b = 0.10, such that:
x = S + 0.10 V.
2.6. Model of Target Detection
Our goal was to derive methods for modeling and simulating the explosive targets in a hyperspectral scene, using the real hyperspectral data of several types of explosive devices, where simulation should be suitable for application by civilians, which is narrower and less complex than the analysis of hyperspectral methods for target detection. Thus, we used, for the considered cases, the SAM algorithm as the detector, among several others (Cross-Correlation, Linear Unmixing, Matched Filtering). The outputs of SAM are a Spectral Angle raster, containing values of the spectral angle for each image cell, and a Class raster, in which cells are assigned to endmember classes based on the angle value set for the threshold value γ (see Figure 28).
For our analysis, we used SAM Class raster values. The computing resources of SAM are proportional to 1/γ and, so, the smaller the value of γ, the larger the computing time. Thus, we selected γ as the independent variable.
The detection of a target was modeled as a Bernoulli experiment, where the binary random variable y took a value of y = 1 (“detected”) with probability p and y = 0 (“not detected”) with probability 1−p [60]. The parameter p was specific for each treatment and depends on the influence variables characterizing that treatment.
Let POD be the probability of target detection. If the number of opportunities to detect a target is n and the number of detections is y, the number of detections is binomially distributed with parameter p, where p = POD and q = 1−p. The basic model for the analysis of mine detection POD confidence limits has been developed in [61], although we applied confidence limits—POD-lower and POD-upper—by Exact Confidence Interval using the Clopper–Pearson method [62]:
where PODlow is the confidence interval lower limit, PODupp is the confidence interval upper limit, n is the number of trials, k is the number of successes in n trials, α is the percent chance to reject the true null hypothesis about detection incorrectly, and BetaInv has been defined in [63]. Usually, α = 0.05 (5%) and 1 − α is the 95% confidence.
PODupp = 1 − BetaInv(α/2, n − k, k + 1),
PODlow = 1 − BetaInv(1 − α/2, n − k + 1, k),
The estimated false alarm rate (FAR) can be defined as the number of false alarms counted on an area divided by the size of that area (i.e., the average number of false alarms per square meter). The area calculated was the area of the terrain scene (147 or 227) minus the area of all detected targets. As we limited our concern only to models and simulations of explosive targets, the FAR was not considered.
3. Results
The results of our research were methods for modeling and simulating explosive targets in a real hyperspectral data scene. We considered improvised explosive devices (IED), unexploded ordnances (UXOs), and landmines. Spectral data of these objects are limited and, for IEDs, are classified. Our approach included spectral data of UXOs and landmines, measured by hyperspectral imaging sensors (line scanner and a snapshot camera) onboard a ground-based mechanic gentry, a helicopter, and a UAV. The spectral data of the terrain were acquired with a snapshot hyperspectral camera onboard a UAV and a Bell-206 helicopter. The measured spectral data of the explosive targets had a very fine spatial resolution of 0.945 × 0.945 mm, while the spectral data of the terrain had a resolution of 1.868 × 1.868 cm. The dimensions of each UXO target were, thus, decreased to 5.0588% (see Figure 21) and, after this step, they could be implanted into the pixels of hyperspectral data of the terrain (see Figure 18 and Figure 19).
A key concept in our research is a combination of tests and analyses, in which several factors appear. The factors were UXO targets (artillery shell—AS, bullet—B, cluster munition—CM, mortar mine—MM, unexploded ordnances of unknown type—UXOX), landmines—PMR-2a, TMA-4, VTMRP-6—and plastic bottles) and the spectral angle mapping classifier (detector). The independent variable was the spectral angle (from 0.055 to 0.150 radians). A detector was tested with each UXO target in two situations: Spectra of targets overlaid with 10% of terrain spectra, or targets obscured by 25.7%. The overlaid and obscured UXO targets were implanted into the terrain hyperspectral cubes 147 and 227, which introduced additional variability; an example with terrain 227 is shown in Figure 22d. Figure 13, Figure 14, Figure 15 and Figure 16, several targets had only one spectral value for each wavelength (see Table 2, Figure 25c,d), and were excluded from the following analysis. The histogram of the spectra in all channels of one considered UXO target showed rich variability, while the randomly simulated spectra were also very variable (see Figure 26c). In contrast to the discussed cases, where only the mean value per channel was known, spectral values were uniformly distributed in the majority of channels (see Figure 26b). We are aware that such cases appear often; therefore, we initially tested simulation with random spectral values, if besides mean values, the minimum and maximum values of the reflectance spectra were known (Figure 25e,f).
3.1. Probability of Target Detection POD, Confidence Intervals
The SAM classification outputs (an example is shown in Figure 28c) were used as the detector outputs. At the same time, the estimated probability of detection for a particular factor level combination is the ratio of the number of detected targets to the total number of opportunities to detect a target. The examples for ASR are shown in Figure 24b,c. While we assumed a binomial distribution for the number of correct positive indications, we also found the 95% confidence limits for the probability of detection, as indicated by relations in Equations (4) and (5).
The considered SAM class raster data models (Figure 24) of the explosive targets ASR, BR, CMR, MMR, and UXOXR were used, after normalizing each to its maximum value. For each target, the POD was derived, as well as the detection probability (see Figure 29 and Figure 30 target 10% overlayed spectra; Figure 31 and Figure 32 target obscured by 25.7%). As the POD and confidence interval data were non-monotonic, we applied a polynomial approximation (see Figure 30 and Figure 32, as well as Appendix A and Appendix B).
The POD functions of targets with overlayed spectra (Figure 29 and Figure 30, Appendix A) were smoother than the POD functions of obstructed targets (Figure 31 and Figure 32, Appendix B).
3.2. Polynomial Approximations of POD, PODupper, and PODlower
The functions of the probability of detection (POD) and the associated confidence limits (PODupper and PODlower) were derived from empirical (measured) reflectance spectra. They are intended for use in civilian security applications, where they should be simulated and processed. Hence, we derived polynomial approximations for the considered targets (see Table 3 and Table 4) Through approximation, we can avoid the need to read empirical POD, PODupper, and PODlower data, by using the corresponding functions.
3.3. Simulation of Target Placement
The placement of targets in the terrain hyperspectral scene is defined in Figure 31, with futher examples given in Appendix A, Appendix B and Appendix C. We created three sets of fused scenes with targets. The first set contained targets, as described earlier. The second had a 10% overlay of spectral information from the position of target placement. The third set had an obscured, partially randomly hidden 25.7% area of targets (Figure 27). In the second case—where targets were overlaid with the scene—we were able to test whether and how different terrain would influence the outcomes. In the third case, we could see how the spectral footprint was changed by hiding randomly chosen different parts of 5 targets at 10 locations. The locations of targets in the scenes were picked to match as much variety as possible, and different positions were picked for each scene.
3.4. SAM Detection Endmembers and Results
We tested the detection results with endmembers from full-scale targets vs. targets decreased to 5.058% (to match scene resolution). Less accurate results were achieved with endmembers of the full-size targets and, so, we continued with the endmember collection containing all the pixels of the reduced-size targets. The use of true spectral data of explosive targets, measured by a hyperspectral imaging scanner and processed as described in Table 1 and Figure 22, led to reliable outcomes and is suitable for civilian security applications (see Figure 25a,b). The average spectral data produced a strong constant response (Figure 25c,d), and should not be used.
4. Discussion
The subjects tasked with explosive ordnance disposal and the disposal of improvised explosive devices are always exposed to explosive threats and, often, to ambushes. The civilian subjects are generally a single or group of the ground vehicles of a humanitarian demining organization, traveling from camp to the working area and returning, logistics convoys, medical, humanitarian aid, Red Cross, reconstruction convoy, security forces, civilian VIP travelers, or similar. The level of incidents and casualties for civilian vehicles and convoys dominate, when compared to military or security forces. Several survey technologies could be considered as a tool for analysis and decreasing the associated risk. These include hyperspectral, non-linear junction detection (NLJD), LIDAR, longwave infrared, magnetometer, and ground-penetrating radar (GPR) technologies. Several cited references have provided initial insights into these domains, although we focused solely on passive hyperspectral technology. We chose this specifically, due to the lack of data about the considered explosive devices in a realistic, non-laboratory environment. A positive fact is that the hyperspectral imaging sensors used onboard unmanned aerial vehicles (UAVs) can provide pixels smaller than the explosive devices on the ground surface (very high spatial resolution), which is not practical for piloted helicopter platforms. This is the new opportunity provided by hyperspectral sensors, allowing them to serve as an efficient tool for the detection of targets on the ground. In this study, we developed several solutions for modeling and simulating UXOs and landmines, which are suitable for application in civilian security. The conducted research relied on several assumptions; our work has found them to be generally valid.
The possibility of synthetically implanting target spectral images of explosive targets in a hyperspectral image was verified. The true spectral images of UXOs and landmines, measured by hyperspectral imaging sensors, as well as ground- and aerial (UAV and helicopter)-based imagery were fused with the spectra of terrain spectral images. The generalizability of these results is subject to certain limitations:
- -
- The true spectral data of the UXO and landmines were measured by ground-based hyperspectral imaging sensors, with ground resolving distance (GRD) of 0.954 mm.
- -
- The spectral data of the terrain—that is, of the minefields and their surroundings—were acquired by UAV with hyperspectral imaging sensors, with GRD of 18.68 mm.
- -
- The best value of GRD target/terrain ratio was 0.05058 (or 5.058%) for the available explosive targets and terrain spectral images. Smaller values of this ratio cannot provide acceptable outcomes.
The goal of the current study was to derive modeling and simulation methods for implanting the spectral data of explosive targets into a hyperspectral terrain scene, not detection methods themselves. Thus, to quantify the success of the modeling and simulation, we considered several hyperspectral classification methods: spectral angle mapping (SAM), cross-correlation, and linear unmixing. SAM was ultimately selected and used in this research. The independent variable of the SAM method was the spectral angle γ, while the dependent variable was the value of the classification raster. The spectral samples (endmembers) representing the targets (UXOs, landmines) were provided by measured true spectral images of full-scale targets or decreased (reduced dimension) targets. The spectral images of the explosive targets were available in the following ranges, and the generalizability of these results is also subject to the following limitations:
The number of endmembers of UXO targets ranged from 19,251 to 45,661; while the number of endmembers of decreased (reduced) UXO targets ranged from 53 to 108. The area of UXO targets ranged from 0.018147 to 0.040482 m2. The number of endmembers of landmines and plastic objects ranged from 1 to 8, while the number of endmembers of decreased (reduced) landmines and plastic objects was 1. The area of landmine targets and plastic objects ranged from 0.00950 to 0.066040 m2.
The landmines and plastic object were excluded from further research in the study, while the available spectral endmember data was limited to one sample per wavelength.
Three types of interaction between targets and terrain were considered in the study:
- -
- Without interaction with its neighborhood, such that the whole area of the target was visible to the imaging hyperspectral sensor.
- -
- The area of the target was partially hidden or obscured or covered by terrain (for which, we used the term obscured).
- -
- The spectrum of a target was mixed or overlaid by the spectra of terrain surface (e.g., partially by soil, sand, gravel, vegetation; for this, we used the term overlaid).
The five targets were analyzed on two terrain spectral data sets; therefore, further research is recommended, including statistically significant cases.
5. Conclusions
- 1.
- The motivation for our research into methods for modeling and simulating the implantation of spectral data of explosive targets into terrain spectral data was caused by the lack of civilian (or public military) hyperspectral data, regarding the considered explosive devices, in a realistic, non-laboratory environment. The lack of considered data can be compensated for by using the developed modeling and simulation methods.
- 2.
- The empirical research presented started with taking measurements using imaging hyperspectral sensors, line scanners, and snapshot cameras onboard a UAV and on a ground-based gantry, considering terrain, unexploded ordnances (UXO), and landmines on the ground surface.
- 3.
- The endmembers of explosive targets should be acquired with an imaging sensor having a very high spatial resolution. For artillery shells, bullets, cluster munitions, mortar mines, and small UXOs, we collected 19,251–45,661 spectral samples. For other types of UXO, these data will differ.
- 4.
- The implantation of targets into terrain spectra was done after decreasing the spatial dimensions of the targets and spatially matching their pixels to pixels of the terrain. In the considered cases, the spatial decrease was to 5.058% of the original dimension. The corresponding number of endmembers ranged from 52 to 108; for other types of UXO, this number will be different.
- 5.
- In this study, we demonstrated, for the first time, that larger values of spectral angle mapping classification outcomes are achieved if the endmembers are used from smaller (spatially decreased) explosive targets, and not from full-scale targets.
- 6.
- If the area of the target is partially hidden or obscured, or if the spectra of a target and terrain are mixed or overlaid, the variability of the SAM data has different behavior.
- 7.
- The SAM classifier was used as the detector, where its outputs were considered as a binary outcome of the Bernoulli statistical model, along with its confidence intervals.
- 8.
- Further research should analyze more terrain spectral images, a statistically relevant number of simulated explosive targets, and a variety of terrain–targets spectral influence.
- 9.
- The empirical and analytical findings of this study provide a new understanding of the hyperspectral behavior of UXOs and landmines in natural environments.
Author Contributions
Conceptualization, M.B.J. and M.B.; Data triage and review, M.B.; Processing, formal analysis M.B.J. and M.B.; Writing—Draft, M.B.J. and M.B.; Writing—Review and Editing, M.B.J. All authors have read and agreed to the published version of the manuscript.
Funding
This research received no external funding.
Institutional Review Board Statement
Not applicable.
Informed Consent Statement
Not applicable.
Data Availability Statement
Restrictions apply to the availability of these data. Data was obtained from HCR-CTRO and are available from the authors with the permission of HCR-CTRO, www.ctro.hr/en accessed on 19 February 2021.
Acknowledgments
The authors are grateful to colleagues who contributed to the development of the described hyperspectral aerial and ground-based survey system: H. Gold, T. Kičimbači, M. Krajnović, D. Vuletić, T. Ivelja, A. Brook, A. Krtalić, M. Tomić, I. Racetin, and G. Skelac. The research leading to these results was possible due to data available from the European Community’s Seventh Framework Programme FP7/2012–2015, under grant agreement n° 284747, project TIRAMISU.
Conflicts of Interest
The authors declare no conflict of interest.
Appendix A. Target Spectra Overlaid with 10% of the Terrain 147 Spectra
Figure A1.
Probability of detection (POD), the confidence limits (PODupper, PODlower), and polynomial approximations (Poly) of BR 147.
Figure A1.
Probability of detection (POD), the confidence limits (PODupper, PODlower), and polynomial approximations (Poly) of BR 147.

Figure A2.
Probability of detection (POD), the confidence limits (PODupper, PODlower), and polynomial approximations (Poly) of CMR 147.
Figure A2.
Probability of detection (POD), the confidence limits (PODupper, PODlower), and polynomial approximations (Poly) of CMR 147.

Figure A3.
Probability of detection (POD), the confidence limits (PODupper, PODlower), and polynomial approximations (Poly) of MMR 147.
Figure A3.
Probability of detection (POD), the confidence limits (PODupper, PODlower), and polynomial approximations (Poly) of MMR 147.

Figure A4.
Probability of detection (POD), the confidence limits (PODupper, PODlower), and polynomial approximations (Poly) of UXOXR 147.
Figure A4.
Probability of detection (POD), the confidence limits (PODupper, PODlower), and polynomial approximations (Poly) of UXOXR 147.

Appendix B. Targets Obstructed by 25.7% in Terrain 227
Figure A5.
Probability of detection (POD), the confidence limits (PODupper, PODlower), and polynomial approximations (Poly) of BR 227.
Figure A5.
Probability of detection (POD), the confidence limits (PODupper, PODlower), and polynomial approximations (Poly) of BR 227.

Figure A6.
Probability of detection (POD), the confidence limits (PODupper, PODlower), and polynomial approximations (Poly) of CMR 227.
Figure A6.
Probability of detection (POD), the confidence limits (PODupper, PODlower), and polynomial approximations (Poly) of CMR 227.

Figure A7.
Probability of detection (POD), the confidence limits (PODupper, PODlower), and polynomial approximations (Poly) of MMR 227.
Figure A7.
Probability of detection (POD), the confidence limits (PODupper, PODlower), and polynomial approximations (Poly) of MMR 227.

Figure A8.
Probability of detection (POD), the confidence limits (PODupper, PODlower), and polynomial approximations (Poly) of UXOXR 227.
Figure A8.
Probability of detection (POD), the confidence limits (PODupper, PODlower), and polynomial approximations (Poly) of UXOXR 227.

Appendix C. Terrain with Several Targets
Figure A9.
Hyperspectral scene 147: Dimensions, 18.681 × 18.681 m; 1000 × 1000 pixels; color-visualized (r = 650 nm, g = 550 nm, b = 460 nm).
Figure A9.
Hyperspectral scene 147: Dimensions, 18.681 × 18.681 m; 1000 × 1000 pixels; color-visualized (r = 650 nm, g = 550 nm, b = 460 nm).

Figure A10.
Hyperspectral scene 227: Dimensions, 18.681 × 18.681 m; 1000 × 1000 pixels; color-visualized (r = 650 nm, g = 550 nm, b = 460 nm).
Figure A10.
Hyperspectral scene 227: Dimensions, 18.681 × 18.681 m; 1000 × 1000 pixels; color-visualized (r = 650 nm, g = 550 nm, b = 460 nm).

References
- Dorn, A.W. Eliminating hidden killers: How can technology help humanitarian demining? Stab. Int. J. Secur. Dev. 2019, 8, 5. [Google Scholar] [CrossRef] [Green Version]
- Asylbek Kyzy, G.; Jung, Y.; Rapillard, P.; Hofmann, U. Geneva International Centre for Humanitarian Demining; SIPRI. In Global Mapping and Analysis of Anti-Vehicle Mine Incidents in 2017; Geneva International Centre for Humanitarian Demining (GICHD): Geneva, Switzerland, 2018. [Google Scholar]
- Geneva International Centre for Humanitarian Demining. IMAS 08.10. Non-Technical Survey 2009; Geneva International Centre for Humanitarian Demining: Geneva, Switzerland, 2017. [Google Scholar]
- Mats, H. Norwegian peoples IRAQ drone use and lessons learned. Norwegian People’s Aid Workshop on Lessons Learned from the Use of Unmannedaerial Vehicles for the Identification and Assessment of Explosive Devices Threats, Presentation, Podgorica, Montenegro, 16–17 October 2019.
- Mats, H. Video acquired by RPAS. In Norwegian People’s Aid Workshop on Lessons Learned from the Use of Unmannedaerial Vehicles for the Identification and Assessment of Explosive Devices Threats, Podgorica, Montenegro, 16–17 October 2019.
- United Nations: Department of Peacekeeping Operations, Department of Field Support. Guidelines on Improvised Explosive Devices (IED) Threat Mitigation in Mission Settings; United Nations, Department of Peacekeeping Operations, Department of Field Support: New York, NY, USA, 2018. [Google Scholar]
- Kalbarczyk, M. Eda Ied Detection (IEDDET) Programme, Presentation. Available online: http://www.irsd.be/website/images/images/Activites/Colloques/presentation/2016-05-17/05-Mr-Marek-KALBARCZYK.pdf (accessed on 10 February 2020).
- Shutte, K.; Sahli, H.; Schrottmayer, D.; Eisl, M.; Varas, F.J.; Bajic, M.; Uppsal, M.; den Breejen, E. ARC: A camcopter based minefield detection system. In Proceedings of the 5th International Airborne Remote Sensing Conference, San Francisco, CA, USA, 17–20 September 2001. [Google Scholar]
- Toolbox Implementation for Removal of Anti-Personnel Mines, Sub-Munitions and UXO—TIRAMISU, EU FP7 Project 2012–2015, Grant Agreement Number 284747. Available online: http://www.fp7-tiramisu.eu/ (accessed on 9 January 2021).
- Fardoulis, J. Drones in HMA lessons from the field 2019. In Proceedings of the 7th Mine Action Technology Workshop, GCIHD, Basel, Switzerland, 7–8 November 2019. [Google Scholar]
- Nevard, M.; Mansel, R.; Torbet, N. Use of aerial imagery in urban survey & use of RPASs in mine Action—Lessons learned from six countries. In Proceedings of the 7th Mine Action Technology Workshop, GCIHD, Basel, Switzerland, 7–8 November 2019. [Google Scholar]
- Lisica, D. Evaluation on use of UAVs in-country assessment of suspected hazardous areas in Bosnia and Herzegovina 2019. In Proceedings of the Norwegian People’s Aid Workshop on Lessons Learned from the Use of Unmanned Aerial Vehicles for the Identification and Assessment of Explosive Devices Threats, Podgorica, Montenegro, 16–17 October 2019. [Google Scholar]
- McFee, J.E.; Ripley, H.T. Detection of buried land mines using a casi hyperspectral imager. In Detection and Remediation Technologies for Mines and Minelike Targets II; International Society for Optics and Photonics: San Diego, CA, USA, 1997; Volume 3079, pp. 738–749. [Google Scholar]
- Yoresh, A.B. Mine detection by air photography. In Proceedings of the 7th International Symposium; Humanitarian Demining; HCR Center for testing, development and training, Šibenik, Croatia, 27–30 April 2010; Volume 27. [Google Scholar]
- Yoresh, A.B. Identification of minefields by aerial photography 2010. In Proceedings of the Third Mine Action Technology Workshop, Geneva, Switzerland, 6–8 September 2010. [Google Scholar]
- Geneva International Centre for Humanitarian Demining. Geomine Demonstration Test 2012/2013; Geneva International Centre for Humanitarian Demining: Geneva, Switzerland, 2013. [Google Scholar]
- Bajic, M.; Ivelja, T.; Brook, A. Development of a hyperspectral non -technical survey of the minefields from the UAV and the helicopter. J. Conv. Weapons Destr. 2017, 21, 11. [Google Scholar]
- Bajić, M.; Krajnović, M.; Brook, A.; Ivelja, T. Ground vehicle based system for hyperspectral measurement of minefields. In Book of Papers—International Symposium “Mine Action”; HCR Center for Testing, Development and Training: Zagreb, Croatia, 2014; p. 13. [Google Scholar]
- Manley, P.V.; Sagan, V.; Fritschi, F.B.; Burken, J.G. Remote sensing of explosives-induced stress in plants: Hyperspectral imaging analysis for remote detection of unexploded threats. Remote Sens. 2019, 11, 1827. [Google Scholar] [CrossRef] [Green Version]
- Smit, R.; Schmitz, P.; du Plooy, N.; Cooper, A.; van Dyk, T.; Smit, E.; Ramaloko, P. The influence of explosives on plants using in-situ hyperspectral data, Presentation. In Proceedings of the 5th UNMAS/GICHD Bi-Annual Technology Workshop, Pretoria, South Africa, 18–20 June 2014. [Google Scholar]
- Berg, A. Detection and Tracking in Thermal Infrared Imagery; Linköping University Electronic Press: Linköping, Sweden, 2016. [Google Scholar]
- Nikulin, A.; de Smet, T.; Baur, J.; Frazer, W.; Abramowitz, J. Detection and identification of remnant PFM-1 ‘Butterfly Mines’ with a UAV-Based thermal-imaging protocol. Remote Sens. 2018, 10, 1672. [Google Scholar] [CrossRef] [Green Version]
- Smirnov, A.; Nikulin, A. Long-Range and tethered UAVs in UXO detection 2019, long-range and tethered UAVs in UXO detection, presentation. In Proceedings of the 7th Mine Action Technology Workshop, GCIHD, Basel, Switzerland, 7–8 November 2019. [Google Scholar]
- Bajic, M. Testing of detectors for non-explosive components of the IED, the non-linear junction, and the control line-wire 2017. In “Synergistic Technologies to Defeat Improvised Threat,” Proceedings of the 3rd C-IED Technology Workshop; Madrid, Spain, 24–26 October 2017, C-IED Centre of Excellence: Madrid, Spain, 2017. [Google Scholar]
- Bajić, M. Propagation model of harmonic radar for detection of nonlinear contacts of improvised explosive device. Polytech. Des. 2017, 210–218. [Google Scholar] [CrossRef]
- Šipoš, D.; Gleich, D.; Malajner, M. Stepped frequency radar for landmine detection attached to hexacopter. Presentation and paper. In Book of Papers, Proceedings of the 16th International Symposium MINE ACTION; Dubrovnik, Croatia, 10 April 2019, HCR Center for testing, development and training: Dubrovnik, Croatia, 2019. [Google Scholar]
- Šipoš, D.; Gleich, D. A Lightweight and low-power UAV-Borne ground penetrating radar design for landmine detection. Sensors 2020, 20, 2234. [Google Scholar] [CrossRef] [PubMed] [Green Version]
- Mayr, W. FindMine UAV im humanitären einsatz presentation, Urs Endress Foundation. In Proceedings of the 7th Mine Action Technology Workshop, GCIHD, Basel, Switzerland, 7–8 November 2019. [Google Scholar]
- Fasano, G.; Renga, A.; Vetrella, A.R.; Ludeno, G.; Catapano, I.; Soldovieri, F. Proof of concept of Micro-UAV-Based radar imaging. In Proceedings of the 2017 International Conference on Unmanned Aircraft Systems (ICUAS), Miami, FL, USA, 13–16 June 2017; pp. 1316–1323. [Google Scholar]
- Targett, K. Amulet UAS with GPR. In Proceedings of the 7th Mine Action Technology Workshop, GCIHD, Basel, Switzerland, 7–8 November 2019. [Google Scholar]
- Guldin, D. Development and Tests of a UXO Survey Drone System 2019. In Book of Papers, Proceedings of the 16th International Symposium MINE ACTION, Dubrovnik, Croatia, 10 April 2019; HCR Center for testing, development and training: Dubrovnik, Croatia, 2019. [Google Scholar]
- Guldin, D. Development and Tests of a UXO Survey Drone System 2019. In Proceedings of the 7th Mine Action Technology Workshop, GCIHD, Basel, Switzerland, 7–8 November 2019. [Google Scholar]
- Krtalić, A.; Bajić, M.; Ivelja, T.; Racetin, I. The AIDSS Module for data acquisition in crisis situations and environmental protection. Sensors 2020, 20, 1267. [Google Scholar] [CrossRef] [PubMed] [Green Version]
- Makki, I.; Younes, R.; Francis, C.; Bianchi, T.; Zucchetti, M. A Survey of landmine detection using hyperspectral imaging. ISPRS J. Photogramm. Remote Sens. 2017, 124, 40–53. [Google Scholar] [CrossRef]
- Makki, I. Hyperspectral Imaging for Landmine Detection. Ph.D. Thesis, Lebanese Univerity and Politecnico di Torino, Torino, Italy, 2017. [Google Scholar]
- Makki, I.; Younes, R.; Khodor, M.; Khoder, J.; Francis, C.; Bianchi, T.; Rizk, P.; Zucchetti, M. RBF Neural network for landmine detection in H yperspectral imaging. In Proceedings of the 2018 7th European Workshop on Visual Information Processing (EUVIP), Tampere, Finland, 26–28 November 2018; pp. 1–6. [Google Scholar]
- Aikio, M. Hyperspectral Prism-Grating-Prism Imaging Spectrograph; VTT Publications: Espoo, Finland, 2001. [Google Scholar]
- Bajić, M.; Ivelja, T.; Krtalić, A.; Tomić, M.; Vuletić, D. The Multisensor and Hyper spectral survey of the UXO around the exploded ammunition depot, of the land mines test site vegetation. In Proceedings of the 10th International Symposium HUDEM, HCR Center for Testing, Development and Training. Šibenik, Croatia, 27–30 April 2013; Volume 9206, pp. 91–96. [Google Scholar]
- Bajic, M.; Gold, H.; Pračić, Ž.; Vuletić, D. Airborne sampling of the reflectivity by the hyperspectral line scanner in a visible and near infrared wavelengths. In Proceedings of the 24th Symposium of the European Association of Remote Sensing Laboratories, Dubrovnik, Croatia, 15–27 May 2004; pp. 25–27. [Google Scholar]
- Bajić, M. Airborne hyperspectral surveillance of the ship-based oil pollution in Croatian part of the Adriatic sea. Geod. List 2012, 66, 77–100. [Google Scholar]
- Bajić, M.; Ivelja, T. Transfer of knowledge and technologies from mine action to counter improvised explosive devices (C-IED) domain. Polytech. Des. 2016, 4, 300–309. [Google Scholar]
- Miljković, V.; Gajski, D. Adaptation of industrial hyperspectral line scanner for archaeological applications. Int. Arch. Photogramm. Remote Sens. Spat. Inf. Sci. 2016, 5, 343–345. [Google Scholar] [CrossRef]
- Krtalić, A.; Miljković, V.; Gajski, D.; Racetin, I. Spatial distortion assessments of a low-cost laboratory and field hyperspectral imaging system. Sensors 2019, 19, 4267. [Google Scholar] [CrossRef] [PubMed] [Green Version]
- Bajic, M. Impact of Mine polluted area characteristics on the suitability of the airborne multisensor mine field Detection—The case of Croatia. In Proceedings of the International Airborne Remote Sensing Conference and Exhibition, 4th/21st Canadian Symposium on Remote Sensing, Ottawa, ON, Canada, 21–24 June 1999. [Google Scholar]
- Yvinec, Y.; Bajić, M.; Dietrich, B.; Bloch, I.; Vanhuysse, S.; Wolff, E.; Willekens, J. Space and Airborne Mined Area Reduction Tools, SMART Project Final Report, V2.2, Classification: Public; European Commission IST-2000-25044; European Commission: Brussels, Belgium, 2005. [Google Scholar]
- Bajic, M.; Beckel, L.; Breejen, E.; Sahli, H.; Schrotmeier, D.; Upsal, M.; Varas, F.J. Airborne Minefield Area Reduction-ARC; European Commission Research Directorates General Project 2001–2003; IST-2000-25300; Information Society Technologies Programme: Brussels, Belgium, 2000. [Google Scholar]
- Donohue, J. Introductory Review of Target Discrimination Criteria; Final Report, 16 April 1991–31 December 1991; Phillips Laboratory Air Force Systems, Command Hanscom Air Force Base: Wilmington, MA, USA, 1991. [Google Scholar]
- Agarwal, S. Modeling and Performance Estimation for Airborne Minefield Detection System. Master’s Thesis, University of Missouri-Rolla, Rolla, MO, USA, 2008. [Google Scholar]
- Lerner, W.D. Predicting the Emplacement of Improvised Explosive Devices: An Innovative Solution. Ph.D. Thesis, Capitol College, Laurel, MD, USA, April 2013. [Google Scholar]
- Johnson, D.; Ali, A. Modeling and simulation of landmine and improvised explosive device detection with multiple loops. J. Def. Model. Simul. Appl. Methodol. Technol. 2015, 12, 257–271. [Google Scholar] [CrossRef]
- Rajagopal, A.; Agarwal, S.; Ramakrishnan, S. Simulation-Based performance modeling for war fighter in loop minefield detection system. In Proceedings of the Winter Simulation Conference, New York, NY, USA, 4–7 December 2005; pp. 1160–1169. [Google Scholar]
- Manolakis, D.; Shaw, G. Detection algorithms for hyperspectral imaging applications. IEEE Signal Process. Mag. 2002, 19, 29–43. [Google Scholar] [CrossRef]
- Manolakis, D.G. Taxonomy of detection algorithms for hyperspectral imaging applications. Opt. Eng. 2005, 44, 066403. [Google Scholar] [CrossRef]
- Manolakis, D.; Marden, D.; Shaw, G.A. Hyperspectral image processing for automatic target detection applications. Linc. Lab. J. 2003, 14, 79–116. [Google Scholar]
- Matteoli, S.; Diani, M.; Corsini, G. A tutorial overview of anomaly detection in hyperspectral images. IEEE Aerosp. Electron. Syst. Mag. 2010, 25, 5–28. [Google Scholar] [CrossRef]
- Wang, L.; Zhao, C. Hyperspectral Image Processing; Springer: Berlin, Germany, 2015; ISBN 978-7-118-08646-1. [Google Scholar]
- Paoletti, M.E.; Haut, J.M.; Plaza, J.; Plaza, A. Deep learning classifiers for hyperspectral imaging: A review. ISPRS J. Photogramm. Remote Sens. 2019, 158, 279–317. [Google Scholar] [CrossRef]
- Kruse, F.A.; Lefkoff, A.B.; Boardman, J.W.; Heidebrecht, K.B.; Shapiro, A.T.; Barloon, P.J.; Goetz, A.F.H. The Spectral image processing system (SIPS)—Interactive visualization and analysis of imaging spectrometer data. Remote Sens. Environ. 1993, 44, 145–163. [Google Scholar] [CrossRef]
- Basener, W.F.; Nance, E.; Kerekes, J. The target implant method for predicting target difficulty and detector performance in hyperspectral imagery. In Proceedings of the Algorithms and Technologies for Multispectral, Hyperspectral, and Ultraspectral Imagery XVII, SPIE, Orlando, FL, USA, 13 May 2011; p. 80481H. [Google Scholar]
- Evans, M.; Hastings, N.; Peacock, B. Statistical Distributions, 3rd ed.; Wiley: Hoboken, NJ, USA, 2000; pp. 31–33. [Google Scholar]
- Simonson, K.M. Statistical Considerations in Designing Tests of Mine Detection Systems: I-Measures Related to the Probability of Detection; Sandia National Laboratories: Albuquerque, NM, USA; Livermore, CA, USA, 1998. [Google Scholar]
- Vollset, S.E. Confidence intervals for a binomial proportion. Stat. Med. 1993, 12, 809–824. [Google Scholar] [CrossRef] [PubMed]
- Abramowitz, J. MATLAB. Available online: https://www.mathworks.com/help/stats/betainv.html (accessed on 9 January 2021).
Figure 1.
Remnants of a cluster munition in South Iraq; “Ideal” targets for hyperspectral detection from UAV [4].
Figure 1.
Remnants of a cluster munition in South Iraq; “Ideal” targets for hyperspectral detection from UAV [4].

Figure 2.
Hyperspectral push-broom sensor provides real hyperspectral data, while complex processing is needed to produce a calibrated hyperspectral cube: (a) Hyperspectral line scanner; (b) data are collected in scan lines, which need parametric geocoding; and (c) hyperspectral cube needed calibration.

Figure 3.
(a) Hyperspectral snapshot camera UHD-185; (b) panchromatic image of the scene (1000 × 1000 pixels); and (c) hyperspectral cube obtained by sharpening real hyperspectral recording of 50 × 50 pixels with 1000 × 1000 panchromatic pixels.
Figure 3.
(a) Hyperspectral snapshot camera UHD-185; (b) panchromatic image of the scene (1000 × 1000 pixels); and (c) hyperspectral cube obtained by sharpening real hyperspectral recording of 50 × 50 pixels with 1000 × 1000 panchromatic pixels.

Figure 4.
(a) Spectralon (on the right side) and UXO targets (artillery shell, bullet, and mortar mine); (b) The geometry of the measured data of Figure 4a are corrected by interpolation, with the new GRD being 0.945 mm.
Figure 4.
(a) Spectralon (on the right side) and UXO targets (artillery shell, bullet, and mortar mine); (b) The geometry of the measured data of Figure 4a are corrected by interpolation, with the new GRD being 0.945 mm.

Figure 5.
Artillery shell (a) photography by handheld camera; (b) color-visualized hyperspectral cube (red = 650 nm, green = 550 nm, blue = 450 nm). The ground resolving distance (GRD) is 0.945 mm.
Figure 5.
Artillery shell (a) photography by handheld camera; (b) color-visualized hyperspectral cube (red = 650 nm, green = 550 nm, blue = 450 nm). The ground resolving distance (GRD) is 0.945 mm.

Figure 6.
Bullet: (a) photography; and (b) color-visualized hyperspectral cube (red = 650 nm, green = 550 nm, blue = 450 nm). The ground resolving distance (GRD) is 0.945 mm.
Figure 6.
Bullet: (a) photography; and (b) color-visualized hyperspectral cube (red = 650 nm, green = 550 nm, blue = 450 nm). The ground resolving distance (GRD) is 0.945 mm.

Figure 7.
Mortar mine: (a) photography; and (b) color-visualized hyperspectral cube (red = 650 nm, green = 550 nm, blue = 450 nm). The ground resolving distance (GRD) is 0.945 mm.
Figure 7.
Mortar mine: (a) photography; and (b) color-visualized hyperspectral cube (red = 650 nm, green = 550 nm, blue = 450 nm). The ground resolving distance (GRD) is 0.945 mm.

Figure 8.
Cluster munition: (a) photography; and (b) color-visualized hyperspectral cube (red = 650 nm, green = 550 nm, blue = 450 nm). The ground resolving distance (GRD) is 0.945 mm.
Figure 8.
Cluster munition: (a) photography; and (b) color-visualized hyperspectral cube (red = 650 nm, green = 550 nm, blue = 450 nm). The ground resolving distance (GRD) is 0.945 mm.

Figure 9.
UXO: (a) photography; and (b) color-visualized hyperspectral cube (red = 650 nm, green = 550 nm, blue = 450 nm). The ground resolving distance (GRD) is 0.945 mm.
Figure 9.
UXO: (a) photography; and (b) color-visualized hyperspectral cube (red = 650 nm, green = 550 nm, blue = 450 nm). The ground resolving distance (GRD) is 0.945 mm.

Figure 10.
Mean spectra of five UXO targets. Legend: AS—artillery shell, B—bullet, CM—cluster munition, MM—mortar mine, and UXO_X—UXO of unknown type.
Figure 10.
Mean spectra of five UXO targets. Legend: AS—artillery shell, B—bullet, CM—cluster munition, MM—mortar mine, and UXO_X—UXO of unknown type.

Figure 11.
Irradiance counts were measured in the morning and the afternoon, using the UHD-185 imaging sensor onboard the UAV. This is the raw, uncalibrated Sun irradiance. The deep minimum of the irradiance (e.g., ~760 nm) must be corrected by interpolating irradiances at lower and higher wavelengths.

Figure 12.
Absolute (calibrated) spectral irradiance, measured in the test area when hyperspectral data acquisition was carried out with the UAV.
Figure 12.
Absolute (calibrated) spectral irradiance, measured in the test area when hyperspectral data acquisition was carried out with the UAV.

Figure 18.
Hyperspectral scene 147. Dimensions 18.681 × 18.681 m, 1000 × 1000 pixels. Visualized with r = 650 nm, g = 550 nm, b = 460 nm.
Figure 18.
Hyperspectral scene 147. Dimensions 18.681 × 18.681 m, 1000 × 1000 pixels. Visualized with r = 650 nm, g = 550 nm, b = 460 nm.

Figure 19.
Hyperspectral scene 227. Dimensions 18.681 × 18.681 m, 1000 × 1000 pixels. Visualized with r = 650 nm, g = 550 nm, b = 460 nm.
Figure 19.
Hyperspectral scene 227. Dimensions 18.681 × 18.681 m, 1000 × 1000 pixels. Visualized with r = 650 nm, g = 550 nm, b = 460 nm.

Figure 20.
Calibration area acquired from Bell-206 helicopter: (a) color-visualized hyperspectral cube (red = 650 nm, green = 550 nm, blue = 450 nm). Area ~ 72 × 72 m, GRD = 7.19 cm; and (b) Handheld oblique photography.
Figure 20.
Calibration area acquired from Bell-206 helicopter: (a) color-visualized hyperspectral cube (red = 650 nm, green = 550 nm, blue = 450 nm). Area ~ 72 × 72 m, GRD = 7.19 cm; and (b) Handheld oblique photography.

Figure 21.
Artillery shell (a) extracted from its neighborhood (Figure 8b); (b) small targets, of decreased dimensions, in this figure are presented not in exact scale, in order to be recognizable. Small targets can be implanted with any orientation. This small target image is named nameR, where the suffix R means the decrease to 5.058%.

Figure 22.
Main steps for implanting targets onto the hyperspectral scene of the terrain. Figure A9 is an example for terrain 147, Figure A10 is terrain 227: (a) Targets inserted on blackboard (1000 × 1000 pixels, 90 channels, floating point 32-bit, stack, tif). Red: AS, B, CN, MM, UXOX, Plastic bottle, mines PMR-2a, TMA-4, VTMRP-6; Yellow: False alarm objects; Green: Random uniform spectral values inside the minimum–maximum interval; (b) locations of targets: black—0, white—1, 90 channels, 32-bit; (c) hyperspectral terrain scene 227 (1000 × 1000 pixels, 90 channels, 32 bits, tif) multiplied by (b). One channel is shown; (d) Adding (a) to (c) in 90 channels, giving implanted targets on hyperspectral terrain scene 227. Color visualization (r = 650 nm, g = 550 nm, b = 460 nm).

Figure 23.
The reference spectrum ri, (i = 1,…,L), the test spectrum ti (i = 1,…,L), γ is the angle between them (in radians), and L is a number of channels [58] (p. 157).
Figure 23.
The reference spectrum ri, (i = 1,…,L), the test spectrum ti (i = 1,…,L), γ is the angle between them (in radians), and L is a number of channels [58] (p. 157).

Figure 24.
Results of spectral angle mapping processing: (a) SAM of targets calculated using their own endmembers; (b) SAM of 9 ASR targets with areas obscured by 25.7%; and (c) spectra of targets overlayed with 10% of scene 147 at locations of targets—SAM of 10 ASR targets.
Figure 24.
Results of spectral angle mapping processing: (a) SAM of targets calculated using their own endmembers; (b) SAM of 9 ASR targets with areas obscured by 25.7%; and (c) spectra of targets overlayed with 10% of scene 147 at locations of targets—SAM of 10 ASR targets.


Figure 25.
Examples of Case1: (a,b) target artillery shell; (c,d) Case 2: target mine TMA-4; (e,f) case 3: case target, mine TMA-4, spectral data randomly generated, with uniform distribution, in the interval from minimum to maximum.
Figure 25.
Examples of Case1: (a,b) target artillery shell; (c,d) Case 2: target mine TMA-4; (e,f) case 3: case target, mine TMA-4, spectral data randomly generated, with uniform distribution, in the interval from minimum to maximum.

Figure 26.
Histograms of spectral data of all channels: (a) Mortar mine; (b) TMA-4; and (c) randomly generated TMA-4 spectral data. Note that histograms (a) and (c) show significant variability of spectral values. Histogram (b) shows that constant values dominate the spectrum, and only several deviations appear.

Figure 27.
Example of obscuring: (a) clear targets; and (b) areas of targets (obscured 25.7%).

Figure 28.
Spectral angle mapping (SAM) outputs for a decreased mortar mine MM: (a) The source of spectral endmembers, MM, in terrain 147 environment, visualized in color (r = 650 nm, g = 550 nm, b = 460 nm); (b) Spectral Angle raster, containing spectral angle values for each image cell, obtained with the angle threshold value of γ = 0.0174532925 radians; and (c) Class raster, in which cells are assigned to endmember classes based on the angle threshold value γ.

Figure 29.
Probability of detection POD of ASR, BR, CMR, MMR, and UXOR targets, with their spectra overlaid with 10% of terrain 147 spectra.
Figure 29.
Probability of detection POD of ASR, BR, CMR, MMR, and UXOR targets, with their spectra overlaid with 10% of terrain 147 spectra.

Figure 30.
Probability of detection (POD), the confidence limits (PODupper, PODlower), and polynomial approximations (Poly) of ASR 147 overlaid spectra.
Figure 30.
Probability of detection (POD), the confidence limits (PODupper, PODlower), and polynomial approximations (Poly) of ASR 147 overlaid spectra.

Figure 31.
The probability of detection (POD) of ASR, BR, CMR, MMR, and UXOR in terrain scene 227; targets obscured by 25.7%.
Figure 31.
The probability of detection (POD) of ASR, BR, CMR, MMR, and UXOR in terrain scene 227; targets obscured by 25.7%.

Figure 32.
Probability of detection (POD), confidence limits (PODupper, PODlower), and polynomial approximations (Poly) of ASR 227, targets obscured by 25.7%.
Figure 32.
Probability of detection (POD), confidence limits (PODupper, PODlower), and polynomial approximations (Poly) of ASR 227, targets obscured by 25.7%.


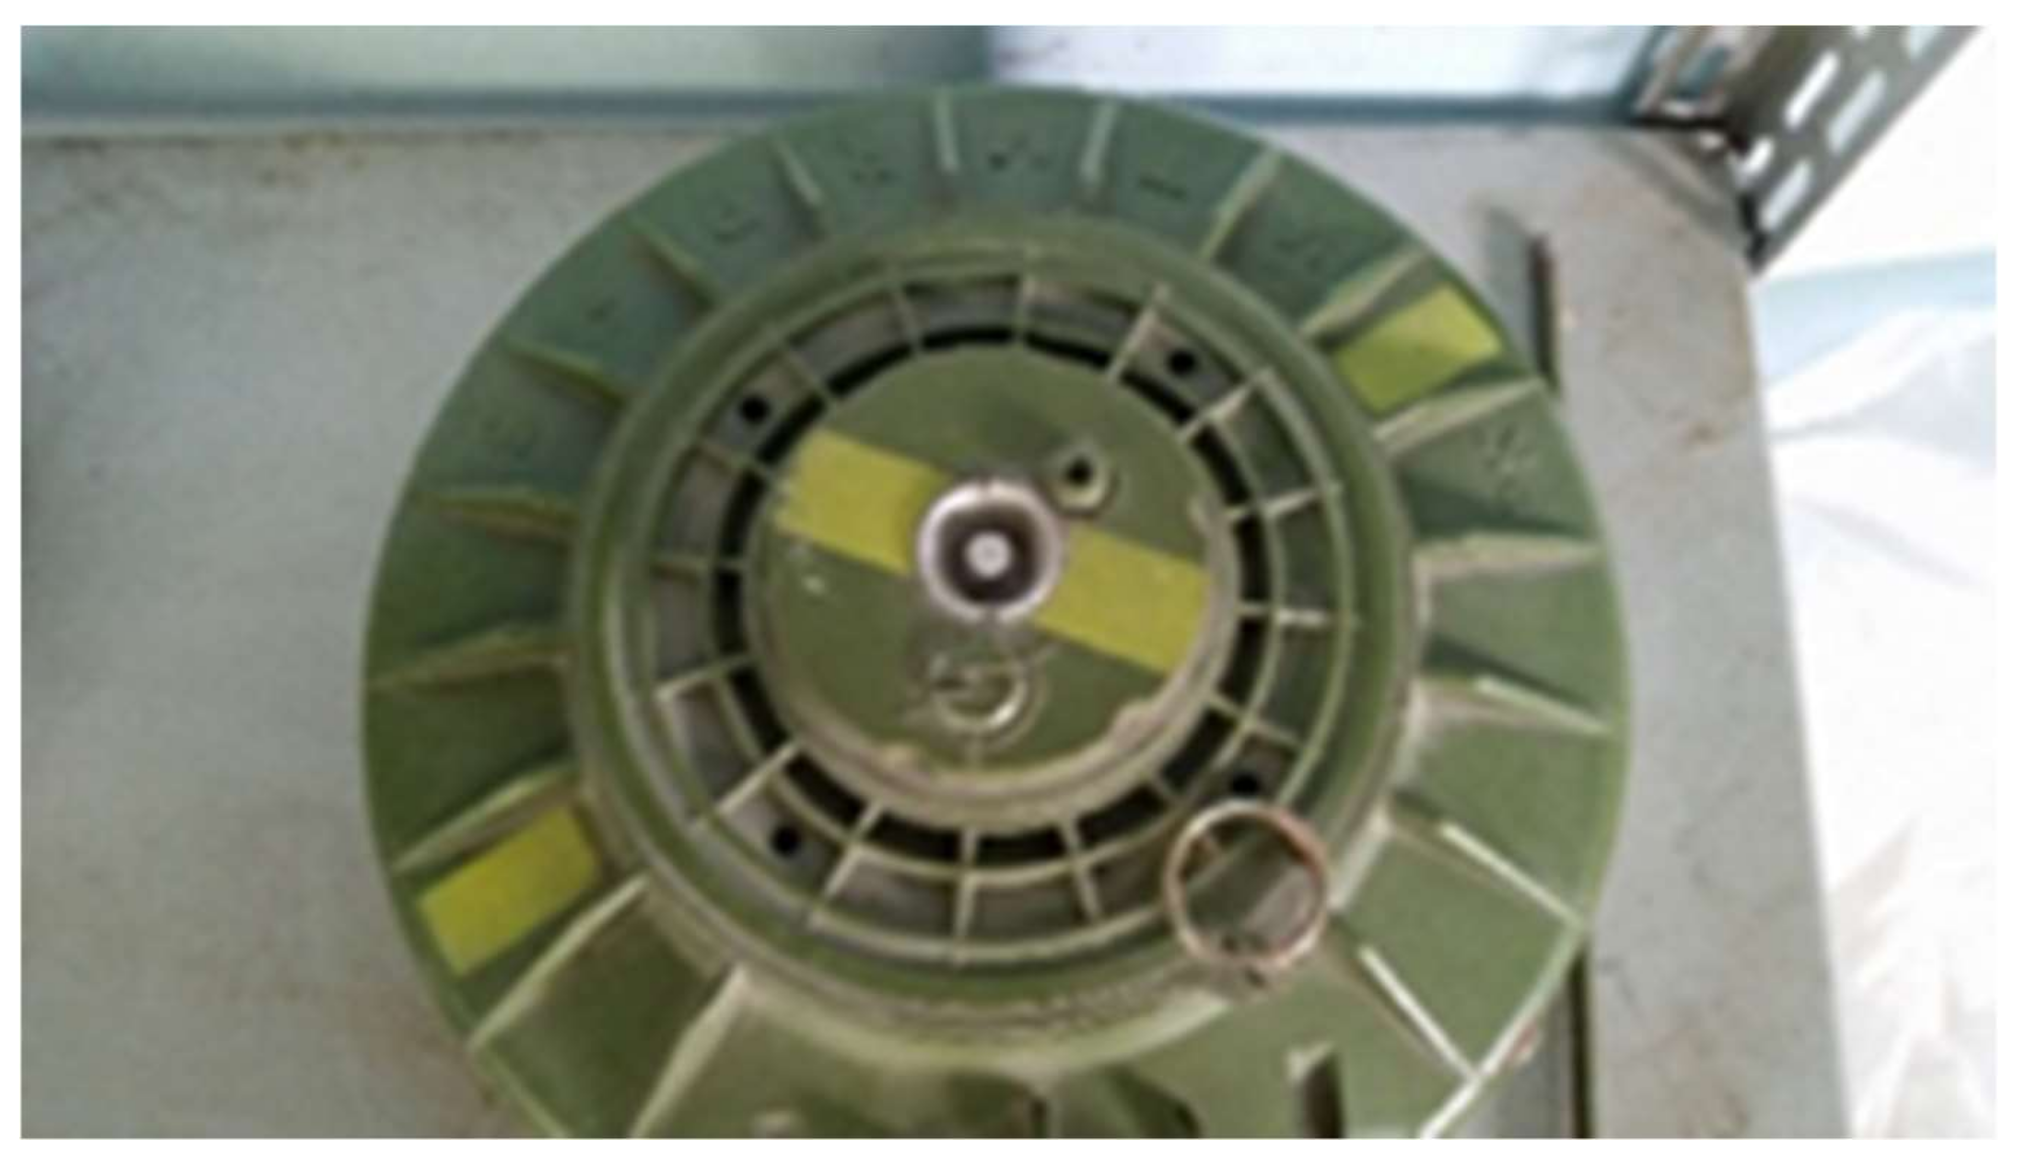
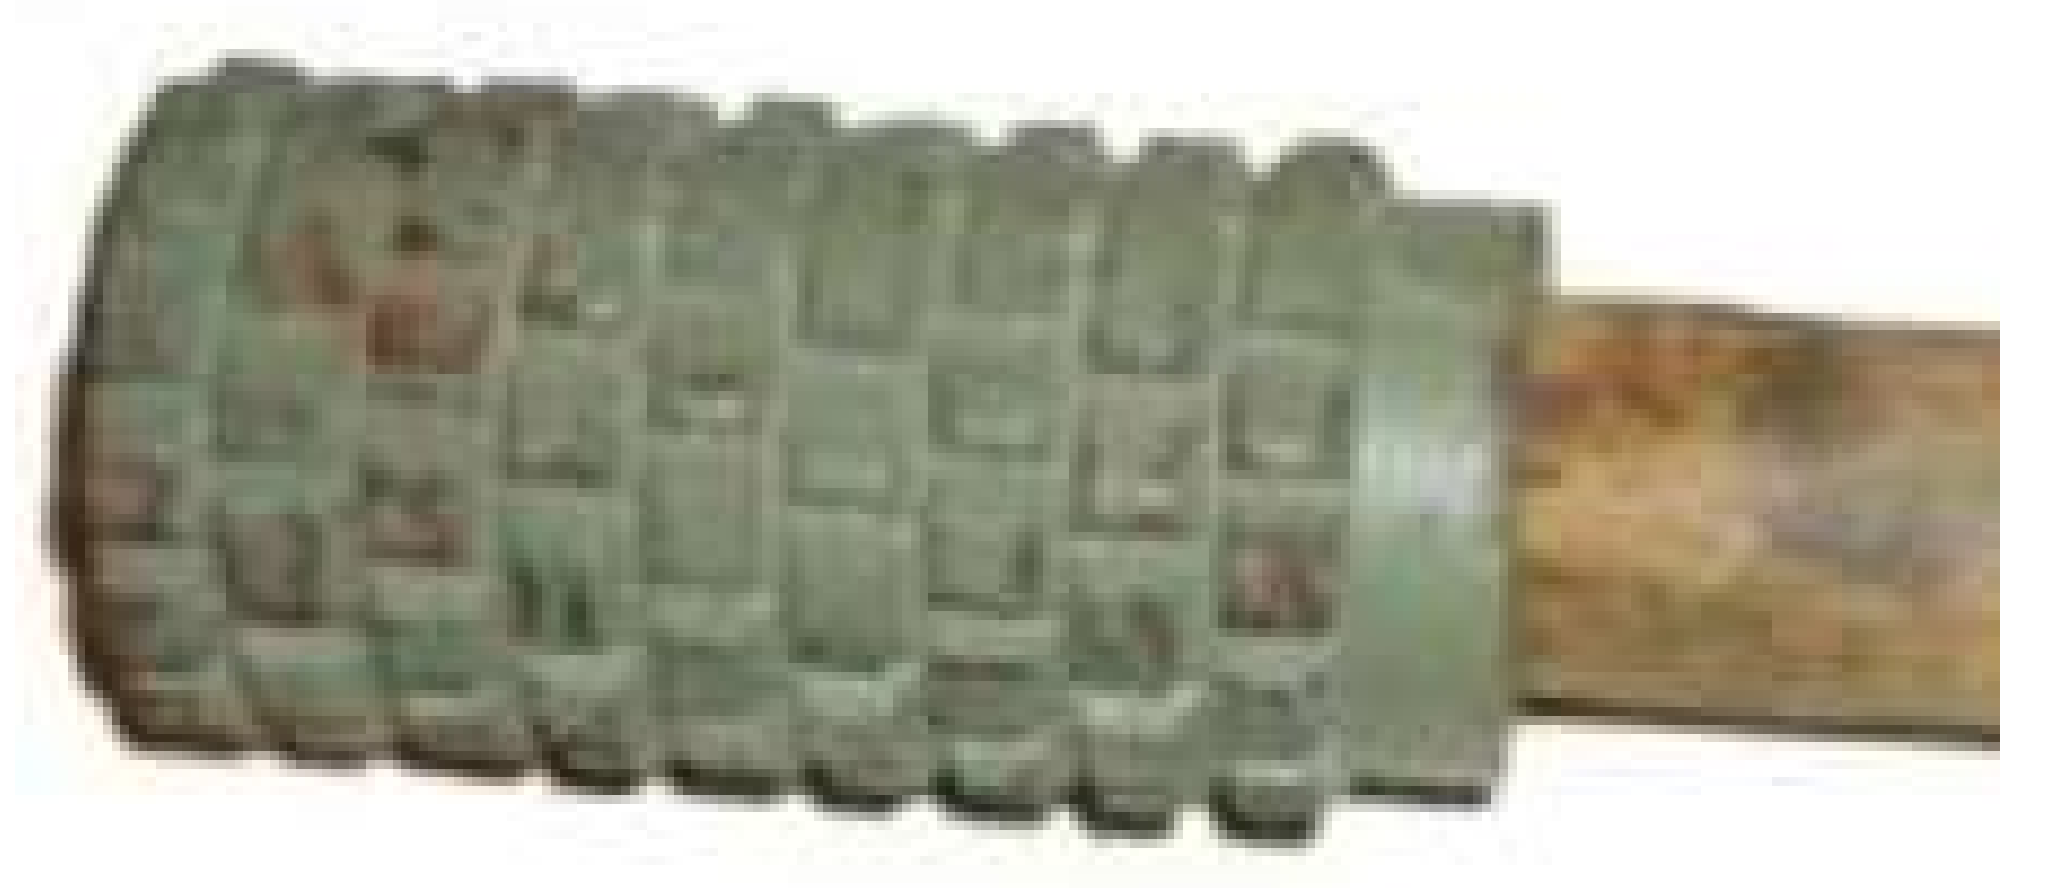
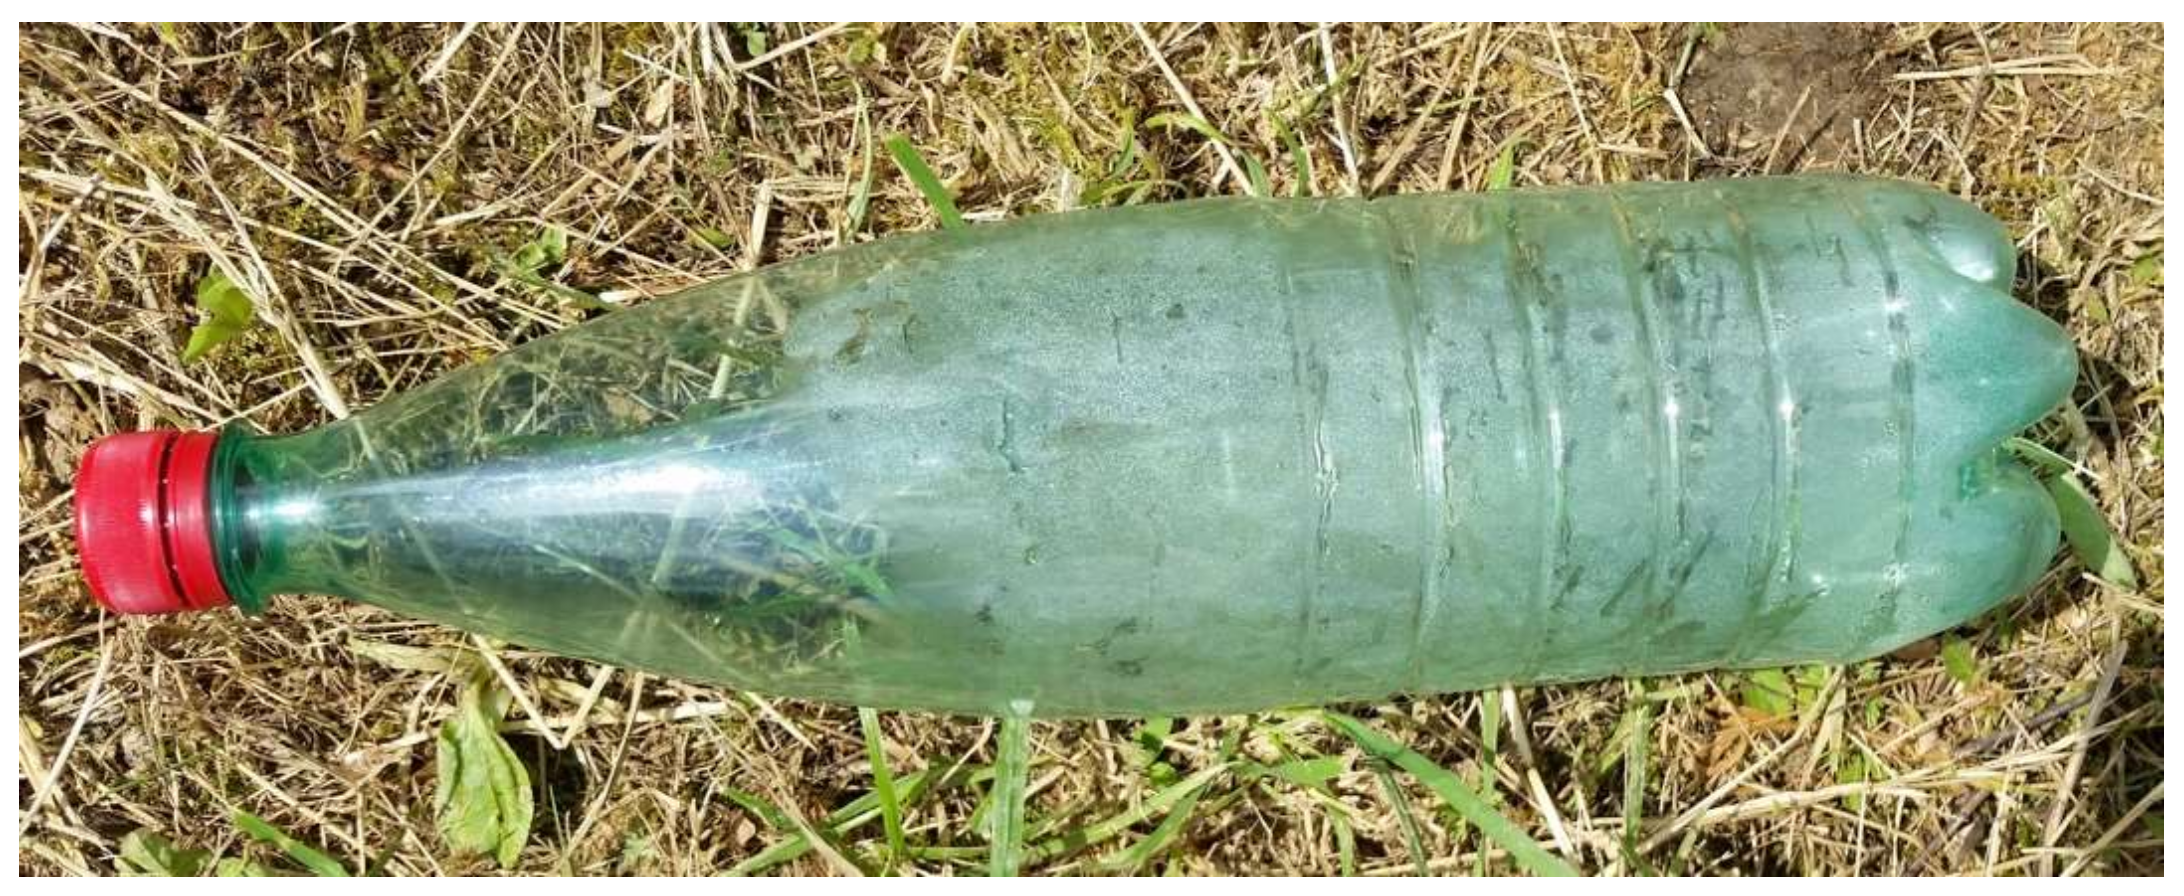
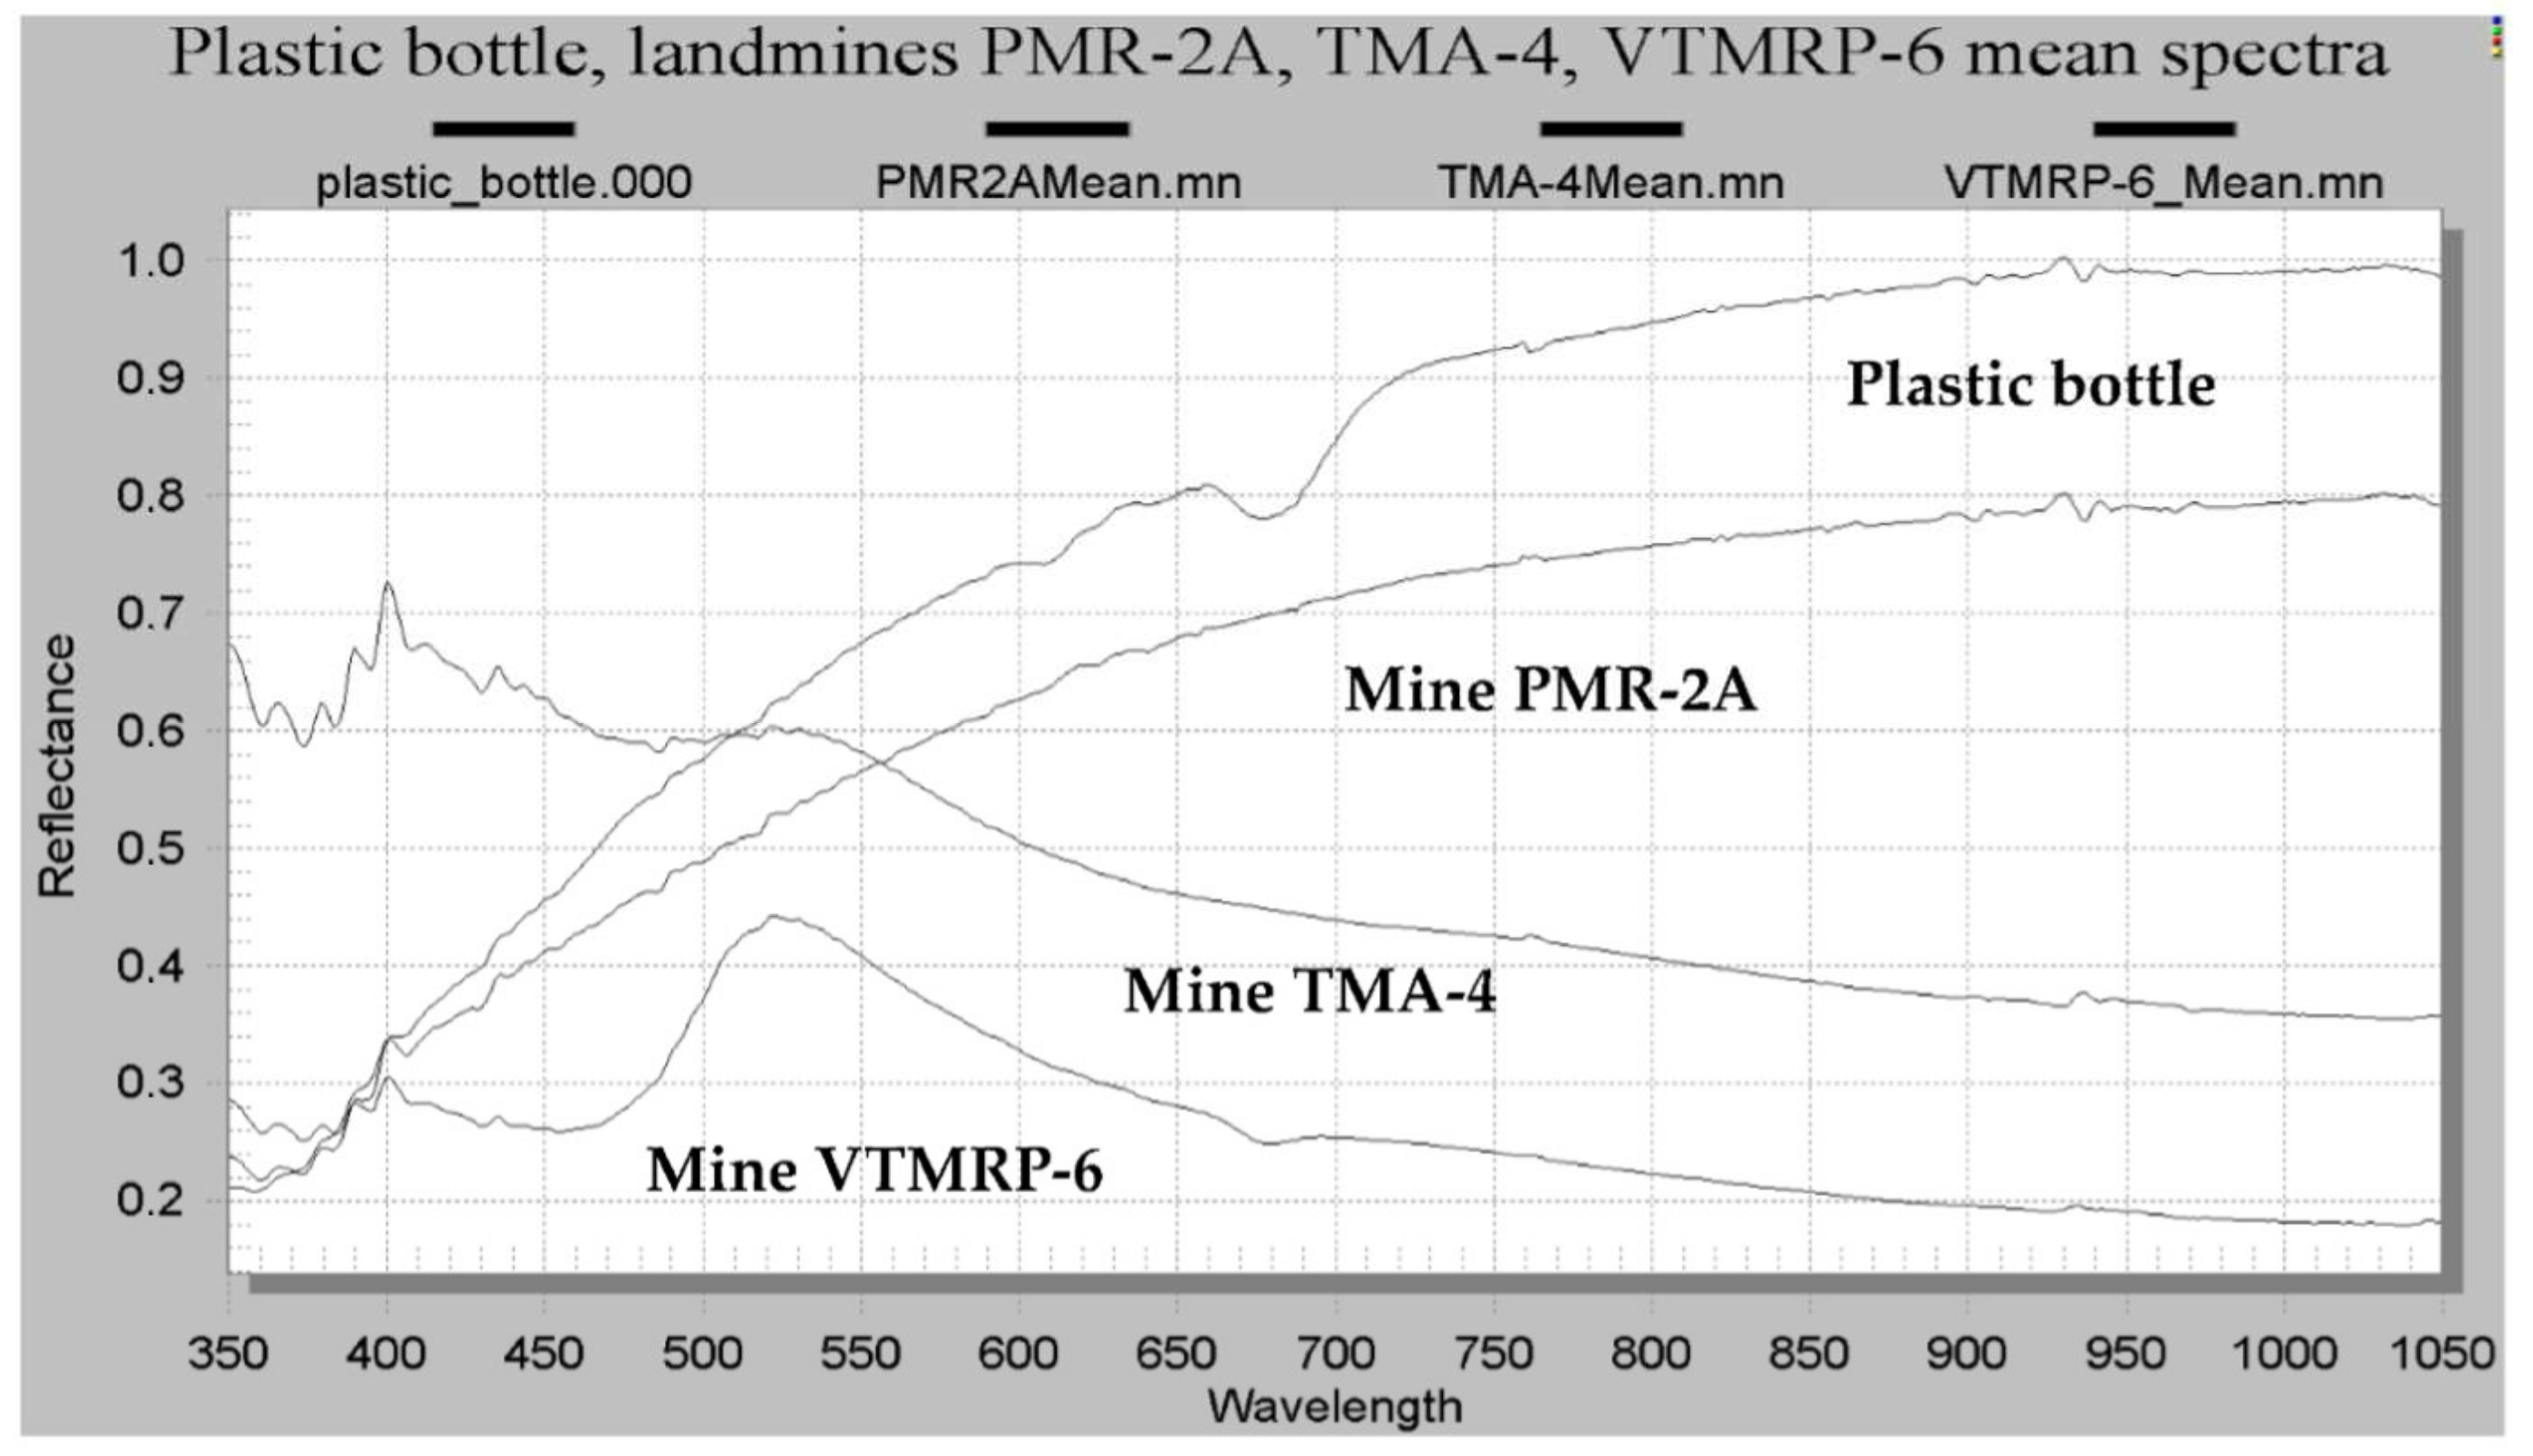
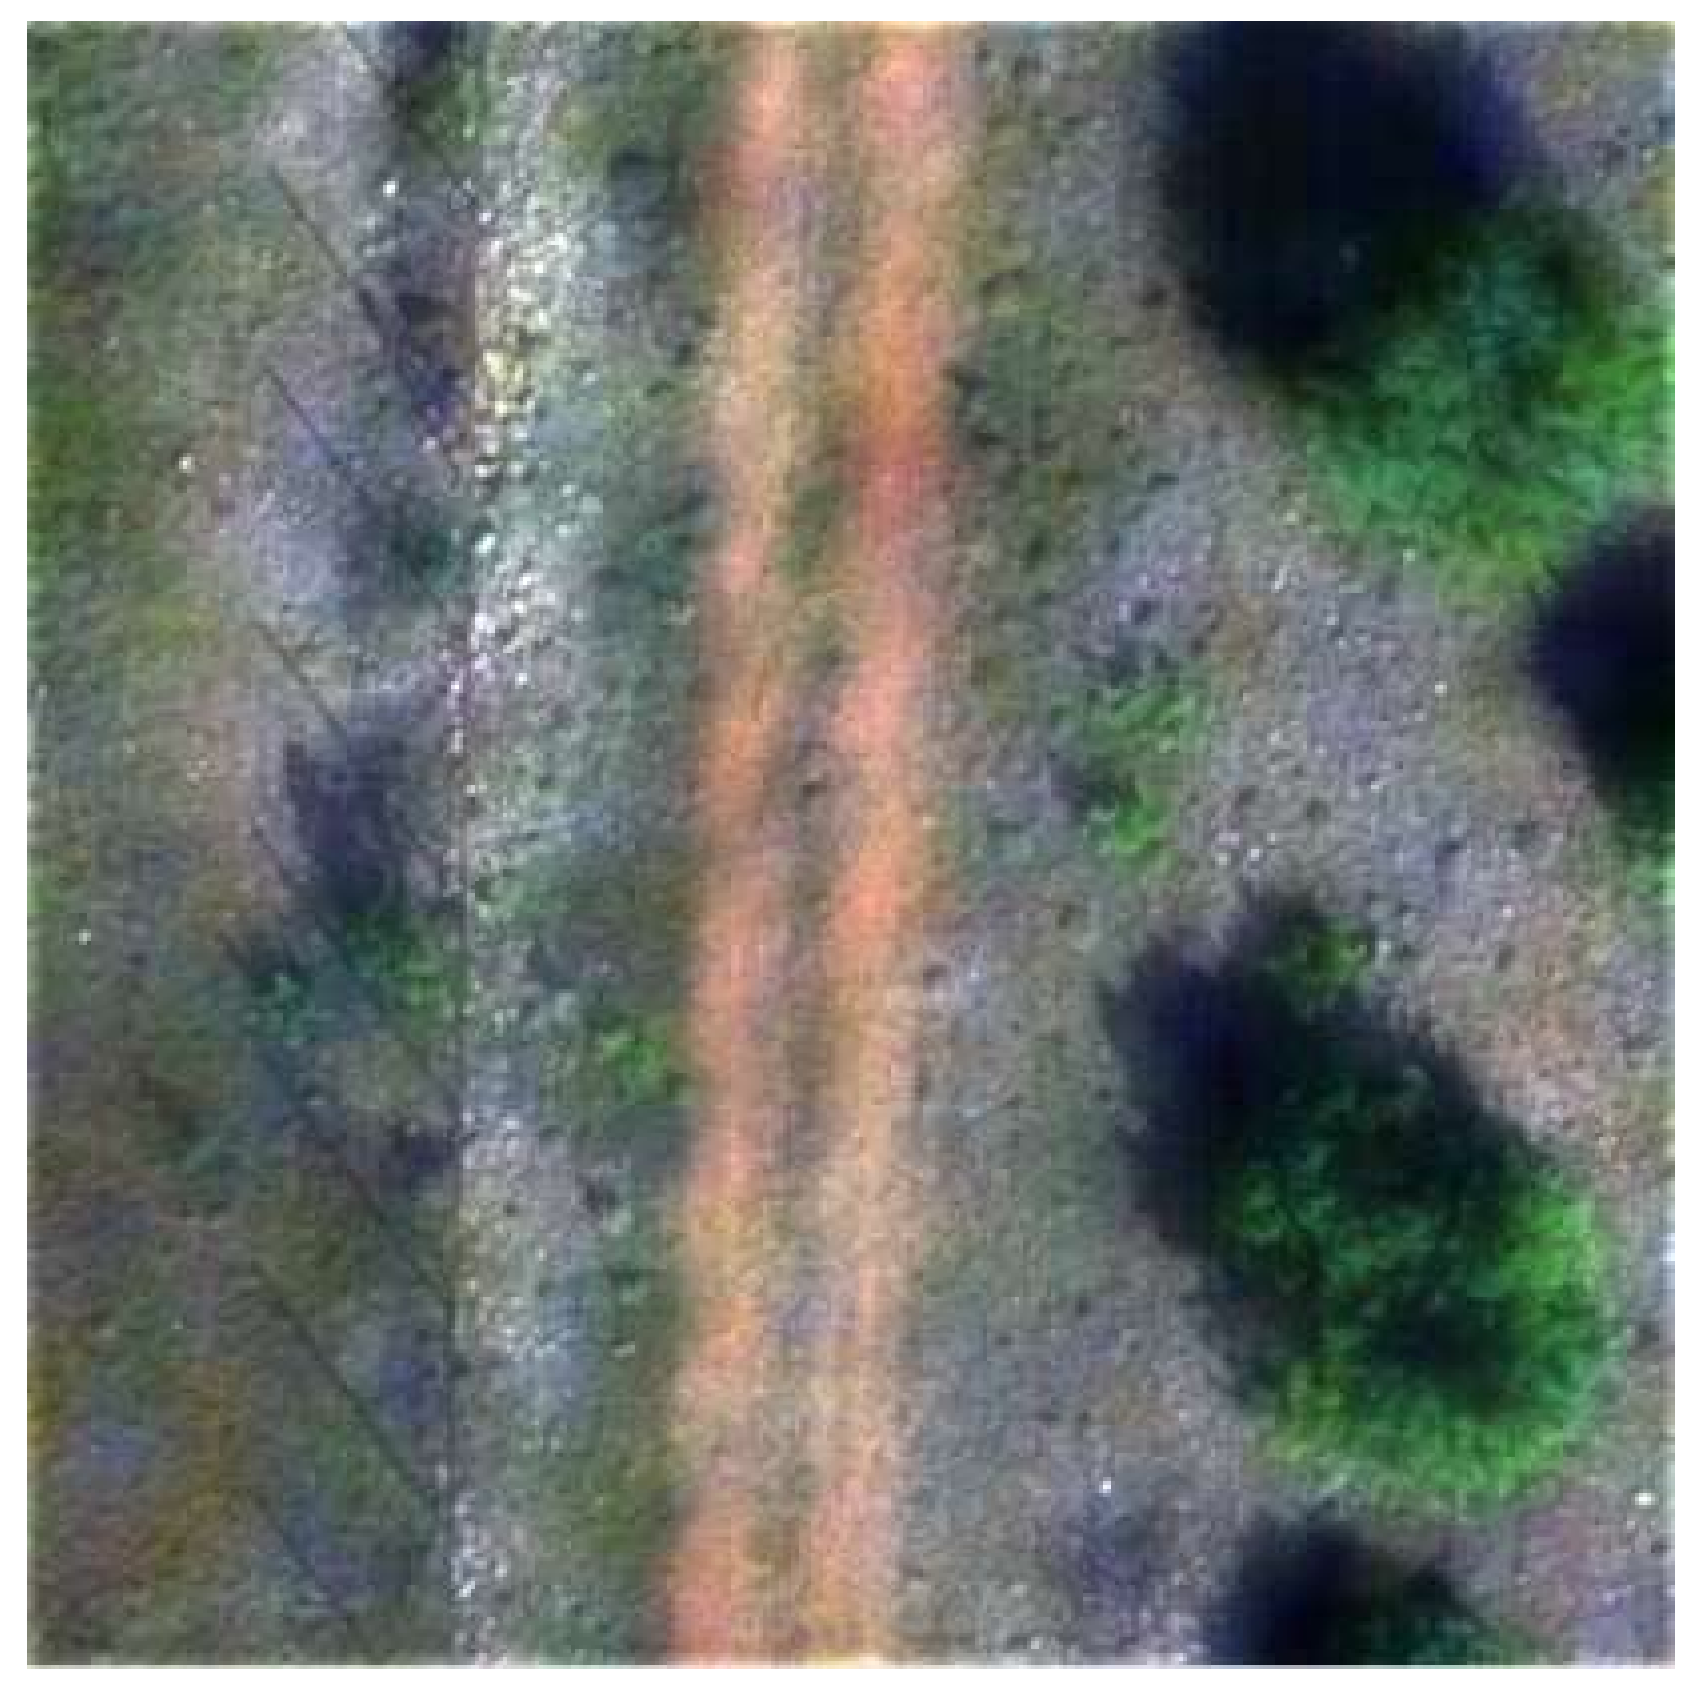
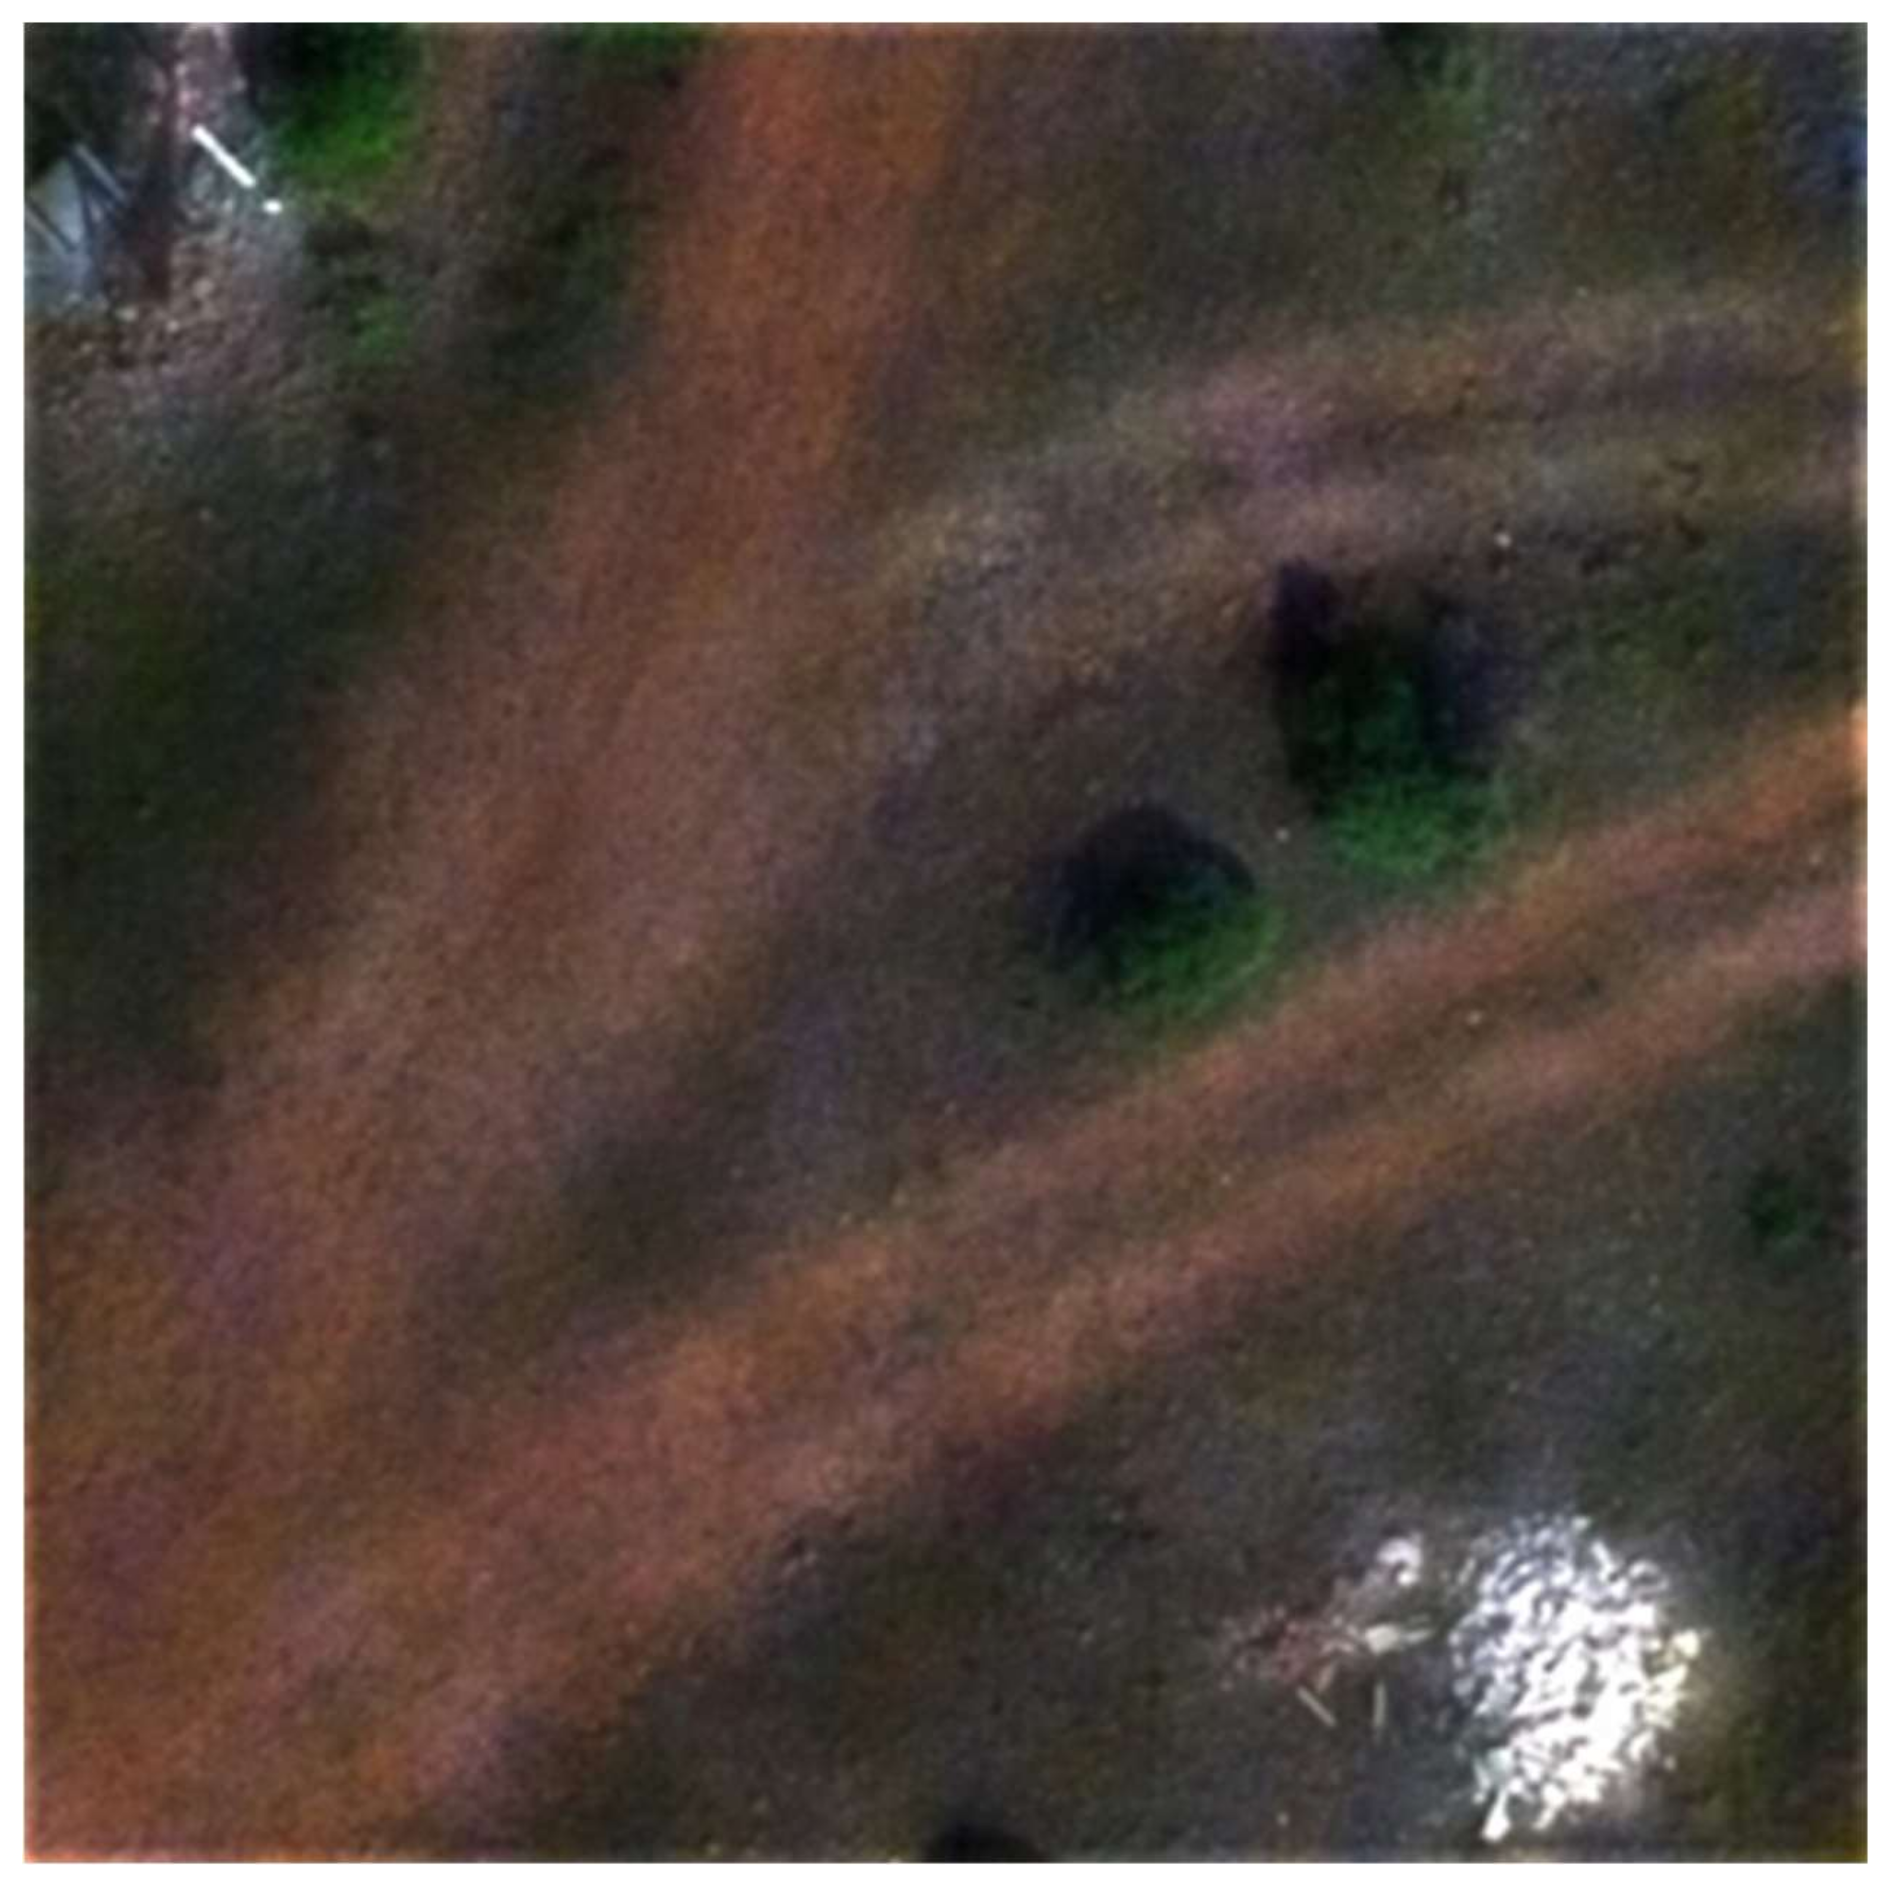
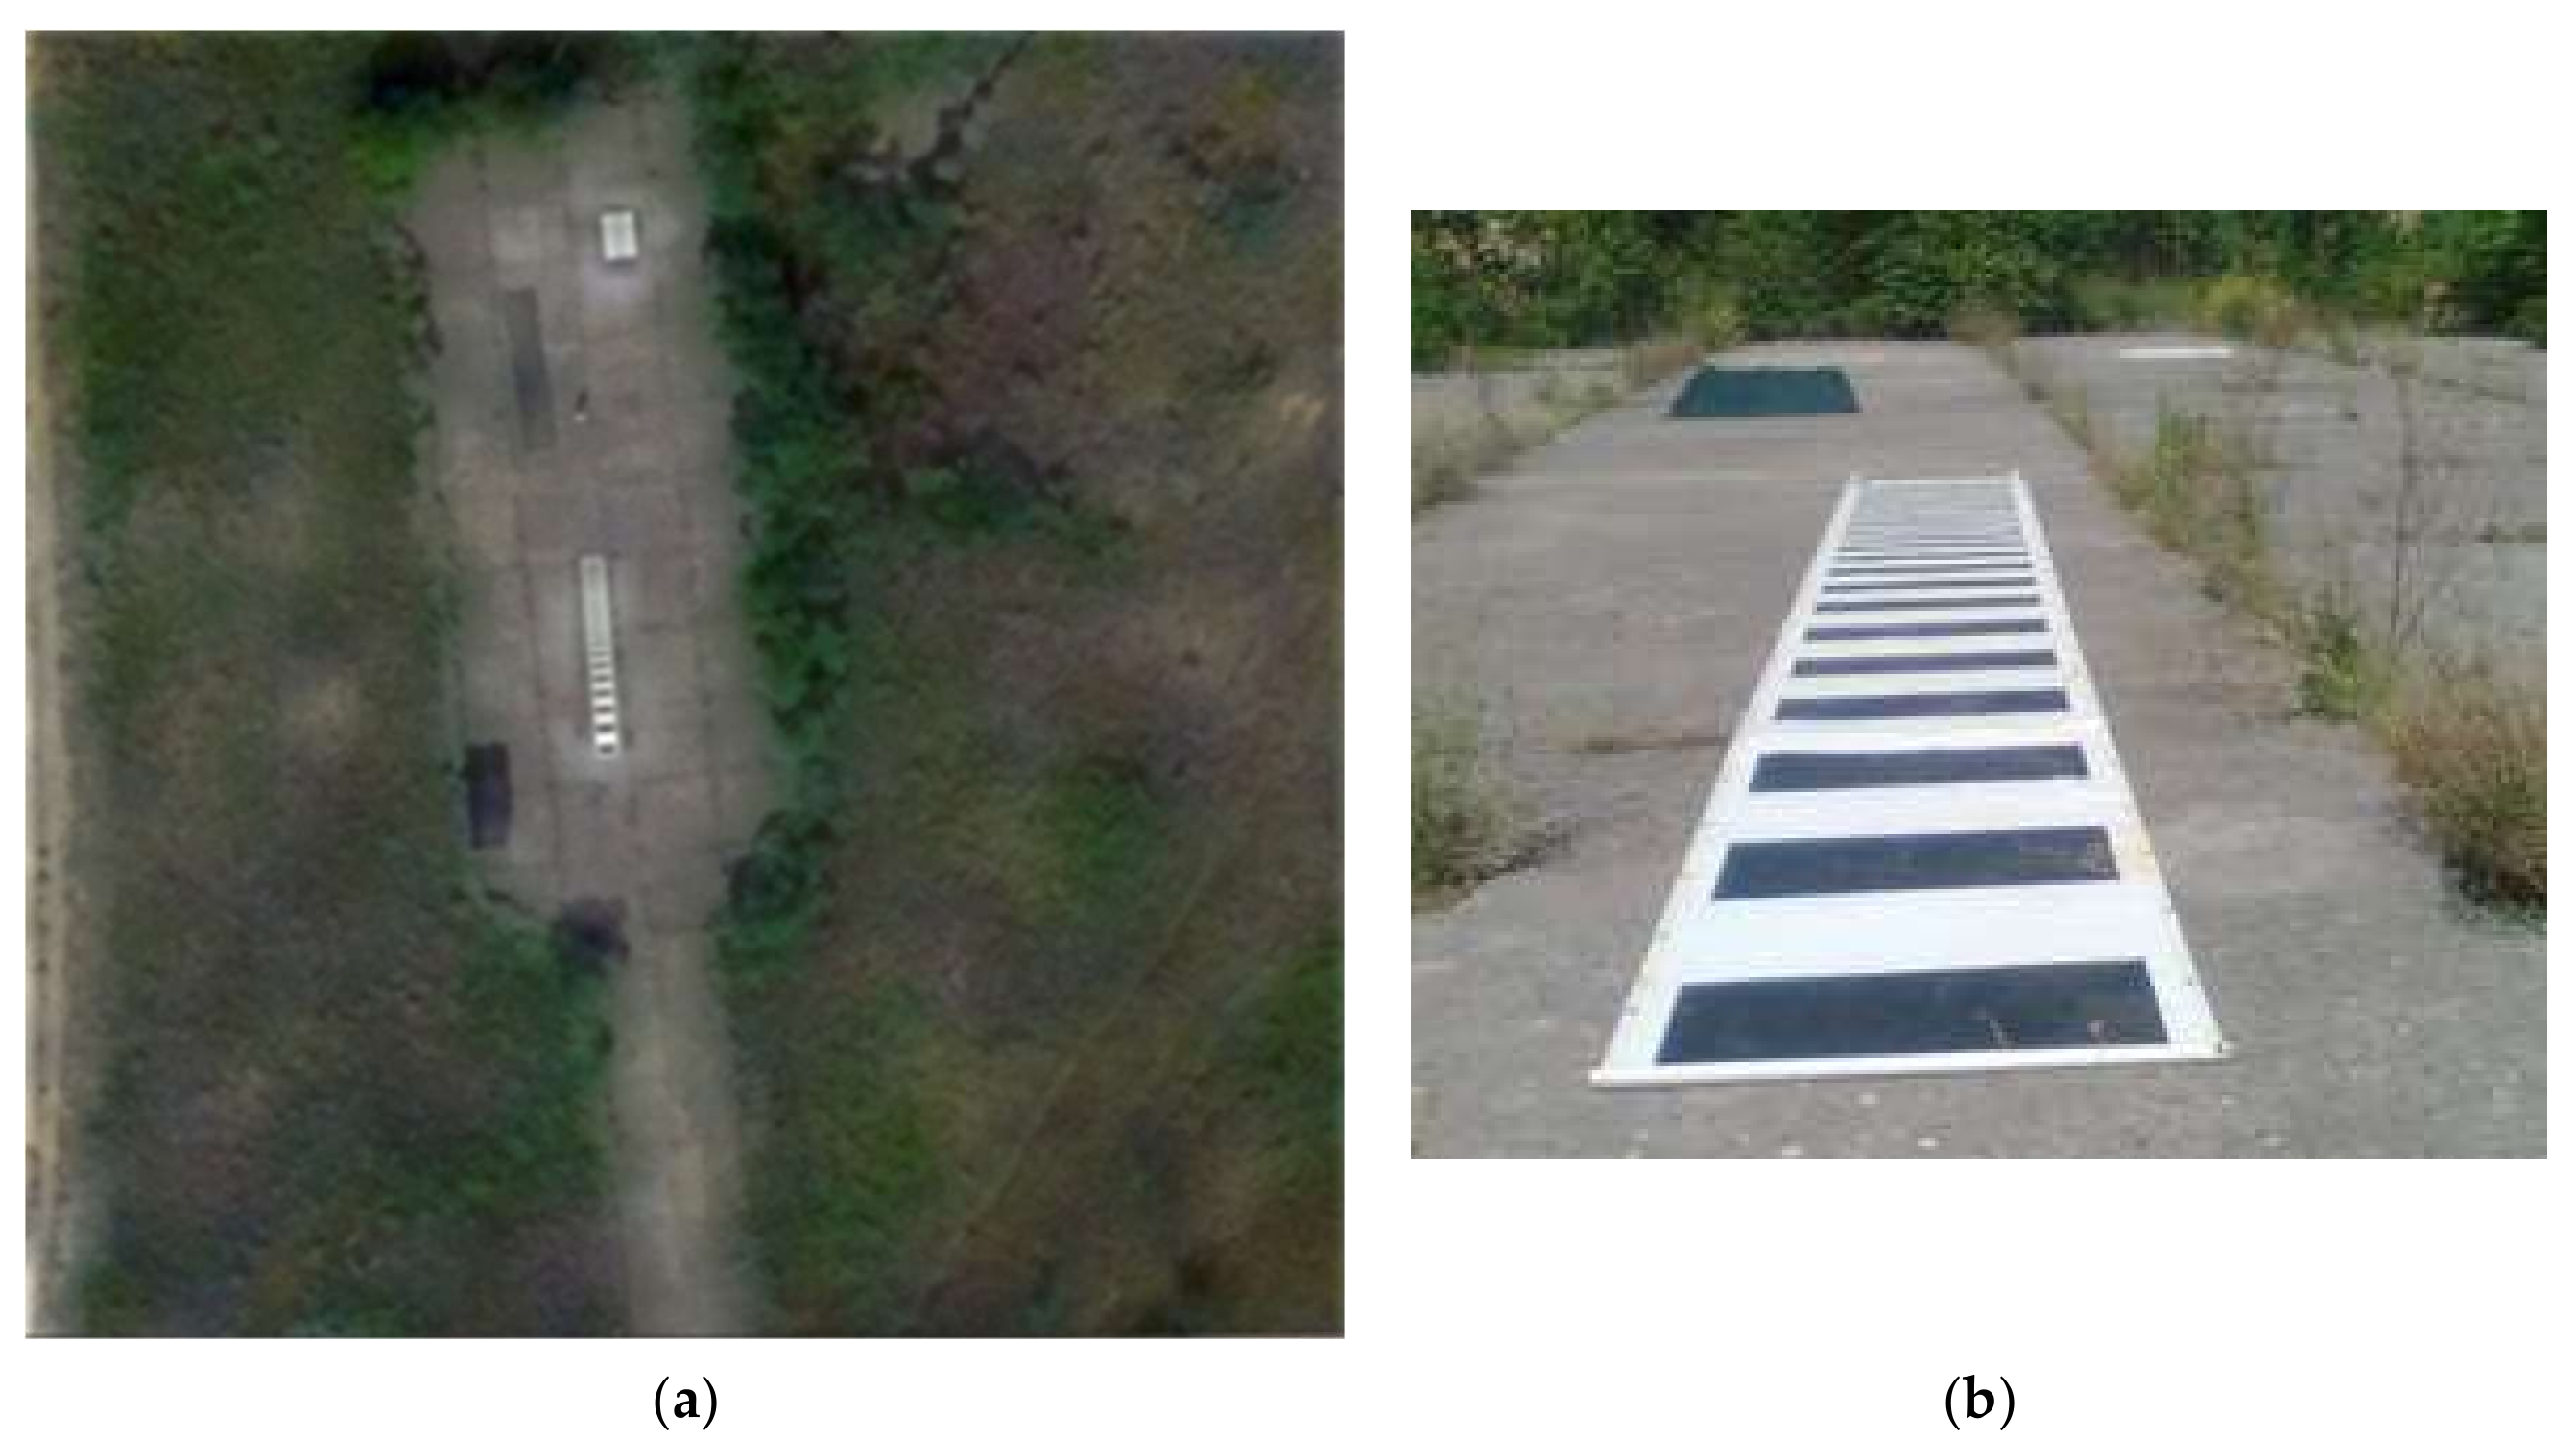
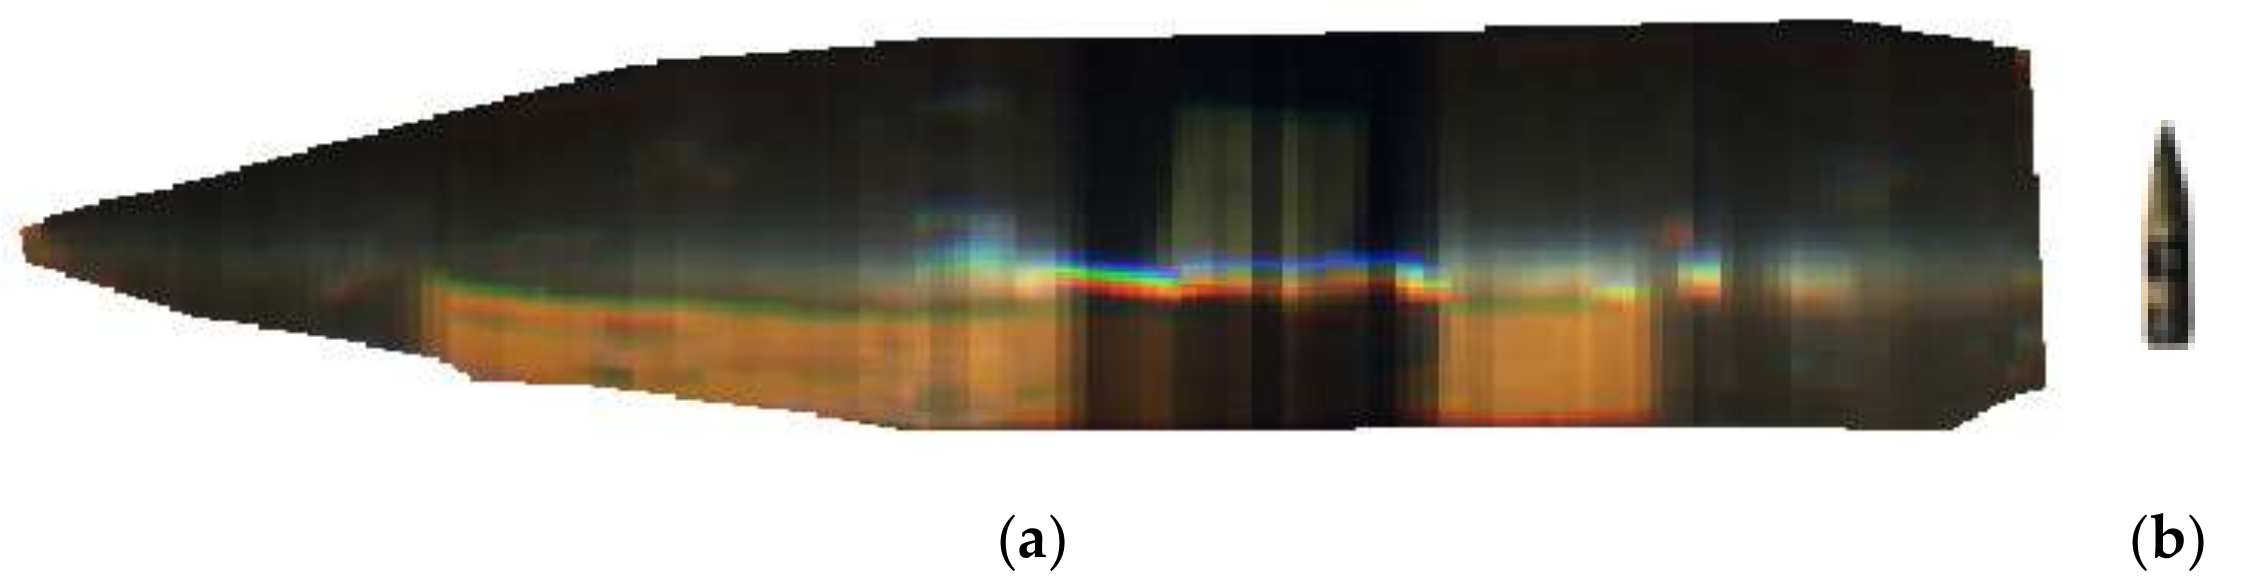
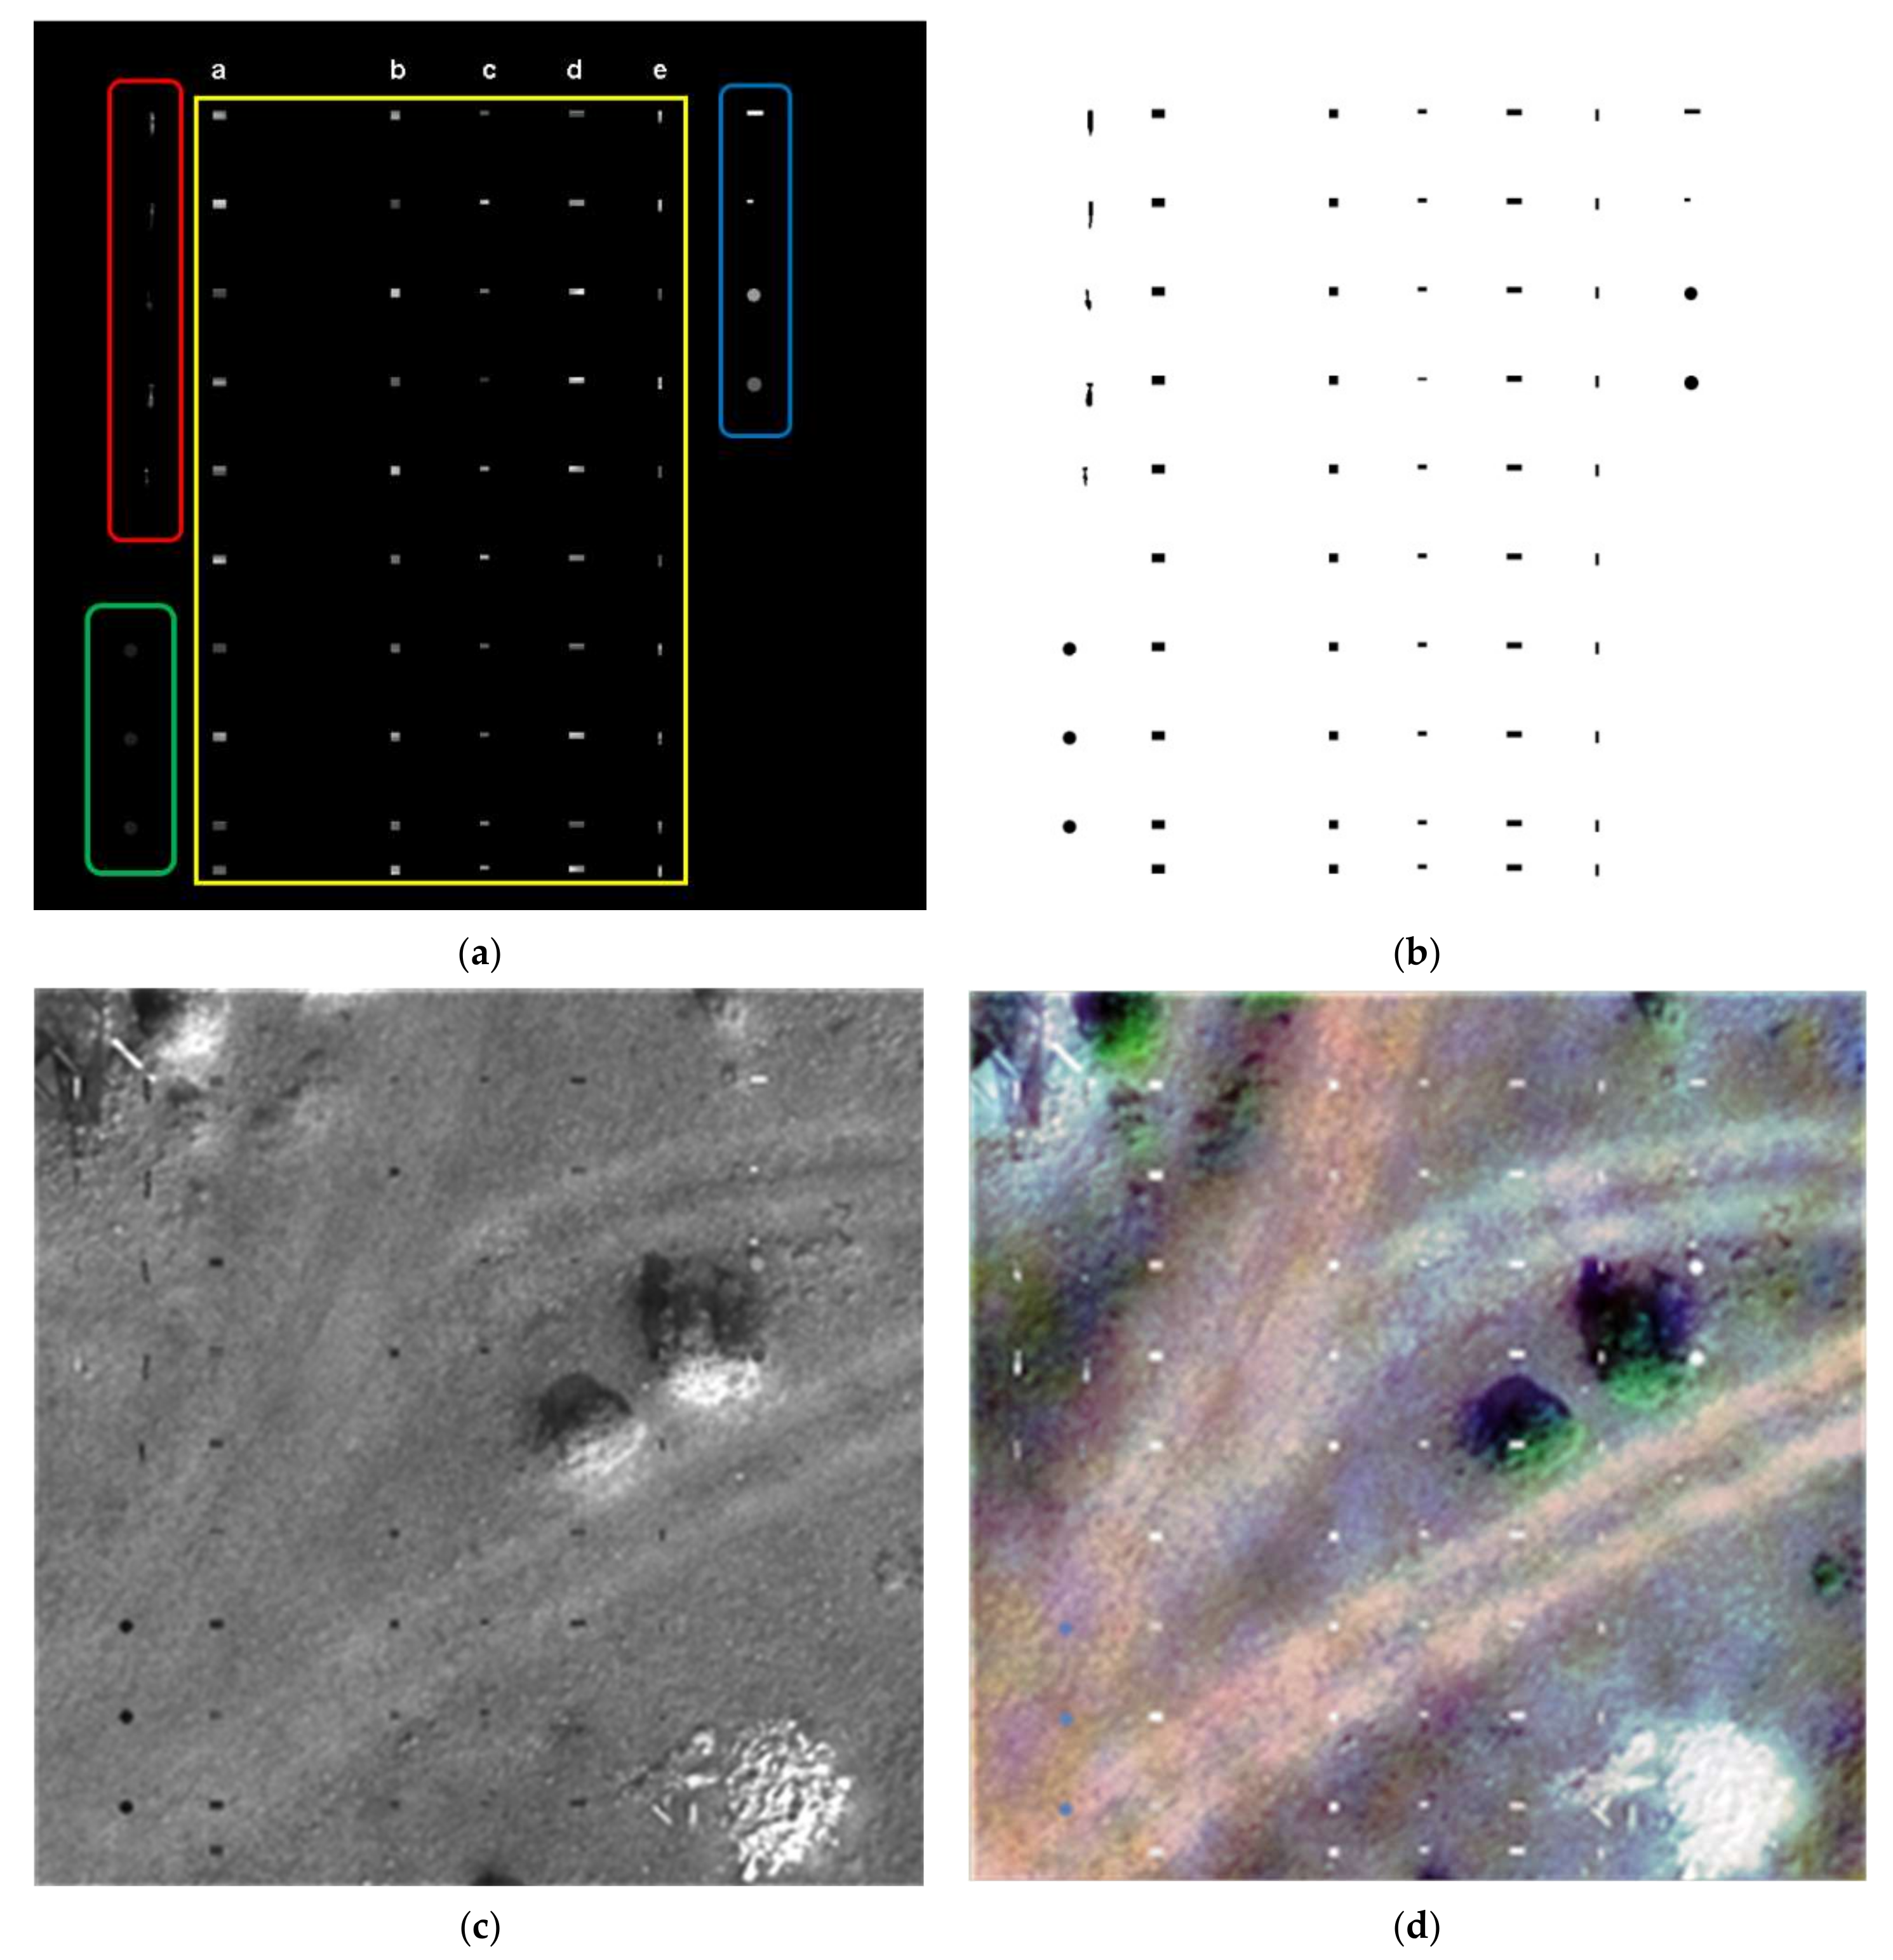
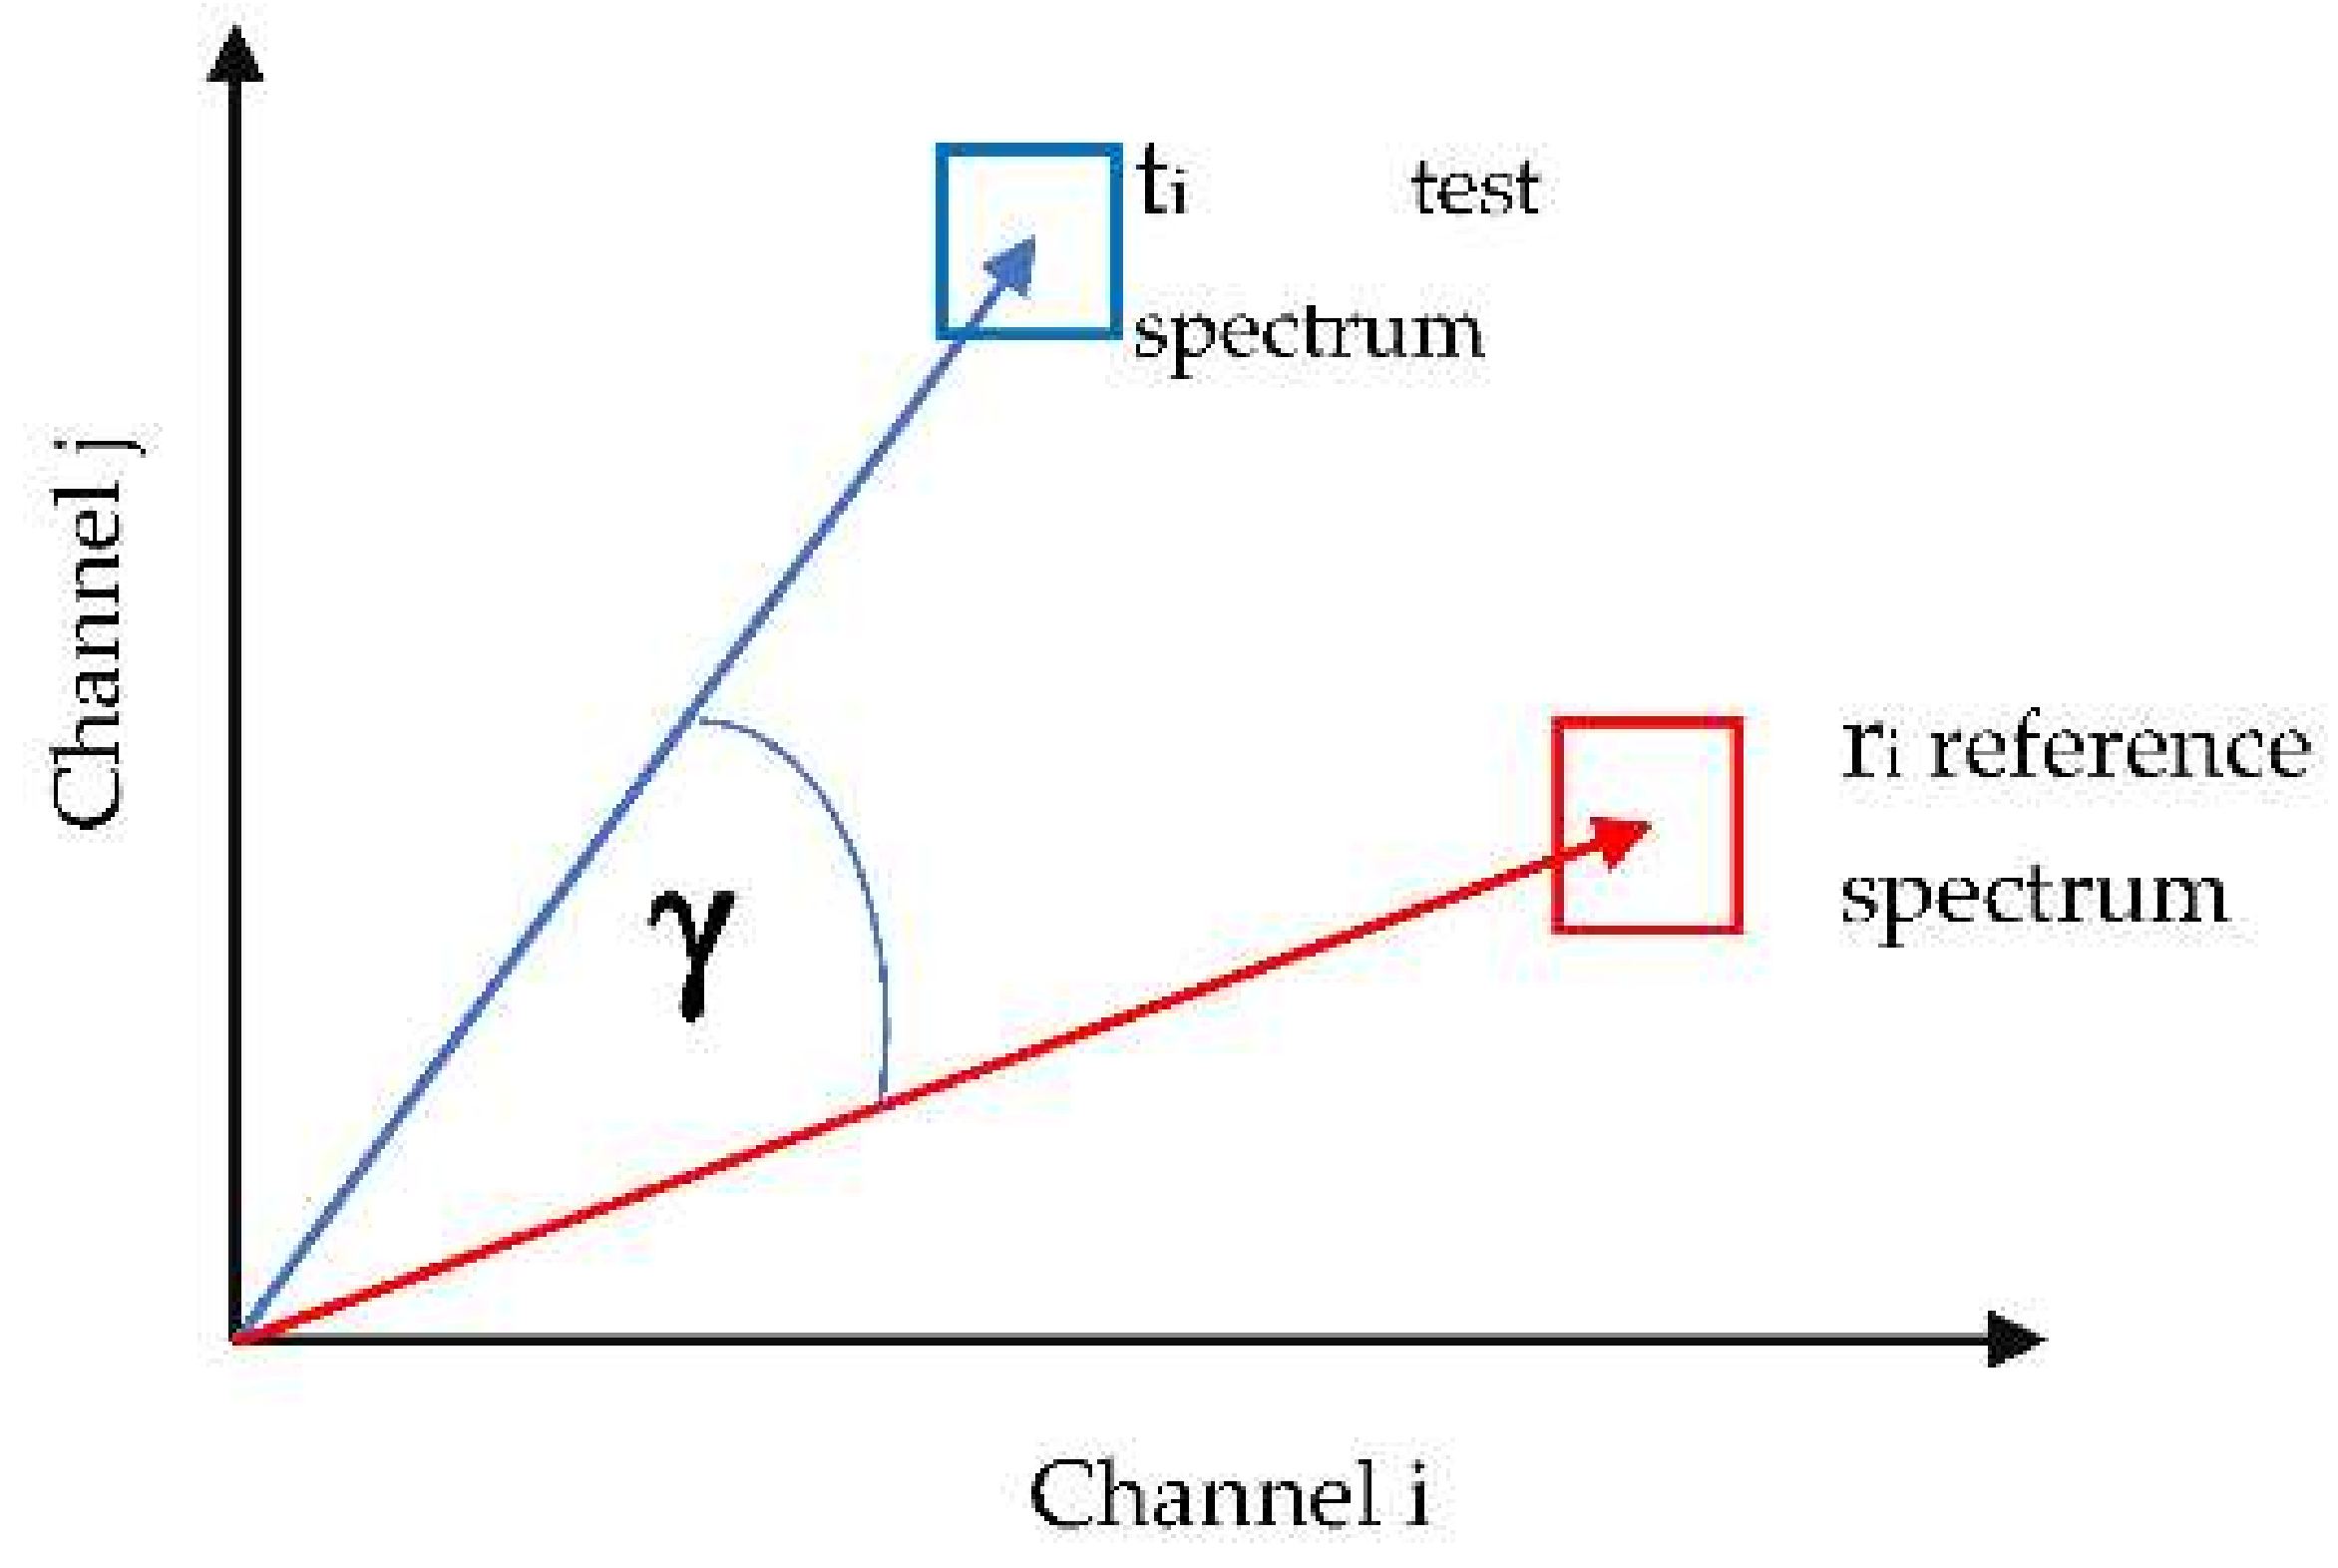
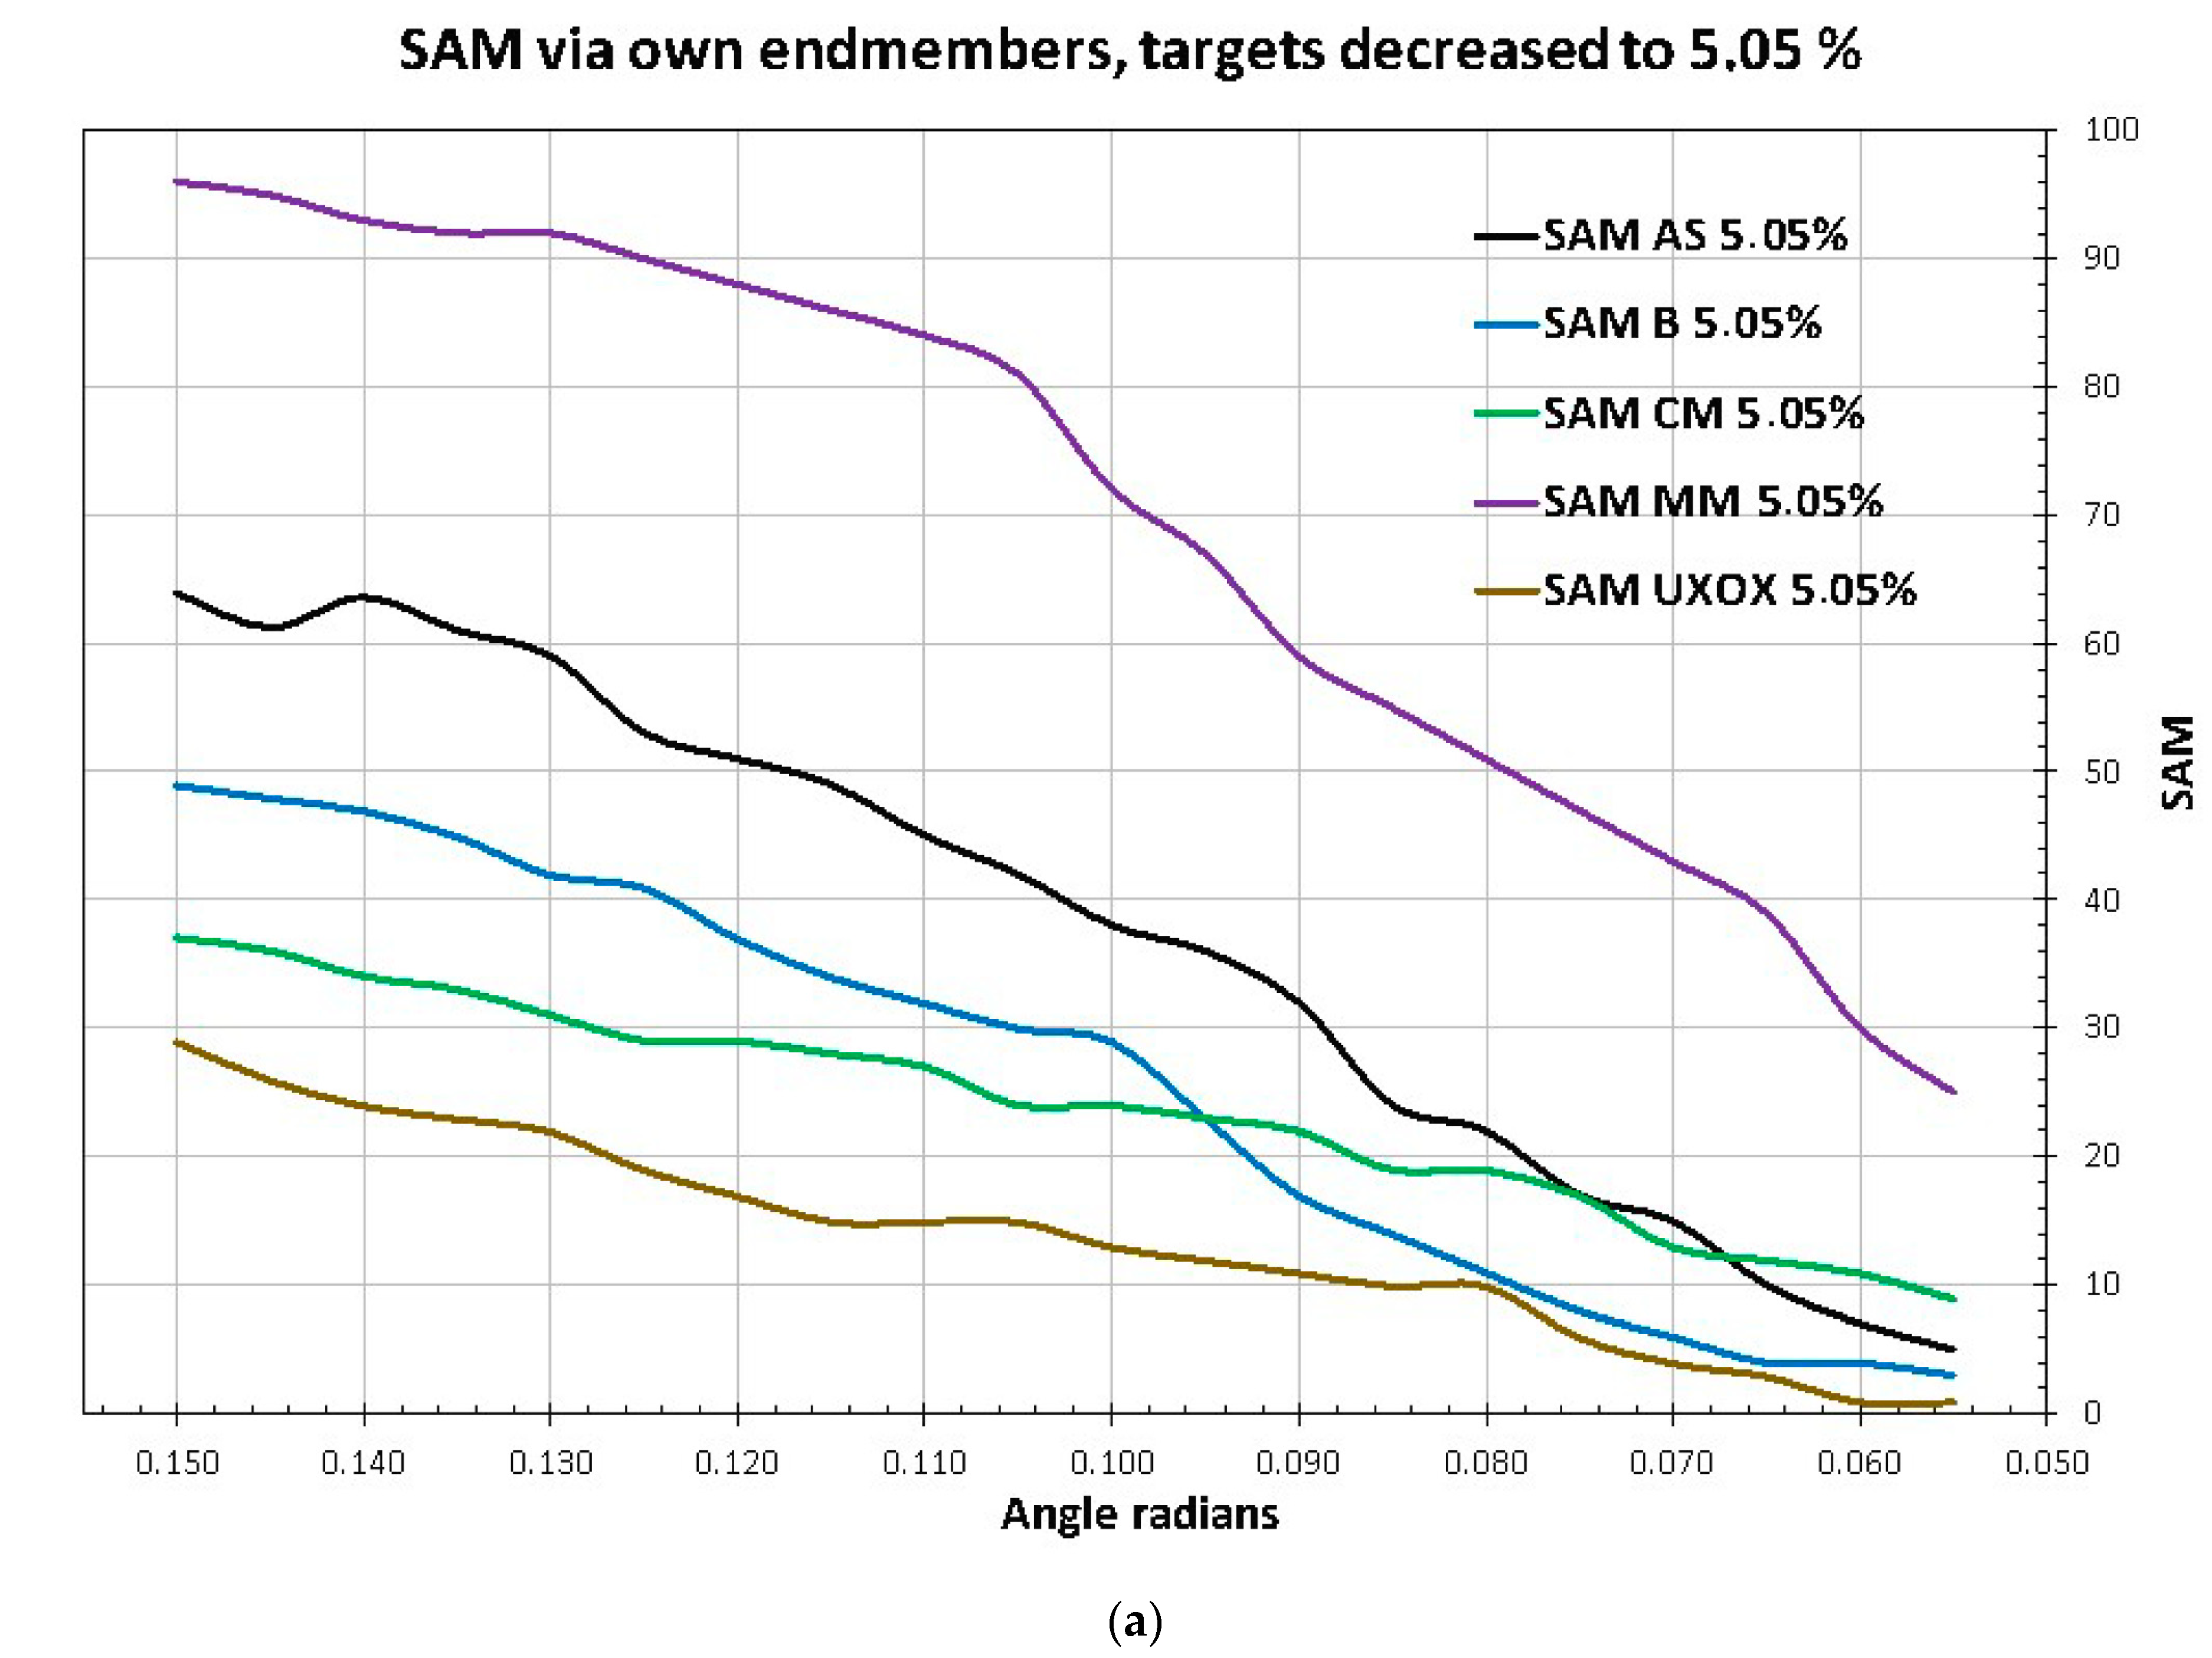
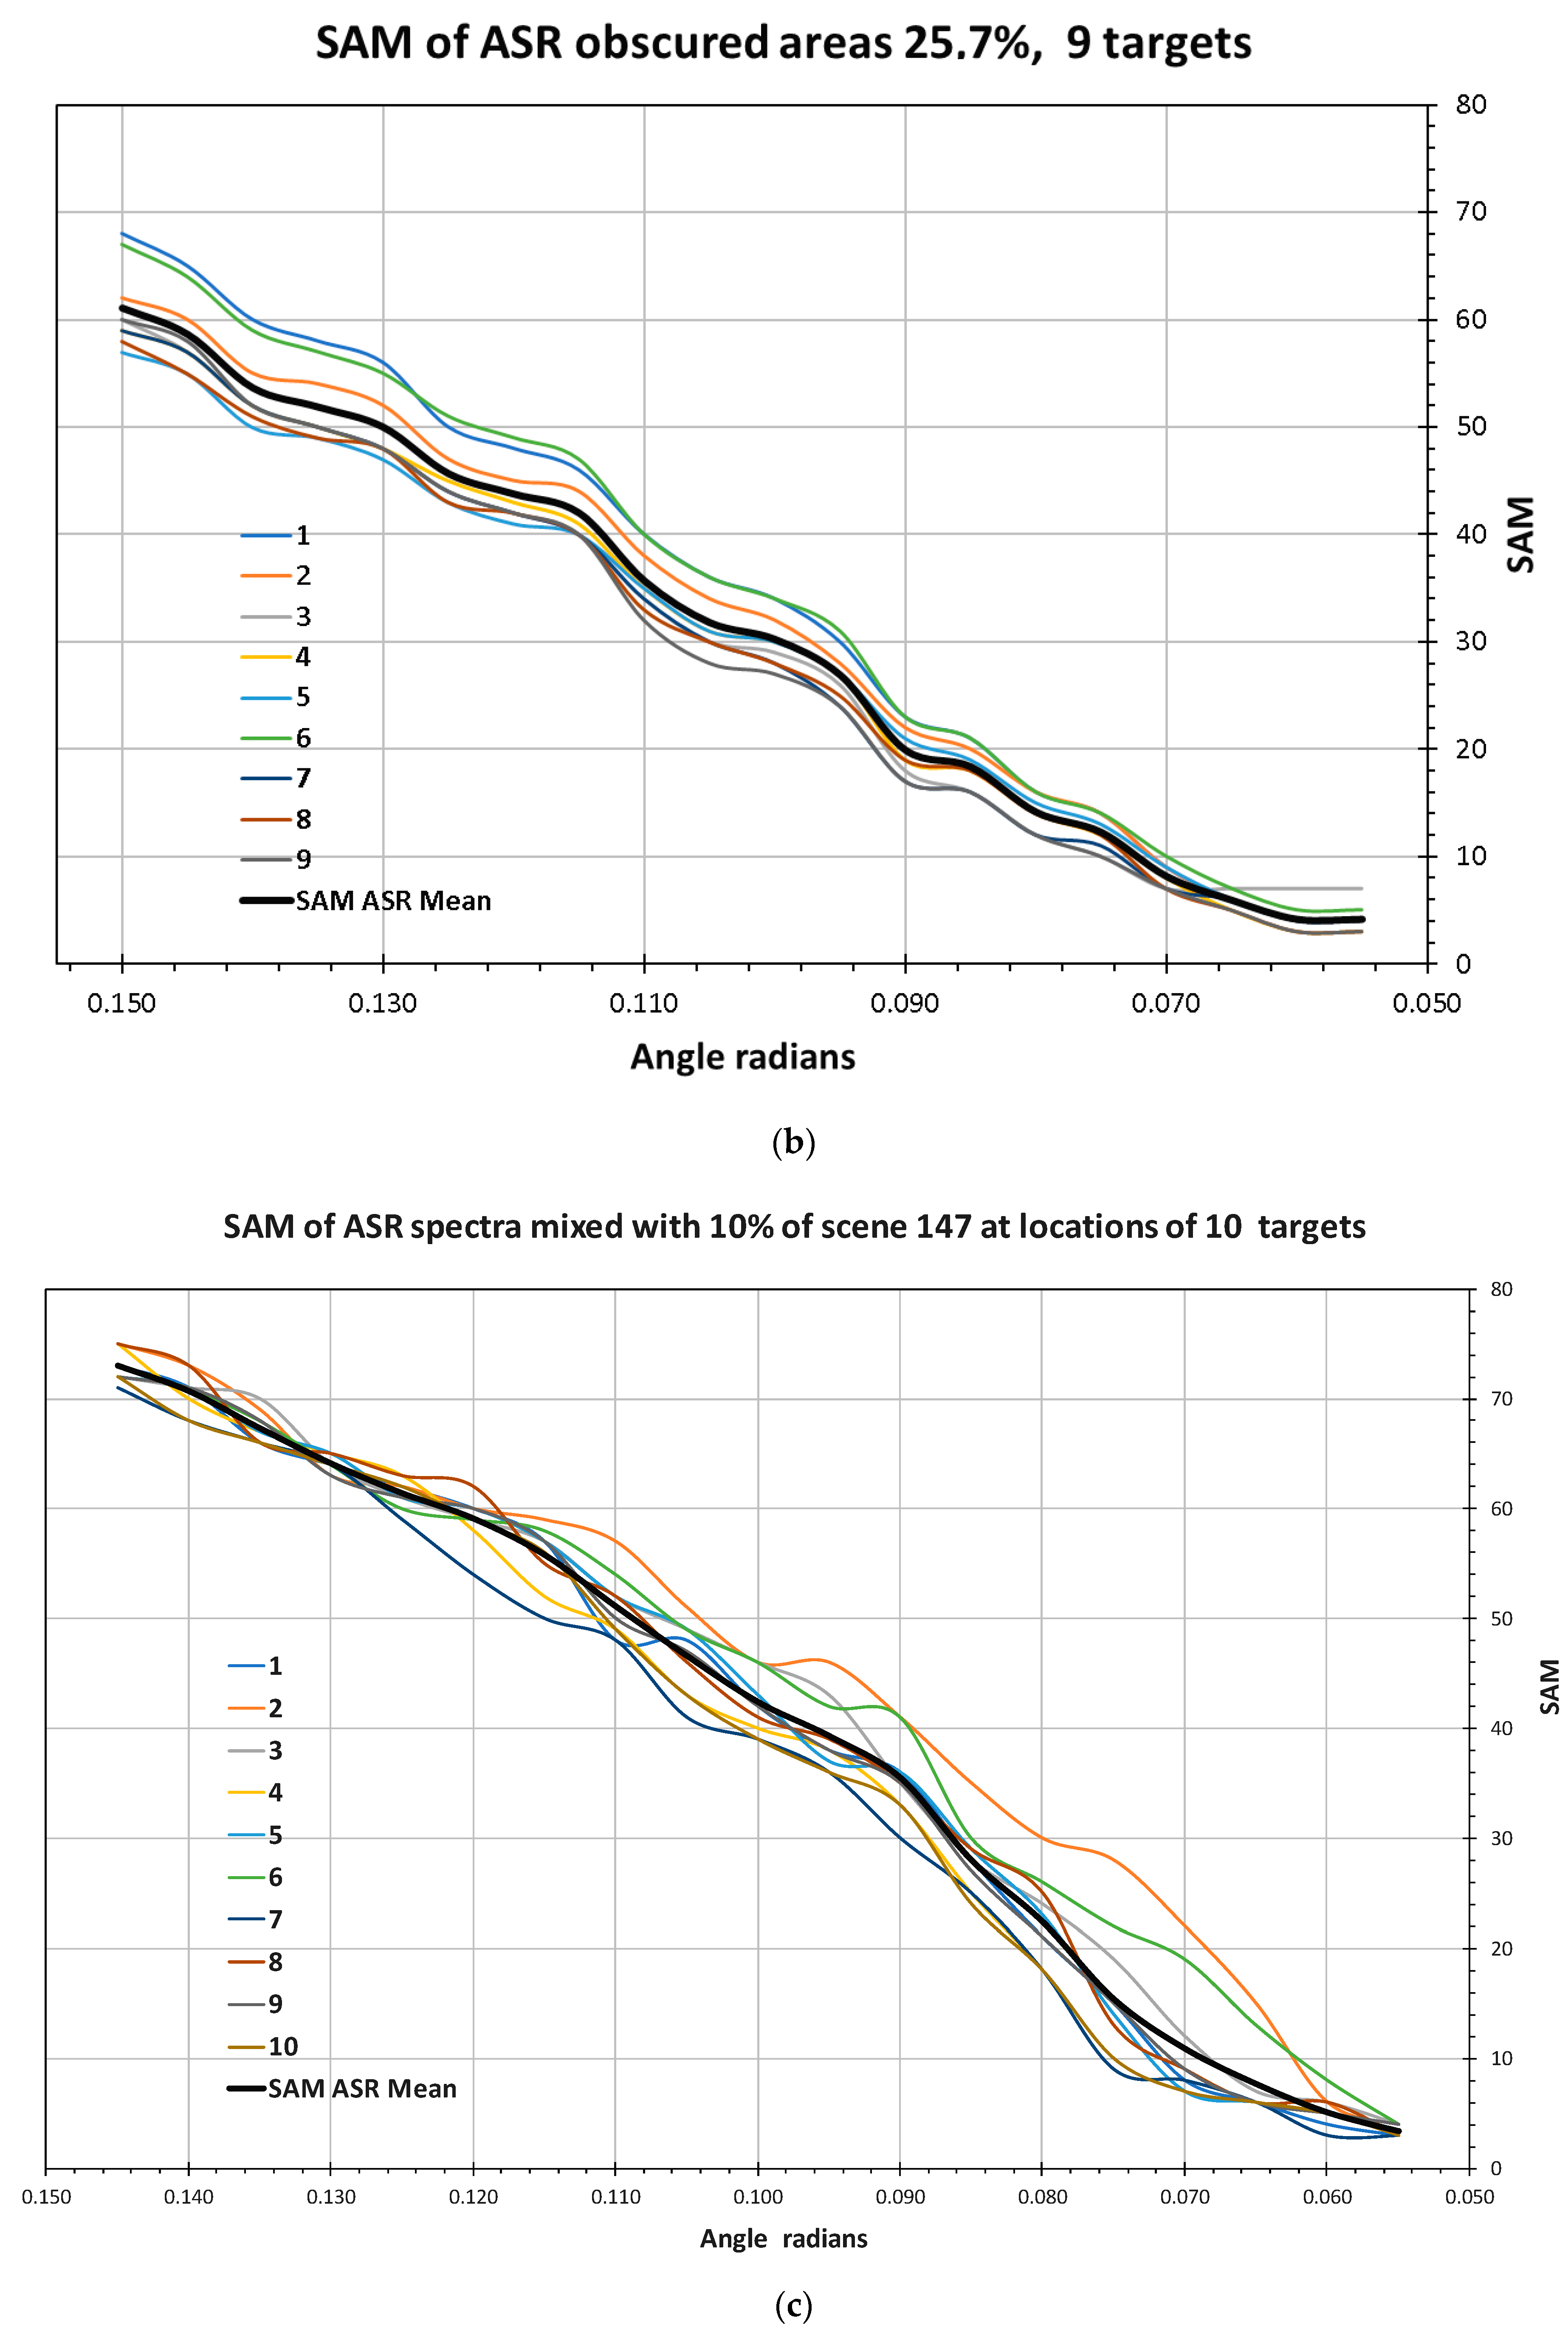
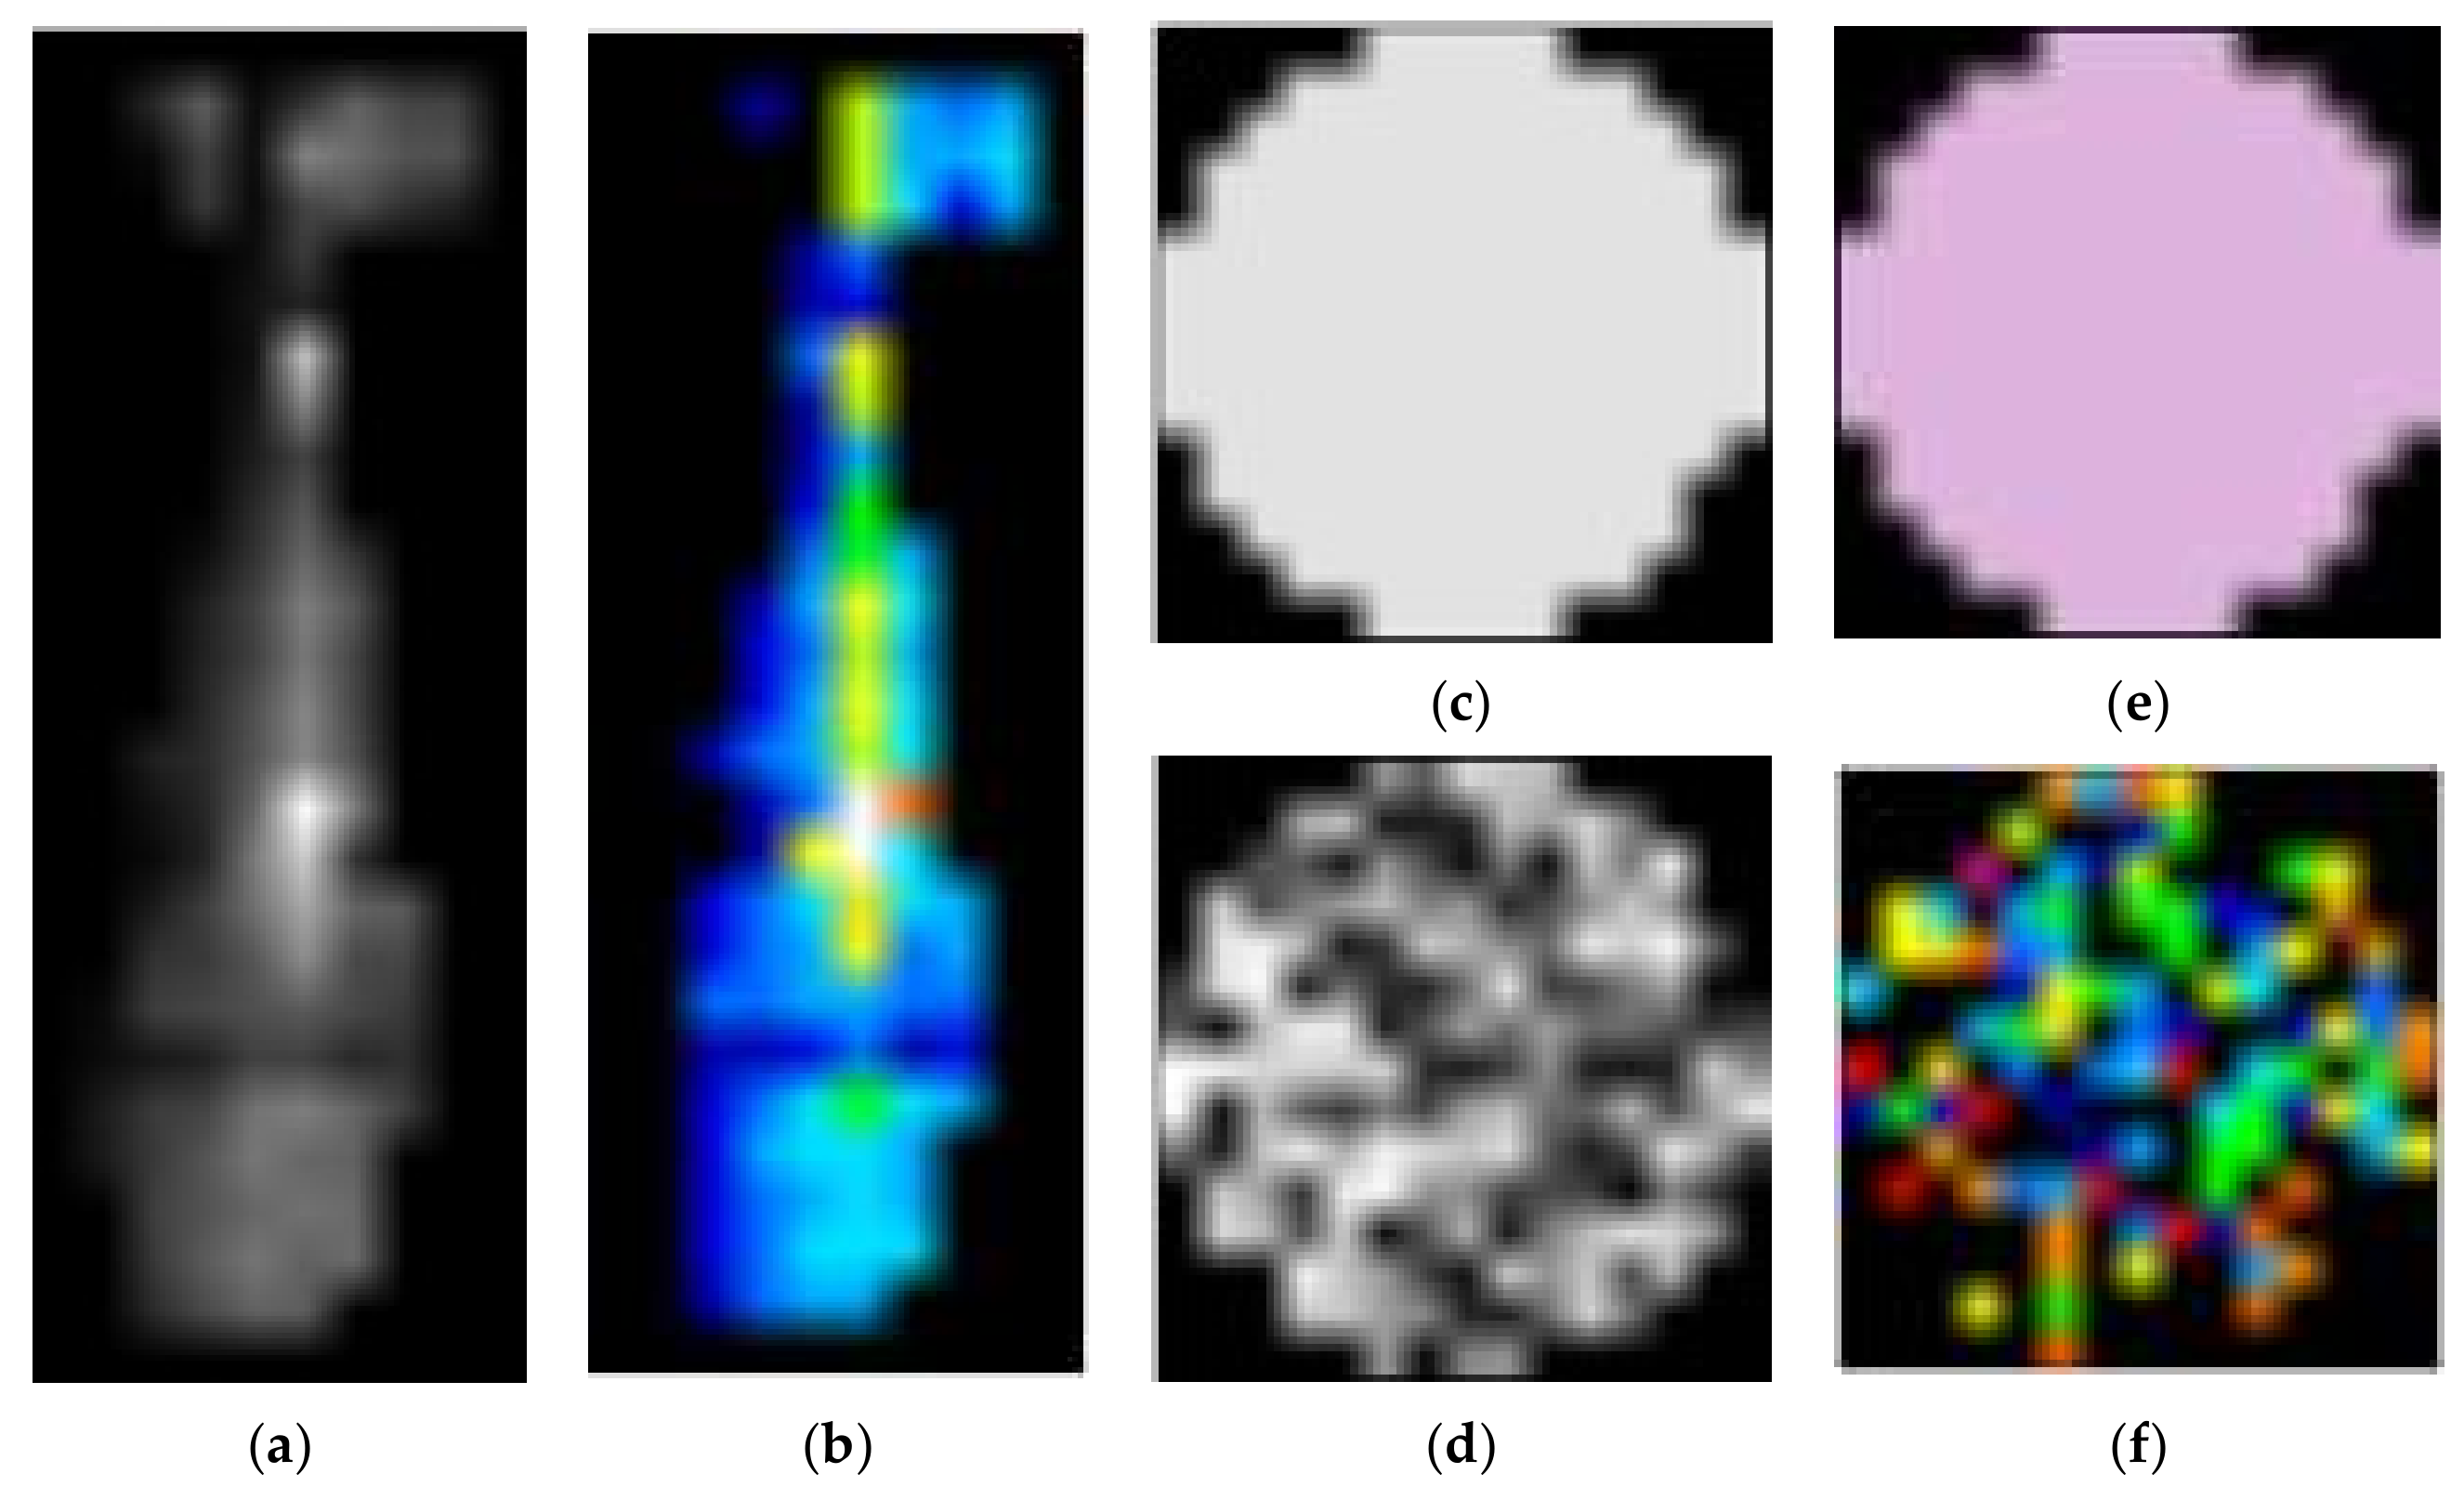
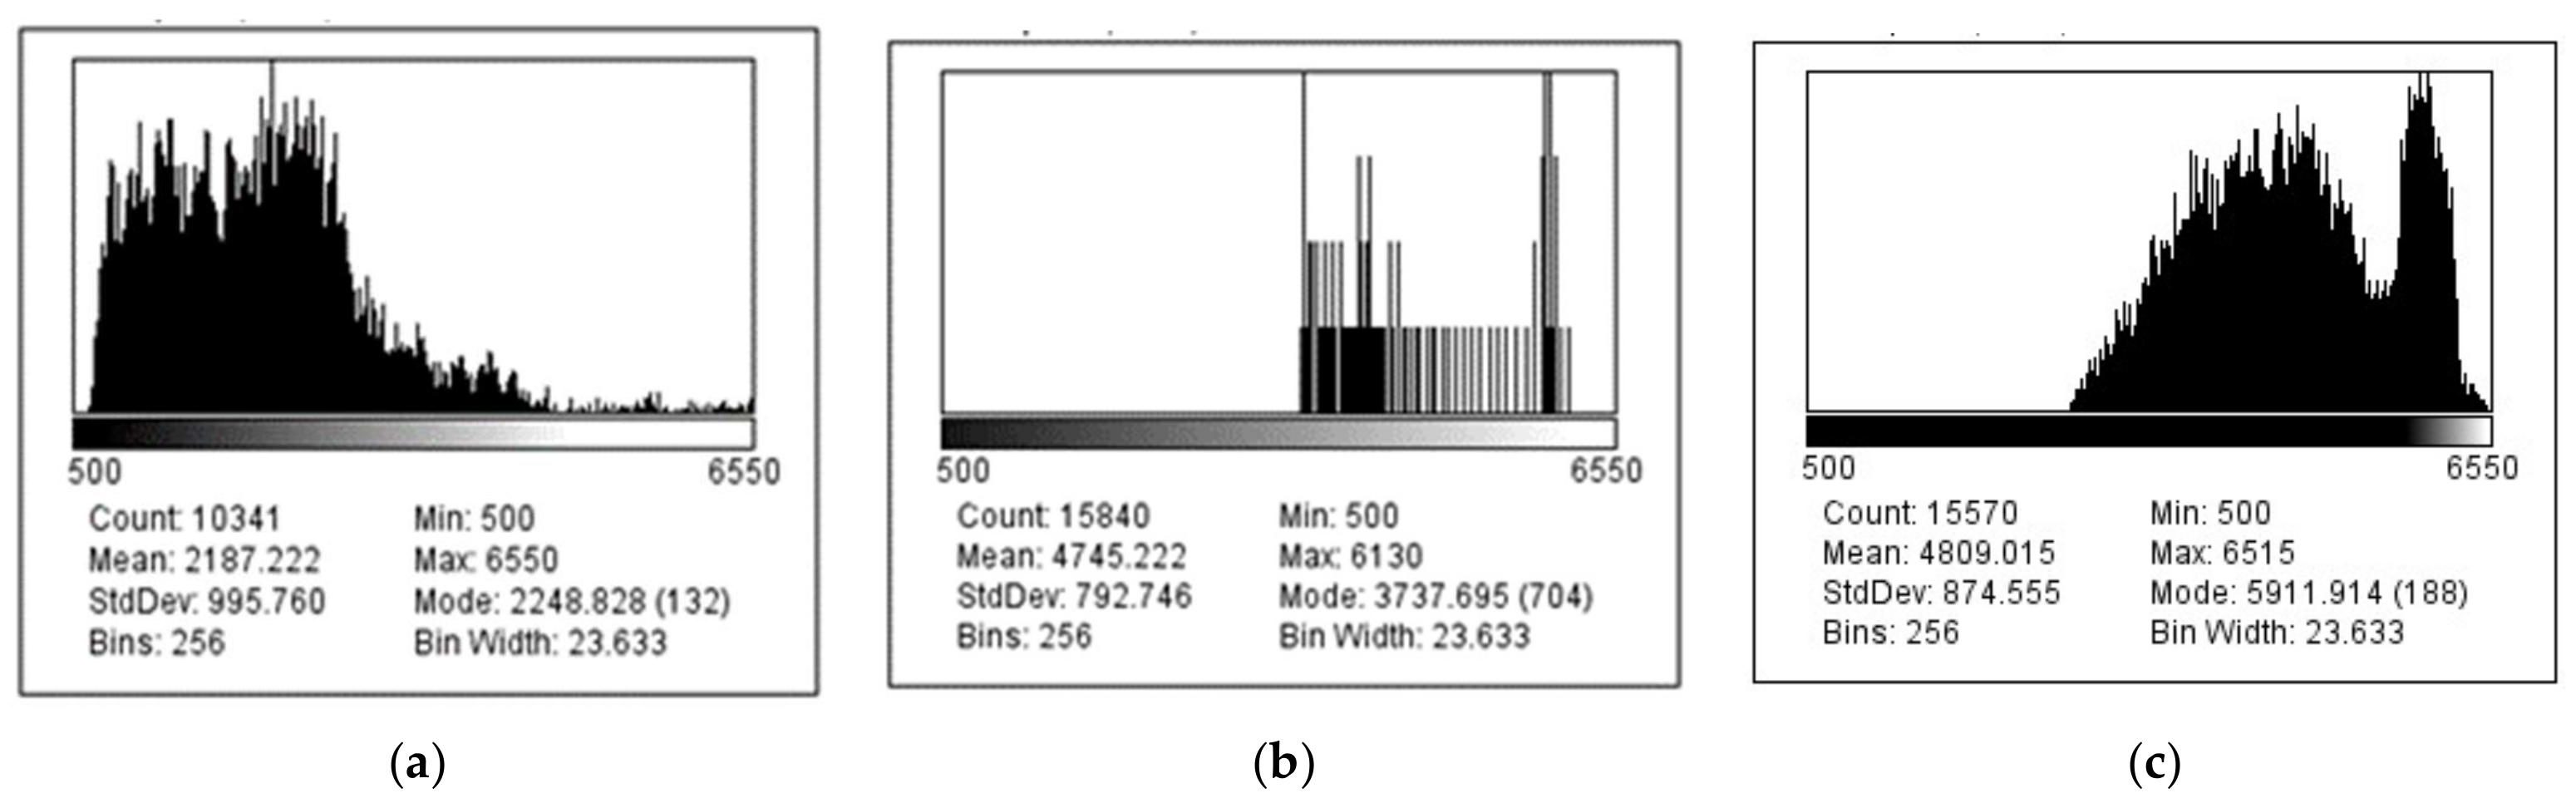
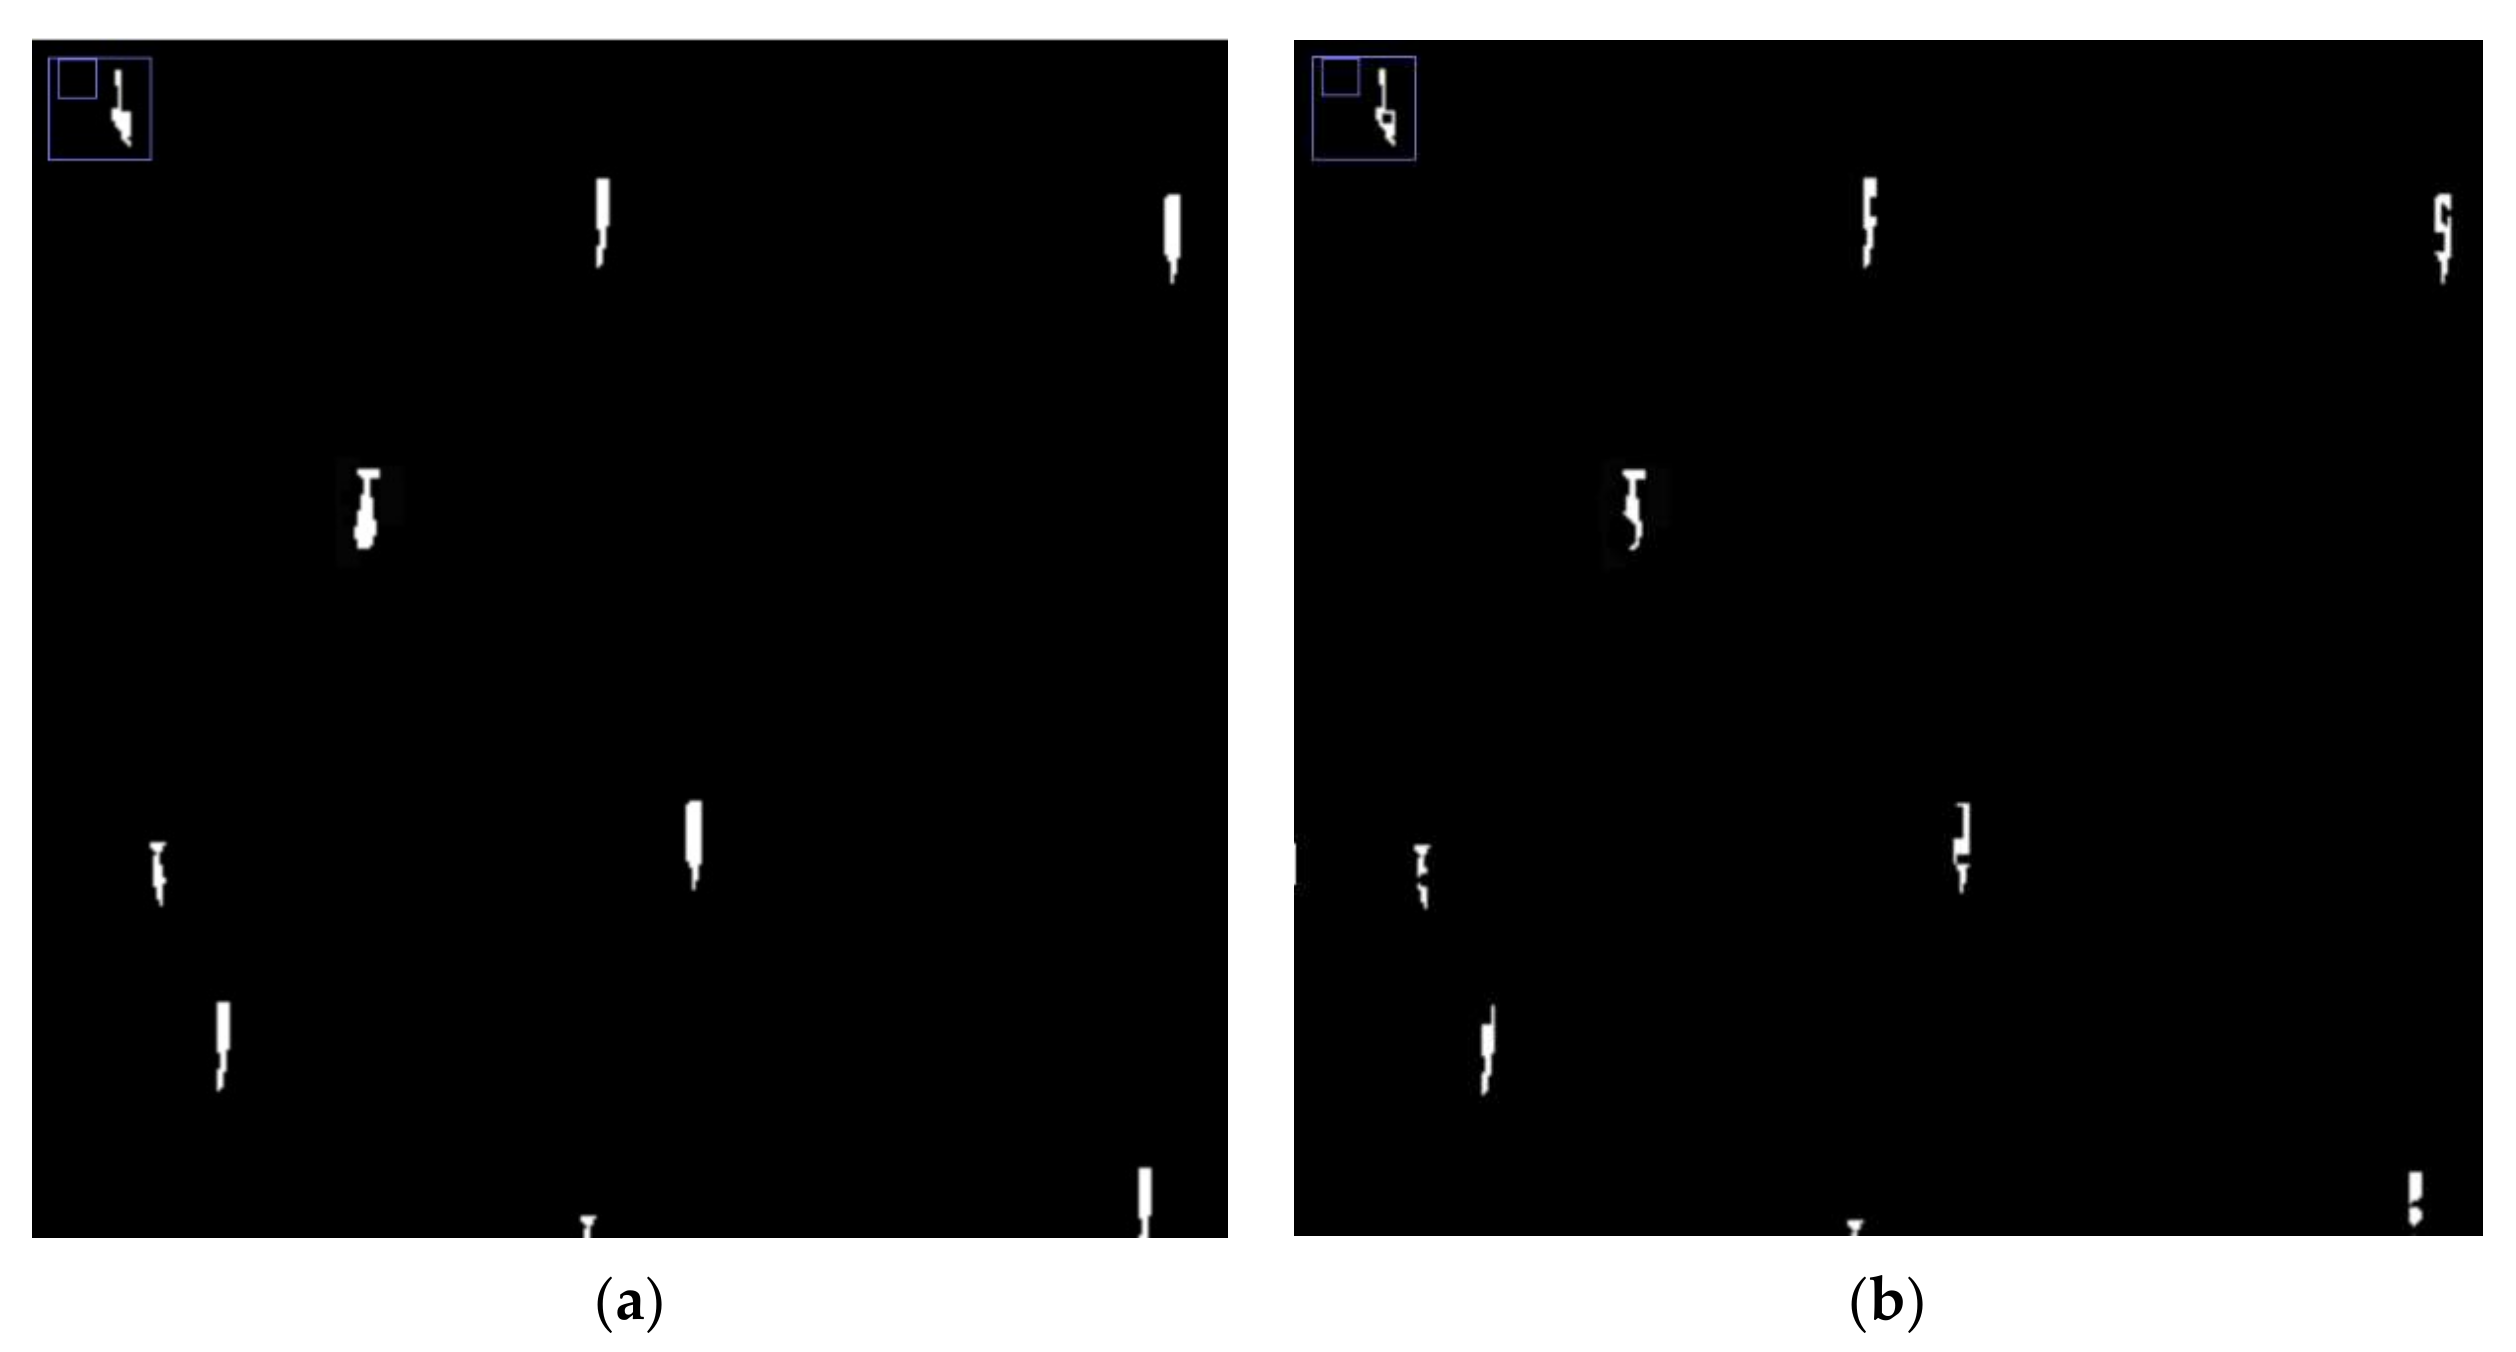
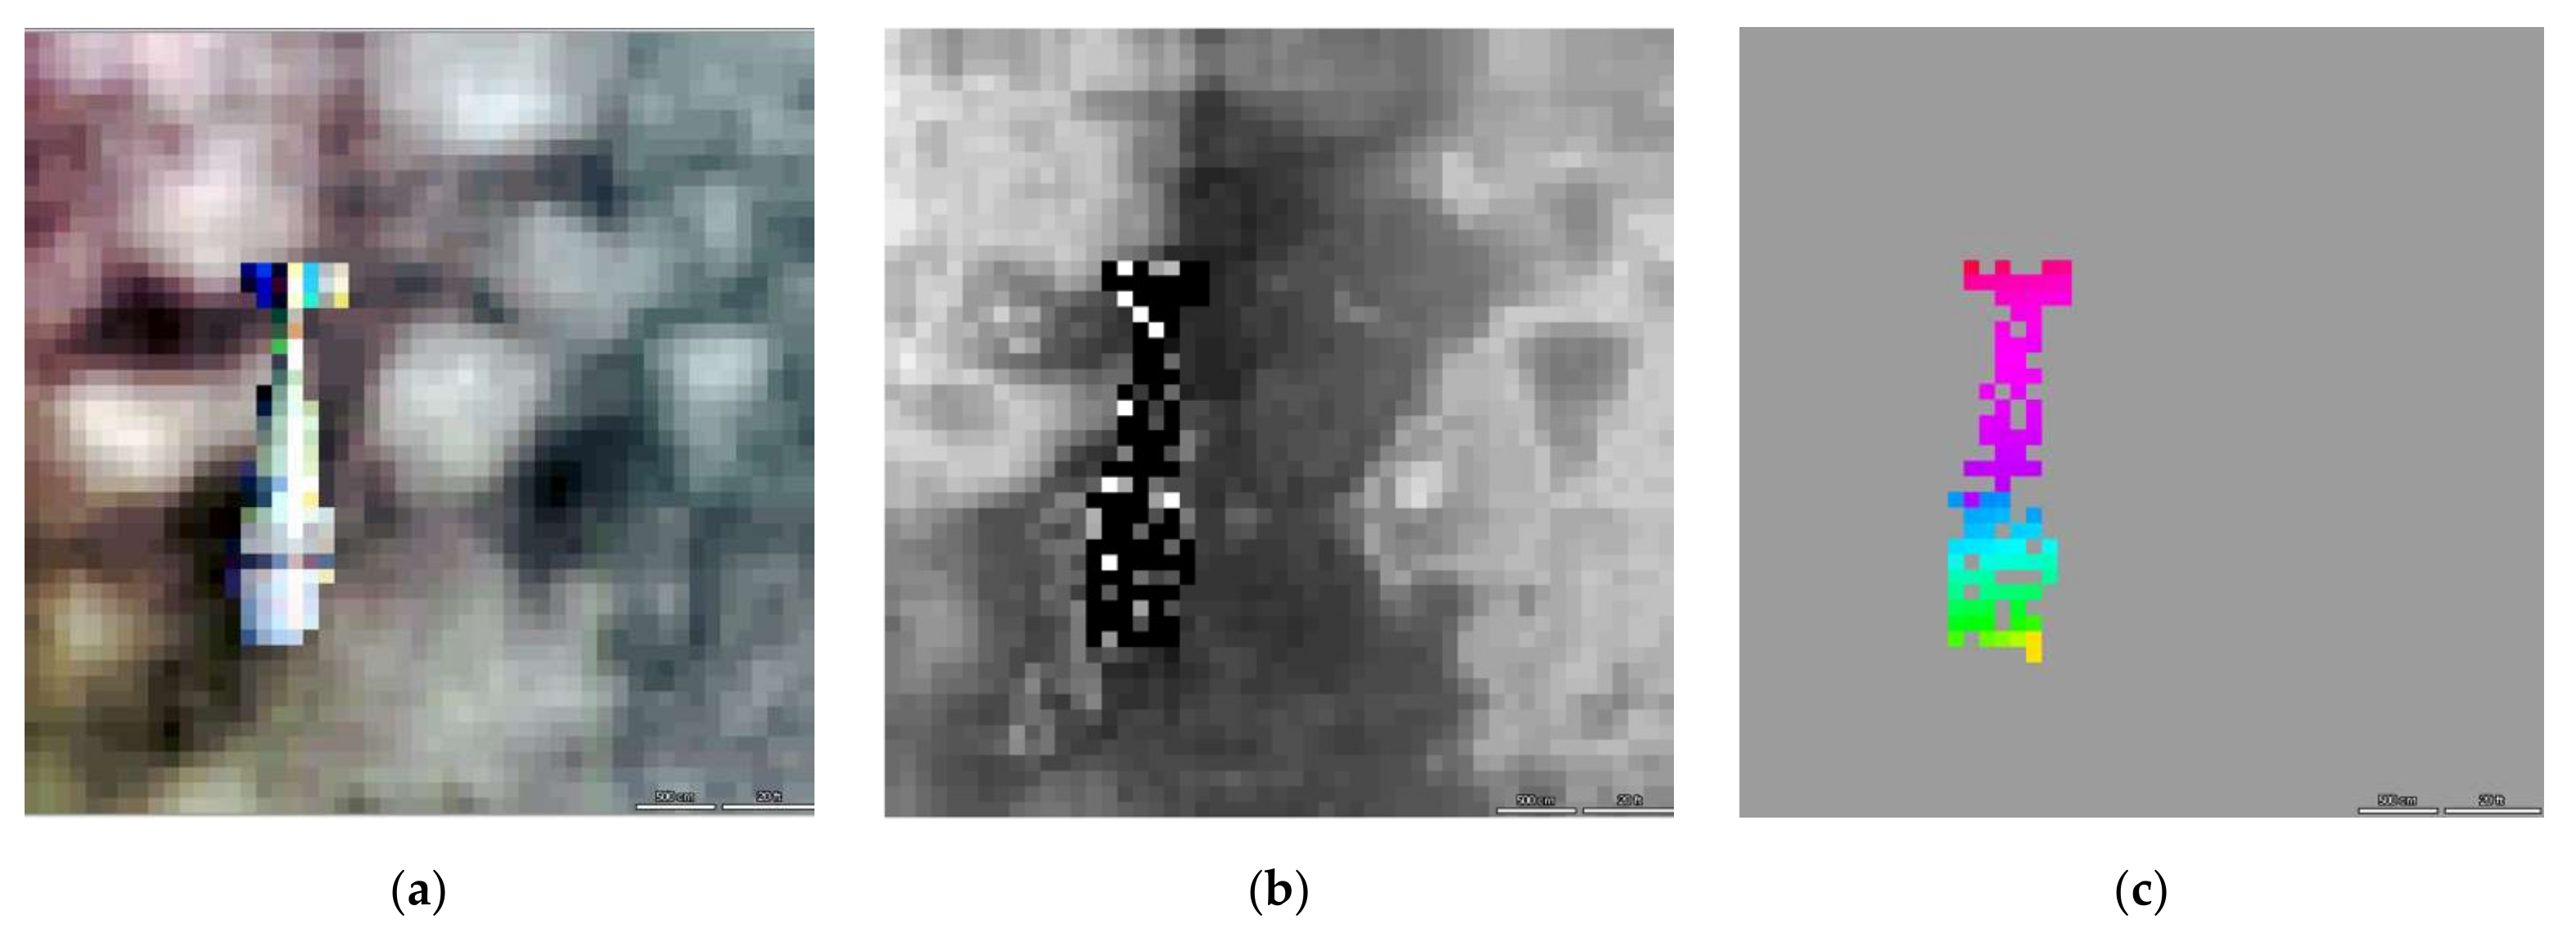
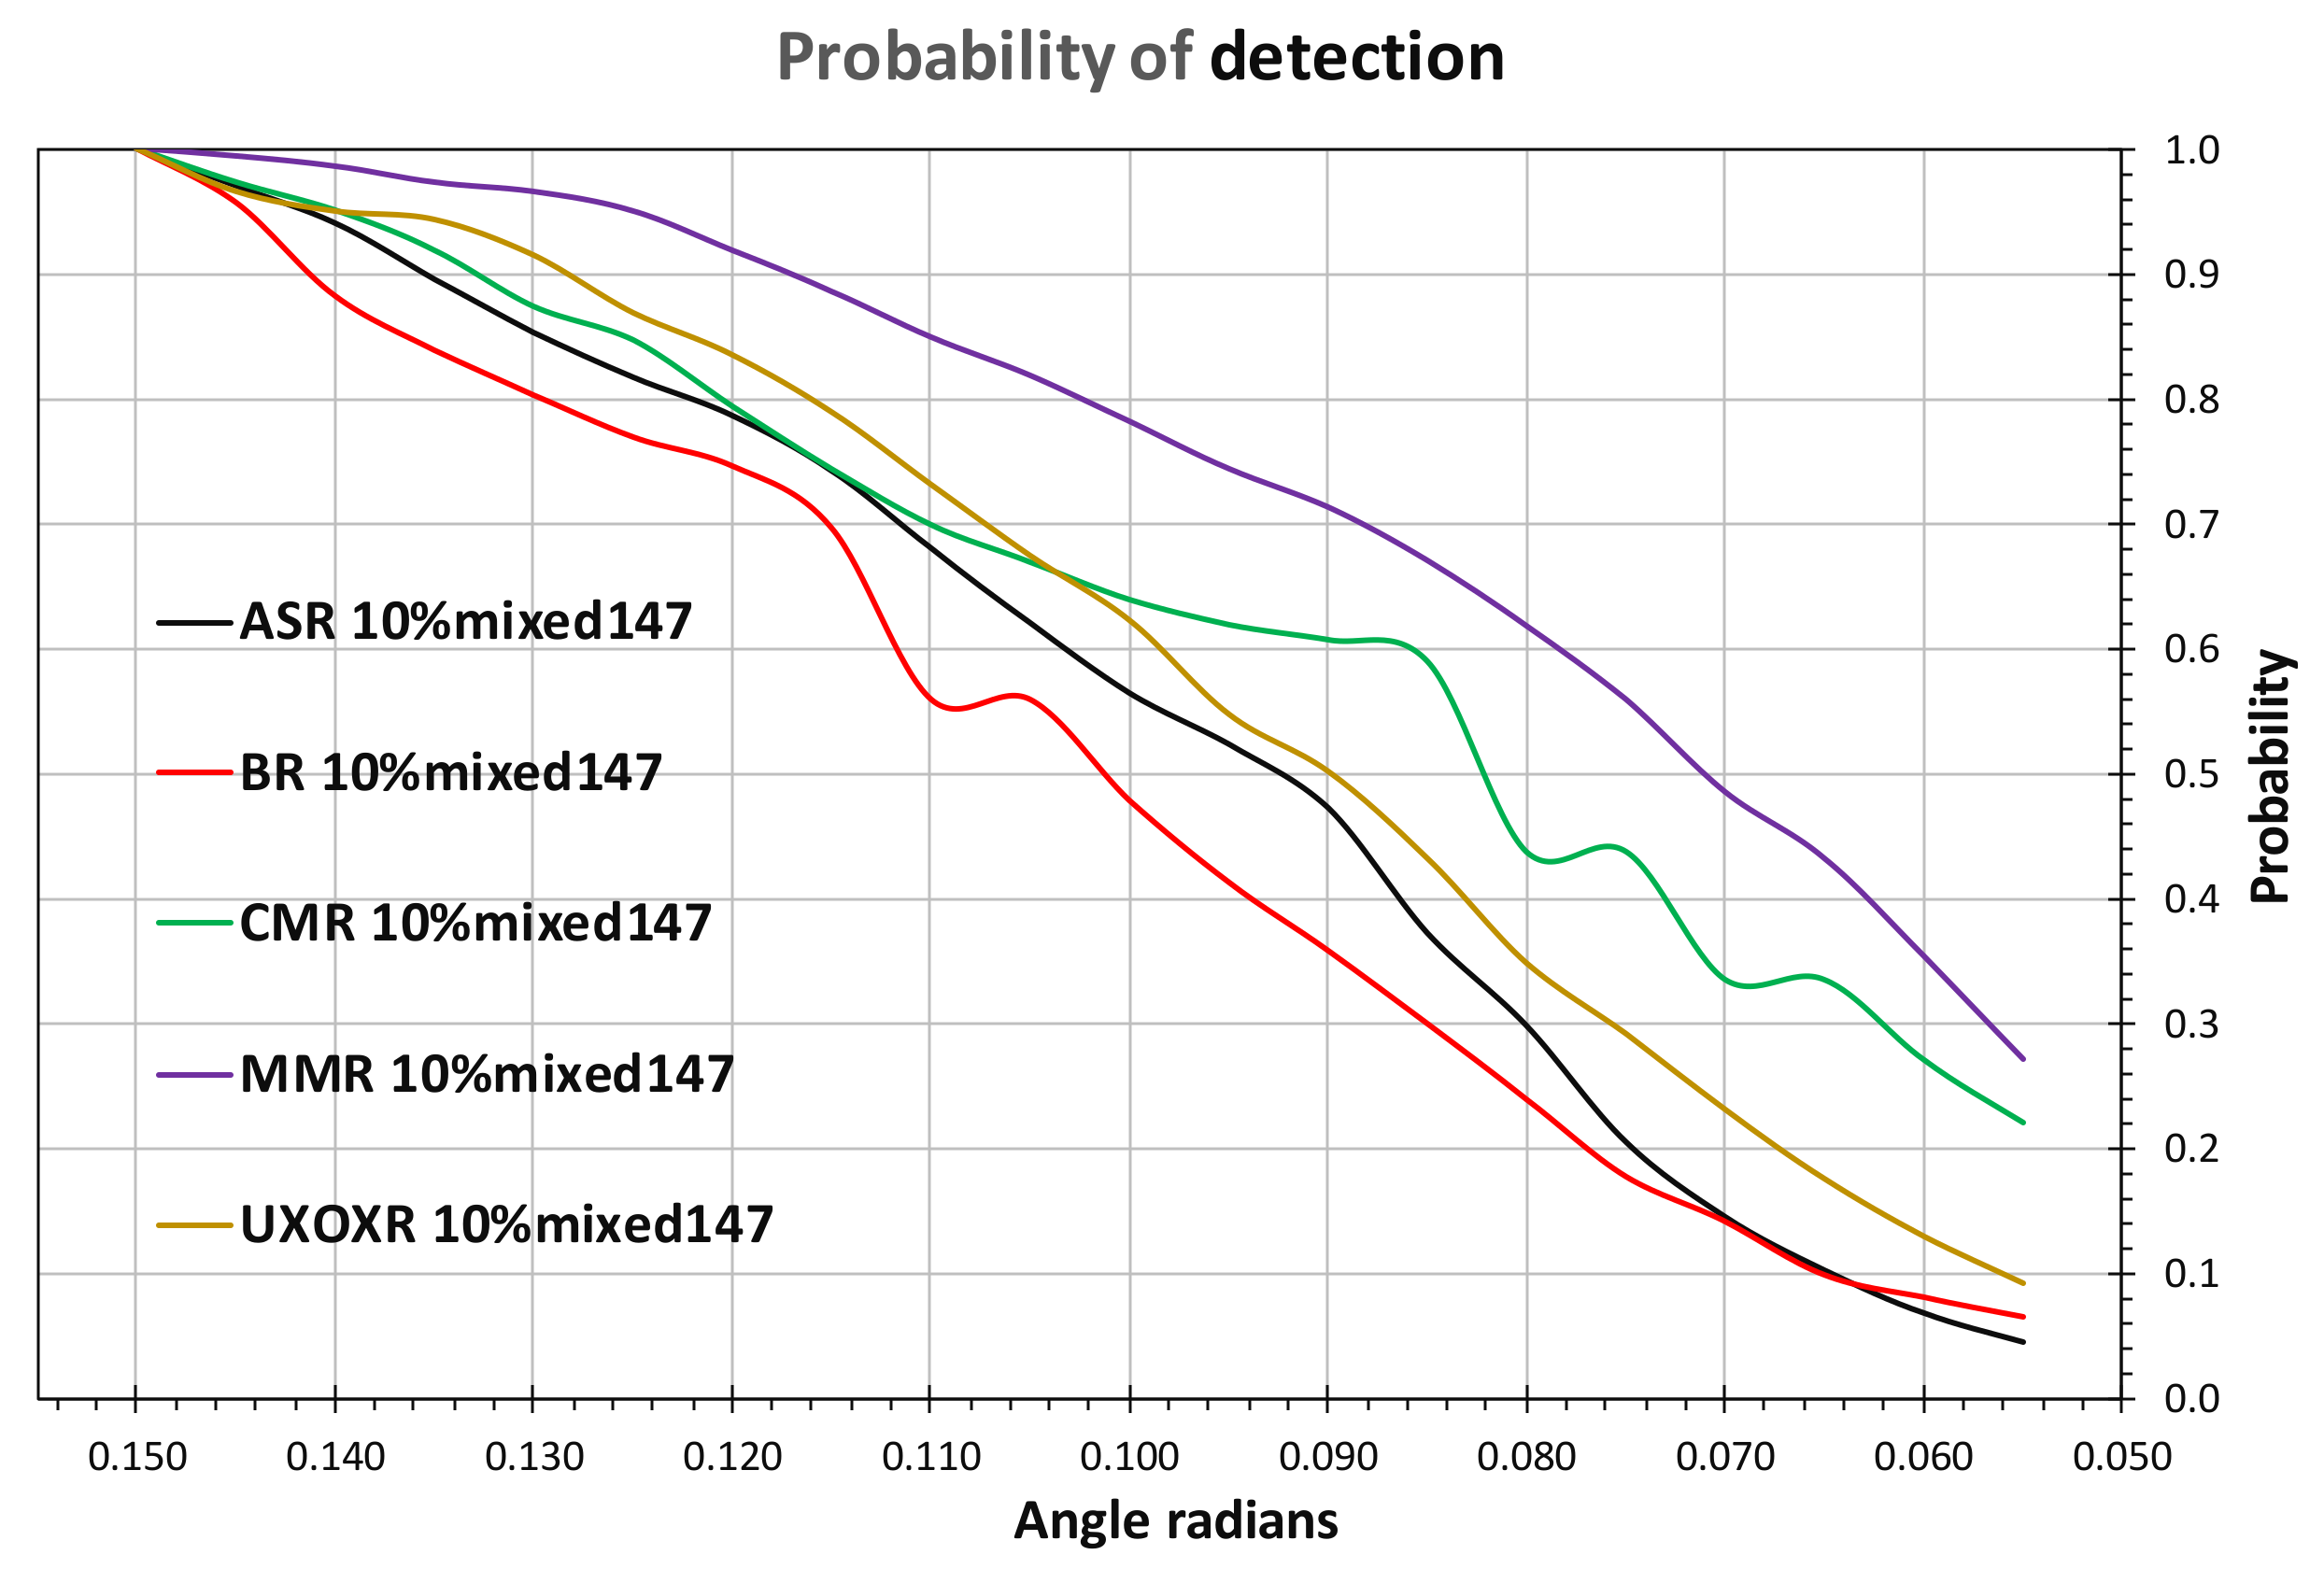
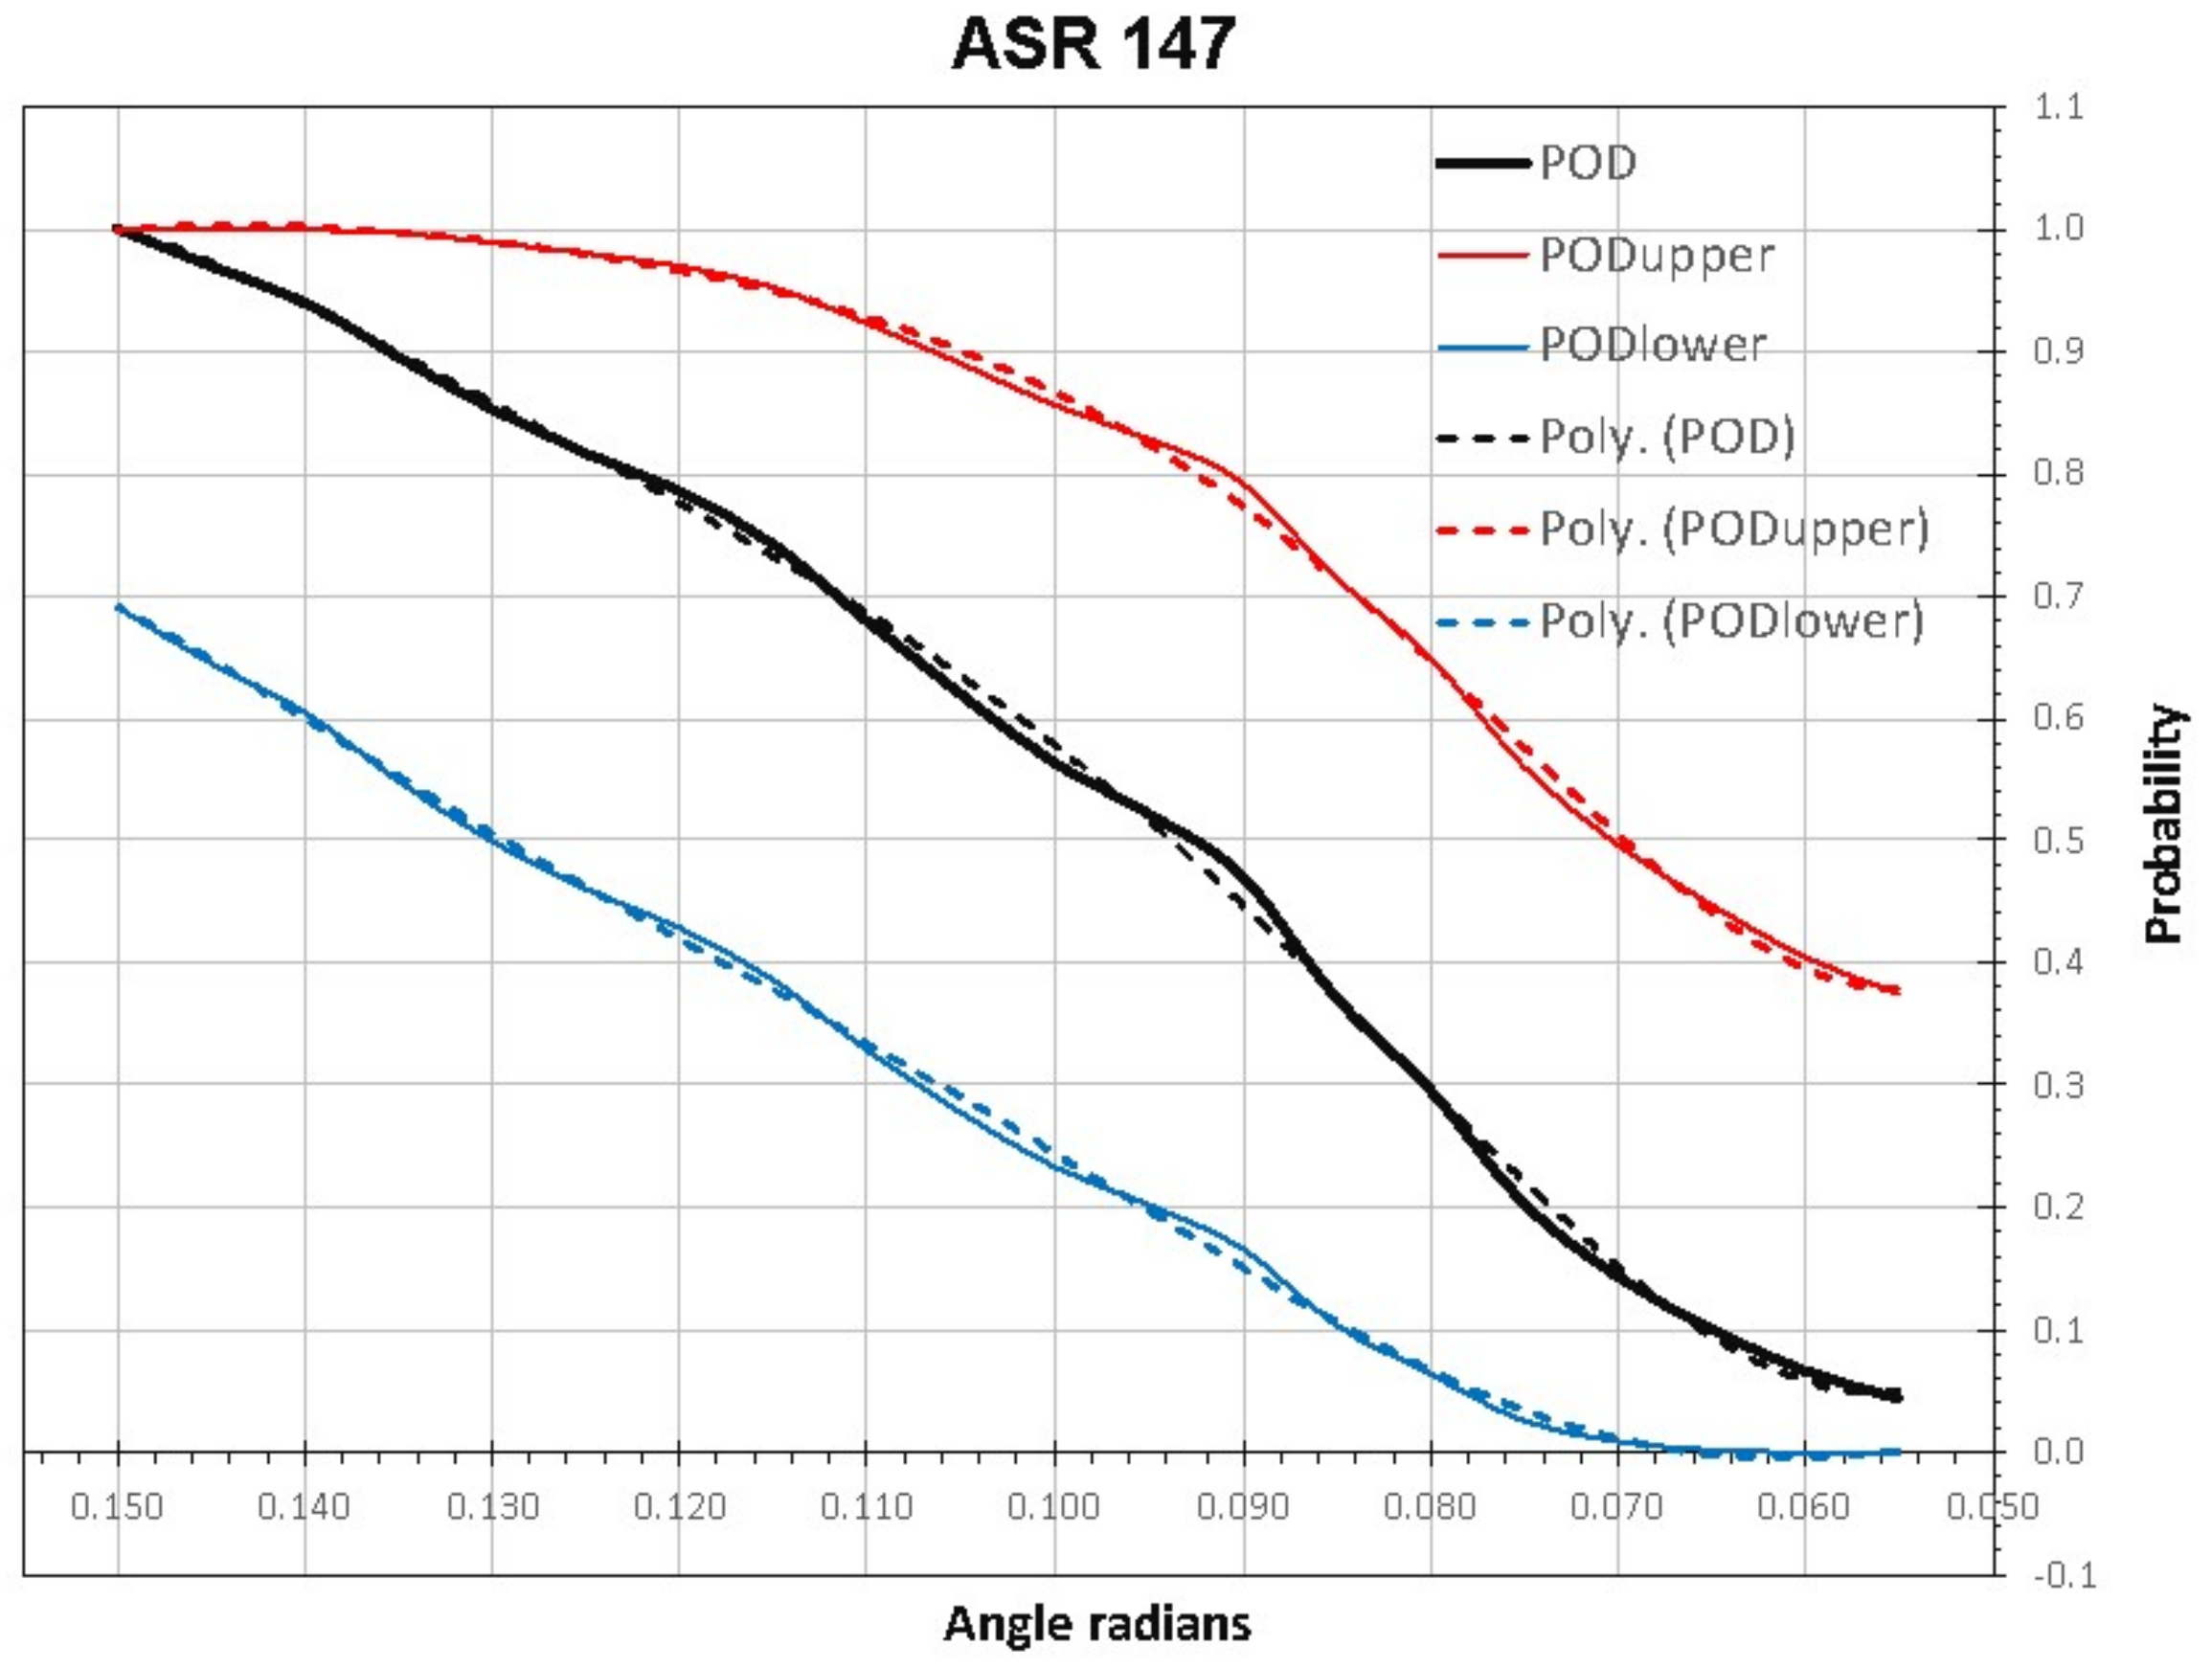
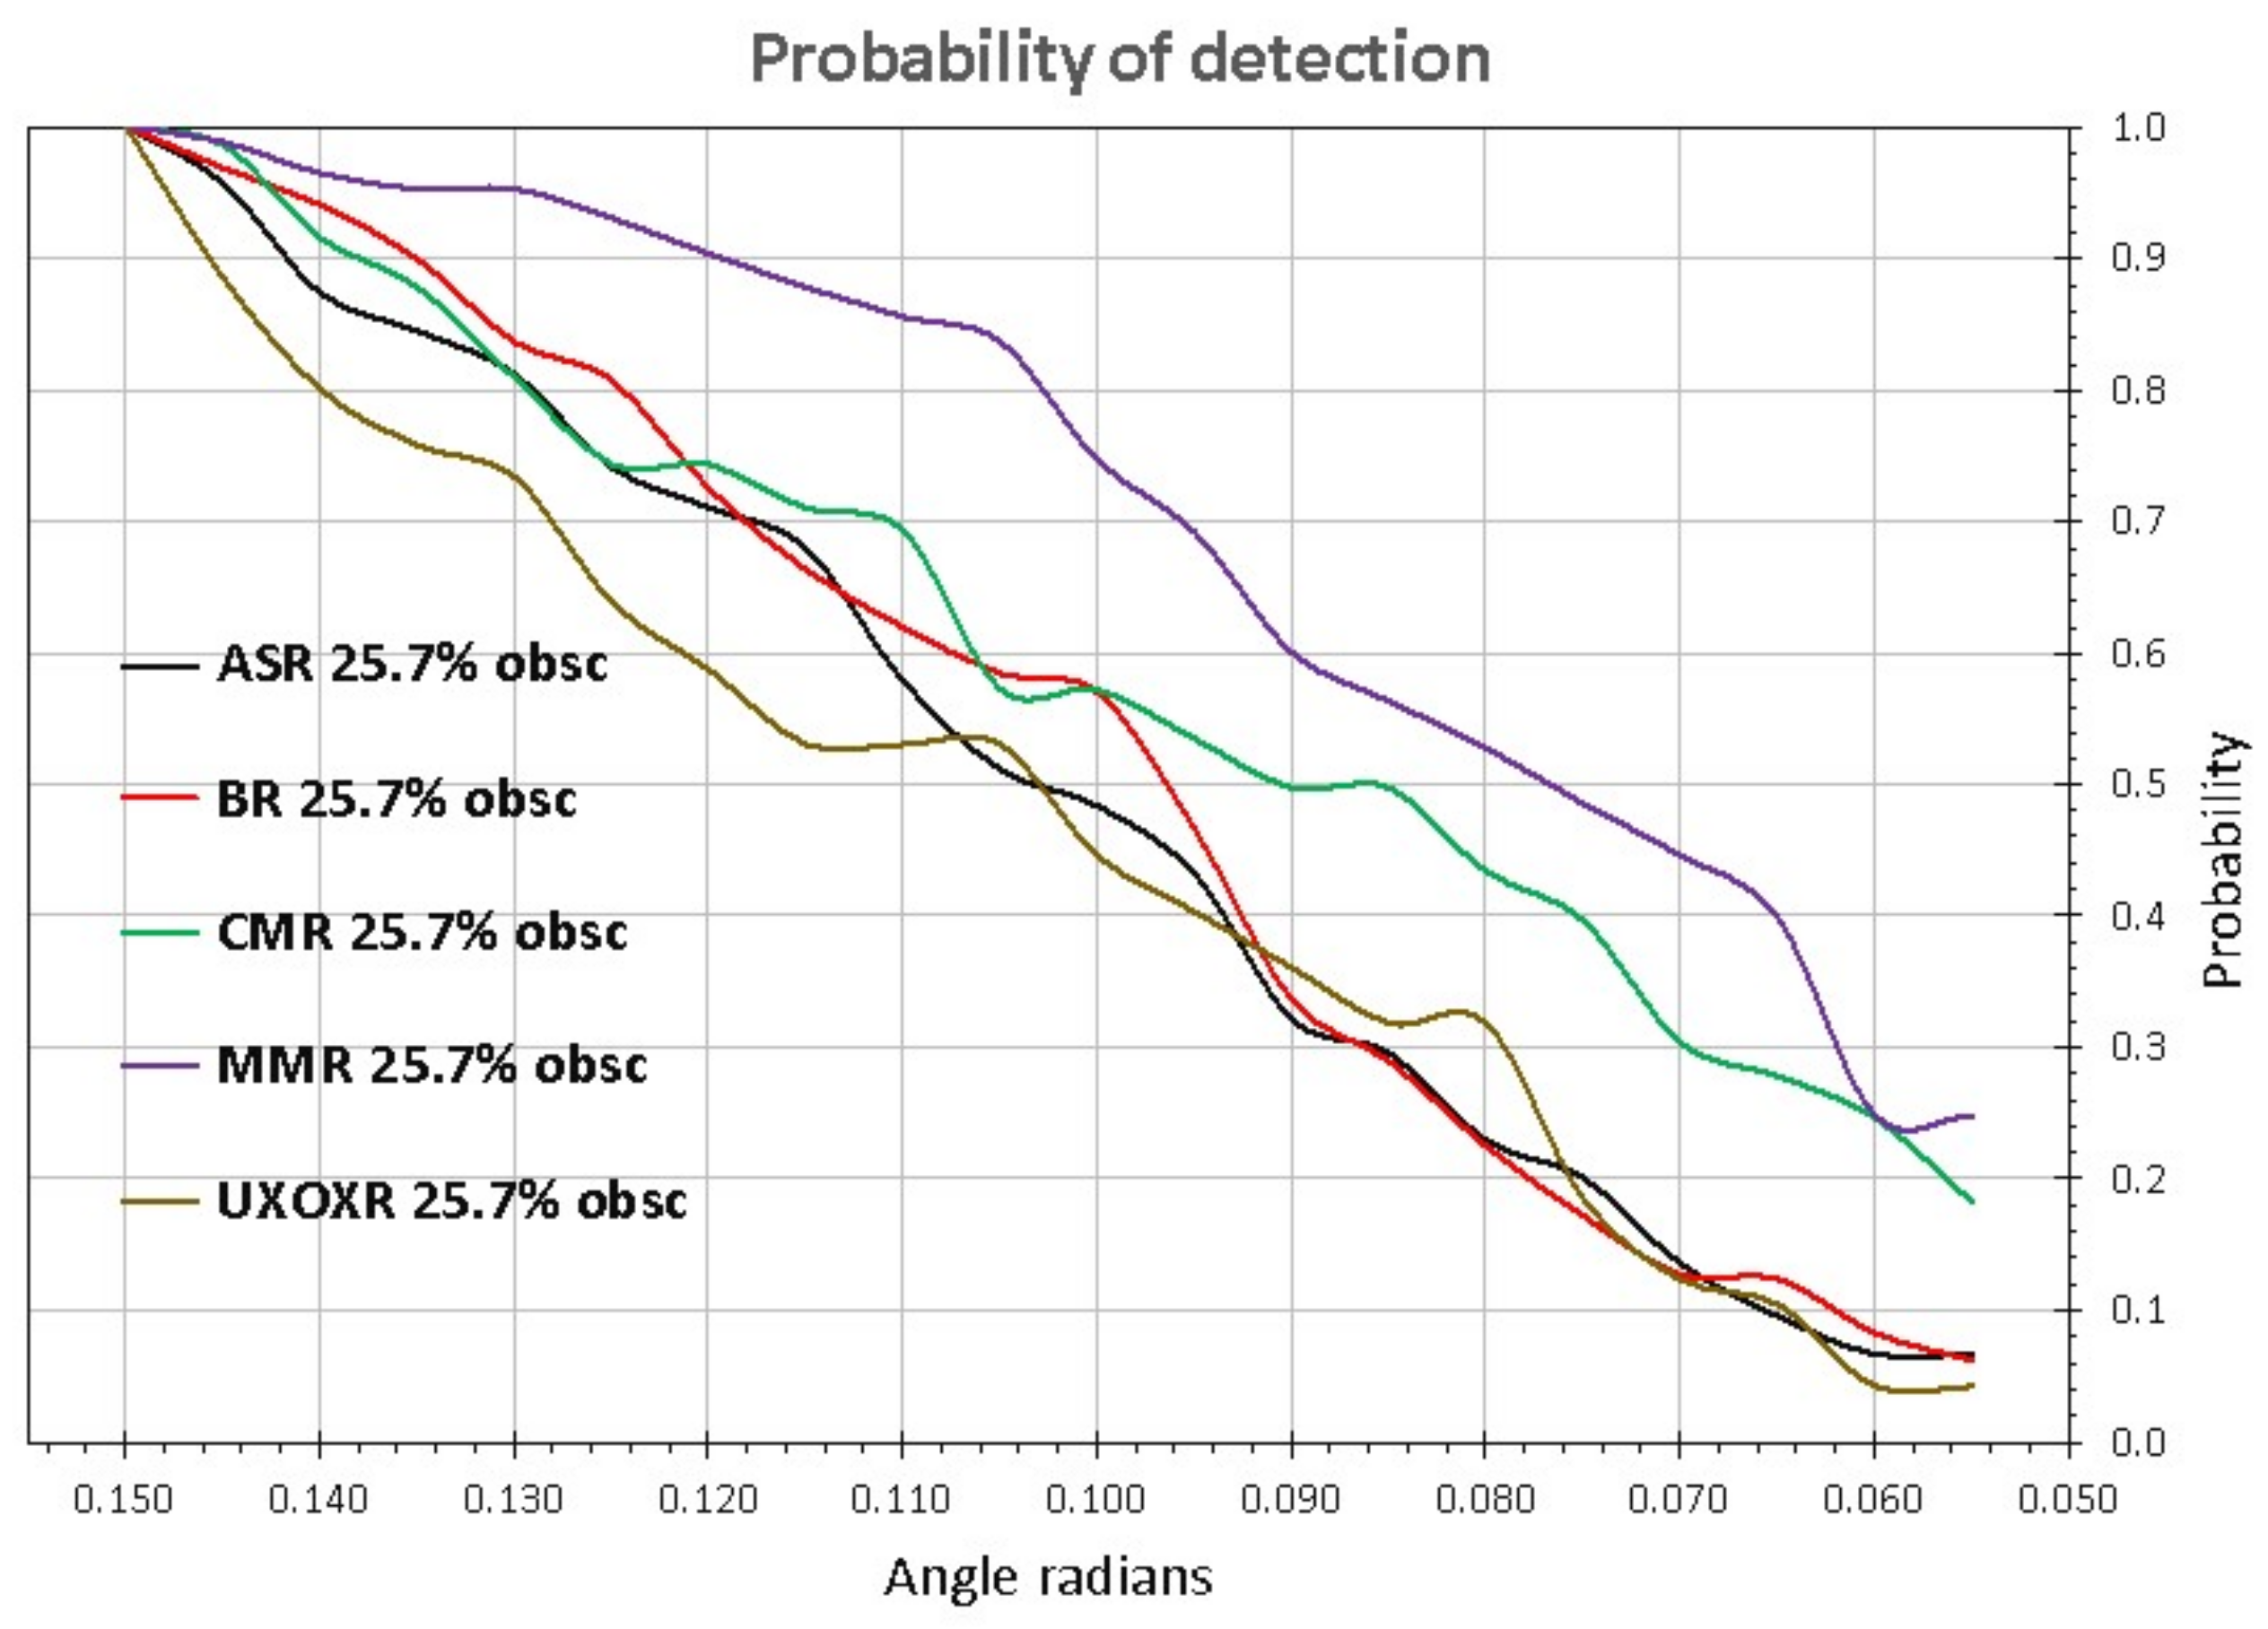
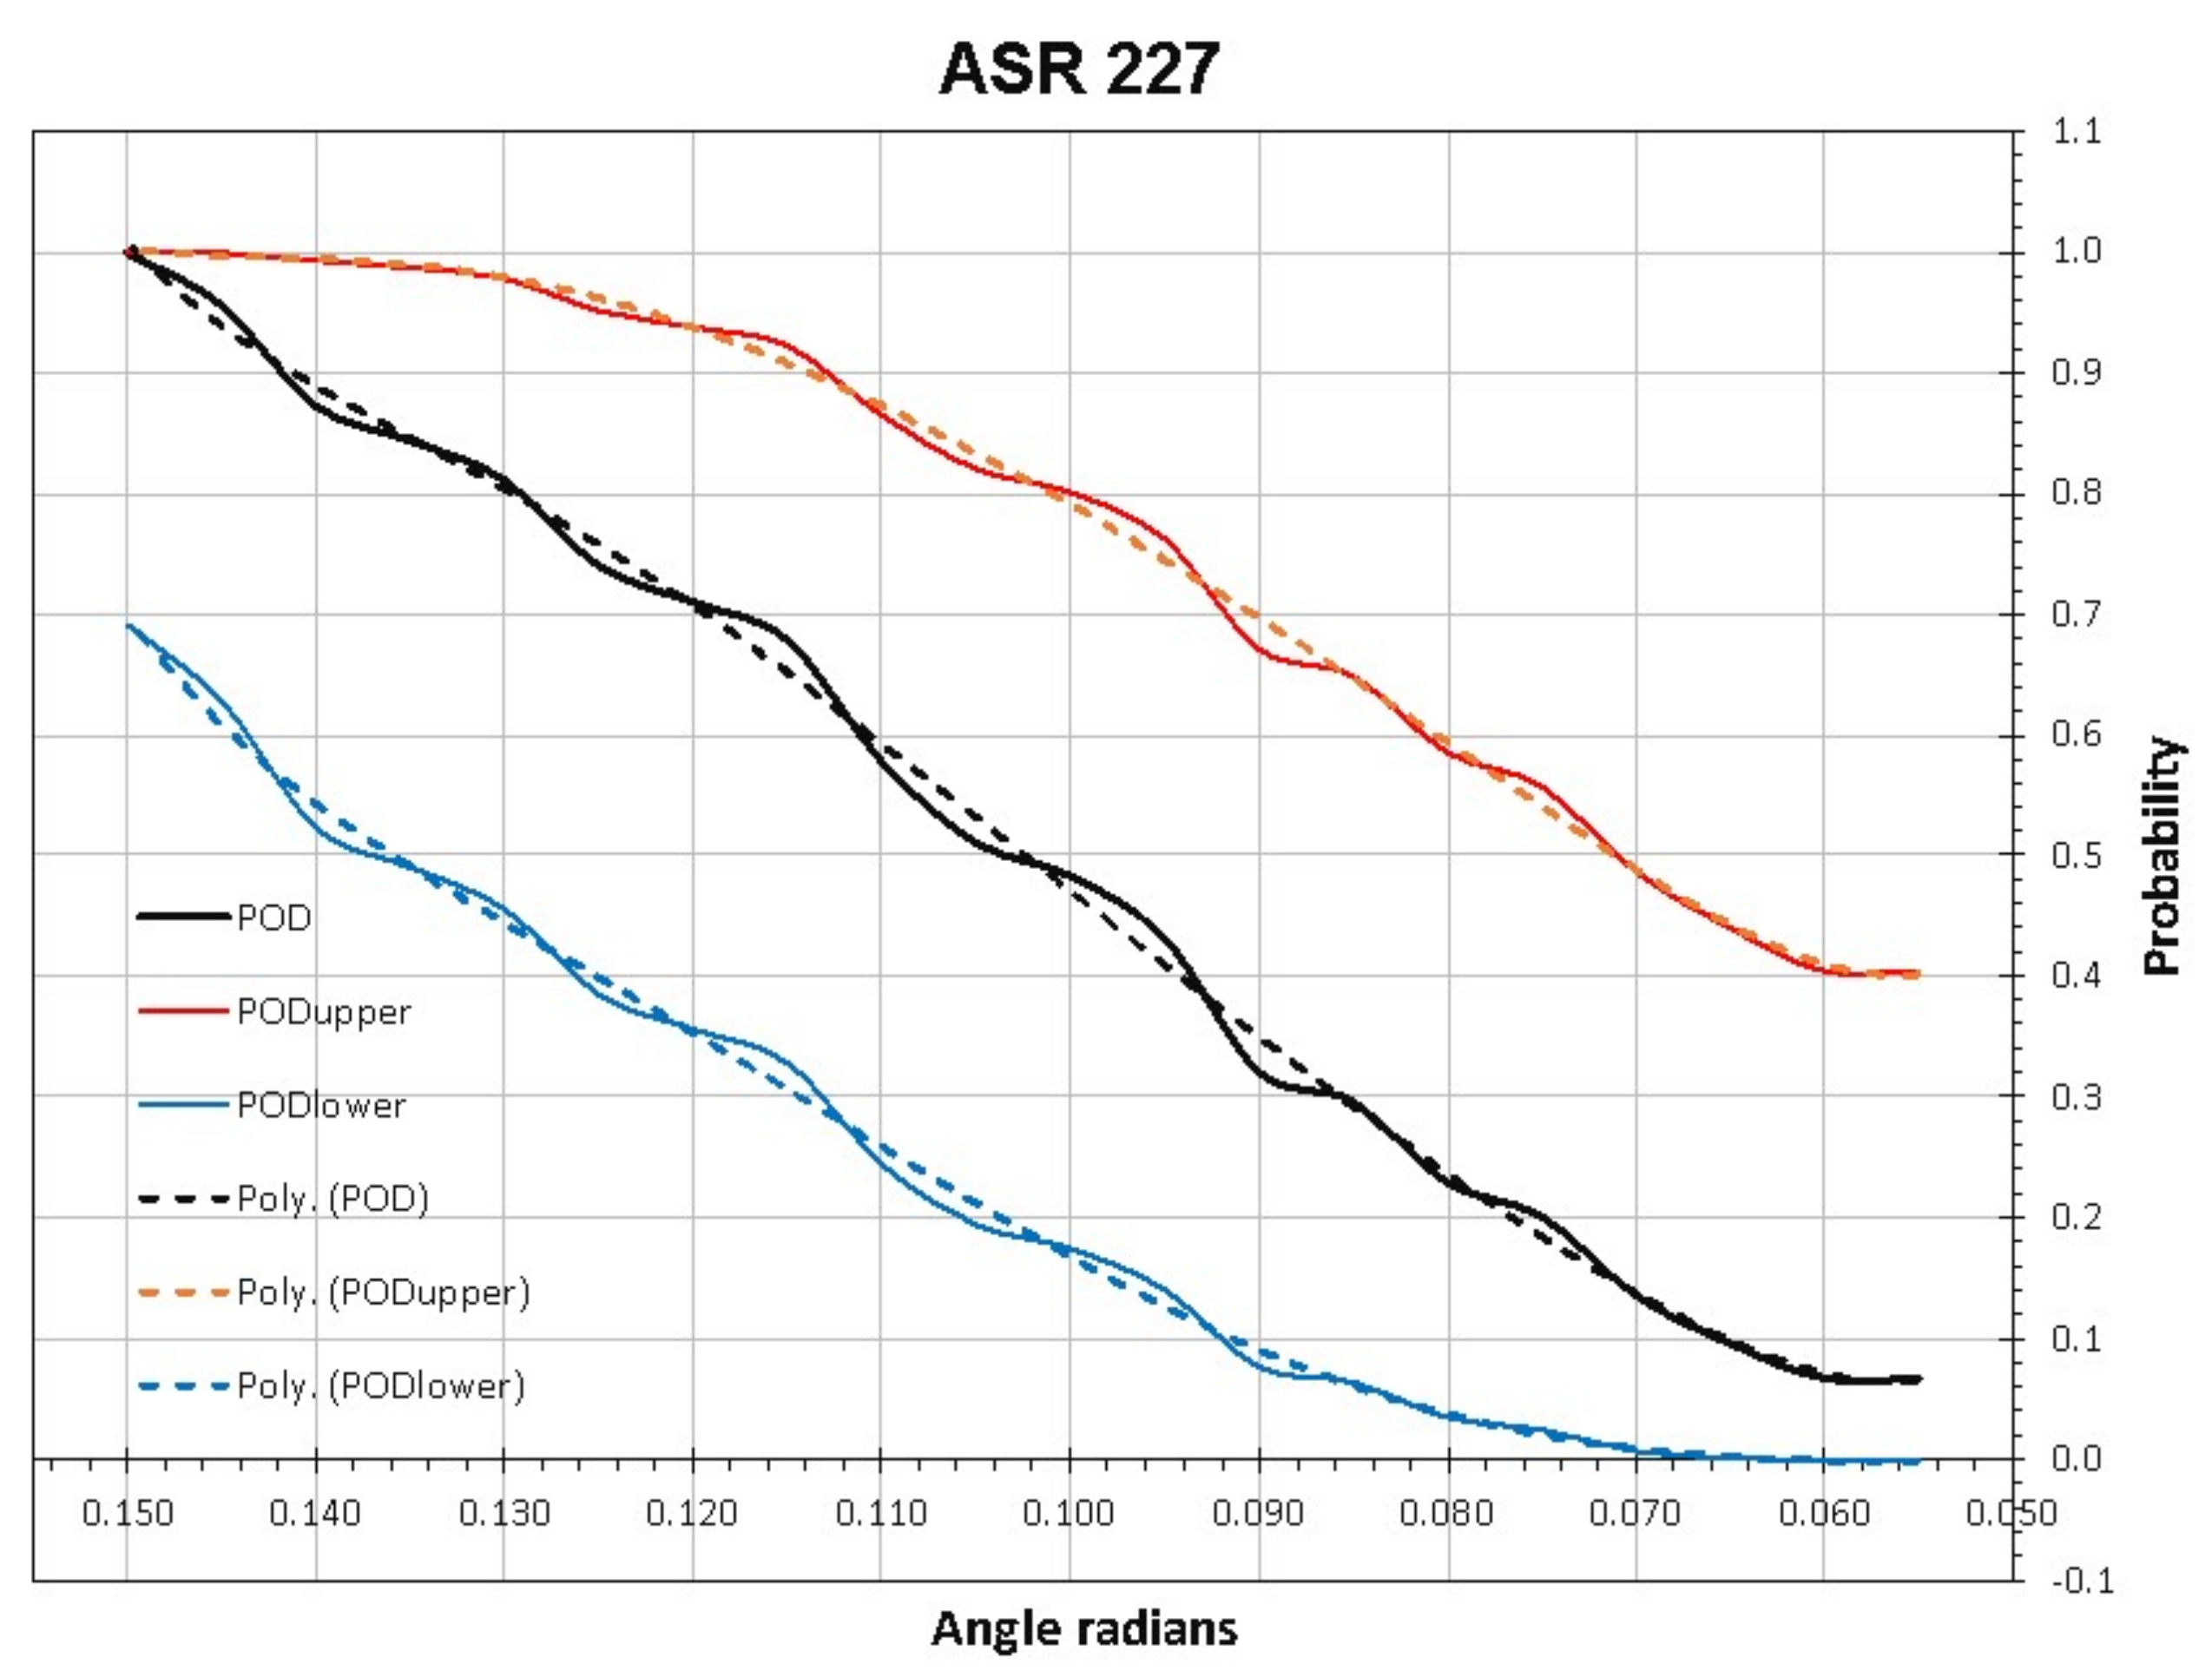
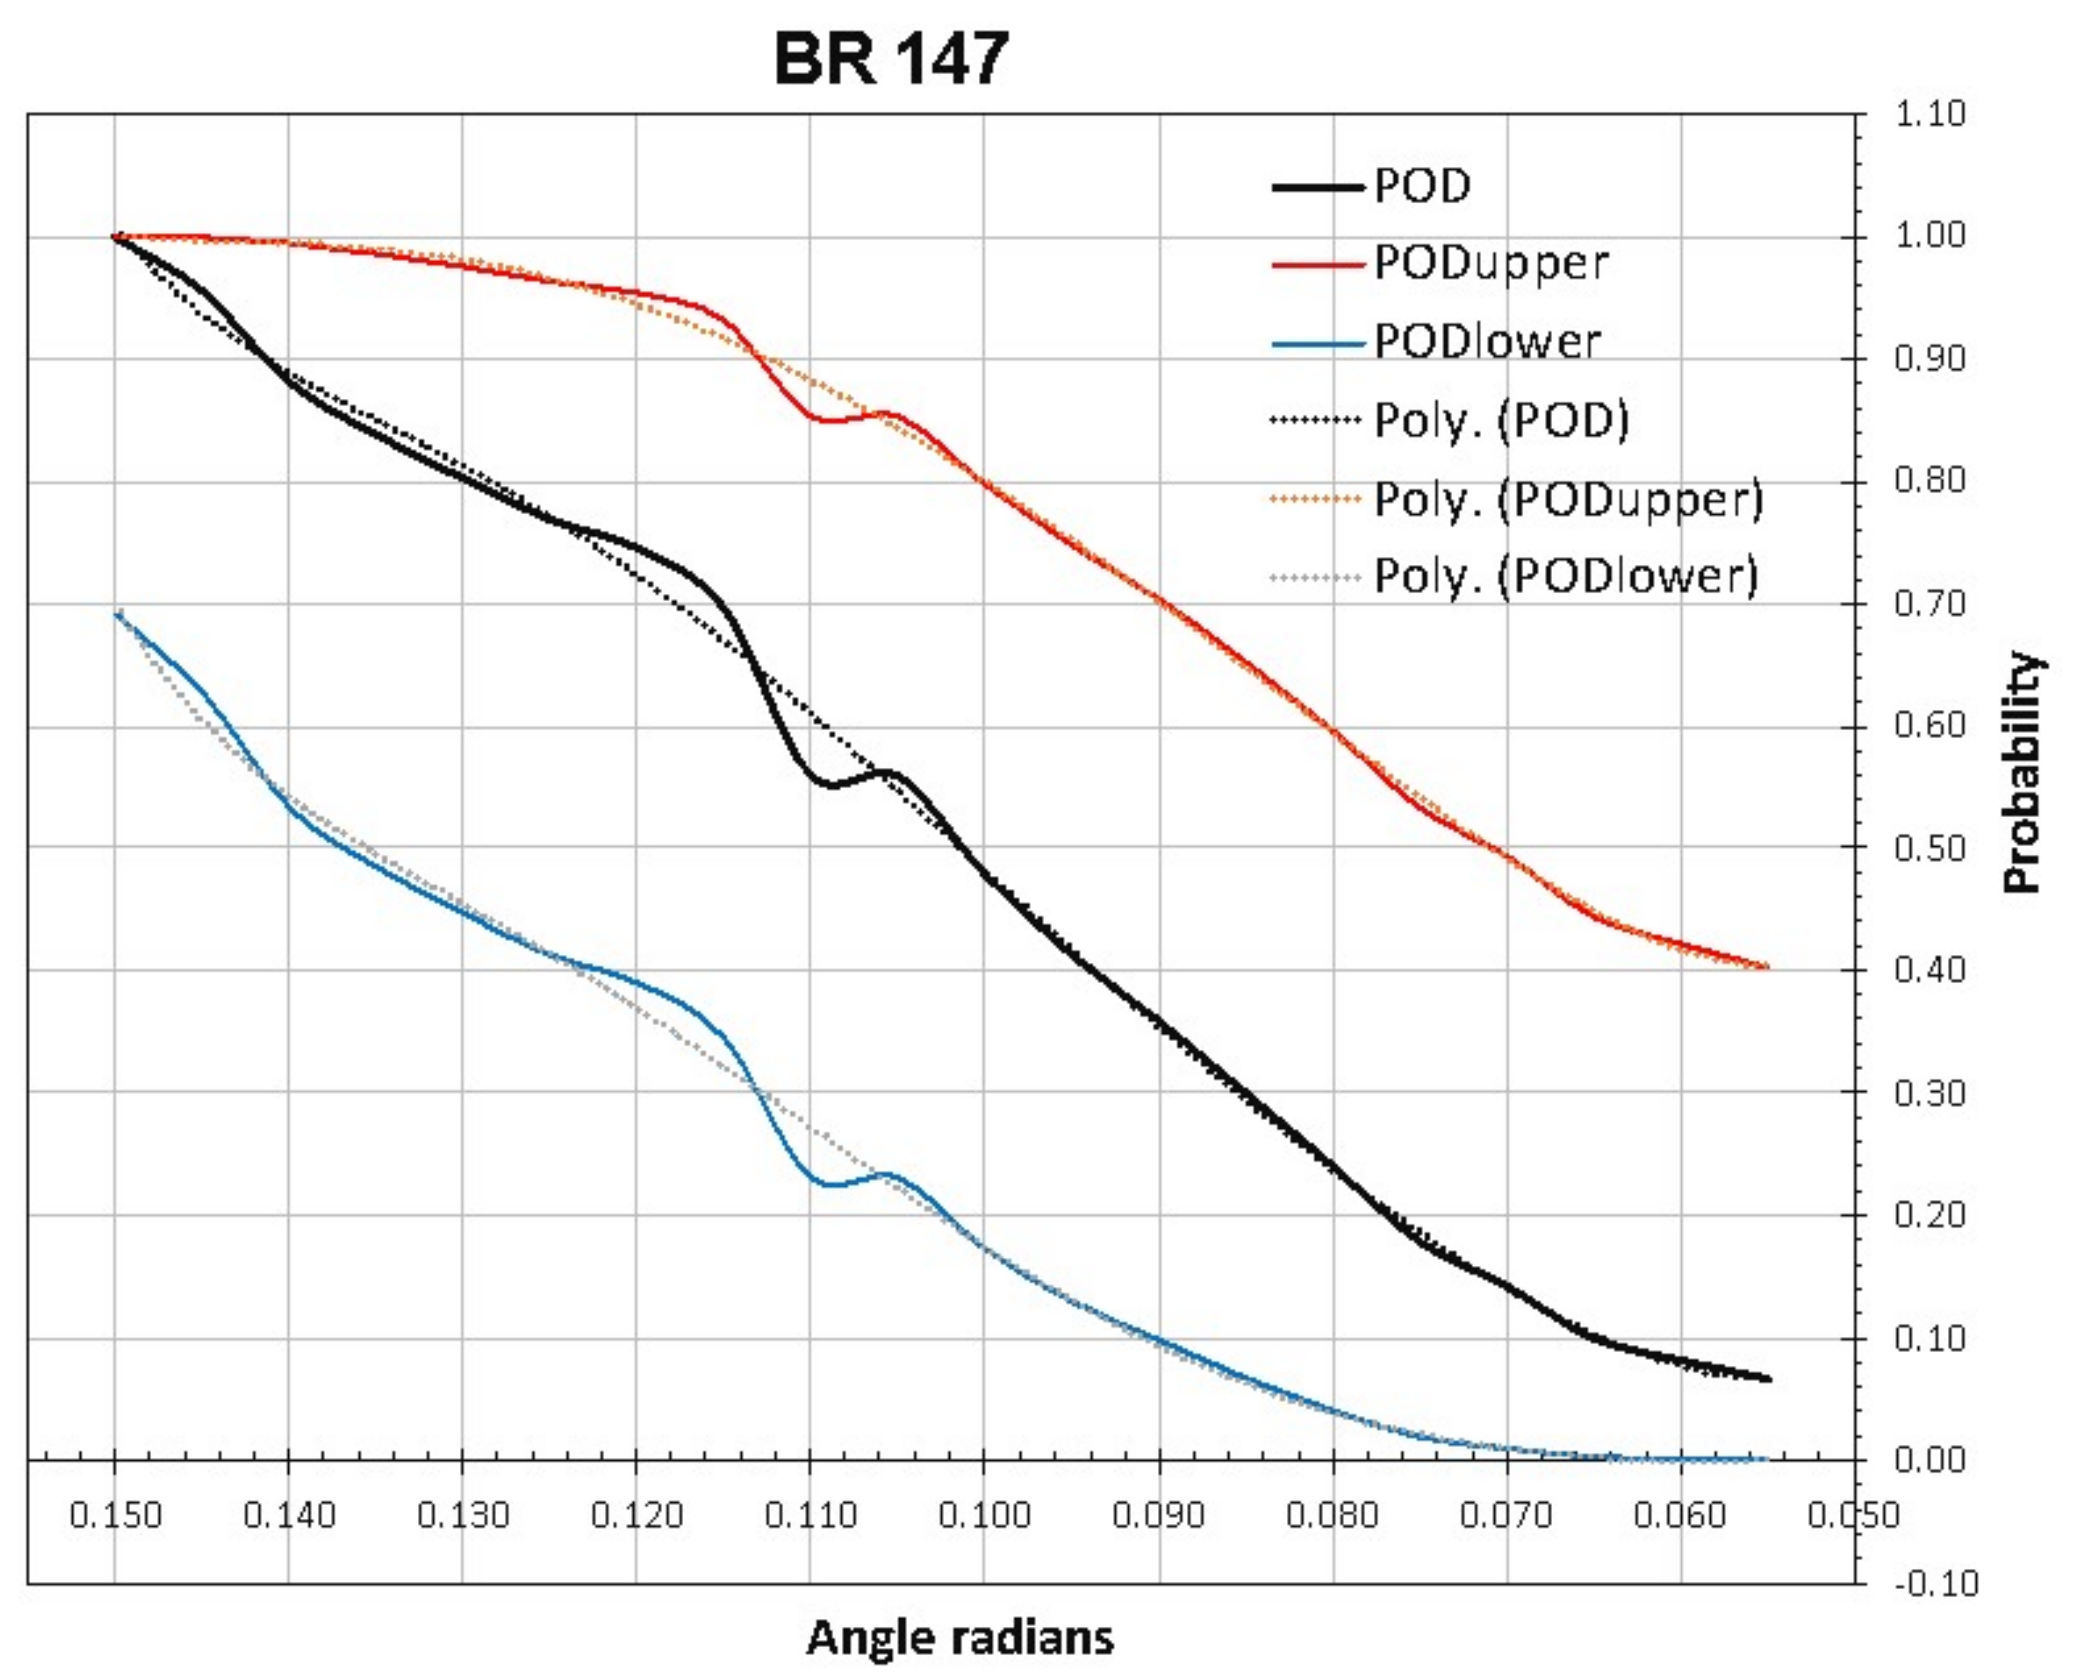
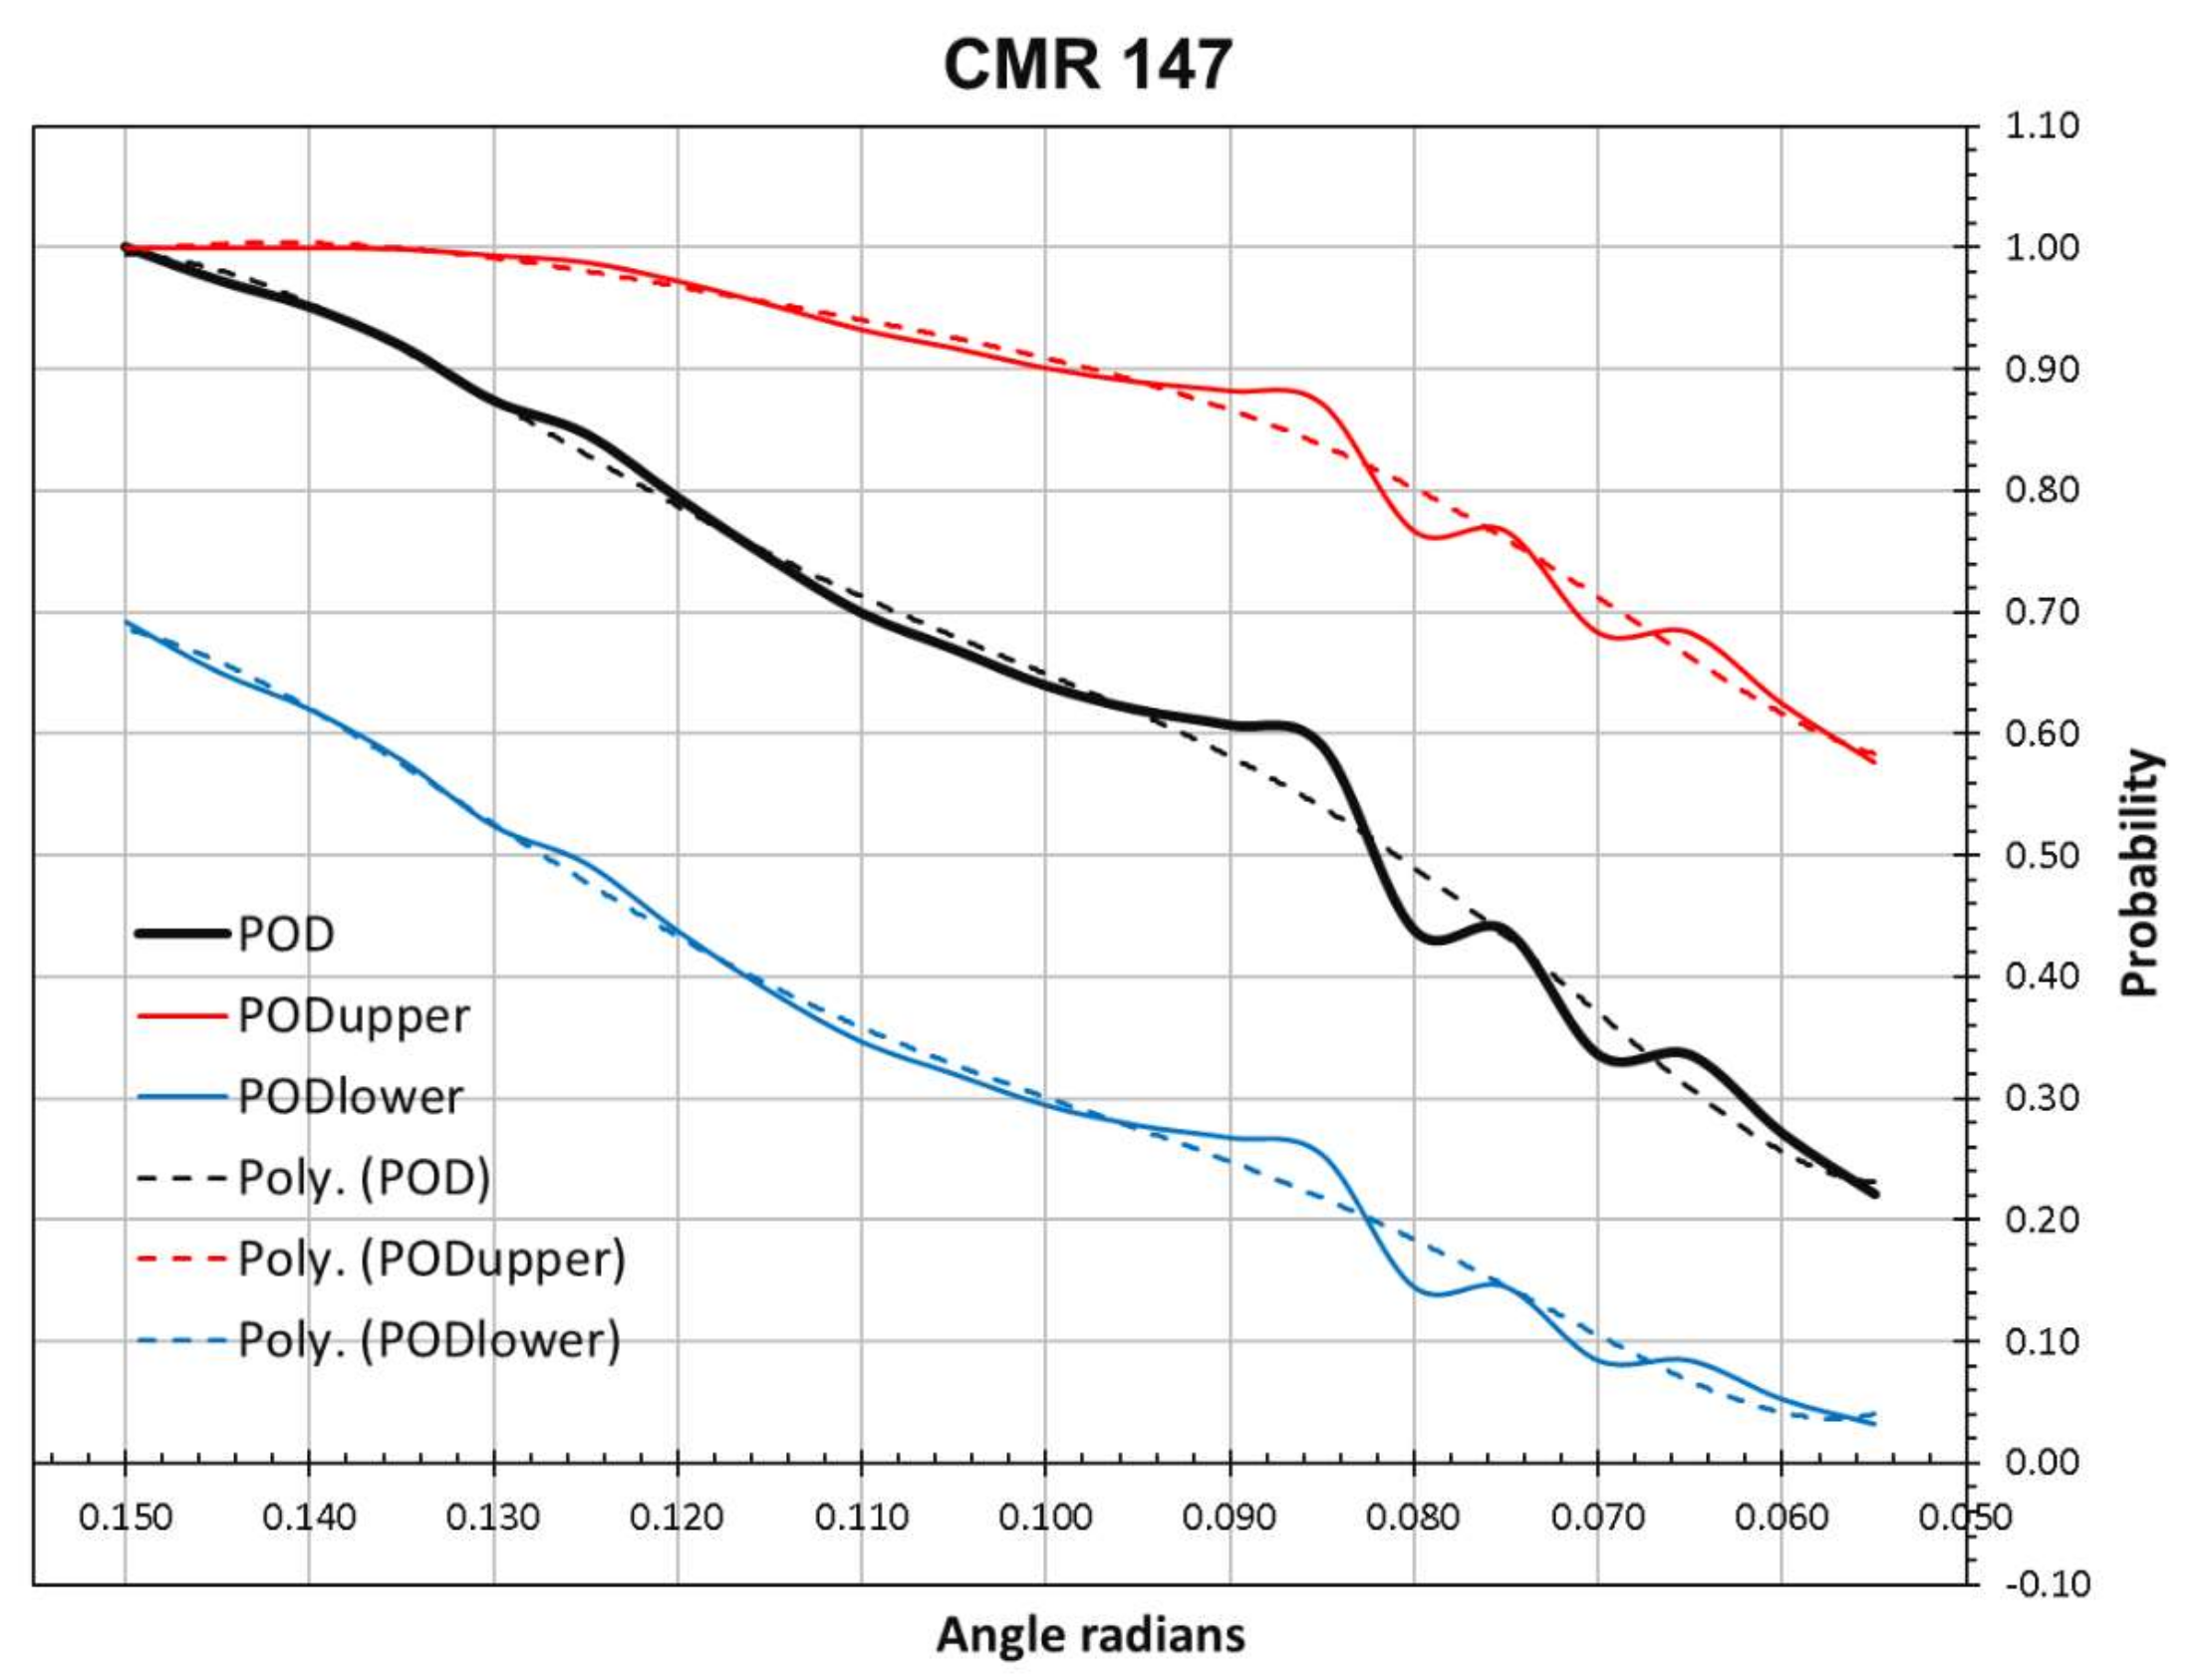
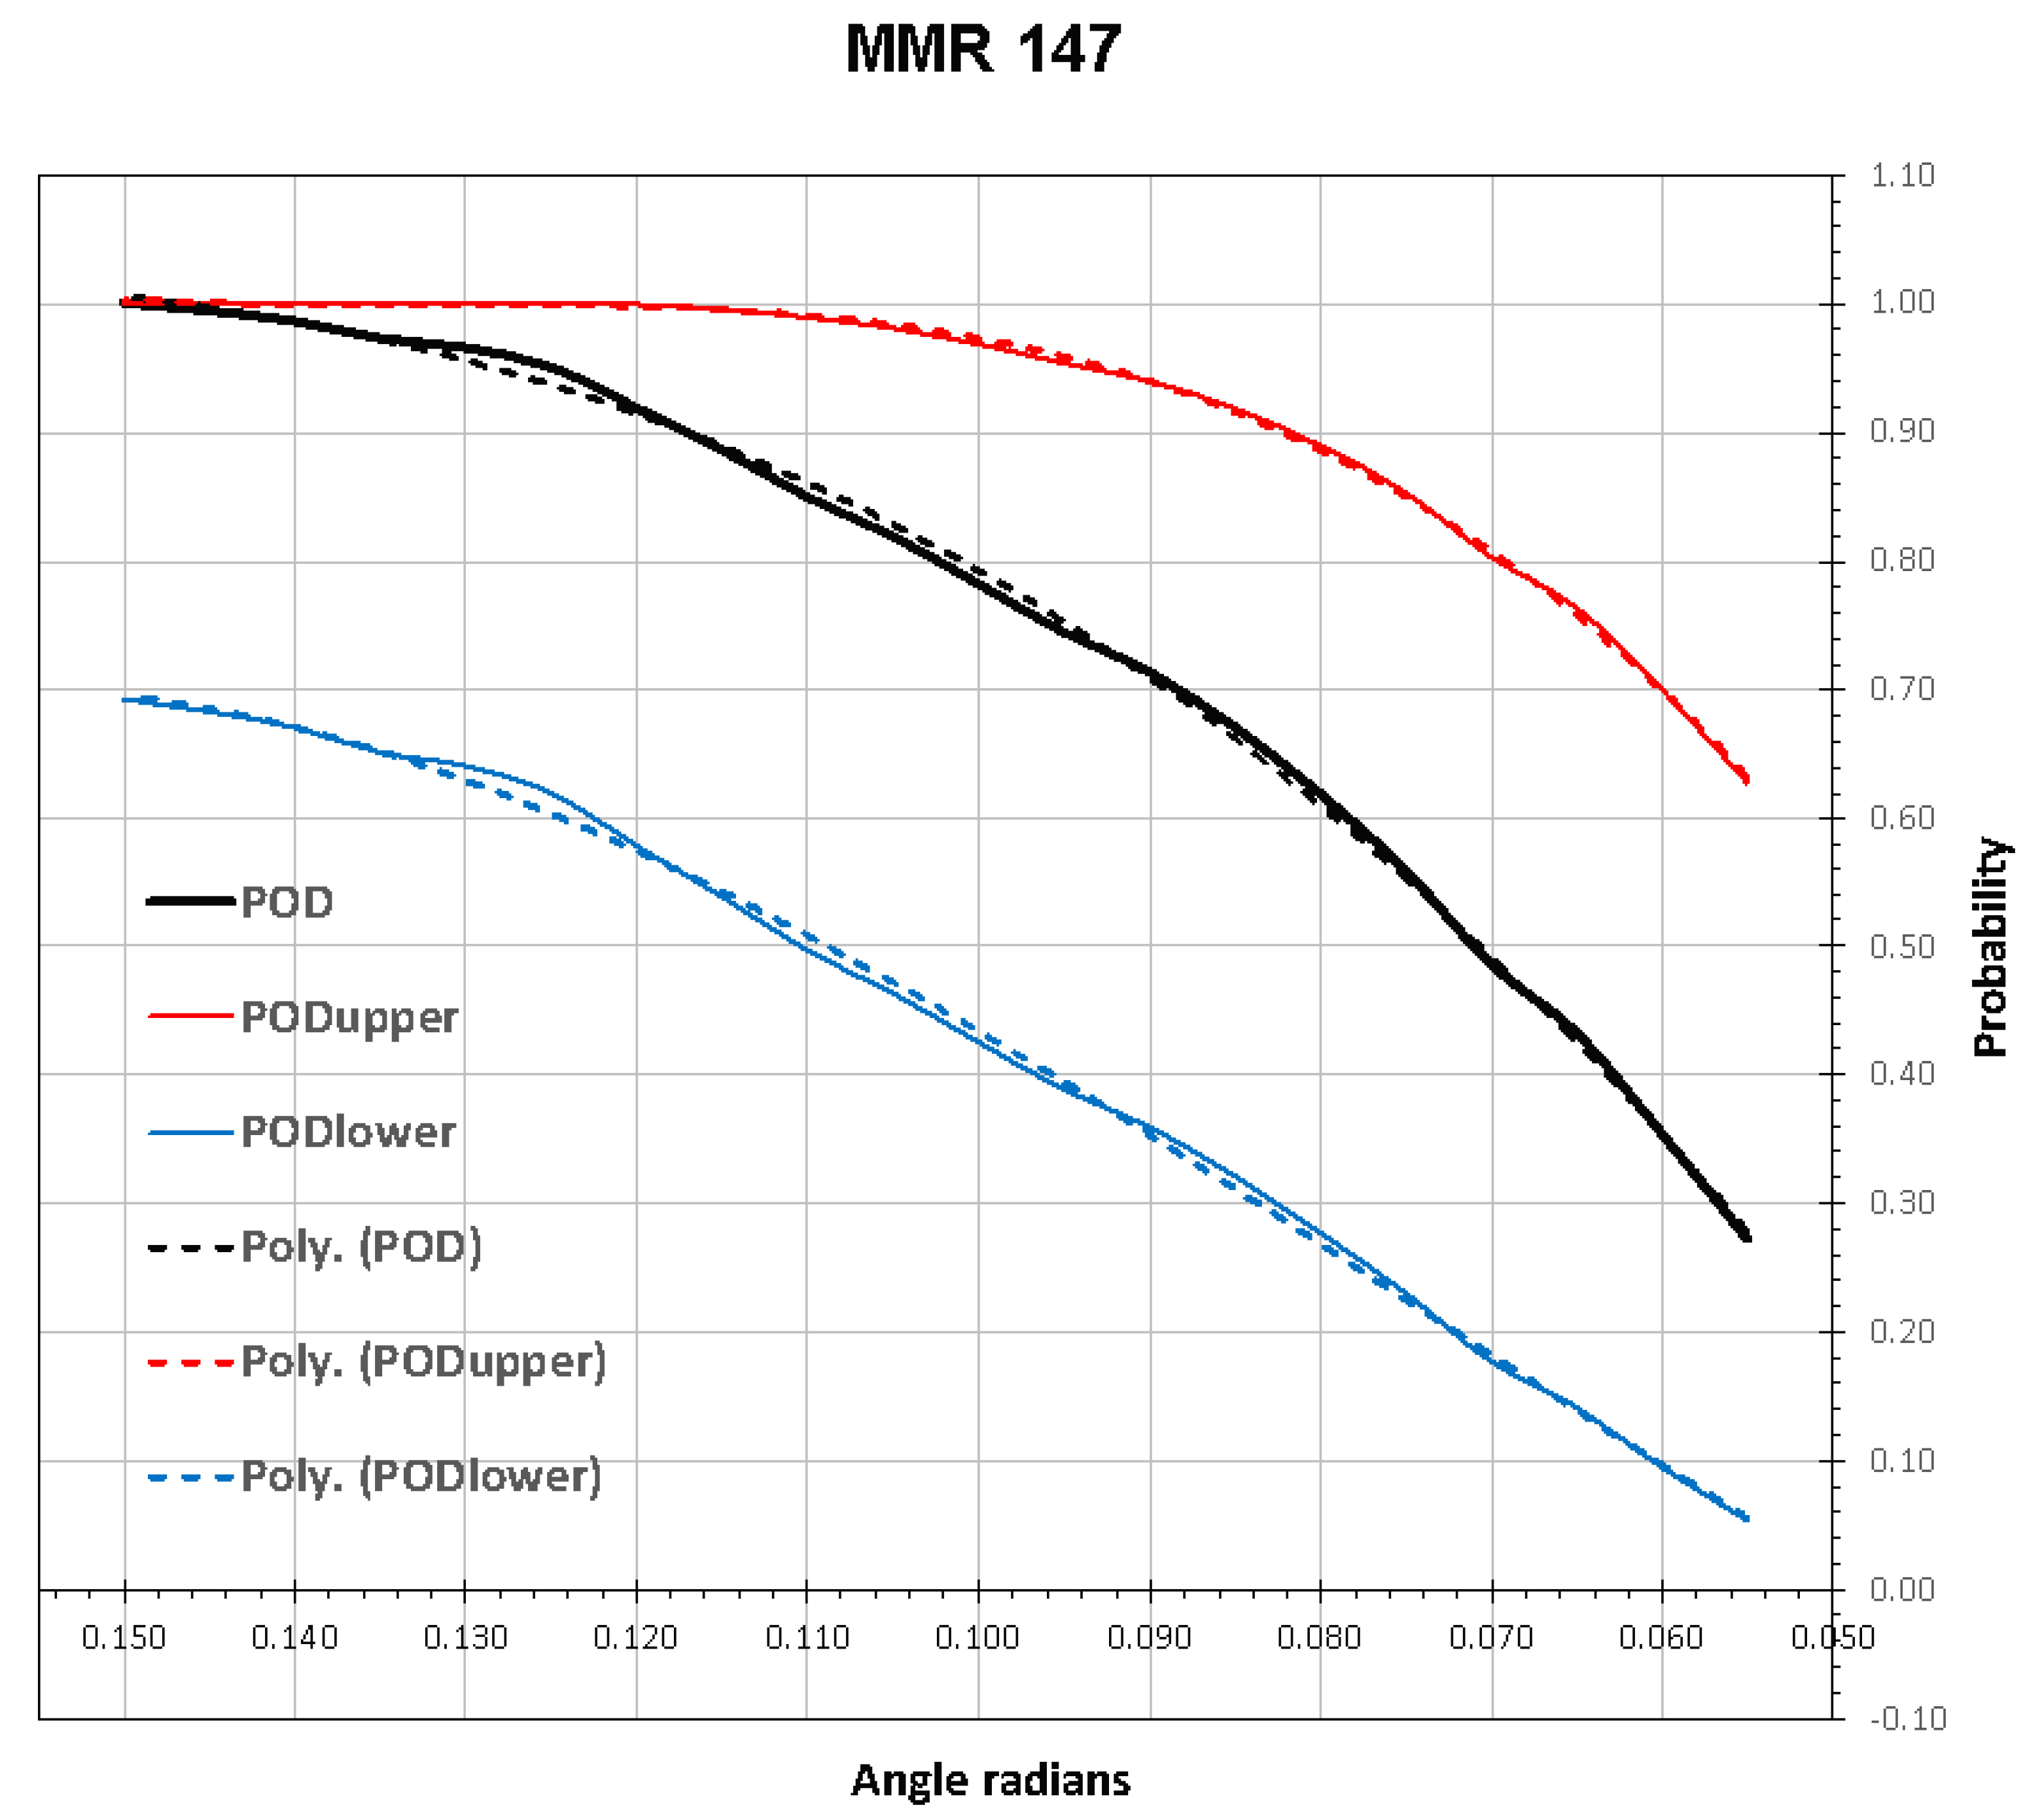
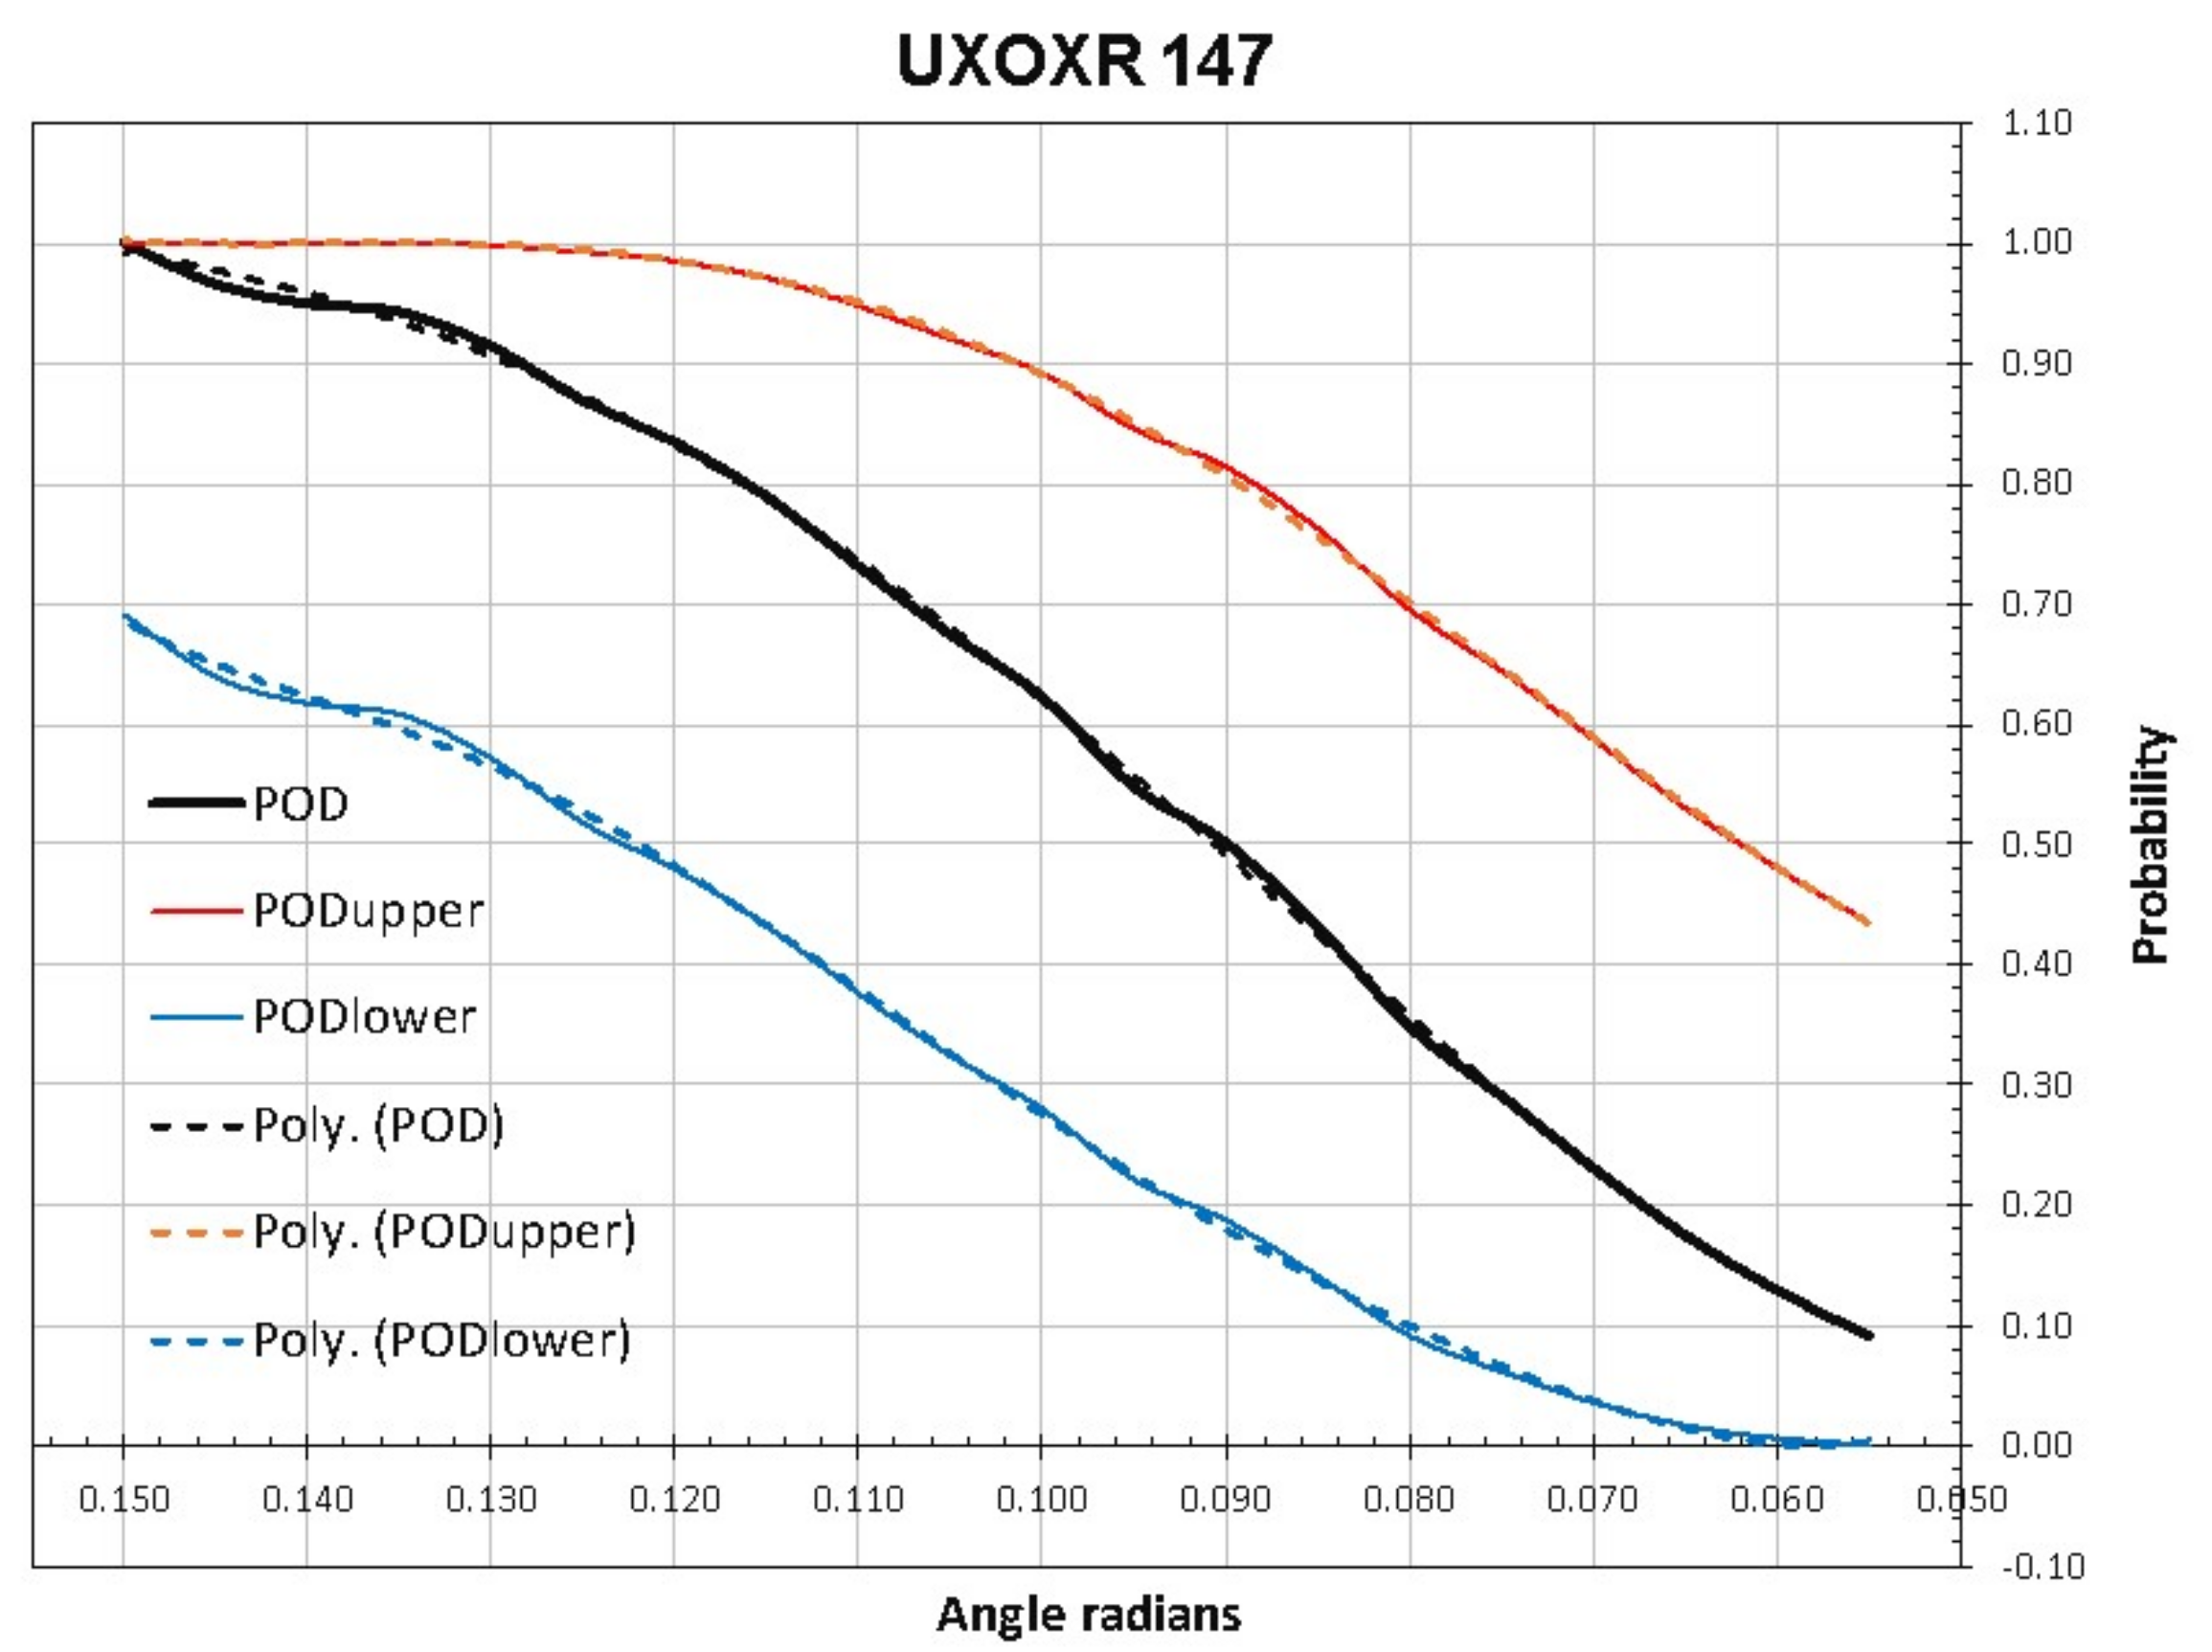
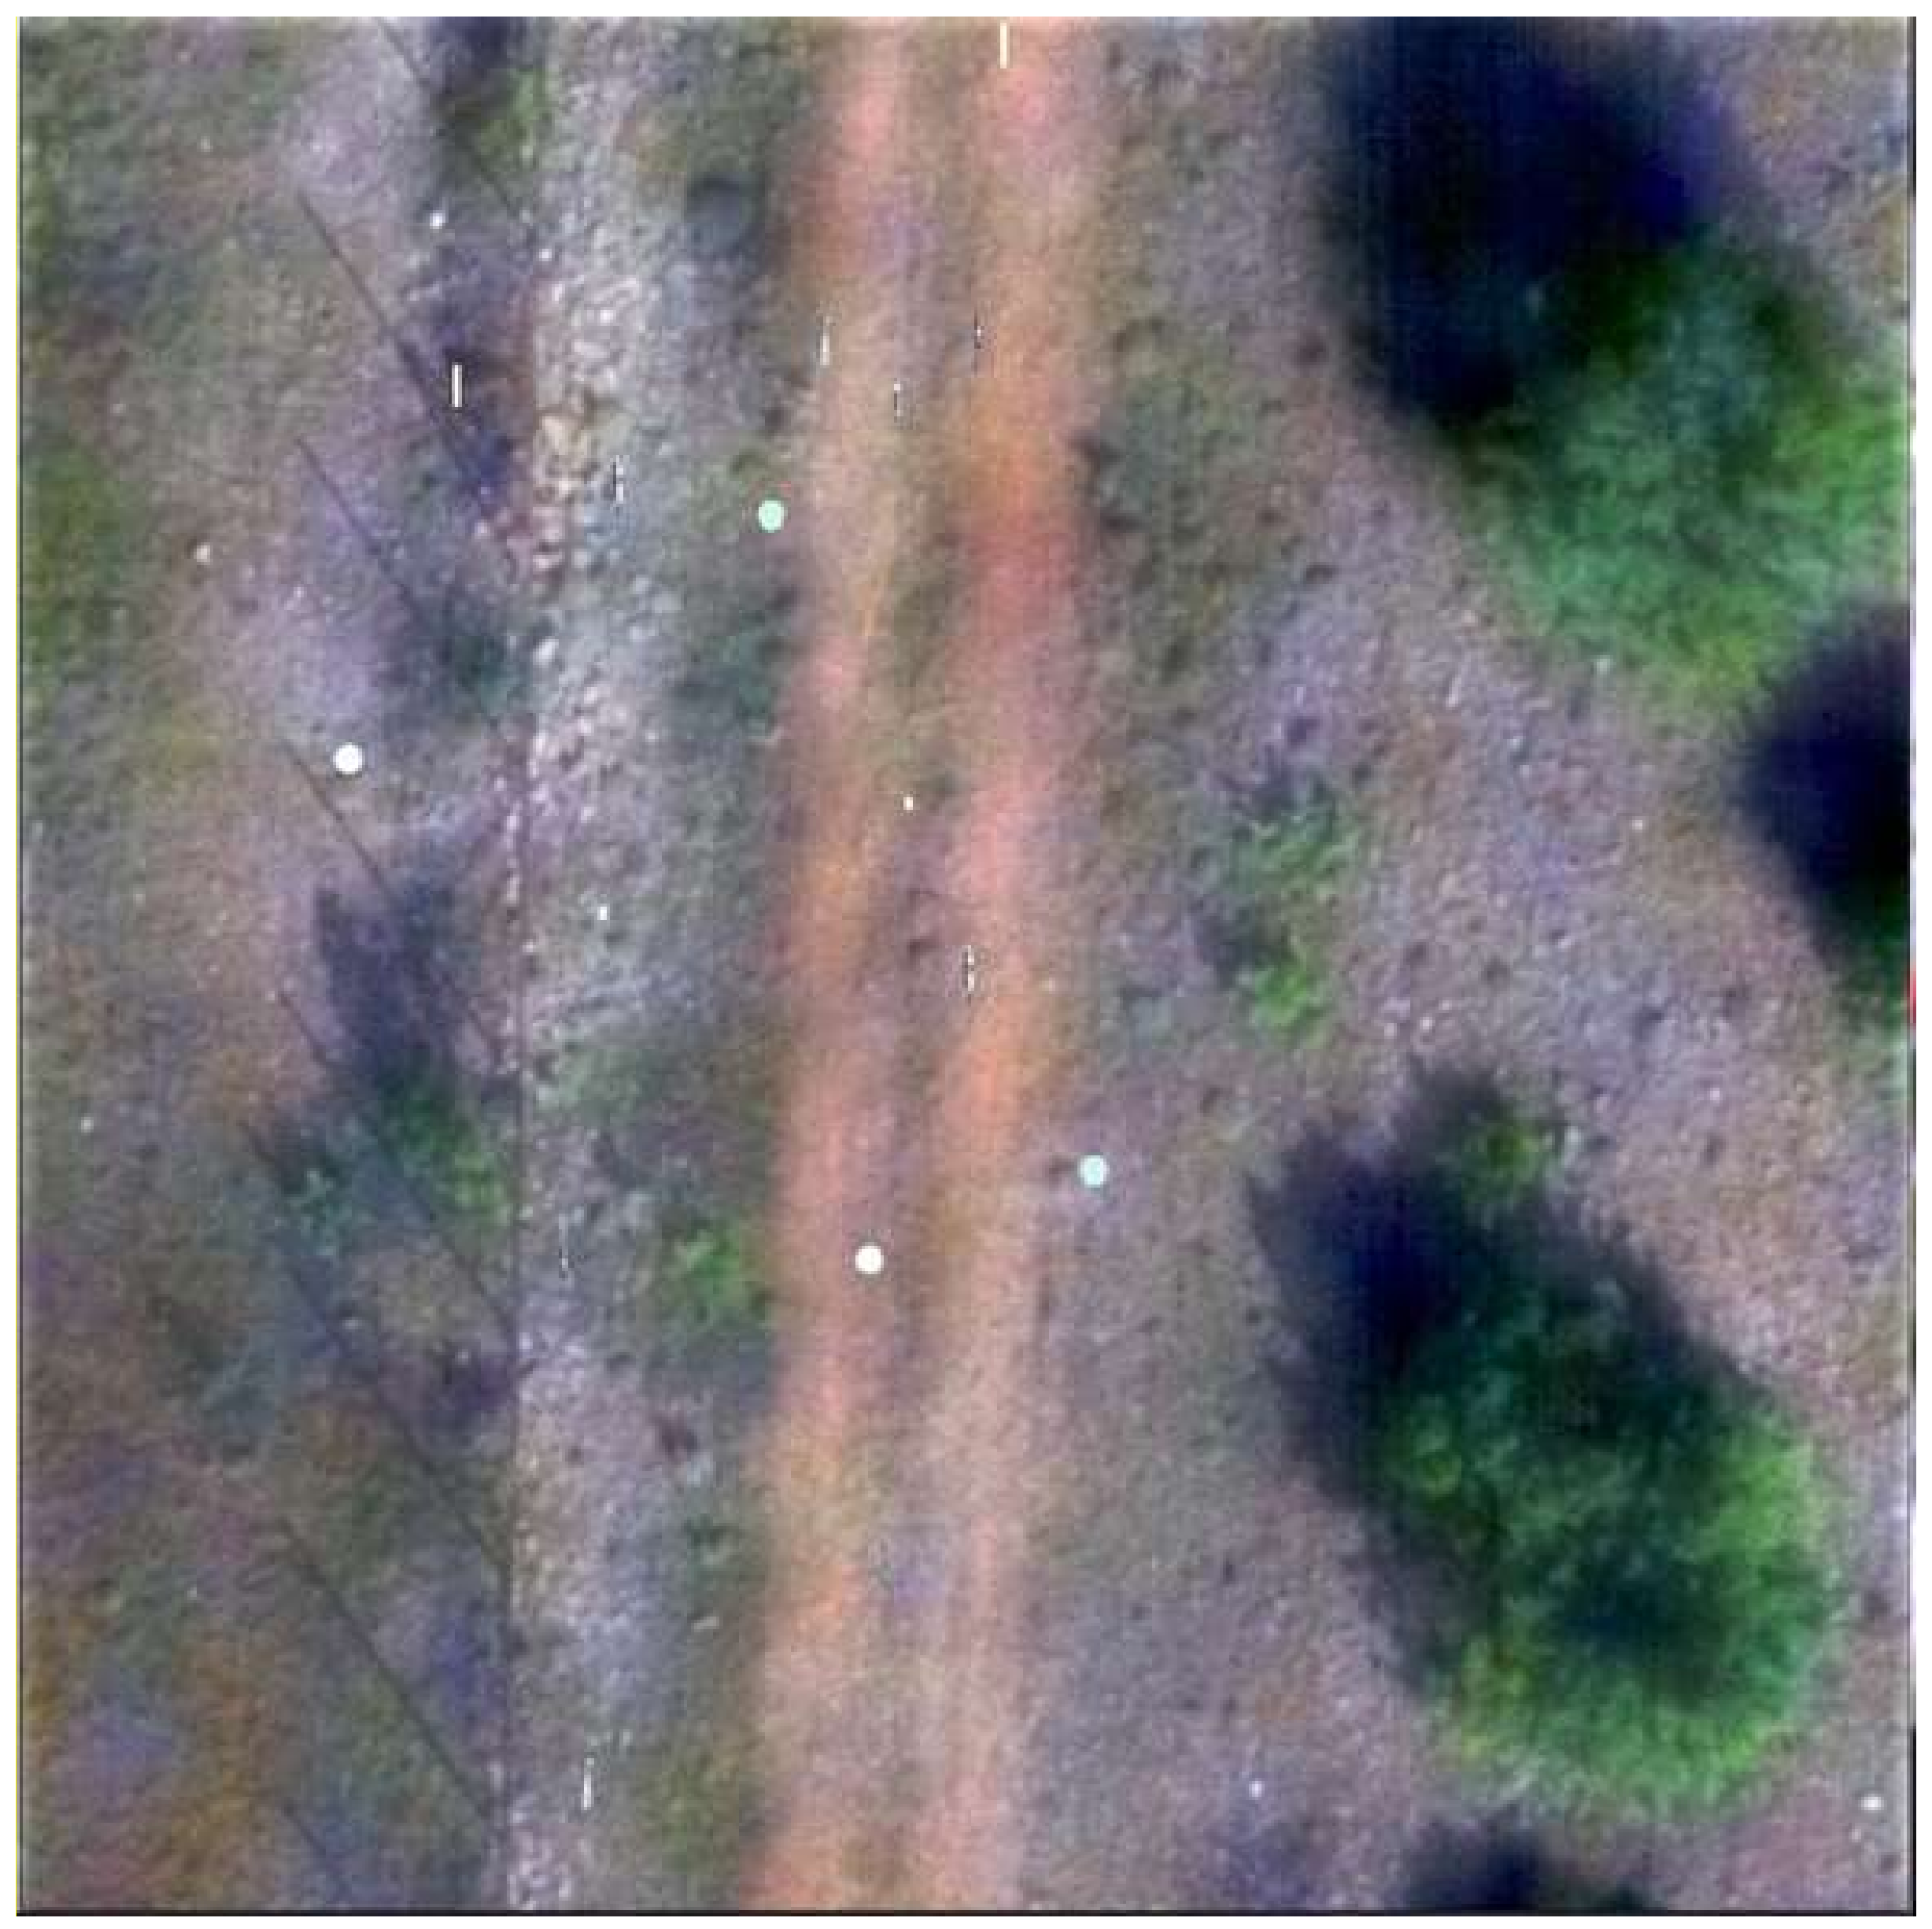
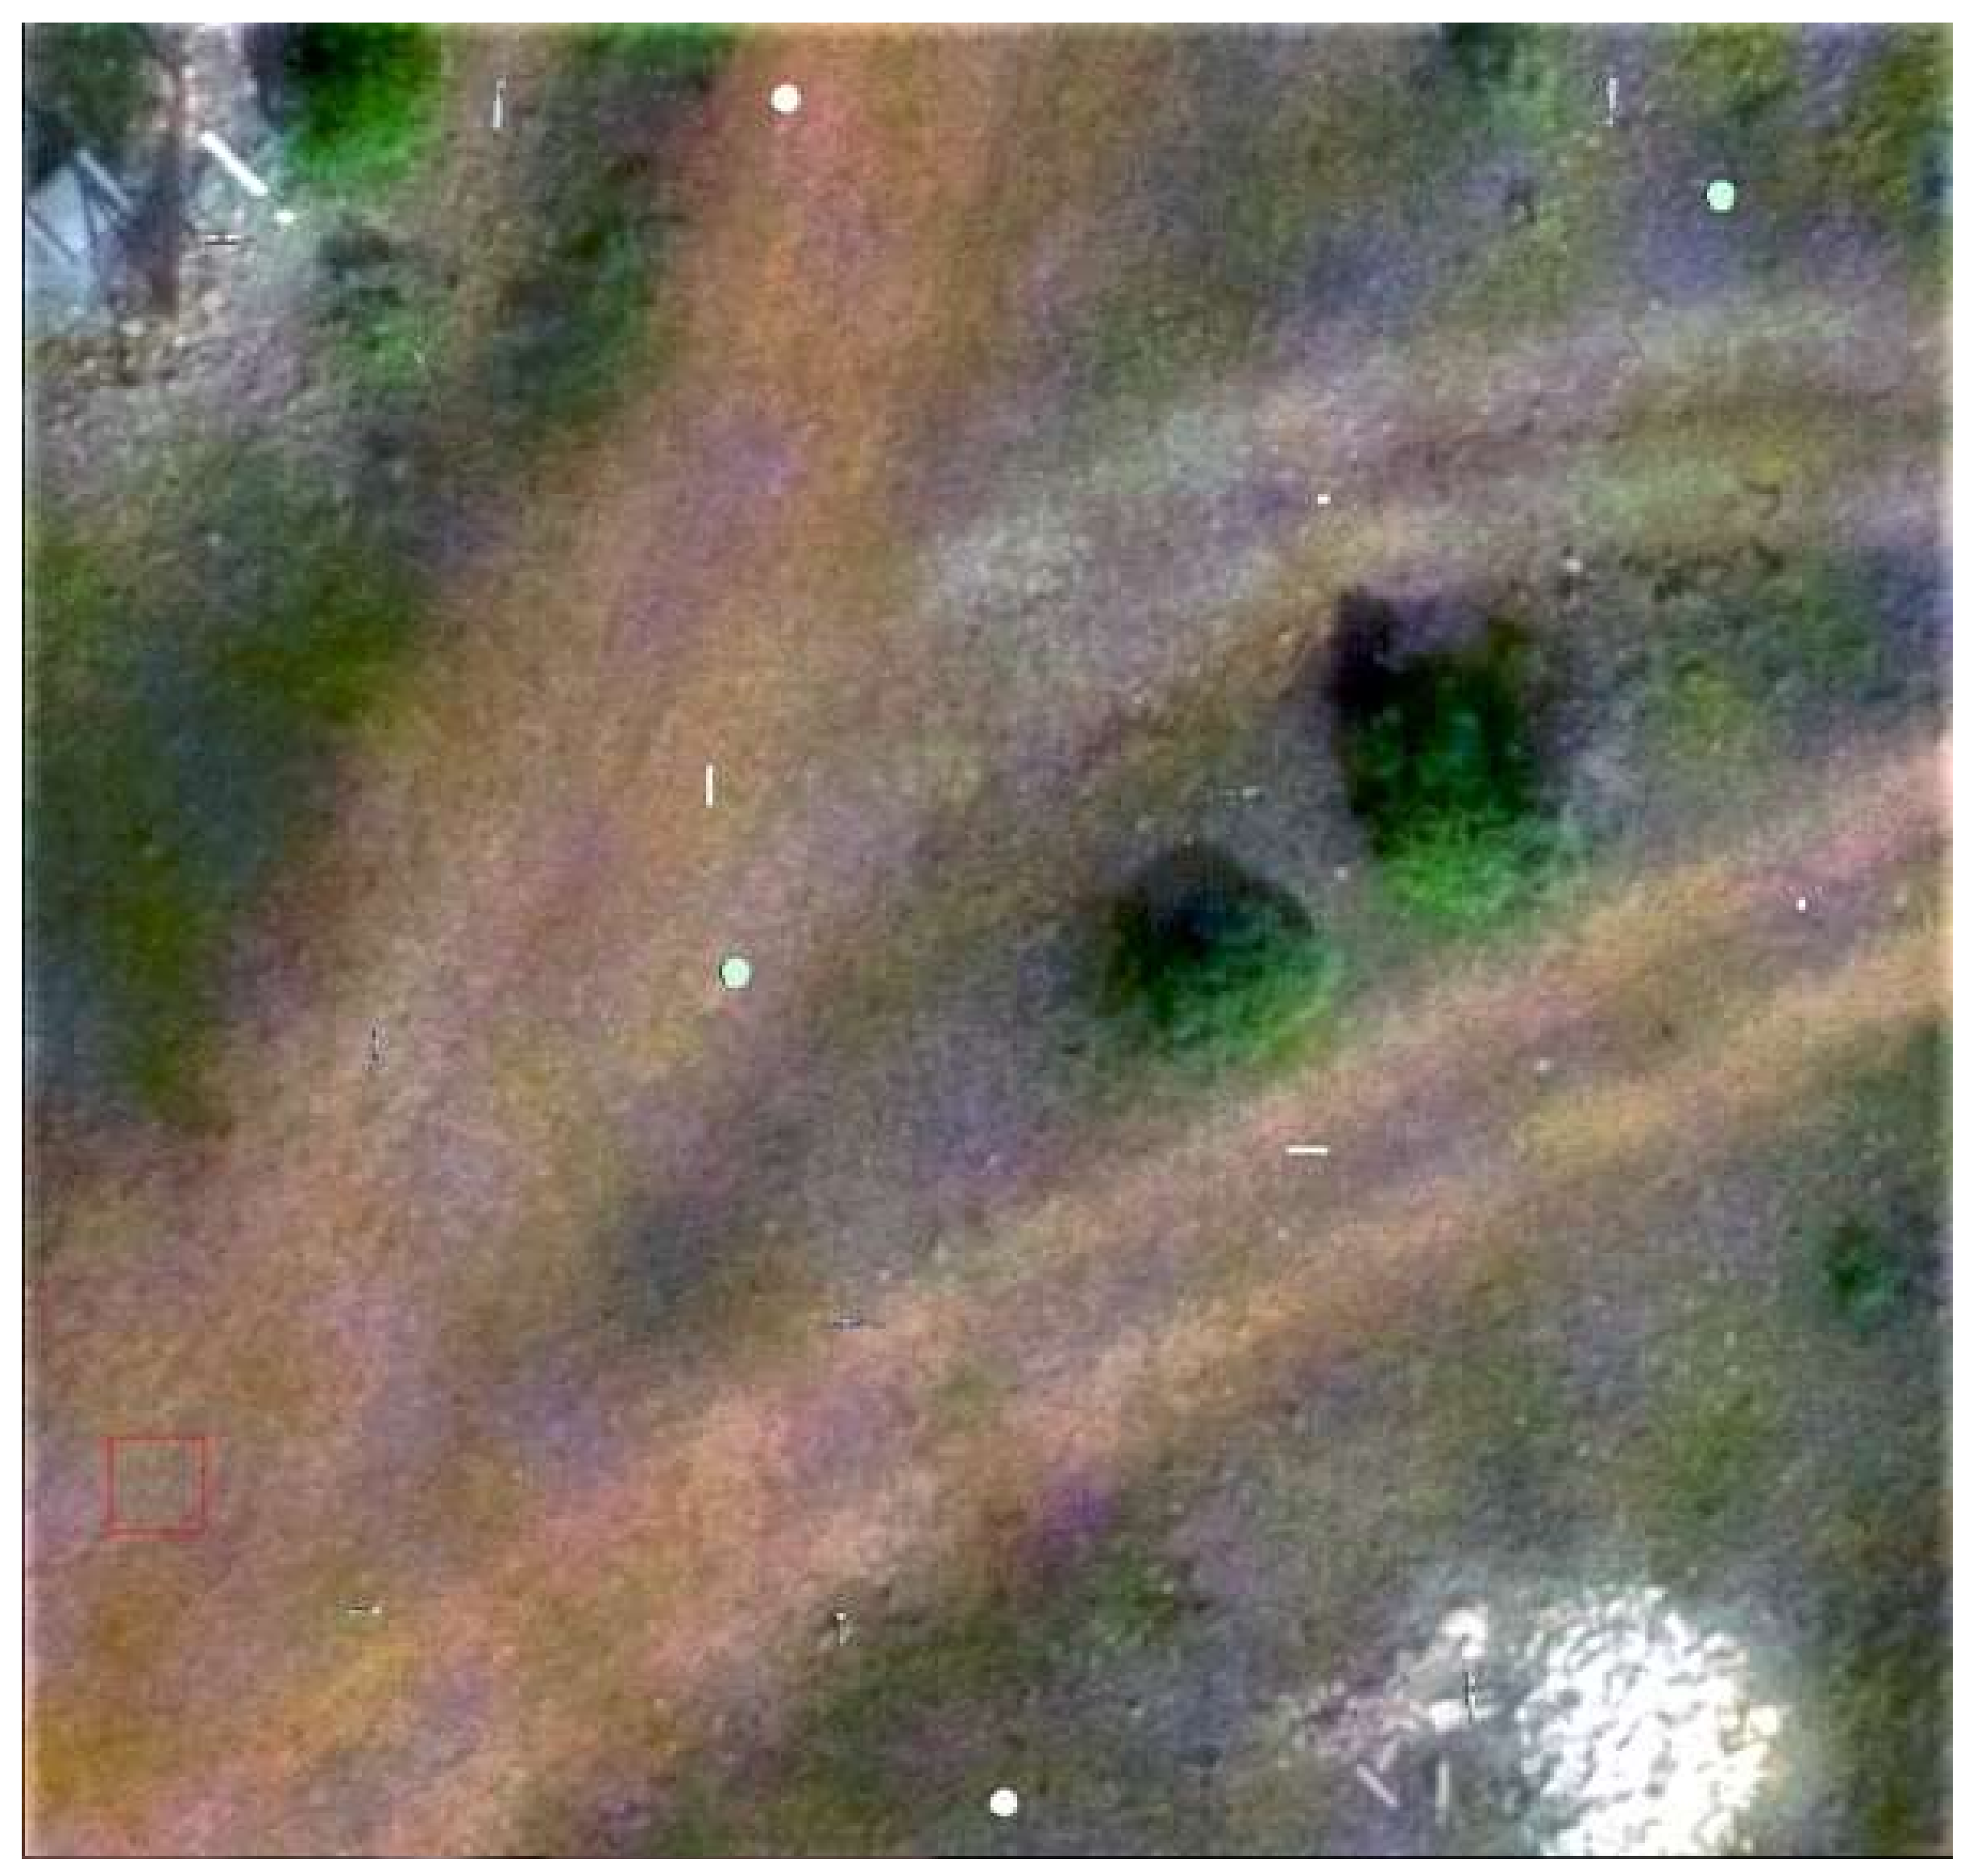
Table 1.
Implanting spectral data of targets in the hyperspectral scene of the terrain.
| No | Action | Description |
|---|---|---|
| 1 | Correcting the geometry of measured target data by NN interpolation. | Use raw measured data of the target Figure 4a. Corrected targets are shown in Figure 4b and Figure 5, Figure 6, Figure 7, Figure 8 and Figure 9. ENVI |
| 2 | Extracting the target from its nearest environment | ENVI. |
| 3 | Decrease the extracted target (small target) to 0.05058 of its original dimensions. | ENVI: After decreasing dimension, export to the stack tifs. Match target pixels (0.945 mm) to pixels (18.681 cm) of terrain field (Figure 21b). |
| 4 | Export hyperspectral terrain field spectral data; 1000 × 1000 × 90, in 32-bit tiff stack. Co-ordinates can be pixel numbers or meters (if georeferenced). | Figure 18 (scene 147) and Figure 19 (scene 227). If desired scenes should be georeferenced, co-ordinates of pixels (in m) can be used. We recommend applying pixel co-ordinates and doing the georeferencing (if needed) on the simulation outcomes. |
| 5 | Implanting small targets in a blackboard stack (1000 × 1000 × 90), where blackboard pixels have value = 0; format 32 bits tiff. | Figure 22a. The targets are visible on the black background. ImageJ. |
| 6 | Inversing blackboard of step 5. Change targets area values to 1, and the values of the blackboard to 0, all in 32 bits floating-point format, in 90 channels. | This can be seen by inversing Figure 22b. ImageJ. |
| 7 | Implant areas of inversed small targets in blackboard stack of 1000 × 1000 × 90. | Figure 22b. ImageJ. |
| 8 | Locations of small targets into the scene of terrain | Figure 22c. Multiplying Figure 22b with the scene of the terrain in Figure 19. ImageJ. |
| 9 | Implanting small targets onto the scene of the terrain | Add blackboard array (Figure 22a) to the outcome of step 8. Result shown in Figure 22d. |
Table 2.
Spectral samples available in the measured targets and their decreased versions.
| Target | Samples per Band in the Measured Target | Samples per Band in the Decreased Target | Percentage % of Implanted Spectral Samples | Target Area m2 |
|---|---|---|---|---|
| Artillery shell | 45,661 | 108 | 0.2365 | 0.037690 |
| Bullet | 36,243 | 87 | 0.2400 | 0.030362 |
| Cluster munition | 24,653 | 63 | 0.2555 | 0.021986 |
| Mortar mine | 45,285 | 116 | 0.2562 | 0.040482 |
| UXOX | 19,251 | 52 | 0.2701 | 0.018147 |
| Landmine PMR2A | 7 | 1 | 14.2857 | 0.009500 |
| Landmine TMA-4 | 8 | 1 | 12.5000 | 0.063340 |
Table 3.
Polynomial approximation functions of targets overlayed with 10% of terrain 147.
| Polynomial Approximation | |
|---|---|
| ASR 147 | |
| PODupper | y = 4E6x6 − 3E6x5 + 1E6x4 − 166833x3 + 14875x2 − 663.1x + 11.849 |
| POD | y = −4E6x6 + 2E6x5 − 240255x4 − 662.15x3 + 2877.7x2 − 220.25x + 5.0015 |
| PODlower | y = −9E6x6 + 6E6x5 − 1E6x4 + 177823x3 − 11922x2 + 400.99x − 5.2922 |
| BR 147 | |
| PODupper | y = 6E6x6 − 4E6x5 + 940755x4 − 131459x3 + 10406x2 − 429.58x + 7.4796 |
| POD | y = 1E7x6 − 7E6x5 + 2E6x4 − 199237x3 + 14057x2 − 526.59x + 8.1301 |
| PODlower | y = 1E7x6 − 6E6x5 + 1E6x4 − 152510x3 + 9421.4x2 − 306.4x + 4.1181 |
| CMR 147 | |
| PODupper | y = 8E6x6 − 5E6x5 + 1E6x4 − 202551x3 + 15760x2 − 620.39x + 10.161 |
| POD | y = 1E7x6 − 7E6x5 + 2E6x4 − 303933x3 + 24386x2 − 990.91x + 16.095 |
| PODlower | y = 8E6x6 − 6E6x5 + 2E6x4 − 250338x3 + 20267x2 − 835.47x + 13.698 |
| MMR 147 | |
| PODupper | y = 806.5x3 − 319.41x2 + 42.148x − 0.8546 |
| POD | y = 217.42x3 − 141.66x2 + 29.343x − 0.9423 |
| PODlower | y = −403.37x3 + 89.372x2 + 2.0295x − 0.259 |
| UXOXR 147 | |
| PODupper | y = 19706x4 − 8375.7x3 + 1204.7x2 − 61.222x + 1.3705 |
| POD | y = 13569x4 − 6690.5x3 + 1123.3x2 − 65.845x + 1.3051 |
| PODlower | y = 1E7x6 − 7E6x5 + 2E6x4 − 226501x3 + 16046x2 − 599.6x + 9.1702 |
Table 4.
Polynomial approximation functions of targets 25,7% obscured in scene 227.
| Function | Polynomial Approximation |
|---|---|
| ASR 227 | |
| PODupper | y = 1E7x6 − 7E6x5 + 2E6x4 − 242706x3 + 18625x2 − 743.66x + 12.321 |
| POD | y = 1E7x6 − 7E6x5 + 2E6x4 − 227551x3 + 16594x2 − 637.76x + 10.023 |
| PODlower | y = 6E6x6 − 3E6x5 + 681375x4 − 70842x3 + 4006.8x2 − 119.2x + 1.4781 |
| BR 227 | |
| PODupper | y = −3E7x6 + 2E7x5 − 5E6x4 + 643587x3 − 45100x2 + 1633x − 23.579 |
| POD | y = −5E7x6 + 3E7x5 − 7E6x4 + 884396x3 − 62088x2 + 2252.8x − 33.03 |
| PODlower | y = −3E7x6 + 2E7x5 − 4E6x4 + 572692x3 − 40514x2 + 1480x − 21.823 |
| CMR 227 | |
| PODupper | y = 1E7x6 − 7E6x5 + 2E6x4 − 222440x3 + 16107x2 − 590.99x + 9.0346 |
| POD | y = −1E6x6 + 302964x5 + 37216x4 − 19070x3 + 2276.7x2 − 103.6x + 1.7106 |
| PODlower | y = −9E6x6 + 5E6x5 − 1E6x4 + 145792x3 − 9412.4x2 + 316.94x − 4.3969 |
| MMR 227 | |
| PODupper | y = −1E6x6 + 1E6x5 − 346262x4 + 57389x3 − 5092.5x2 + 241.73x − 4.1651 |
| POD | y = −3E6x6 + 3E6x5 − 997759x4 + 163684x3 − 14079x2 + 621.58x − 10.871 |
| PODlower | y = −4E6x6 + 4E6x5 − 1E6x4 + 188319x3 − 15692x2 + 663.92x − 11.22 |
| UXOXR 227 | |
| PODupper | y = 1E7x6 − 1E7x5 + 3E6x4 − 427371x3 + 34075x2 − 1388.2x + 22.829 |
| POD | y = 2E7x6 − 1E7x5 + 4E6x4 − 523864x3 + 40335x2 − 1605.7x + 25.685 |
| PODlower | y = 1E7x6 − 8E6x5 + 2E6x4 − 269836x3 + 19689x2 − 755.96x + 11.847 |
Publisher’s Note: MDPI stays neutral with regard to jurisdictional claims in published maps and institutional affiliations. |
© 2021 by the authors. Licensee MDPI, Basel, Switzerland. This article is an open access article distributed under the terms and conditions of the Creative Commons Attribution (CC BY) license (http://creativecommons.org/licenses/by/4.0/).
Share and Cite
MDPI and ACS Style
Bajić, M., Jr.; Bajić, M. Modeling and Simulation of Very High Spatial Resolution UXOs and Landmines in a Hyperspectral Scene for UAV Survey. Remote Sens. 2021, 13, 837. https://doi.org/10.3390/rs13050837
AMA Style
Bajić M Jr., Bajić M. Modeling and Simulation of Very High Spatial Resolution UXOs and Landmines in a Hyperspectral Scene for UAV Survey. Remote Sensing. 2021; 13(5):837. https://doi.org/10.3390/rs13050837
Chicago/Turabian StyleBajić, Milan, Jr., and Milan Bajić. 2021. "Modeling and Simulation of Very High Spatial Resolution UXOs and Landmines in a Hyperspectral Scene for UAV Survey" Remote Sensing 13, no. 5: 837. https://doi.org/10.3390/rs13050837
Note that from the first issue of 2016, this journal uses article numbers instead of page numbers. See further details here.