Article

An Approach to High-Resolution Rice Paddy Mapping Using Time-Series Sentinel-1 SAR Data in the Mun River Basin, Thailand

1
State Key Laboratory of Resources and Environmental Information System, Institute of Geographic Sciences and Natural Resources Research, Chinese Academy of Sciences, Beijing 100101, China
2
CAS Engineering Laboratory for Yellow River Delta Modern Agriculture, Institute of Geographic Sciences and Natural Resources Research, Chinese Academy of Sciences, Beijing 100101, China
3
Key Laboratory of Agricultural Remote Sensing, Ministry of Agriculture and Rural Affairs, Institute of Agricultural Resources and Regional Planning, Chinese Academy of Agricultural Sciences, Beijing 100081, China
*
Author to whom correspondence should be addressed.
These two authors contributed equally: He Li & Chong Huang.
Remote Sens. 2020, 12(23), 3959; https://doi.org/10.3390/rs12233959
Submission received: 10 November 2020 / Revised: 26 November 2020 / Accepted: 1 December 2020 / Published: 3 December 2020

Abstract

:
Timely and accurate regional rice paddy monitoring plays a significant role in maintaining the sustainable rice production, food security, and agricultural development. This study proposes an operational automatic approach to mapping rice paddies using time-series SAR data. The proposed method integrates time-series Sentinel-1 data, auxiliary data of global surface water, and rice phenological characteristics with Google Earth Engine cloud computing platform. A total of 402 Sentinel-1 scenes from 2017 were used for mapping rice paddies extent in the Mun River basin. First, the calculated minimum and maximum values of the backscattering coefficient of permanent water (a classification type within global surface water data) in a year was used as the threshold range for extracting the potential extent. Then, three rice phenological characteristics were extracted based on the time-series curve of each pixel, namely the date of the beginning of the season (DBS), date of maximum backscatter during the peak growing season (DMP), and length of the vegetative stage (LVS). After setting a threshold for each phenological parameter, the final rice paddy extent was identified. Rice paddy map produced in this study was highly accurate and agreed well with field plot data and rice map products from the International Rice Research Institute (IRRI). The results had a total accuracy of 89.52% and an F1 score of 0.91, showing that the spatiotemporal pattern of extracted rice cover was consistent with ground truth samples in the Mun River basin. This approach could be expanded to other rice-growing regions at the national scale, or even the entire Indochina Peninsula and Southeast Asia.

Graphical Abstract

1. Introduction

Fields of paddy rice, one of the three leading grain crops throughout the world, account for approximately 12% of global cropland area and feed more than half of the world’s population [1]. The fields, or paddies, are the important reservoirs of water and methane (the second most abundant greenhouse gas) emissions because of the waterlogged environment [2,3], which has implications for water management and climate change [4,5]. Therefore, efficient and timely collection of accurate information on the geographic location, distribution, and extent of rice paddies is important for sustainable rice production, water and food security, greenhouse gas emissions, environmental sustainability, effective decision making, and policy management [2,6,7,8,9,10,11,12,13].
Despite its significance for water and food security and global change research, the extent of rice paddies worldwide still remains uncertain [14,15]. Those existing maps covering the continental or global scale have been derived primarily from regional or national statistics, which cannot reflect the extent or distribution of rice paddies across large areas [16,17]. Remote sensing has gradually become the core alternative for rice paddy mapping over large areas due to its low cost, scalability, unbiased estimates, high temporal resolution, and spatial continuity [18,19].
Remotely sensed rice paddy mapping has been performed since the launch of the first-generation Landsat satellite [9], and subsequent research has grown more and more. Early traditional unsupervised and supervised image classification methods have been applied using single and multitemporal optical images such as Landsat, SPOT, or other higher spatial resolution satellite images [20,21,22,23,24,25] to fulfill the needs of rice paddy mapping. With the development of classification methods, new classification algorithms such as neural networks (NNs), support vector machines (SVMs), random forest (RF), and deep learning have been gradually introduced into rice paddy mapping [3,26,27]. However, these methods commonly require local prior knowledge to map rice paddies at relatively fine scales, which is not always directly exportable to other regions at larger scales.
In recent years, time-series vegetation indices were gradually increasingly used for extracting the extent of rice paddies at regional or larger scales [9,13,14,20,22,24,28,29,30,31,32,33,34,35,36,37]. Common indices include the normalized difference vegetation index (NDVI), normalized difference water index (NDWI), land surface water index (LSWI), and the enhanced vegetation index (EVI). The indices are often used with multispectral data with medium-low spatial resolution, e.g., SPOT vegetation (VGT), or moderate resolution imaging spectroradiometer (MODIS). Due to the large number of mixed pixels, however, additional high-resolution imagery is needed for estimating the fractional coverage of rice paddies in each mixed pixel, and the overall classification accuracies are typically not high [3,33,38,39,40].
Some recent research has also used time-series remote sensed vegetation index products from Landsat or Chinese HJ-1 satellites with a high spatial resolution of 30 m [6,10,18,30,41,42]. Although most of these studies provide effective performance for revealing the spatial heterogeneity of rice paddies, they also have limitation. Since most of the available imagery with a spatial resolution of 30–1000 m, it is difficult to identify the smaller rice paddy areas with a spatial resolution of less than 30 m, which may be the dominant planting pattern and size in agriculturally developing countries [43]. The Sentinel-2 A/B optical satellites launched by European Space Agency (ESA) in 2015 and 2017, respectively, can provide the imagery with a higher resolution of 10–20 m, which facilitates the identification of very small rice paddies. It may be difficult to separate rice from other crops or vegetation types in humid tropical and subtropical areas. This is because of substantial unfavorable cloudy or rainy weather, which inevitably leads to unusable imagery in the series, constraining the application of optical time series images [19,44,45]. Thus, mapping rice paddies with a higher spatial resolution, short revisit time, wide coverage area, and all-weather capabilities is urgently needed.
Contrary to the optical satellites’ sensors, Synthetic aperture radar (SAR) is free from the influence of weather conditions. Moreover, SAR data has the special backscattering characteristics to the inundated vegetation, which can distinguish rice paddies from other crops or vegetation types, so it can be used to identify the rice fields [40,46,47]. Thus, the availability of SAR data in multiple frequencies and polarizations with frequent observations offers an important alternative for rice mapping. However, only a few SAR datasets (ERS-1/2, JERS-1, RADARSAT-1/2, ENVISAT advanced synthetic aperture radar (ASAR), TerraSAR-X, TanDEM-X, and ALOS Phased Arraytype L-band SAR (PALSAR)) could be obtained in the past decades for capturing dynamic water signals for rice mapping. Furthermore, the cost of using radar datasets is too high, which leads to the limitation of large-scale practical applications [19,23,40,45,46,48,49,50,51]. With the appearance of free data from Sentinel-1, it has become easier to use SAR datasets for the research of rice paddies identification [19,41,44,52,53,54].
Similar to optical remote sensing classification, there are two main strategies for rice paddy mapping based on SAR data. The first strategies in classification algorithms for rice detection were exploitation of backscatter properties, the polarization ratio, or polarimetric decompositions (e.g., volume scattering, double-bounce scattering, anisotropy (A), entropy (H), alpha or beta angle (a or b), amplitudes, and relative phase) [40,46,49,50,55,56]. However, these methods commonly require local prior knowledge of rice paddies at local scales. The second strategy mainly relies on a time-series analysis of SAR backscatter to capture the dynamic water signals and gradually increasingly backscattering characteristics during the rice growth process [45,48,50,53,57,58]. Although these rice paddies identification methods have been implemented using SAR data with the medium and high spatial resolution of less than 50 m, and have been proven effective at small regional scales [40], the exorbitant requirements of SAR data storage and computing should be considered when developing rice maps, especially for higher spatial resolutions of around 10 m and more frequent mapping over larger areas (regional to continental scales). Fortunately, with free access to Sentinel-1 SAR imagery and free sharing of Google Earth Engine remote sensing cloud computing platform, provides a convenient means for us to develop a rice paddy mapping method with a high spatial resolution of 10 m.
The innovation presented in this paper has two components. (1) An operational approach was developed for identifying rice paddy extent using high-resolution, dual-polarization SAR images of Sentinel-1, based on the outstanding temporal behavior of water and rice backscattering. (2) Time-series Sentinel-1 SAR datasets were used to map the extent of rice paddy in the Mun River basin in Thailand on the Indochina Peninsula. These methods and the rice map could be used to aid in local sustainable rice production, food security, water resource utilization, and policy making.

2. Materials and Methods
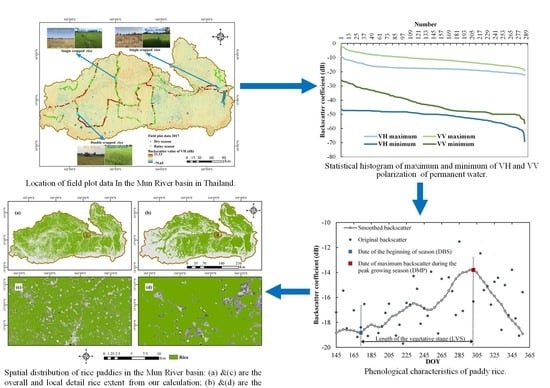
2.1. Study Area

Mun River Basin, located in Northeastern Thailand, is an important tributary of the Mekong River and the largest river basin in the country. The total area is approximately 71,000 km2, and covering 10 provinces (Figure 1). The Mun river begins in the Sankamphaeng Range, flows through the Korat Plateau, and finally enters into the Mekong River at the Khong Chiam in Ubon Ratchathani. The terrain of this basin is higher in the southwest with plateaus and mountains and lower in the eastern plains.
The study area is located in the tropics, significantly affected by the Asian monsoon climate, and has the characteristics of distinct rainy/wet and dry seasons. In the rainy/wet season, i.e., mid-May to mid-October, the southwest monsoon brings abundant precipitation to the study area, with the ranging from 1300 to 1500 mm, and the maximum precipitation occurs in August or September. While in the dry season, i.e., mid-October to mid-May of the following year, the northeast monsoon brings a dry climate with little precipitation. The annual average temperature is higher than 18 °C, with the highest of 40–42 °C in April and the lowest in December or January [59].
The warm climate, concentrated abundant precipitation, and convenient river water resources provide excellent conditions for rice cultivation in the Meng River Basin. There are approximately 75% of the agricultural land is devoted to the paddy fields in our study area. Farmers in this area generally rely on the precipitation as the main water source to plant single-season rice with the cultivation mode of direct-seeding during the rainy/wet season, and the main varieties of rice are the photoperiod-sensitive varieties, such as RD15, RD6, and KDML105, whose phenological periods vary from 150 to 180 days [45]. A small number of farmers near the Mun River or its tributaries rely on their convenient irrigation conditions to replant rice with direct-seeding during the dry season, and the main varieties of paddy rice are the non-photoperiod-sensitive varieties, such as RD series (RD29, RD31, RD41, etc.), PTT1, or SPR1, whose phenological periods vary from approximately 95 to 120 days [45].

2.2. Data Preparation

2.2.1. Field Plot Data

The main purpose of field-plot data is to identify and validate classified rice paddies. The field-plots are commonly selected as the area with uniform and homogeneous, which can be easy accessed by the road. Representative samples should be able to represent one of land use/cover types, so as to ensure that the geographic location of each class of pixel is accurate [14]. The spatial resolution of time-series Sentinel-1 data and the final rice map was 10 m. Thus, the representative field plot data is based on our field observations with homogeneous land cover in a minimum radius of 50 m [45] for each plot in this study.
Sampled field-plot data was gathered from two field trips carried out at 542 locations during 24 February to 10 March (dry season) and 698 locations during 15–24 August (rainy season) in 2017. The 1240 locations in total were all recorded with the geographic coordinates from a handheld Trimble GeoXT3000 GPS receiver along with the observed cropping pattern or land cover categories and digital photographs (Figure 2). Furthermore, interviews with farmers were conducted to collect relevant information about crop planting, including the crop varieties, sowing density, fertilization amount, spraying conditions, crop growth phenology period (such as seeding, jointing, heading, booting, and harvesting), and the rice ecosystem (irrigated or rainfed). Ultimately, all observed field-plots were used as the validation points for verifying the accuracy of the final classification results in this study. In the end, 722 observation samples of rice paddies were obtained, and the remaining 518 sample plots were unified as the other land use/land cover types.

2.2.2. Time-Series Sentinel-1 SAR Data

Current Sentinel-1 is a satellite constellation composed of Sentinel-1A and Sentinel-1B. These two satellites have the same orbital plane, and carry the same dual-polarization synthetic aperture radar (SAR) sensors. The working band and the frequency of these SAR are the C-band, and 5.4 GHz, respectively [60]. The Sentinel-1 satellites are the important part of the Global Monitoring for Environment and Security program (GMES, a set of earth observation missions by ESA). Two additional satellites of Sentinel-1C and Sentinel-1D will be launched to provide better all-weather, day-and-night, and continuous Earth observation services [53,61]. With a high spatial resolution (10 m) and short revisit period (12 days for one satellite, and 6 days for two satellites), Sentinel-1 is an attractive option for frequent, effective mapping of rice paddies at a large regional level.
The Sentinel-1 satellite products covering the Mun River watershed can be obtained from the Copernicus Open Access Hub [61]. The Sentinel-1 Level-1 ground range detected (GRD) products could also be used via the Google Earth Engine platform [62] after the scenes had been preprocessed as a backscatter coefficient in decibels (dB) using the Sentinel-1 Toolbox in this study. The operations included: (1) applying the precise orbit ephemerides file to update the orbit metadata to reduce the impact of satellite orbit errors on imagery; (2) a SAR border noise removal function to remove the invalid values on imagery edges and the low intensity noise; (3) a thermal noise removal operator to reduce additive thermal noise effects; (4) a radiometric calibration step to convert the digital signal to radiometrically calibrated backscatter; and (5) orthorectification to remove the effects of scenes perspective and terrain, and get the backscatter coefficient of each pixel by using the NASA shuttle radar topography mission (SRTM) global digital elevation model (DEM) products [54,63]. To further reduce the short-term influence of speckle, high frequency signals, and other noise inherent in the Sentinel-1 data, and to further aid the extraction of the key phenological characteristics of paddy rice, the obtained time-series backscattering imagery were filtered using a multitemporal speckle filter named a Gaussian filter [52,64].
The Sentinel-1 data ultimately used in the study had a high spatial resolution of 10 m for the study area with dual-polarization of VV (vertical transmit and vertical receive) and VH (vertical transmit and horizontal receive) in the mode of “Interferometric Wide Swath (IW)”. The VV polarized and VH polarized data were selected for potential water information and rice mapping, respectively, because of their accuracy in detecting water and rice paddies [52,53]. Finally, 402 available Sentinel-1 SAR images were acquired over the study area in 2017. The coverage frequency of the acquired data is shown in Figure 3. The high temporal resolution and wide range of dense data coverage of the Sentinel-1 mission increased and improved the mapping of rice paddies in our study.

2.2.3. Auxiliary Data

The temporal distributions of surface water from 1984 to 2019 at 30 m resolution are available from the datasets of the JRC Yearly Water Classification History v1.2 [65]. These datasets were generated using more than 4.1 million Landsat satellite images (TM, ETM+, and OLI sensors’ images) between 15 March 1984 and 31 December 2019, in the Google Earth Engine. The overall producer’s accuracy and the user’s accuracy are 98.8% and 99.8%, respectively [65]. Thus, these datasets (Figure 1) could be used to calculate the backscattering threshold interval of surface water areas in our study.
The DEM data are available from the NASA SRTM V3 digital elevation products, derived from the NASA Jet Propulsion Laboratory (JPL). The spatial resolution of these DEM products is 30 m. Before sharing, this product was filled with the invalid pixels using the open products of GMTED2010, ASTER GDEM2, and NED, to ensure the spatial continuity of the elevation [63]. Thus, this dataset could be directly used to analyze or calculate slopes using Google Earth Engine.
The rice map for our study area in 2017 was acquired from the International Rice Research Institute (IRRI), derived using MODIS multispectral data with the moderate spatial resolution of 250 m and 500 m, high temporal resolution, and large study area coverage [14,22]. A new algorithm of phenology- and pixel-based paddy mapping (PPPM) was developed, then successfully applied to China and India, and the MODIS-based rice paddy maps were obtained with a high accuracy [10,54]. This data was used for intercomparison with our paddy extraction results.

2.3. Methods

Paddy rice has a unique physical feature in that it commonly grows on flooded soil, which was maintained until the harvest season. Then the rice was harvested successfully with some equipment operations in the dried condition. Thus, the temporal dynamics of this unique feature from flood water through a rapid plant growth period to an existing full canopy can be recorded with a high backscatter value difference, which make it easier to distinguish them from other land cover/land use types with no surface water. Permanent water has a low backscatter value compared with forest, grass, shrub, built-up land, and other crops. Thus, an approach integrates time-series SAR data, auxiliary data of permanent water, and rice phenological characteristics to identify flooded rice paddies. First, the threshold interval of the backscattering coefficients for permanent water were determined using the backscatter values of time-series Sentinel-1 SAR data and the global surface water data. Second, the potential rice areas were extracted with a rule-based method using the above thresholds, removing the areas that exceeded the thresholds of the elevation and slopes, and the permanent water pixels. Third, the growth and phenological characteristics of potential rice paddies were extracted based on backscatter time-series features. Fourth, the rice paddies were identified based on a decision tree approach. Last, the accuracy assessment of our rice paddy map was verified using the field plot data and reference rice map from IRRI. Figure 4 shows the diagram of the overall technical workflow. The relevant algorithm codes for rice identification are written with JavaScript code, and are available from the Supplementary Materials.

2.3.1. Determination of the Backscattering Threshold of Permanent Water

Datasets of global surface water over 36 years (from 1984 to 2019) were used to calculate the backscattering threshold interval of the water areas. These datasets classified the water into ten types: four types of permanent water (permanent, new, lost, and ephemeral) and seasonal water (seasonal, new, lost, and ephemeral), and two types of conversion between each other [65]. We selected the permanent type (areas that were always water during the 36-year period, Figure 1) and the backscattering SAR images to analyze the value ranges of all water pixels. Then we could obtain the maximum and minimum backscattering coefficients of the water pixels in each image (Equations (1) and (2)).
σ m a x , n o = M a x i m u m { σ 1 o , σ 2 o , σ 3 o , , σ i o }
σ m i n , n o = M i n i m u m   { σ 1 o , σ 2 o , σ 3 o , , σ i o }
where i is the number of water pixels, and may be different in each image, and n is the number of each image, which is between 1 and 402 in this study.
After obtaining the maximum and minimum values of water pixels in each image, we further calculated the average of all the maximum and the average of minimum values ( σ m a x _ a v e o and σ m i n _ a v e o ) of water pixels with all images (Equations (3) and (4)).
σ m a x _ a v e o = A v e r a g e { σ m a x , 1 o , σ m a x , 2 o , σ m a x , 3 o , , σ m a x , n o }
σ m i n _ a v e o = A v e r a g e { σ m i n , 1 o , σ m i n , 2 o , σ m i n , 3 o , , σ m i n , n o }
Then the final maximum and minimum results of σ m a x o and σ m i n o were calculated with Equations (5) and (6).
σ m a x o = σ m a x a v e o + S t d D e v m a x
σ m i n o = σ m i n _ a v e o S t d D e v m i n
where StdDevmax and StdDevmin are the standard deviation (StdDev) of all maximum and minimum values from the Sentinel-1 SAR data, respectively.
Finally, we used σ m a x o and σ m i n o as the main threshold interval of permanent water.

2.3.2. Extraction of Potential Rice Paddies

For the extraction of potential rice extent, our proposed method was to identify the Sentinel-1 images’ pixels that were within the maximum and minimum mean backscatter values of permanent water. With this threshold, the areas with ephemeral potential water information throughout the year were all extracted (including the permanent water areas).
Then the SRTM DEM products were used to remove the areas where paddy rice was impossible to grow. Studies have shown that it is difficult for rice to grow at altitudes above 2500 m and slopes greater than 2° [3,14,35]. Therefore, we used these above thresholds to remove the non-rice areas, after which the permanent water was also removed, leaving potential rice paddies in the remaining areas. The advantage of this step was that it could distinguish between flooded rice and forests, shrubs, settlements, and infrastructure, which showed a different threshold interval and no backscattering characteristic associated with surface water. However, classification errors occur in this process for some other crops affected by precipitation, resulting in backscattering values just within the threshold. Therefore, we still needed additional steps to extract other phenological characteristics to identify rice paddies accurately.

2.3.3. Extraction of the Phenological Characteristics of Paddy Rice

Rice paddies in the subtropical climate of the Mun River are mainly rainfed and few are irrigated. Monsoon rain is the only water source in the rainy season. Therefore, we extracted phenological characteristics of paddy rice in the rainy season to determine if planted areas could represent the actual rice planting situation the whole year.
Rice varieties in this study area range in duration from 95 to 180 days and commonly included four main growth stages: nursery from sowing to seedling/transplanting stages (approximately from 0 to 45 days), vegetative growth period from tillering to panicle initiation (approximately from 45 to 100 days), reproductive period from panicle initiation to flowering (around 35 days), and maturity from flowering to mature grain (around 30 days) [45].
The main differences between paddy rice and other vegetation is the abundance of water in the beginning of the vegetative stage, becoming greener during the peak growing season (panicle initiation phase) [3]. The water information was first used to extract the potential rice paddies, described above in Section 3.2, and then the other phenological characteristics were used to accurately identify the extent of rice paddies.
Using the time-series Sentinel-1 SAR images, we obtained three phenological characteristics of the date of the beginning of season (DBS), the date of maximum backscatter during the peak growing season (DMP), and the length of the vegetative stage (LVS). The area that satisfies the above three parameters was delineated as the rice paddy, and the remaining area was classed as the other land use/land cover of non-rice type (Table 1, Figure 5).

2.3.4. Identification of Rice Paddies

The initial extent of potential rice was extracted using the threshold intervals for the backscattering values between σ m a x o and σ m i n o from permanent water bodies. There is no doubt that this potential extent of rice paddies is significantly larger than the actual rice planting areas. Thus, based on the three phenological characteristics of paddy rice above in Section 3.3, the decision tree method with a simple threshold was used to identify the rice paddies. In order to better distinguish rice paddies from other land use/land cover types, we selected a fixed threshold range of the vegetative growth stage based on the time-series backscattering curve of VH cross-polarization: greater than or equal to 50 days, and less than 120 days for LVS, which represents the shortest and largest possible vegetative stages of rice, respectively. Based on the comprehensive evaluation method above, the final rice areas were obtained.

2.3.5. Rice Accuracy Assessment

The accuracy of our method for rice extent mapping was assessed with two approaches: (1) validation using the field plot samples and (2) comparison with the existing data of rice extent from the IRRI (see Section 2.2.3).
In order to validate the accuracy of our identified rice results, the conventional standard accuracy evaluation parameters were used in this study, i.e., overall accuracy (OA), user’s and producer’s accuracies (UA and PA), and F1-score (Equation (7)).
F 1 s c o r e = U A × P A U A + P A × 2

3. Results

3.1. Temporal Backscattering Thresholds of Permanent Water

Among the 402 scenes used in this study, only 28,748 scenes had coverage by water bodies. Therefore, the maximum and minimum values and the average of the permanent water pixels in all images were statistically obtained (Figure 6). The distribution trends of the maximum and minimum of VH and VV polarization were similar to a parallel distribution (Figure 6a). In general, the minimum and maximum values of the VV polarization were greater than the VH polarization. Figure 6b shows the average values of the maximum and minimum of VH and VV polarization. It can be seen that the average maximum and minimum of VH were both less than the polarization of VV. The difference between the maximum and minimum of VH was 33.68 dB, which was greater than the 30.85 dB of VV polarization, while the first standard deviation of the maximum and minimum of VH (2.54 dB and 4.02 dB) were both smaller than the VV polarization (3.59 dB and 7.48 dB). The σ m a x _ V V o and σ m i n _ V V o values were finally calculated with −15.05 dB and −55.29 dB, respectively, while σ m a x _ V H o and σ m i n _ V H o were obtained with −7.69 dB and −49.60 dB. These results indicate that the range of the final maximum and minimum of VV were larger than that of VH. At the same time, VV polarization also had a larger standard deviation and volatility, and was sensitive to changes in water during the whole year, which is beneficial to the extraction of water information. Therefore, σ m a x _ V V o and σ m i n _ V V o were selected as the threshold range for the subsequent extraction of potential rice in this study.

3.2. Phenological Characteristics of Paddy Rice

On the basis of extracting potential rice by using thresholds of σ m a x _ V V o and σ m i n _ V V o , the corresponding three phenological characteristics were estimated for the time-series backscattering curve of each potential rice pixel. It can be seen directly from the figure that DBS is mainly distributed between 150 and 240 days (i.e., from the beginning of June to the end of August), which is the main sowing period for rice (Figure 7a), while DMP is mainly distributed between 240 and 330 days (from the end of August to the end of October), which is the main vegetative growth stage (Figure 7b). For the length of the vegetative stage, LVS is concentrated between 60 and 120 days, which is within the set thresholds between 50 and 120 days (Figure 7c). Therefore, this threshold range then could be directly used for rice paddies identification in the subsequent studies.

3.3. Extent of Rice Paddies in the Mun River Basin

After obtaining the phenological characteristics, the rice paddies were extracted using the set thresholds of LVS. The spatial extent of the paddies can be observed in the final time-series Sentinel-1 rice map in the Mun River basin (Figure 8a,c). The extracted rice cultivation area obtained using our proposed rice identification method was 32,066.81 km2 in 2017, mostly concentrated in the central and northern plateau areas. Rice paddies are also distributed in low-lying plain areas along the Mun River and its tributaries, while the non-rice cover such as forest and dry land are mainly distributed in the upland mountain areas in the south of Mun River basin. Among the ten changwats (provinces) covered by the Mun River basin, the rice cultivation areas are mainly distributed in the changwats of Nakhon Ratchasima, Ubon Ratchathani, Surin, Buri Ram, and Si Sa Ket, with areas of 7945.94 km2, 5141.29 km2, 4620.90 km2, 4499.79 km2, and 3887.34 km2, respectively.

3.4. Accuracy Assessment

3.4.1. Comparison with Field Plot Data

To validate the classification accuracy of our proposed rice paddy mapping method, the classified rice paddy results were first compared against the field plot data. The accuracy validation was conducted on the basis of rice paddy and other land use/land cover types, where all non-rice paddy types were uniformly grouped into the other land use/land cover class. The classification accuracies shown in Table 2 demonstrate that only 63 plots out of all 722 rice plots were misclassified as other land use/land cover types, and 67 other land use/land cover plots were misclassified as rice paddy. The confusion matrix shows that the identified rice paddies results using our proposed approach owned a high accuracy with the UA, PA, OA, and F1 score of 90.77%, 91.27%, 89.52%, and 0.91, respectively.

3.4.2. Comparison with Rice Paddy Acquired from IRRI

After comparison with field plot data, the performance of the proposed rice classification method was then assessed by comparing the classified rice paddy map to the rice paddy products from IRRI derived using MODIS data. The IRRI rice products showed a consistent spatial pattern with our rice map (Figure 8b,d), though the area of the IRRI rice products was 36,386.69 km2, which was much higher than the identified rice area of 32,066.81 km2 in this study. The comparison results show that our proposed approach can identify smaller rice paddies effectively with its high spatial resolution, and at a higher accuracy, while the MODIS-based rice results overestimated the rice cover in the perimeter areas of rice fields, with an overall accuracy of 74.76% (Table 3). Despite the various spatiotemporal resolutions among the rice paddy data, the intercomparison verified the effectiveness of our method with Sentinel-1 SAR data to obtain a rice paddy map.

4. Discussion

4.1. Comparison with Other Phenological-Based Studies

Since the launch of the first Earth resource satellite, various studies have been proposed to identify rice cultivation using remote sensing data. So far, there have been dozens or even hundreds of studies on the application of various satellite data sources [3,45,46,48,52,66], and various identification algorithms [3,52,54].
Currently, the phenological-based studies mainly focus on the application of optical satellite imagery for rice extraction, among that the MODIS data are used widely. The auxiliary rice products in this study are extracted by IRRI based on the MODIS data [14,22]. Compared to the MODIS data with 250 m, Sentinel-1 data has a much higher spatial resolution of 10 m, which greatly reduces the impact of mixed pixels on rice extraction. Since the rice paddies area in our Mun River Basin is mainly composed of large paddy fields and other smaller non-rice land types (pathways, irrigation canals, trees, and other vegetation patches). Therefore, most rice pixels may contain some small non-rice cover, which may cause an overestimation of the rice-cultivation area. Moreover, this overestimation will be more obvious at coarse resolutions of 250 m. Compared with the rice area acquired from IRRI using MODIS data, our classified rice results greatly reduced the overestimation of rice caused by mixed pixels and improved the accuracy of rice identification.
With the popularization of Landsat data, the Landsat based time series data with the spatial resolution of 30 m and revisit cycle of 16 days has gradually been used to extract a rice paddy [6,10,18,30,41,42]. Compared to the Landsat data, Sentinel-1 not only has a certain improvement in spatial resolution, but also has a greater advantage in temporal resolution with the revisit cycle of 6/12 days. In addition, during the growing period of rice, there is frequently cloudy, rainy weather, which seriously affects the usefulness of Landsat optical satellites, and severely may make it impossible to construct a time series data set. In contrast, SAR has the capability of penetrating clouds and fog, and is less affected by clouds and rain [15,52,54,67]. Thus, Sentinel-1 can provide sufficient images to generate dense time-series imagery for rice identification in rainy study areas like the Mun River basin. It also has a similar advantage compared to the Sentinel-2 time-series images.
In addition, there are also some phenological-based rice extraction studies based on time-series SAR data [40,45,54,58,64,68,69,70]. However, the prerequisites of these research still need to obtain prior knowledge of the study area, and relies on samples derived from the ground surveys or selected using visual interpretation with a priori knowledge to construct a standard time-series curve of rice or find the backscatter distribution interval of rice, which have been used as the standard or threshold value for rice extraction [36,37,52,64,68,69]. Compared with these above approaches, this study proposes a rice identification approach that need not rely on rice paddy sample plots. Our research relies on global surface water data for extracting the time-series backscattering coefficient threshold, realizing the substitution of prior knowledge. This approach is simple and effective. However, there are uncertainties in extracting potential rice paddies on using the time-series backscattering threshold of permanent water bodies. Affected by the sediment, water weeds, and water quality, the pixels of permanent water may not be pure, which will cause a certain expansion of the water threshold, which affects the extraction results. The impact of the annual maximum and minimum values of water pixels as thresholds on the uncertainty of rice extraction will be discussed further in subsequent related studies.

4.2. Comparison with Non-Phenological Studies

Non-phenological methods usually include the traditional unsupervised, supervised classification, and the increasingly popular algorithms of machine learning and deep learning. The traditional unsupervised classification methods can directly identify the rice paddy based on the spectral features without needing the field plot samples [3]. However, the manual classification discrimination must be required after classification. In contrast, our proposed method does not require manual intervention and can be performed automatically to identify a rice paddy.
For the supervised classification method, it is necessary to select a sufficient number of field plot samples as training to achieve the purpose of high-precision classification [21,23,24]. With the development of classification methods, some new algorithm based on machine learning were introduced for identifying the rice paddy, but they still have the same requirements [3,22,25]. This requires a priori knowledge of the study area, and also need a lot of manual field plot samples. Compared with the above methods, our proposed method does not need the samples derived from the ground surveys or selected using visual interpretation with a priori knowledge. We only rely on the global surface water data for extracting the threshold of permanent water, realizing the substitution of plot samples. Moreover, the relevant threshold is set automatically with little manual intervention.
For the hot research methods of deep learning [26,27], they need not require field samples, but it is a very time-consuming and laborious task to construct a picture sample library for image identification. In contrast, the method proposed by us does not require this process at all and can achieve accurate extraction of rice automatically.

4.3. Benefits from Using the Google Earth Engine Clouding Computing Platform

Since its emergence, Google Earth Engine has gradually become an important tool for Earth system science, allowing researchers to take advantage of massive datasets, powerful computing capabilities, a convenient and fast interface, and convenient data sharing and publishing [63,64,69]. Google Earth Engine stores all available Sentinel-1 SAR images and provides a complete set of image preprocessing functions that can quickly produce preprocessed Sentinel-1 SAR images, greatly reducing the time and tedious steps required for image downloads, preprocessing, and storage. It also stores the dataset of JRC Yearly Water Classification History v1.2 [65], which provided a complete auxiliary dataset for the rice extraction method in our study. Furthermore, the Google Earth Engine platform provides a high-performance parallel computing infrastructure to meet the powerful processing requirements of massive data over large areas in multitemporal applications. Thus, the algorithm codes were written with JavaScript in the Google Earth Engine online Code Editor, and all procedures in our rice paddy classification could be operated on this platform. The time-series Sentinel-1 SAR images quickly generated in Google Earth Engine can be combined with fine phenological characteristics to identify rice information with periodic rules. This study proved that a large amount of 402 Sentinel-1 SAR images could be used for rapid extraction of rice paddies in a large area.

4.4. Potential Extensions for Producing Large-Area Maps

This study proposes a rice identification approach that need not rely on rice paddy sample plots. It could be used for accurate rice extraction relying only on the time-series Sentinel-1 SAR images and a global surface water dataset. This approach is simple, effective, and also has the advantage for automatic rice mapping. It can produce a large-area, high-precision rice map. Since this method does not rely on the local prior knowledge, it also has the potential to expand to other national regions of Indochina Peninsula, Southeast Asia, or the world.
Although this research has obtained a high accuracy of rice extraction (OA equal 89.52%), it is still affected by other sources of errors, and the accuracy of our proposed approach needs to be further improved. The proposed method relies heavily on rice paddies containing irrigation water; when it encounters fields of upland rice, they may not be recognized. However, the planting area of upland rice is very small, accounting for less than 0.3% of the whole of Thailand, which can be ignored in this study. When there are land cover types similar to the temporal SAR signature of rice, such as wetlands or other areas with water and vegetation cover, additional auxiliary information is needed to further distinguish them [53,64,68]. In practical applications, wetlands and similar areas are sparsely distributed in rice cultivation areas, so they could be ignored in our study. Different rice planting systems (triple, double, and single cropping rice) have different time-series curves, while the differences in plant morphology and growth period caused by different rice varieties also affect the final backscattering of rice. These studies will be analyzed and discussed in detail in the future.

5. Conclusions

Although the research on SAR remote sensing mapping of rice paddies has lasted for more than 20 years, the development of operational automatic and rapid rice identification methods combined with high spatial resolution and long time-series SAR data, is still the hotspot and frontier in current rice mapping research. Therefore, this research proposes an automatic method to identify the regional rice paddies using the long time-series Sentinel-1 SAR images. By integrating 402 Sentinel-1 scenes, auxiliary data of permanent water bodies, and data on the general phenological characteristics of rice with the Google Earth Engine geospatial data cloud computing platform, the proposed method can rapidly identify the extent of rice paddies without needing local expert experience or field sample plots.
Comparison with the field plot data, it is concluded that our proposed approach is feasible for mapping rice paddy extent at a fine resolution of 10 m, and can effectively obtain a high accuracy with the OA of 89.52%. Through a comparison of the rice products from IRRI, our rice extraction results have a finer resolution, and the spatiotemporal pattern of rice paddies was consistent in the Mun River basin.
This study has contributed to rice identification approaches and regional rice mapping using time-series Sentinel-1 SAR dataset. The method developed in this study is timely, effective, and highly accurate, while the rice results obtained had a high resolution of 10 m. This approach can be expanded to other rice-cultivation countries, or even the entire Indochina Peninsula and Southeast Asia.

Supplementary Materials

The relevant codes for rice extraction are available online at https://www.mdpi.com/2072-4292/12/23/3959/s1, all the algorithm codes were written with JavaScript in the Google Earth Engine online Code Editor.

Author Contributions

H.L., D.F., and C.H. conceived the research and designed the experiments; D.F. performed the experiments; H.L. drafted the manuscript. Q.L., F.S., G.L., and S.W. provided help with the language and reviewed the manuscript. All authors have read and agreed to the published version of the manuscript.

Funding

This research was funded by the National Natural Science Foundation of China, grant number 41801353; the Strategic Priority Research Program of the Chinese Academy of Sciences, grant number XDA19060302, XDA19060304, and XDA23050101; the Science and Technology Basic Resources Investigation Program of China, grant number 2017FY201401; and the National Key Research and Development Program of China, grant number 2017YFD0300403.

Acknowledgments

We thank Chuanpeng Zhao in our laboratory for his comments on the manuscript.

Conflicts of Interest

The authors declare no conflict of interest.

References

  1. FAO. Statistical Database of the Food and Agricultural Organization of the United Nations; FAO: Rome, Italy, 2010. [Google Scholar]
  2. Liu, W.; Dong, J.; Xiang, K.; Wang, S.; Han, W.; Yuan, W. A sub-pixel method for estimating planting fraction of paddy rice in Northeast China. Remote Sens. Environ. 2018, 205, 305–314. [Google Scholar] [CrossRef]
  3. Dong, J.; Xiao, X. Evolution of regional to global paddy rice mapping methods: A review. ISPRS J. Photogramm. 2016, 119, 214–227. [Google Scholar] [CrossRef] [Green Version]
  4. Tian, H.; Lu, C.; Ciais, P.; Michalak, A.M.; Canadell, J.G.; Saikawa, E.; Huntzinger, D.N.; Gurney, K.R.; Sitch, S.; Zhang, B.; et al. The terrestrial biosphere as a net source of greenhouse gases to the atmosphere. Nature 2016, 531, 225–228. [Google Scholar] [CrossRef] [Green Version]
  5. Montzka, S.A.; Dlugokencky, E.J.; Butler, J.H. Non-CO2 greenhouse gases and climate change. Nature 2011, 476, 43–50. [Google Scholar] [CrossRef] [PubMed]
  6. Kontgis, C.; Schneider, A.; Ozdogan, M. Mapping rice paddy extent and intensification in the Vietnamese Mekong River Delta with dense time stacks of Landsat data. Remote Sens. Environ. 2015, 169, 255–269. [Google Scholar] [CrossRef]
  7. Arai, H.; Takeuchi, W.; Oyoshi, K.; Nguyen, L.; Inubushi, K. Estimation of Methane Emissions from Rice Paddies in the Mekong Delta Based on Land Surface Dynamics Characterization with Remote Sensing. Remote Sens. 2018, 10, 1438. [Google Scholar] [CrossRef] [Green Version]
  8. Arunrat, N.; Pumijumnong, N.; Hatano, R. Predicting local-scale impact of climate change on rice yield and soil organic carbon sequestration: A case study in Roi Et Province, Northeast Thailand. Agr. Syst. 2018, 164, 58–70. [Google Scholar] [CrossRef]
  9. Boschetti, M.; Busetto, L.; Manfron, G.; Laborte, A.; Asilo, S.; Pazhanivelan, S.; Nelson, A. PhenoRice: A method for automatic extraction of spatio-temporal information on rice crops using satellite data time series. Remote Sens. Environ. 2017, 194, 347–365. [Google Scholar] [CrossRef] [Green Version]
  10. Dong, J.; Xiao, X.; Menarguez, M.A.; Zhang, G.; Qin, Y.; Thau, D.; Biradar, C.; Moore, B. Mapping paddy rice planting area in northeastern Asia with Landsat 8 images, phenology-based algorithm and Google Earth Engine. Remote Sens. Environ. 2016, 185, 142–154. [Google Scholar] [CrossRef] [Green Version]
  11. Xin, F.; Xiao, X.; Dong, J.; Zhang, G.; Zhang, Y.; Wu, X.; Li, X.; Zou, Z.; Ma, J.; Du, G.; et al. Large increases of paddy rice area, gross primary production, and grain production in Northeast China during 2000–2017. Sci. Total Environ. 2020, 711, 135183. [Google Scholar] [CrossRef]
  12. Zhang, G.; Xiao, X.; Dong, J.; Kou, W.; Jin, C.; Qin, Y.; Zhou, Y.; Wang, J.; Menarguez, M.A.; Biradar, C. Mapping paddy rice planting areas through time series analysis of MODIS land surface temperature and vegetation index data. ISPRS J. Photogramm. 2015, 106, 157–171. [Google Scholar] [CrossRef] [PubMed] [Green Version]
  13. Peng, D.; Huete, A.R.; Huang, J.; Wang, F.; Sun, H. Detection and estimation of mixed paddy rice cropping patterns with MODIS data. Int. J. Appl. Earth Obs. 2011, 13, 13–23. [Google Scholar] [CrossRef]
  14. Gumma, M.K.; Thenkabail, P.S.; Maunahan, A.; Islam, S.; Nelson, A. Mapping seasonal rice cropland extent and area in the high cropping intensity environment of Bangladesh using MODIS 500 m data for the year 2010. ISPRS J. Photogramm. 2014, 91, 98–113. [Google Scholar] [CrossRef]
  15. Gao, Q.; Zribi, M.; Escorihuela, M.; Baghdadi, N.; Segui, P. Irrigation Mapping Using Sentinel-1 Time Series at Field Scale. Remote Sens. 2018, 10, 1495. [Google Scholar] [CrossRef] [Green Version]
  16. Waldner, F.; De Abelleyra, D.; Verón, S.R.; Zhang, M.; Wu, B.; Plotnikov, D.; Bartalev, S.; Lavreniuk, M.; Skakun, S.; Kussul, N.; et al. Towards a set of agrosystem-specific cropland mapping methods to address the global cropland diversity. Int. J. Remote Sens. 2016, 37, 3196–3231. [Google Scholar] [CrossRef] [Green Version]
  17. Orynbaikyzy, A.; Gessner, U.; Conrad, C. Crop type classification using a combination of optical and radar remote sensing data: A review. Int. J. Remote Sens. 2019, 40, 6553–6595. [Google Scholar] [CrossRef]
  18. Phalke, A.R.; Özdoğan, M. Large area cropland extent mapping with Landsat data and a generalized classifier. Remote Sens. Environ. 2018, 219, 180–195. [Google Scholar] [CrossRef]
  19. Park, S.; Im, J.; Park, S.; Yoo, C.; Han, H.; Rhee, J. Classification and Mapping of Paddy Rice by Combining Landsat and SAR Time Series Data. Remote Sens. 2018, 10, 447. [Google Scholar] [CrossRef] [Green Version]
  20. Thi, T.H.N.; De Bie, C.A.J.M.; Ali, A.; Smaling, E.M.A.; Thai, H.C. Mapping the irrigated rice cropping patterns of the Mekong delta, Vietnam, through hyper-temporal SPOT NDVI image analysis. Int. J. Remote Sens. 2012, 33, 415–434. [Google Scholar]
  21. Fang, H.; Wu, B.; Liu, H.; Huang, X. Using NOAA AVHRR and Landsat TM to estimate rice area year-by-year. Int. J. Remote Sens. 1998, 19, 521–525. [Google Scholar] [CrossRef]
  22. Gumma, M.K.; Nelson, A.D.; Thenkabail, P.S.; Singh, A.N. Mapping rice areas of South Asia using MODIS multitemporal data. J. Appl. Remote Sens. 2011, 5, 53547. [Google Scholar] [CrossRef] [Green Version]
  23. Shao, Y.; Fan, X.; Liu, H.; Xiao, J.; Ross, S.; Brisco, B.; Brown, R.; Staples, G. Rice monitoring and production estimation using multitemporal RADARSAT. Remote Sens. Environ. 2001, 76, 310–325. [Google Scholar] [CrossRef]
  24. Li, Q.; Zhang, H.; Du, X.; Wen, N.; Tao, Q. County-level rice area estimation in southern China using remote sensing data. J. Appl. Remote Sens. 2014, 8, 83657. [Google Scholar] [CrossRef]
  25. Zhang, C.; Huang, C.; Li, H.; Liu, Q.; Li, J.; Bridhikitti, A.; Liu, G. Effect of Textural Features in Remote Sensed Data on Rubber Plantation Extraction at Different Levels of Spatial Resolution. Forests 2020, 11, 399. [Google Scholar] [CrossRef] [Green Version]
  26. Mosleh, M.; Hassan, Q.; Chowdhury, E. Application of Remote Sensors in Mapping Rice Area and Forecasting Its Production: A Review. Sensors 2015, 15, 769–791. [Google Scholar] [CrossRef] [Green Version]
  27. Huang, C.; Zhang, C.; He, Y.; Liu, Q.; Li, H.; Su, F.; Liu, G.; Bridhikitti, A. Land Cover Mapping in Cloud-Prone Tropical Areas Using Sentinel-2 Data: Integrating Spectral Features with Ndvi Temporal Dynamics. Remote Sens. 2020, 12, 1163. [Google Scholar] [CrossRef] [Green Version]
  28. Boschetti, M.; Nutini, F.; Manfron, G.; Brivio, P.A.; Nelson, A.D. Comparative analysis of normalised difference spectral indices derived from MODIS for detecting surface water in flooded rice cropping systems. PLoS ONE 2014, 9, e88741. [Google Scholar] [CrossRef]
  29. Clauss, K.; Yan, H.; Kuenzer, C. Mapping Paddy Rice in China in 2002, 2005, 2010 and 2014 with MODIS Time Series. Remote Sens. 2016, 8, 434. [Google Scholar] [CrossRef] [Green Version]
  30. Dong, J.; Xiao, X.; Kou, W.; Qin, Y.; Zhang, G.; Li, L.; Jin, C.; Zhou, Y.; Wang, J.; Biradar, C.; et al. Tracking the dynamics of paddy rice planting area in 1986–2010 through time series Landsat images and phenology-based algorithms. Remote Sens. Environ. 2015, 160, 99–113. [Google Scholar] [CrossRef]
  31. More, R.S.; Manjunath, K.R.; Jain, N.K.; Panigrahy, S.; Parihar, J.S. Derivation of rice crop calendar and evaluation of crop phenometrics and latitudinal relationship for major south and south-east Asian countries: A remote sensing approach. Comput. Electron. Agr. 2016, 127, 336–350. [Google Scholar] [CrossRef]
  32. Nuarsa, I.W.; Nishio, F.; Hongo, C.; Mahardika, I.G. Using variance analysis of multitemporal MODIS images for rice field mapping in Bali Province, Indonesia. Int. J. Remote Sens. 2012, 33, 5402–5417. [Google Scholar] [CrossRef]
  33. Xiao, X.; Boles, S.; Frolking, S.; Salas, W.; Moore, B.; Li, C.; He, L.; Zhao, R. Observation of flooding and rice transplanting of paddy rice fields at the site to landscape scales in China using VEGETATION sensor data. Int. J. Remote Sens. 2002, 23, 3009–3022. [Google Scholar] [CrossRef]
  34. Wang, J.; Xiao, X.; Qin, Y.; Dong, J.; Zhang, G.; Kou, W.; Jin, C.; Zhou, Y.; Zhang, Y. Mapping paddy rice planting area in wheat-rice double-cropped areas through integration of Landsat-8 OLI, MODIS and PALSAR images. Sci. Rep. 2015, 5, 10088. [Google Scholar] [CrossRef] [PubMed] [Green Version]
  35. Xiao, X.; Boles, S.; Frolking, S.; Li, C.; Babu, J.Y.; Salas, W.; Moore, B. Mapping paddy rice agriculture in South and Southeast Asia using multi-temporal MODIS images. Remote Sens. Environ. 2006, 100, 95–113. [Google Scholar] [CrossRef]
  36. Guan, X.; Liu, G.; Huang, C.; Meng, X.; Liu, Q.; Wu, C.; Ablat, X.; Chen, Z.; Wang, Q. An Open-Boundary Locally Weighted Dynamic Time Warping Method for Cropland Mapping. ISPRS Int. Geo Inf. 2018, 7, 75. [Google Scholar] [CrossRef] [Green Version]
  37. Guan, X.; Huang, C.; Liu, G.; Meng, X.; Liu, Q. Mapping Rice Cropping Systems in Vietnam Using an NDVI-Based Time-Series Similarity Measurement Based on DTW Distance. Remote Sens. 2016, 8, 19. [Google Scholar] [CrossRef] [Green Version]
  38. Chen, C.F.; Son, N.T.; Chang, L.Y.; Chen, C.R. Classification of rice cropping systems by empirical mode decomposition and linear mixture model for time-series MODIS 250 m NDVI data in the Mekong Delta, Vietnam. Int. J. Remote Sens. 2011, 32, 5115–5134. [Google Scholar] [CrossRef]
  39. Xiao, X.; Boles, S.; Liu, J.; Zhuang, D.; Frolking, S.; Li, C.; Salas, W.; Moore, B. Mapping paddy rice agriculture in southern China using multi-temporal MODIS images. Remote Sens. Environ. 2005, 95, 480–492. [Google Scholar] [CrossRef]
  40. Bouvet, A.; Le Toan, T. Use of ENVISAT/ASAR wide-swath data for timely rice fields mapping in the Mekong River Delta. Remote Sens. Environ. 2011, 115, 1090–1101. [Google Scholar] [CrossRef] [Green Version]
  41. Onojeghuo, A.O.; Blackburn, G.A.; Wang, Q.; Atkinson, P.M.; Kindred, D.; Miao, Y. Mapping paddy rice fields by applying machine learning algorithms to multi-temporal Sentinel-1A and Landsat data. Int. J. Remote Sens. 2018, 39, 1042–1067. [Google Scholar] [CrossRef] [Green Version]
  42. Wang, J.; Huang, J.; Zhang, K.; Li, X.; She, B.; Wei, C.; Gao, J.; Song, X. Rice Fields Mapping in Fragmented Area Using Multi-Temporal HJ-1A/B CCD Images. Remote Sens. 2015, 7, 3467–3488. [Google Scholar] [CrossRef] [Green Version]
  43. Ozdogan, M.; Yang, Y.; Allez, G.; Cervantes, C. Remote Sensing of Irrigated Agriculture: Opportunities and Challenges. Remote Sens. 2010, 2, 2274–2304. [Google Scholar] [CrossRef] [Green Version]
  44. Song, P.; Mansaray, L.R.; Huang, J.; Huang, W. Mapping paddy rice agriculture over China using AMSR-E time series data. ISPRS J. Photogramm. 2018, 144, 469–482. [Google Scholar] [CrossRef]
  45. Nelson, A.; Setiyono, T.; Rala, A.; Quicho, E.; Raviz, J.; Abonete, P.; Maunahan, A.; Garcia, C.; Bhatti, H.; Villano, L.; et al. Towards an Operational SAR-Based Rice Monitoring System in Asia: Examples from 13 Demonstration Sites across Asia in the RIICE Project. Remote Sens. 2014, 6, 10773–10812. [Google Scholar] [CrossRef] [Green Version]
  46. Li, K.; Brisco, B.; Yun, S.; Touzi, R. Polarimetric decomposition with RADARSAT-2 for rice mapping and monitoring. Can. J. Remote Sens. 2012, 38, 169–179. [Google Scholar] [CrossRef]
  47. McNairn, H.; Jiao, X.; Pacheco, A.; Sinha, A.; Tan, W.; Li, Y. Estimating canola phenology using synthetic aperture radar. Remote Sens. Environ. 2018, 219, 196–205. [Google Scholar] [CrossRef]
  48. Rossi, C.; Erten, E. Paddy-Rice Monitoring Using TanDEM-X. IEEE Trans. Geosci. Remote. Sens. 2015, 53, 900–910. [Google Scholar] [CrossRef] [Green Version]
  49. Inoue, Y.; Sakaiya, E.; Wang, C. Capability of C-band backscattering coefficients from high-resolution satellite SAR sensors to assess biophysical variables in paddy rice. Remote Sens. Environ. 2014, 140, 257–266. [Google Scholar] [CrossRef]
  50. Zhang, Y.; Wang, C.; Wu, J.; Qi, J.; Salas, W.A. Mapping paddy rice with multitemporal ALOS/PALSAR imagery in southeast China. Int. J. Remote Sens. 2009, 30, 6301–6315. [Google Scholar] [CrossRef]
  51. Chen, J.; Lin, H.; Pei, Z. Application of ENVISAT ASAR Data in Mapping Rice Crop Growth in Southern China. IEEE Geosci. Remote Sens. Lett. 2007, 4, 431–435. [Google Scholar] [CrossRef]
  52. Nguyen, D.B.; Wagner, W. European Rice Cropland Mapping with Sentinel-1 Data: The Mediterranean Region Case Study. Water 2017, 9, 392. [Google Scholar] [CrossRef]
  53. Singha, M.; Dong, J.; Sarmah, S.; You, N.; Zhou, Y.; Zhang, G.; Doughty, R.; Xiao, X. Identifying floods and flood-affected paddy rice fields in Bangladesh based on Sentinel-1 imagery and Google Earth Engine. ISPRS J. Photogramm. 2020, 166, 278–293. [Google Scholar] [CrossRef]
  54. Singha, M.; Dong, J.; Zhang, G.; Xiao, X. High resolution paddy rice maps in cloud-prone Bangladesh and Northeast India using Sentinel-1 data. Sci. Data. 2019, 6, 1–10. [Google Scholar] [CrossRef]
  55. Wu, F.; Wang, C.; Zhang, H.; Zhang, B.; Tang, Y. Rice Crop Monitoring in South China with RADARSAT-2 Quad-Polarization SAR Data. IEEE Geosci. Remote Sens. Lett. 2011, 8, 196–200. [Google Scholar] [CrossRef]
  56. Ngo, K.D.; Lechner, A.M.; Vu, T.T. Land cover mapping of the Mekong Delta to support natural resource management with multi-temporal Sentinel-1A synthetic aperture radar imagery. Remote Sens. Appl. Soc. Environ. 2020, 17, 100272. [Google Scholar] [CrossRef]
  57. Mansaray, L.; Huang, W.; Zhang, D.; Huang, J.; Li, J. Mapping Rice Fields in Urban Shanghai, Southeast China, Using Sentinel-1A and Landsat 8 Datasets. Remote Sens. 2017, 9, 257. [Google Scholar] [CrossRef] [Green Version]
  58. Nguyen, D.B.; Gruber, A.; Wagner, W. Mapping rice extent and cropping scheme in the Mekong Delta using Sentinel-1A data. Remote Sens. Lett. 2016, 7, 1209–1218. [Google Scholar] [CrossRef]
  59. Zhao, Z.; Liu, G.; Liu, Q.; Huang, C.; Li, H.; Wu, C. Distribution Characteristics and Seasonal Variation of Soil Nutrients in the Mun River Basin, Thailand. Int. J. Environ. Res. Pub. Health 2018, 15, 1818. [Google Scholar] [CrossRef] [Green Version]
  60. Torres, R.; Snoeij, P.; Geudtner, D.; Bibby, D.; Davidson, M.; Attema, E.; Potin, P.; Rommen, B.; Floury, N.; Brown, M.; et al. GMES Sentinel-1 mission. Remote Sens. Environ. 2012, 120, 9–24. [Google Scholar] [CrossRef]
  61. Copernicus Open Access Hub. Available online: https://scihub.copernicus.eu/ (accessed on 30 November 2020).
  62. Gorelick, N.; Hancher, M.; Dixon, M.; Ilyushchenko, S.; Thau, D.; Moore, R. Google Earth Engine: Planetary-scale geospatial analysis for everyone. Remote Sens. Environ. 2017, 202, 18–27. [Google Scholar] [CrossRef]
  63. Google Earth Engine Platform. Available online: https://developers.google.com/earth-engine/sentinel1 (accessed on 30 November 2020).
  64. Bazzi, H.; Baghdadi, N.; El Hajj, M.; Zribi, M.; Minh, D.H.T.; Ndikumana, E.; Courault, D.; Belhouchette, H. Mapping Paddy Rice Using Sentinel-1 SAR Time Series in Camargue, France. Remote Sens. 2019, 11, 887. [Google Scholar] [CrossRef] [Green Version]
  65. Pekel, J.; Cottam, A.; Gorelick, N.; Belward, A.S. High-resolution mapping of global surface water and its long-term changes. Nature 2016, 540, 418–422. [Google Scholar] [CrossRef]
  66. Inoue, Y.; Sakaiya, E.; Wang, C. Potential of X-Band Images from High-Resolution Satellite SAR Sensors to Assess Growth and Yield in Paddy Rice. Remote Sens. 2014, 6, 5995–6019. [Google Scholar] [CrossRef] [Green Version]
  67. Minh, H.V.T.; Avtar, R.; Mohan, G.; Misra, P.; Kurasaki, M. Monitoring and Mapping of Rice Cropping Pattern in Flooding Area in the Vietnamese Mekong Delta Using Sentinel-1A Data: A Case of An Giang Province. ISPRS Int. J. Geo Inf. 2019, 8, 211. [Google Scholar] [CrossRef] [Green Version]
  68. Minasny, B.; Shah, R.M.; Soh, N.C.; Arif, C.; Setiawan, B.I. Automated Near-Real-Time Mapping and Monitoring of Rice Extent, Cropping Patterns, and Growth Stages in Southeast Asia Using Sentinel-1 Time Series on a Google Earth Engine Platform. Remote Sens. 2019, 11, 1666. [Google Scholar]
  69. Nguyen, D.; Clauss, K.; Cao, S.; Naeimi, V.; Kuenzer, C.; Wagner, W. Mapping Rice Seasonality in the Mekong Delta with Multi-Year Envisat ASAR WSM Data. Remote Sens. 2015, 7, 15868–15893. [Google Scholar] [CrossRef] [Green Version]
  70. Pham-Duc, B.; Prigent, C.; Aires, F. Surface Water Monitoring within Cambodia and the Vietnamese Mekong Delta over a Year, with Sentinel-1 SAR Observations. Water 2017, 9, 366. [Google Scholar] [CrossRef] [Green Version]
Figure 1. Location of the study area in the Mun River basin in Thailand.
Remotesensing 12 03959 g001
Figure 2. Location of field plot data.
Remotesensing 12 03959 g002
Figure 3. Coverage number of Sentinel-1 SAR scenes in the Mun River basin in 2017.
Remotesensing 12 03959 g003
Figure 4. Workflow of the method adopted for this study to extract rice paddies using the Google Earth Engine.
Remotesensing 12 03959 g004
Figure 5. Schematic diagram of the three phenological characteristics of paddy rice.
Remotesensing 12 03959 g005
Figure 6. Statistical histogram of backscattering values of permanent water. (a) Maximum and minimum of VH (vertical transmit and horizontal receive) and VV (vertical transmit and vertical receive) polarization. (b) Average values of the maximum and minimum of VH and VV polarization. Vertical error is ±1 standard deviation.
Remotesensing 12 03959 g006aRemotesensing 12 03959 g006b
Figure 7. Distributions of the rice phenological characteristics. (a) Date of the beginning of season (DBS); (b) date of maximum backscatter during the peak growing season (DMP); and (c) length of the vegetative stage (LVS).
Remotesensing 12 03959 g007
Figure 8. Spatial distribution of rice paddies in the Mun River basin: (a,c) the overall and local detail rice extent, respectively, from our calculation in this study and (b,d) the overall and local detail rice extent respectively in 2017 declared by the International Rice Research Institute (IRRI). Identification results are superimposed on grey scale images at VH polarization.
Remotesensing 12 03959 g008
Table 1. Three phenological characteristics of the rule-based paddy rice.
ParametersAbbreviationDefinition and Explanation
date of the beginning of seasonDBSDefined as the points reached the local minimum backscattering value, and gradually increased.
date of maximum backscatter during the peak growing stageDMPDefined as the point after DBS reached the local maximum backscattering value
length of the vegetative stageLVSDefined as the number of days from DBS to DMP
Table 2. Rice classification accuracies of time-series Sentinel-1 data compared with field plot data.
Class ValueRice PaddyOther Land Use/Land CoverTotalUser’s Accuracy (%)
Rice paddy6596772690.77
Other land use/land cover6345151487.74
Total7225181240100
Producer’s accuracy (%)91.2787.07
Overall accuracy (%)89.52
F1-score0.91
Table 3. Rice classification accuracies of moderate resolution imaging spectroradiometer (MODIS) rice products from IRRI compared with field plot data.
Class ValueRice PaddyOther Land Use/Land CoverTotalUser’s Accuracy (%)
Rice paddy54213367580.30
Other land use/land cover18038556568.14
Total7225181240
Producer’s accuracy (%)75.0774.32
Overall accuracy (%)74.76
F1-score (%)0.78
Publisher’s Note: MDPI stays neutral with regard to jurisdictional claims in published maps and institutional affiliations.

