InSAR- and PIM-Based Inclined Goaf Determination for Illegal Mining Detection


1
Faculty of Geomatics, East China University of Technology (ECUT), Nanchang 330029, China
2
NASG Key Laboratory of Land Environment and Disaster Monitoring, China University of Mining and Technology (CUMT), Xuzhou 221116, China
*
Author to whom correspondence should be addressed.
Remote Sens. 2020, 12(23), 3884; https://doi.org/10.3390/rs12233884
Submission received: 27 October 2020
/
Revised: 22 November 2020
/
Accepted: 24 November 2020
/
Published: 27 November 2020
(This article belongs to the Section Environmental Remote Sensing)
Abstract
:The determination of the depth and boundary of the goaf is of great significance for the detection of illegal mining. However, determining the current location of unknown goafs mainly relies on low-efficiency, time-consuming, and labor-intensive physical detection methods such as geomagnetic field changes. Due to their large coverage and high degree of automation, research on remote sensing methods has been conducted to locate mining activities by monitoring surface deformation. This paper proposes a method that relies on the principle of the probability integration method (PIM) and on synthetic aperture radar interferometry (InSAR) to retrieve the location of an underground goaf. First, the relationship between ground subsidence and the location of the mined-out area was established according to PIM; then, the location of the mined-out area was obtained by the surface deformation acquired by InSAR. The proposed method does not rely on complex nonlinear models and has complete parameters; therefore, it has higher engineering application value. A test site in the Fengfeng mining area and 11 Radarsat-2 images were used to verify the proposed method. The experimental results showed that the average relative error of the proposed method is 6.35%, which is 27.56% higher than that of similar algorithms based on complex nonlinear models. Compared to algorithms that ignore the coal seam dip, the accuracy is improved to 98.27%.

1. Introduction
China is the biggest coal producer in the world [1]. As can be seen in Table 1, among the other countries in the world, only China has a coal mining capacity of one billion tons. While the huge amount of coal mining has brought energy to the people of the country, it has also spawned many cases of illegal mining. Illegal mining activities not only damage the interests of legal miners and of the country, but also threaten the lives of local residents and even the lives of illegal miners, and have laid potential safety hazards for future mining [2]. For example, mining disasters caused by illegal mining occur due to the insufficient technical support. Moreover, illegal mining is not filed with the relevant departments, and, as such, residents’ properties cannot be safely transferred when such mining causes deformation of the ground. Irregular mined-out areas left by illegal mining may cause water penetration, and collapse accidents may happen in adjacent coal seams that are being mined. Additionally, illegal mining activities without corresponding technical support cause a lot of waste of coal resources. Therefore, the prohibition of illegal mining activities is of great significance.
One of the difficulties in prohibiting illegal mining activities is identifying the illegal mining areas. Since illegal mining is concealed and easily subject to human interference, technically, it is very difficult to detect illegal mining activities [3]. To date, the main methods for determining the location of illegal mining include geophysics, human reporting, and placement of cameras. These methods are low in automation, time-consuming, labor-intensive, and inefficient. Due to its large coverage, all-weather work, and high monitoring accuracy, synthetic aperture radar interferometry (InSAR) is widely used to measure deformation across various landscapes, such as glaciers, volcanoes, and earthquakes, as well as urban deformation and surface deformation caused by resource mining [4,5,6,7]. Research has been carried out to locate mining activities according to the deformation acquired by InSAR. This method has the advantages of being efficient, time-saving, and labor-saving, has a high degree of automation, and is not susceptible to human interference. Moreover, the archiving of SAR data makes it possible to detect past illegal mining activities as well. The detection range of SAR data is very large, the largest being dozens of square kilometers, which can realize the regular and comprehensive monitoring of illegal mining. Based on these advantages, Yang established the relationship between the position parameters of a goaf and the surface deformation through the probability integration method (PIM), and then used a mixture of genetic and simulated annealing algorithms to solve the position of said goaf [8]. Du Sen directly solved the location of a goaf according to the characteristics of the PIM [9]. However, the first method relies too much on nonlinear complex models, has low computational efficiency, and is susceptible to interference from model parameters. The second method is fast and effective, but only suitable for horizontal coal seams. Based on the above analysis, this paper proposes an efficient, full-parameter inversion method for goaf detection. This method is based on the PIM to establish the relationship between goaf parameters and surface deformation, and uses InSAR monitoring data to retrieve the position of goafs. While ensuring calculation efficiency and stability, it can detect goafs at any inclination. The 132610 working face in Fengfeng, China was used to verify the reliability and accuracy of this method.
The structure of this paper is as follows: Section 2 details the goaf location retrieval algorithm. Simulation experiments are introduced in Section 3. In Section 4, the test site is described and used to verify the proposed method, and then the results and errors are analyzed. Section 5 discusses some of the open issues of this experiment, and Section 6 provides conclusions of this work.
2. Methodology
2.1. Principle of the PIM
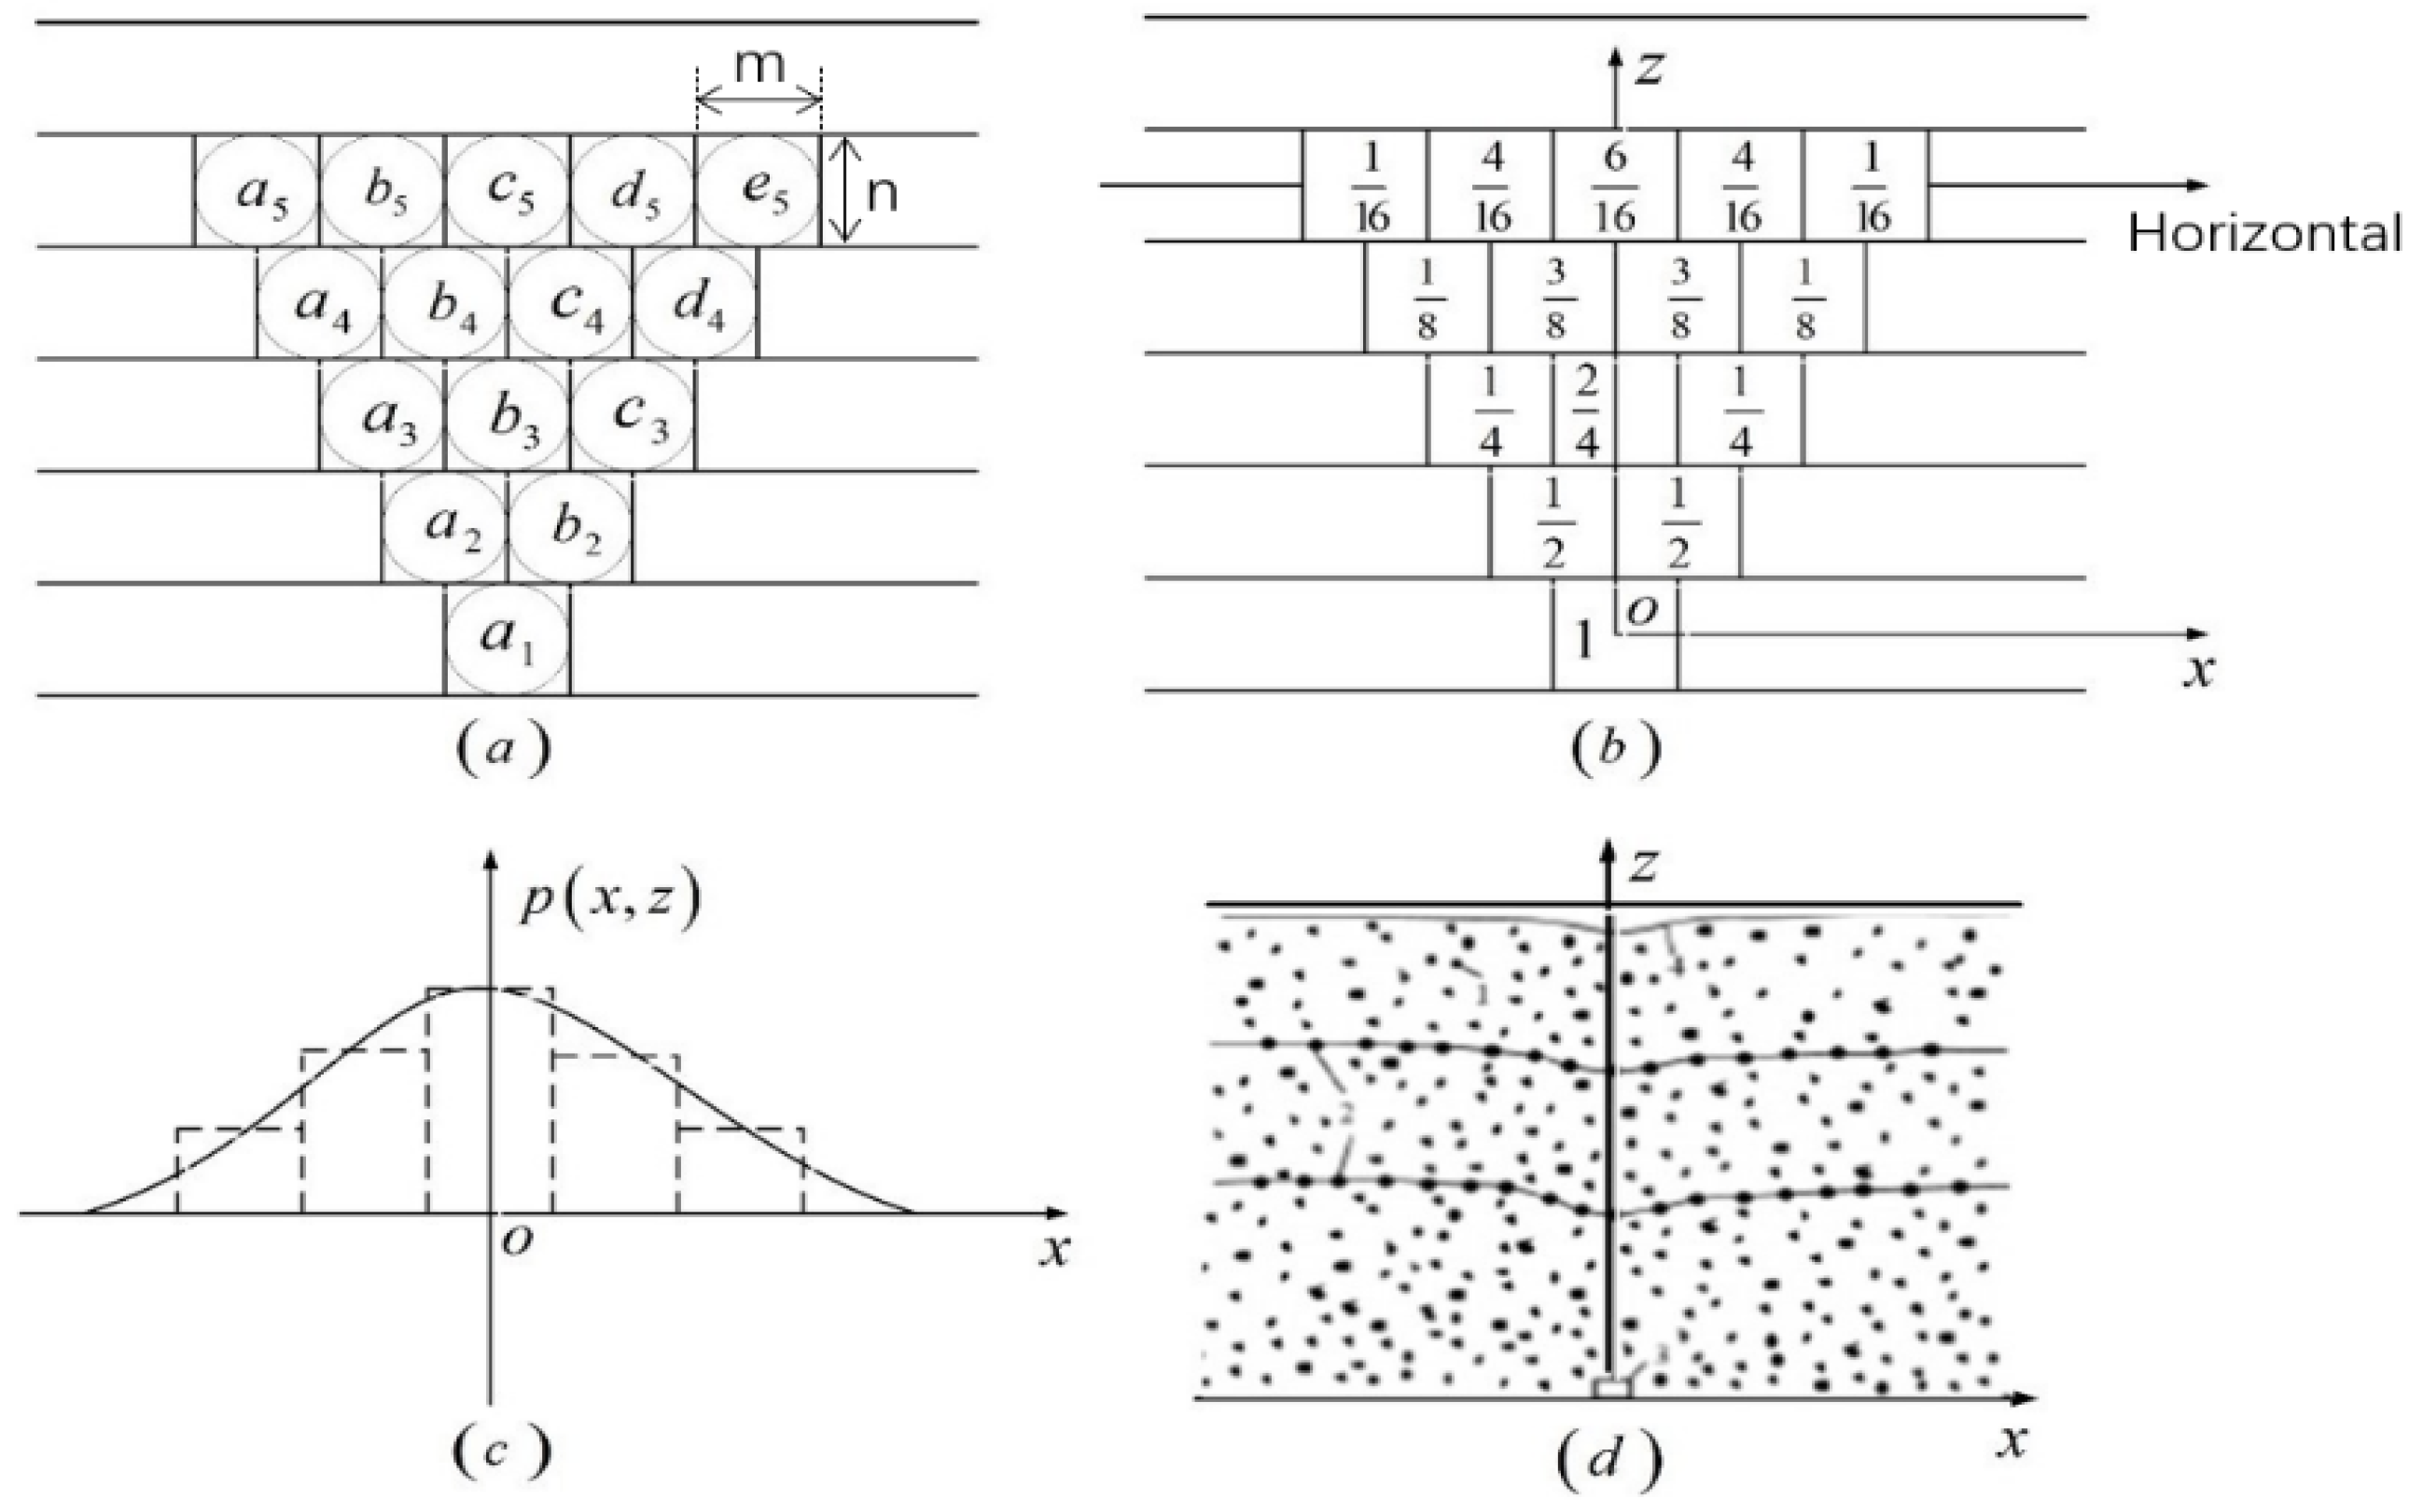
The PIM is based on the theory of discontinuous medium, and obtains the deformation curve of the uppermost layer of the medium by integrating the probability of movement of said discontinuous medium [10]. Specifically, assuming that the medium particles are small balls of the same size and uniform mass and are packed in squares with the same size and uniform arrangement, the length and width are m and n, respectively, as shown in Figure 1a. If the ball in the first layer is removed due to gravity, the probability of the balls in the two adjacent squares on the second layer rolling into the first layer should both be 1/2. By analogy, with each level up, we can obtain the particle movement probability distribution diagram in Figure 1b. If a coordinate system is selected, the histogram probability distribution of any level in the medium can be drawn as a dotted line, as shown in Figure 1c. If the squares and particles are infinitely small, the histogram will approach a smooth curve, as shown by the solid line in Figure 1c. This theory was verified using the sandbox model in Figure 1d.
The expression of the sinking basin caused by unit mining can be obtained by integrating the probability function and performing certain simplifications:
where is the surface subsidence caused by the mining of the unit at x, and is the main influence radius. In , m and n are the length and width of the grid in Figure 1a, respectively. The value of A is determined by the nature of the overlying rock.
2.2. Relationship between Subsidence Curve and Horizontal Working Face Position
The formula for the calculation of the surface subsidence caused by semi-infinite mining of the horizontal coal seam described by the PIM is [11]:
where represents the subsidence value at x, is the maximum subsidence value, r is the main influence radius, and . The mining boundary is at . From differential geometry, the curvature is the second derivative of the sinking curve:
where is the curvature value at position x. In the actual subsidence basin, the surface tilt is only a few percent; therefore, is so small that it can be ignored. Then, Equation (3) can be simplified to:
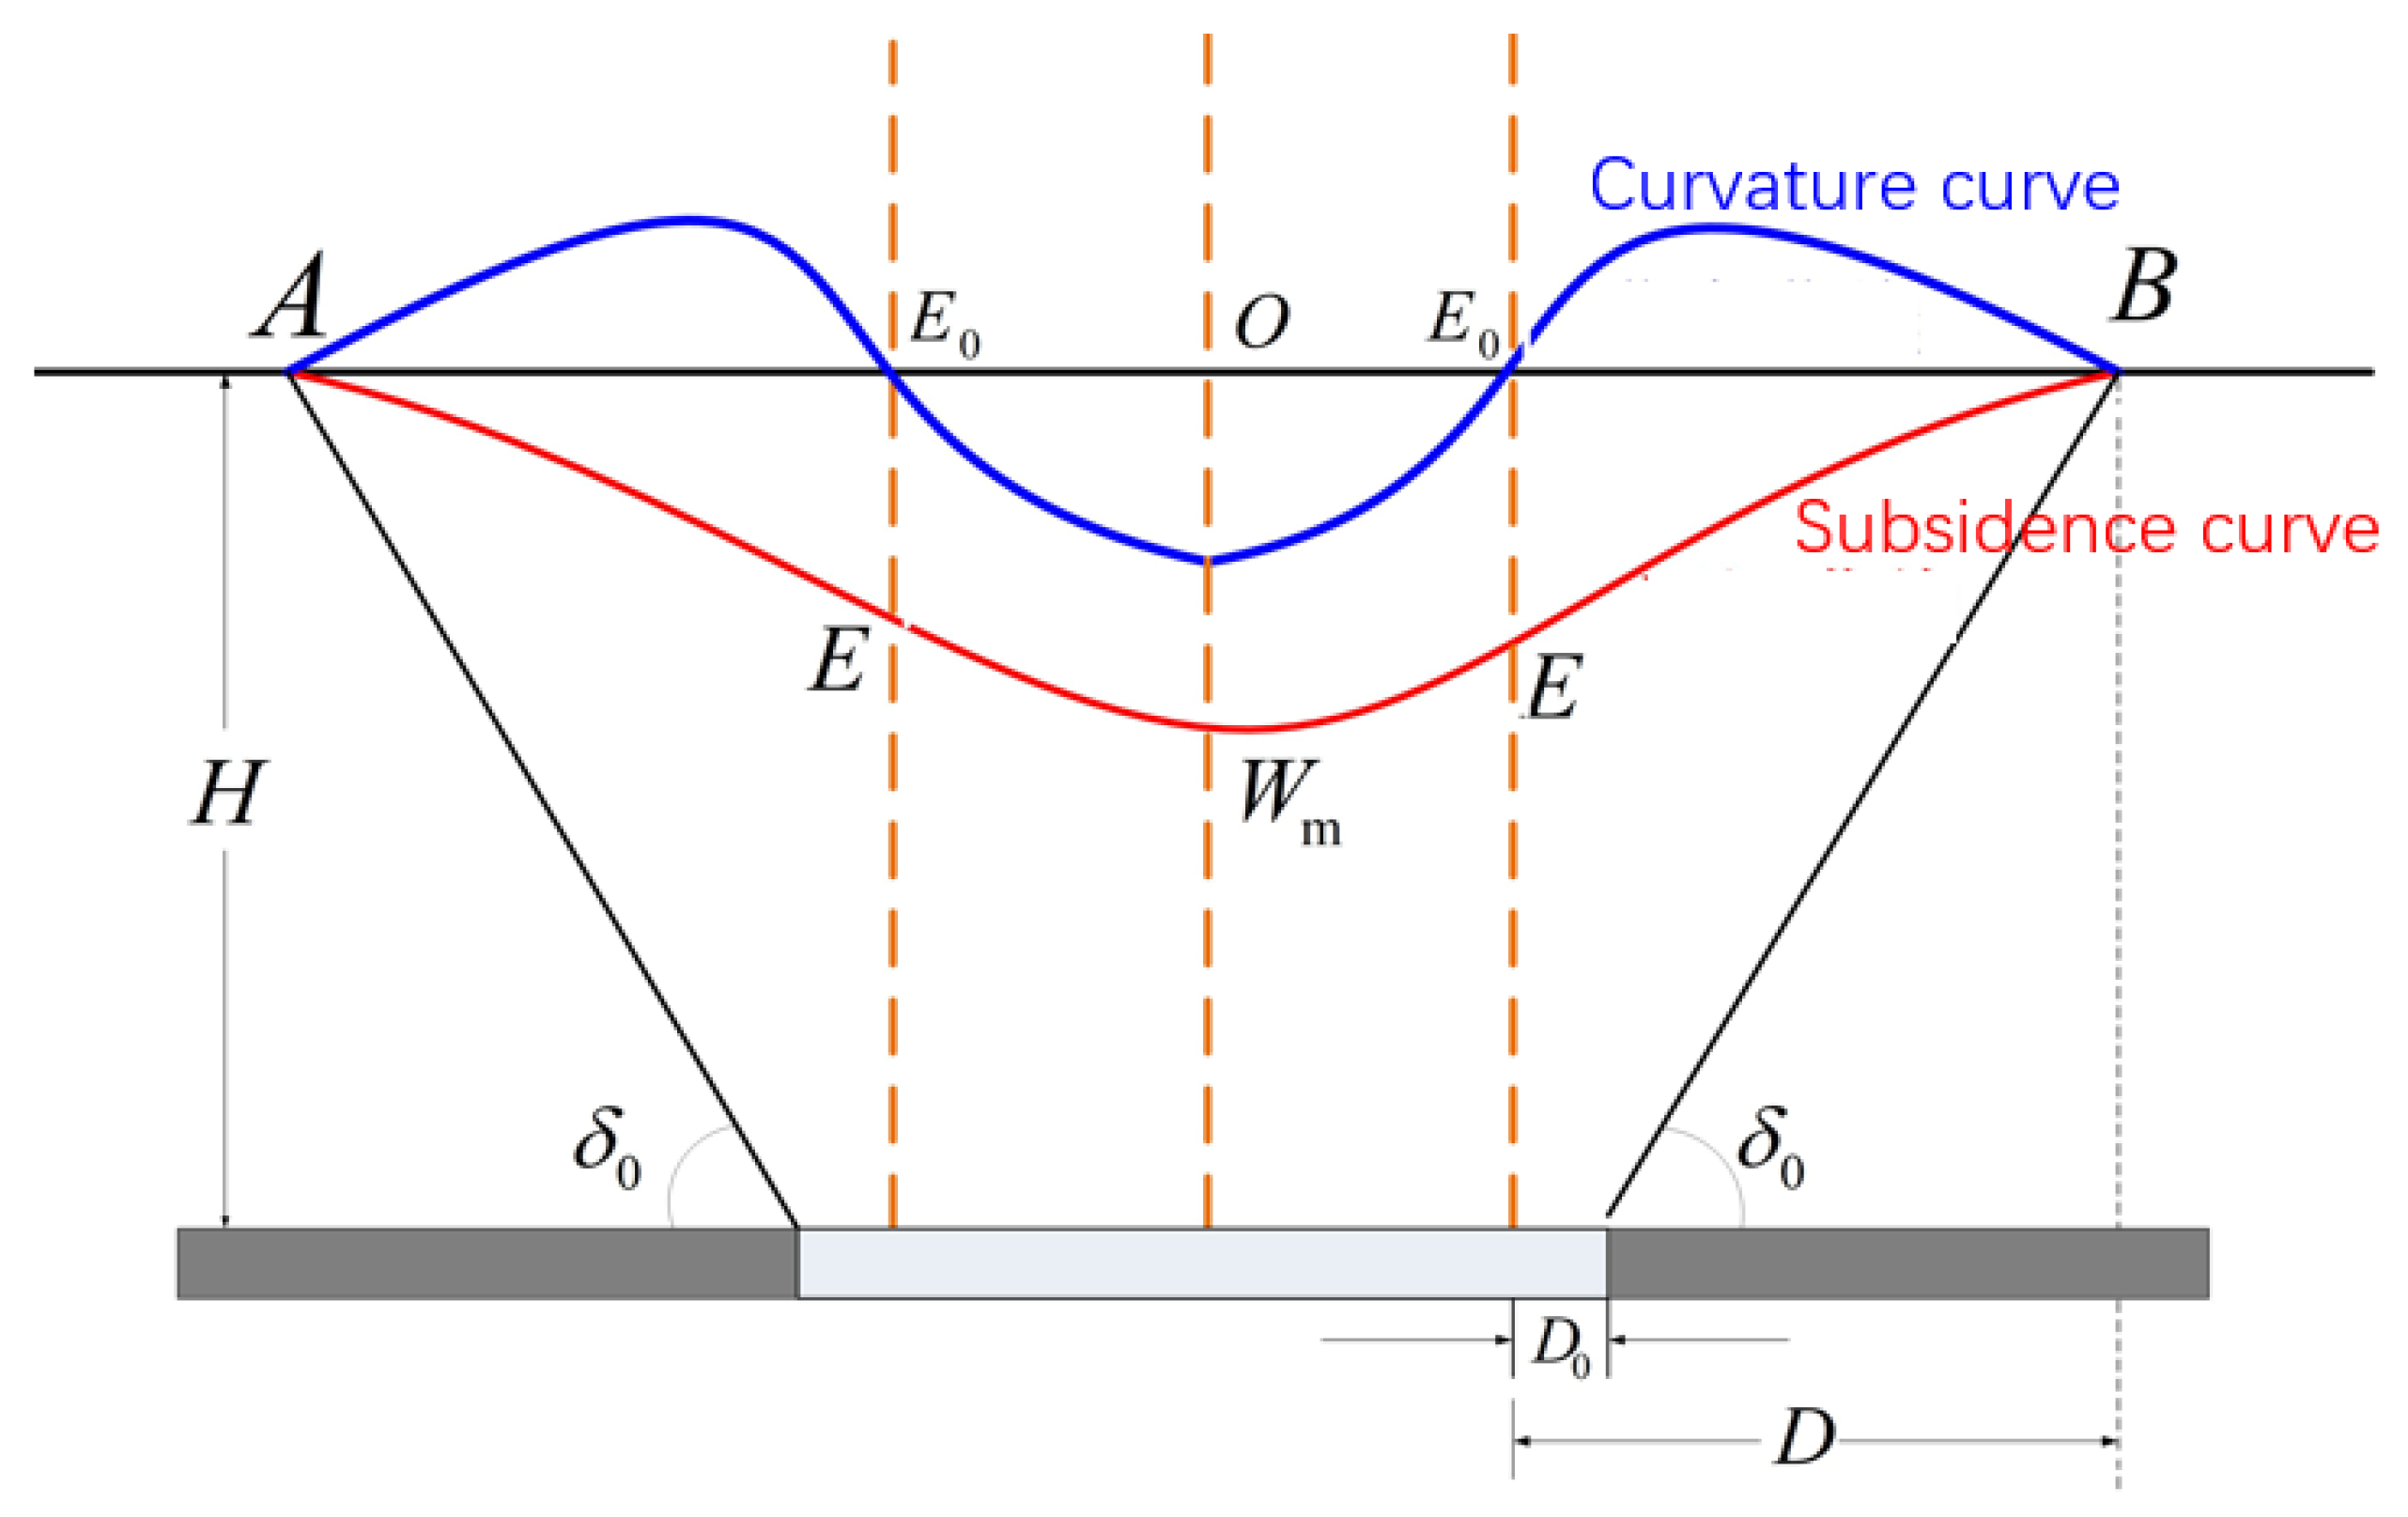
It can be known from Equation (4) that, when , , the sinking curve is convex; when , , the sinking curve is concave. Therefore, the point at is the inflection point of the sinking curve. When the deformation of the overlying rock layers completely conforms to the law of random medium, the inflection point of the subsidence curve coincides with the projection of the coal seam mining boundary on the horizontal plane. However, the actual situation is that the inflection point is located above the coal seam mining boundary slightly toward the inside of the goaf. There are two reasons for this: first, the roof collapsed in the actual project to form a masonry beam structure, resulting in the roof near the boundary of the working face not cutting the coal wall or bending the steps, and causing a suspended roof distance; the second is that the fracture angle affected the position of the inflection point. Therefore, the surface subsidence and curvature curves caused by underground coal mining have the characteristics shown in Figure 2.
2.3. Deformation Propagation Characteristics of an Inclined Coal Seam
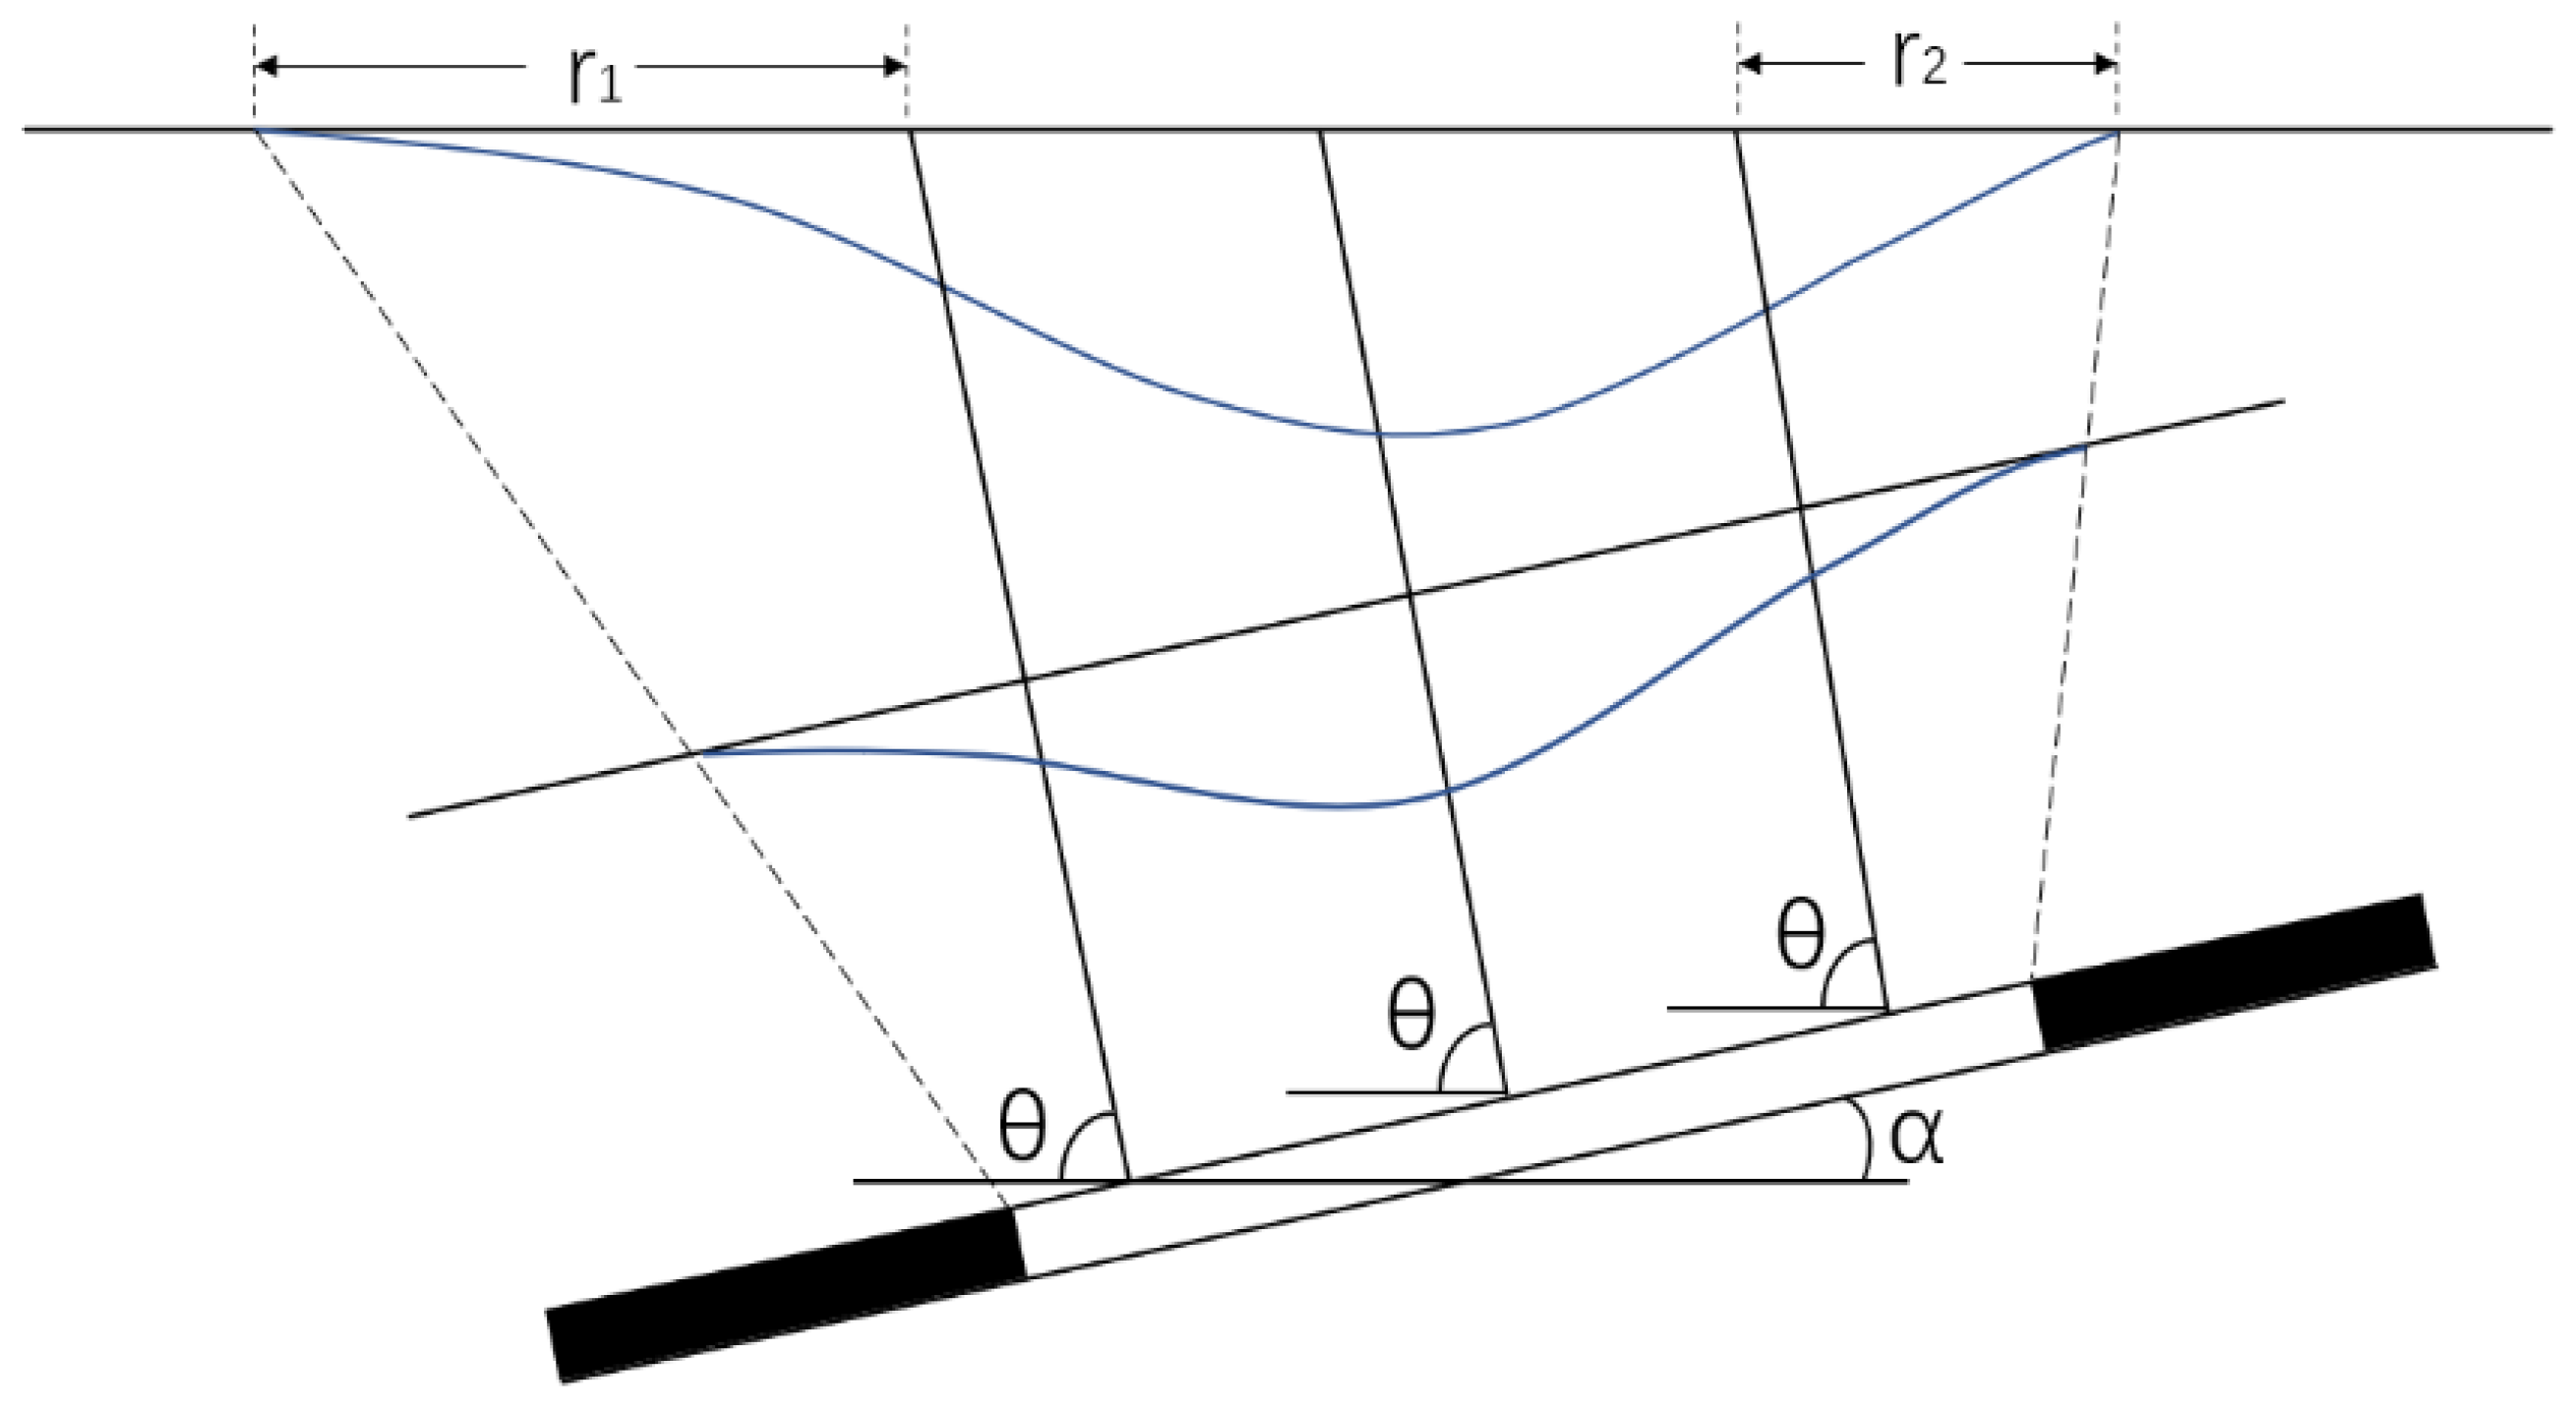
Due to the inclination of a coal seam and the overlying rock, the roof overlying rock will bend and sink in the normal direction after the coal seam is mined. The influence of mining does not propagate vertically upward, but instead propagates to the surface along a certain angle , usually [12]. Thus, the inflection point is not located directly above the calculation boundary anymore but is offset downhill. The angle between the line of the offset inflection point and the calculation boundary and the horizontal line in the downhill direction is called the mining influence propagation angle, i.e., . The sinking basin has obvious asymmetry. At the downhill boundary, due to the greater mining depth, the subsidence effect is large, and the sinking is gentler. At the uphill boundary, due to the lesser mining depth, the expansion of the subsidence impact is small, and the sinking is steeper. Therefore, under the condition of sloping coal seams, the main influence radius of the downhill and uphill directions is different.
Due to the inclination of the coal seam and the overlying rock, after underground mining, the roof overlying rock falls and bends, and basically propagates along the normal direction of the coal seam, as shown in Figure 3. The rock layer moves approximately in the normal direction and has two components: One is the vertical sinking, and the other is the horizontal component along the uphill direction. In addition to the component produced by normal bending and subsidence, the existence of this horizontal component adds an additional horizontal movement in the uphill direction, and its value is approximately . Thus, the horizontal movement in the uphill direction is increased, while the horizontal movement in the downhill direction is reduced, and the zero point of the horizontal movement does not coincide with the maximum sinking point.
2.4. Inversion Method of Mining Goafs
According to the analysis of the characteristics of the basin caused by coal mining in the above subsections, a method for inverting the underground mined-out area from the mining subsidence basin can be obtained.
2.4.1. Determination of the Strike Boundary and Average Mining Depth
Generally speaking, the inclination of the mining face along the strike direction is horizontal or nearly horizontal. Therefore, determination of the strike boundary relies on the subsidence law of horizontal mining. It can be seen from Section 2.2 that the position of the strike boundary can be defined according to the inflection point and .
The mining depth can be calculated according to the basin boundary and inflection point in the strike direction. In Figure 2, is the boundary angle, that is, the angle between the horizontal line and the line from the basin boundary point to the boundary of the goaf on the side of the mine pillar. D is the distance from the basin boundary to the inflection point. It can be seen that the mining depth, , D, and satisfy the trigonometric function relationship:
where and can be found in [13] and D can be obtained from the subsidence basin; thus, the average mining depth H can be requested. Four basin boundaries on two main sections can be obtained by differential InSAR (D-InSAR). According to [9], the boundary behind the excavation direction can be used to obtain ideal results.
2.4.2. Determination of the Inclination
The inclination angle of the coal seam can be obtained according to the goaf width and the mining depth difference in the uphill and downhill directions. According to the principle of the PIM and the introduction in Section 2.1, the relationship between the main influence radius and the mining depth can be described as:
where A is a constant, is the main influence radius, and z is the mining depth. A can be obtained according to the average depth and . It is worth noting that at the mining boundary on the back side of the strike can lead to the minimum error according to [9]. The mining depth in the uphill and downhill directions can then be obtained according to and . The goaf width can be acquired by the inflection point and the inflection point offset on the dip main section, similar to the calculation method of the goaf length. From the mining width and the mining depth, the inclination angle of the coal seam can be obtained:
2.4.3. Determination of the Dip Boundary
Although the goaf width can be obtained by the inflection point, the subsidence basin shifts due to the dip angle. It can be seen from Figure 3 that the propagation angle of the mining influence is the key to determining the dip boundary of the goaf. The propagation angle of the mining influence is closely related to the inclination of the coal seam. The statistical analysis results of the measured data are as follows [11]:
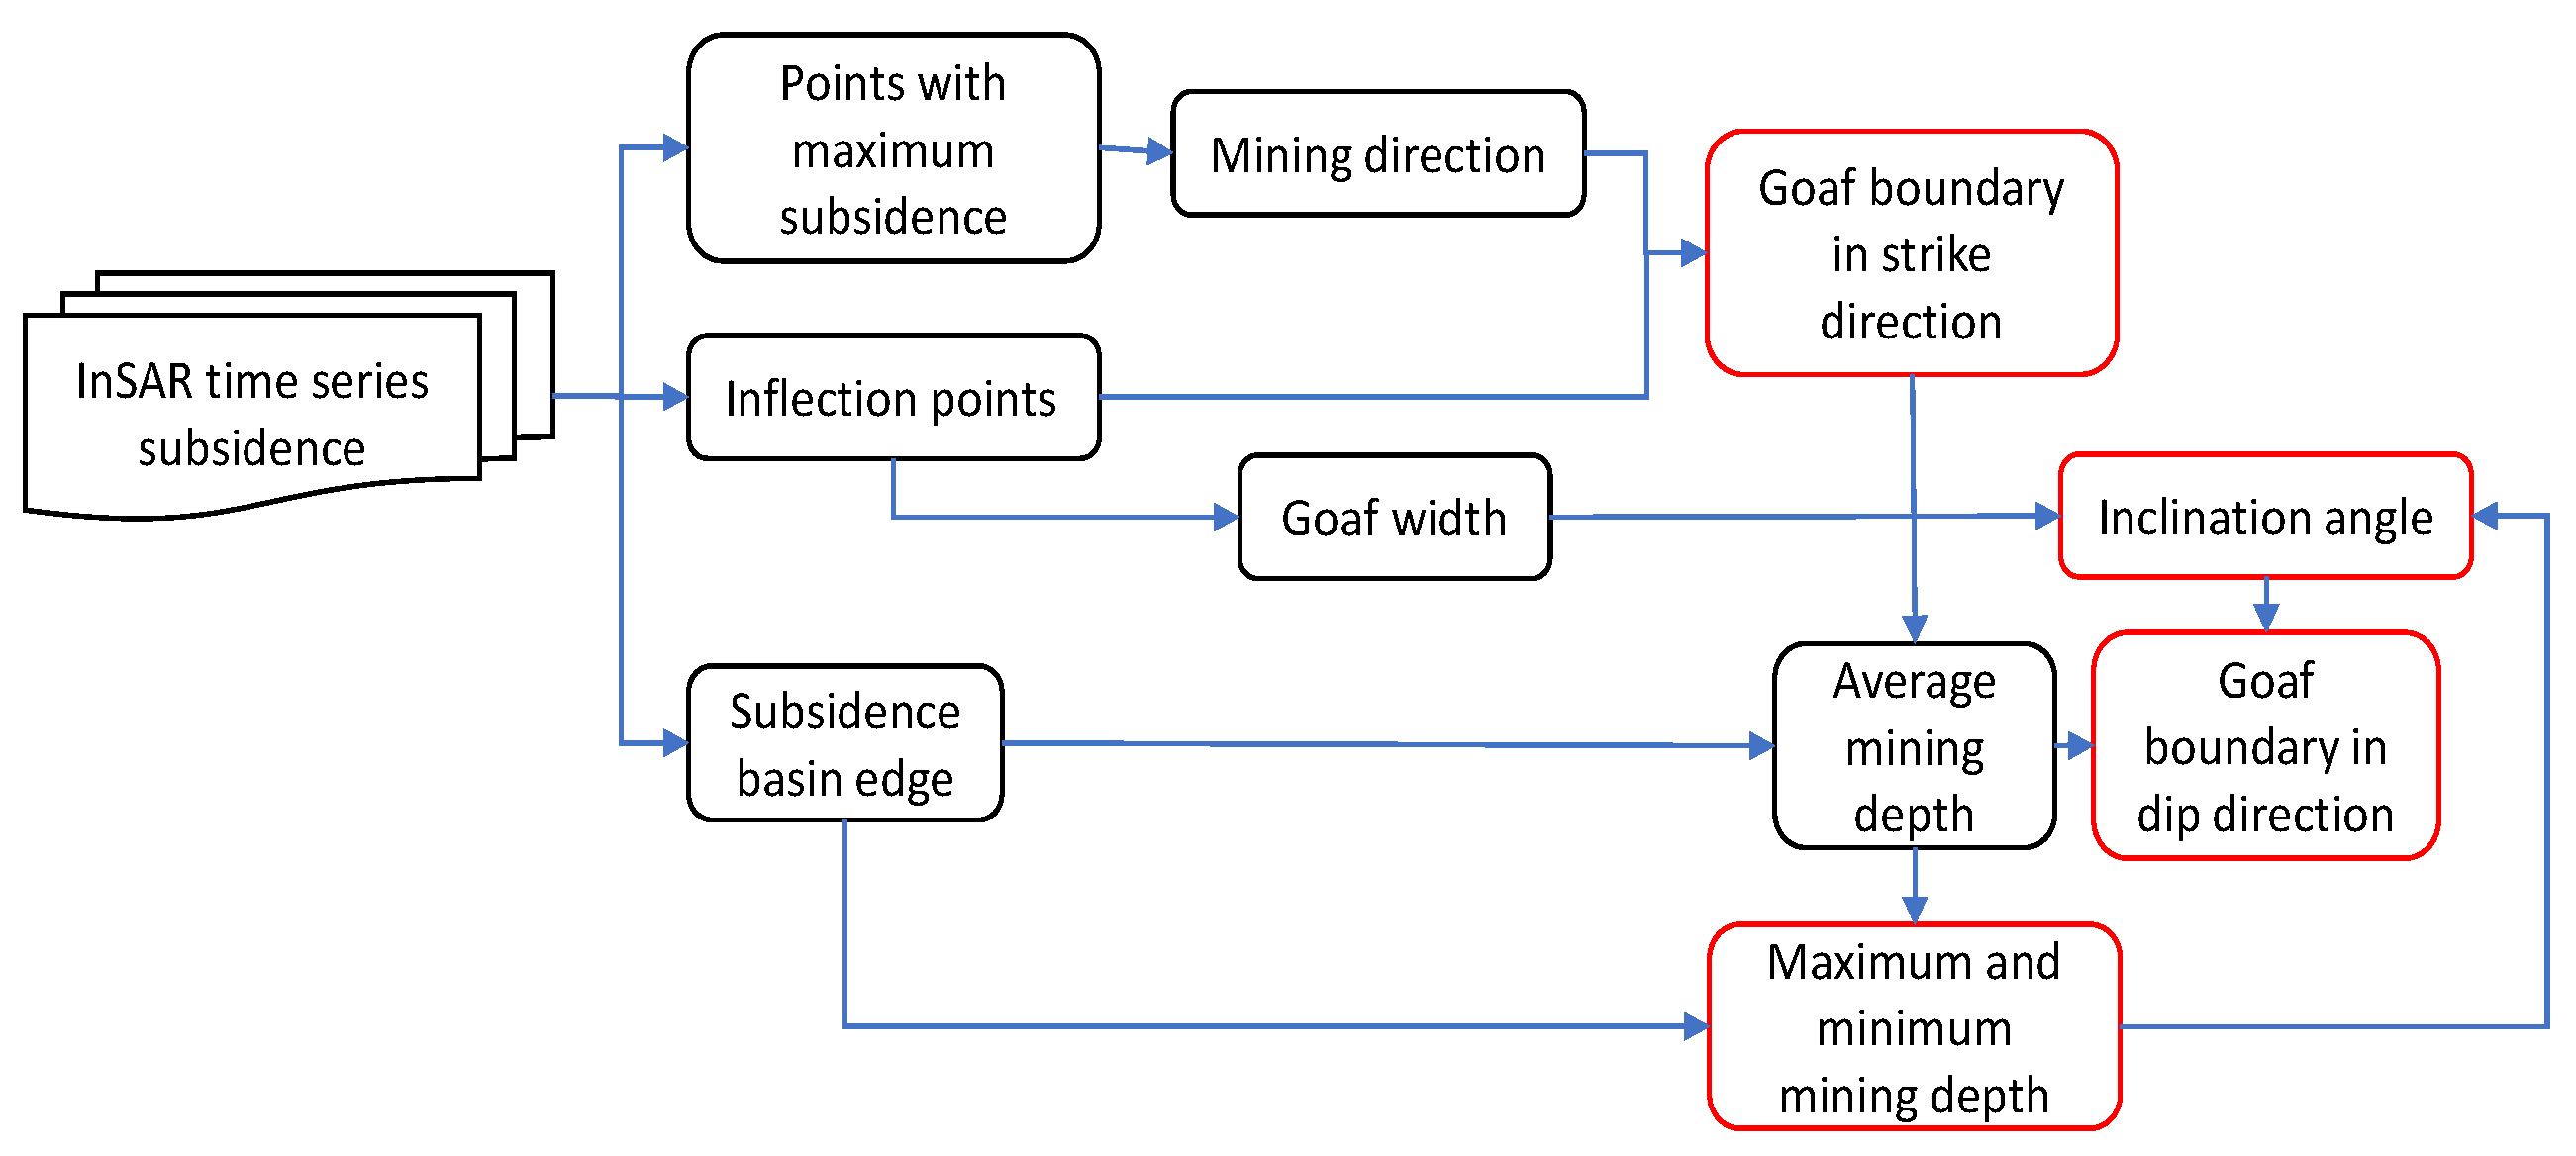
where k is a coefficient, which is related to the lithology of the overlying rock. As the lithology of the overlying rock becomes harder, the value of k increases and generally varies between 0.5 and 0.8. It can be seen from Figure 3 that, after obtaining the mining influence propagation angle, the goaf width and mining depth can be used to determine the position of the goaf dip boundary. The process of locating an inclined goaf is shown in Figure 4.
3. Simulation Experiment
In order to verify the proposed method, firstly, FLAC3D software was used to simulate the ground subsidence, and then the proposed method was used to calculate the position of the mined-out area, and compared with the simulated preset parameters. FLAC3D software was developed by ITASCA in the United States. It adopts an explicit Lagrangian algorithm and hybrid discrete partitioning technology, which can accurately simulate the plastic failure of materials, especially for the large nonlinear deformation in this experiment, and its calculation speed and accuracy are higher than that of finite element programs.
3.1. Simulation Experiment
In this model, a total of nine rock layers were built, including coal seams and floors, and an interface was set up between each layer of overlying rock to ensure that the rock layers could slide or separate. All rock formations adopted the Mohr–Coulomb constitutive model [14]. The horizontal size of each model block was 10 × 10 m, which is a compromise between calculation efficiency and accuracy. The maximum unbalanced force was set as 50 N. The location and information of the simulated goaf are shown in Figure 5 and Table 2. In order to evaluate the impact of insufficient mining, the width of the goaf was greater than the length. The thickness of the coal seam was set to 2 m to make the shape of the sinking basin more typical. The ratio of mining depth to coal seam thickness was far greater than 30 to ensure continuous surface deformation without cracks.
3.2. Simulation Results and Analysis
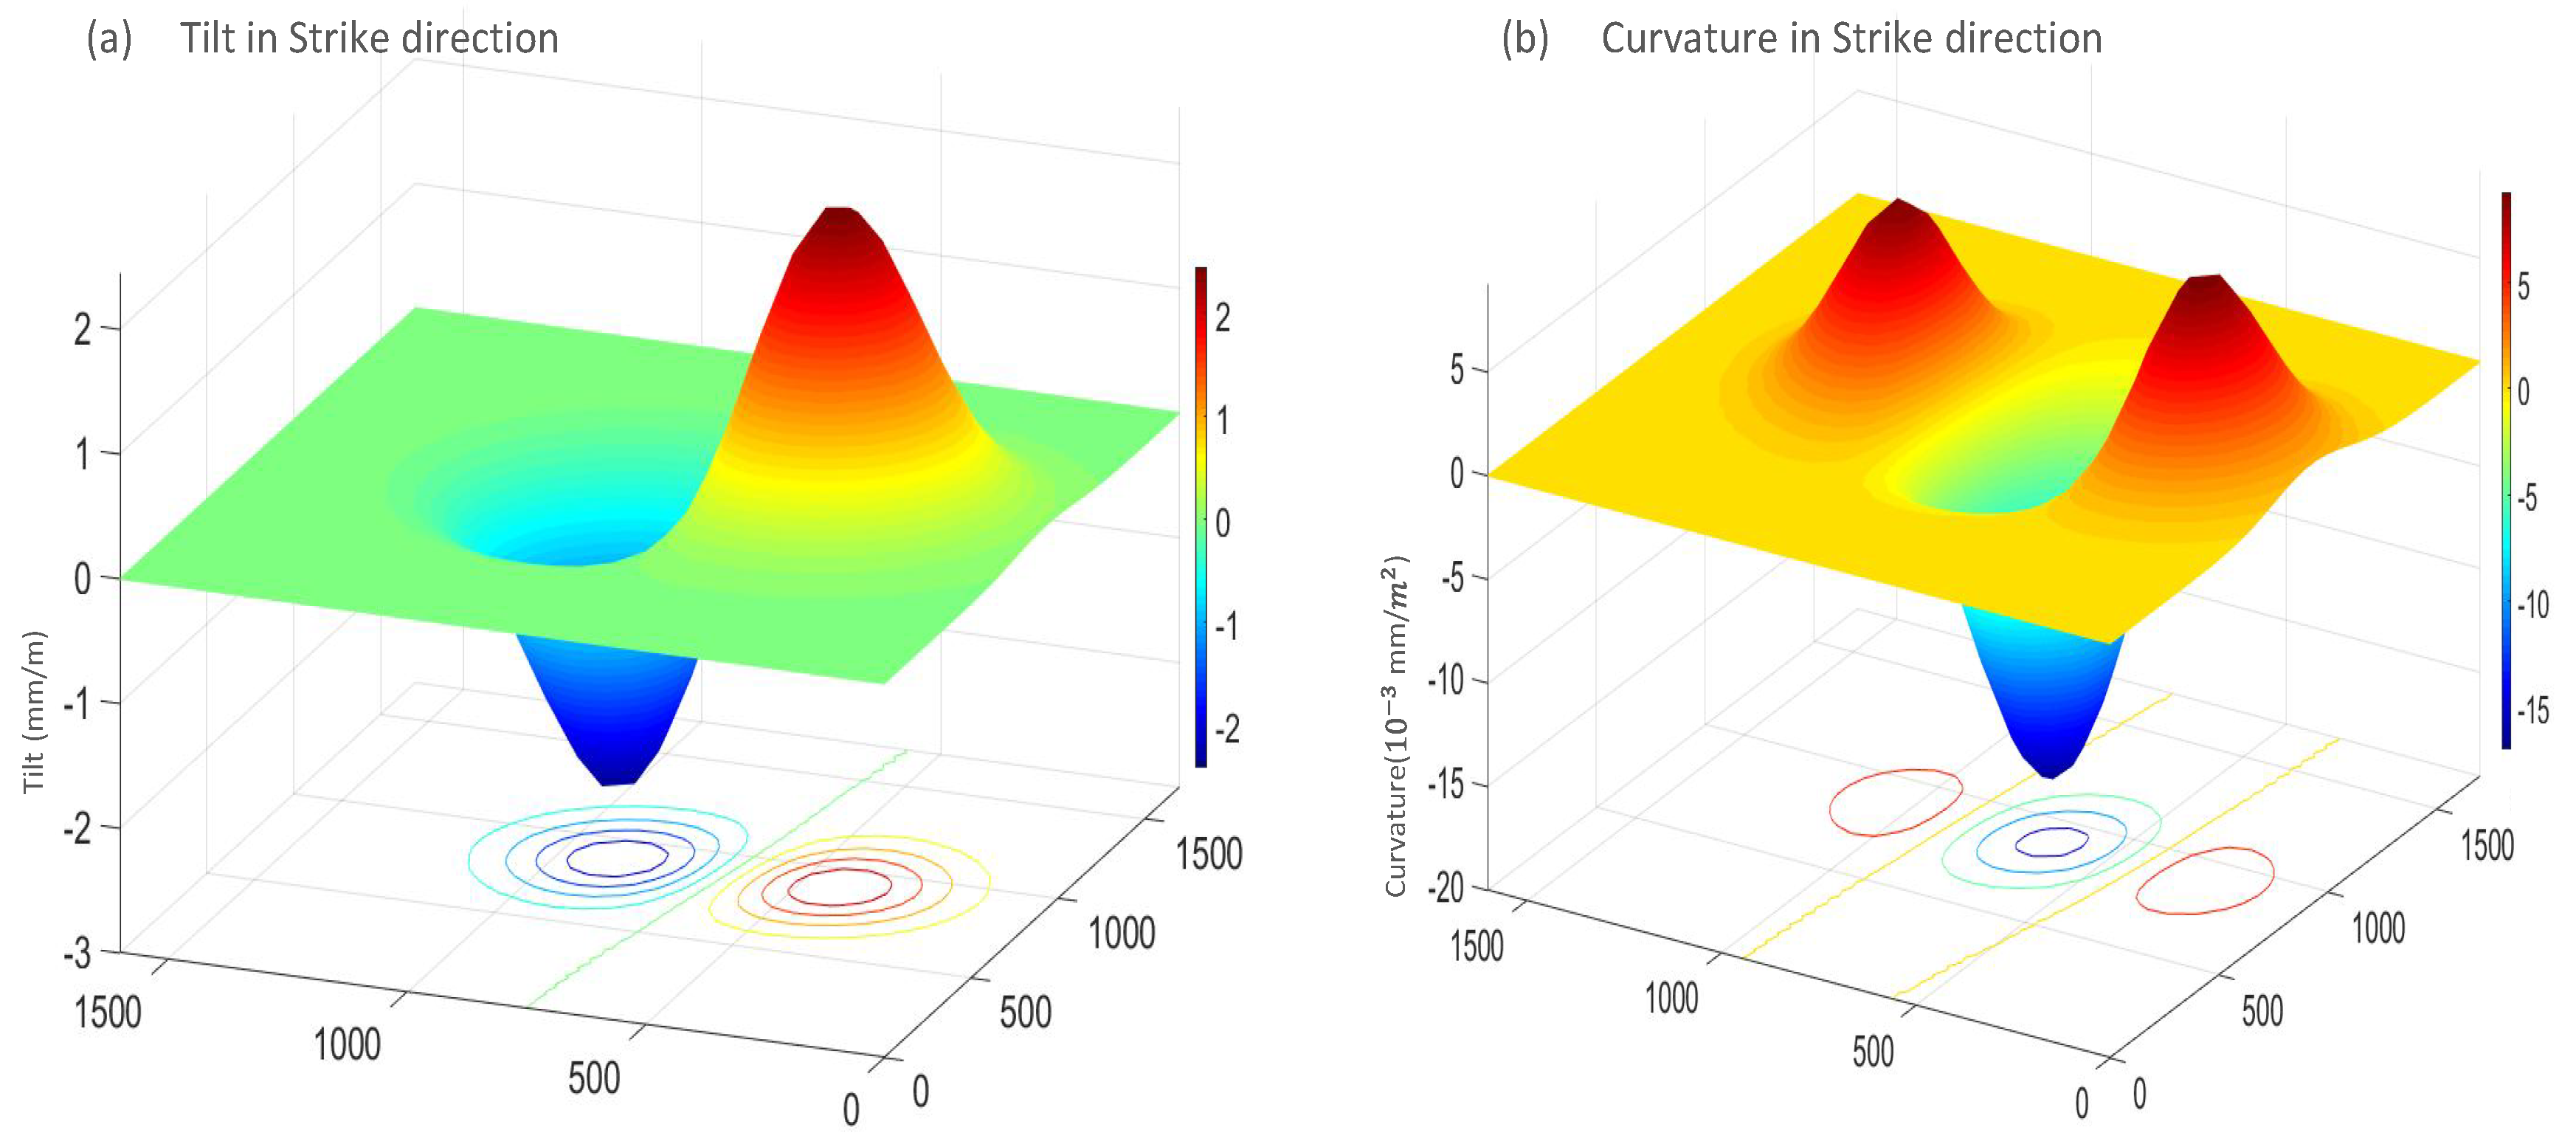
According to the model constructed in Section 3.1, the subsidence basin and the tilt and curvature of the sinking basin can be obtained, as shown in Figure 5 and Figure 6. As it can be seen in Figure 5, due to the inclination of the coal seam, the center of the sinking basin did not overlap the center of the goaf, but instead moved downhill. Meanwhile, it can be seen in Figure 6 that the tilt of the inclined coal seam is asymmetrical. Compared to the downhill direction, the uphill direction changed more drastically. In Figure 6a, the zero value between the tilt peak and the trough is a line instead of a rectangle, indicating that the coal seam was not fully mined. Since the width of the goaf in this simulation was greater than the length, it can be concluded that the coal seam was not fully mined in either the strike or dip directions.
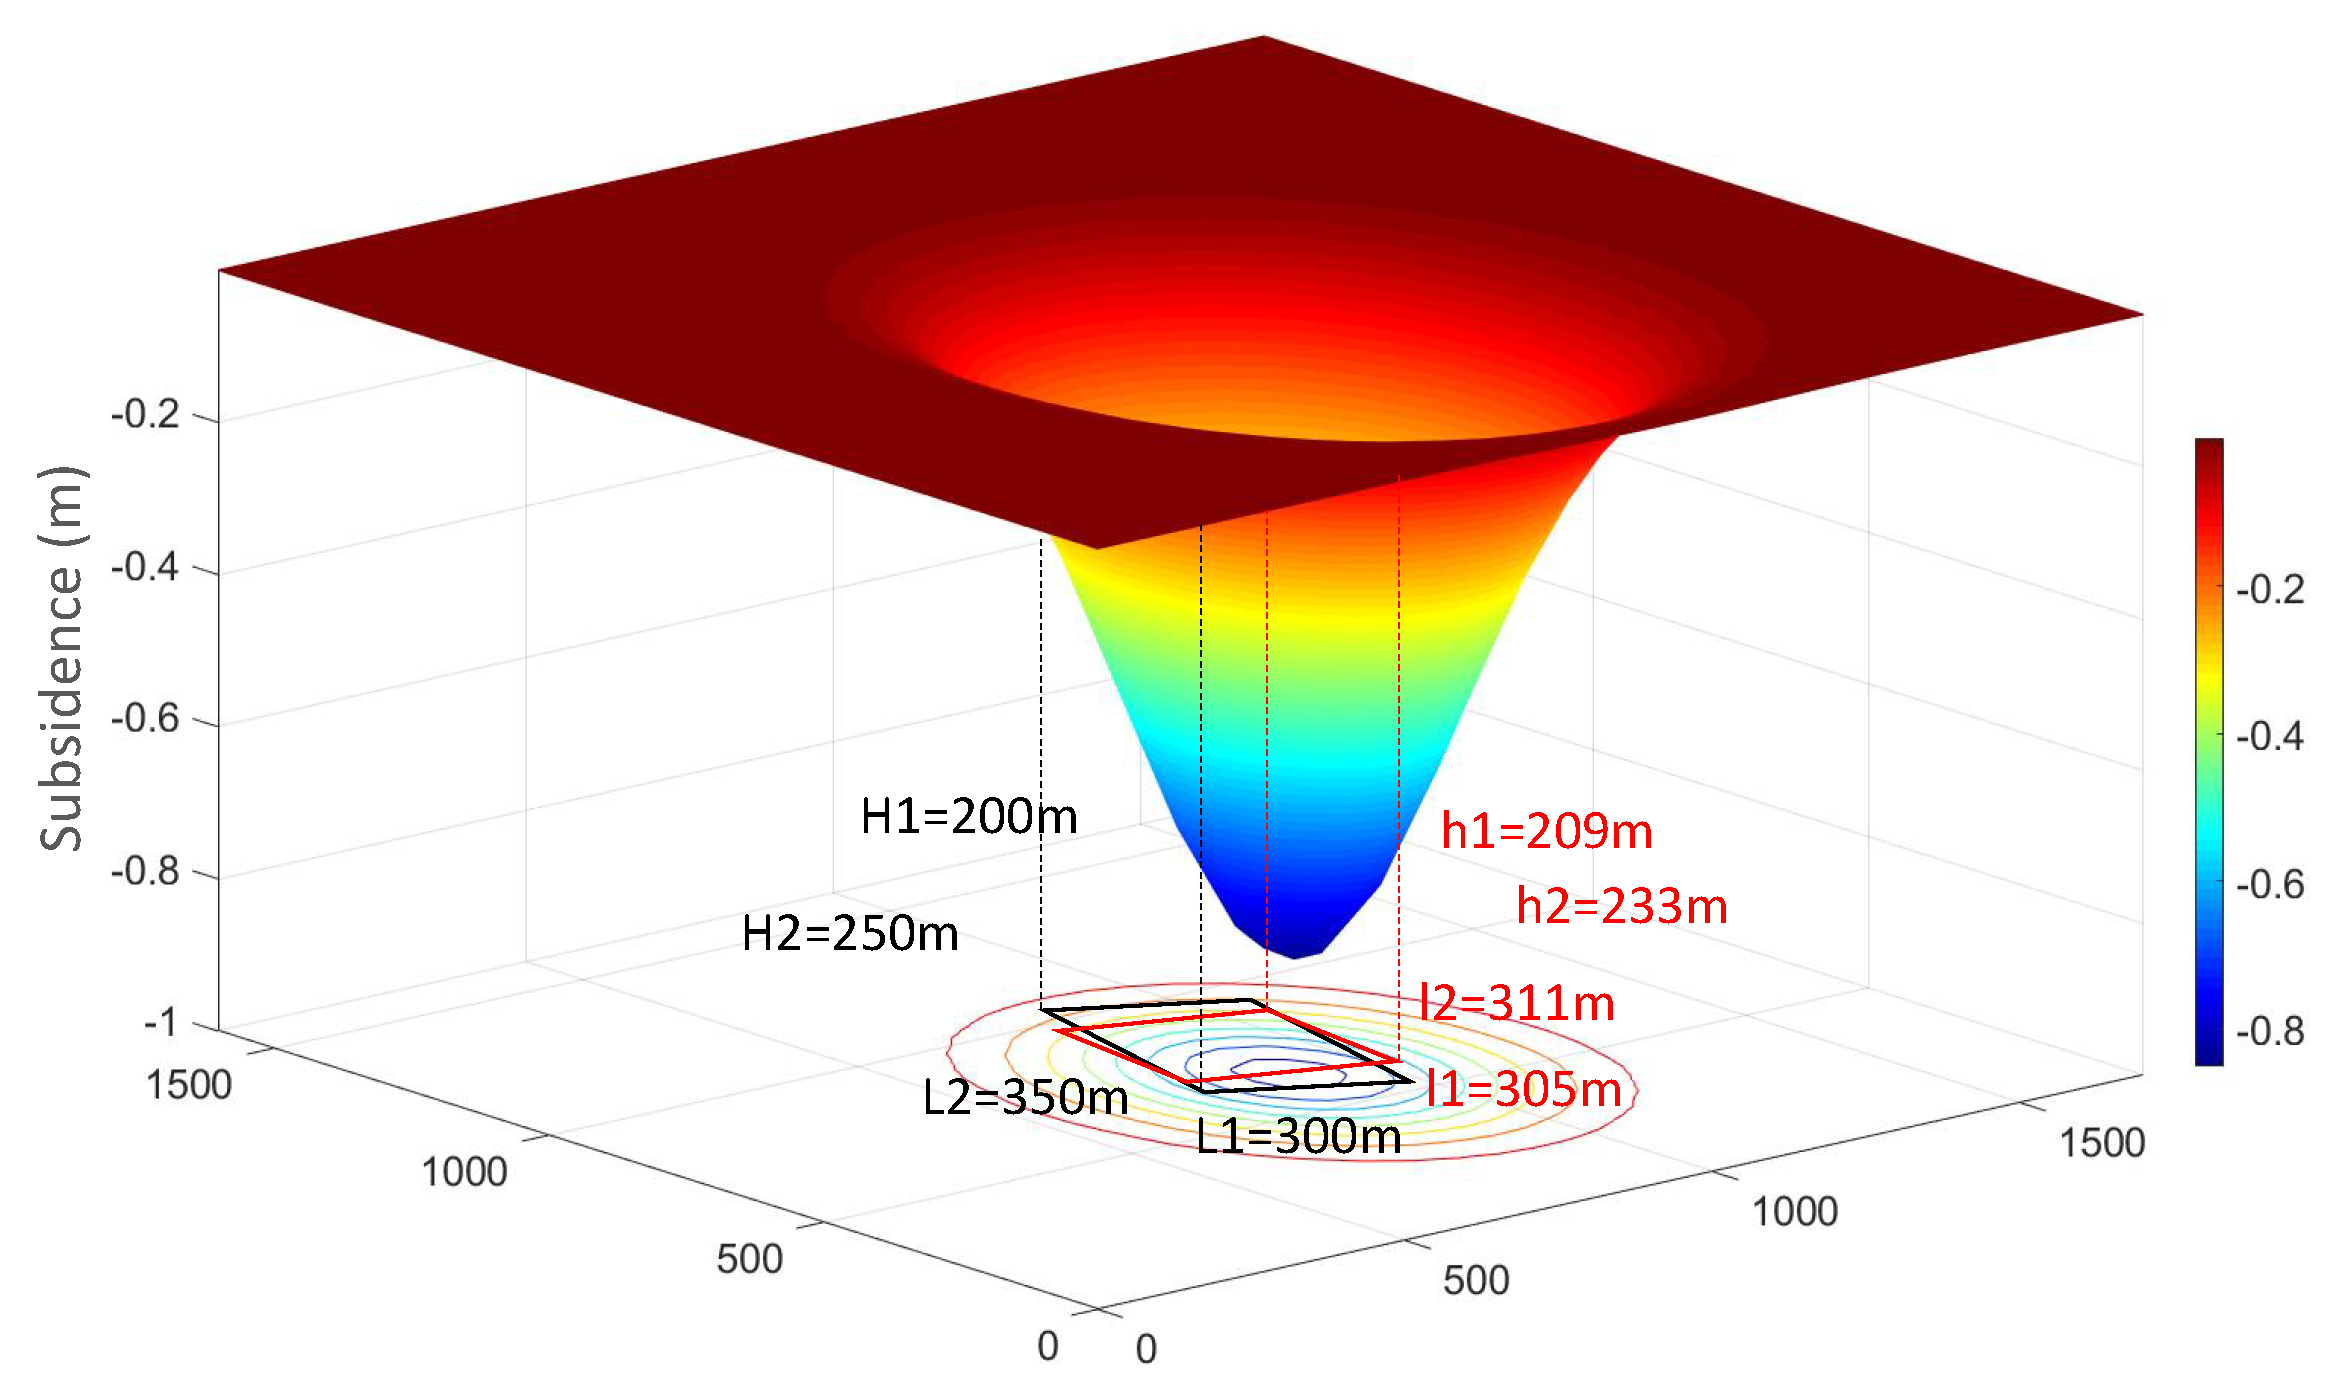
The results obtained according to the proposed method are shown in Table 2. From Table 2, it can be seen that the average error was 4.71%. Since the simulation experiment was not affected by the InSAR monitoring accuracy, it can be considered that the all of the errors in Table 2 are model errors. These errors were below 2%, except for the length of the dip and the mining depth in the uphill direction. The length of the dip was directly calculated from the inflection point and its offset. Since the error of the strike length was small, it can be considered that the reason for the large dip length error is the change of the inflection point caused by the inclination of the coal seam. Meanwhile, the mining depth in the uphill direction was calculated from the main influence radius. Compared to the mining depth in the downhill direction, the error significantly increased. Similarly, the reason for this phenomenon is that the inclination of the coal seam led to changes in the relationship between the main influence radius and the mining depth in the uphill direction.
4. Project Example
4.1. Study Area and Data Sets
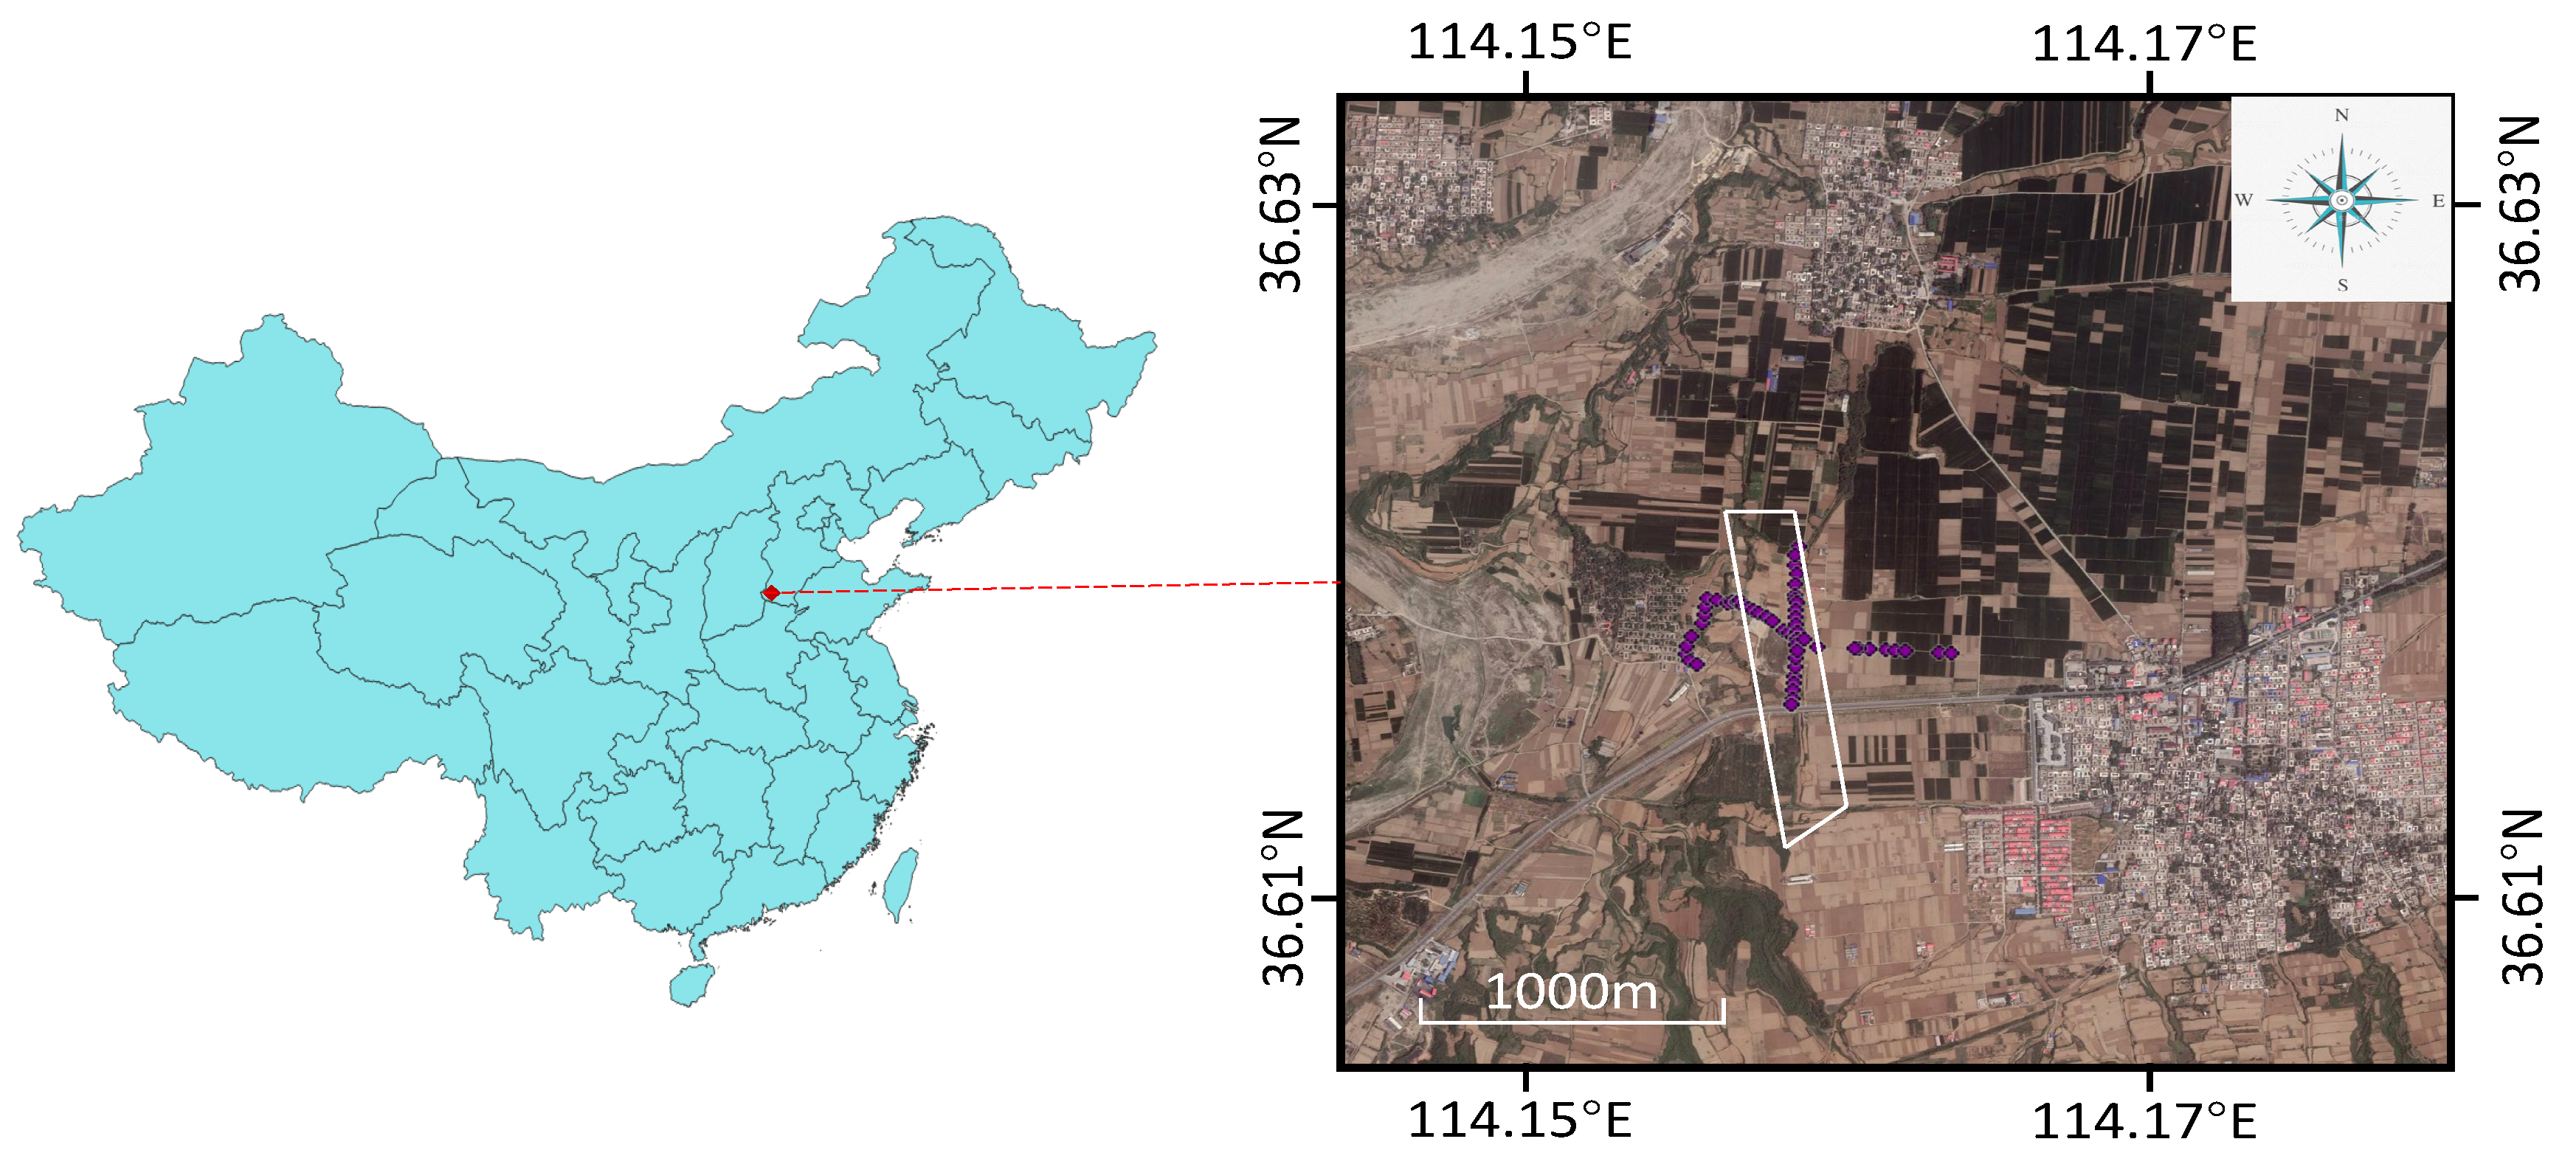
Fengfeng Mining Area with affiliated to Handan, Hebei Province, located in the southern part of Hebei Province and the eastern part of Taihang Mountain, at the junction of the Shanxi, Henan, and Hebei provinces. The area covers – north (latitude) and – east (longitude), with a total area of approximately 560 km [15]. The east of the mining area is a sloping plain, and the west comprises a basin and hills. The lowest elevation is 107 m and the highest elevation is 891 m. The Fengfeng mining area has a warm, temperate, semi-humid, continental monsoon climate. The four seasons are distinct: hot and rainy in summer, cold and dry in winter, concentrated sunlight, a long frost-free period, and rainfall from July to September each year [16,17]. The Fengfeng mining area is a semi-covered area. The strata exposed from west to east are Cambrian, Ordovician, Carboniferous, Permian, Triassic, and Quaternary [18,19]. The inclination angle is between and [20]. Fengfeng is rich in resources, dominated by natural resources such as mineral resources and construction raw materials. Among them, coal resources are the most abundant. The coal resources total approximately 1.63 billion tons a year, and the annual output of raw coal is 15 million tons. To date, the coking coal mining in the Fengfeng mining area alone is more than 500 million tons, forming a mining district with a population of more than 300,000 [21]. In this experiment, the 132,610 working face was selected as the study goaf. The average coal seam thickness of 132,610 is 5.9 m, the average mining depth is 774 m, and the actual mining thickness of the mine is 4.5 m. Herein, the planned strike length of the coal seam was 1021 m, the strike mining length during the InSAR observation period was 319 m, the dip length was 165 m, the strike inclination angle was , and the dip inclination angle was . It can be seen in Figure 7 that most of the ground surface is covered by farmland, which has lower SAR coherence than urban areas. The purple dots in Figure 7 indicate the locations of the leveling observations that were used to verify the InSAR results.
In this experiment, 11 scenes of Radarsat-2 ascending orbit images were used to obtain the surface deformation. The image acquisition time was from 15 June 2015 to 5 March 2016. The sensor was right-view imaging, with an HH polarization mode, a range resolution of 2.66 m, an azimuth resolution of 2.90 m, and an incident angle range from to .
4.2. InSAR Processing
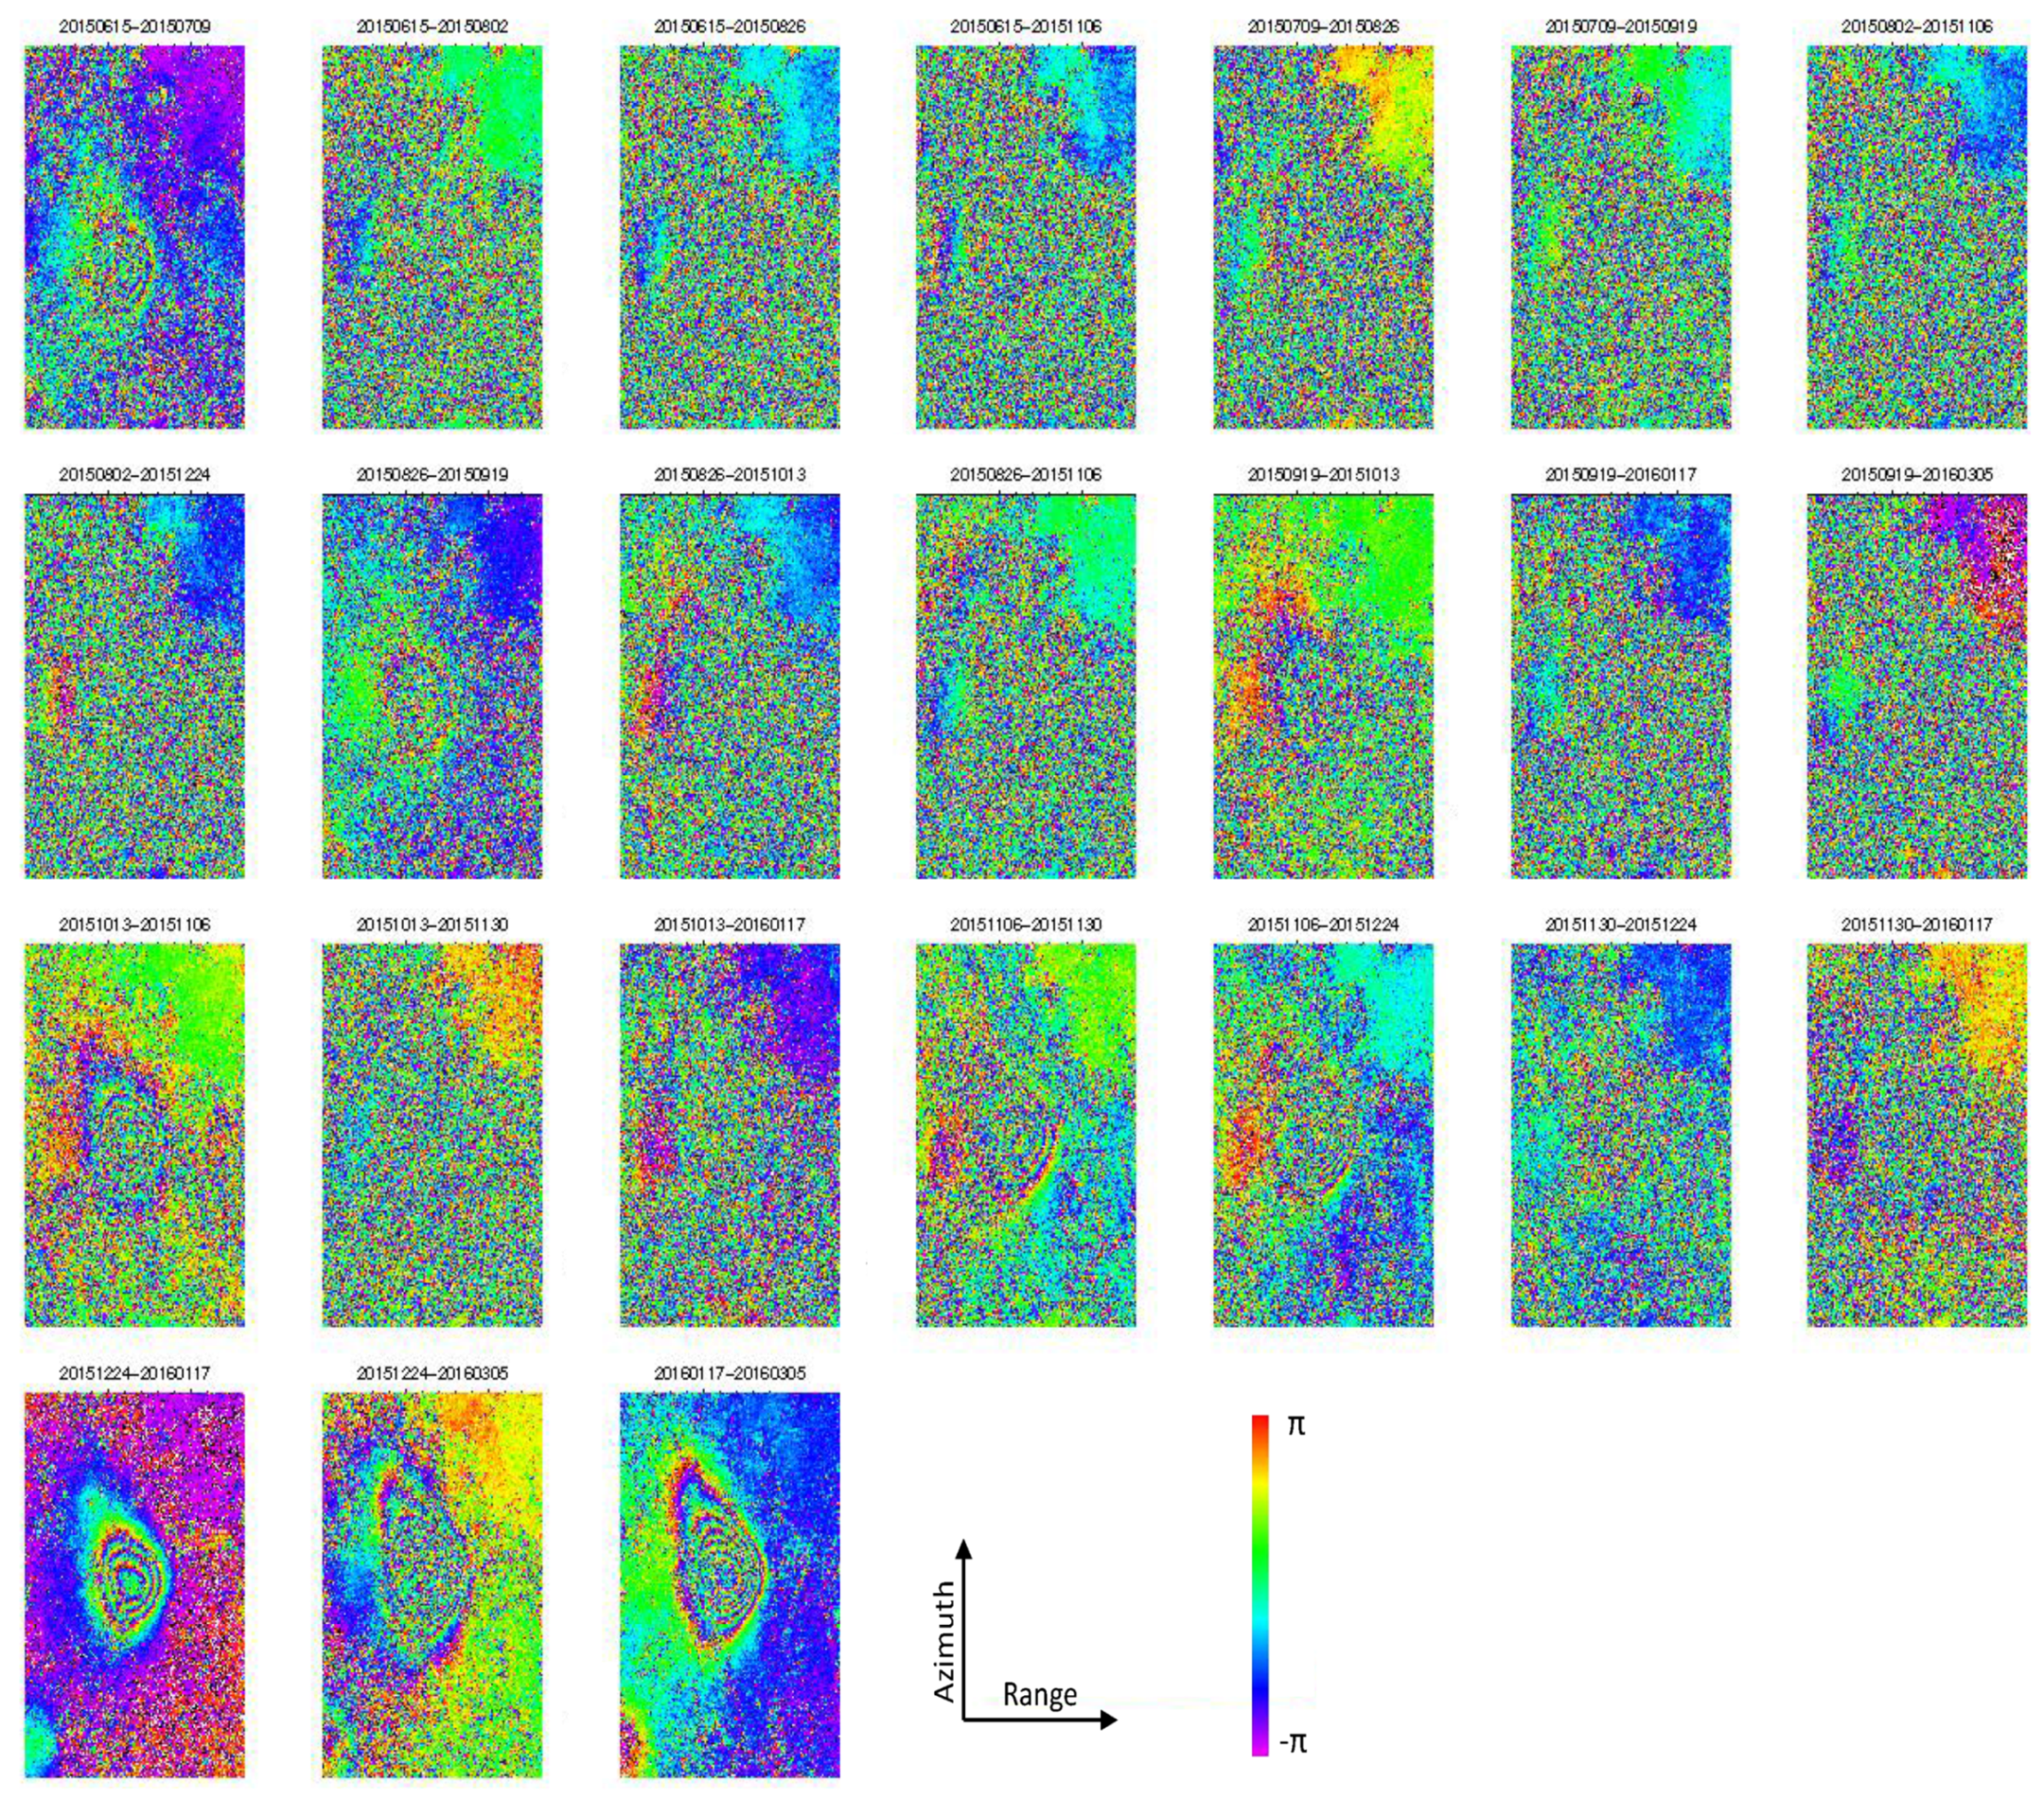
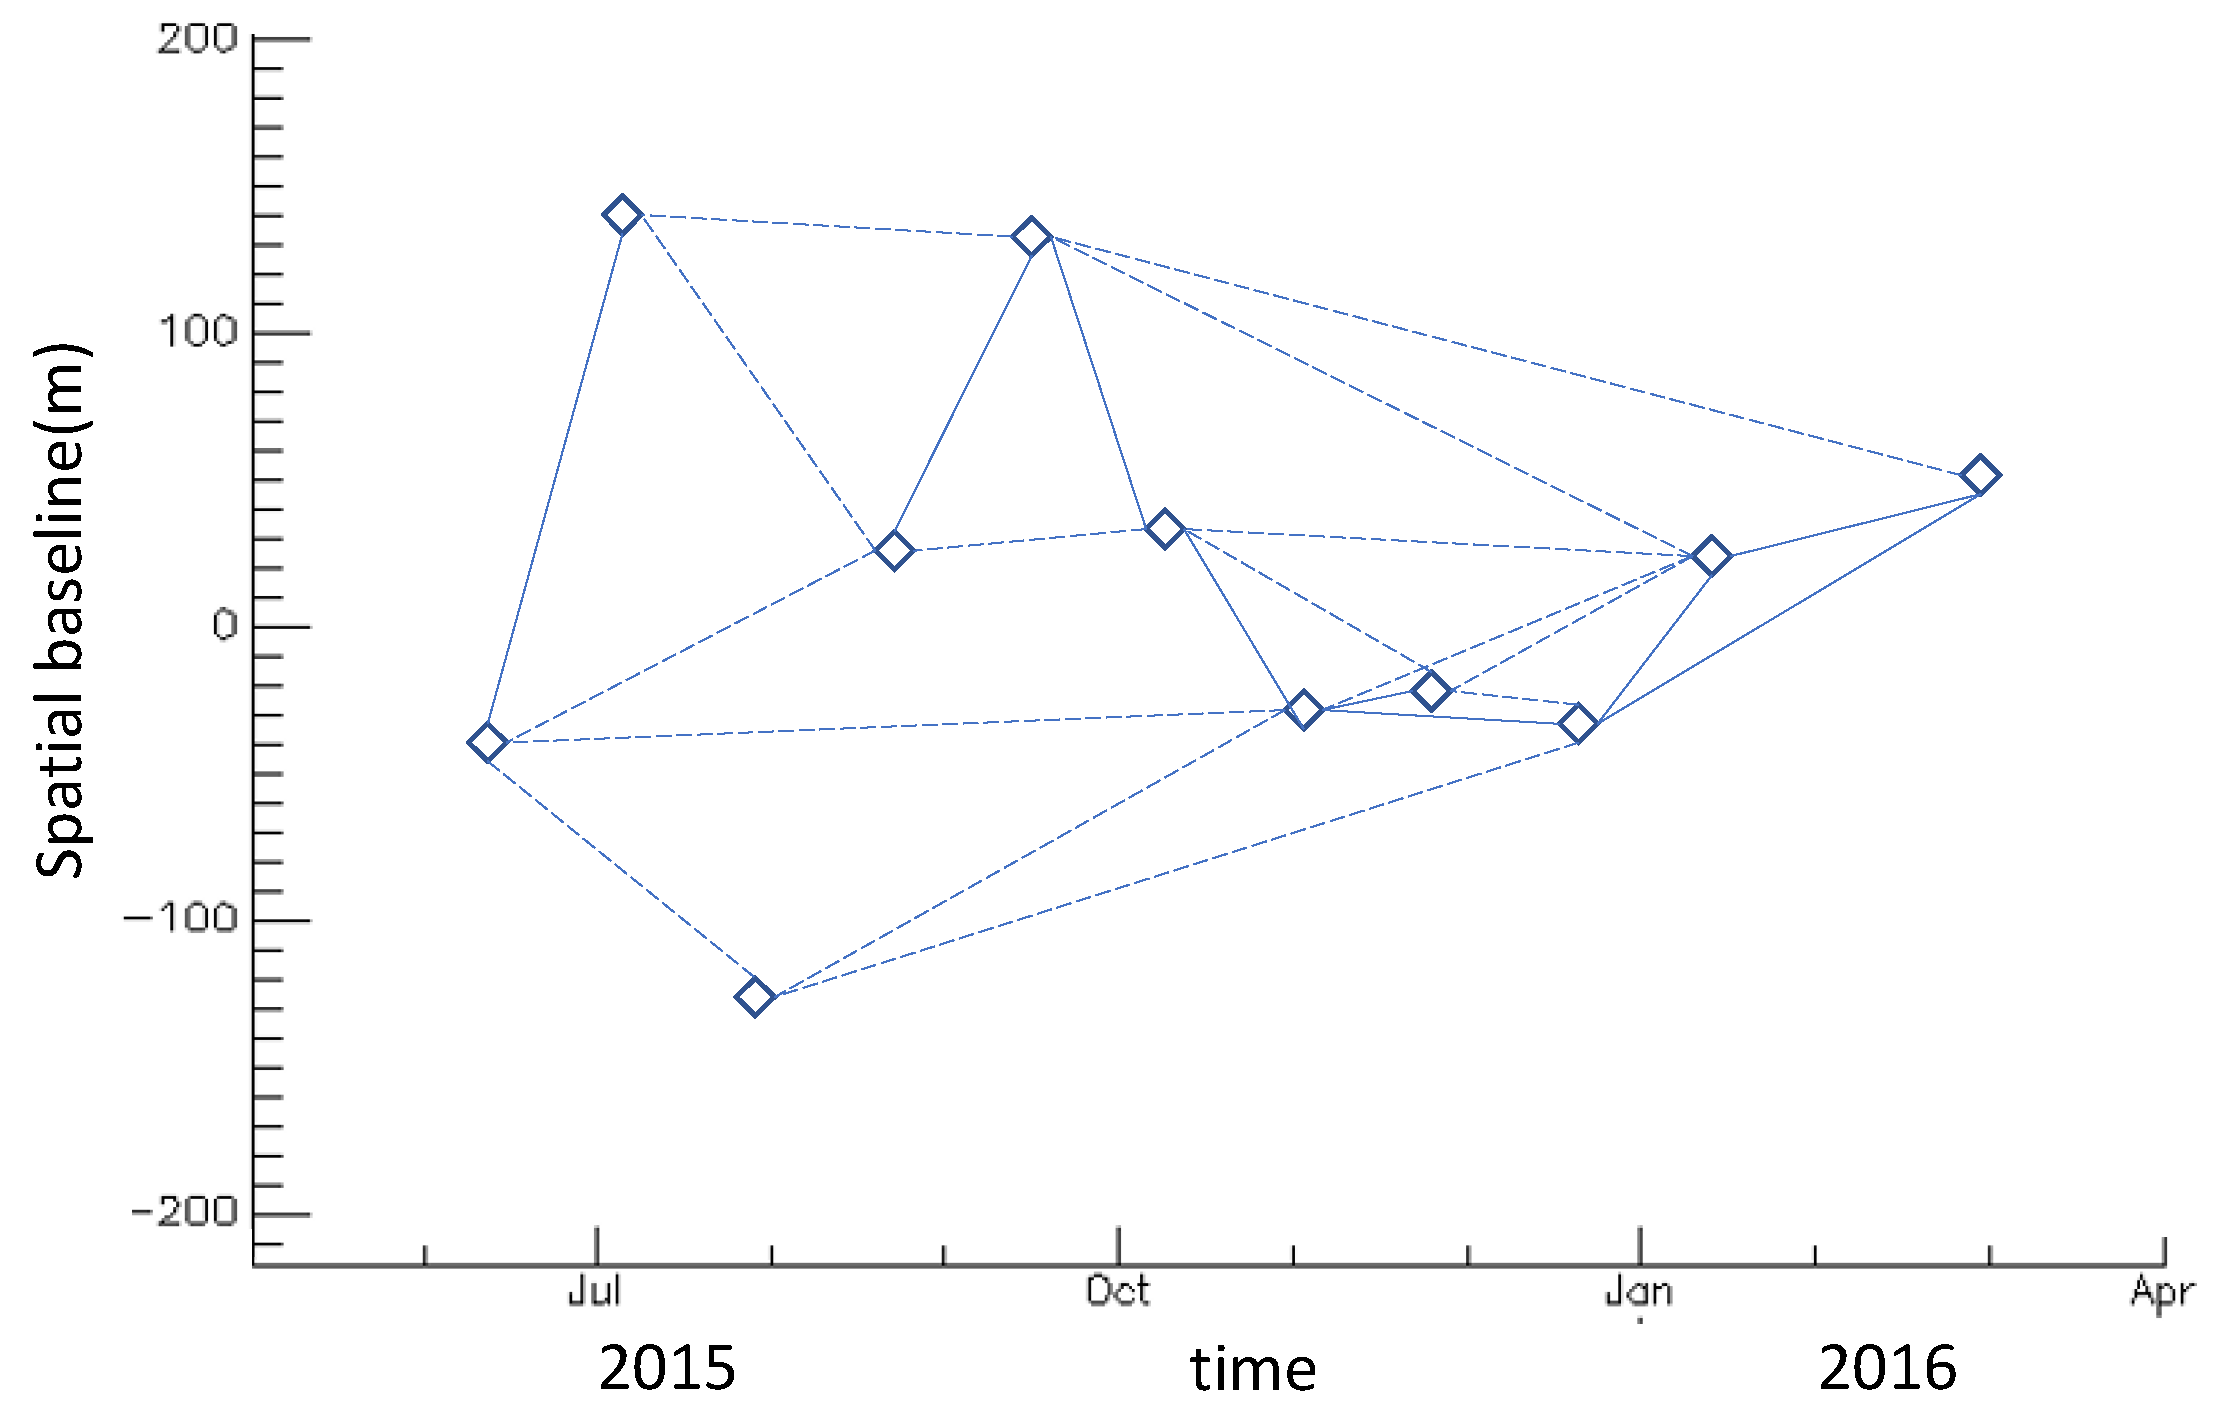
After setting the thresholds of spatial baseline and temporal baseline to 1000 m and 1000 days, Delaunay triangulation was used to select the interference pair. Twenty-four interferograms were obtained from 11 SAR images, as shown in Figure 8. It can be seen from Figure 8 that severe incoherence occurred in some interferograms, and the interference fringes almost disappear. The interferograms with severe incoherence were discarded, as shown in Figure 9. Due to the large deformation and poor coherence in this region, after the multi-looks were completed, the points with coherence greater than 0.45 were retained. The phase standard deviation of the point selected by this threshold was approximately . Then, the linear and nonlinear deformations were estimated according to the method in [22,23]. This method can effectively retain the nonlinear part of the deformation, so the surface deformation can be obtained more accurately.
4.3. Results
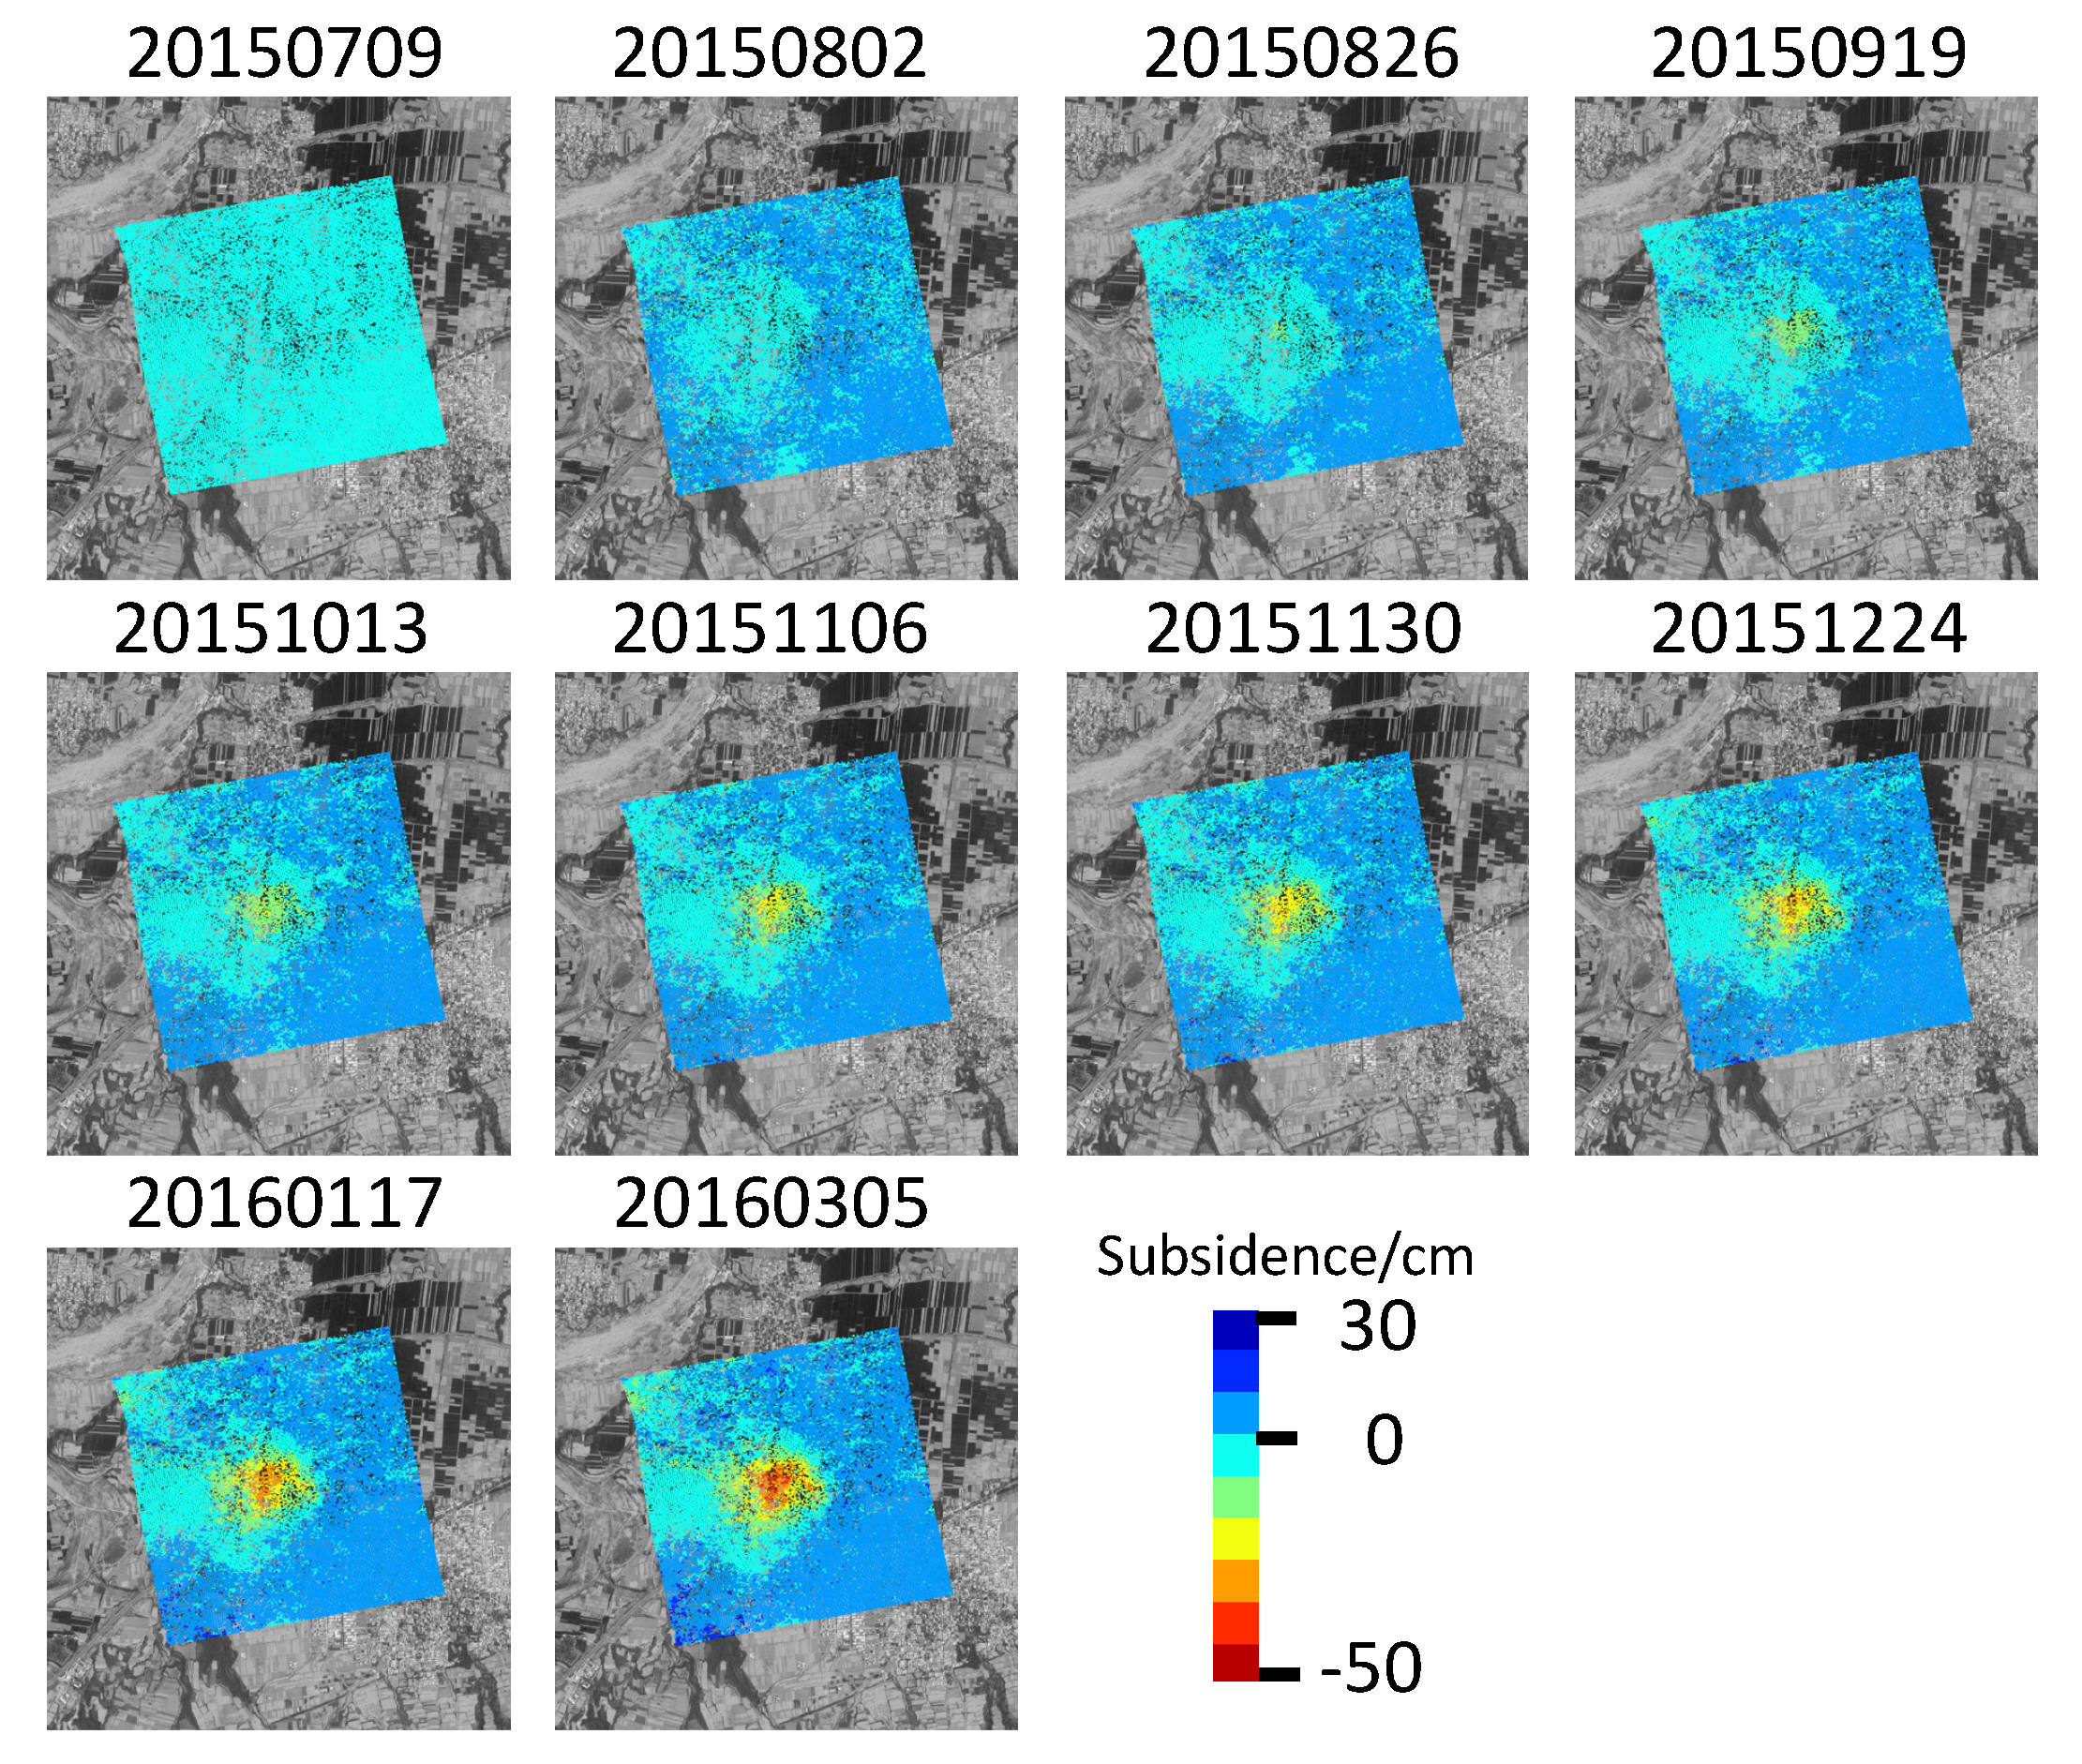
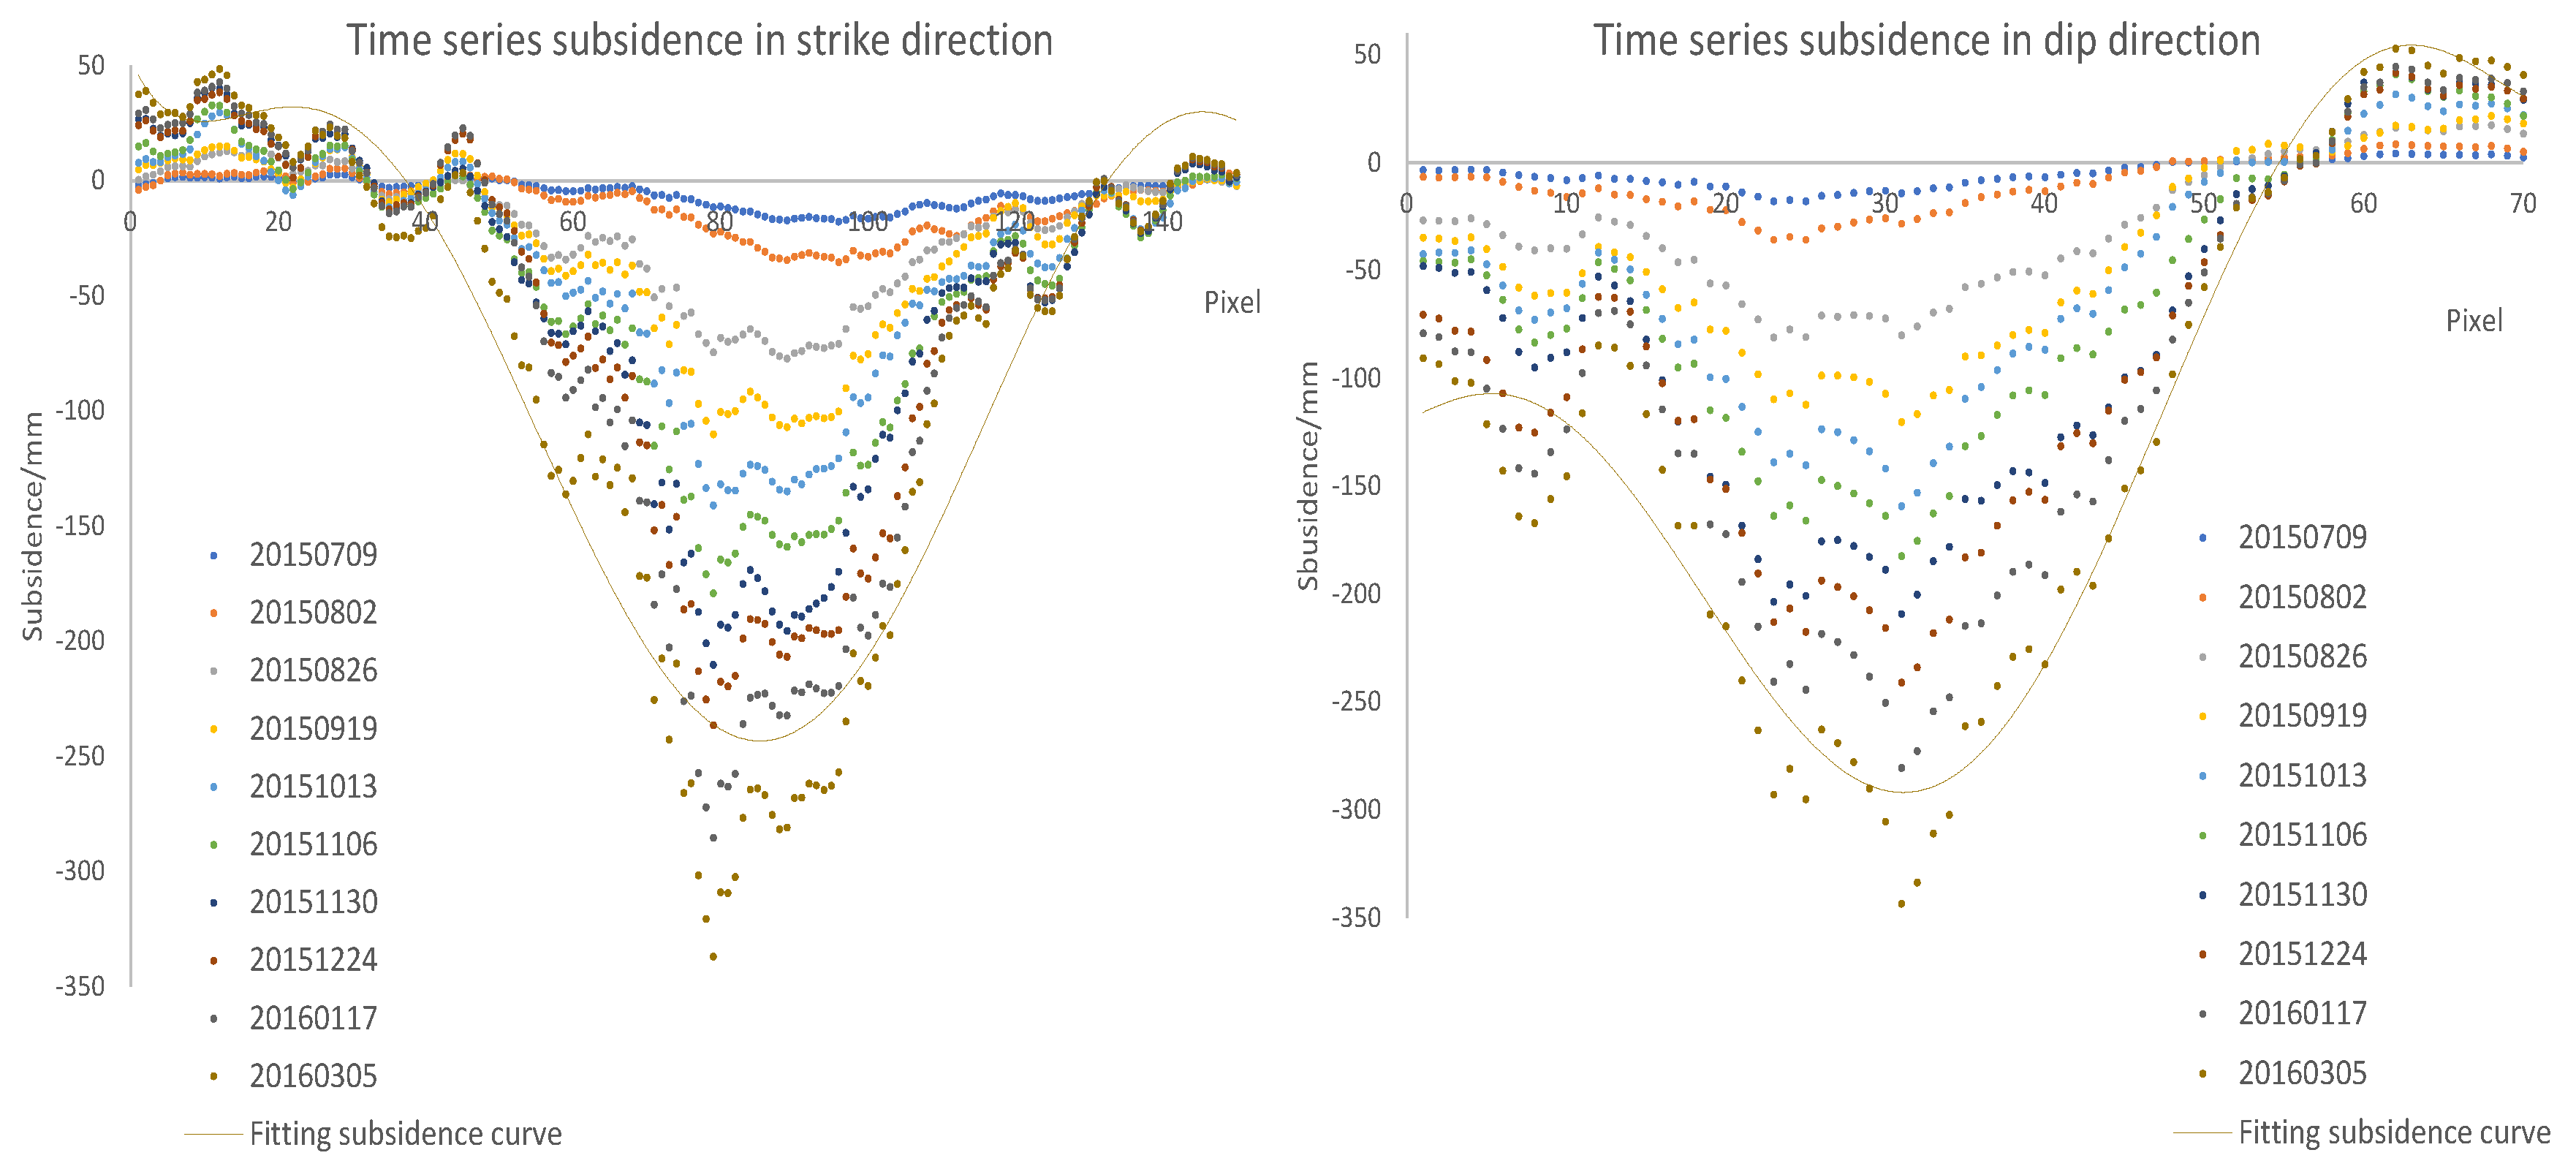
It can be seen from Figure 10 that the lower coherence threshold ensured the sufficient retention of the points that complete the basin shape. Although lower coherence means larger phase standard deviation, the accuracy of the results was still within an acceptable range. The main manifestation is that the shape of the sinking basin was complete and continuous, with no or few outliers around it. Meanwhile, the time series ground the subsidence gradually increased and shifted to the southeast. The subsidence in the eastern half was relatively slow, while, in the western half, it was more dramatic. Combined with the characteristics of the inclined coal seam in Figure 3, it can be seen that the east direction was the downhill direction, and the west direction was the uphill direction. As can be seen in Figure 11, the sinking curves of each period exhibit the same characteristics and the maximum sinking value reached 350 mm. The location of the maximum sink point shifted southward over time. The subsidence curve in the inclined direction experienced obvious asymmetry of the inclined coal seam because the observed value of InSAR fluctuated greatly, and, therefore, it was not easy to determine the position of the inflection point and the boundary point; thus, a sixth degree polynomial was used to fit the final sinking curve to obtain each characteristic point.
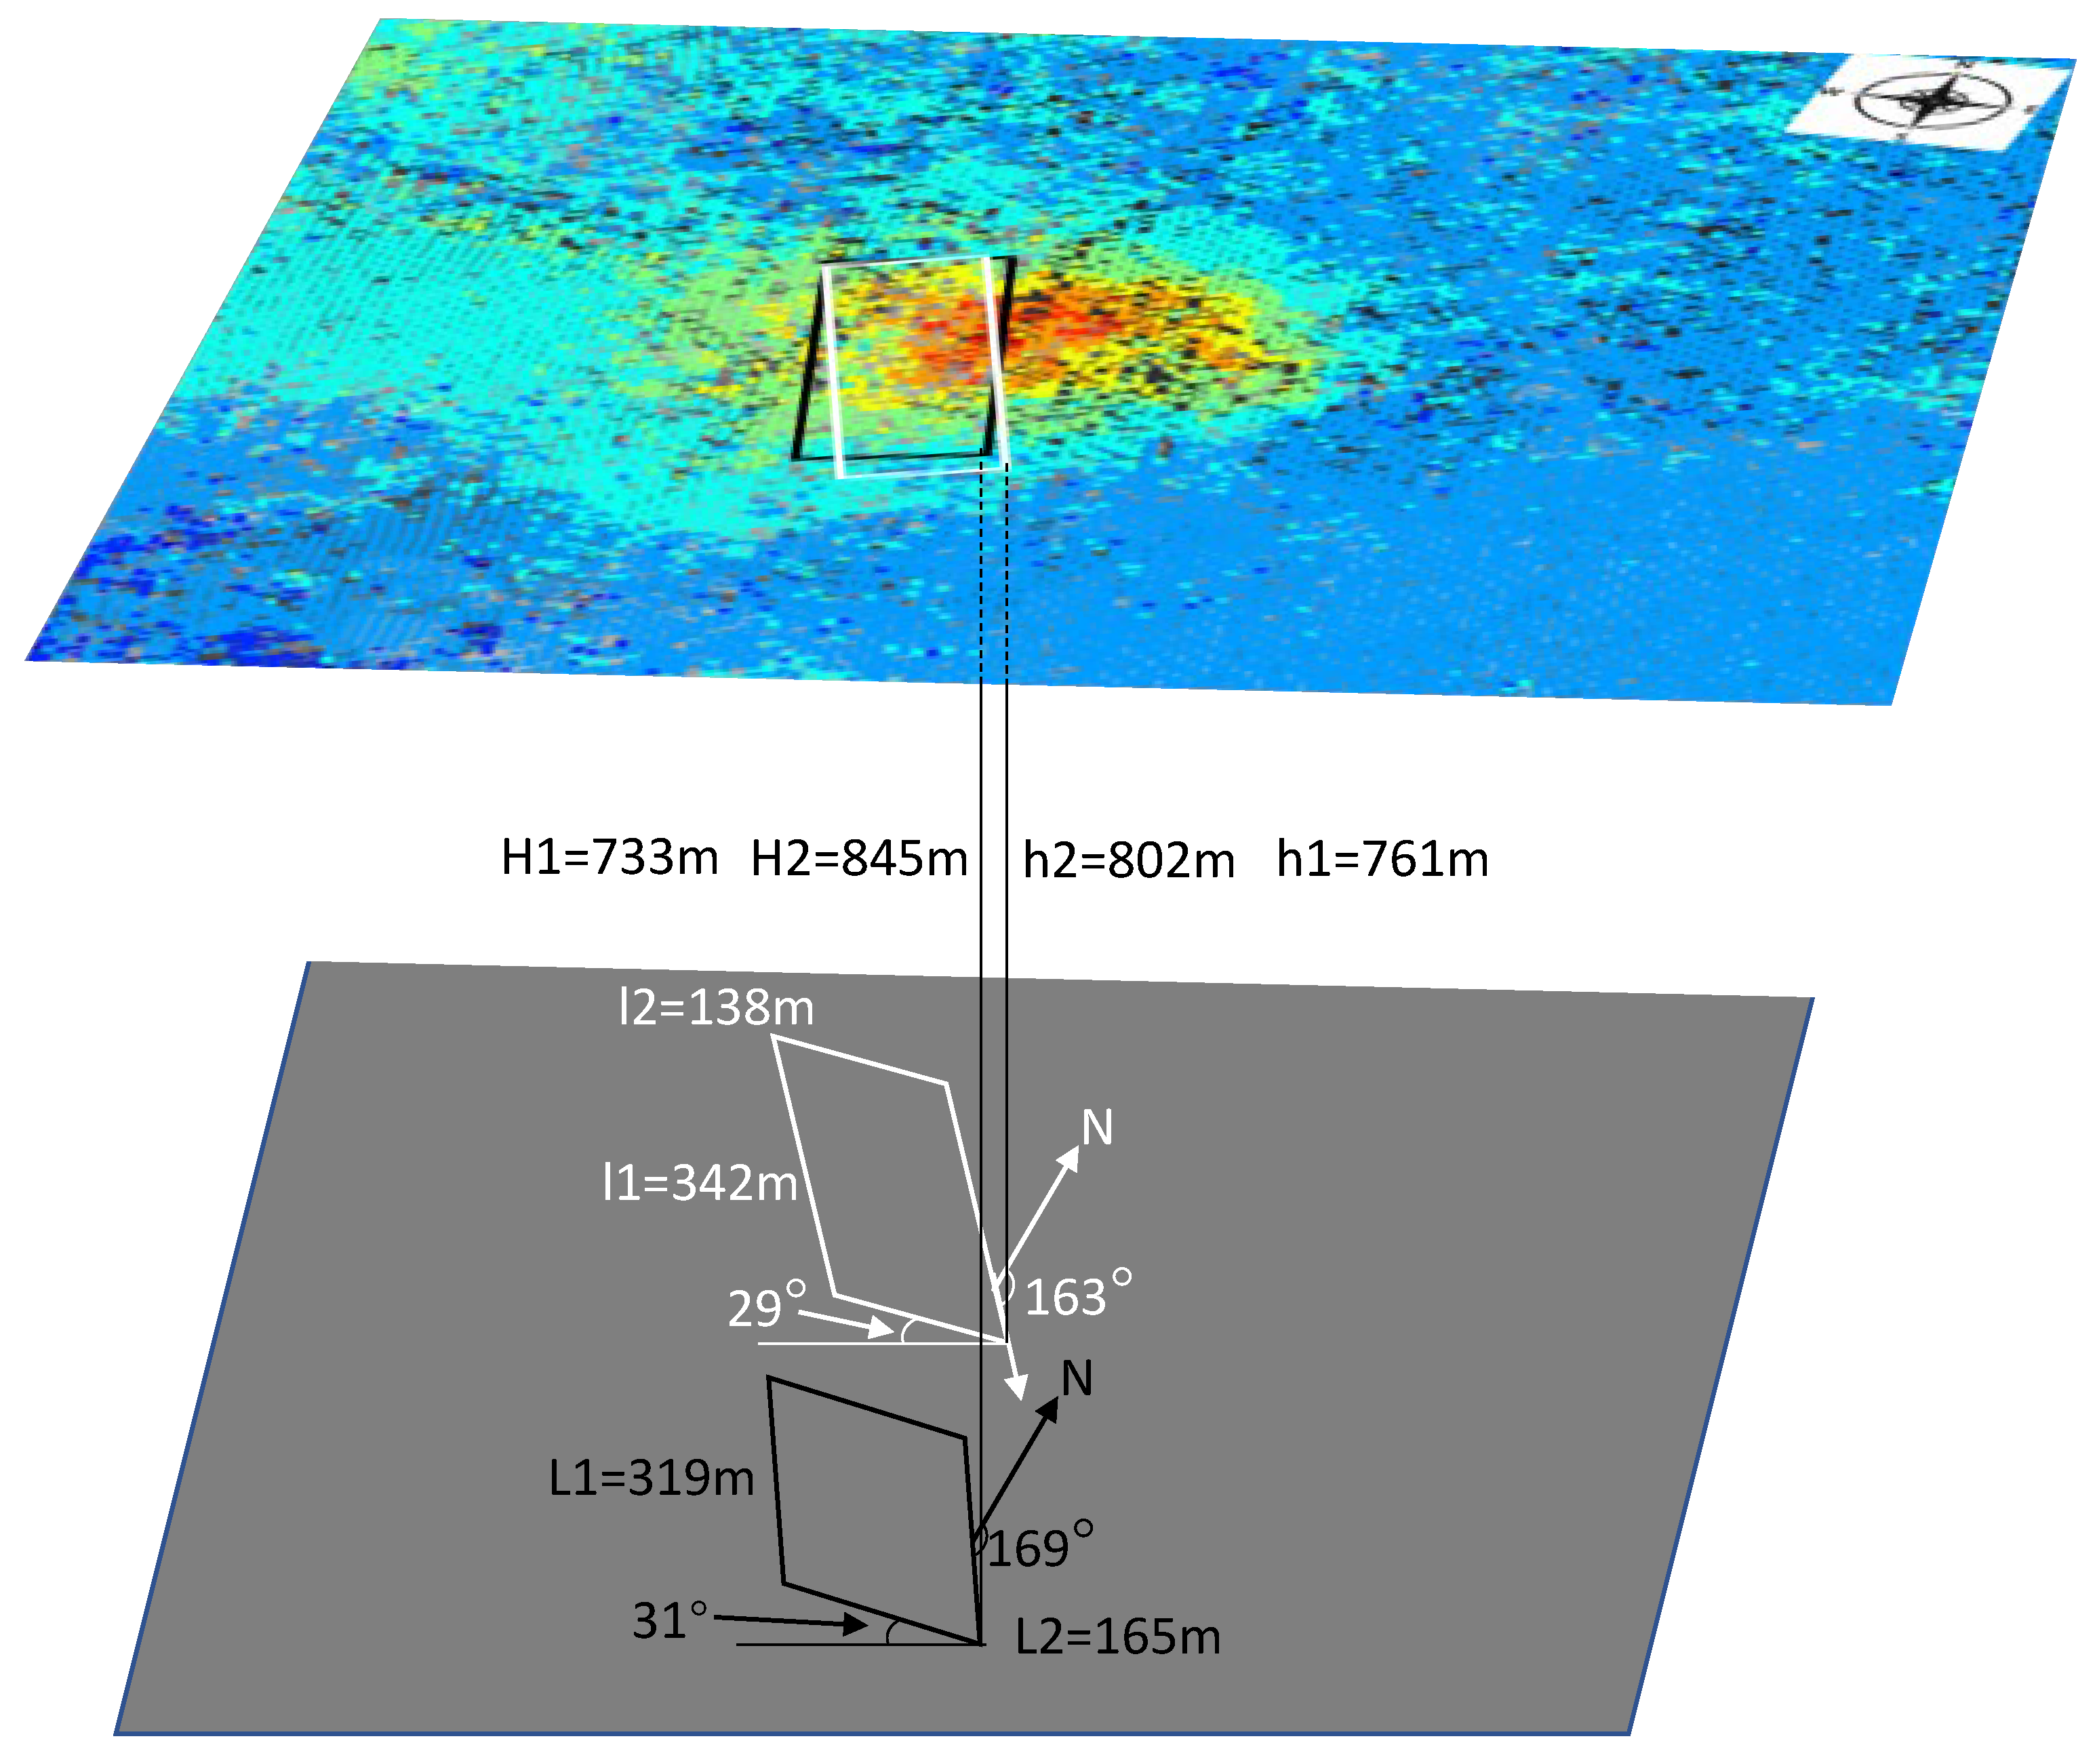
The results of the working face position obtained according to the characteristic points are shown in Table 3 and Figure 12. As the strike direction was obtained using multiple maximum sinking points, the results are more accurate and the relative error is small. Since the mining in the dip direction was insufficient, the inflection point moved toward the center of the goaf, resulting in a larger relative error in the dip length than the strike length. According to [9], the stable back boundary of the mined-out area was used to calculate the average mining depth to avoid the influence of insufficient mining and basin instability and to ensure a small relative error. The more accurate inflection point position in the uphill direction led to a lower relative error of the mining depth with regard to the mining depth in the downhill direction. In Figure 12, it can be seen that the obtained horizontal position of the goaf is close to the real one, while the error of depth is larger. The reason is that the sensitivity of depth calculation was larger than that of the horizontal position. According to Table 3, the average relative error of locating the goaf is 6.35%.
5. Discussion
5.1. Leveling Data Verification
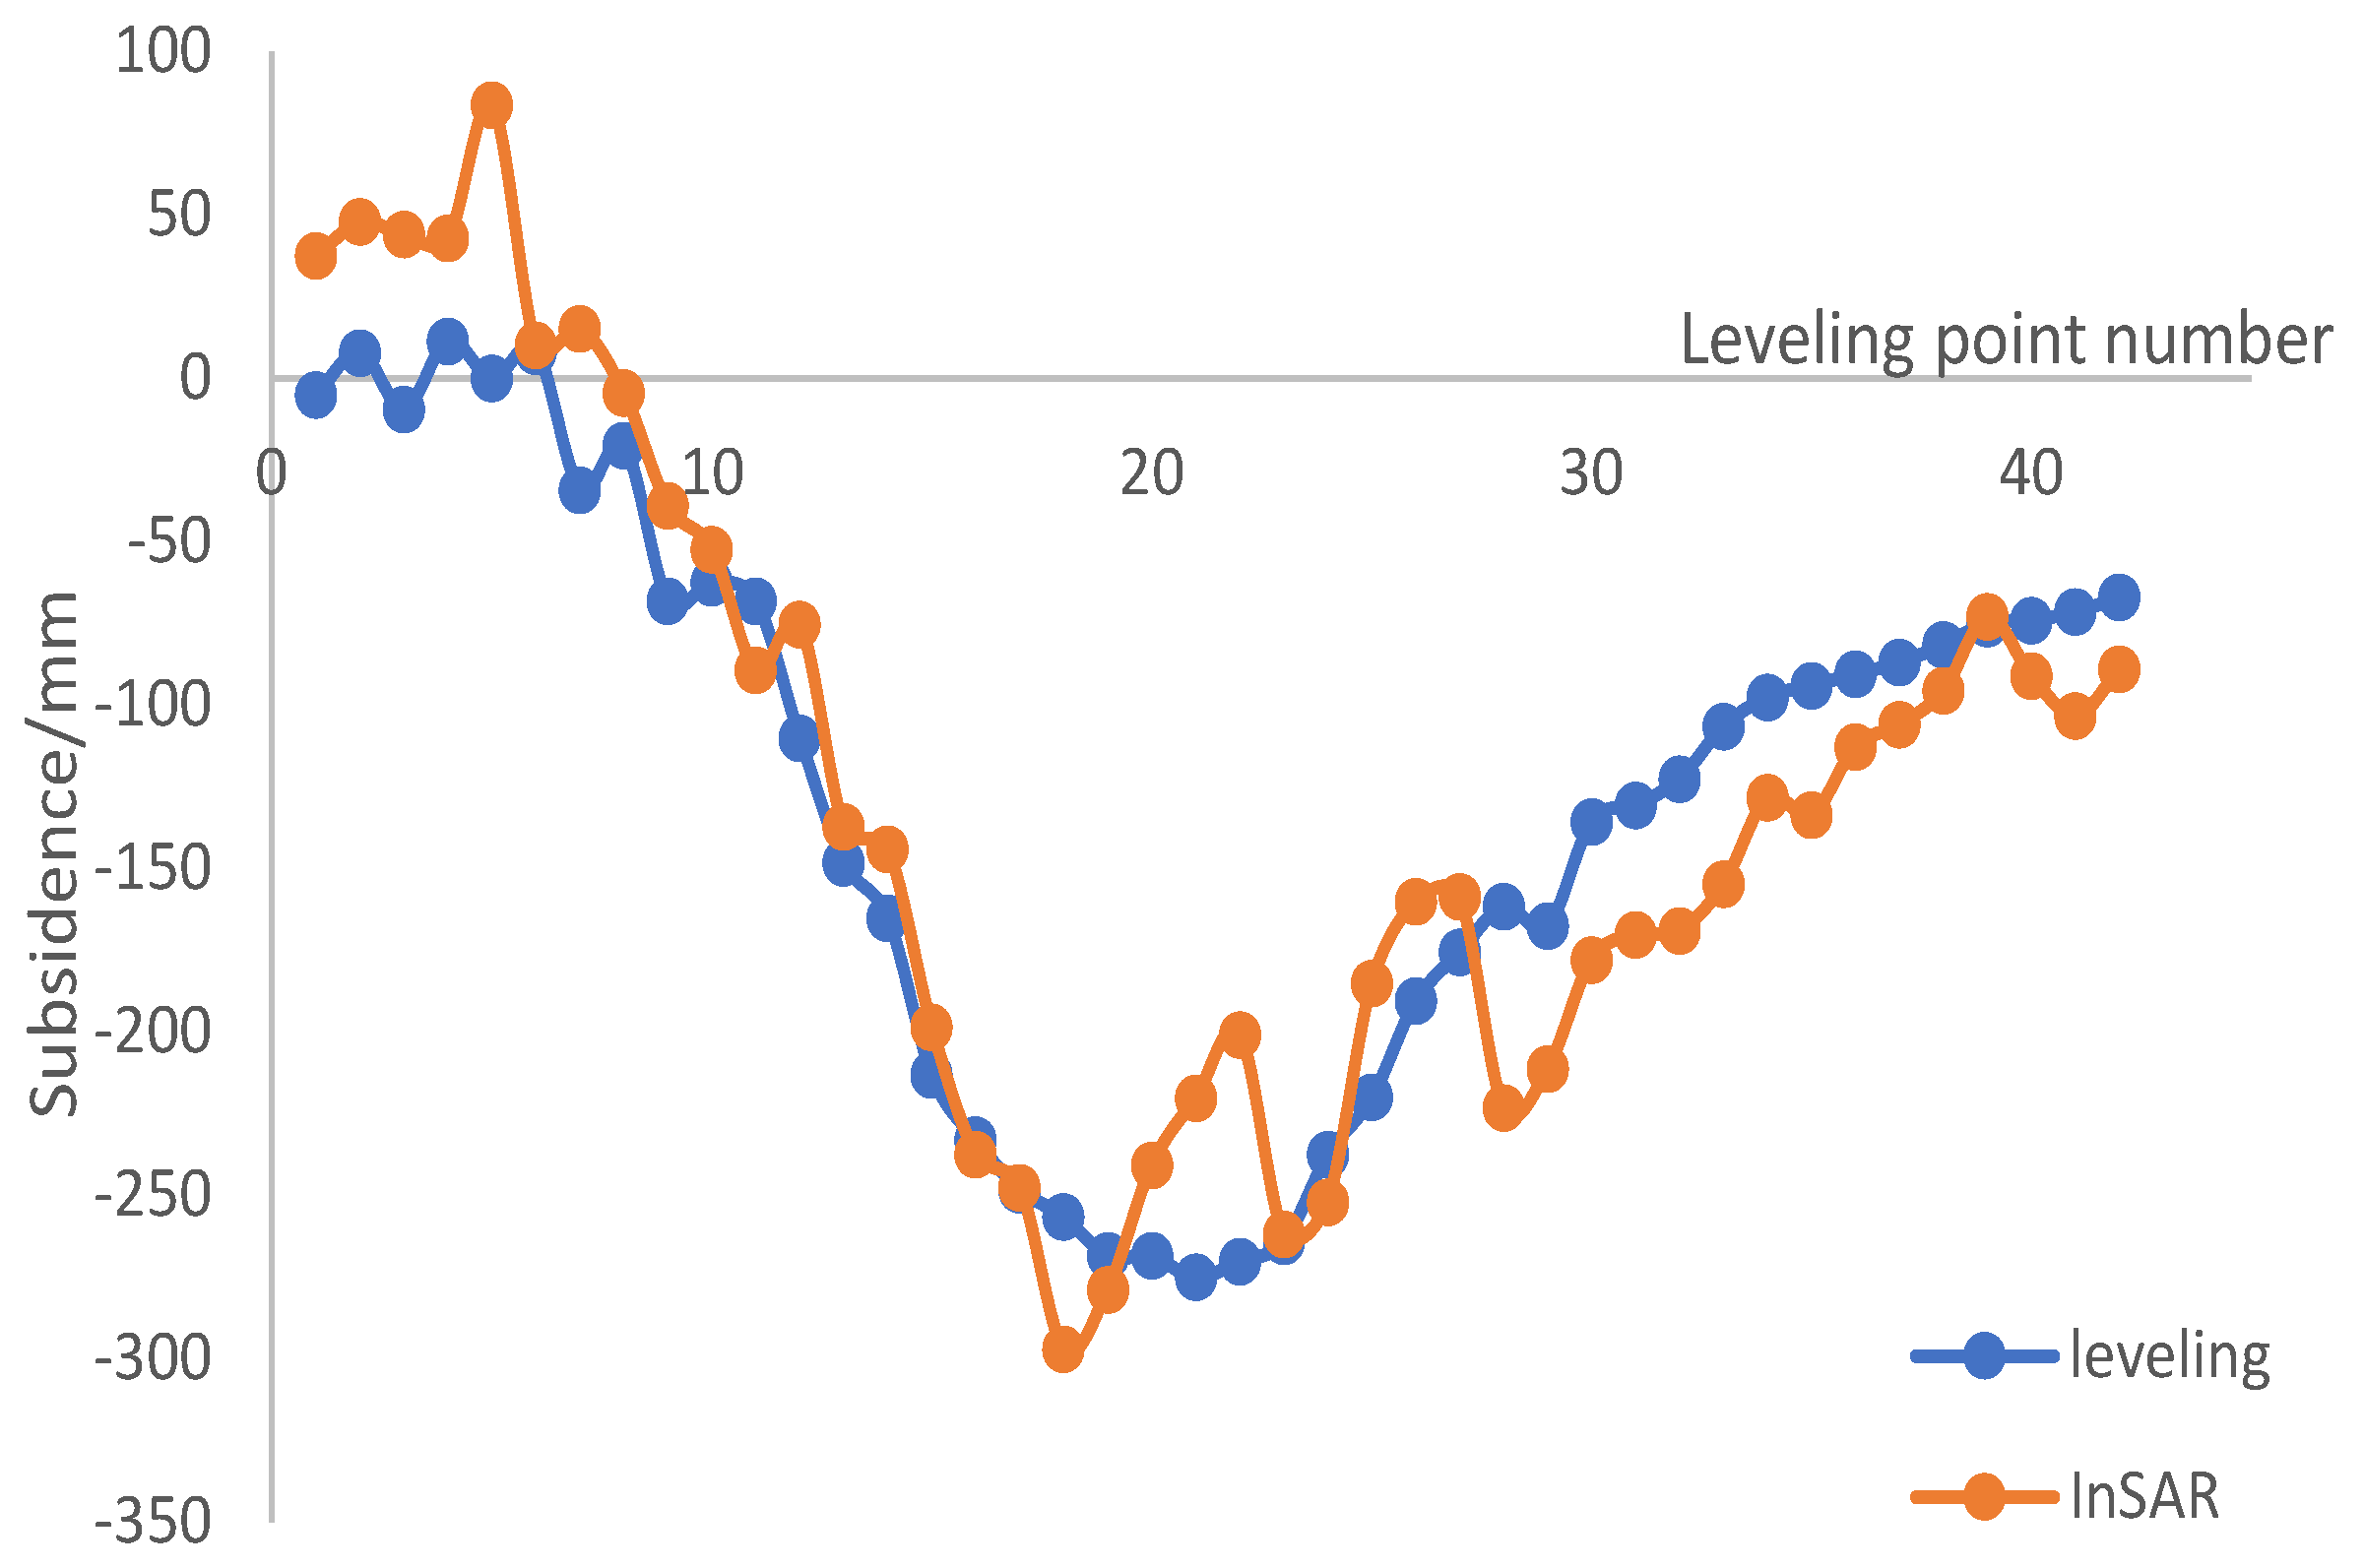
Subsidence data from 42 leveling stations were used to verify the accuracy of the InSAR results. The error of the leveling data was less than 1 mm, and therefore can be regarded as real subsidence. In order to avoid accidental errors, the InSAR results were obtained by inverse distance weighting from the five points closest to the leveling station. The root mean square error (RMSE) was 35.28 mm. The comparison is shown in Figure 13. The InSAR results fluctuated at the edge and center of the sinking basin, but the overall trend remained the same. It can be seen from Figure 11 that most of the fluctuations in the InSAR monitoring results could be removed by polynomial fitting. Therefore, the method in this paper is more dependent on the accuracy of the monitoring of the deformation trend, rather than absolute accuracy.
5.2. The Relationship between Mining Depth in the Dip Direction and the Main Influence Radius
The calculation for the main influence radius of the uphill and downhill directions in the dip direction of the PIM is:
Equation (9) shows that the main influence radius is proportional to the mining depth, while, in Equation (6), the mining depth is proportional to the square of the main influence radius. The difference between the two is that the main influence radius includes the additional horizontal movement and the normal movement caused by the inclination of the coal seam, while the main influence angle is considered as a constant in Equation (9). and obtained by Equation (9) refer to the theoretical influence radius, and their physical meaning does not represent the basin characteristics, but rather a prediction parameter in the PIM.
5.3. Influence of Insufficient Mining
The parameters of the probability integral method are closely related to the degree of mining. The subsidence coefficient, horizontal movement coefficient, and inflection point offset change with a change in accordance with the degree of mining. The inflection point offset decreases as the degree of mining increases. This means that the more insufficient the mining, the larger the inflection point offset, and the smaller the calculated mining length or width compared to the actual mining size. This is also the reason of the underestimation of dip width. The main influence radius increases as the degree of mining increases, following which the calculated mining depth increases as the main influence radius increases. Therefore, the degree of insufficient mining results in a smaller calculated mining depth. The mining depth in the downhill direction is greater than that in the uphill direction, so the mining degree in the downhill direction is less than that in the uphill direction, which means that the calculated mining depth is more affected by insufficient mining. It can be seen from Table 3 that the error in the calculation of depth in the downhill direction is greater than that in the uphill direction, which proves this point.
6. Conclusions
In this paper, a method for locating illegal mining was proposed based on InSAR technology and the PIM. The method calculates the position and inclination of the goaf through the characteristic points of the subsidence basin. Since remote sensing data are used instead of ground measurement data, this method has the advantages of saving time and labor and a high degree of automation. Compared to [8], the proposed method does not rely on complex nonlinear models or algorithms, and has high computational efficiency while ensuring high reliability. Compared to [9], the algorithm does not ignore the contribution of the coal seam inclination to the shape of the subsidence basin, so the inclination angle can be obtained. Moreover, the tunneling direction of the working face can be obtained from multiple maximum sinking points, which can effectively reduce the errors caused by accidental factors. By adopting the basin boundary with the greatest degree of mining, the error caused by insufficient mining can be avoided.
The proposed method was verified by data from the 132610 working face in the Fengfeng mining area and 11 scenes of Radarsat-2. The experiment proved the accuracy and reliability of this method. The relative error of the method in this paper was 6.35%, which is a decrease of 27.56% and 98.27% compared to [8,9], respectively.
In addition, this article discussed the factors affecting the results and the meaning of the different formulas in the PIM. The analysis showed that, compared to absolute accuracy, the accuracy of the deformation trend has a greater impact on the monitoring accuracy of this method. Although the method in this paper adopts many measures to avoid the influence of insufficient mining on the results, it can only reduce the influence rather than avoiding it. The most affected parameters are the length of the dip and the depth in the uphill and downhill directions.
Although it still is affected by InSAR monitoring accuracy and mining insufficiency, the project example shows that this method has the advantages of a simple principle, high calculation efficiency, and time and labor saving. Therefore, it has certain engineering application value for locating illegal mining.
Author Contributions
Y.X. and Y.W. developed the methodologies and designed the experiments; Y.X. and Y.W. performed the experiments; Y.X. and Y.W. analyzed the data and validated the results; Y.X. and Y.W. wrote the paper; Y.X. and Y.W. improved the paper. All authors have read and agreed to the published version of the manuscript.
Funding
This research was funded by the Natural Science Foundation of China (Grant No. 41962018,41874044).
Acknowledgments
The authors would like to thank their colleagues of the School of Environment Science and Spatial Informatics of the China University of Mining and Technology for collecting experimental data.
Conflicts of Interest
The authors declare no conflict of interest.
References
- Available online: https://www.worldcoal.org/coal/coal-mining (accessed on 25 November 2020).
- Miao, X.X.; Qian, M.G. Research on green mining of coal resources in China: Current status and future prospects. J. Min. Saf. Eng. 2009, 26, 1–14. [Google Scholar]
- Han, R.L.; Nan, S.Q.; Li, F.P.; Guo, X.Z.; Su, M.; Wan, X.J. Application of Micro-seismic Monitoring on Fighting Against Illegal Mining. J. Hebei Polytech. Univ. (Nat. Sci. Ed.) 2011, 4. [Google Scholar]
- Engelbrecht, J.; Inggs, M. Differential interferometry techniques on L-band data employed for the monitoring of surface subsidence due to mining. S. Afr. J. Geomat. 2013, 2, 82–93. [Google Scholar]
- Herrera, G.; Tomás, R.; López-Sánchez, J.M.; Delgado, J.; Mallorqui, J.J.; Duque, S.; Mulas, J. Advanced DInSAR analysis on mining areas: La Union case study (Murcia, SE Spain). Eng. Geol. 2007, 90, 148–159. [Google Scholar] [CrossRef] [Green Version]
- Ishwar, S.G.; Kumar, D. Application of DInSAR in mine surface subsidence monitoring and prediction. Curr. Sci. 2017, 112, 46–51. [Google Scholar] [CrossRef]
- Przyłucka, M.; Herrera, G.; Graniczny, M.; Colombo, D.; Béjar-Pizarro, M. Combination of conventional and advanced DInSAR to monitor very fast mining subsidence with TerraSAR-X data: Bytom City (Poland). Remote Sens. 2015, 7, 5300–5328. [Google Scholar] [CrossRef] [Green Version]
- Yang, Z.; Li, Z.; Zhu, J.; Yi, H.; Feng, G.; Hu, J.; Wu, L.; Preusse, A.; Wang, Y.; Papst, M. Locating and defining underground goaf caused by coal mining from space-borne SAR interferometry. ISPRS J. Photogramm. Remote. Sens. 2018, 135, 112–126. [Google Scholar] [CrossRef]
- Du, S.; Wang, Y.; Zheng, M.; Zhou, D.; Xia, Y. Goaf Locating Based on InSAR and Probability Integration Method. Remote Sens. 2019, 11, 812. [Google Scholar] [CrossRef] [Green Version]
- Litwiniszyn, J. The theories and model research of movements of ground masses. Proceedings of the European congress on ground movement. Univ. Leeds 1957, 202, 209. [Google Scholar]
- Deng, K.Z.; Tan, Z.X.; Jiang, Y. Subject of Deformation Monitoring and Subsidence Engineering; China University of Mining and Technology Press: Xuzhou, China, 2015. [Google Scholar]
- Fan, H.; Lu, L.; Yao, Y. Method combining probability integration model and a small baseline subset for time series monitoring of mining subsidence. Remote Sens. 2018, 10, 1444. [Google Scholar] [CrossRef] [Green Version]
- Ministry of Coal Industry. Regulations for Coal Pillar Retention and Coal Mining in Buildings, Water Bodies, Railways and Main Shafts; Coal Industry Press: Beijing, China, 1986.
- Abbo, A.J.; Sloan, S.W. A smooth hyperbolic approximation to the Mohr-Coulomb yield criterion. Comput. Struct. 1995, 54, 427–441. [Google Scholar] [CrossRef]
- Chen, Q. Analysis of Water Quality Test Results of Ordovician Limestone Water in Fengfeng Mining Area. Occup. Health 2009, 25, 1974. [Google Scholar]
- Nie, C. Research on Comprehensive Planning and Utilization of Water Resources in Fengfeng Mining Area of Handan City; Hebei University of Engineering: Handan, China, 2010. [Google Scholar]
- Du, L.; Zhu, W.; Tian, X. Climatic characteristics analysis of different grades of precipitation days in Handan area. J. Meteorol. Environ. 2017, 33, 102–107. [Google Scholar]
- Liu, Y.; Hu, B.; Zhang, F. Carboniferous-Permian sandstone microstructure in Tonger Minefield, Fengfeng Mining Area, Hebei Province Analysis of structural characteristics. Mod. Geol. 2003, 17, 75–79. [Google Scholar]
- Cao, D.; Zhan, W.; Zhang, J. New structural features of Handan-Fengfeng mining area and its significance for coal resource development. J. China Coal Soc. 2007, 32, 141–145. [Google Scholar]
- Hebei University of Engineering. Jiulong Mine Geology Report; Jizhong Energy Fengfeng Group: Handan, China.
- Lai, S.; Dong, Y. Fengfeng Group’s methods and approaches to increase the recovery rate of coal resources. Coal Mine Saf. 2014, 45, 191–193. [Google Scholar]
- Mora, O.; Mallorqui, J.J.; Broquetas, A. Linear and nonlinear terrain deformation maps from a reduced set of interferometric SAR images. IEEE Trans. Geosci. Remote Sens. 2003, 41, 2243–2253. [Google Scholar] [CrossRef]
- Blanco-Sanchez, P.; Mallorquí, J.J.; Duque, S.; Monells, D. The coherent pixels technique (CPT): An advanced DInSAR technique for nonlinear deformation monitoring. Pure Appl. Geophys. 2008, 165, 1167–1193. [Google Scholar] [CrossRef]
Figure 1.
Theoretical model of discontinuous medium. (a) random media theory model; (b) probability distribution of particle movement; (c) probabilistic subsidence simulation; (d) sandbox model.
Figure 1.
Theoretical model of discontinuous medium. (a) random media theory model; (b) probability distribution of particle movement; (c) probabilistic subsidence simulation; (d) sandbox model.

Figure 2.
Subsidence and curvature curves of a horizontal goaf on the main section. A and B are the boundary points of the sinking basin. E is the inflection point of the subsidence curve. is the zero point of the curvature curve. H is the mining depth. is the maximum sinking point of the subsidence basin. is the boundary angle on the main section. is the inflection point offset. D is the projection distance between the boundary point of the sinking basin and the boundary of said goaf on the horizontal plane.

Figure 3.
The subsidence curve caused by inclined coal mining. is the main influence radius in the downhill direction. is the main influence radius in the uphill direction. is the propagation angle of the mining influence. is the inclination angle of the coal seam.
Figure 3.
The subsidence curve caused by inclined coal mining. is the main influence radius in the downhill direction. is the main influence radius in the uphill direction. is the propagation angle of the mining influence. is the inclination angle of the coal seam.

Figure 4.
Scheme of the inversion of an inclined mined-out area position based on time series surface subsidence and the probability integration method (PIM). InSAR, synthetic aperture radar interferometry.
Figure 4.
Scheme of the inversion of an inclined mined-out area position based on time series surface subsidence and the probability integration method (PIM). InSAR, synthetic aperture radar interferometry.

Figure 5.
Subsidence basin caused by the simulated goaf and comparison with the calculated goaf position.
Figure 5.
Subsidence basin caused by the simulated goaf and comparison with the calculated goaf position.

Figure 6.
The tilt (a) and curvature (b) of the simulated basin in the strike direction. The green line at the bottom of (a) and the yellow line at the bottom of (b) are the positions where the tilt and curvature are 0, respectively.
Figure 6.
The tilt (a) and curvature (b) of the simulated basin in the strike direction. The green line at the bottom of (a) and the yellow line at the bottom of (b) are the positions where the tilt and curvature are 0, respectively.

Figure 7.
Study area. The white quadrilateral in the right picture is the 132,610 working surface, and the purple dots refer to the leveling observations.
Figure 7.
Study area. The white quadrilateral in the right picture is the 132,610 working surface, and the purple dots refer to the leveling observations.

Figure 8.
Interferograms.

Figure 9.
Interference pair and time–space baseline. The blue diamonds represent Singe Look Complex ( SLC ) images, the blue lines represent the interference pairs, the solid line represents the interferogram used to calculate the deformation, and the dotted line represents the interference pair that was discarded due to incoherence.

Figure 10.
Time series of ground subsidence in the look of sight (LOS) direction. Each small chart represents the cumulative land subsidence from 15 June 2015 to the date above the chart (YYYYMMDD). A positive value means uplift, and a negative value means sinking.
Figure 10.
Time series of ground subsidence in the look of sight (LOS) direction. Each small chart represents the cumulative land subsidence from 15 June 2015 to the date above the chart (YYYYMMDD). A positive value means uplift, and a negative value means sinking.

Figure 11.
Time series sinking and fitting curve in the strike and dip main sections. The observation stations are arranged from north to south in the strike main section, and from east to west in the dip main section.
Figure 11.
Time series sinking and fitting curve in the strike and dip main sections. The observation stations are arranged from north to south in the strike main section, and from east to west in the dip main section.

Figure 12.
A comparison of the calculated and actual goaf positions. The white rectangle is the calculated position, while the black rectangle is the actual position. H1, H2, L1, and L2 refer to the mining depth in the uphill and downhill directions and the length and width of the actual goaf, respectively. h1, h2, l1, and l2 refer to the mining depth in the uphill and downhill directions and the length and width of the calculated goaf, respectively.

Figure 13.
Verification of the InSAR results.


Table 1.
Top ten coal producers (2018).
| Country | Coal Extraction (Mt) | Country | Coal Extraction (Mt) |
|---|---|---|---|
| PR China | 3550 | Russia | 420 |
| India | 771 | South Africa | 259 |
| USA | 685 | Germany | 169 |
| Indonesia | 549 | Poland | 122 |
| Australia | 483 | Kazakhstan | 114 |
Table 2.
Inversion results and errors of goaf position.
| Strike Direction | Length | Width | Average Depth | Depth in Uphill Direction | Depth in Downhill Direction | Inclination Angle | |
|---|---|---|---|---|---|---|---|
| Calculated value | 305 m | 311 m | 228 m | 209 m | 247 m | ||
| Real value | 300 m | 350 m | 225 m | 200 m | 250 m | ||
| Relative error | 1.11% | 1.67% | 11.14% | 1.33% | 4.50% | 1.20% | 1.23% |
Table 3.
Results and errors of the goaf position.
| Strike Direction | Length | Width | Average Depth | Depth in Uphill Direction | Depth in Downhill Direction | Inclination Angle | |
|---|---|---|---|---|---|---|---|
| Calculated value | 342 m | 138 m | 759 m | 761 m | 802 m | ||
| Real value | 319 m | 3165 m | 774 m | 733 m | 845 m | ||
| Relative error | 3.55% | 7.21% | 16.36% | 1.94% | 3.82% | 5.09% | 6.45% |
Publisher’s Note: MDPI stays neutral with regard to jurisdictional claims in published maps and institutional affiliations. |
© 2020 by the authors. Licensee MDPI, Basel, Switzerland. This article is an open access article distributed under the terms and conditions of the Creative Commons Attribution (CC BY) license (http://creativecommons.org/licenses/by/4.0/).
Share and Cite
MDPI and ACS Style
Xia, Y.; Wang, Y. InSAR- and PIM-Based Inclined Goaf Determination for Illegal Mining Detection. Remote Sens. 2020, 12, 3884. https://doi.org/10.3390/rs12233884
AMA Style
Xia Y, Wang Y. InSAR- and PIM-Based Inclined Goaf Determination for Illegal Mining Detection. Remote Sensing. 2020; 12(23):3884. https://doi.org/10.3390/rs12233884
Chicago/Turabian StyleXia, Yuanping, and Yunjia Wang. 2020. "InSAR- and PIM-Based Inclined Goaf Determination for Illegal Mining Detection" Remote Sensing 12, no. 23: 3884. https://doi.org/10.3390/rs12233884
Note that from the first issue of 2016, this journal uses article numbers instead of page numbers. See further details here.