Georeferencing of Multi-Channel GPR—Accuracy and Efficiency of Mapping of Underground Utility Networks

Faculty of Mining Surveying and Environmental Engineering, AGH University of Science and Technology, al. Mickiewicza 30, 30-059 Kraków, Poland
*
Author to whom correspondence should be addressed.
Remote Sens. 2020, 12(18), 2945; https://doi.org/10.3390/rs12182945
Submission received: 30 July 2020
/
Revised: 8 September 2020
/
Accepted: 8 September 2020
/
Published: 11 September 2020
Abstract
:Due to the capabilities of non-destructive testing of inaccessible objects, GPR (Ground Penetrating Radar) is used in geology, archeology, forensics and increasingly also in engineering tasks. The wide range of applications of the GPR method has been provided by the use of advanced technological solutions by equipment manufacturers, including multi-channel units. The acquisition of data along several profiles simultaneously allows time to be saved and quasi-continuous information to be collected about the subsurface situation. One of the most important aspects of data acquisition systems, including GPR, is the appropriate methodology and accuracy of the geoposition. This publication aims to discuss the results of GPR measurements carried out using the multi-channel Leica Stream C GPR (IDS GeoRadar Srl, Pisa, Italy). The significant results of the test measurement were presented the idea of which was to determine the achievable accuracy depending on the georeferencing method using a GNSS (Global Navigation Satellite System) receiver, also supported by time synchronization PPS (Pulse Per Second) and a total station. Methodology optimization was also an important aspect of the discussed issue, i.e., the effect of dynamic changes in motion trajectory on the positioning accuracy of echograms and their vectorization products was also examined. The standard algorithms developed for the dedicated software were used for post-processing of the coordinates and filtration of echograms, while the vectorization was done manually. The obtained results provided the basis for the confrontation of the material collected in urban conditions with the available cartographic data in terms of the possibility of verifying the actual location of underground utilities. The urban character of the area limited the possibility of the movement of Leica Stream C due to the large size of the instrument, however, it created the opportunity for additional analyses, including the accuracy of different location variants around high-rise buildings or the agreement of the amplitude distribution at the intersection of perpendicular profiles.
1. Introduction
High level and easy access to advanced technological solutions enable the quick reaction of a provider to current problems and consumer market demand. This issue is also well known to the producers of Ground Penetrating Radar (GPR) equipment, who have extended its range of possible applications in recent years. The GPR method is no longer used only locally as a source of spatial information on potential changes in the studied environment. Thanks to the introduction of successive improvements and through direct cooperation with positioning tools, GPR has become an instrument capable of quick delivery of data on the distribution and character of changes as well as their spatial location in national and global coordinate systems. The latter issue is especially interesting in terms of geodesy in noninvasive testing of the continuity of reinforced concrete structures and their basis [1,2], diagnosis of roadway layers [3,4] and runways [5], detection of concrete reinforcement [6], as well as underground utility networks [7].
A standard setup for GPR profiling consists of a single-channel GPR unit and two antennas transmitting and receiving and located with constant offset. An electromagnetic wave, emitted into the studied medium, reflects on the boundary of two surfaces with different electrical properties and then reaches the receiving antenna [8]. However, the signal generated by the transmitting antenna, despite the antenna’s directivity, travels in different directions, which causes, e.g., huge energy losses. Nevertheless, a hyperbolic shape on an echogram is achieved as a result of moving the GPR over the buried object, e.g., a pipe. (Figure 1).
The shape of a hyperbola depends on the cross-section of the object along which the profiling is conducted, while the wave polarization depends on the characteristics of the materials’ border reflecting the wave [9].
Electromagnetic wave interferences, both determined and random noise, cause difficulties in the interpretation of the measured material. There are a lot of publications on the analysis of echograms without human action. Most of them use machine learning technologies for image classification, which is the base for the automatic vectorization of hyperbole [10,11] or extraction of the studied object’s characteristics, e.g., diameter when it comes to pipes. Automatic approximation of utility run is also possible, based on hyperbola vertices identified on consecutive measurement profiles [12]. Most publications, however, cover working with GPR on a local scale, while the potential of the GPR method used for an inventory of pipe and cable networks is much broader and should be naturally directed to obtaining data on a global scale. In the Polish national databases system, it could successfully be treated as a part of information about underground utility gathered in the GESUT (Geodezyjna Ewidencja Sieci Uzbrojenia Terenu—Geodetic Records of Public Utilities) database. Some countries, understanding the possibilities of the method as a noninvasive way of verifying underground utility networks, implemented regulations on the methodology and range of its use, as well as the suspected accuracy depending on the measurement variant. Independent groups of researchers conducted studies aiming to answer the question of how legitimate and possible it is to achieve the assumptions and requirements of the aforementioned regulations against the actual results of GPR works [7,13]. These issues were also included in a summary of the studies on the accuracy results for the set GPR and positioning instrument [14]. Most of the research was conducted with the use of the currently most popular GPR based on a single-channel unit, which means that it consists of a radar managing the works with one set of transmitting and receiving antennas.
For a few years, the producers of the equipment have also offered multi-channel GPR systems, called massive arrays, which acquire the underground situation data simultaneously along a few parallel profiles [15]. Those instruments have undergone huge metamorphosis, i.e., elaborate electronic systems of antennas were replaced by enclosed, compact sets fitted with propulsion systems and adapters that enable installation on motorized vehicles. All the applied amenities have a positive effect on the work comfort of the users and the efficiency of the measurement in the given environmental conditions. Despite such a huge development of multiple-channels systems, their potential still is not fully utilized, also in a scientific approach. In scientific publications, multi-channel GPR is tested mainly as a tool for quickly gathering data to determine the spatial variability of the wave velocity in a soil environment [16] as well as to determine pavement layer thickness [17] or to study the variability of agricultural soil moisture [16] and even permafrost areas [18]. There are not many sources though whose authors use multi-antenna GPRs to inspect infrastructure objects [19] or underground utilities networks.
The aim of this publication is to present the results of GPR measurements using multi-channel GPR—Leica Stream C consisting of 34 transmitting and receiving antennas. Section 2 includes a description of the construction and methods of GPR operating, especially concerning the possible configurations with different positioning systems, as well as echogram post-processing in dedicated GRED HD software (IDS GeoRadar Srl, Pisa, Italy). The next part of the article includes the result of experimental measurements aiming to determine the possible to achieve accuracy of GPR data measured by positioned Leica Stream C. The positioning was performed with the use of GNSS (Global Navigation Satellite System) satellite measurements in RTK-RTN (Real Time Kinematic-Real Time Network) mode with an option of additional time synchronization of the receiver and the GPR control unit as well as a robotic total station. This constitutes the basis for the confrontation of data acquired from a Leica Stream C system with available cartographic studies paying special attention to verifying the actual location of utilities. Measurements done in an urban area enabled additional analysis of data integrity to be carried out in a horizontal and vertical profiles grid and available methods of localization to be used with limited horizon conditions.
2. Materials and Methods
2.1. Description of the Equipment and Software
In the carried out research, for noninvasive measurement of subsurface situation, a multi-channel GPR Leica Stream C was used (Figure 2a,b), which is designed for utilities detection on vast and easily accessible areas, e.g., communication routes. Its main component is the DAD control unit, characterized by a high PRF (Pulse Repetition Frequency) index of 400 KHz [8], time window up to 20,000 ns and capability to record 64 channels. It controls the work of many multi-channel sets, e.g., Stream EM or RIS MF HiMod, which differ mainly according to the number of registered lines and parameters of the utilized antennas.
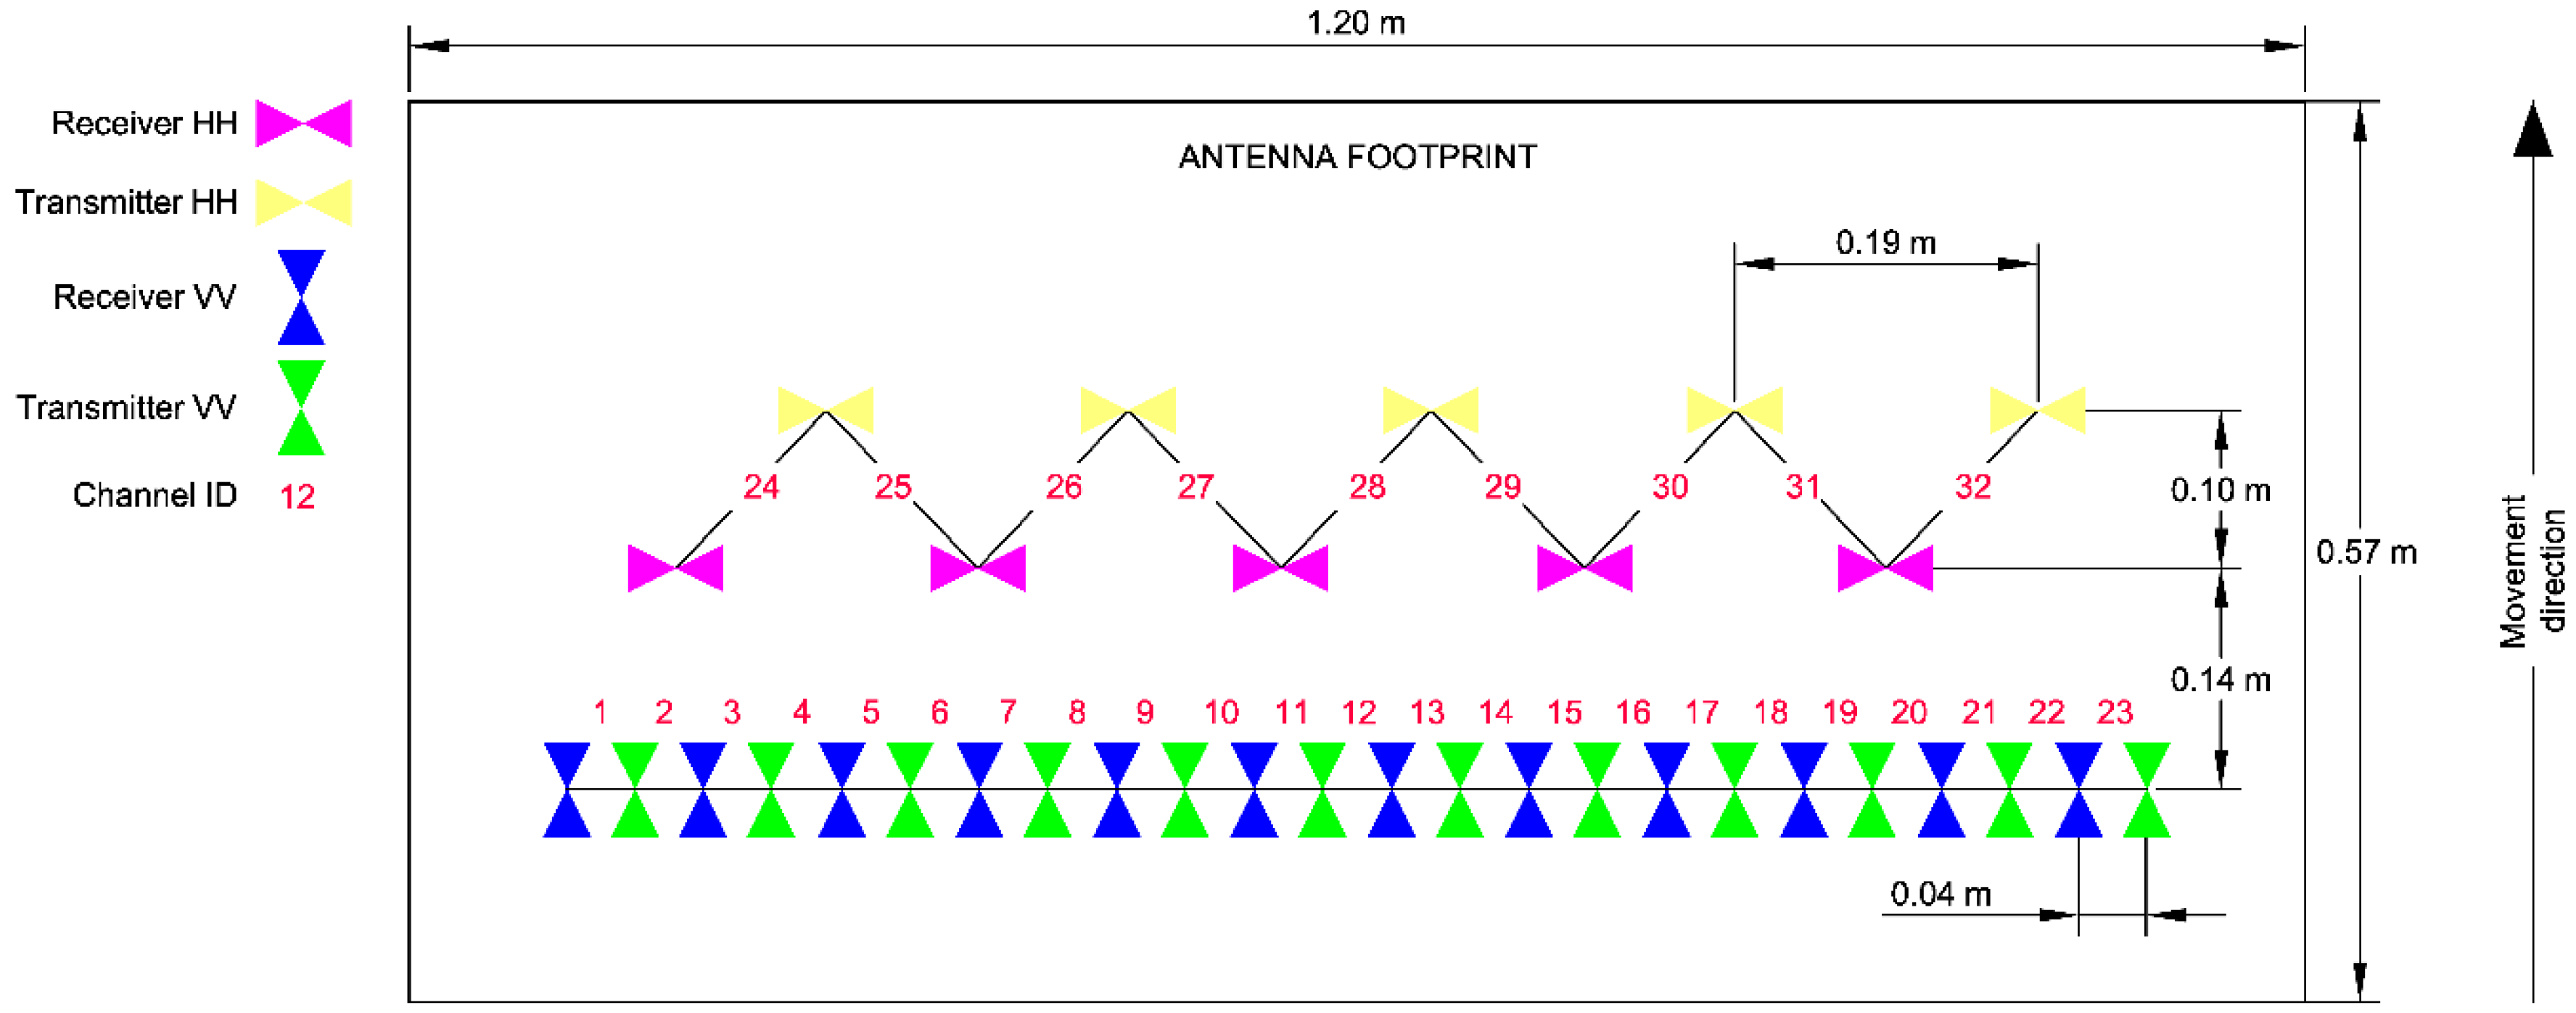
A Leica Stream C set consists of 34 transmitting and receiving antennas. All the antennas are characterized by 600 MHz frequency, which provides appropriate vertical resolution and depth range of measurements for underground utility network detection. Each antenna is responsible for communication in two data streams, which enables information to be gathered on the subsurface situation using 32 channels. To achieve a combination of antennas as shown on Figure 3, the TDM (Time Division Multiplexing) method of coding signals was used.
TDM is a one-direction process of communication, which enables transmission of two or more data streams through a single channel. It can be used when the speed of the medium’s transmission is higher than the source’s. The output streams of the transmitter are divided into parts of the same length in the time slot. The elementary parts of the particular signals are grouped in time frames and successively sent through a transmission track. The time slots of particular signals are so short that it seems as if there is a parallel transmission. The identification of signal sources in the receiver is done with the use of a demultiplexer [20]. Implementation of this technology enables the effective usage of GPR antennas, significantly increasing the number of used channels in relation to the number of installed receivers and transmitters.
The recorded signals in the presented GPR were differentiated using applied dipoles polarization. The system construction contains 23 pairs of receiving-transmitting antennas arrangements of VV configuration and 9 pairs with arrangements of HH configuration, which is supposed to guarantee the collection strong reflections simultaneously from elements located perpendicularly as well as parallel to the direction of the carried out measurements. This solution eliminates the necessity to implement GPR profiles in perpendicular or irregular grids in order to detect elements of different flow directions [21].
The fair-sized Leica Stream C GPR equipment set has also many additional accessories. Electronic regulation of the ride elevation or electric propulsion are helpful for the user, increasing the work comfort and efficiency. The maximum speed of data acquisition can even reach 6 km/h. During the measurements, the real value of acquisition speed of GPR data was about 1 m/s, i.e., 3.5 km/h. A significant convenience is also the adapter, which enables the installation of geodetic positioning devices such as a GNSS receiver and prismatic reflector. Its position towards the other components of the set is defined by the producer in configuration files used in estimating the GPR trajectory during data processing.
In order to georeference echograms in real time, the connection between the positioning system and the software for GPR data acquisition is provided with the use of the NMEA (National Marine Electronics Association) protocol via radio or WiFi in the case of total stations, as well as Bluetooth connection in the case of GNSS receivers. The second solution is worth special attention because it is possible to increase its accuracy through the output signal 1-PPS (Pulse Per Second) of the GNSS receiver and achieve better time synchronization with the GPR control unit. The impulse generated by the 1-PPS receiver (physical electrical signal (trigger)) with the UTC time provided simultaneously allows the delays to be corrected, resulting in discordant reception times of individual measuring devices, i.e., the geodetic GNSS receiver and DAD radar control unit.
OneVision software (IDS GeoRadar Srl, Pisa, Italy) is responsible for controlling the GPR system work and the correct integration with geodetic data. Besides the configuration of the parameters, it also allows the results to be seen in real time with the available cartographic developments, e.g., Google Earth maps, in the background.
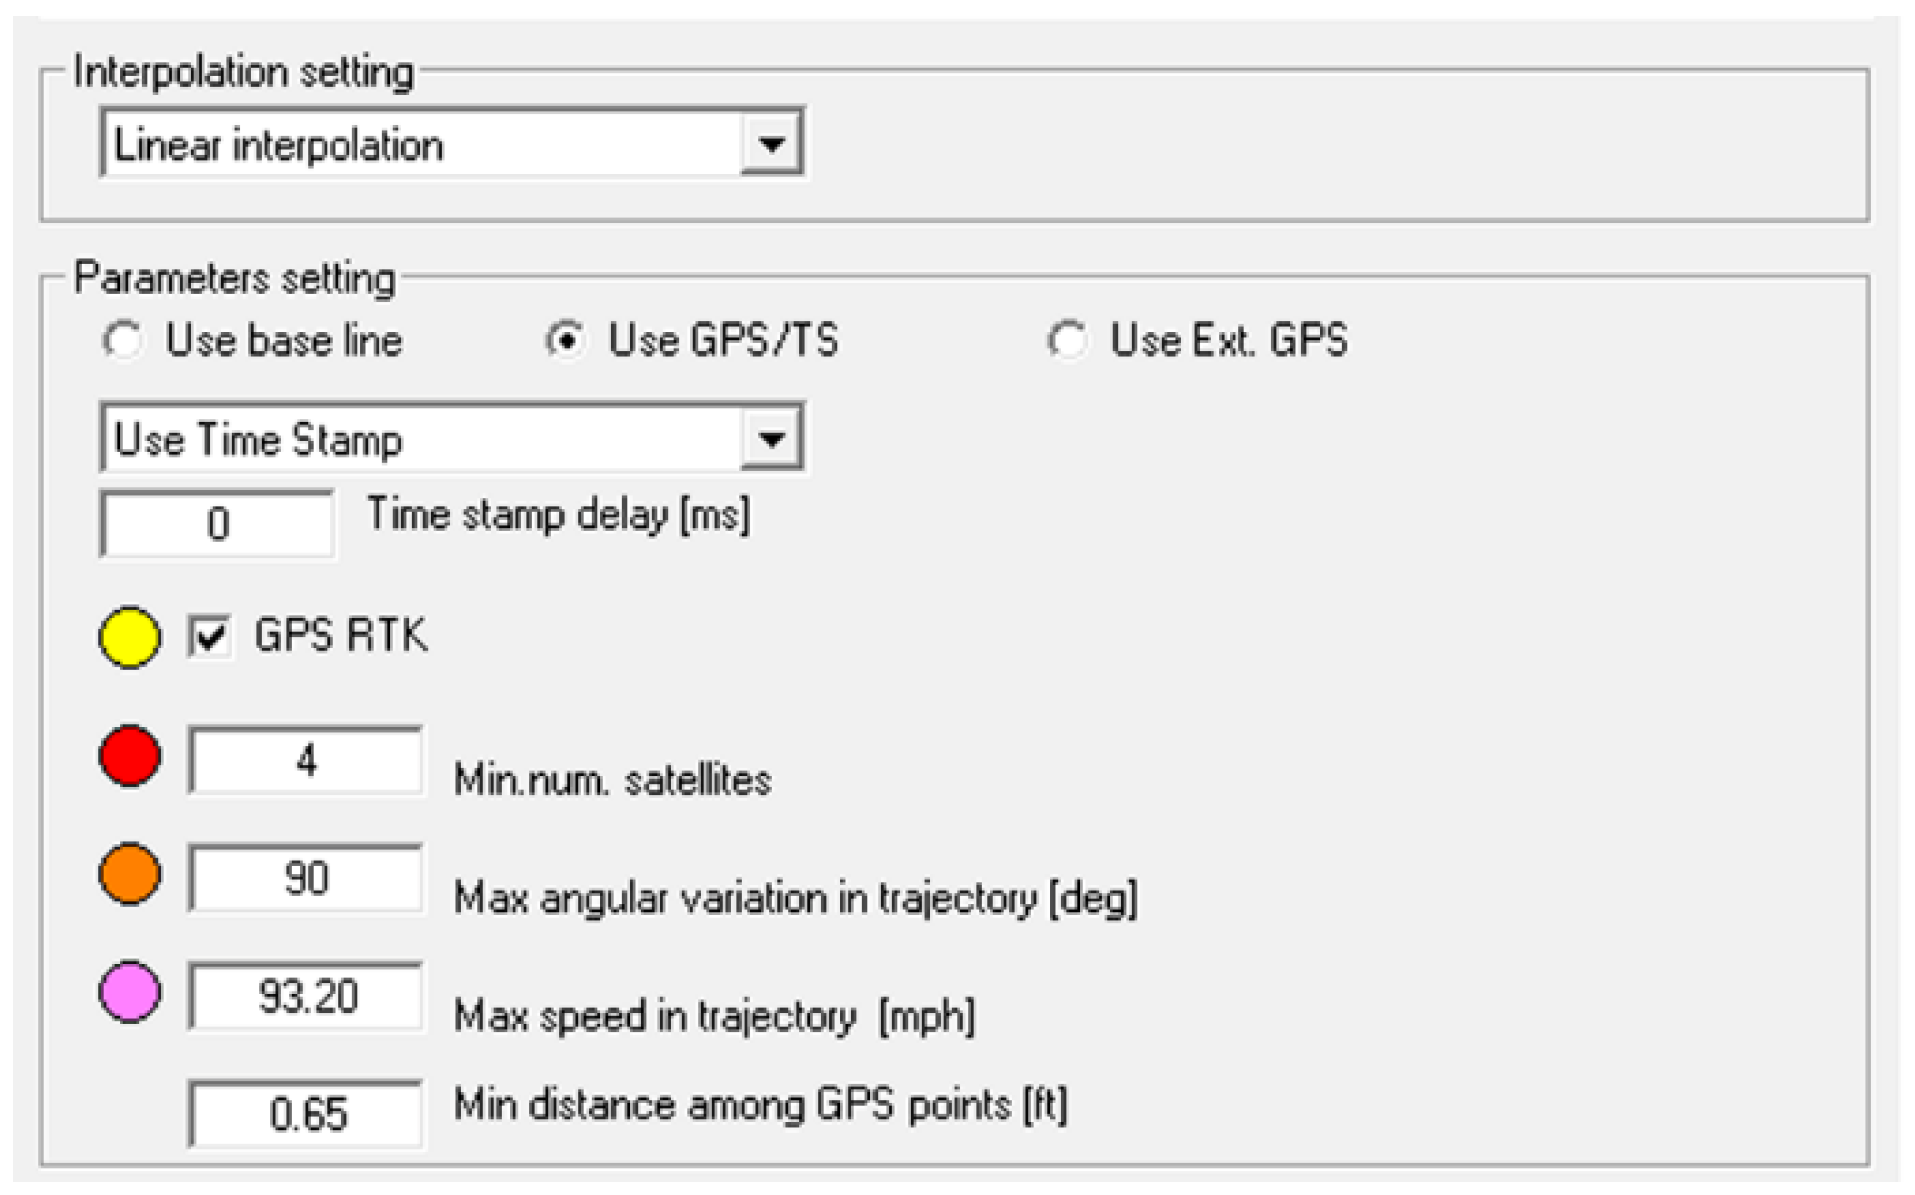
Multi-channel solutions deliver information on the subsurface situation with huge horizontal coverage. Therefore, they present a problem of post-processing enormous amounts of echograms, including sending the georeference based on a trajectory of the whole track and not coordinates assigned to points of GPR measurement release. In the case of the Leica Stream C system, the coordinates are recorded with the frequency of positioning device sampling, i.e., about 10 Hz for GPS and about 5 Hz for the Leica MS50 total station (Leica Geosystems AG, Heerbrugg, Switzerland) was [22], which means positioning every 10 cm and 20 cm respectively. The position is not assigned to each GPR trace, but only to a few selected by the unknown key. In dedicated software for processing data of Leica Stream C, i.e., GRED HD with supplementary modules, a conversion of the data and then georeferencing calculating are conducted in the first step. Based on points selected by the software, the linear interpolation is applied to calculate the position of the rest of the traces as a method recommended by the producers for straight profiles. Spline interpolation, recommended for curves, did not improve the computation of the results of the coordinates for irregular profiles. For different positioning systems, it enables filtering positions of low credibility (Figure 4), which could initiate errors in coordinate interpolation algorithms, e.g., maximum angular variability of trajectory or measurement speed for total stations, as well as maximum number of visible satellites in the case of GNSS receivers.
The positioning system is recognized automatically thanks to referential files. Similarly, it is performed in the case of GPR measurement filtration. The configuration files contain information on the applied antennas’ characteristics and measurement parameters, based on which GRED HD selects filter parameters in integrated standard processing. It includes time-zero correction, removing the background, frequency and gain filters grouped in the first filtration block, migration in the next one and finally extraction of the maximum values. There is also the possibility to define parameters independently and to conduct advanced filtration processes. The authors have repeatedly tested and analyzed the impact of the selected filter algorithms on the quality of echograms regarding the needs of engineering [23] or geological [24] issues. However, this paper is focused on the assessment of positioning and the effectiveness of multi-channel GPR, therefore, the authors decided to use processing algorithms prepared by the software producer during data analysis. Data can be analyzed in B-scan and A-scan pictures, however, the 3D module enables efficient interpretation and identification of linear or punctual subsurface objects.
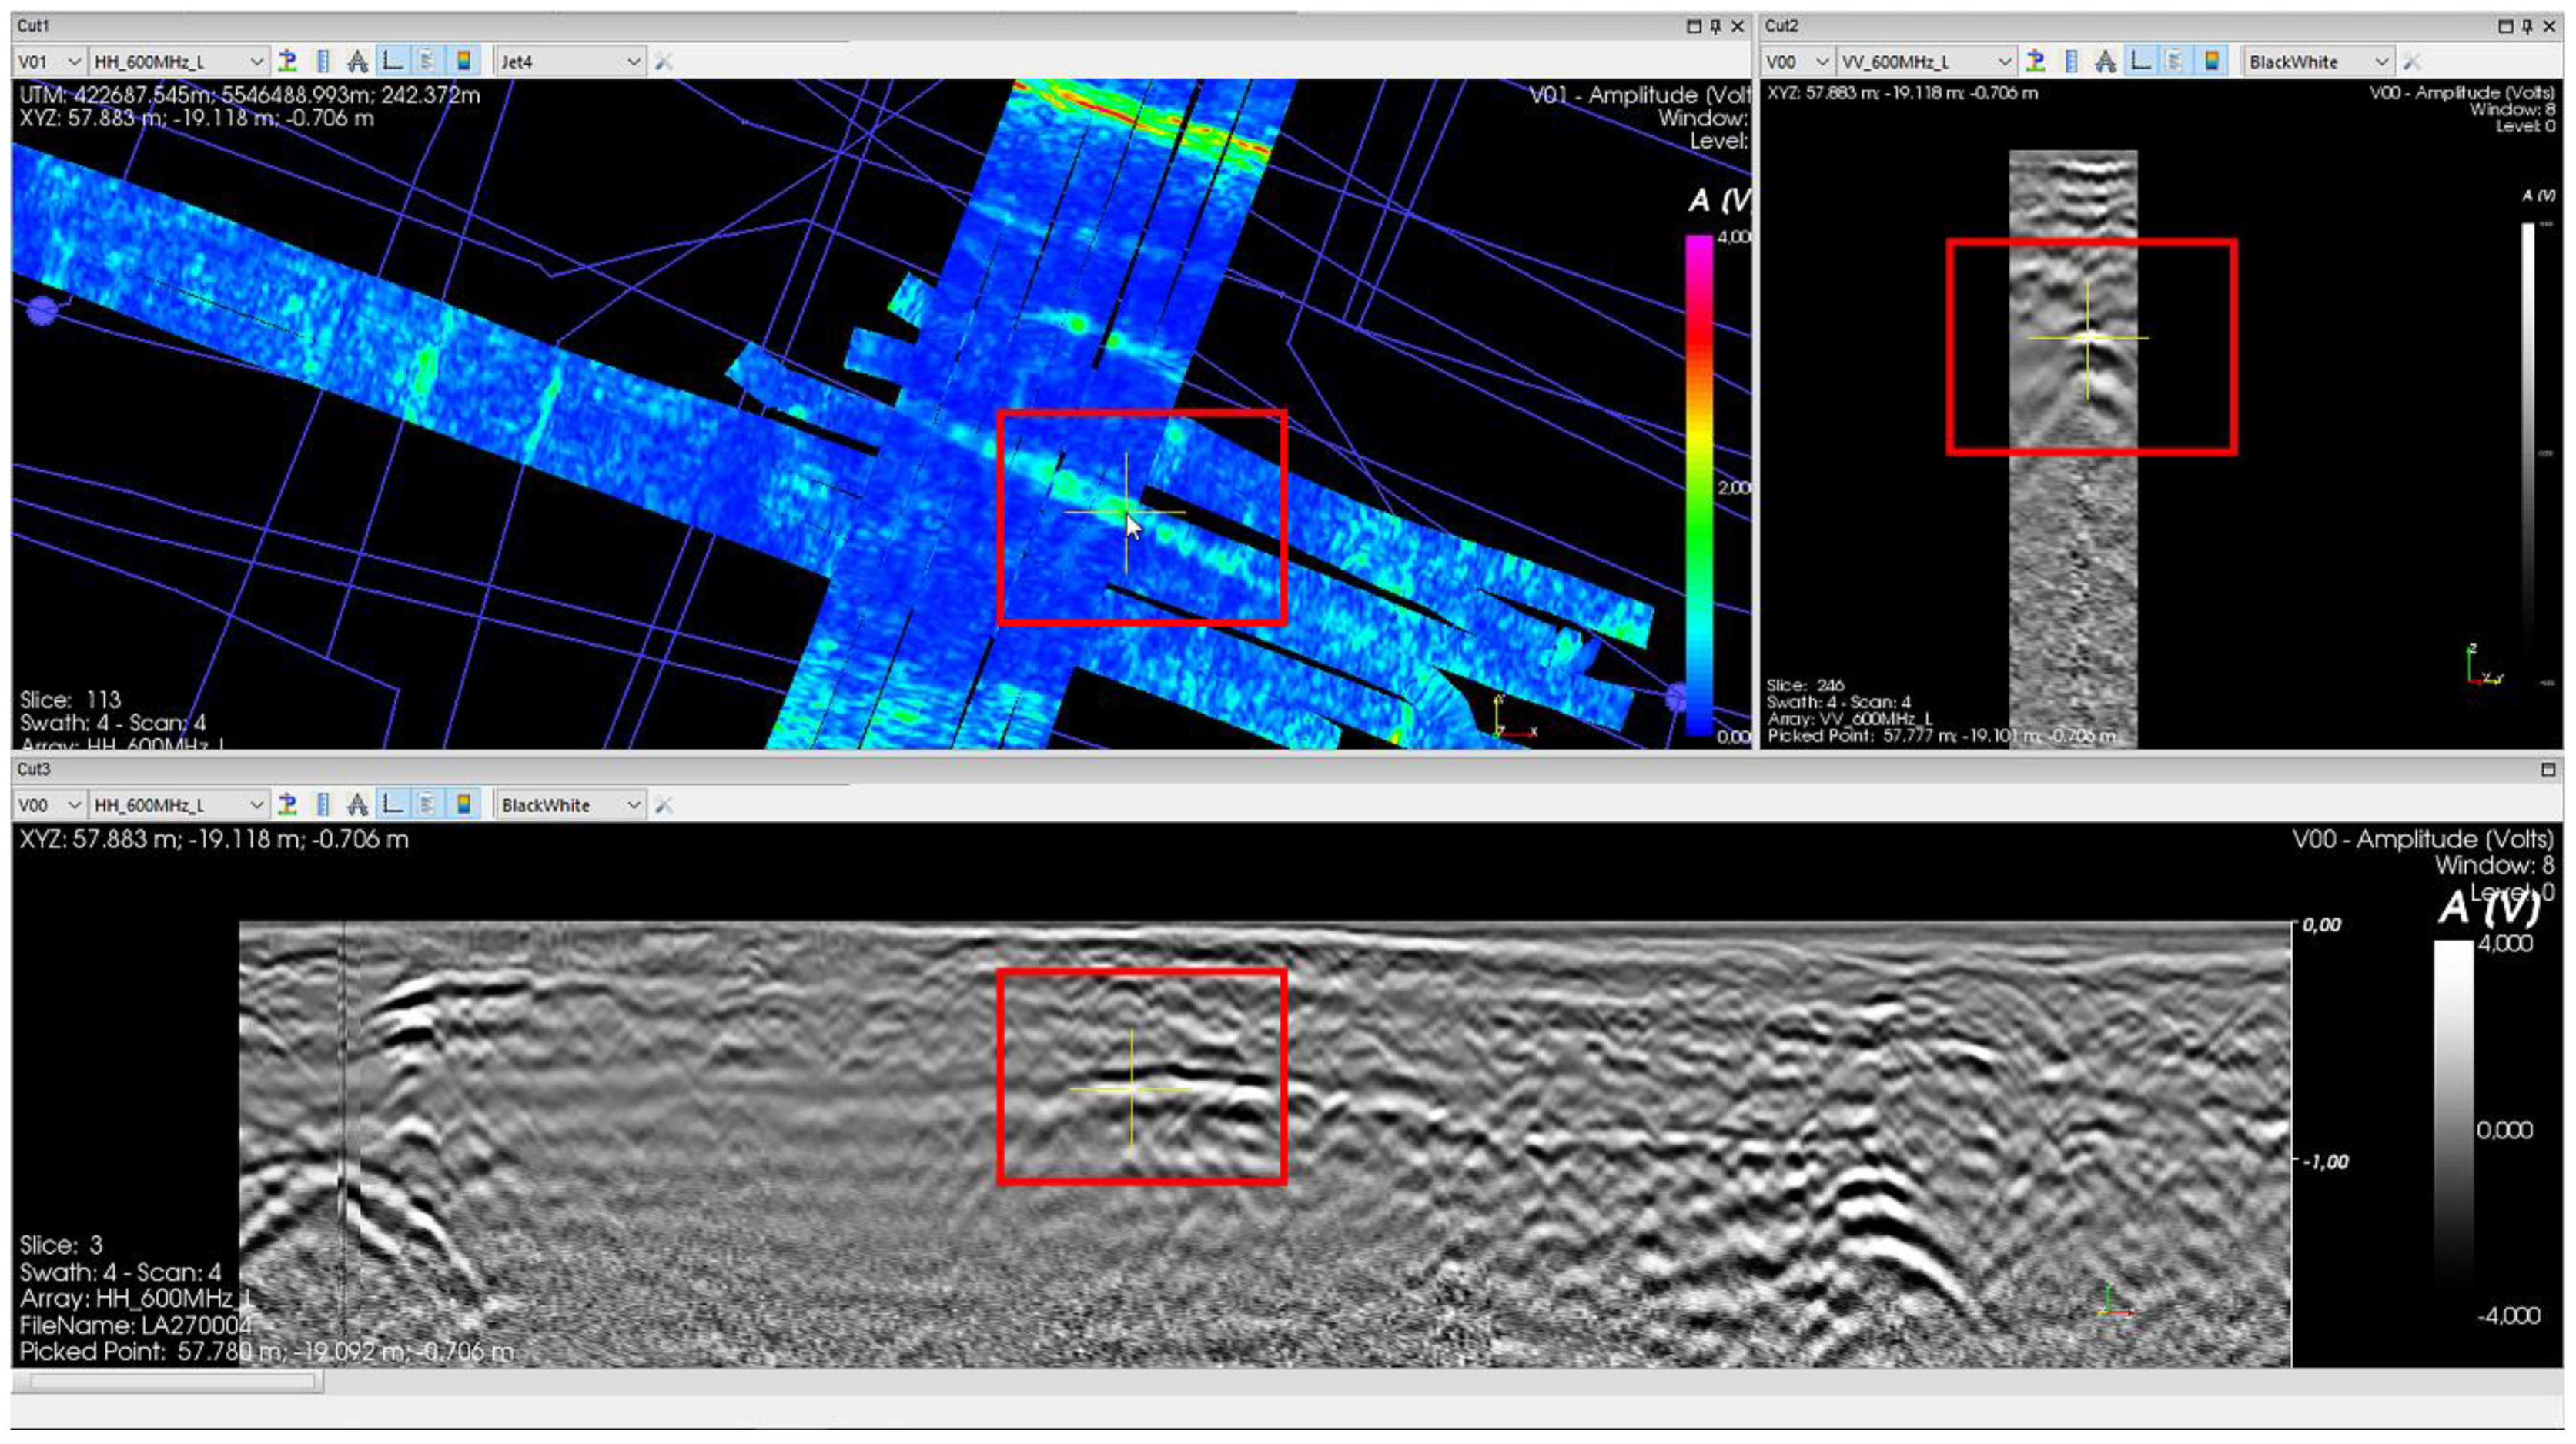
The 3D module allows the observation of GPR data in spatial view but also in three section views, diagonal, longitudinal and horizontal, fitted to the local measurement system. Thanks to the proper section choice (Figure 5), you can easily simultaneously observe the situational and depth track of, e.g., a pipe, and carry out the vectorization based on the points of track refractions.
2.2. Methodology of the Experimental Measurement on a Test Field
Multi-channel GPRs serve to acquire quasi-continuous information on the subsurface situation of vast areas in a short amount of time. If the subject of the works is to get the course of the utilities network, it is crucial to be aware of the accuracy of the acquired results. Keeping in mind that there are not many analyses of products derived from multi-channel GPR, experimental measurements of Leica Stream C GPR and three different positioning sets were conducted. The robotic total station Leica MS50 were used, then in sequence a satellite receiver working in RTN mode and finally the GNSS-RTN mode expanded with 1-PPS output signals of the receiver clock.
The most important parameters of GPR profiles scanning, for the needs of echogram interpretation, were set as follows: a number of samples equal to 512, a 64 ns time window, a number of stacks equal to 1 and an interval distance between traces equal to 0.04 m. It was assumed that the accepted values will ensure proper projection of the studied objects on echograms. The measurements were also planned in a way to explicitly answer the question of which method of positioning guarantees achievement of the most accurate results and what accuracy of the final products can be expected.
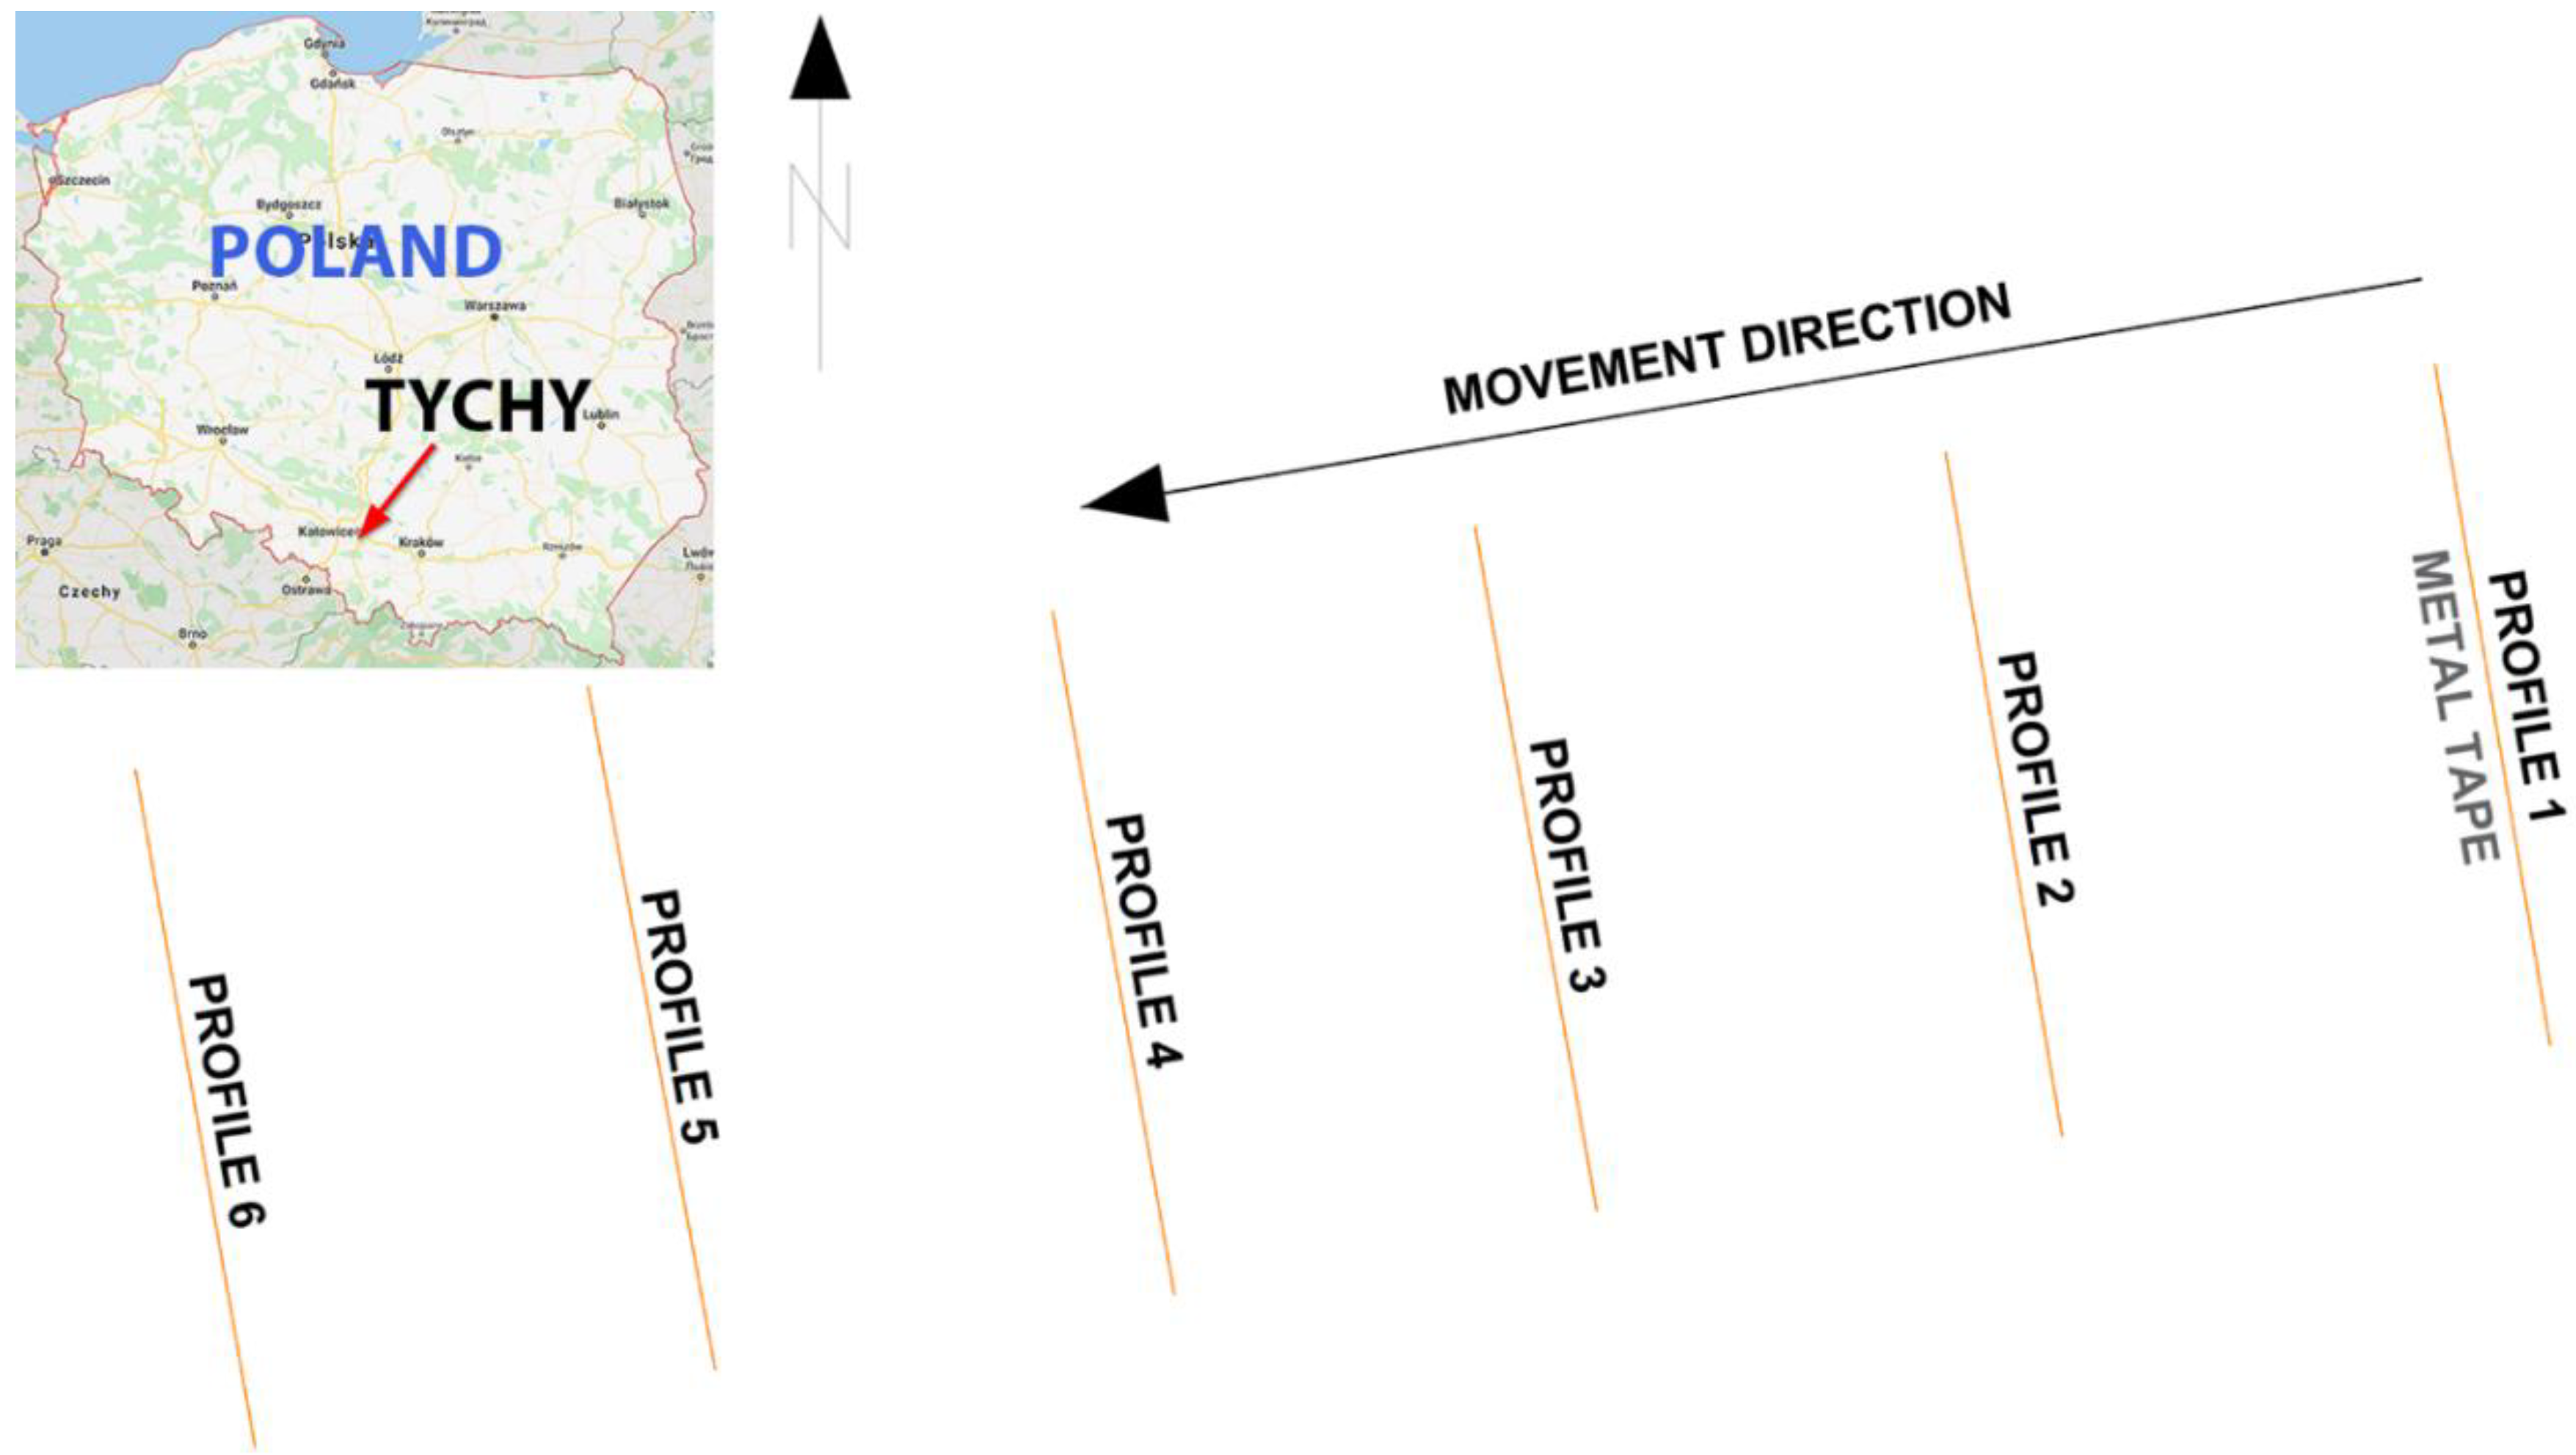
In the beginning, on a parking lot covered with pavers, six parallel sections were set out, physically implemented on site using metal tape (Figure 6). It was assumed that such a prepared basis would provide proper relative reference of the tape pass accuracy acquired from the GPR measurement, because it will be a clearly visible object on echograms, easy and clear to identify. The passes over the tapes were performed in GPS PPS variant of positioning and with the use of a Leica iCON GPS 80 receiver (Leica Geosystems AG, Heerbrugg, Switzerland).
The resulting echogram of the first pass in OneVision software for data acquisition did not show any signals, proving that the radar wave was reflected from the tape. Due to the fact that in field conditions clear identification of the tape reflection on the test material could be uncertain, in the next stages the object of measurement providing clear anomaly on echograms was the linear drainage grille of the parking lot.
Localization of the drainage was based on total station measurements. Coordinates of the control points were acquired using a GNSS receiver in RTN measuring mode. Using the construction of resection, the coordinates of the Leica MS50 total station point were specified with ±0.01 m accuracy. Finally, the axis of the drainage grille was determined on symmetry points of its outmost edges.
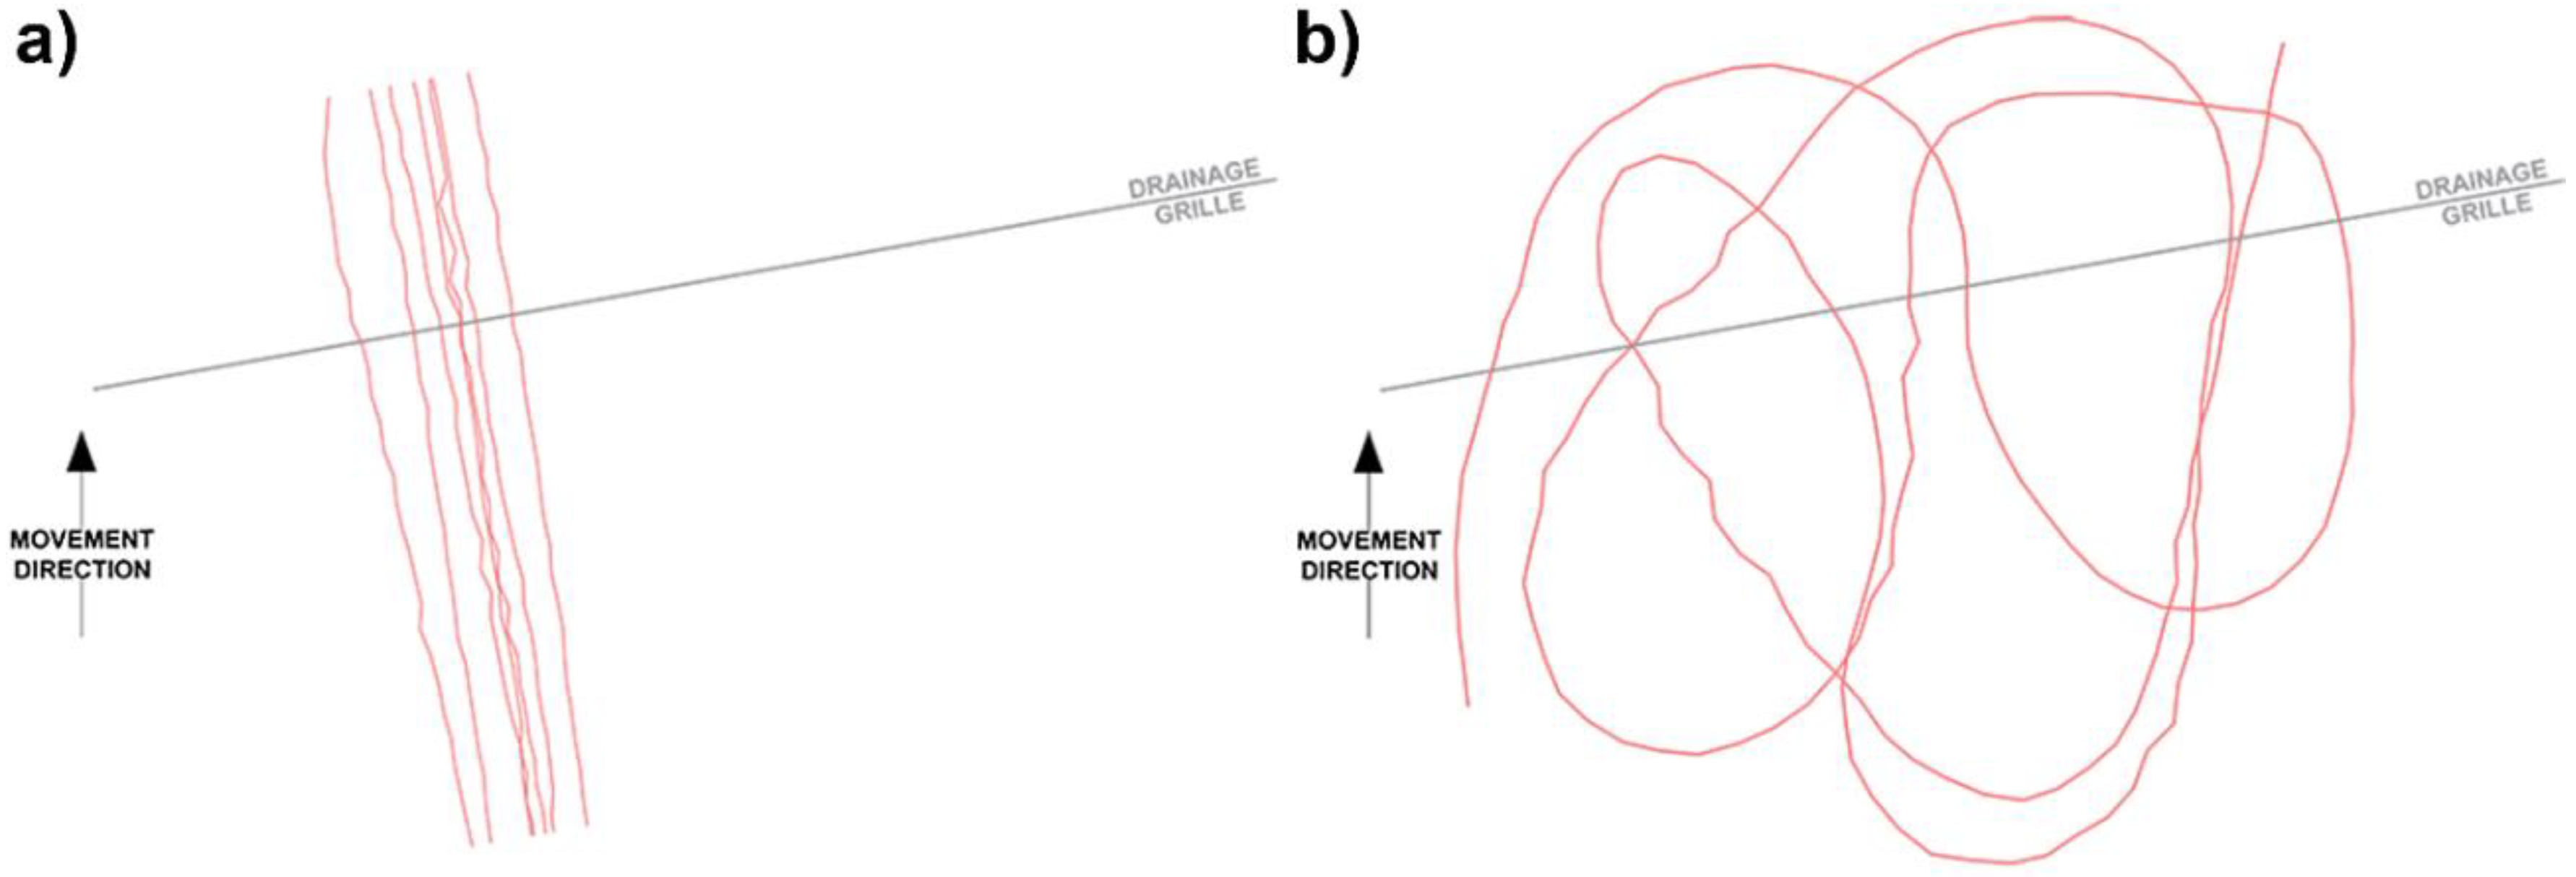
The GPR measurement for each of the three positioning systems was conducted in two variants (Figure 7a,b): using multiple parallel passes in the main and return direction along straight sections, according to producer’s recommendations, as well as implementing trajectory disrupted by dynamic changes in pass direction.
In the case of integration GPR data and coordinates provided by the GNSS receiver, data transmission in GGA format through Bluetooth communication takes place with the use of NMEA protocol. This solution allows coordinates to be achieved in a WGS84 (World Geodetic System ‘84) system and their conversion into a UTM (Universal Transverse Mercator) system, zone 34 N. On the other hand, coordinate transmission between the robotic total station and data acquisition software via radio with the use of Satteline 3AS(d) modems (Satel Oy, Salo, Finland) could be affected by latency errors of the ATR (Automatic Target Recognition) and tracking system [25], however, it enables data transmission also in the local coordinate system, avoiding GNSS measurement uncertainty resulting from, e.g., signal multipath [26].
The collected research data were processed in GRED HD software, using default parameters of the processes estimating the trajectory for each of the localizing solutions and algorithms of data filtering. If possible, on processed echograms based on analysis of horizontal and transverse slices in the 3D module, manual vectorization of the drainage grille course was conducted. The achieved results were then confronted in C-GEO surveying software (Softline, Wrocław, Poland) by setting the distances between the points obtained on the echogram and their projection on a reference axis from a classic measurement.
2.3. Methodology of GPR Measurement in Urban Conditions to the Need of Confrontation with Cartographic Material
The test survey proved that the location of the parallel passes of Leica Stream C GPR using applied positioning systems and vectorization of data processed into C-scans enables a linear objects run to be achieved with the accuracy fulfilling the legal and standard requirements of many countries in regard to the accuracy of the location of the subsurface utility network. That gives the basis to state that surface GPR is a proper tool for the tasks of verifying the accuracy and completeness of existing cartographic data recording utilities in the area.
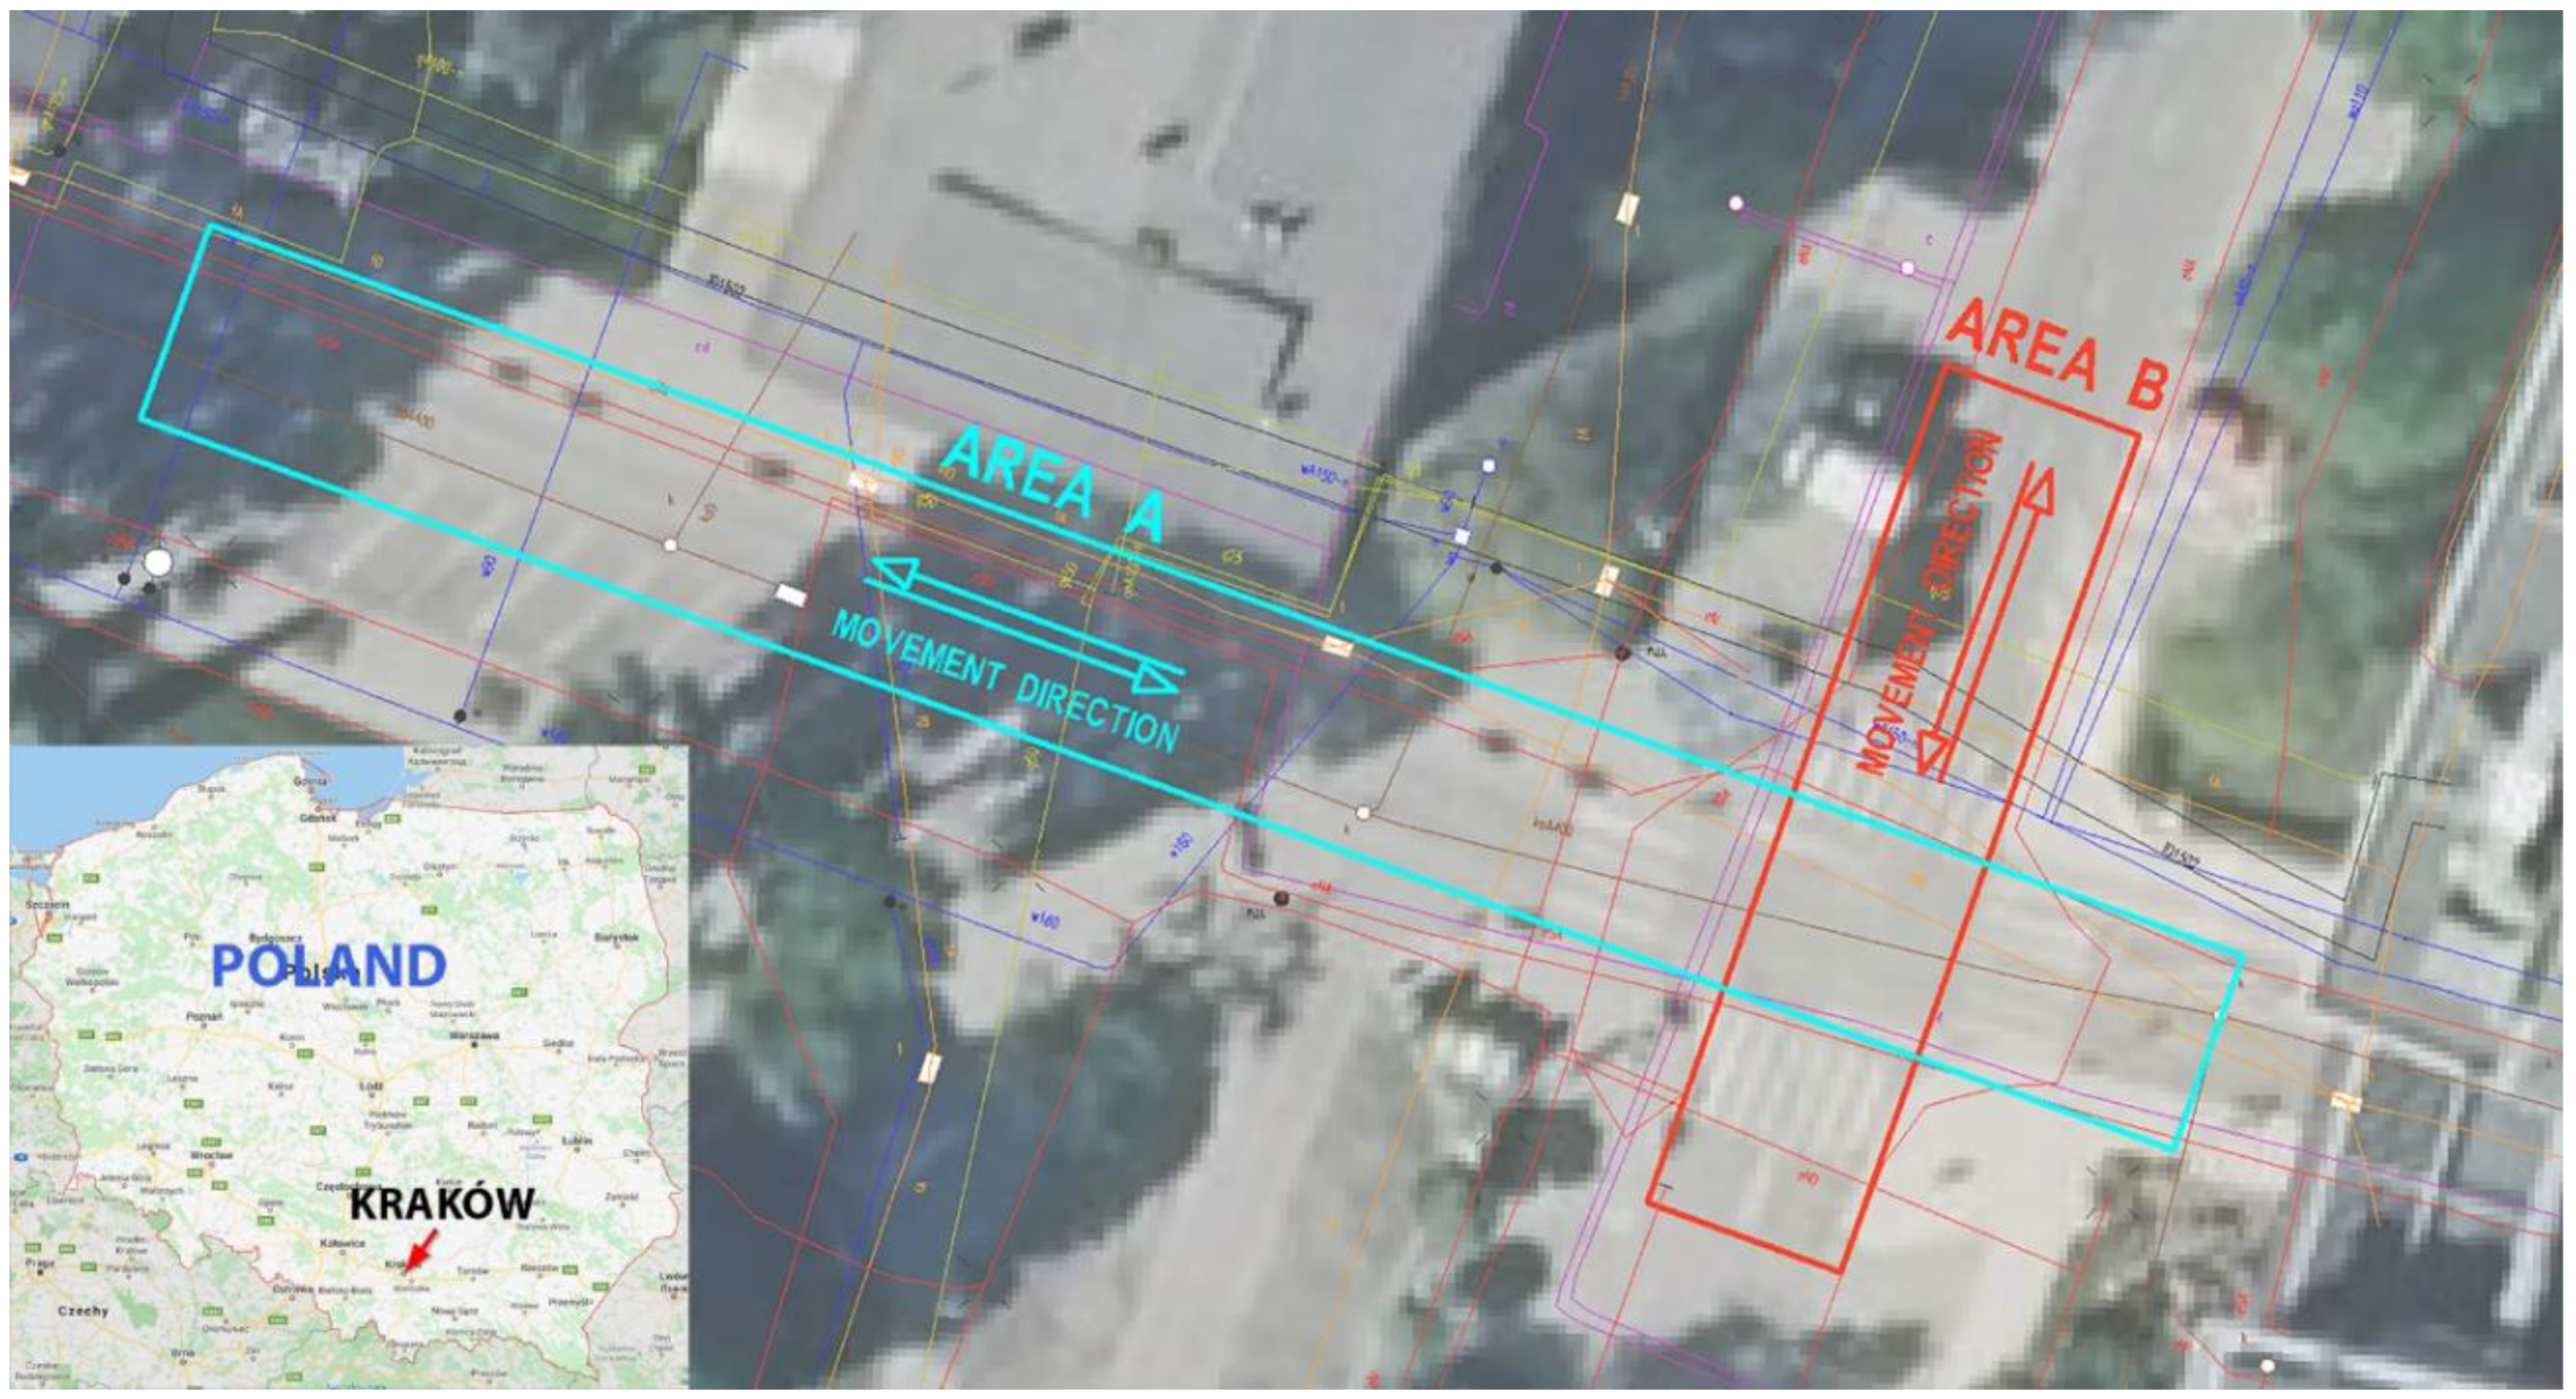
The practical use of multi-channel GPR was verified in urban conditions. The planned area of the survey included the intersection of the main traffic routes of the college campus in Krakow, as shown in Figure 8, which is characterized by high intensity and diversity of the underground utilities network. It is also an area of dense surface development with numerous elements of footpath fitting like tall curbs, places for pedestrians to rest, concrete plant pots, as well as being diversified with greenery, e.g., hedges or young trees. There are also connectors between multi-storey buildings.
The GPR profiles set up on site included measurement of the roads and adjoining pavements too, however, the great number of their fitting objects limited their accessibility for multi-channel GPR. According to the results of test research, to achieve the highest possible accuracy, parallel passes for three positioning systems were conducted on areas A and B presented in Figure 8.
The biggest area, including A and B, was measured using GPS PPS and included intersection of longitudinal and transverse routes, which enabled the assessment of consistency of data acquired from two perpendicular movement directions. The urban character of the area created the possibility to carry out additional analysis. Therefore, the areas of measurement using the total station and GPS PPS system overlapped, especially near the limited horizon, at the connector of two buildings. Area B was measured also using a GPS receiver without additional time synchronization, to determine to what extend shifts between adjacent passes, characteristic of this measurement solution, influence on location of dense located, intersecting utility networks.
3. Results
3.1. Results of the Test Measurement for Accuracy Assessment
Despite the ambiguous results observed on location during the pass trials of the GPR–GPS PPS set over the set up base, processing of the echograms in the GRED HD software showed clear reflections coming from the metal tape for each of the six scanned sections. It allowed vectorization on echograms and determination of the distance of the outermost points in relation to the course of the baseline in classic measurements. In the same way, ∆d difference between the measured drainage grille and its course was determined. They were estimated during successive GPR passes along parallel and perpendicular sections, using three positioning systems. The results, differentiating the type of base and location variant applied, are shown in Table 1.
Assuming that both the metal tape and drainage grille coordinates were determined with the same accuracy, increase in the number of observations for the GPS PPS positioning solution allowed the RMSE of the distance of two runs to be estimated based on Equation (1):
where ∆d is the difference between the runs from classic and GPR measurements, and n is the number of determined differences.
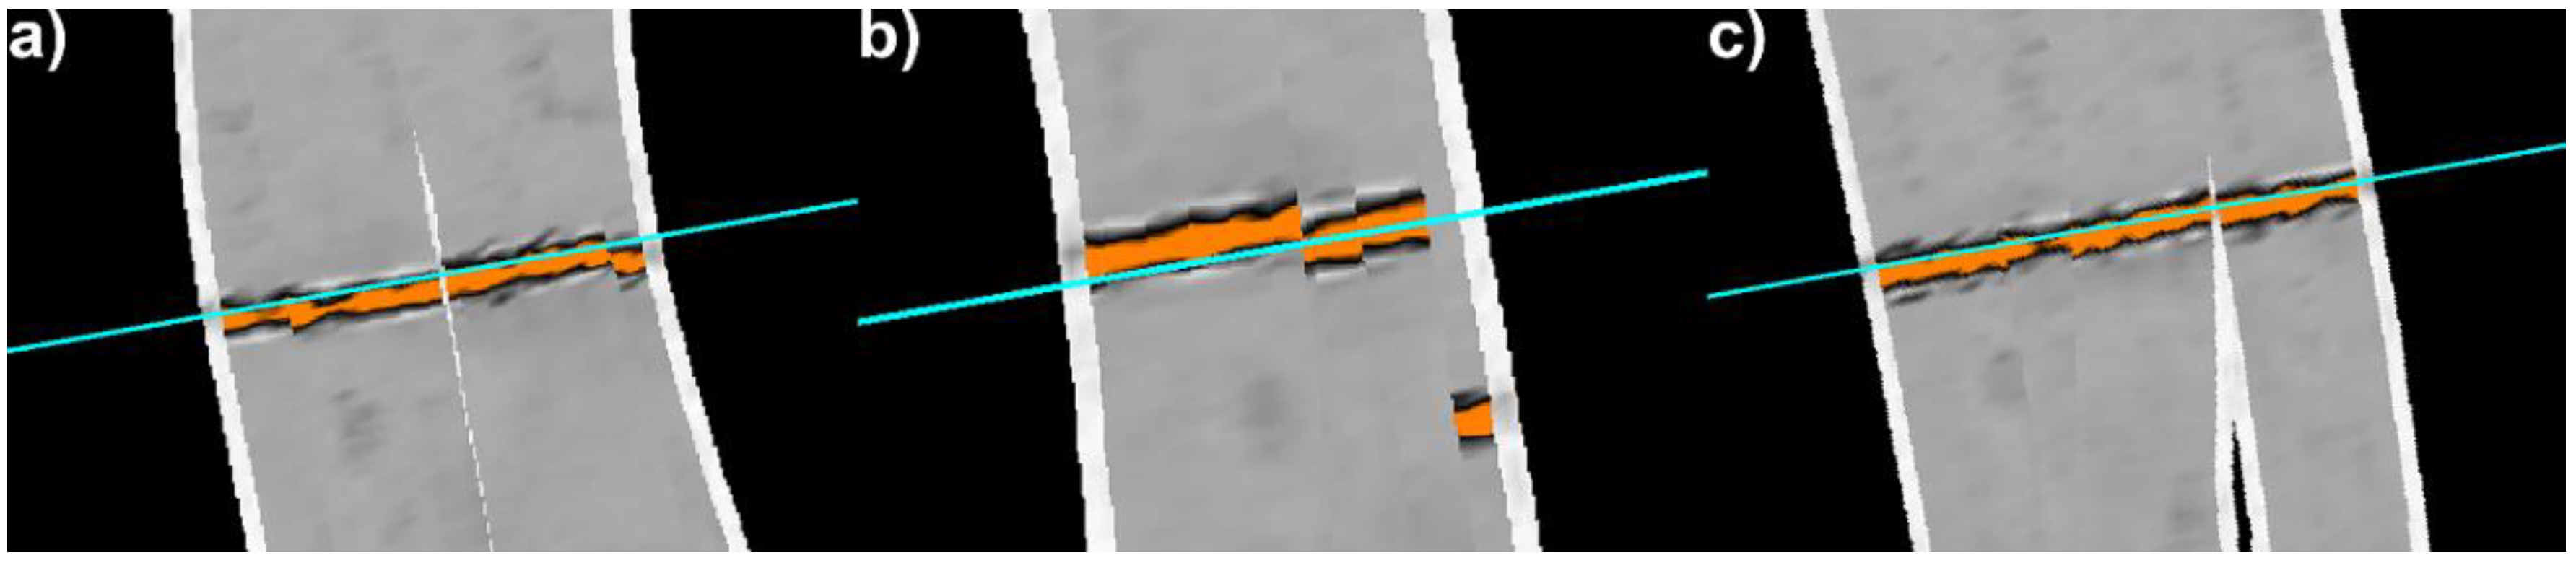
The acquired RMSE = ±0.052 m proves the high accuracy of the implemented measurement solution. Those results are reflected in the visual assessment of the C-scans. Visualizations that come from adjacent passes, on the edges of a junction, are characterized by high consistency of the recorded amplitude on the given depth and form continuous image of its layout in space (Figure 9a).
For the other two solutions, GPS and total station (TS), it was impossible to determine statistical parameters of their processing because of the insufficient number of observations. Partial results, however, are the proof of the high quality and accuracy of the final products, especially for GPR data positioned using the robotic total station (Figure 9c). In both cases, vectorization based on the centers of anomalies visible on the GPR C-scan image, implemented in the outermost points, showed twisting of the anomaly run in relation to the grille axis measured geodetically. Looking into C-scan images allows the statement that in the case of the GPR–GPS system, this is caused by a lot worse adjustment of the adjacent trajectories of GPR traces (Figure 9b). The result of that is characteristic faults along the linear objects. Supplementing the measurements with additional passes over the grille could lead to better approximation of the run and reduce the twisting angle.
Parallel passes are the solution recommended by the equipment producer and provide satisfactory echogram accuracy, which is reflected also in the visual accuracy of GPR data in the form of C-scans, especially while using additional time synchronization. In field measurements, especially using motorized vehicles to tow the instrument, bending of the GPR track profile could occur, which is presented in publications shared by the producer. The implemented algorithm of trajectory estimation is not effective in the case of profile trace discrepancies caused by dynamic changes in moving direction, which considerably translates into the final result of GPR data processing.
The highest consistency in the horizontal view of adjacent sections of an irregular pass is presented by the echogram whose profile was positioned using the GPS PPS system (Figure 10a). The faults between the amplitude distribution visualizations of the drainage grille in consecutive passes are not significant, although they are characterized by different twisting angles in relation to the base axis, and it is difficult to decide which fragments could be considered as a proper run. Vectorization based on the outermost passes showed discrepancies up to ±20 cm on section ends. In the same way, the vectorization of irregular passes located with the use of a GPS receiver without PPS assistance was conducted. In this case, the numeral data is more beneficial. Differences do not exceed ±10 cm, but the situation recorded between the outermost points could be treated as the presence of at least two additional linear objects (Figure 10b). Measurements conducted for the needs of an investment or creating data supplying the national surveying databases could require additional verification of the situation, to make sure that the existing compilation is complete.
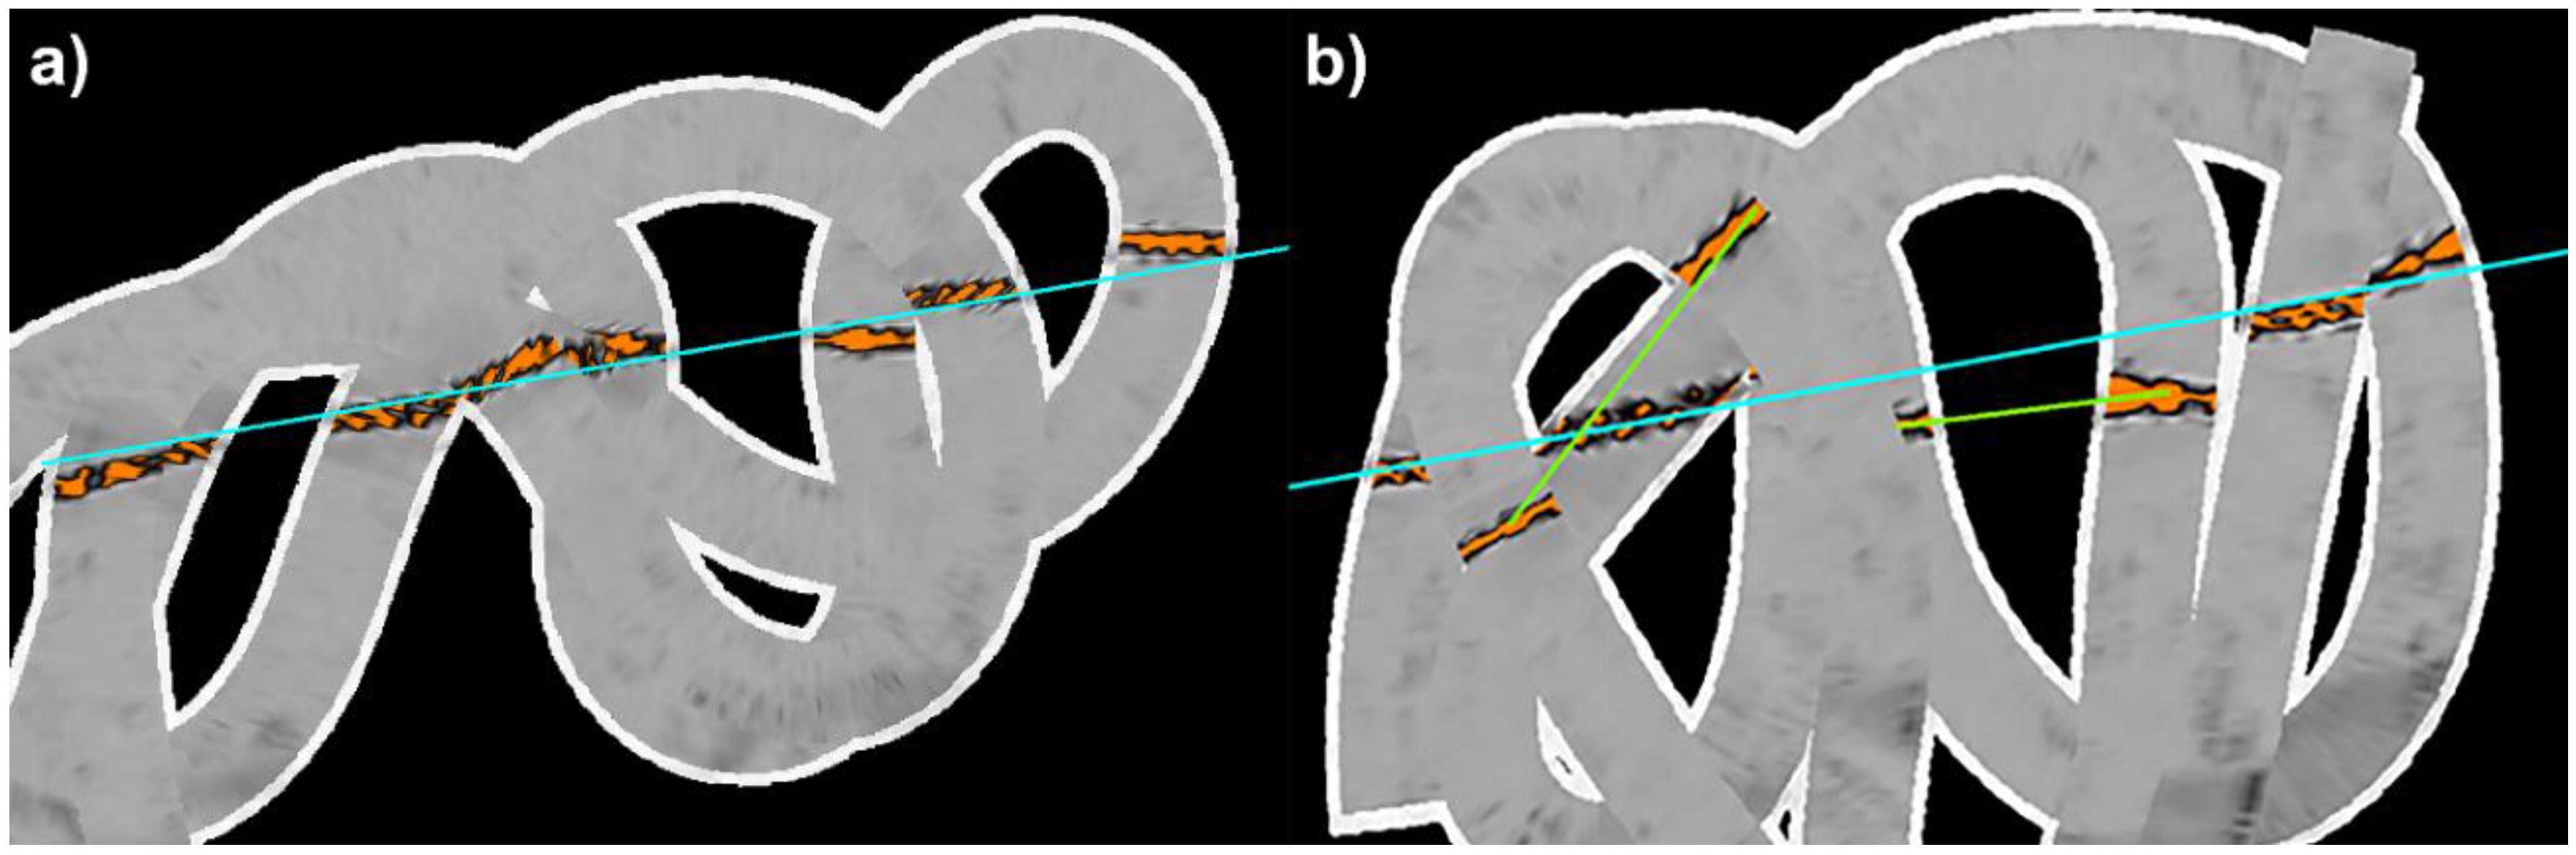
In the case of the last method of positioning using the total station, the recorded irregular GPR trace should be divided into two fragments (Figure 11). In the beginning stage of the pass, despite the turning, compliance of up to ±10 cm between the vectorization and axis of a utility can be observed on the length of about 3 m along the drainage grille. In the next fragment, however, the situation gets much worse. The theoretical run of the drainage grille is located even 25–40 cm away from the actual location.
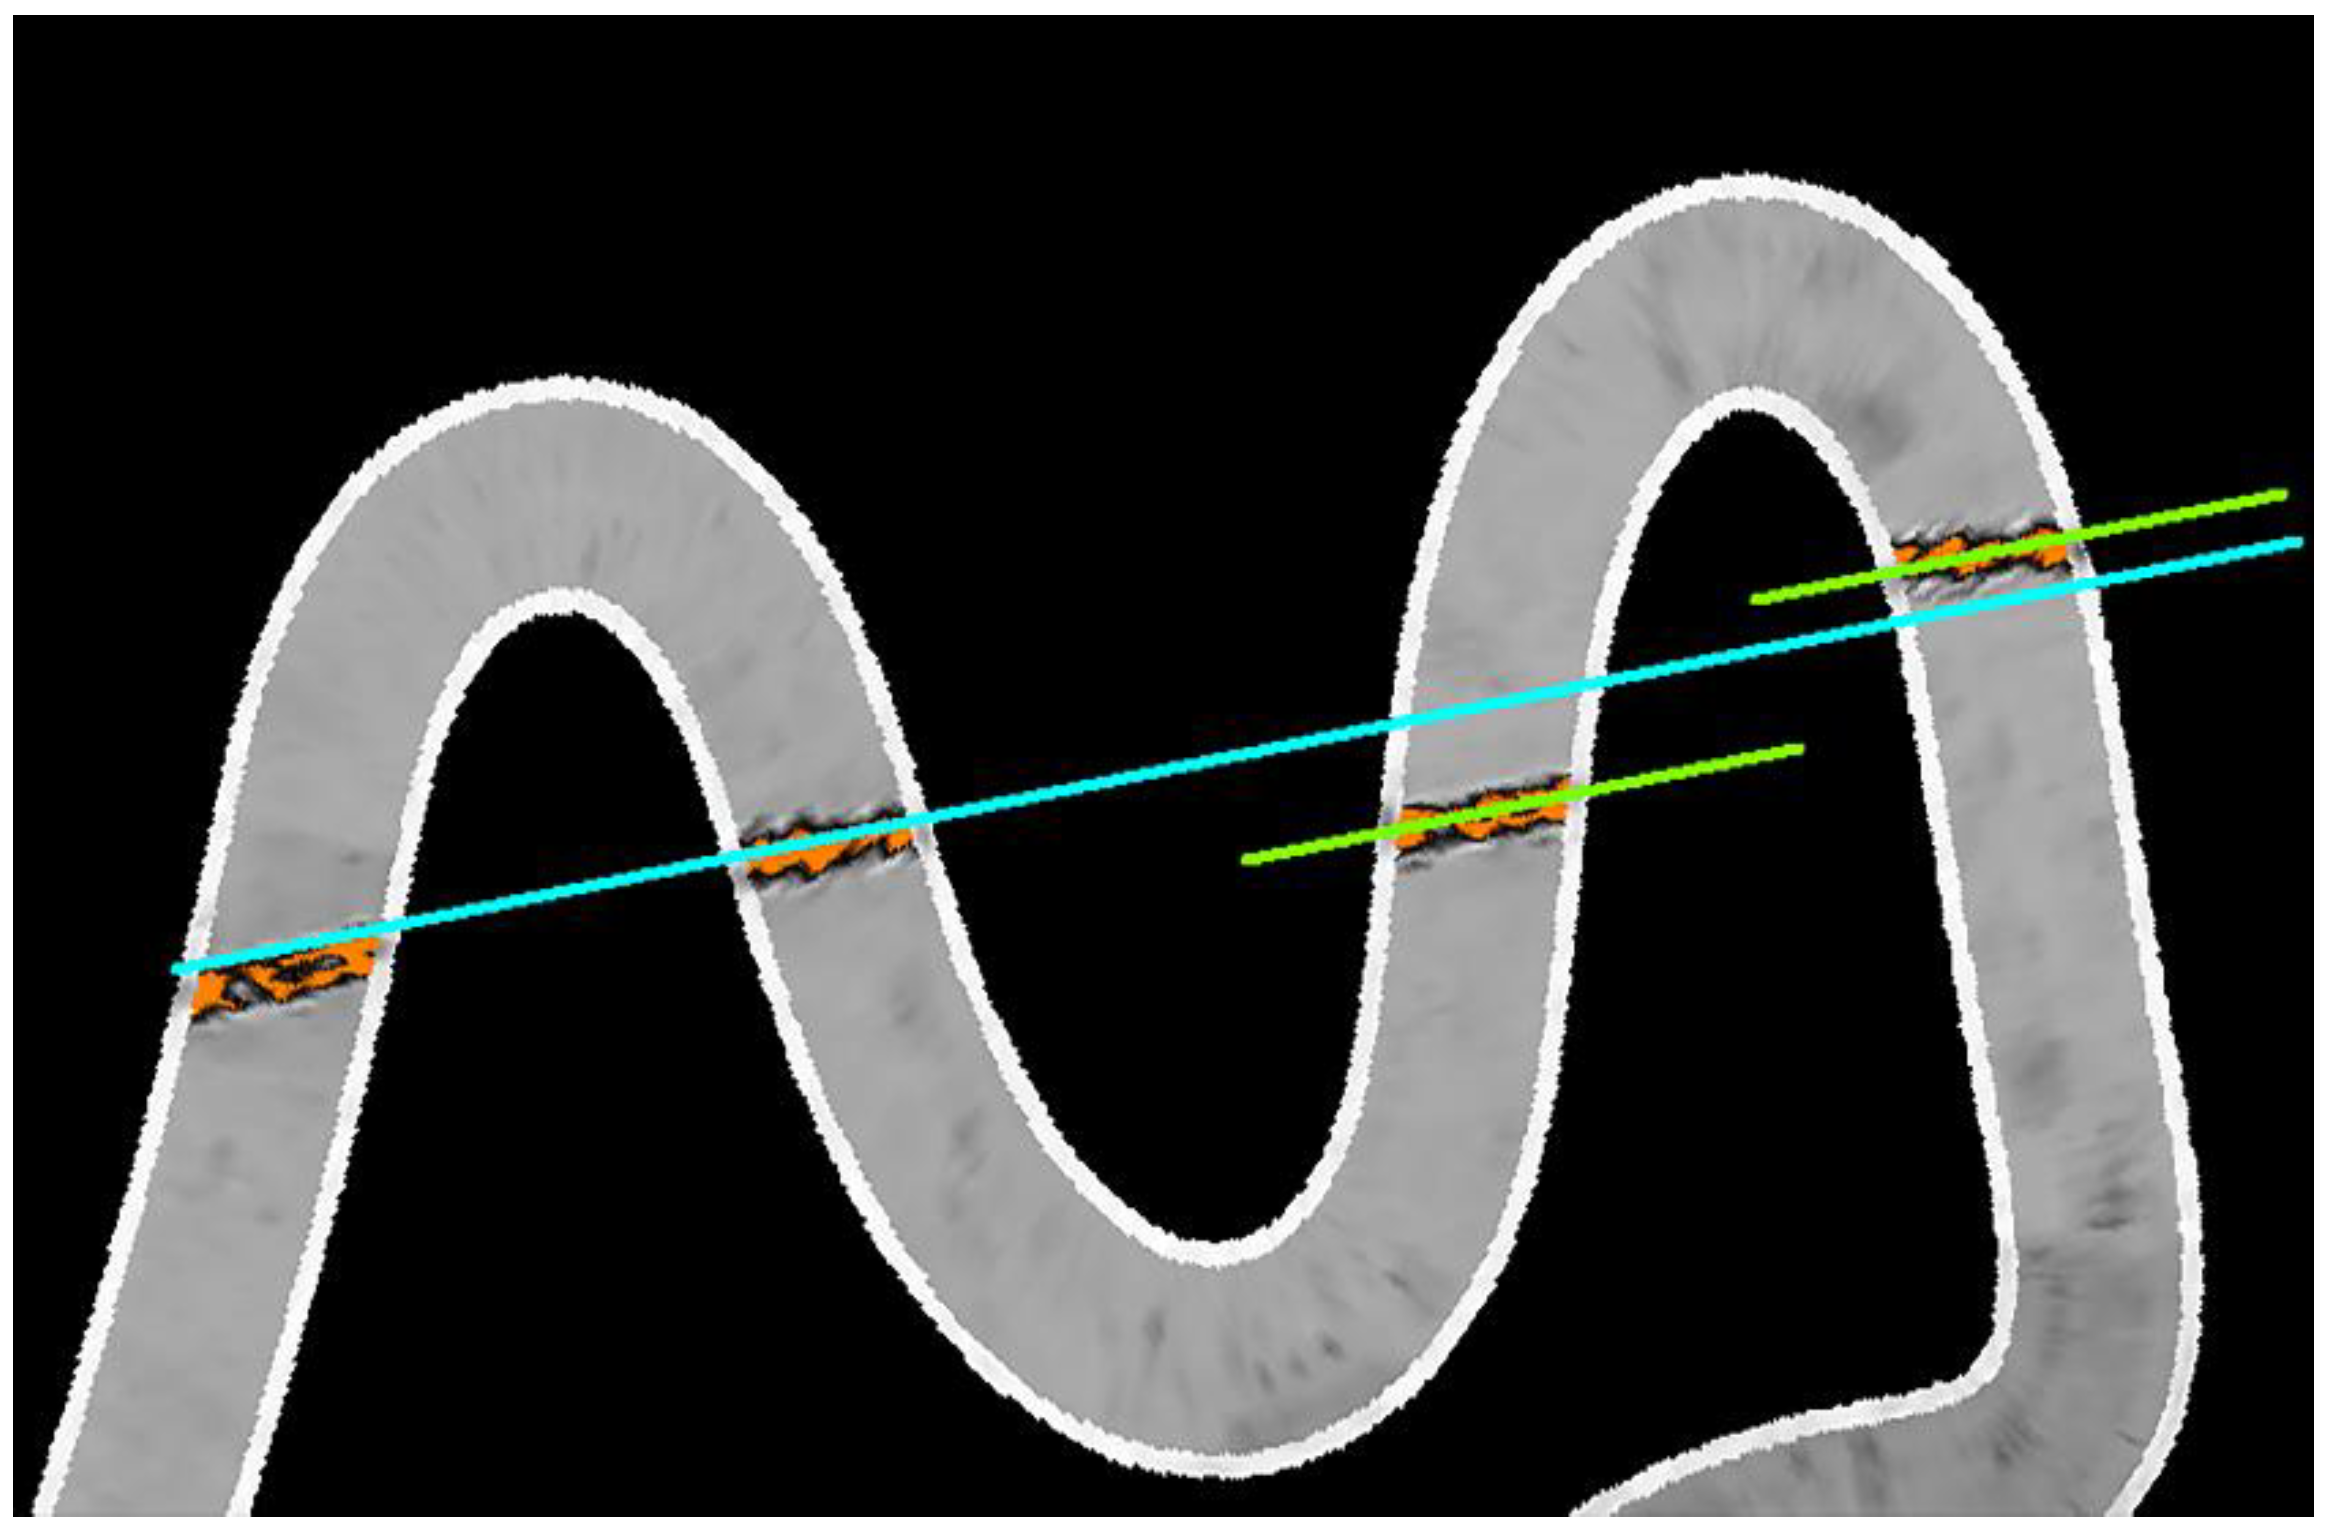
A clear reason for the faulty positioning of echograms acquired during the irregular run has not been determined. The plus/minus sign of the echogram rotation angle relative to the grille axis does not show dependence on the direction of the twist proceeding on a given fragment of the profile. It was observed, however, that the mentioned direction is related to the way C-scans are shaped within curvilinear sections. As it is shown in the presented images, turning right (Figure 12a,c) results in an echogram whose borderline makes the curve of the radius smaller than the one fitted into GPR trajectory points. Distances between the curves reach a size of up to 0.10 m. In the case of turning left, the relationship is formed in the opposite way (Figure 12b,d)—the radius of the echogram borderline is bigger than the one fitted into the recorded track and distances between the two runs are up to even 0.25 m. In addition, it can be noticed that the software “evens” echogram run reduces the impact of the pole tilt through the broken profile approximation.
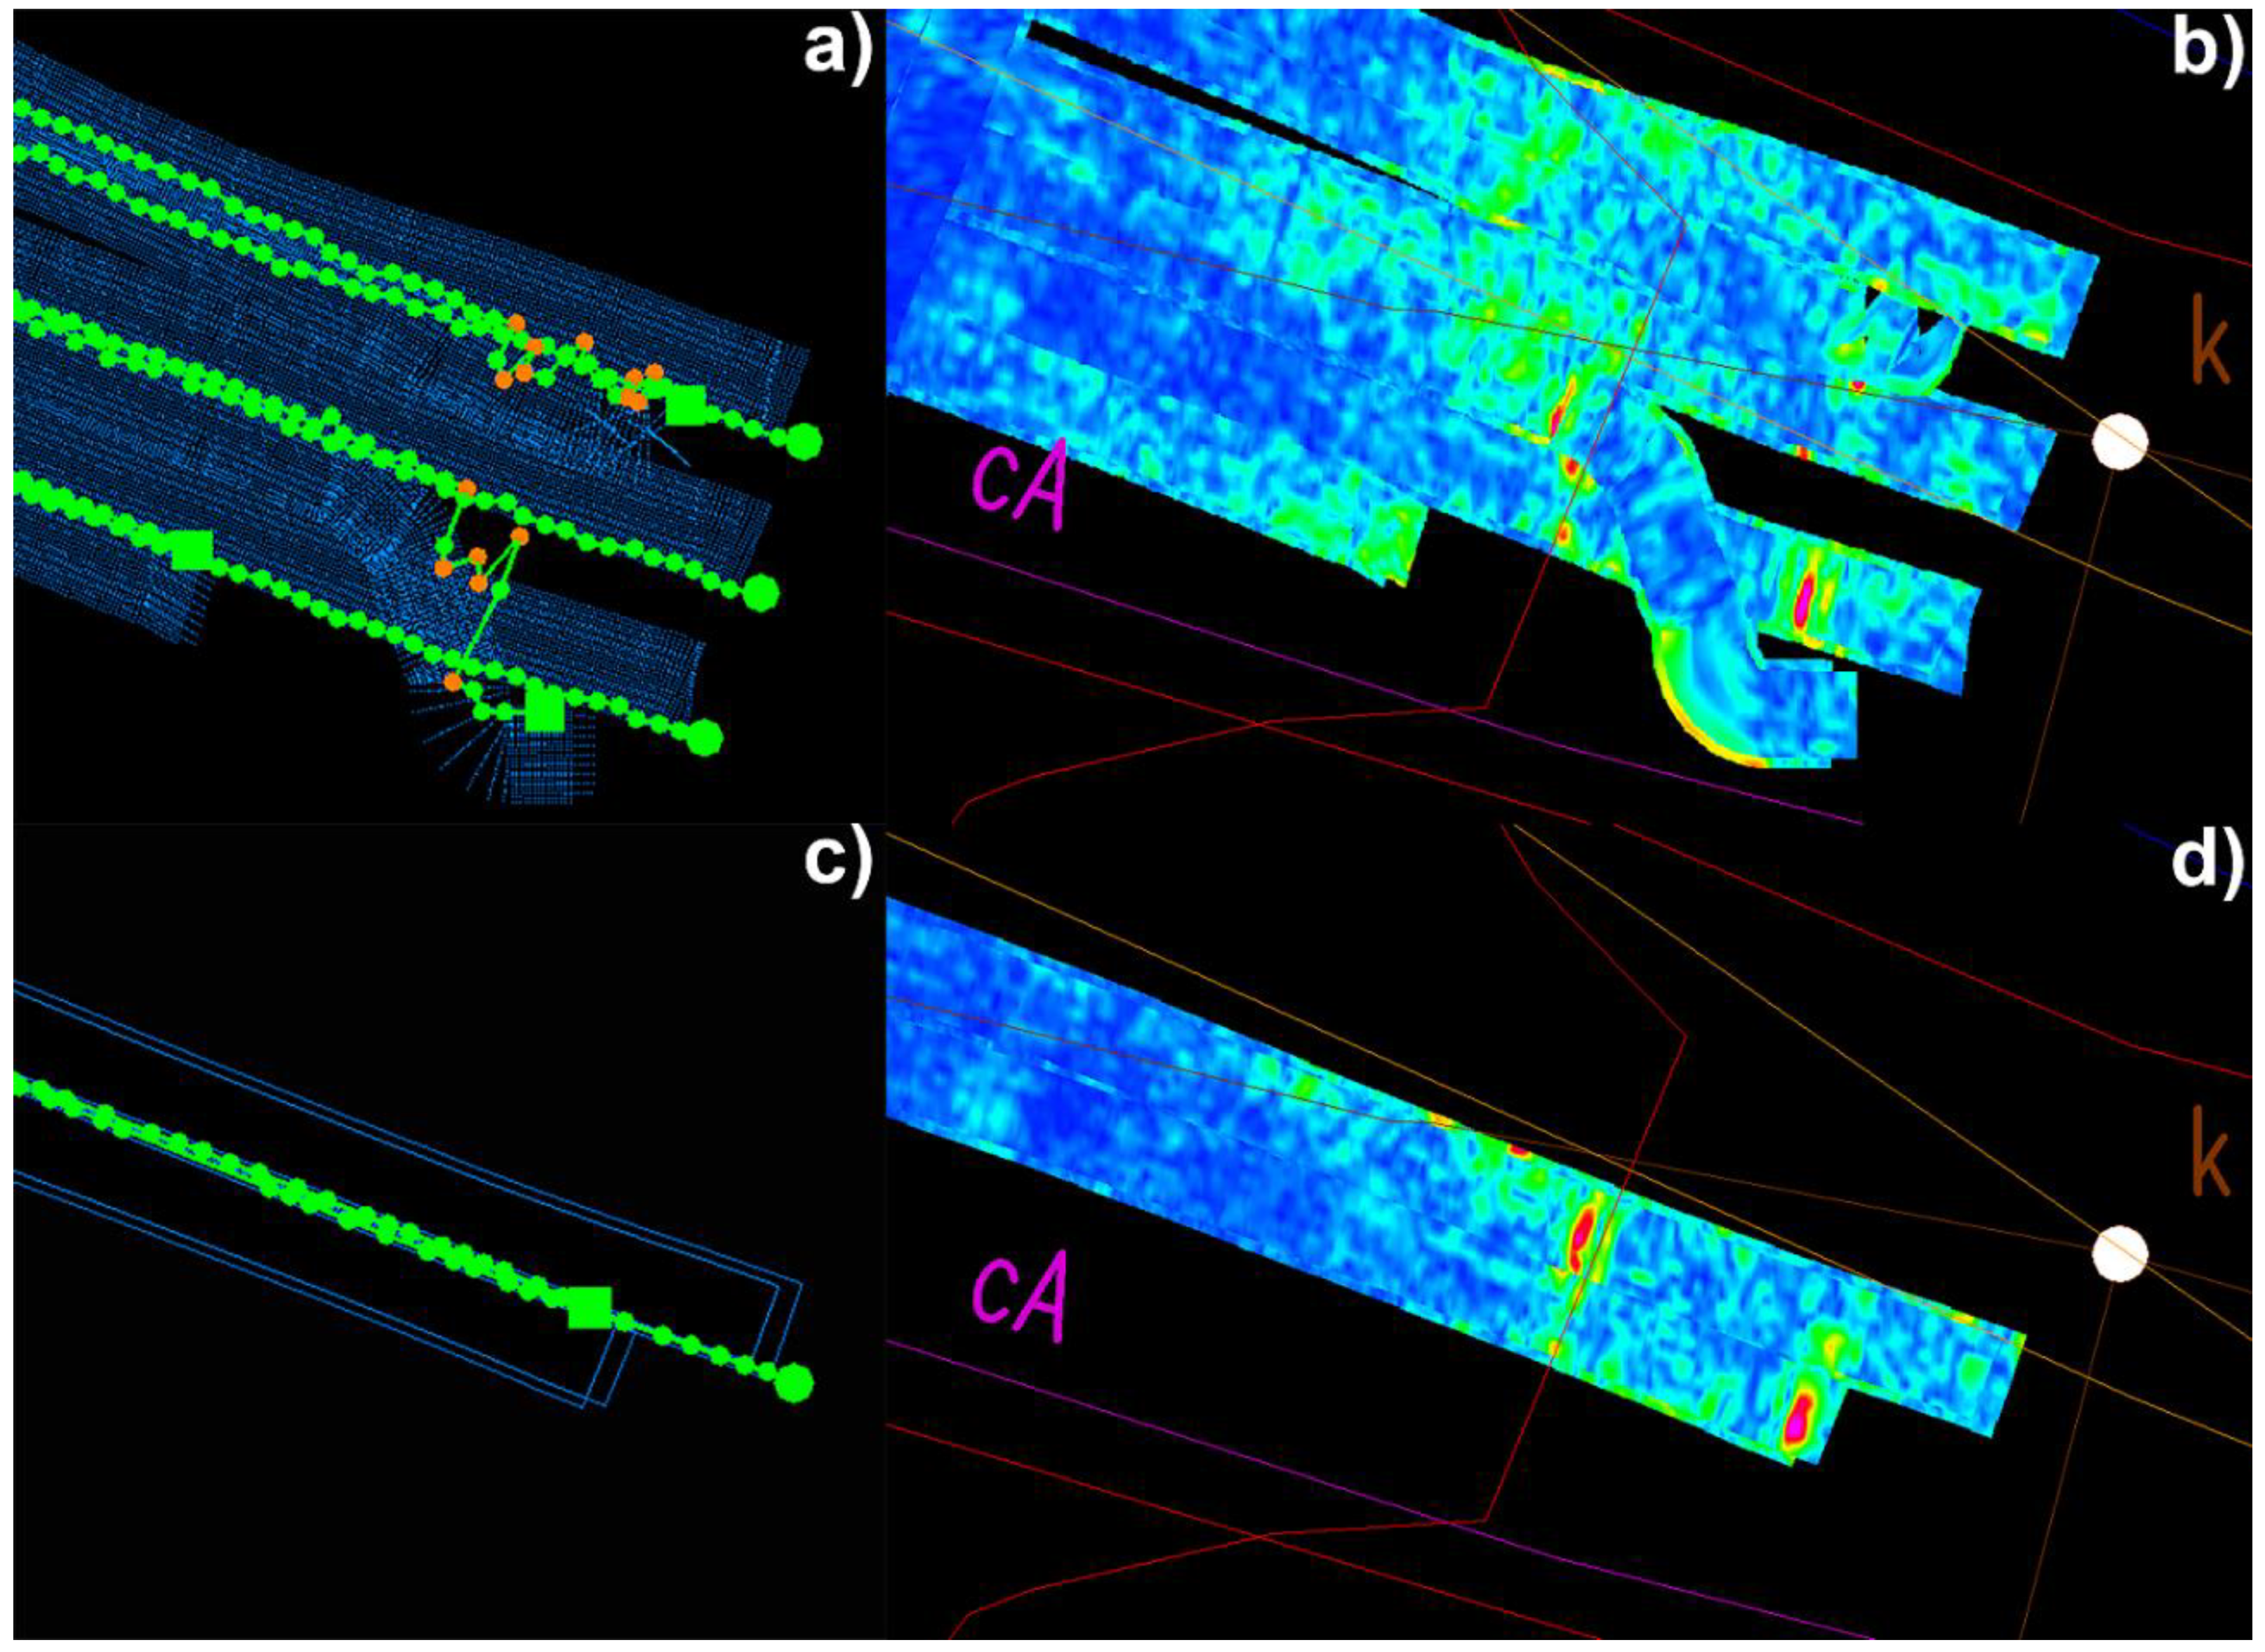
3.2. GPR Measurement Results in Urban Conditions to the Need of Confrontation with Cartographic Material
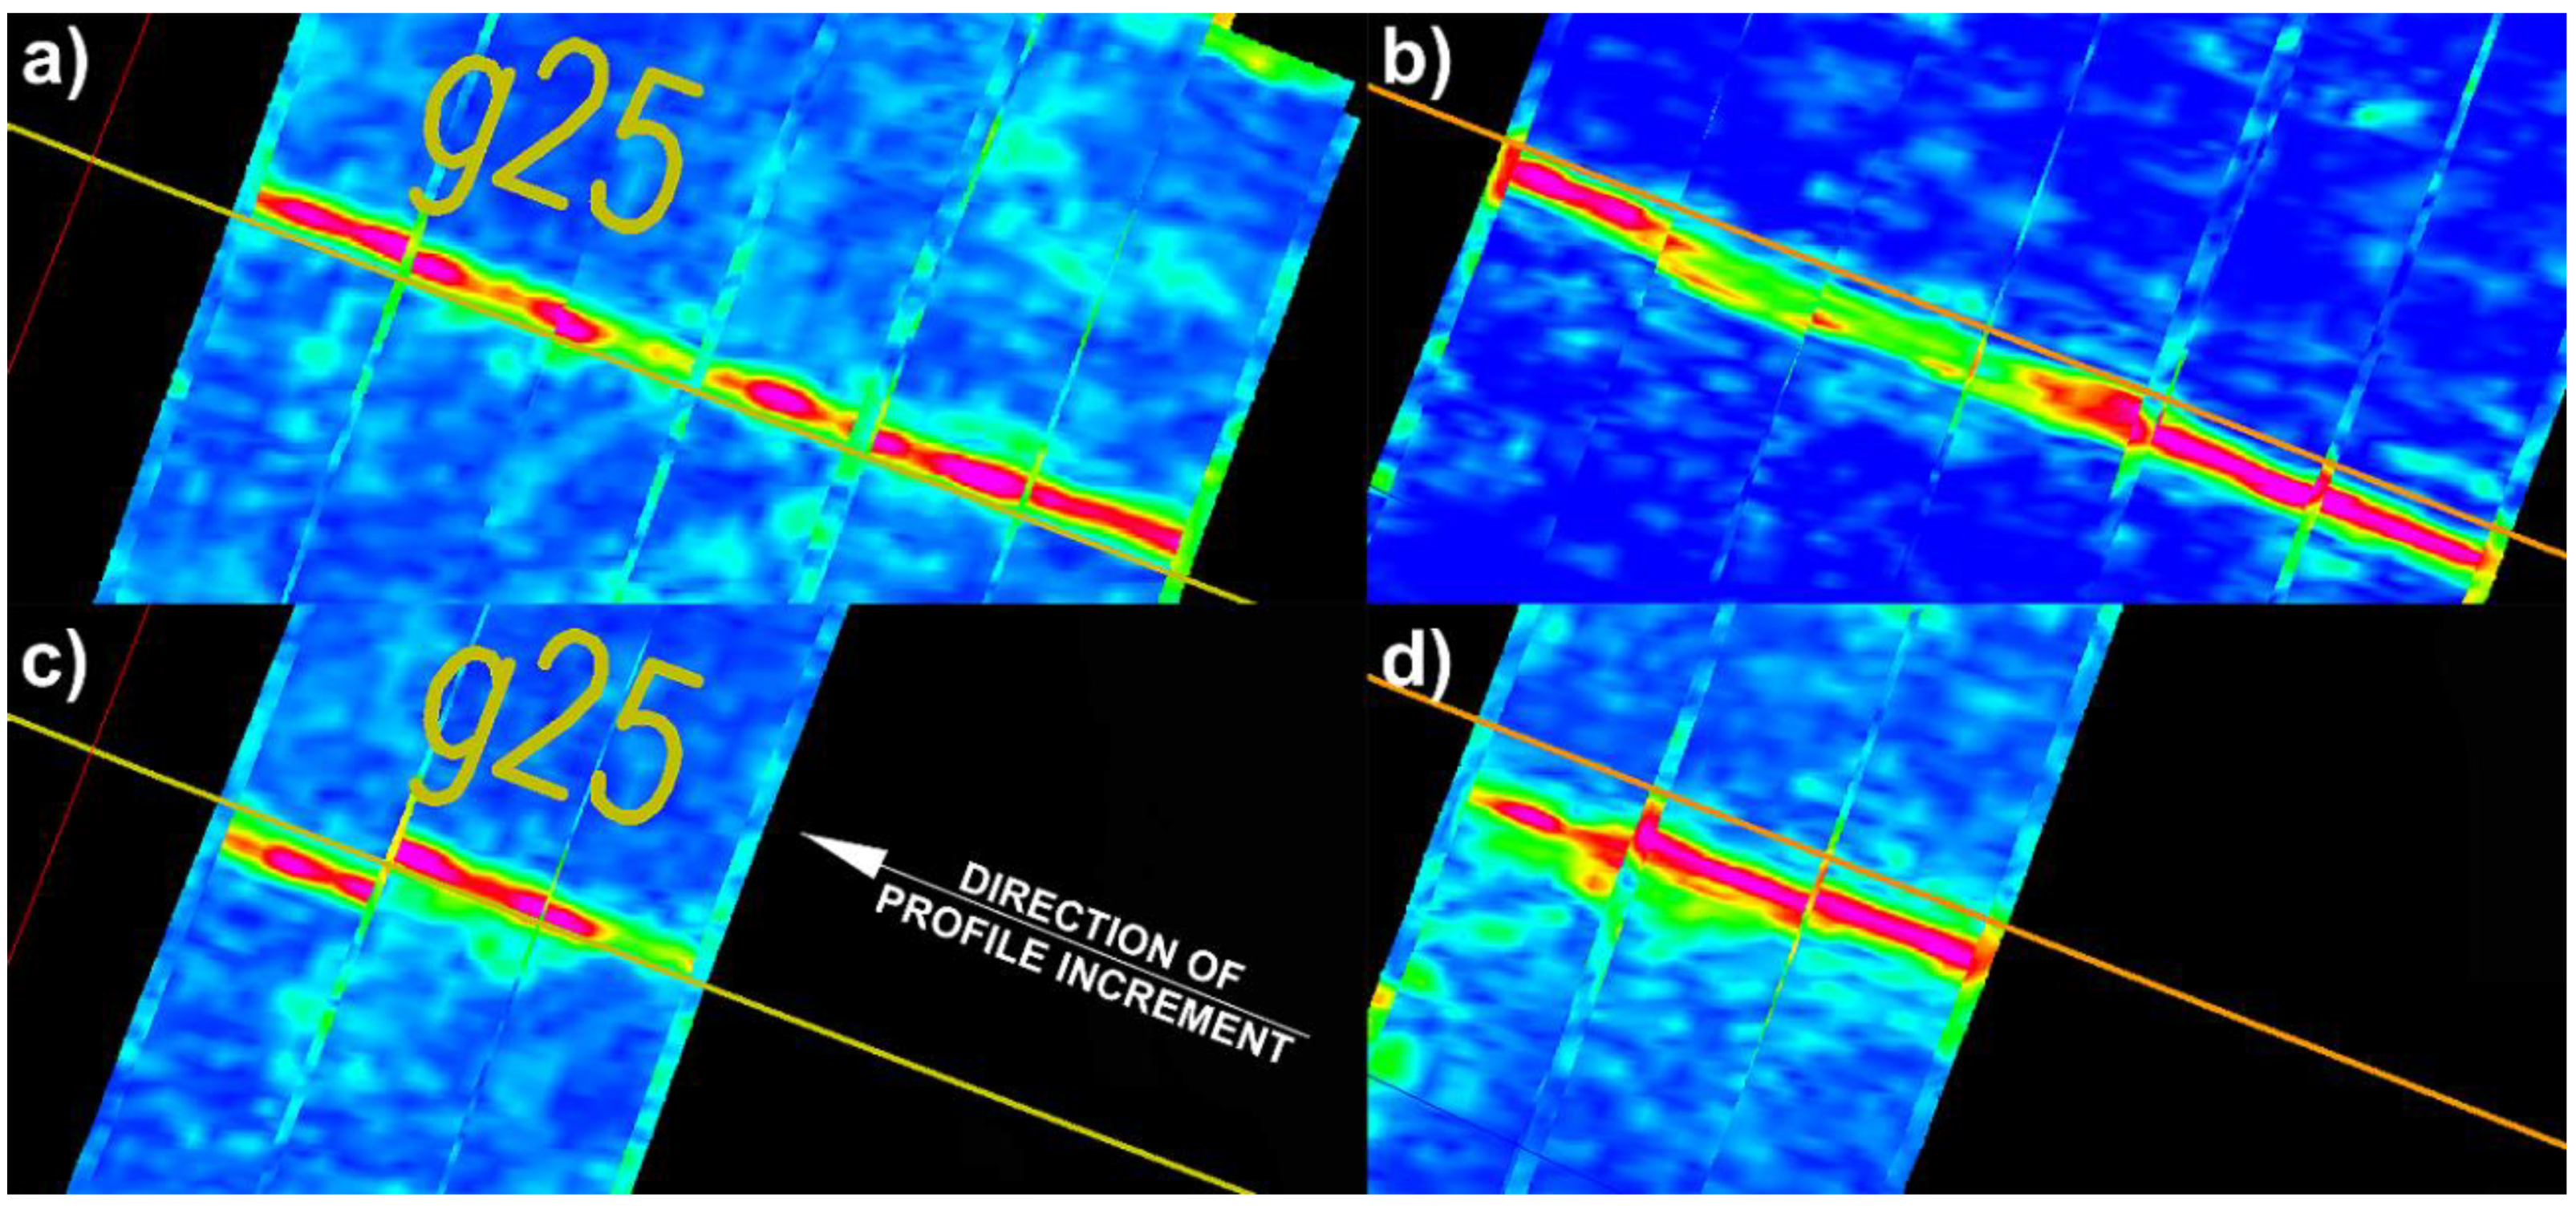
The result of the test measurement confirmed high accuracy of GPR profiles when processing products located using GPS PPS and conducted in parallel. In addition, in the whole area of the urban conditions measurement, no radical discrepancies in the identified transmission networks were observed. This is especially visible in area B (Figure 8), where up to six measuring profiles were conducted, and yet the straight sections of the network produced a continuous image of the utility (Figure 13a,b). This is a considerable advantage over the other positioning solutions. Figure 13c,d presents analogical sections of utilities which were measured in area B using the GPS system without additional time synchronization. The last pass is characterized by the shift in relation to the adjacent one of about 20 cm along the route axis.
A similar situation occurs when using coordinates transmission from the total station in area A, which is shown in Figure 14b. The identified fault between the profiles reaches up to 15 cm. Such registered GPR pictures make it very difficult to properly interpret the subsurface situation and vectorize the network route.
In the case of the GPS PPS system, it is also crucial that conducting measurements in a regular profiles grid showed high consistency of amplitude layout on the intersection of perpendicular routes in areas A and B (Figure 15), where the existence of telecommunication wire was confirmed. Quality assessment of the map vector run on the horizontal slice of echograms leads to the conclusion that GPR data were well adjusted to cartographic data. The determined average difference of vectorized wire on echograms in relation to the basis section equals 0.174 m though. Referring to the results of the experimental measurement, assuming even twice bigger uncertainty of GPR processing products due to anomaly depths of about −0.70 m, the achieved difference provides information about the incorrect location of the utility on the map. This can be related to the fact that the object was introduced into the geobase on the basis of the digitalized archive materials. Coming to a conclusion about the accuracy based on the visual assessment must be therefore supplemented with determining the quantity parameters. This is especially applied to larger depths, when GPR images are characterized by lesser contrast of amplitude layout due to the suppression effect and the decreasing horizontal resolution together with depth.
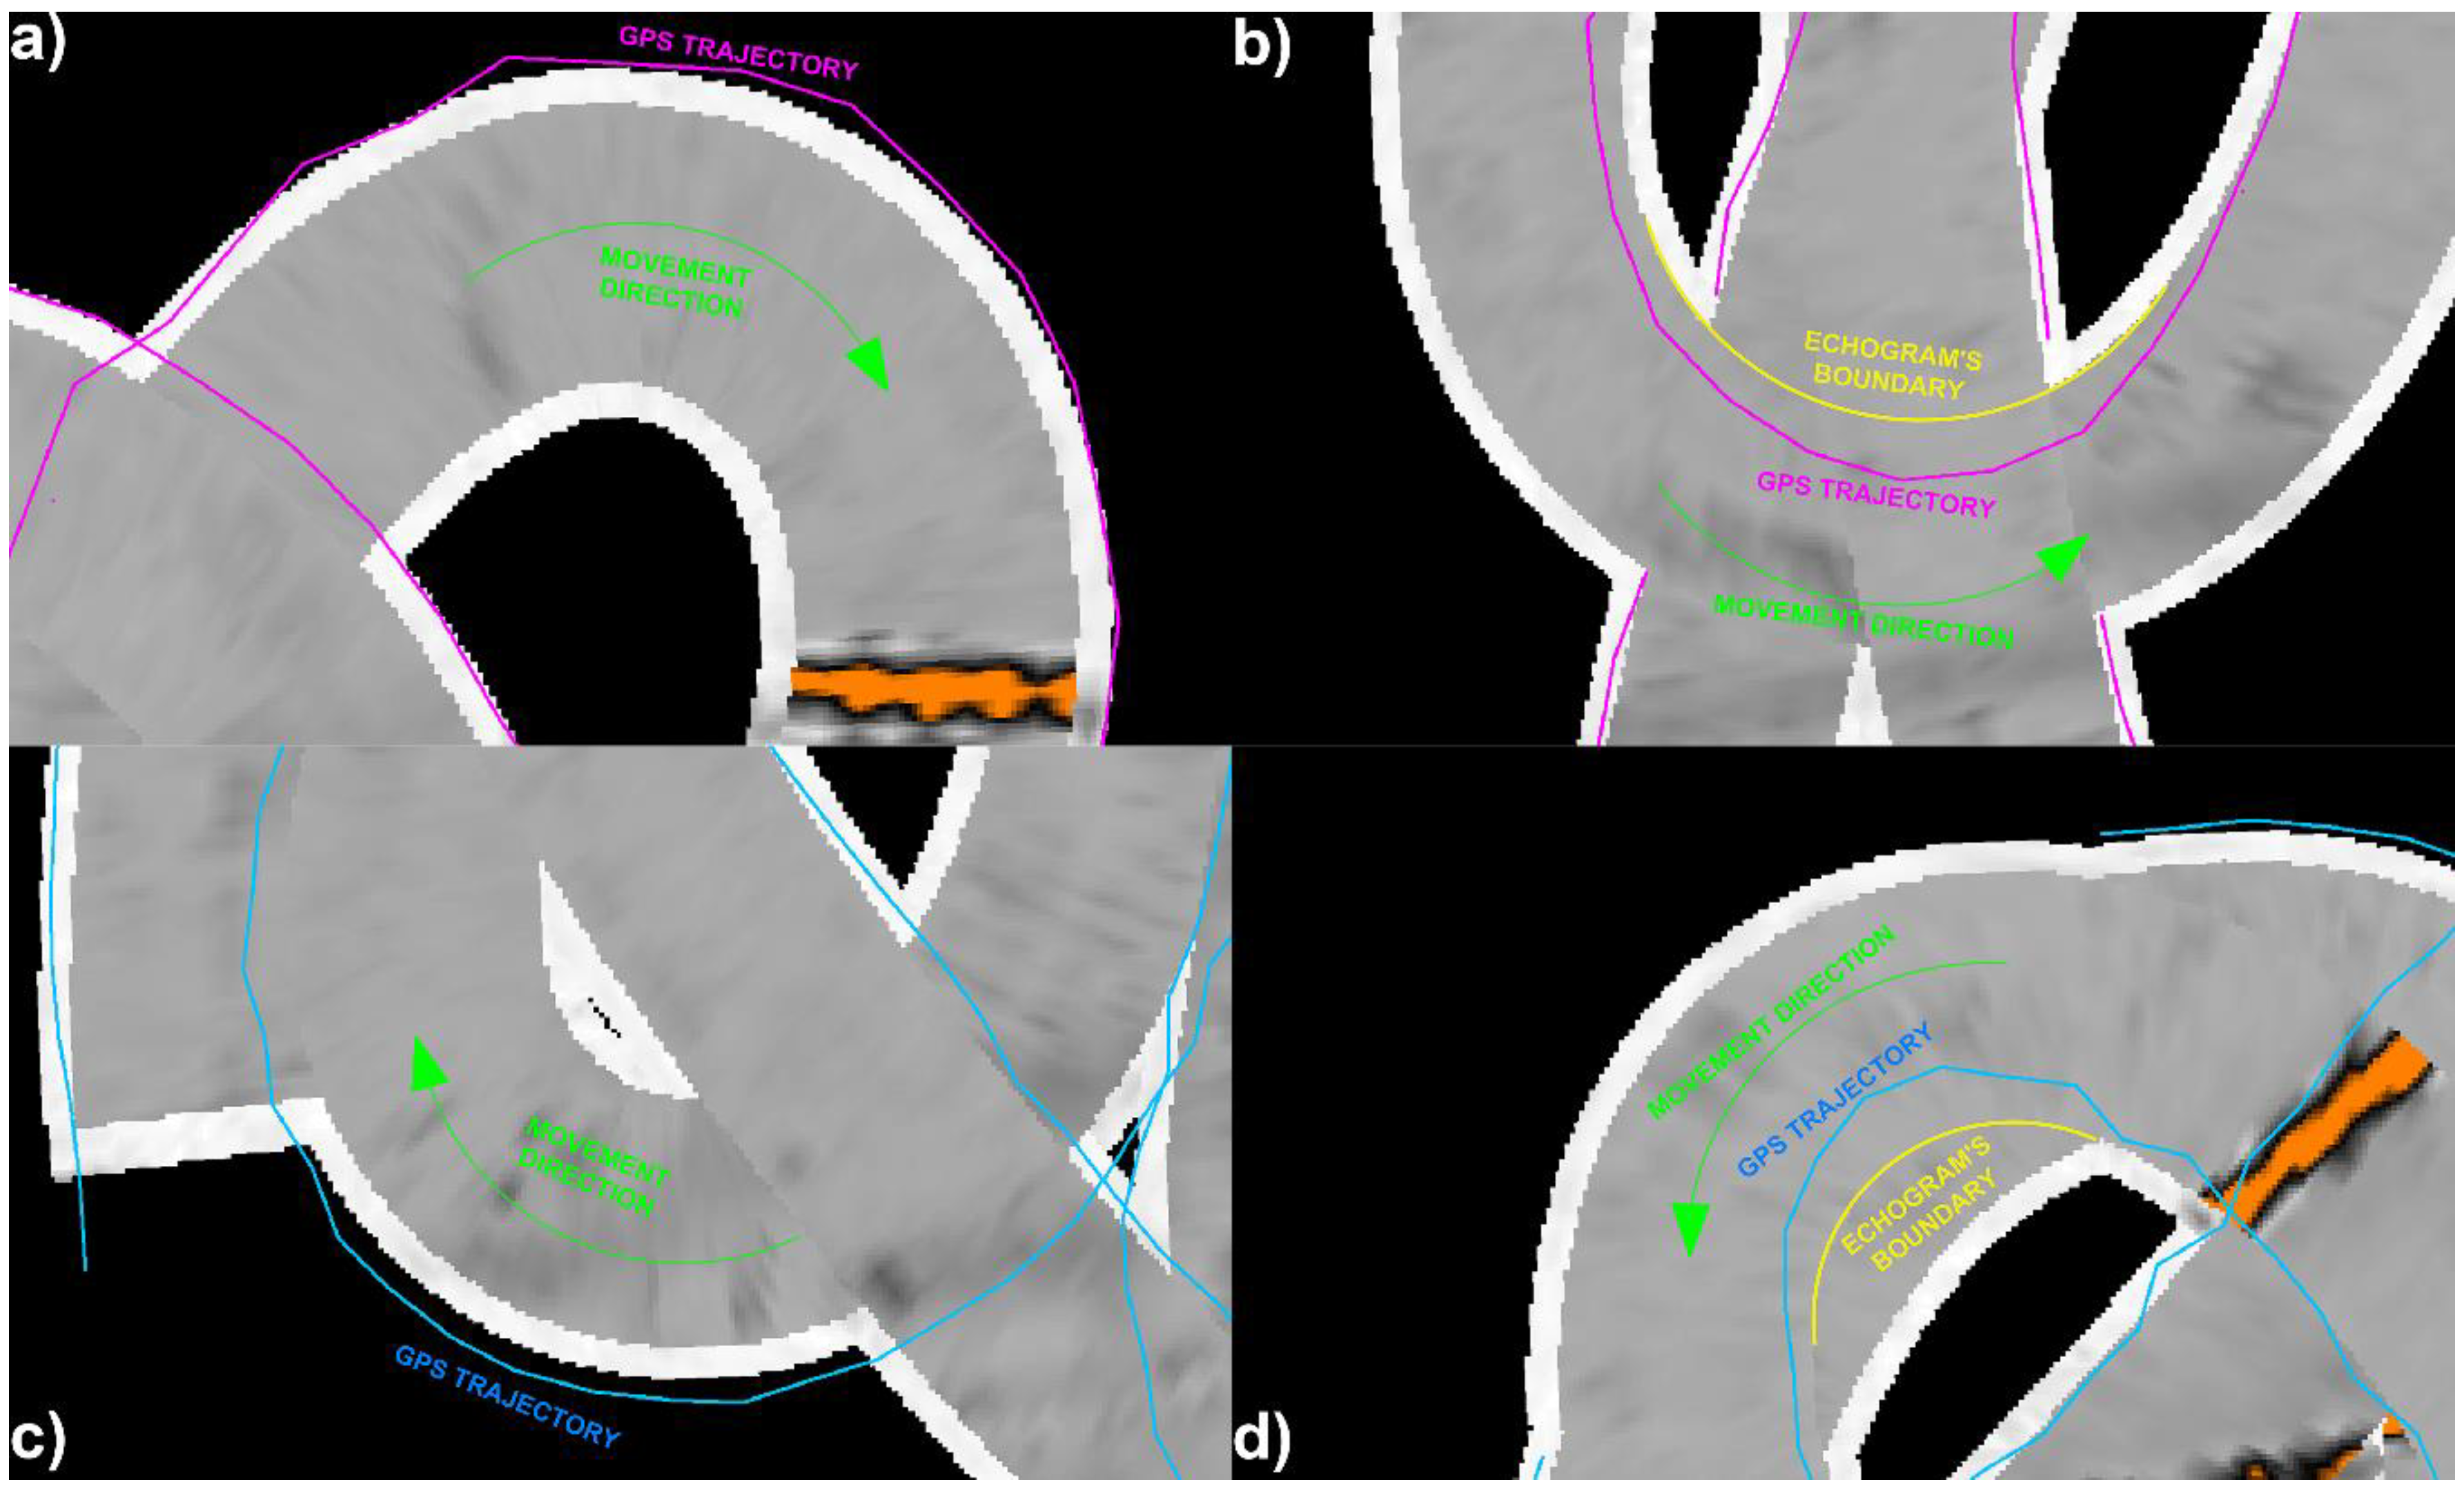
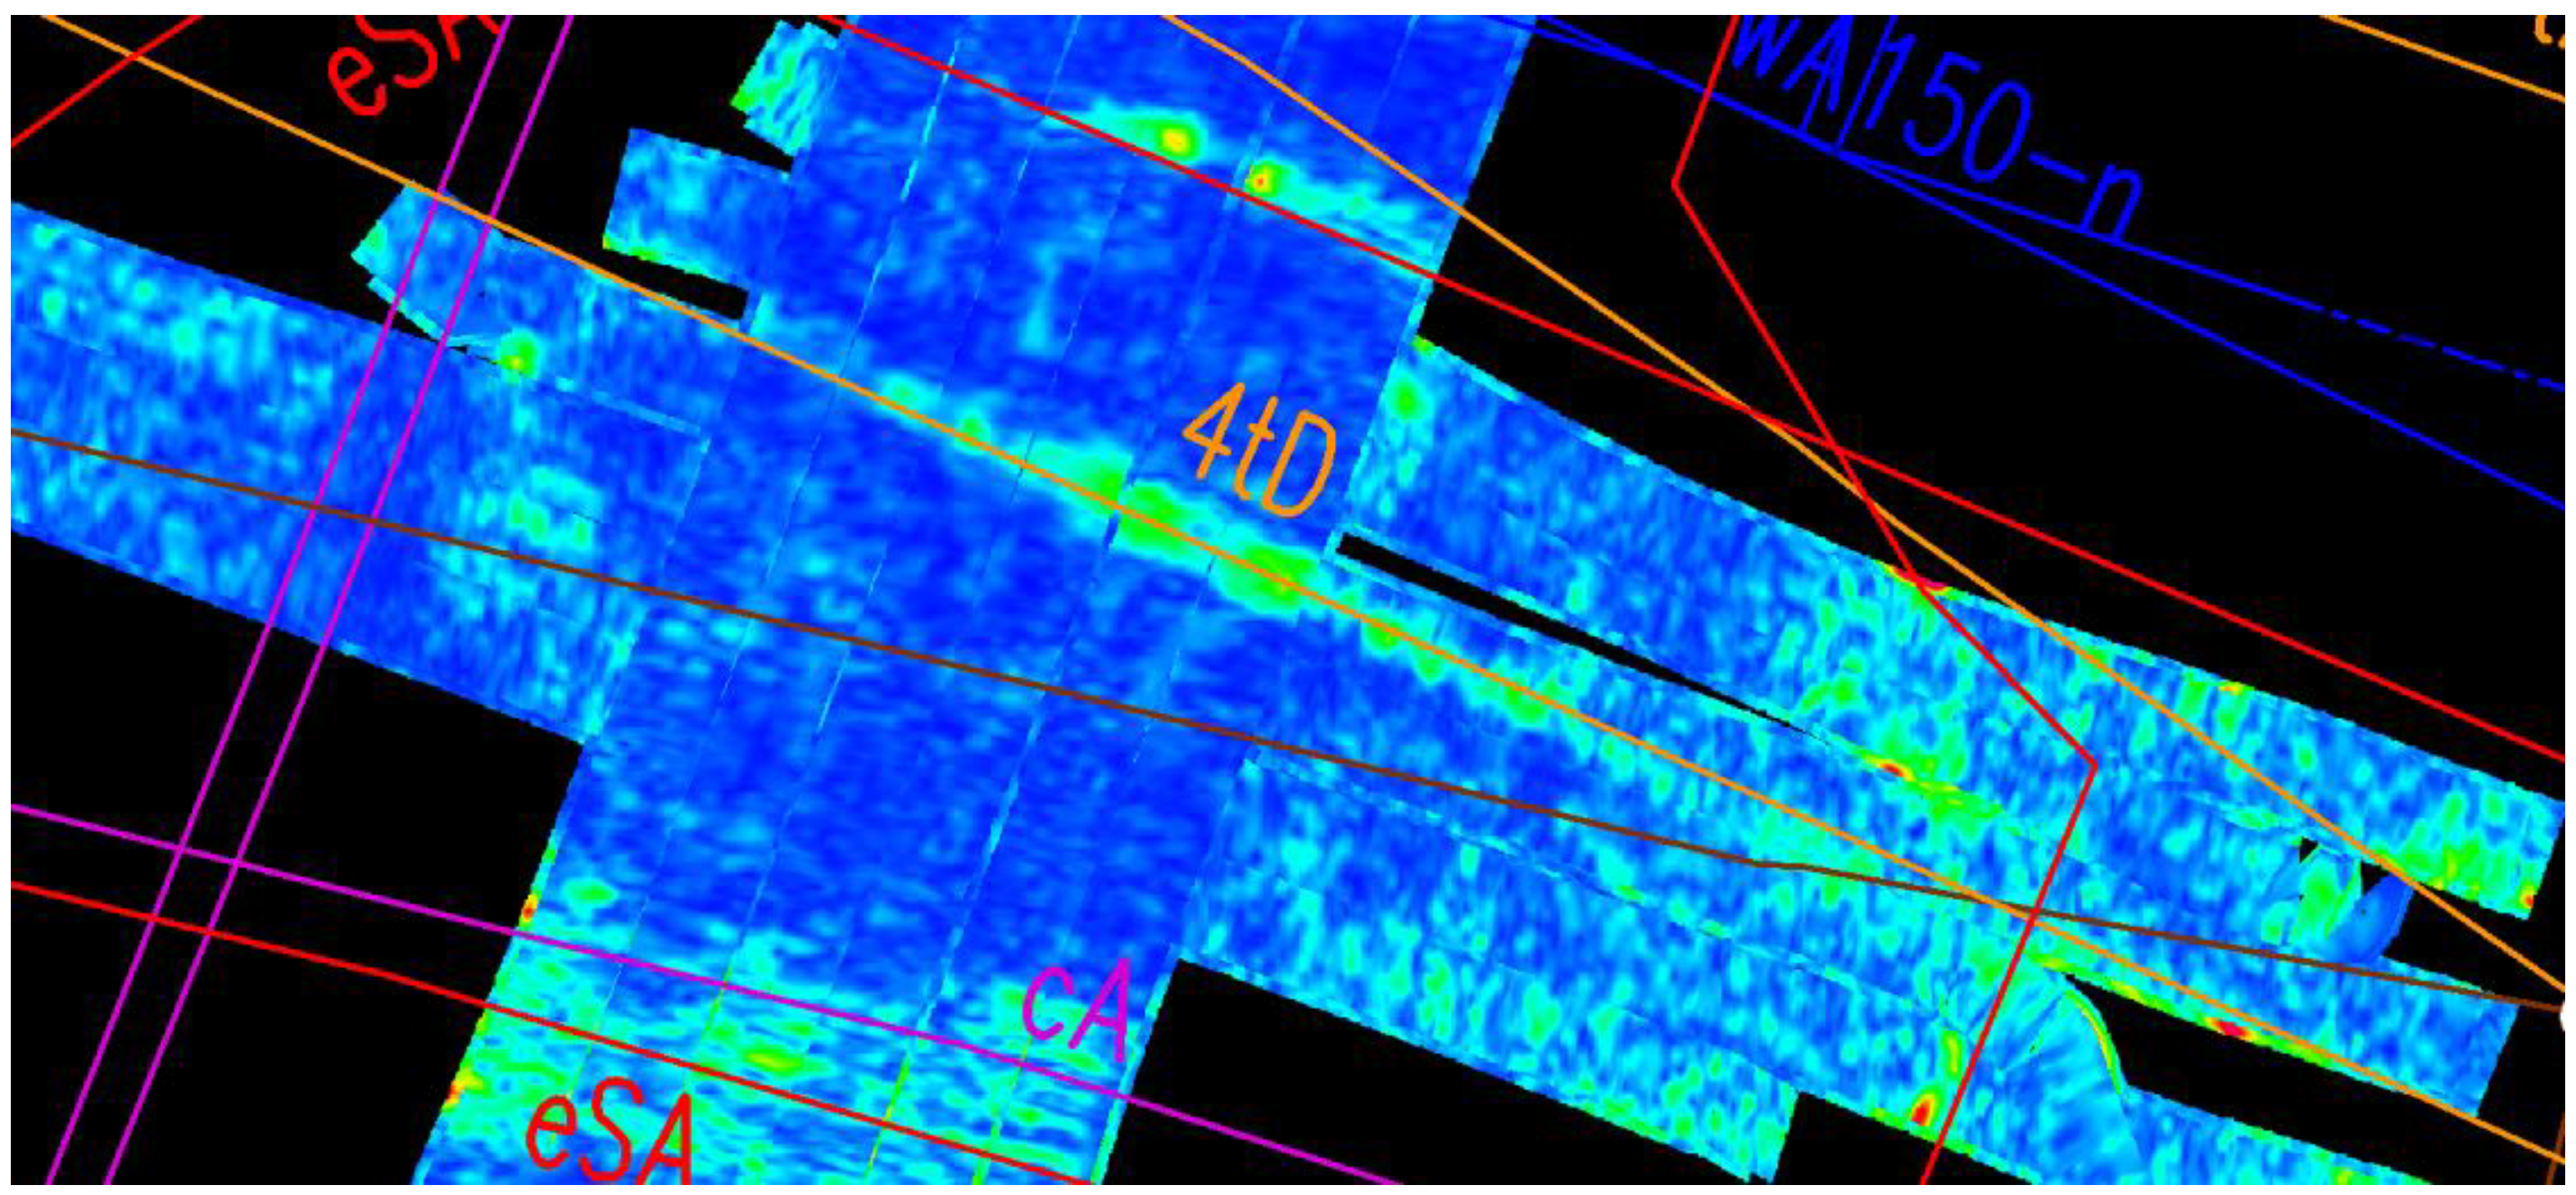
In the presented situations, the GPS-PPS solution allows high location accuracies to be achieved, however, there are some cases when this method does not provide the correct pass trajectory. While estimating the Leica Stream C GPR trajectory in the test measurement, a sudden change in direction caused twisting of the registered image in relation to the pass line. Similar instability of results caused by profile disruption was observed during the measurement of area A. Its outermost north pass ended in a place of curb lowering and the possibility to ride in that way was used to extend the measurement profile. An image obtained in that place could prove the breakpoint of the district heating direction (Figure 14a), which is not however reflected in cartographic data analysis and fragments of subsurface situation observations.
The GNSS solution is based on the signals from satellites visible on the horizon—the more of them and the better their geometric configuration, the better the measurement accuracy. On open spaces the conditions do not present any problems, but dense and tall architecture considerably limits horizon visibility and therefore has a negative impact on positioning accuracy using satellite receivers. During the measurement in urban conditions, the eastern part of area A was adjacent to a five-storey college building. The number of visible satellites in this place dropped to 6 and the solution gained DGPS (Differential Global Positioning System) status, while the measurements on open spaces were characterized with a number from 10 up to 14 of tracked satellites in RTK measurement mode. The decrease in accuracy is visible not only in the NMEA message but especially during visualization of collected data, which in areas of DGPS solution status are impossible to use (Figure 16a,b). In the areas of dense, multi-storey architecture, the solution based on the georeference using the total station worked much better, which is presented on Figure 16c,d. Thanks to proper positioning of echograms, it was possible to identify the utility which had not been correctly projected in the GPS PPS variant.
According to cartographic data, in the borders of areas A and B, 29 lines of underground utility networks are located. The echograms failed to identify 9 of them.
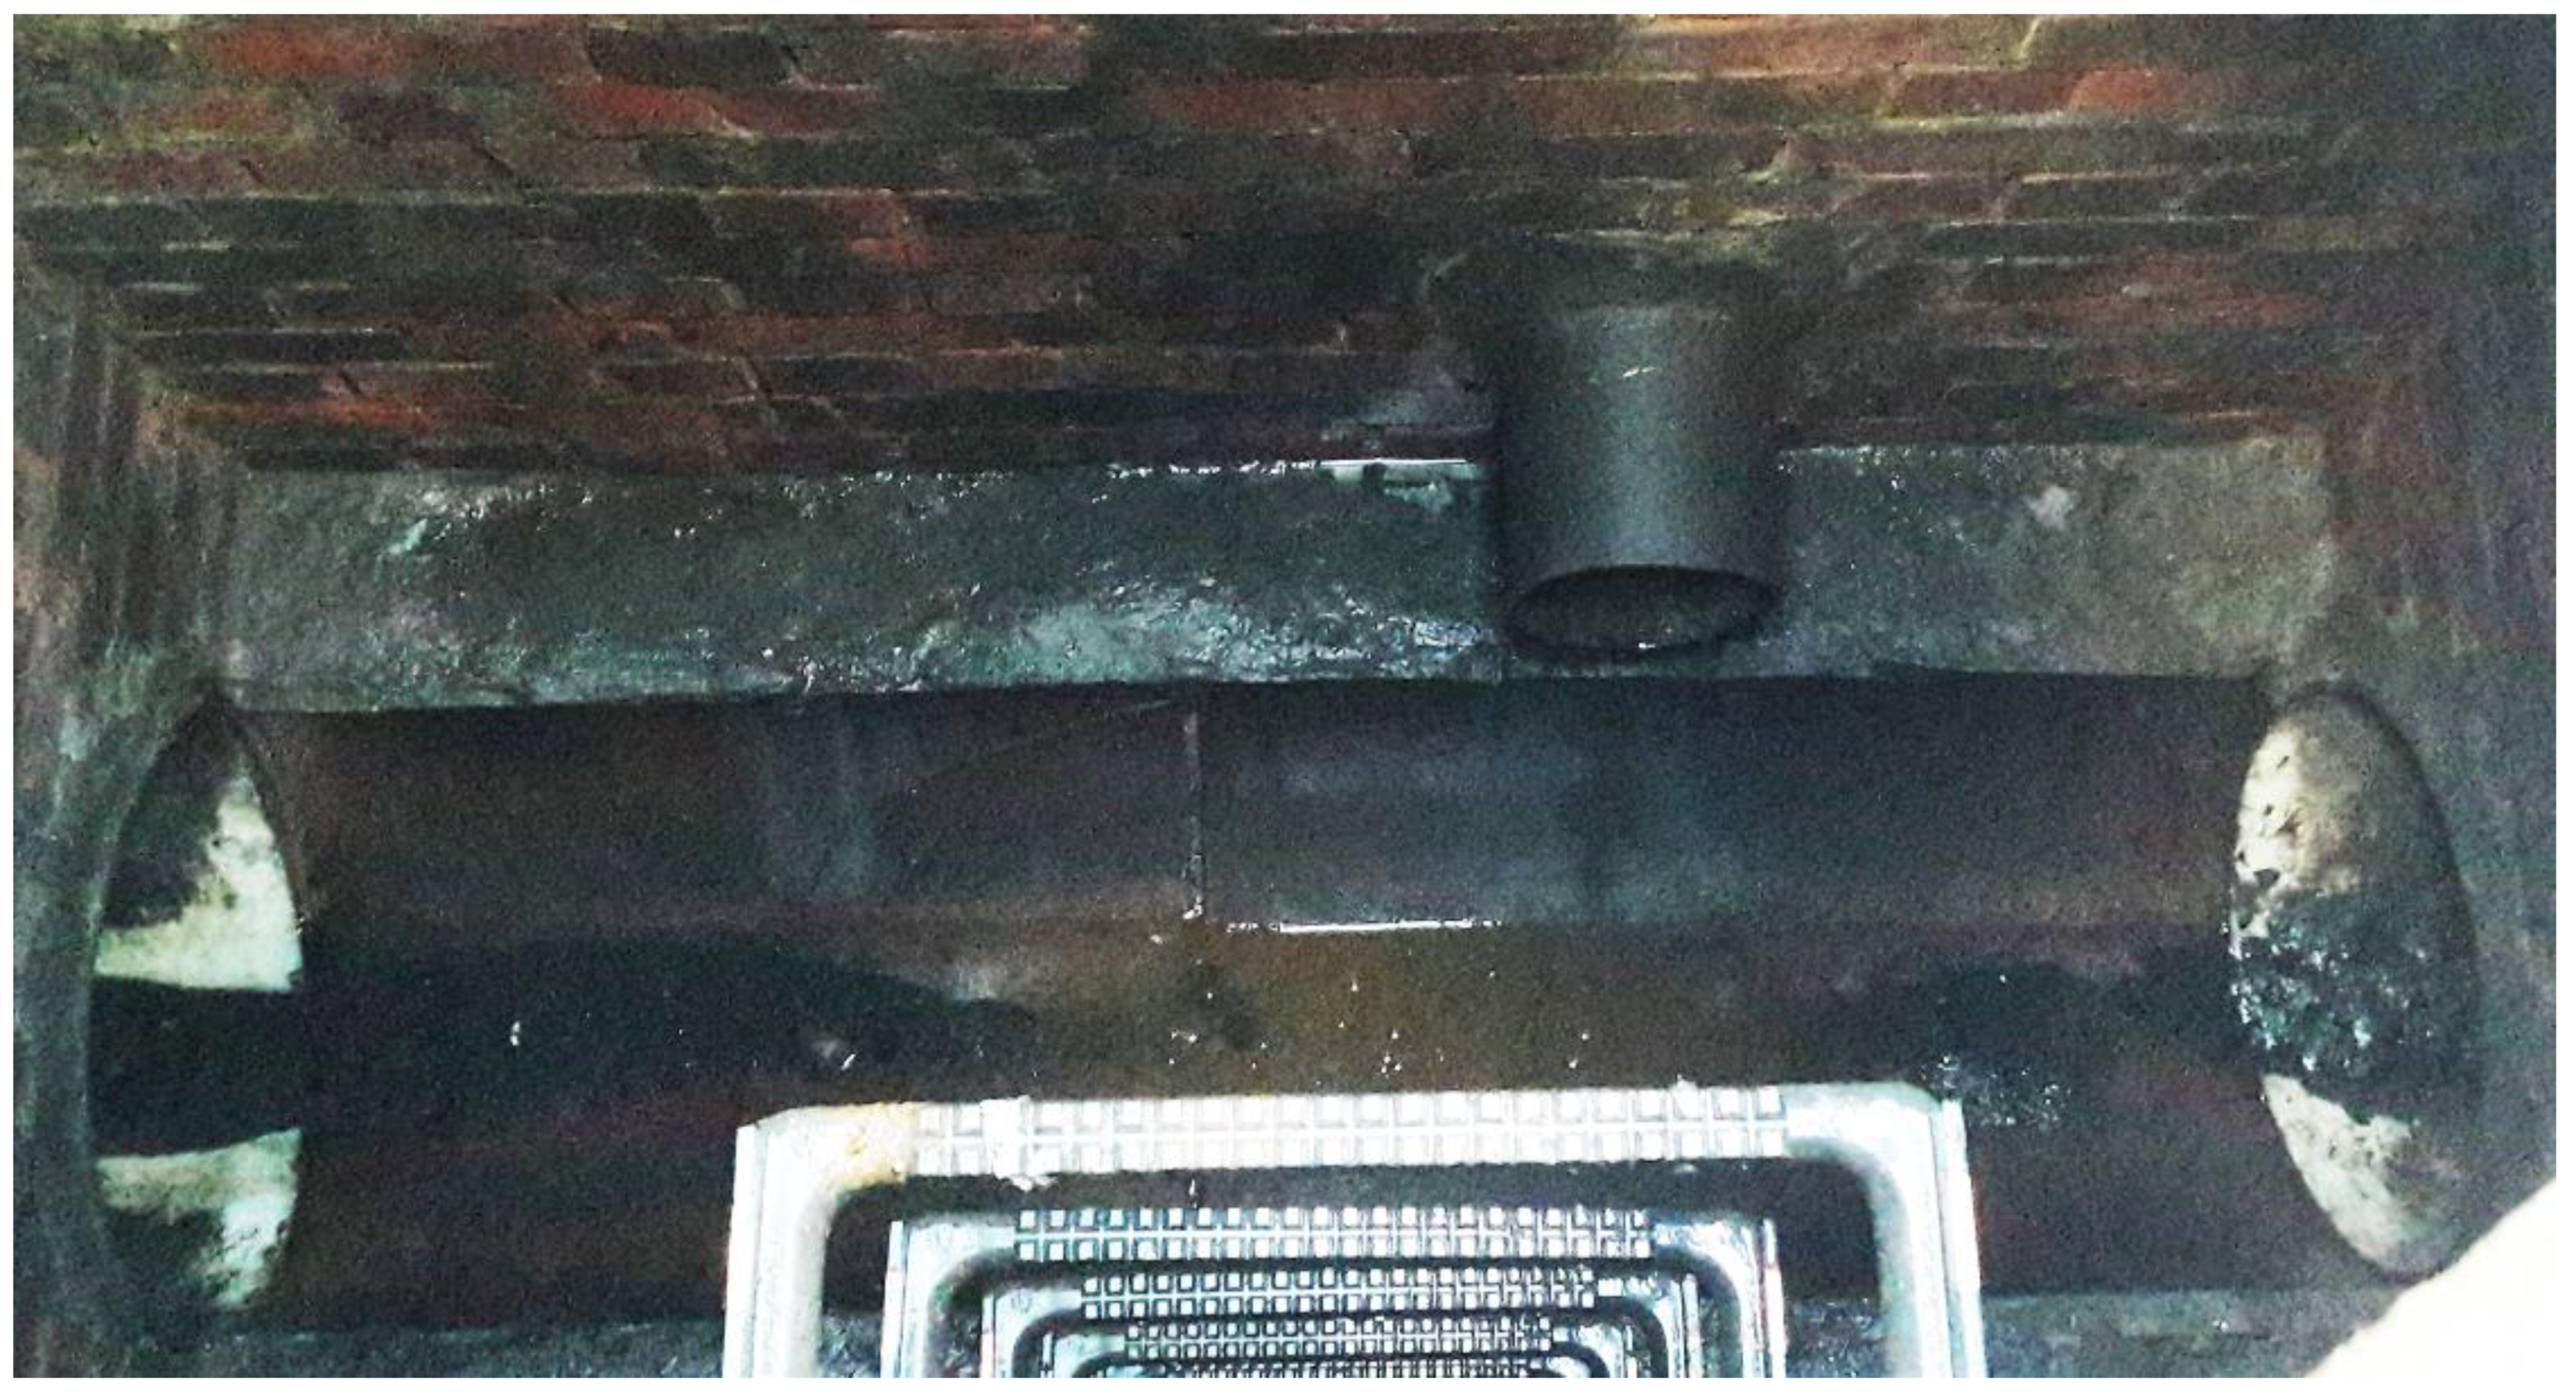
It was decided to verify more thoroughly the possibility of an incorrect record of the map using a visual inventory of the sewage network in order to check the occurrence of its main string and its two connections. The inventory confirmed their existence (Figure 17), although none of the elements were identified on GPR data. Measured depths of the pipelines in relation to the terrain, which reached from 1.65 m to 2.35 m, served as a reference during additional echogram analysis. It allowed us to determine that under the 130th ns of an echogram (about 1.3 m deep) data are much more noisy. This could be the result of applying the small number of stacks equal to 1, the only one available for users. For verification of the impact of the change of that parameter on GPR measurement results, MALA RAMAC GPR (Mala GeoScience, Mala, Sweden) with 500 MHz and 250 MHz antennas was used, increasing the number of stacks in successive passes in the range 1–64. According to the main principles of the electromagnetic wave propagation, increasing the antenna frequency decreases depth range, but has a positive impact on data resolution [27]:
where ∆R is the vertical resolution of an echogram, c is the speed of light, f is the center frequency of the antenna, and εr is the electric permeability of ground.
However, independently of the number of stacks and different antenna frequencies, the processed echograms under 1.30 m deep were also much noisier, and it was impossible to identify the sewage system in them. It cannot be therefore assumed that the other objects not identified in the echograms do not exist in the area.
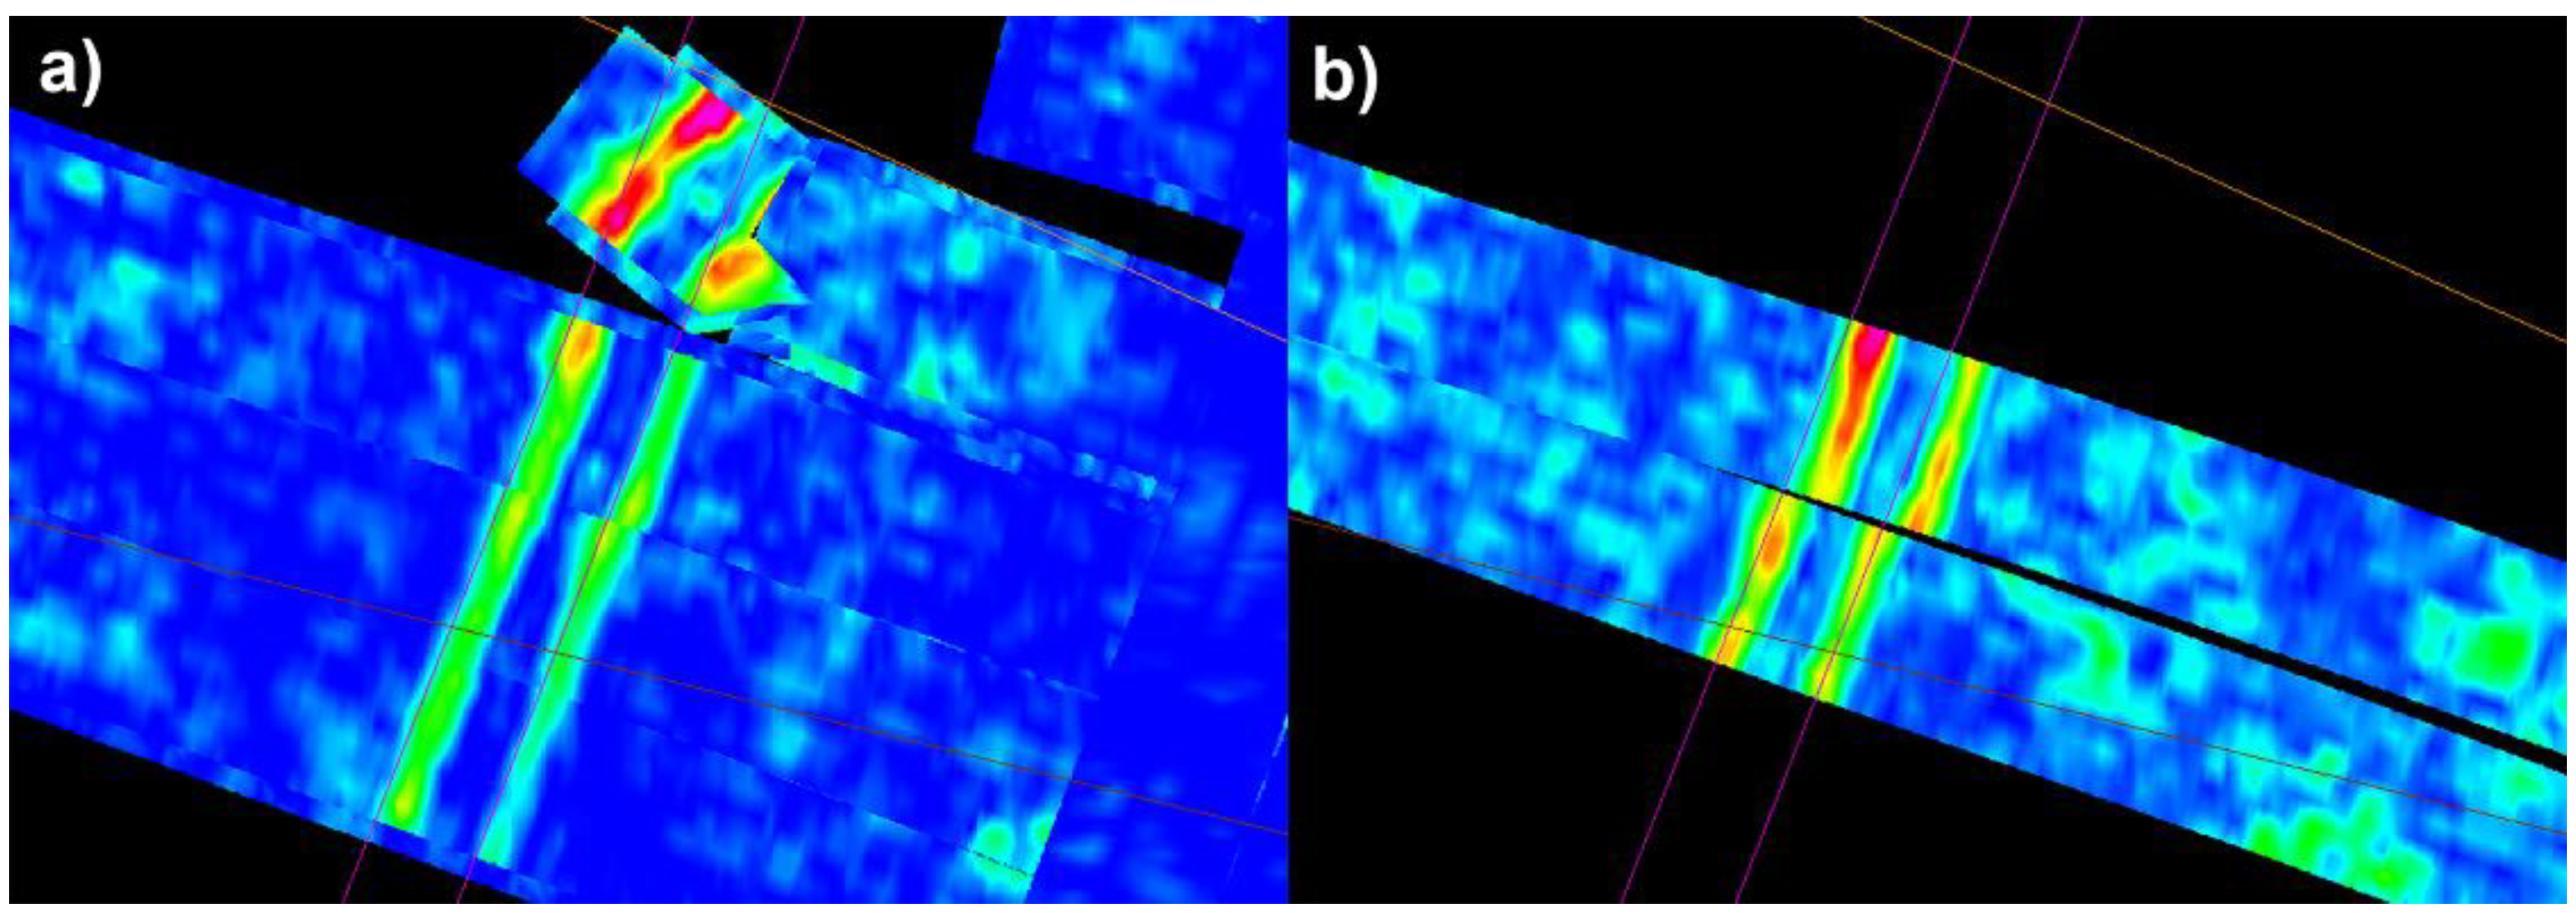
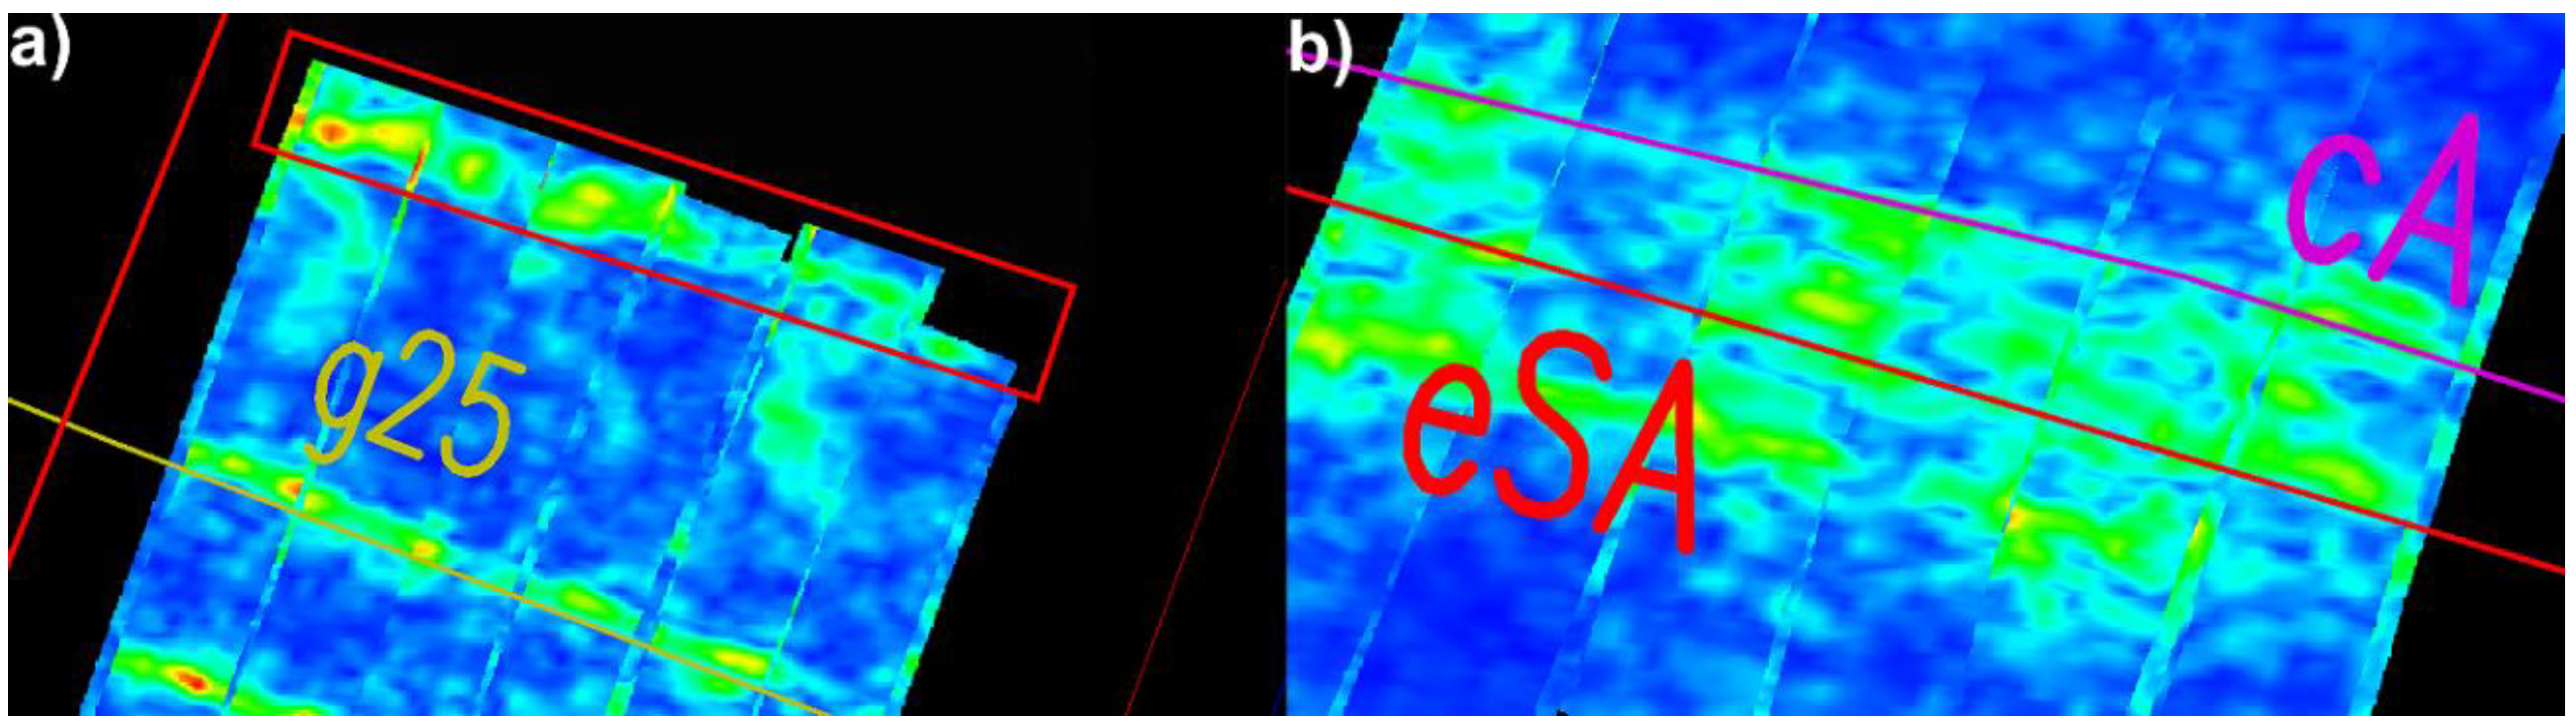
In area B, which was measured using GPS PPS and only GNSS RTN, both locating methods enabled the same pipes to be identified. Moreover, GPR images showed strong reflections of an additional linear object which does not exist on the map (Figure 18a). A sewage system and waterworks, whose inserted run is doubtful, were not identified though. In the place where the district heating line and power grid is located, strong reflections are visible, but the quality of data did not allow their vectorization (Figure 18b).
It should be underlined, however, that in the places where GPR passes were not burdened with an incorrect, shifted trajectory, the accuracy of vectorization results reached 3.4 cm, with the majority of differences not exceeding 2 cm. The fault of the last pass caused differences of 25 cm though (Figure 13). Both methods confirmed an incorrect run of two networks marked on the map as “unidentified” with differences of runs in the studied area even reaching 1.10 m. In the case of the other identified networks, differences reached approximately 13.8 cm for GPS PPS vectorization and 11.1 cm for GPS.
In the case of area A, passes using the total station enabled a power grid near the building to be identified which was not identified due to trajectory calculation errors from GPS PPS. Both solutions did not show the aforementioned sewage connections or two water connections and one gas connection. One fragment of the map also suggests the route of one district heating line and one power line, while the echograms clearly show three lines—it is probably therefore a double line of district heating system and a power line.
In the other cases, differences between the network routes on the map and GPR data vectorization positioned through GPS PPS and the total station reached approximately 9.6 cm and 11.3 cm. In the case of the total station, this is caused by a bigger angle of vectorized sections twisting in a relation to the vector from the map because of the faults of the adjacent GPR profiles.
4. Discussion
The performed research showed that the special advantage of a multi-channel GPR method, using the example of Leica Stream C, is the possibility to obtain high accuracies of the final products. The key is to choose a suitable positioning method depending on the infrastructure conditions of the measurement. Localization based on the GNSS satellite measurements assisted with additional time synchronization 1-PPS provides high consistency of the results of the adjacent passes as well as the intersecting perpendicularly ones, which translates into the vectorized networks localization errors equal to ±0.052 m. A solution based on GPS and total station measurement can be burdened with errors in the translation of adjacent profiles along the direction of the GPR movement, which causes difficulties in interpretation if the proper number of passes is not available. Positioning using a robotic total station gains an advantage over satellite solutions in places of poor visibility of horizon as in tall urban architecture.
The lack of efficiency in the recognition of sewage systems of considerable diameter located at depths possible to penetrate with the applied 600 MHz antenna is especially disappointing. It constitutes, however, another confirmation that statements of the British PAS128 standard are justified. Field reconnaissance is required before conducting an inventory of an underground utilities network and complementing GPR measurement with the use of an additional geophysical method. The lack of a correct scanning result, despite the modification of measurement parameters (like the number of stacks), leads to the conclusion that the GPR method, as an independent tool of verification of cartographic data, cannot be the basis for inference with an incorrect record of maps when it comes to inserted networks. However, this tool allows the accuracy of those records to be verified in terms of utilities which were identified on echograms.
It should not be forgotten that to ensure the best accuracy of GPR processing products, the choice of positioning method is crucial, as well as obtaining material in a way which enables clear vectorization of a network route. This is related to conducting a GPR pass according to the producer’s recommendation, which means setting the profiles closest to straight sections and in a number which ensures identification and elimination of the impact of adjacent profiles translation.
This publication focuses on determining the accuracy of data processing products obtained using a multi-channel GPR. For the Leica Stream C GPR, the results of localization and data consistency are satisfactory. However, the method of interpolating echograms to the 3D form in GRED HD is not known, so the impact of the selection and implementation of the processing algorithm on the final data quality cannot be assessed. The next stages of the authors’ research will concern the automation of B-scan processing, including interpolation into 3D form, as there is still a need to use single-channel units.
5. Conclusions
The main aim of this paper was to assess the accuracy of positioning of the multi-channel GPR Leica Stream C using three different georeferencing methods during measurement on a test field, where the basis to compare the GPR result was a drainage grill whose coordinates had been obtained using a surveying method. The RMSE = ±0.052 m for the GPS PPS method confirms the possibility of achieving high accuracy of determining the position of an underground utility using a multi-channel GPR. According to the satisfactory results on the test field, available cartographic data (of questionable accuracy) was confronted with Leica Stream C echograms as reference data on an urban area. The vector map was only kind of a background to present the capabilities of the described GPR with regards to the need for verification of the actual underground utility location.
The multi-channel GPR’s uniqueness is based on the assumption of the speed and continuity of achieved data. The possibility of easy insight into the subsurface situation by working in C-scan space is a valuable aspect while using the GPR method. A considerable limitation is, however, the size of such a solution. In places of intensified development and terrain facilities, the surface GPR pass becomes impossible. It causes the need to supplement the measurement using a classic single-channel solution.
The compromise between the speed of data acquisition and a small number of stacks in multi-channel units has not significantly affected the quality of the echograms and errors in the location of vectorized objects. The effectiveness of pipe identification on echograms depends mainly on soil conditions. Moreover, the accuracy of the final results depends on the selection of a georeferencing method appropriate for the field conditions of measurement and the accuracy of echogram vectorization. The automating of the GPR data processing will significantly accelerate data analysis and interpretation, minimizing the impact of the human factor on the final accuracy of the results. Nevertheless, with the use of the relevant configuration of the radar and surveying systems, the GPR method is already an appropriate tool for verifying the location of underground utility networks.
Author Contributions
Conceptualization, M.G. and Ł.O.; methodology, M.G. and Ł.O.; formal analysis, M.G. and Ł.O.; investigation, M.G. and Ł.O.; writing—original draft preparation, M.G. and Ł.O.; writing—review and editing, M.G. and Ł.O. All authors have read and agreed to the published version of the manuscript.
Funding
The article was prepared under the research subvention of AGH University of Science and Technology No. 16.16.150.545 in 2020.
Conflicts of Interest
The authors declare no conflict of interest.
References
- Owerko, P.; Ortyl, Ł.; Salamak, M. Identification of concrete voids in an untypical railway bridge pillar by Ground Penetrating Radar Method. Meas. Autom. Monit. 2015, 61, 76–80. [Google Scholar]
- Lai, W.W.; Chang, R.K.; Sham, J.F. A blind test of nondestructive underground void detection by ground penetrating radar (GPR). J. Appl. Geophys. 2018, 149, 10–17. [Google Scholar] [CrossRef]
- Benedetto, A.; Tosti, F.; Ciampoli, L.B.; D’Amico, F. An overview of ground-penetrating radar signal processing techniques for road inspections. Signal Process. 2017, 132, 201–209. [Google Scholar] [CrossRef]
- Pajewski, L.; Fontul, S.; Solla, M. Ground-penetrating radar for the evaluation and monitoring of transport infrastructures. In Innovation in Near-Surface Geophysics; Elsevier Science Publishing Co Inc.: Amsterdam, The Netherlands, 2019; pp. 341–398. ISBN 978-0-12-812429-1. [Google Scholar]
- Marecos, V.; Fontul, S.; Antunes, M.L.; Solla, M. Assessment of a concrete pre-stressed runway pavement with ground penetrating radar. In Proceedings of the 8th International Workshop on Advanced Ground Penetrating Radar (IWAGPR 2015), Florence, Italy, 7–10 July 2015; pp. 1–4. [Google Scholar]
- Owerko, P.; Ortyl, Ł.; Salamak, M. Identification of prestressing tendons using ground penetrating radar in particular the anchorage zone. In Proceedings of the 9th Central European Congress on Concrete Engineering (CCC2013), Wrocław, Poland, 4–6 September 2013; pp. 250–253. [Google Scholar]
- Gabryś, M.; Kryszyn, K.; Ortyl, Ł. GPR surveying method as a tool for geodetic verification of GESUT database of utilities in the light of BSI PAS128. Rep. Geod. Geoinform. 2019, 107, 49–59. [Google Scholar] [CrossRef] [Green Version]
- Karczewski, J.; Ortyl, Ł.; Pasternak, M. Zarys Metody Georadarowej; Wydawnictwa AGH: Kraków, Poland, 2011; ISBN 978-83-66016-35-4. [Google Scholar]
- Pasternak, M. Radarowa Penetracja Gruntu GPR; Wydawnictwo Komunikacji i Łączności: Warszawa, Poland, 2015; ISBN 978-83-206-1951-5. [Google Scholar]
- Skartados, E.; Kostavelis, I.; Giakoumis, D.; Simi, A.; Manacorda, G.; Ioannidis, D.; Tzovaras, D. Ground Penetrating Radar Image Processing Towards Underground Utilities Detection for Robotic Applications. In Proceedings of the 2018 International Conference on Control, Artificial Intelligence, Robotics & Optimization (ICCAIRO), Prague, Czech Republic, 19–21 May 2018; pp. 27–31. [Google Scholar]
- Al-Nuaimy, W.; Huang, Y.; Nakhkash, M.; Fang, M.; Nguyen, V.; Eriksen, A. Automatic detection of buried utilities and solid objects with GPR using neural networks and pattern recognition. J. Appl. Geophys. 2000, 43, 157–165. [Google Scholar] [CrossRef]
- Jiang, G.; Zhou, X.; Li, J.; Chen, H. A Cable-Mapping Algorithm Based on Ground-Penetrating Radar. IEEE Geosci. Remote Sens. Lett. 2019, 16, 1630–1634. [Google Scholar] [CrossRef]
- Šarlah, N.; Podobnikar, T.; Mongus, D.; Ambrožič, T.; Mušič, B. Kinematic GPR-TPS Model for Infrastructure Asset Identification with High 3D Georeference Accuracy Developed in a Real Urban Test Field. Remote Sens. 2019, 11, 1457. [Google Scholar] [CrossRef] [Green Version]
- Šarlah, N.; Podobnikar, T.; Ambrožič, T.; Mušič, B. Application of Kinematic GPR-TPS Model with High 3D Georeference Accuracy for Underground Utility Infrastructure Mapping: A Case Study from Urban Sites in Celje, Slovenia. Remote Sens. 2020, 12, 1228. [Google Scholar] [CrossRef] [Green Version]
- Kim, N.; Kim, S.; An, Y.-K.; Lee, J.-J. A novel 3D GPR image arrangement for deep learning-based underground object classification. Int. J. Pavement Eng. 2019, 1–12. [Google Scholar] [CrossRef]
- Kaufmann, M.S.; Klotzsche, A.; Vereecken, H.; Van Der Kruk, J. Simultaneous multi-channel GPR measurements for soil characterization. In Proceedings of the 2018 17th International Conference on Ground Penetrating Radar (GPR), Rapperswil, Switzerland, 18–21 June 2018; pp. 1–4. [Google Scholar]
- Muller, W. Self-correcting pavement layer depth estimates using 3D multi-offset ground penetrating radar (GPR). In Proceedings of the 15th International Conference on Ground Penetrating Radar, Brussels, Belgium, 30 June–4 July 2014; pp. 887–892. [Google Scholar]
- Wollschläger, U.; Gerhards, H.; Yu, Q.; Roth, K. Multi-channel ground-penetrating radar to explore spatial variations in thaw depth and moisture content in the active layer of a permafrost site. Cryosphere 2010, 4, 269–283. [Google Scholar] [CrossRef] [Green Version]
- Simonin, J.-M.; Baltazart, V.; Hoornych, P.; Dérobert, X.; Thibaut, E.; Sala, J.; Utsi, V. Case study of detection of artificial defects in an experimental pavement structure using 3D OPR systems. In Proceedings of the 15th International Conference on Ground Penetrating Radar, Brussels, Belgium, 30 June–4 July 2014; pp. 847–851. [Google Scholar]
- Boyes, W. Instrumentation Reference Book, 4th ed.; Butterworth-Heinemann: Burlington, NJ, USA, 2009; ISBN 978-0-7506-8308-1. [Google Scholar]
- Jaw, S.W.; Hashim, M. Locational accuracy of underground utility mapping using ground penetrating radar. Tunn. Undergr. Space Technol. 2013, 35, 20–29. [Google Scholar] [CrossRef]
- Kuras, P.; Ortyl, Ł.; Kędzierski, M.; Podstolak, P. Vibration measurements of steel chimneys equipped with mass dampers, using interferometric radar, robotic total station and accelerometer. Pomiary Autom. Kontrola. 2014, 60, 1090–1095. [Google Scholar]
- Ortyl, Ł. Assessing of the effect of selected parameters of GPR surveying in diagnosis of the condition of road pavement structure. Meas. Autom. Monit. 2015, 61, 140–147. [Google Scholar]
- Ortyl, Ł. Artykuły Naukowe Geometryzacja form zjawisk krasowych na podstawie badań metodą georadarową. Przegląd Geol. 2019, 67, 252–269. [Google Scholar] [CrossRef]
- Boniger, U.; Tronicke, J. On the Potential of Kinematic GPR Surveying Using a Self-Tracking Total Station: Evaluating System Crosstalk and Latency. IEEE Trans. Geosci. Remote Sens. 2010, 48, 3792–3798. [Google Scholar] [CrossRef]
- Scott, A.W. Understanding Microwaves; John Wiley & Sons Inc.: New York, NY, USA, 1993; ISBN 0-471-57567-4. [Google Scholar]
- Annan, P.A. Ground Penetrating Radar: Principles, Procedures & Applications; Sensors & Software Inc.: Mississauga, ON, Canada, 2003. [Google Scholar]
Figure 1.
Shaping of buried object picture on echograms.

Figure 2.
Ground Penetrating Radar (GPR) Leica Stream C: (a) during test measurement; (b) in urban area.
Figure 2.
Ground Penetrating Radar (GPR) Leica Stream C: (a) during test measurement; (b) in urban area.

Figure 3.
Diagram of Leica Stream C GPR antennas configuration.

Figure 4.
Applied parameters of filtration and interpolation of localising data in GRED HD software.
Figure 4.
Applied parameters of filtration and interpolation of localising data in GRED HD software.

Figure 5.
Workspace of GRED HD 3D module.

Figure 6.
Location and scheme of the test basis.

Figure 7.
Implemented variants of GPR profiling: (a) parallel, (b) irregular.

Figure 8.
Sketch of measurement location in real condition.

Figure 9.
Resulting C-scans for parallel passes positioned with the use of: (a) GPS PPS (b) GPS and (c) the total station—with the scanned drainage grille in the background.
Figure 9.
Resulting C-scans for parallel passes positioned with the use of: (a) GPS PPS (b) GPS and (c) the total station—with the scanned drainage grille in the background.

Figure 10.
Resulting C-scans for irregular passes positioned with the use of (a) GPS PPS and (b) GPS. The axis of the scanned drainage grille is presented in the background.
Figure 10.
Resulting C-scans for irregular passes positioned with the use of (a) GPS PPS and (b) GPS. The axis of the scanned drainage grille is presented in the background.

Figure 11.
Resulting C-scan of irregular pass positioned with the use of total station with the axis of the drainage grille in the background.
Figure 11.
Resulting C-scan of irregular pass positioned with the use of total station with the axis of the drainage grille in the background.

Figure 12.
Relation between echogram shape and direction of the turning for positioning using GPS PPS—(a) right turn, (b) left turn—and GPS—(c) right turn, (d) left turn.
Figure 12.
Relation between echogram shape and direction of the turning for positioning using GPS PPS—(a) right turn, (b) left turn—and GPS—(c) right turn, (d) left turn.

Figure 13.
Analogical fragments of GPR echograms, positioned using (a,b) GPS PPS and (c,d) GPS.

Figure 14.
Results of the pass over the district heating network localised by (a) GPS PPS and (b) total station.
Figure 14.
Results of the pass over the district heating network localised by (a) GPS PPS and (b) total station.

Figure 15.
Consistency of GPR data on the intersection of two perpendicular areas A and B on an example of a telecommunication network.
Figure 15.
Consistency of GPR data on the intersection of two perpendicular areas A and B on an example of a telecommunication network.

Figure 16.
Comparison of trajectories obtained in limited horizon conditions by (a,b) GPS PPS and (c,d) total station.
Figure 16.
Comparison of trajectories obtained in limited horizon conditions by (a,b) GPS PPS and (c,d) total station.

Figure 17.
Visual inventory of a sewage drain with visible main string and transverse connection.

Figure 18.
(a) The linear element identified in the echogram but not present on the map, (b) the C-scan view at the location of the heating and power network.
Figure 18.
(a) The linear element identified in the echogram but not present on the map, (b) the C-scan view at the location of the heating and power network.


Table 1.
Overview of GPR data vectorization distances in relation to the test base and drainage grille.
Table 1.
Overview of GPR data vectorization distances in relation to the test base and drainage grille.
| Positioning Variant | Difference ∆d [cm] | Type of Base |
|---|---|---|
| GPS PPS | 8 | metal tape |
| 7 | ||
| 7 | ||
| 7 | ||
| 5 | ||
| 5 | ||
| 5 | ||
| 5 | ||
| 3 | ||
| 3 | ||
| 6 | ||
| 5 | ||
| GPS PPS | 4 | drainage grille |
| 3 | ||
| 3 | ||
| 3 | ||
| GPS | −5 | |
| 1 | ||
| Total station | 1 | |
| 5 |
© 2020 by the authors. Licensee MDPI, Basel, Switzerland. This article is an open access article distributed under the terms and conditions of the Creative Commons Attribution (CC BY) license (http://creativecommons.org/licenses/by/4.0/).
Share and Cite
MDPI and ACS Style
Gabryś, M.; Ortyl, Ł. Georeferencing of Multi-Channel GPR—Accuracy and Efficiency of Mapping of Underground Utility Networks. Remote Sens. 2020, 12, 2945. https://doi.org/10.3390/rs12182945
AMA Style
Gabryś M, Ortyl Ł. Georeferencing of Multi-Channel GPR—Accuracy and Efficiency of Mapping of Underground Utility Networks. Remote Sensing. 2020; 12(18):2945. https://doi.org/10.3390/rs12182945
Chicago/Turabian StyleGabryś, Marta, and Łukasz Ortyl. 2020. "Georeferencing of Multi-Channel GPR—Accuracy and Efficiency of Mapping of Underground Utility Networks" Remote Sensing 12, no. 18: 2945. https://doi.org/10.3390/rs12182945
Note that from the first issue of 2016, this journal uses article numbers instead of page numbers. See further details here.