First Measurements of Gas Flux with a Low-Cost Smartphone Sensor-Based UV Camera on the Volcanoes of Northern Chile

 ,
,  , , , ,
  , , and
Abstract
:
1. Introduction
2. Geological and Volcanological Settings
2.1. Central Volcanic Zone
2.2. Study Cases
3. Methodology
3.1. PiCam UV Camera
3.2. Fieldwork
3.3. Post Processing
3.4. Estimation of the PiCam UV Camera Uncertainties
4. Results
5. Discussions
5.1. External/Internal Effects during Measuring and Post Processing Methods Comparison
5.2. Comparison with Previous Measurements from Other Ground-Based Remote Techniques
5.3. Volcanological Implications of the SO2 Emission Rates
6. Conclusions
Supplementary Materials
Author Contributions
Funding
Acknowledgments
Conflicts of Interest
References
- Gliß, J.; Stebel, K.; Kylling, A.; Sudbo, A. Improved optical flow velocity analysis in SO2 camera images of volcanic plumes—Implications for emission-rate retrievals investigated at Mt Etna, Italy and Guallatiri, Chile. Atmos. Meas. Tech. 2018, 11, 781–801. [Google Scholar] [CrossRef] [Green Version]
- Giggenbach, W. Chemical composition of volcanic gases. In Monitoring and mitigation of Volcano Hazards; Scarpa, R., Tilling, R., Eds.; Springer-Verlag: Berlin, Germany, 1996; pp. 222–256. [Google Scholar]
- Symonds, R.B.; Rose, W.I.; Bluth, G.J.S.; Gerlach, T.M. Volcanic gas studies: Methods, results and applications. In Volatiles in Magmas; Carroll, M.R., Hollaway, J.R., Eds.; Mineralogical Society of America: Washington, DC, USA, 1994; pp. 1–66. [Google Scholar]
- Smekens, J.F.; Burton, M.R.; Clarke, A. Validation of the SO2 camera for high temporal and spatial resolution monitoring of SO2 emissions. J. Volcanol. Geotherm. Res. 2015, 300, 37–47. [Google Scholar] [CrossRef]
- Rodríguez, L.; Nadeau, P. Resumen de las principales técnicas de percepción remota usadas en volcanes para monitorear las emisiones de gas en la superficie. Rev. Geol. Am. Central. 2015, 52, 67–105. [Google Scholar]
- Krotkov, N.A.; Torres, O.; Seftor, C.; Krueger, A.J.; Rose, W.; Kostinski, A.; Bluth, G.; Schneider, D.; Schaefer, S.J. Comparison of TOMS and AVHRR volcanic ash retrievals from the August 1992 eruption of Mt. Spurr. Geophys. Res. Lett. 1999, 26, 455–458. [Google Scholar] [CrossRef] [Green Version]
- Carn, S.A.; Krueger, A.J.; Bluth, G.S.J.; Schaefer, S.J.; Krotkov, N.A.; Watson, I.M.; Datta, S. Volcanic eruption detection by the Total Ozone Mapping Spectrometer (TOMS) instruments: A 22-year record of sulphur dioxide and ash emissions. In Volcanic Degassing; Oppenheimer, C., Pyle, D.M., Barclay, J., Eds.; Geological Society: London, UK, 2003; pp. 177–202. [Google Scholar]
- Carn, S.; Kroktov, N.; Yang, K.; Krueger, A. Measuring global volcanic degassing with the Ozone Monitoring Instrument (OMI). In Remote Sensing of Volcanoes and Volcanic Processes: Integrating Observation and Modelling; Mather, T., Biggs, J., Eds.; Geological Society: London, UK, 2013; Volume 380. [Google Scholar]
- Carn, S.; Fioletov, V.; McLinden, C.; Li, C.; Krotov, N. A decade of global volcanic SO2 emissions measured from space. Sci. Rep. Sci. Rep. 2017, 7, 44095. [Google Scholar] [CrossRef] [PubMed] [Green Version]
- Moussallam, Y.; Peters, N.; Masias, P.; Apaza, F.; Barnie, T.; Schipper, C.I.; Curtis, A.; Tamburello, G.; Aiuppa, A.; Bani, P.; et al. Magmatic gas percolation through the old lava dome of El Misti volcano. Bull. Volcanol. 2017, 79, 46. [Google Scholar] [CrossRef] [PubMed]
- Vaselli, O.; Tassi, F.; Montegrossi, G.; Capaccioni, B.; Giannini, L. Sampling and analysis of fumarolic gases. Acta Vulcanol. 2006, 18, 65–76. [Google Scholar]
- Caltabiano, T.; Romano, R.; Budetta, G. SO2 measurements at Mount Etna, Sicily. J. Volcanol. Geotherm. Res. 1994, 99, 12.809–12.811. [Google Scholar]
- Galle, B.; Oppenheimer, C.; Geyer, A.; McGonigle, A.J.S.; Edmonds, M.; Horrocks, L.A. A miniaturised UV spectrometer for remote sensing of SO2 fluxes: A new tool for volcano surveillance. J. Volcanol. Geotherm. Res. 2003, 119, 241–254. [Google Scholar] [CrossRef]
- McGonigle, A.J.S.; Oppenheimer, C.; Galle, B.; Mather, T.A.; Pyle, D.M. Walking traverse and scanning DOAS measurements of volcanic gas emission rates. Geophys. Res. Lett. 2002, 29, 1985. [Google Scholar] [CrossRef]
- Oppenheimer, C.; Bani, P.; Calkins, J.A.; Burton, M.R.; Sawyer, G.M. Rapid FTIR sensing of volcanic gases released by strombolian explosions at Yasur volcano, Vanuatu. Appl. Phys. B 2006, 85, 453–460. [Google Scholar] [CrossRef]
- Mori, T.; Notsu, K. Temporal variation in Chemicals composition of the volcanic plume from Aso volcano, Japan, measured by remote FTIR spectroscopy. Geochem. J. 2008, 42, 133–140. [Google Scholar] [CrossRef]
- Prata, A.J.; Bernardo, C. Retrieval of sulphur dioxide from a ground-based thermal infrared Imaging camera. Atmos. Meas. Tech. 2014, 7, 1153–1211. [Google Scholar] [CrossRef]
- Kern, C.; Lubcke, P.; Bobrowski, N.; Campion, R.; Mori, T.; Smekens, J.F.; Stebel, K.; Tamburello, G.; Burton, M.R.; Platt, U.; et al. Intercomparison of SO2 camera systems for imaging volcanic gas plumes. J. Volcanol. Geotherm. Res. 2015, 300, 22–36. [Google Scholar] [CrossRef]
- Calabrese, S.; Aiuppa, S.; Allard, P.; Bagnato, E.; Bellomo, S.; Brusca, L.; D’Alessandro, W.; Parello, F. Atmospheric sources and sinks of volcanogenic elements in a basaltic volcano (Etna, Italy). Geochim. Cosmochim. Acta 2011, 75, 7401–7425. [Google Scholar] [CrossRef]
- Mather, T.A.; Witt, M.L.I.; Pyle, D.M.; Quayle, B.M.; Aiuppa, A.; Bagnato, E.; Martin, R.S.; Sims, K.W.W.; Edmonds, M.; Sutton, A.J.; et al. Halogens and trace metal emissions from the ongoing 2008 summit eruption of Kīlauea volcano, Hawai’i. Geochim. Cosmochim. Acta 2012, 83, 292–323. [Google Scholar] [CrossRef]
- McElhoe, H.B.; Conner, W.D. Remote Measurement of Sulfur dioxide emissions using an Ultraviolet Light sensitive video system. J. Air Pollut. Control Assoc. 1986, 36, 42–47. [Google Scholar] [CrossRef]
- Mori, T.; Burton, M.R. The SO2 camera: A simple, fast and cheap method for ground-based imaging of SO2 in volcanic plumes. Geophys. Res. Lett. 2006, 33, L24804. [Google Scholar] [CrossRef]
- Bluth, G.; Shannon, J.; Watson, I.M.; Prata, A.J.; Realmuto, V. Development of an ultra-violet digital camera for volcanic SO2 imaging. J. Volcanol. Geotherm. Res. 2007, 161, 47–56. [Google Scholar] [CrossRef]
- Moussallam, Y.; Bani, P.; Curtis, A.; Barnie, T.; Moussallam, M.; Peters, N.; Schipper, C.I.; Aiuppa, A.; Giudice, G.; Amigo, Á.; et al. Sustaining persistent lava lakes: Observations from high-resolution gas measurements at Villarrica volcano, Chile. Earth Planet. Sci. Lett. 2016, 454, 237–247. [Google Scholar] [CrossRef]
- Pering, T.D.; McGonigle, A.J.S.; James, M.R.; Tamburello, G.; Aiuppa, A.; Delle Donne, D.; Ripepe, M. Conduit dynamics and post explosion degassing on Stromboli: A combined UV camera and numerical modelling treatment. Geophys. Res. Lett. 2016, 43, 5009–5016. [Google Scholar] [CrossRef] [PubMed] [Green Version]
- Delle Donne, D.; Ripepe, M.; Lacanna, G.; Tamburello, G.; Bitetto, M.; Aiuppa, A. Gas mass derived by infrasound and UV cameras: Implications for mass flow rate. J. Volcanol. Geotherm. Res. 2016, 325, 169–178. [Google Scholar] [CrossRef]
- Kazahaya, R.; Mori, T.; Takeo, M.; Ohminato, T.; Urabe, T.; Maeda, Y. Relation between single very-long-period pulses and volcanic gas emissions at Mt. Asama, Japan. Geophys. Res. Lett. 2011, 38, L11307. [Google Scholar] [CrossRef]
- Nadeau, P.A.; Palma, J.L.; Waite, G.P. Linking volcanic tremor, degassing, and eruption dynamics with SO2 imaging. Geophys. Res. Lett. 2011, 38, L013404. [Google Scholar] [CrossRef]
- Burton, M.R.; Salerno, G.G.; D’Auria, L.; Caltabiano, T.; Murè, F.; Maugeri, R. SO2 flux monitoring at Stromboli with the new permanent INGV SO2 camera system: A comparison with the FLAME network and seismological data. J. Volcanol. Geotherm. Res. 2015, 300, 95–102. [Google Scholar] [CrossRef]
- Wilkes, T.C.; McGonigle, A.J.S.; Pering, T.D.; Taggart, A.J.; White, B.S.; Bryant, R.G.; Willmott, J.R. Ultraviolet imaging with low cost smartphone sensors: Development and application of a raspberry Pi-based UV camera. Sensors 2016, 16, 1649. [Google Scholar] [CrossRef] [PubMed] [Green Version]
- Wilkes, T.C.; Pering, T.D.; McGonigle, A.J.S.; Tamburello, G.; Willmott, J.R. A low-cost smartphone sensor-based UV camera for volcanic SO2 emission measurements. Remote Sens. 2017, 9, 27. [Google Scholar] [CrossRef] [Green Version]
- Tassi, F.; Aguilera, F.; Vaselli, O.; Medina, E.; Tedesco, D.; Huertas, A.D.; Poreda, R.; Kojima, S. The magmatic-and hydrothermal-dominated fumarolic system at the active crater of Lascar volcano, northern Chile. Bull. Volcanol. 2009, 71, 171–183. [Google Scholar] [CrossRef]
- Tassi, F.; Aguilera, F.; Vaselli, O.; Darrah, T.; Medina, E. Gas discharges from four remote volcanoes in northern Chile (Putana, Olca, Irruputuncu and Alitar): A geochemical survey. Ann. Geophys. Italy 2011, 54, 121–136. [Google Scholar]
- Capaccioni, B.; Aguilera, F.; Tassi, F.; Darrah, T.; Poreda, R.; Vaselli, O. Geochemical and isotopic evidences of magmatic inputs in the hydrothermal reservoir feeding the fumarolic discharges of Tacora volcano (northern Chile). J. Geotherm. Res. 2011, 208, 77–85. [Google Scholar] [CrossRef]
- Aguilera, F.; Tassi, F.; Darrah, T.; Moune, S.; Vaselli, O. Geochemical model of a magmatic hydrothermal system at the Lastarria volcano, northern Chile. Bull. Volcanol. 2012, 74, 119–134. [Google Scholar] [CrossRef]
- Menard, G.; Moune, S.; Vlastélic, I.; Aguilera, F.; Valade, S.; Bontemps, M.; González, R. Gas and aerosol emissions from Lascar volcano (Northern Chile): Insights into the origen of gases and their links with the volcanic activity. J. Volcanol. Geotherm. Res. 2014, 287, 51–67. [Google Scholar] [CrossRef]
- Andres, R.; Rose, W.; Kyle, P.; de Silva, S.; Francis, P.; Gardeweg, M.; Moreno, H. Excessive sulfur dioxide emissions from Chilean volcanoes. J. Volcanol. Geotherm. Res. 1991, 46, 323–329. [Google Scholar] [CrossRef]
- Mather, T.; Tsanev, V.I.; Pyle, D.M.; McGonigle, A.J.S.; Oppenheimer, C.; Allen, A.G. Characterization and evolution of tropospheric plumes from Lascar and Villarrica volcanoes, Chile. J. Geophys. Res. 2004, 109, D21303. [Google Scholar] [CrossRef]
- Geoffroy, C. Estimación de la emisión de dióxido de azufre en penachos volcánicos mediante una cámara ultravioleta. Undergraduate Thesis, Universidad de Chile, Santiago, Chile, 2014. Available online: http://repositorio.uchile.cl/bitstream/handle/2250/117055/cf-geoffroy_cg.pdf?sequence=1&isAllowed=y (accessed on 30 June 2020).
- Tamburello, G.; Hansteen, T.H.; Bredemeyer, S.; Aiuppa, A.; Tassi, F. Gas emissions from five volcanoes in northern Chile and implications for the volatiles budget of the Central Volcanic Zone. Geophys. Res. Lett. 2014, 41, 4961–4969. [Google Scholar] [CrossRef]
- Stebel, K.; Amigo, A.; Thomas, H.E.; Prata, A.J. First estimates of fumarolic SO2 fluxes from Putana volcano, Chile, using an ultraviolet imaging camera. J. Volcanol. Geotherm. Res. 2015, 300, 112–120. [Google Scholar] [CrossRef] [Green Version]
- Lopez, T.; Aguilera, F.; Tassi, F.; de Moore, M.J.; Bobrowski, N.; Aiuppa, A.; Tamburello, G.; Rizzo, A.; Liuzzo, M.; Viveiros, F.; et al. New constraints on the magmatic-hydrothermal system and volatile budget of Lastarria Volcano, Chile: Integrated results from the 2014 IAVCEI CCVG 12th Volcanic Gas Workshop. Geosphere 2018, 14, 983–1007. [Google Scholar] [CrossRef] [Green Version]
- DeMets, C.; Gordon, R.G.; Argus, D.F.; Stein, S. Current plate motions. Geophys. J. Int. 1990, 101, 425–478. [Google Scholar] [CrossRef] [Green Version]
- Stern, C.; Moreno, H.; López-Escobar, L.; Clavero, J.; Lara, L.; Naranjo, J.; Parada, M.; Skewes, M. Chilean volcanoes. In The Geology of Chile; Moreno, T., Gibbons, W., Eds.; The Geological Society: London, UK, 2007; pp. 147–178. [Google Scholar]
- Syracuse, E.M.; Abers, G.A. Global compilation of variations in slab depth beneath arc volcanoes and implications. Geochem. Geophys. Geosyst. 2006, 7, 1–18. [Google Scholar] [CrossRef]
- Stern, C.R. Active Andean volcanism: Its geologic and tectonic setting. Rev. Geol. Chile 2004, 31, 161–206. [Google Scholar] [CrossRef]
- de Silva, S.L.; Francis, P.W. Volcanoes of the central Andes; Springer-Verlag: Heidelberg, Germany, 1991; p. 216. [Google Scholar]
- González-Ferran, O. Volcanes de Chile; Instituto Geográfico Militar: Santiago, Chile, 1995; p. 639.
- Siebert, L.; Simkin, T.; Kimberly, P. Volcanoes of the World, 3rd ed.; University of California Press: Berkeley, CA, USA, 2010; p. 551. [Google Scholar]
- Lucassen, F.; Becchio, R.; Kasemann, S.; Franz, G.; Trumbull, R.; Wilke, H.; Romer, R.; Dulski, F. Composition and density model of the continental crust at an active continental margin- the Central Andes between 21° and 27°S. Tectonophysics 2001, 341, 195–223. [Google Scholar] [CrossRef]
- Wörner, G.; Hammerschmidt, K.; Henjes-Kunst, F.; Lezaun, J.; Wilke, H. Geochronology (40Ar/39Ar, K-Ar and He-exposure ages) of Cenozoic magmatic rocks from northern Chile (18–22 S): Implications for magmatism and tectonic evolution of the central Andes. Rev. Geol. Chile 2000, 27, 205–240. [Google Scholar]
- Allmendinger, R.; Jordan, T.; Kay, S.; Isacks, B. The evolution of the Altiplano-Puna Plateau of The Central Andes. Annu. Rev. Earth Planet. Sci. 1997, 25, 139–174. [Google Scholar] [CrossRef]
- Yuan, X.; Sobolev, S.V.; Kind, R. Moho topography in the central Andes and its geodynamic implications. Earth Planet. Sci. Lett. 2002, 199, 389–402. [Google Scholar] [CrossRef]
- Wörner, G.; Lopez-Escobar, L.; Moorbath, S.; Horn, S.; Entenmann, J.; Harmon, R.; Davidson, J. Variaciones geoquímicas, locales y regionales, en el frente volcánico cuaternario de los Andes Centrales (17 30′–22 00′S), Norte de Chile. Andean Geol. 1992, 19, 37–56. [Google Scholar]
- Wörner, G.; Moorbath, S.; Horn, S.; Entenmann, J.; Harmon, R.; Davidson, J.; Lopez-Escobar, L. Large-and fine-scale geochemical variations along the Andean arc of northern Chile (17.5–22 S). In Tectonics of the southern Central Andes; Reutter, K.J., Scheuber, E., Wigger, P., Eds.; Springer: Berlin/Heidelberg, Germany, 1994; pp. 77–92. [Google Scholar]
- Aitcheson, S.; Harmon, R.; Moorbath, S.; Schneider, A.; Soler, P.; Soria-Escalante, E.; Steele, G.; Awainbank, I.; Wörner, G. Pb isotopes define basement domains of the Altiplano, central Andes. Geology 1995, 23, 555–558. [Google Scholar] [CrossRef]
- Mamani, M.; Tassara, A.; Wörner, G. Composition and structural control of crustal domains in the central Andes. Geochem. Geophy. Geosyst. 2008, 9, 1–13. [Google Scholar] [CrossRef]
- Mamani, M.; Wörner, G.; Sempere, T. Geochemical variations in igneous rocks of the Central Andean orocline (13°S to 18°S): Tracing crustal thickening and magma generation through time and space. Geol. Soc. Am. Bull. 2010, 122, 162–182. [Google Scholar] [CrossRef]
- Lucassen, F.; Becchio, R.; Franz, G. The Early Palaeozoic high-grade metamorphism at the active continental margin of West Gondwana in the Andes (NW Argentina/N Chile). Int. J. Earth Sci. 2011, 100, 445–463. [Google Scholar] [CrossRef]
- Casertano, L. General characteristics of active Andean volcanoes and a summary of their activities during recent centuries. Bull. Seismol Soc. Am. 1963, 53, 1415–1433. [Google Scholar]
- Tassi, F.; Aguilera, F.; Darrah, F.; Vaselli, O.; Capaccioni, B.; Poreda, R.J.; Delgado Huertas, A. Fluid geochemistry of hydrothermal systems in the Arica-Parinacota, Tarapacá and Antofagasta regions (northern Chile). J. Volcanol. Geotherm. Res. 2010, 192, 1–15. [Google Scholar] [CrossRef]
- Global Volcanism Program. In Global Volcanism Program, Irruputuncu (Chile-Bolivia): Minor, Late-1995 Eruption; the First Unambiguous Modern Report. 1997. Available online: https://volcano.si.edu/showreport.cfm?doi=10.5479/si.GVP.BGVN199701-355040 (accessed on 30 June 2020).
- Céspedes, L.; Clavero, J.; Cayupi, J. Hazard management at Isluga volcano, northern Chile: Preliminary results. In Proceedings of the IAVCEI General Assembly, Pucón, Chile, 14–16 November 2004. [Google Scholar]
- Global Volcanism Program. In Global Volcanism Program, Lascar (Chile): Eruptions Sends Ash above 25 km Altitude; Pyroclastic Flow Travel 7.5 km. Available online: https://volcano.si.edu/showreport.cfm?doi=10.5479/si.GVP.BGVN199304-355100 (accessed on 30 June 2020).
- Gardeweg, M.C.; Medina, E. La erupción subpliniana del 19-20 de Abril de 1993 del Volcán Lascar, N. de Chile. In Proceedings of the 7th Chilean Geological Congress, Concepción, Chile, 17–21 October 1994. [Google Scholar]
- Global Volcanism Program. In Global Volcanism Program, Lascar (Chile): Small Ash Eruptions and Increased Height of Gas Plume. Available online: https://volcano.si.edu/showreport.cfm?doi=10.5479/si.GVP.BGVN199503-355100 (accessed on 30 June 2020).
- Global Volcanism Program. In Global Volcanism Program, Lascar (Chile): Ash Eruption on 20–21 July. Available online: https://volcano.si.edu/showreport.cfm?doi=10.5479/si.GVP.BGVN200006-355100 (accessed on 30 June 2020).
- Global Volcanism Program. In Global Volcanism Program, Lascar (Chile): Further Analysis of 4 May 2005 Event Indicates A Phreato-Vulcanian Eruption. Available online: https://volcano.si.edu/showreport.cfm?doi=10.5479/si.GVP.BGVN200505-355100 (accessed on 30 June 2020).
- Global Volcanism Program. In Global Volcanism Program, Lascar (Chile): Seismicity, Glow, Gray Plumes, and Other Anomalies Suggest April 2013 Eruption. Available online: https://volcano.si.edu/showreport.cfm?doi=10.5479/si.GVP.BGVN201307-355100 (accessed on 30 June 2020).
- Global Volcanism Program. In Global Volcanism Program, Lascar (Chile): Ash Plume on 30 October 2015 Rises 2500 m high; Variable Seismicity and Persistent Thermal Anomaly afterwards. Available online: https://volcano.si.edu/showreport.cfm?doi=10.5479/si.GVP.BGVN201607-355100 (accessed on 30 June 2020).
- Sepúlveda, J.; Inostroza, M.; Esquivel, A. Evolución Geológica del Complejo Volcánico Guallatiri, región de Arica y Parinacota, norte de Chile. In Proceedings of the XV Congreso Geológico Chileno, Concepción, Chile, 18–23 November 2018. [Google Scholar]
- Inostroza, M.; Aguilera, F.; Tassi, F.; Cappecciachi, F.; Sepúlveda, J.; González, C.; Ureta, G.; Layana, S. Preliminary assessment of the origin and evolution of fluids discharged from Guallatiri volcano, Cities on Volcanoes 10, Naples, Italy, 2–7 September 2018.
- Cortés, J.; Cascante, M.; Zavala, V. Geología de las Áreas Isluga y Sierra de Huaillas, Región de Tarapacá; Serie Geología Básica; Servicio Nacional de Geología y Minería: Santiago, Chile, 2014; pp. 172–173.
- Cascante, M. Evolución Geológica y Magmática del Volcán Isluga 19°S. Región de Tarapacá, Chile. Master’s Thesis, Universidad de Chile, Santiago, Chile, 2015. [Google Scholar]
- Rodríguez, I.; Roche, O.; Moune, S.; Aguilera, F.; Campos, E.; Pizarro, M. Evolution of Irruputuncu volcano, central Andes, northern Chile. J. S. Am. Earth Sci. 2015, 63, 385–399. [Google Scholar] [CrossRef]
- Aguilera, F. Origen Y Naturaleza De Los Fluidos En Los Sistemas Volcánicos, Geotermales Y Termales De Baja Entalpía De La Zona Volcánica Central (zvc) Entre Los 17°43′S Y 25°10′S; Fundación Bicentenario: Santiago, Chile, 2010; p. 307. [Google Scholar]
- Gardeweg, M.; Selles, D.; Arcos, R.; Pino, H.; Camacho, J.; Sprohnle, C.; Sanhueza, A.; Mont, A. Volcanismo del Cenozoico tardío al este de Collahuasi, Región de Tarapacá, Chile. In Proceedings of the XII Congreso Geológico Chileno, Santiago, Chile, 22–26 November 2009. [Google Scholar]
- Martínez, S.; Navas, S.; González, C.; Aguilera, F. Geología del Complejo Volcánico Olca-Paruma, Norte de Chile, Actas 12º Encuentro del Centro Internacional de Ciencias de la Tierra, Mendoza, Argentina, November 2017; Gomez, M.P., Lopez, M.I., Eds.; International Center for Earth Sciences: Buenos Aires, Argentina, 2018. [Google Scholar]
- Godoy, B.; Wörner, G.; Kojima, S.; Aguilera, F.; Simon, K.; Hartmann, G. Low-pressure evolution of arc magmas in thickened crust: The San Pedro-Linzor volcanic chain, Central Andes, Northern Chile. J. S. Am. Earth Sci. 2014, 52, 24–42. [Google Scholar] [CrossRef]
- Francis, P.; Roobol, M.; Walker, G.; Cobbold, P.; Coward, M. The San Pedro and San Pablo volcanoes of northern Chile and their hot avalanche deposits. Geol. Rundsch. 1974, 63, 357–388. [Google Scholar] [CrossRef]
- O’Callaghan, L.; Francis, P. Volcanological and petrological evolution of San Pedro volcano, Provincia El Loa, North Chile. J. Geol. Soc. Lond. 1986, 143, 275–286. [Google Scholar] [CrossRef]
- Amigo, A.; Bertin, D.; Orozco, G. Peligros Volcánicos de la Zona Norte de Chile, Regiones de Arica y Parinacota, Tarapacá, Antofagasta y Atacama; Serie 177; Servicio Nacional de Geología y Minería: Santiago, Chile, 2012; p. 45.
- Bruggen, J. Fundamentos de la Geología en Chile; Instituto Geográfico Militar: Santiago, Chile, 1950; p. 374.
- Petit-Breuilh, M.E. La historia eruptiva de los volcanes hispanoamericanos (Siglos XVI al XX); Casa de los volcanes: Huelva, Spain, 2004; p. 431. [Google Scholar]
- Martin, C. Los volcanes activos de Chile. Rev. Chil. Hist. Nat. 1901, 5, 243–250. [Google Scholar]
- Marinovic, N.; Lahsen, A. Hoja Calama: Región de Antofagasta; Serie 58; Servicio Nacional de Geología y Minería: Santiago, Chile, 1984; p. 140.
- Kantzas, E.P.; McGonigle, A.J.; Tamburello, G.; Aiuppa, A.; Bryant, R.G. Protocols for UV camera volcanic SO2 measurements. J. Volcanol. Geotherm. Res. 2010, 194, 55–60. [Google Scholar] [CrossRef] [Green Version]
- Gliß, J.; Stebel, K.; Kylling, A.; Dinger, A.; Sihler, H.; Sudbø, A. A Python Software Toolbox for the Analysis of SO2 Camera Data. Implications in geosciences. Geosciences 2017, 7, 134. [Google Scholar] [CrossRef] [Green Version]
- Campion, R.A.; Delgado-Granados, H.; Mori, T. Image-based correction of the light dilution effect for SO2 camera measurements. J. Volcanol. Geotherm. Res. 2015, 300, 48–57. [Google Scholar] [CrossRef]
- Llanko, T.; Pering, T.; Wilkes, T.; Apaza Choquehuayta, F.; Kern, C.; Diaz Moreno, A.; De Angelis, S.; Layana, S.; Rojas, F.; Aguilera, F.; et al. Degassing at Sabancaya volcano measured by UV cameras and the Novak network. Volcanica 2019, 2, 239–252. [Google Scholar]
- Klein, A.; Lübcke, P.; Bobrowski, N.; Kuhn, J.; Platt, U. Plume propagation direction determination with SO2 cameras. Atmos. Meas. Tech. 2017, 10, 979–987. [Google Scholar] [CrossRef]
- Kern, C.; Kick, F.; Lübcke, P.; Vogel, L.; Wöhrbach, M.; Platt, U. Theoretical description of Functionality, Applications, and Limitations of SO2 Cameras for the Remote Sensing of volcanic Plumes. Atmos. Meas. Tech. 2010, 3, 733–749. [Google Scholar] [CrossRef] [Green Version]
- Clavero, J.; Soler, V.; Amigo, A. Caracterizacion preliminar de la actividad sismica y de desgasificacion pasiva de volcanes activos de los Andes Centrales del norte de Chile. In Proceedings of the Actas 11º Congreso Geologico Chileno, Antofagasta, Chile, 7–11 August 2006. [Google Scholar]
- Johansson, M.; Galle, B.; Zhang, Y.; Rivera, C.; Chen, D.; Wyser, K. The dual-beam mini-DOAS technique–measurements of volcanic gas emission, plume height and plume Speedy with a single instrument. Bull. Volcanol. 2009, 71, 747–751. [Google Scholar] [CrossRef]
- Inostroza, M.; Tassi, F.; Aguilera, F.; Sepúlveda, J.; Capecchiacci, F.; Venturi, S.; Capasso, G. Geochemistry of gas and water discharges from the magmatic-hydrothermal system of the Guallatiri Volcano, northern Chile. Bull. Volcanol. 2020, in press. [Google Scholar] [CrossRef]


| Volcano | Date | Site | Coordinates | Altitud (m a.s.l.) | Distance from the Plume (km) | Measure Sequence | Time | Shutter Speed | Framerate (Hz) | Images | Proccesing Methods (1) | Plume Speed OCV (ms−1) | SO2 Emission Rate OCV (td−1) | Plume Speed CP (ms−1) | SO2 Emission Rate CP (td−1) | |||||||||
|---|---|---|---|---|---|---|---|---|---|---|---|---|---|---|---|---|---|---|---|---|---|---|---|---|
| Lat | Long | Starting * | Ending * | Span (min) | Filter A | Filter B | Captured | Proccessed | Average ± 1 | Minimum | Maximum | Average ± 1 | Minimum | Maximum | ||||||||||
| Guallatiri | 10 December 2017 | 1 | −18.466677 | −69.110220 | 4658 | 5.2 | 1 | 11:00 | 11:55 | 55 | 700 | 100 | 0.25 | 1555 | 1064 | CP | n.d. | n.d. | n.d. | n.d. | 9.0 | 49.4 ± 18.8 | 13 | 101 |
| 12 December 2017 | 2 | −18.459761 | −69.168300 | 4305 | 10.8 | 1 | 11:37 | 12:22 | 45 | 600 | 100 | 0.2 | 1070 | 492 | OCV | 10.3 | 50.5 ± 12.3 | 19.9 | 86.4 | n.d. | n.d. | n.d. | n.d. | |
| 13 December 2017 | 3 | −18.390355 | −69.120780 | 4933 | 4.8 | 1 | 11:26 | 12:16 | 50 | 80 | 11 | 0.2 | 1156 | 1156 | OCV/CP | n.r.d. | n.r.d. | n.r.d. | n.r.d | n.r.d. | n.r.d. | n.r.d. | n.r.d | |
| 5 April 2018 | 4 | −18.483295 | −69.140873 | 4315 | 8.4 | 1 | 11:38 | 12:22 | 44 | 200 | 50 | 0.2 | 1062 | 1062 | CP | n.d. | n.d. | n.d. | n.d. | 1.0 | 5.5 ± 2.8 | 1.7 | 13 | |
| 2 | 12:29 | 13:14 | 45 | 1084 | 1084 | OCV | 2.2 | 12.2 ± 3.1 | 4.3 | 19.9 | n.d. | n.d. | n.d. | n.d. | ||||||||||
| 3 | 13:21 | 14:06 | 45 | 1068 | 320 | CP | n.d. | n.d. | n.d. | n.d. | 8.5 | 19.1 ± 4.5 | 10.4 | 32 | ||||||||||
| 4 | 14:11 | 14:42 | 31 | 744 | 744 | OCV | 9.3 | 28 ± 9.3 | 9.5 | 51 | n.d. | n.d. | n.d. | n.d. | ||||||||||
| Isluga | 4 April 2018 | 1 | −19.203115 | −68.865454 | 4103 | 6.2 | 1 | 11:05 | 11:49 | 44 | 350 | 70 | 0.2 | 1046 | 644 | CP | n.d. | n.d. | n.d. | n.d. | 10.9 | 329 ± 90.8 | 177 | 569 |
| 2 | 11:55 | 12:08 | 13 | 312 | 312 | OCV | 10.4 | 199 ± 47.5 | 129 | 325 | n.d. | n.d. | n.d. | n.d. | ||||||||||
| 3 | 12:18 | 12:40 | 22 | 505 | 504 | OCV/CP | n.r.d. | n.r.d. | n.r.d. | n.r.d | n.r.d. | n.r.d. | n.r.d. | n.r.d | ||||||||||
| 4 | 12:45 | 13:30 | 45 | 1072 | 1072 | OCV | 13.1 | 361 ± 31.6 | 285 | 495 | n.d. | n.d. | n.d. | n.d. | ||||||||||
| 5 | 13:38 | 14:05 | 27 | 630 | 630 | CP | n.d. | n.d. | n.d. | n.d. | 7.0 | 129 ± 28.3 | 58.8 | 206 | ||||||||||
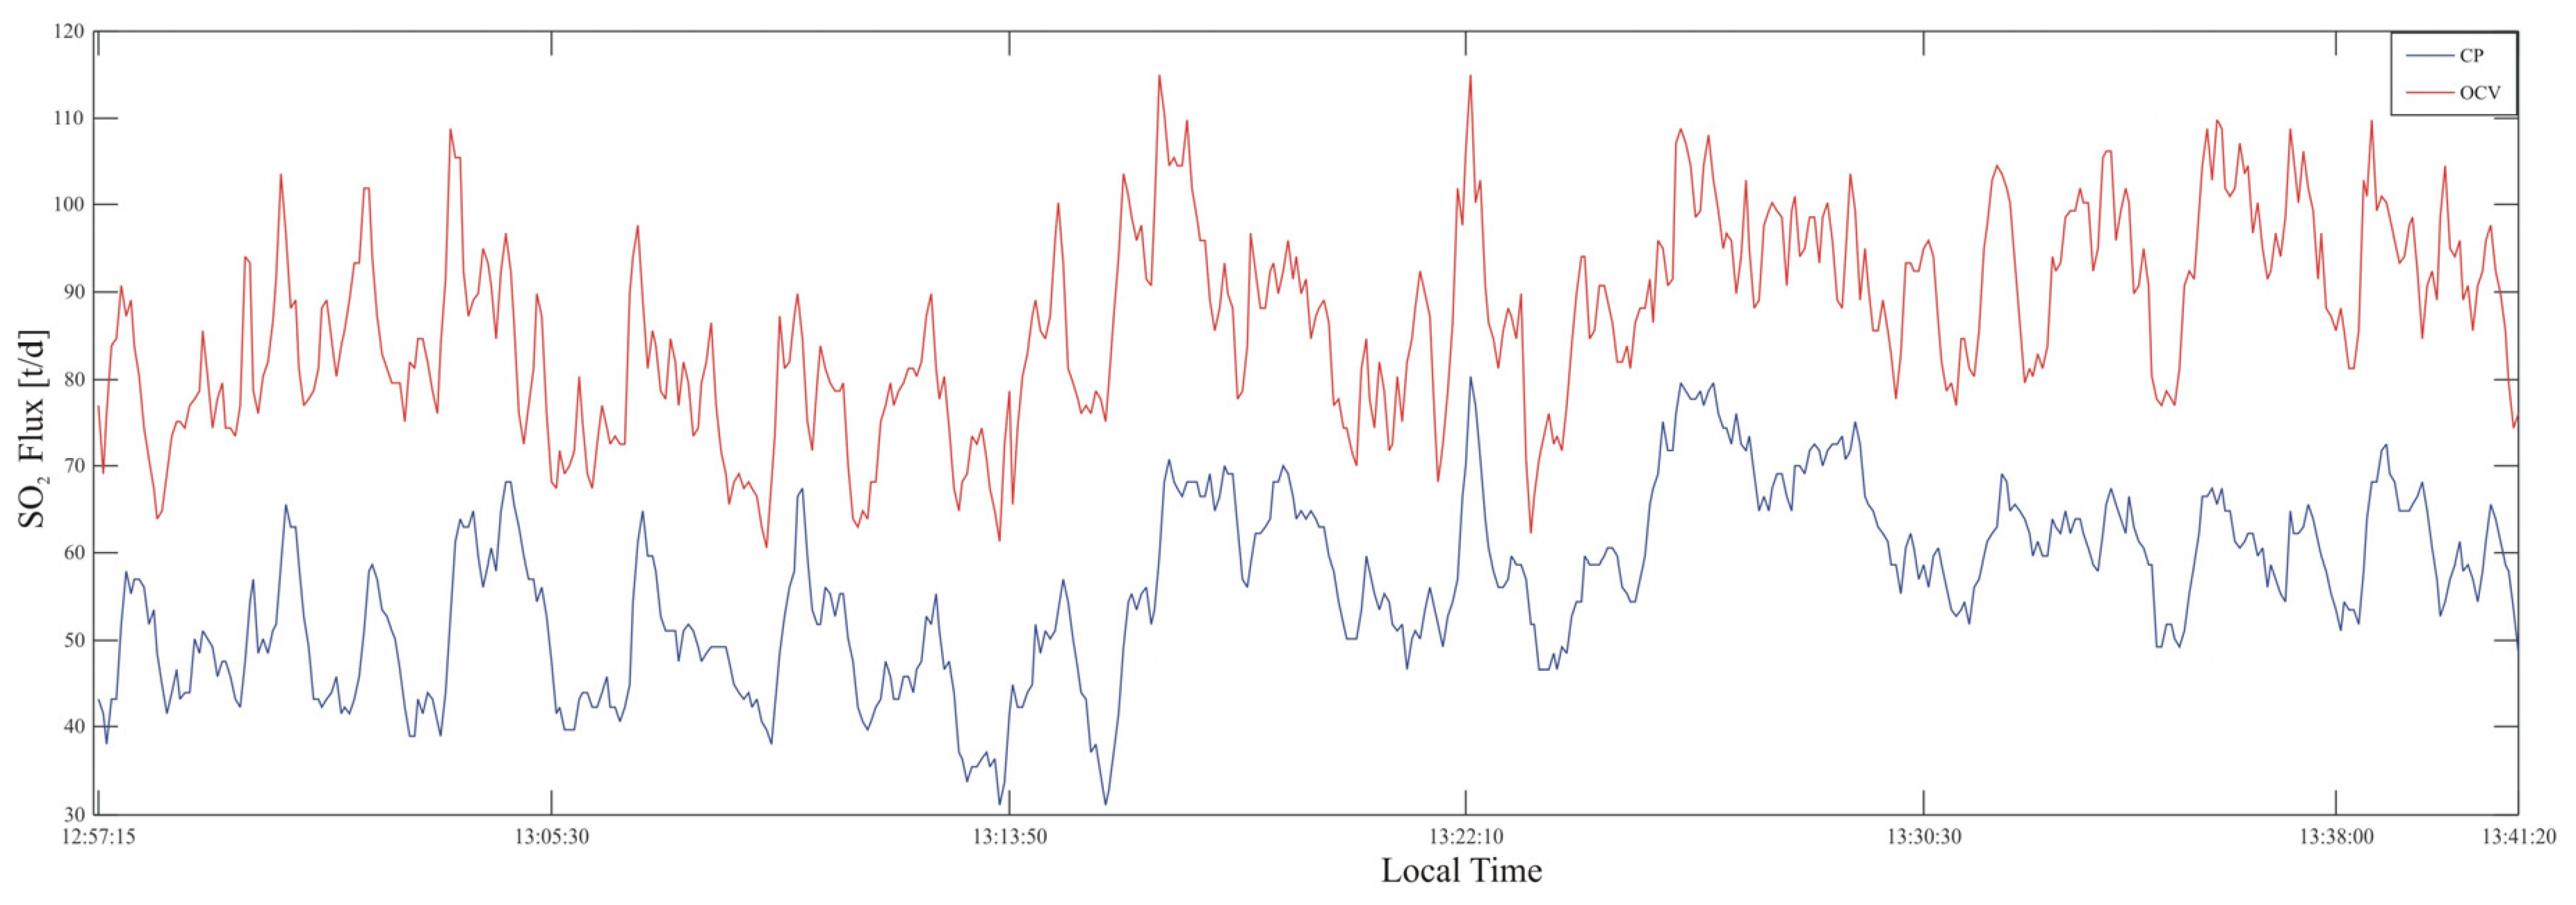
| Irruputuncu | 2 April 2018 | 1 | −20.760319 | −68.572877 | 4182 | 3.3 | 1 | 12:57 | 13:40 | 43 | 350 | 75 | 0.2 | 1058 | 1058 | OCV/CP | 6.0 (2) | 86.6 ± 11.1 (2) | 60.5 | 114.9 | 5.9 | 56 ± 10 | 31.1 | 80.4 |
| 2 | 13:47 | 14:29 | 42 | 964 | 964 | CP | n.d. | n.d. | n.d. | n.d. | 5.3 | 40.2 ± 6.2 | 19 | 54.4 | ||||||||||
| 3 | 14:32 | 15:16 | 44 | 1050 | 554 | CP | n.d. | n.d. | n.d. | n.d. | 3.9 | 22.3 ± 5.3 | 10.4 | 35.4 | ||||||||||
| 3 April 2018 | 1 | 10:15 | 10:55 | 40 | 350 | 50 | 946 | 949 | CP | n.d. | n.d. | n.d. | n.d. | 4.8 | 21.4 ± 5.5 | 12.1 | 38 | |||||||
| 2 | 11:11 | 11:51 | 40 | 350 | 60 | 960 | 960 | CP | n.d. | n.d. | n.d. | n.d. | 2.6 | 25.4 ± 3.1 | 17.3 | 32.8 | ||||||||
| 3 | 11:58 | 12:38 | 40 | 954 | 656 | CP | n.d. | n.d. | n.d. | n.d. | 4.4 | 16.5 ± 5.4 | 3.5 | 30.2 | ||||||||||
| Olca | 1 March 2018 | 1 | −20.944073 | −68.478082 | 5300 | 0.6 | 1 | 12:45 | 12:50 | 5 | 55 | 10 | 0.2 | 130 | 130 | OCV | 0.9 | n.r.d. | n.r.d. | n.r.d | n.d. | n.d. | n.d. | n.d. |
| 2 | 12:58 | 13:29 | 31 | 55 | 10 | 742 | 742 | OCV | 9.1 | 18.4 ± 13.4 | 0 | 58.4 | n.d. | n.d. | n.d. | n.d. | ||||||||
| 3 | 13:52 | 14:23 | 31 | 100 | 15 | 732 | 732 | OCV/CP | n.r.d. | n.r.d. | n.r.d. | n.r.d | 1.0 | n.r.d. | n.r.d. | n.r.d | ||||||||
| Ollagüe | 1 March 2018 | 1 | −21.280380 | −68.233636 | 4012 | 5.9 | 1 | 17:13 | 17:55 | 42 | 230 | 40 | 0.2 | 1012 | 786 | OCV/CP | 8.4 | 15.9 ± 3.1 | 7.5 | 25 | 9.4 | 7.9 ± 2.1 | 2.6 | 16.4 |
| 2 | 18:16 | 18:47 | 31 | 220 | 35 | 738 | 448 | OCV/CP | 7.4 | 19.2 ± 4.1 | 8.3 | 34.2 | n.r.d. | n.r.d. | n.r.d. | n.r.d | ||||||||
| 2 March 2018 | 2 | −21.272022 | −68.231213 | 3958 | 6.3 | 1 | 9:48 | 10:23 | 35 | 180 | 45 | 0.2 | 836 | 836 | OCV/CP | 9.5 (2) | 92.5 ± 14.4 (2) | 63.1 | 139.1 | 3.7 | 21.5 ± 4.0 | 13.8 | 38 | |
| 2 | 10:44 | 11:26 | 42 | 160 | 40 | 1008 | 1008 | OCV/CP | 3.7 | 5.8 ± 4.6 | 0.8 | 28.4 | 3.3 | 4.8 ± 2.0 | 0.9 | 12.1 | ||||||||
| 3 | 11:44 | 11:52 | 8 | 65 | 5 | 188 | 188 | OCV/CP | n.r.d. | n.r.d. | n.r.d. | n.r.d | n.r.d. | n.r.d. | n.r.d. | n.r.d | ||||||||
| San Pedro | 28 February 2018 | 1 | −21.835503 | −68.370719 | 4350 | 6 | 1 | 11:45 | 12:40 | 55 | 230 | 30 | 0.2 | 1324 | 350 | OCV/CP | 6.8 | 7.4 ± 1.6 | 3.6 | 11.2 | n.r.d. | n.r.d. | n.r.d. | n.r.d |
| 2 | 12:59 | 13:55 | 56 | 1332 | 746 | OCV/CP | 12.9 | 16.2 ± 6.5 | 5.2 | 43.2 | 7.6 | 16.1 ± 4.6 | 6.9 | 32 | ||||||||||
| Putana | 29 November 2017 | 1 | −22.585581 | −67.895600 | 4935 | 5.3 | 1 | 10:40 | 11:20 | 20 | 600 | 75 | 0.25 | 560 | 560 | OCV | 6.1 | 31.9 ± 9.8 | 7.6 | 66.8 | n.d. | n.d. | n.d. | n.d. |
| 9 March 2018 | 2 | −22.548809 | −22.548809 | 4467 | 9.5 | 1 | 12:29 | 12:44 | 15 | 500 | 100 | 0.2 | 360 | 360 | OCV/CP | 5.1 | 5.6 ± 1.4 | 3.5 | 11.2 | 5.0 | 6.1 ± 1.4 | 4.2 | 14.2 | |
| 2 | 12:53 | 13:08 | 15 | 356 | 356 | OCV/CP | 4.5 | 5.5 ± 1.4 | 3.5 | 11.2 | 8.0 | 4.8 ± 2 | 0.9 | 13 | ||||||||||
| 3 | 13:16 | 13:30 | 14 | 720 | 125 | 0.25 | 402 | 402 | OCV/CP | 6.2 | 11.9 ± 3.1 | 6.9 | 24.2 | 6.3 | 9.8 ± 2.8 | 6 | 19 | |||||||
| 4 | 13:48 | 14:02 | 14 | 700 | 100 | 0.2 | 348 | 348 | OCV/CP | 6.8 | 4 ± 1.1 | 1.7 | 8.6 | 6.8 | 3.2 ± 1 | 1.7 | 7.8 | |||||||
| 5 | 14:06 | 14:32 | 26 | 628 | 628 | OCV/CP | 5.2 | 2.8 ± 1.6 | 0.9 | 9.5 | 5.6 | 3.9 ± 1.3 | 1.7 | 14.2 | ||||||||||
| Uncertainty | Volcano | |||||||
|---|---|---|---|---|---|---|---|---|
| Guallatiri | Isluga | Irruputuncu | Olca | Ollagüe | San Pedro | Putana | ||
| Plume Distance | min | ±0.4 | ±0.8 | ±1.5 | ±0.3 | ±0.8 | ±0.8 | ±0.5 |
| max | ±4.2 | ±3.2 | ±6.1 | ±17 | ±3.4 | ±3.3 | ±3.8 | |
| Time | min | ±8.3 | ±8.3 | ±8.3 | ±8.3 | ±13 | ±8.3 | ±8.3 |
| max | ±13 | ±13 | ±13 | ±13 | ±17 | 25 | ±13 | |
| Plume Speed | min | ±5.9 | ±5.9 | ±6 | ±5.9 | ±8.9 | ±5.9 | ±5.9 |
| max | ±9.3 | ±9.1 | ±9.8 | ±15 | ±12 | ±18 | ±9.2 | |
| Gas Cell Calibration | ±10 | ±10 | ±10 | ±10 | ±10 | ±10 | ±10 | |
| Calibration Drift | min | ±0.8 | ±2.3 | ±0.4 | ±5.1 | ±7.5 | ±1.1 | ±7.2 |
| max | ±3.5 | ±9.5 | ±15 | ±15 | ±19 | ±2.8 | ±19 | |
| Light Dilution | min | +20 | +20 | +20 | +20 | +20 | +20 | +20 |
| max | +42 | +42 | ||||||
| SO2 detection | ±15 | ±15 | ±15 | ±15 | ±15 | ±15 | ±15 | |
| Plume Direction | ±5 | ±5 | ±5 | ±5 | ±5 | ±5 | ±5 | |
| Multiple Scattering | - | - | - | - | - | - | - | |
| Total RMS Error | min | −8.7/+11 | −8.7/+11 | −8.7/+11 | −9/+8.2 | −9.8/+12 | −8.7/+11 | −9.3/+12 |
| max | −9.4/+19 | −10/+12 | −12/+13 | −12/+11 | −12/+14 | −12/+12 | −13/+21 | |
| max (*) | +12 | +14 | ||||||
| Volcano | Date | Technique | SO2 Emission Rate (td−1) | Reference | |
|---|---|---|---|---|---|
| Average | Maximum (1) | ||||
| Guallatiri (summit) | 20–22 October 2014 | UV Cam | 8.6–129 * | 129 | 1 |
| Guallatiri (flank) | 20–22 October 2014 | UV Cam | n.r. | 216 | 1 |
| Guallatiri (whole system) | 20–22 October 14 | UV Cam | 112 ± 43.2 | 251 | 1 |
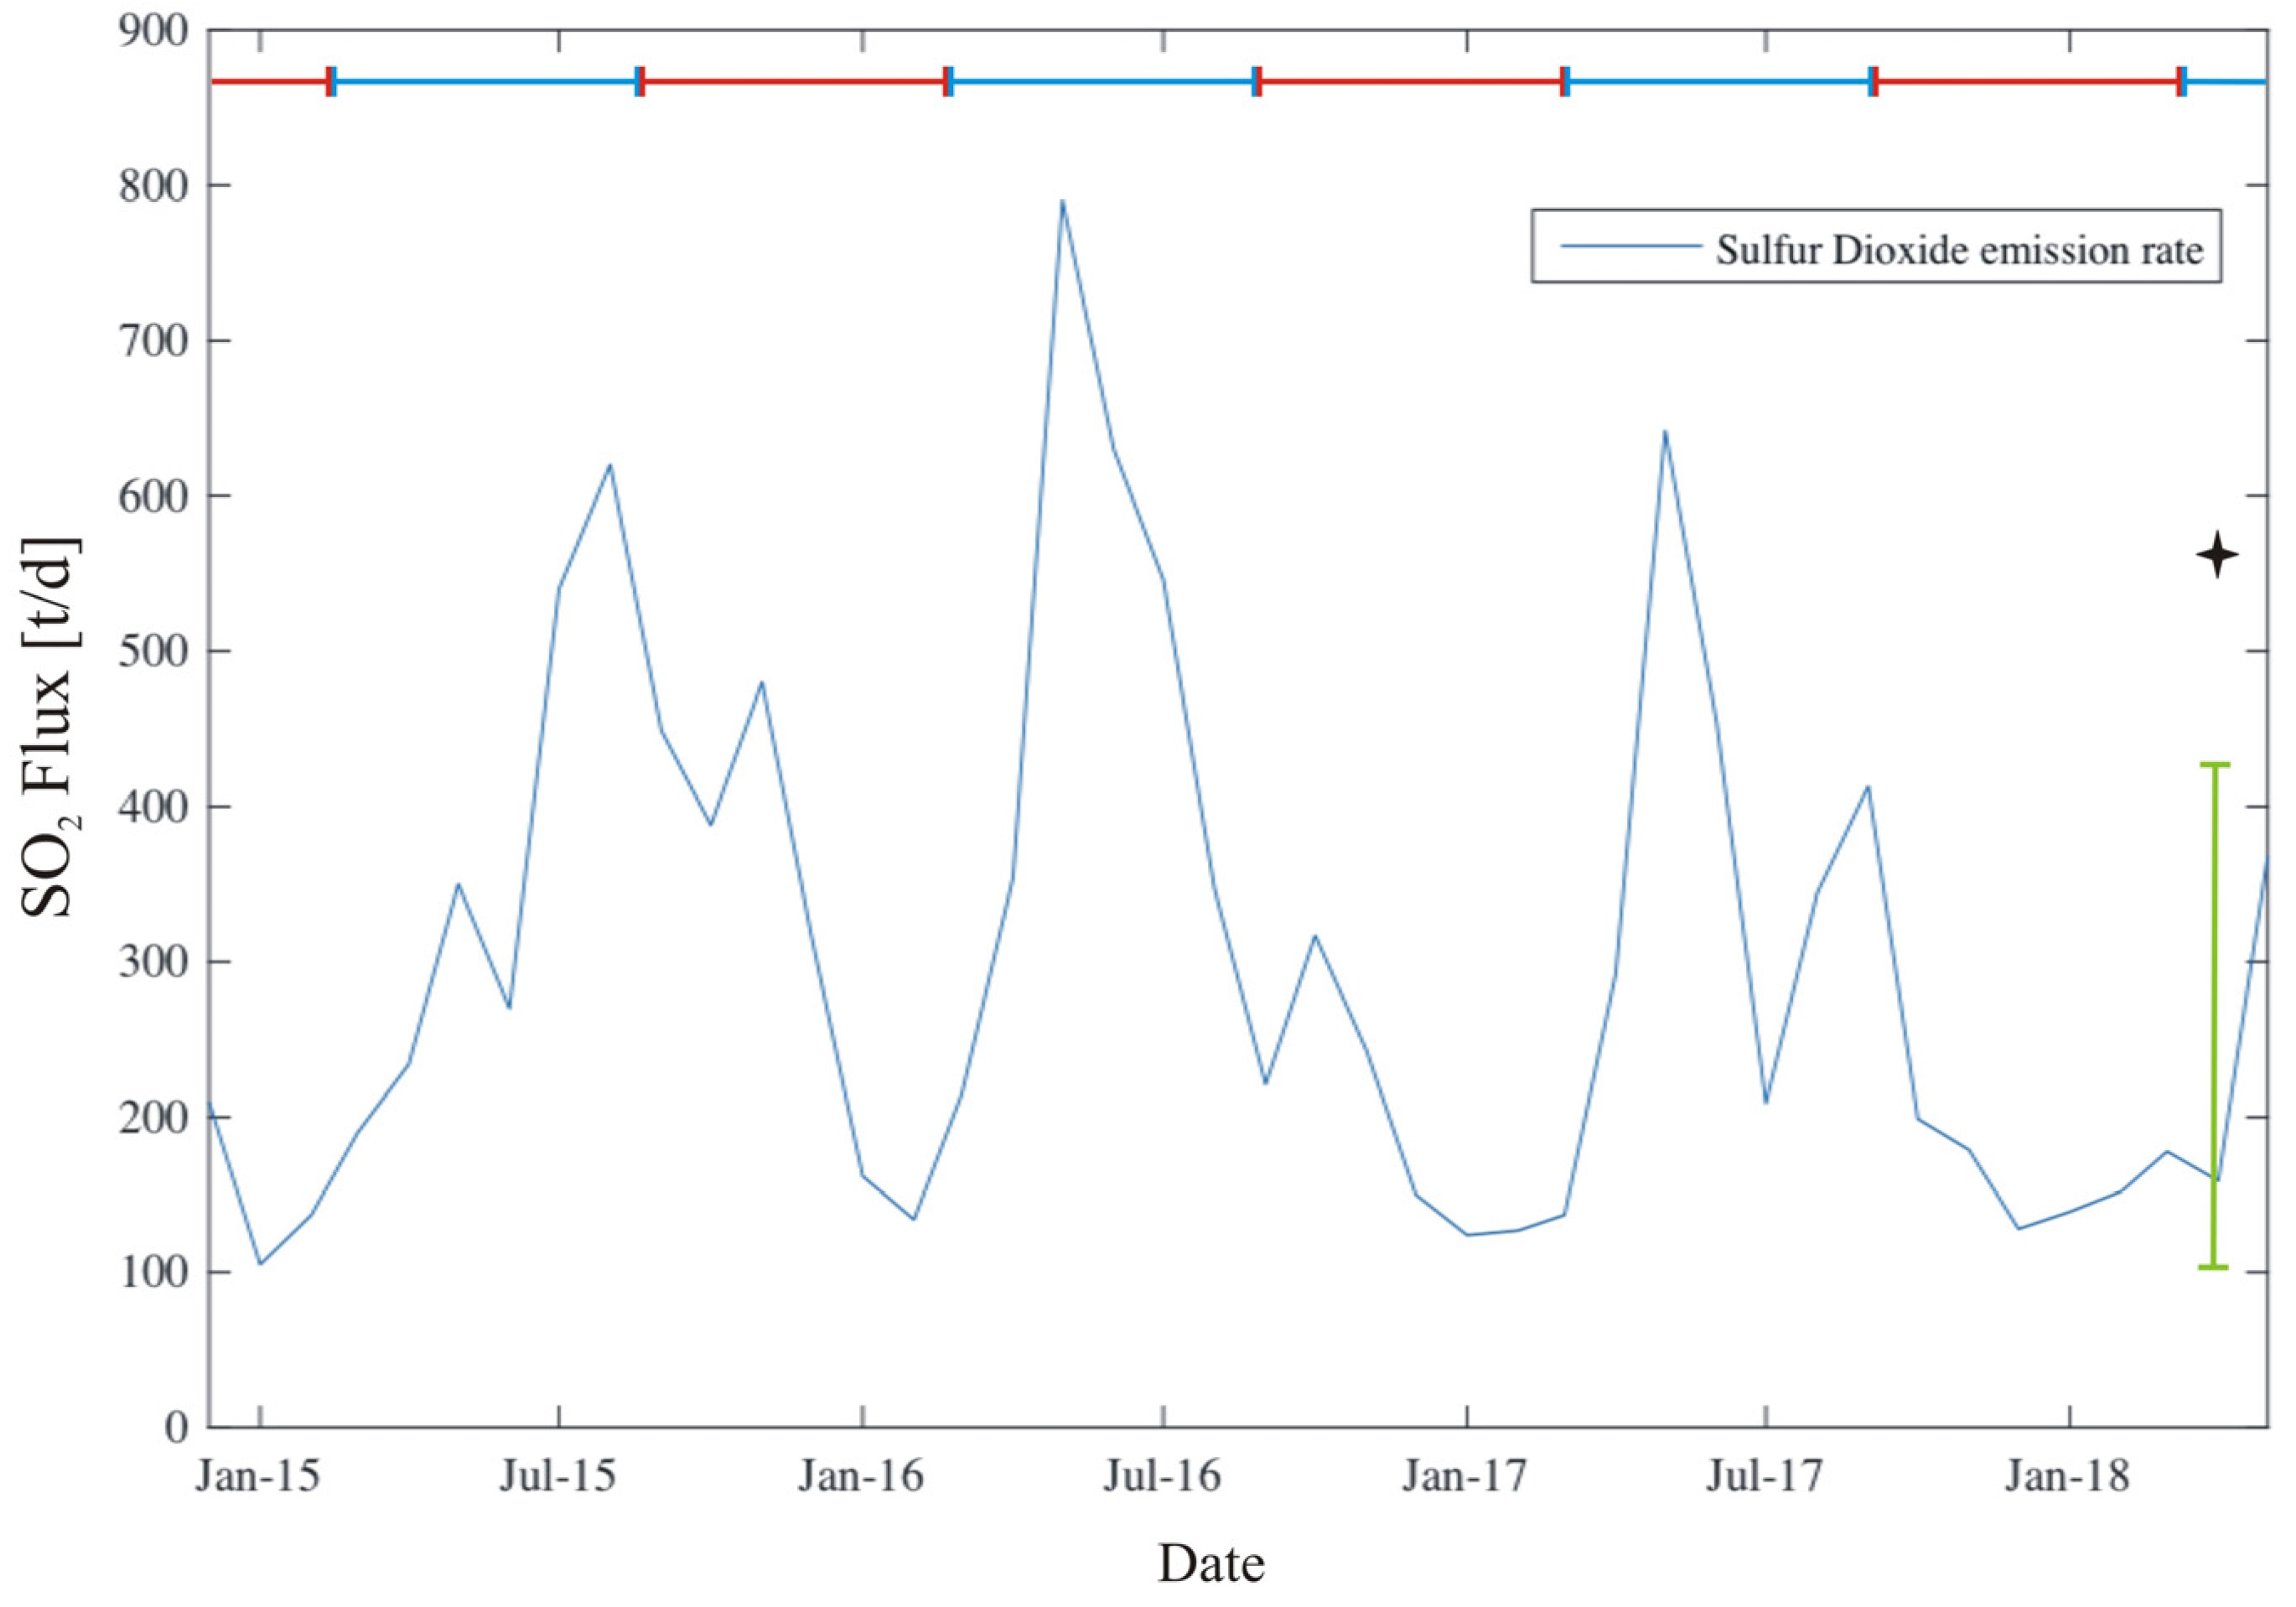
| Isluga (2) | 2018 | DOAS | 199.2 ± 139.3 | 698 | 2 |
| 2017 | DOAS | 270.7 ± 245.8 | 1841 | 2 | |
| 2016 | DOAS | 342.4 ± 323.3 | 1800 | 2 | |
| 2015 | DOAS | 339.9 ± 72.2 | 1600 | 2 | |
| 2014 | DOAS | 210 | 530 | 2 | |
| Irruputuncu | 2004 | DOAS | 21–50 * | 50 | 3 |
| Ollagüe | 2004 | DOAS | 4.5–9.1 * | 9.1 | 3 |
| 05/14 | DOAS | 150 | n.r. | 2 | |
| 11–2 December 2014 | DOAS | 150 ± 162 | 220 ± 181 | 4 | |
| San Pedro | 10–12 December 2014 | DOAS | 161 ± 150 | 182 ± 188 | 4 |
| June 2014 | DOAS | 180 | 250 | 2 | |
| May 2014 | DOAS | 190 | n.r. | 2 | |
| Putana | 5, 6–12 December 2012 | DOAS | 97 ± 78 (3) | 133 ± 104 | 4 |
| 28 November 2012 | UV Cam | 60.5 ± 45.8 (4) | 77.8 ± 51.8 | 5 | |
| 28 November 12 | UV Cam | 55.3 ± 17.3 (5) | 121 | 5 | |
© 2020 by the authors. Licensee MDPI, Basel, Switzerland. This article is an open access article distributed under the terms and conditions of the Creative Commons Attribution (CC BY) license (http://creativecommons.org/licenses/by/4.0/).
Share and Cite
Aguilera, F.; Layana, S.; Rojas, F.; Arratia, P.; Wilkes, T.C.; González, C.; Inostroza, M.; McGonigle, A.J.S.; Pering, T.D.; Ureta, G. First Measurements of Gas Flux with a Low-Cost Smartphone Sensor-Based UV Camera on the Volcanoes of Northern Chile. Remote Sens. 2020, 12, 2122. https://doi.org/10.3390/rs12132122
Aguilera F, Layana S, Rojas F, Arratia P, Wilkes TC, González C, Inostroza M, McGonigle AJS, Pering TD, Ureta G. First Measurements of Gas Flux with a Low-Cost Smartphone Sensor-Based UV Camera on the Volcanoes of Northern Chile. Remote Sensing. 2020; 12(13):2122. https://doi.org/10.3390/rs12132122
Chicago/Turabian StyleAguilera, Felipe, Susana Layana, Felipe Rojas, Pilar Arratia, Thomas C. Wilkes, Cristóbal González, Manuel Inostroza, Andrew J.S. McGonigle, Tom D. Pering, and Gabriel Ureta. 2020. "First Measurements of Gas Flux with a Low-Cost Smartphone Sensor-Based UV Camera on the Volcanoes of Northern Chile" Remote Sensing 12, no. 13: 2122. https://doi.org/10.3390/rs12132122