Article

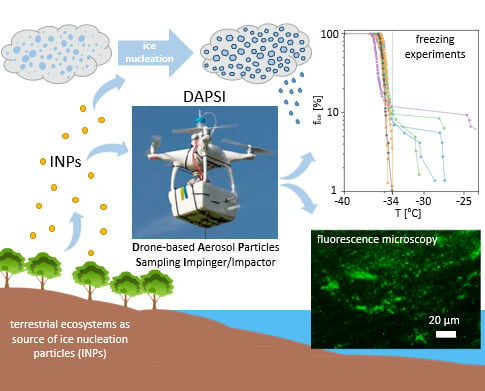
A Drone-Based Bioaerosol Sampling System to Monitor Ice Nucleation Particles in the Lower Atmosphere

1
Institute of Materials Chemistry, TU Wien, 1060 Vienna, Austria
2
Faculty of Physics, University of Vienna, 1090 Vienna, Austria
3
Institute of Chemical Technologies and Analytics, TU Wien, 1060 Vienna, Austria
4
School of Plant and Environmental Sciences, Virginia Tech, Blacksburg, VA 24061-0390, USA
*
Author to whom correspondence should be addressed.
Remote Sens. 2020, 12(3), 552; https://doi.org/10.3390/rs12030552
Submission received: 20 December 2019 / Revised: 31 January 2020 / Accepted: 5 February 2020 / Published: 7 February 2020
(This article belongs to the Special Issue Unmanned Aerial Systems for Surface Hydrology)

Abstract

:
Terrestrial ecosystems can influence atmospheric processes by contributing a huge variety of biological aerosols (bioaerosols) to the environment. Several types of biological particles, such as pollen grains, fungal spores, and bacteria cells, trigger freezing processes in super-cooled cloud droplets, and as such can contribute to the hydrological cycle. Even though biogenic particles are known as the most active form of ice nucleation particles (INPs), the transport to high tropospheric altitudes, as well as the occurrence in clouds, remains understudied. Thus, transport processes from the land surface into the atmosphere need to be investigated to estimate weather phenomena and climate trends. To help fill this knowledge gap, we developed a drone-based aerosol particles sampling impinger/impactor (DAPSI) system for field studies to investigate sources and near surface transport of biological INPs. DAPSI was designed to attach to commercial rotary-wing drones to collect biological particles within about 100 m of the Earth’s surface. DAPSI provides information on particulate matter concentrations (PM10 & PM2.5), temperature, relative humidity, and air pressure at about 0.5 Hz, by controlling electrical sensors with an onboard computer (Raspberry Pi 3). Two remote-operated sampling systems (impinging and impacting) were integrated into DAPSI. Laboratory tests of the impinging system showed a 96% sampling efficiency for standardized aerosol particles (2 µm polystyrene latex spheres) and 84% for an aerosol containing biological INPs (Betula pendula). A series of sampling missions (12 flights) were performed using two Phantom 4 quadcopters with DAPSI onboard at a remote sampling site near Gosau, Austria. Fluorescence microscopy of impactor foils showed a significant number of auto-fluorescent particles < 0.5 µm at an excitation of 465–495 nm and an emission of 515–555 nm. A slight increase in ice nucleation activity (onset temperature between −27 °C and −31 °C) of sampled aerosol was measured by applying freezing experiments with a microscopic cooling technique. There are a number of unique opportunities for DAPSI to be used to study the transport of bioaerosols, particularly for investigations of biological INP emissions from natural sources such as birch or pine forests.

Graphical Abstract

1. Introduction

Precipitation as a part of surface hydrology is the result of physical and chemical reactions taking place in the troposphere. One major part is the freezing process of condensed water droplets in clouds. The formation of ice in pure water is kinetically hindered at temperatures below the equilibrium freezing/melting point at 0 °C. Homogeneous ice nucleation, where the ice embryo consists of water molecules only, takes place at about −38 °C in micrometer sized water droplets [1,2]. However, so-called ice nucleation particles (INPs) can act as triggers for freezing events at higher subzero temperatures. Thus, heterogeneous ice nucleation based on foreign INPs occurs in clouds at warmer atmospheric layers, resulting in solid or mixed phase clouds with different properties [3]. Consequently, hydrological events in the form of hail, rain, snow, or sleet formation often result. Different types of INPs, many associated with microorganisms, are present in precipitation collected at the surface of the Earth [4,5,6].
In 1972, biological ice nucleation was discovered in decomposing leaf litter [7]. Later, the ice nucleation activity was attributed to the bacterium Pseudomonas syringae, which can use INPs to cause damage in plant tissues for nutrition access [8,9,10,11]. Since that landmark discovery, several plants [12], ectothermic animals [13], and fungi [14,15] have been shown to produce biological INPs to aid in survival and fitness [16]. Since many different plant species contain highly active INPs in pollen grains [17,18], the transport of INPs from terrestrial sources into the atmosphere is conceivable via pollination. This process during flowering peaks out as an intense emission with about 50 Tg yr−1 of biological particles within the aerosol (biological aerosol particles; BAPs) [19]. Furthermore, birch pollen grains can rupture due to high humidity [20] and/or mechanical forces [21], releasing sub-pollen particles with an aerodynamic diameter of about 0.8 µm. Small diameters may lead to lower rates of descent, further distributions and therefore affect atmospheric processes tremendously. Pummer et al. showed that INPs of pollen grains can also be in the macromolecular size range [17]. Experiments with birch branches, bark, leaves and pollen have highlighted the possibility of ice nucleation macromolecules (INMs) to be extracted from plant tissues with water [22]. Thus, ice-nucleating BAPs may be generated during rainfall events when droplets impact on tree surfaces and/or leaf litter [23]. Considering rain showers in northern Europe and Asia, a total of 12 Gm3 birch forest, mostly Betula pendula and Betula pubescence, are affected [24]. Even though aerosol investigations highlighted a burst in INP concentrations after rainfall [25,26], less is known about the main sources causing these peaks. Associations between auto-fluorescence measurements and the BAP content of aerosols provide unique opportunities to characterize BAPs via fluorescence spectroscopy [27,28]. However, most of the instruments for collecting BAPs with ice nucleation and fluorescence activity are either ground-based or airplane-based [25,29].
The concentration of BAPs can vary according to location and elevation and dilute during airflows in the troposphere. Hence, methods to detect and track BAPs near their source are required for spatial and time resolved analyses. Un(wo)manned aircraft systems (UASs), or drones, provide unique opportunities for sampling biological aerosols in the lower atmosphere [30,31,32]. Schmale III et al. developed and used an autonomous fixed-wing UAS to sample microorganisms along prescribed sampling paths at precise altitudes [33]. These drones were equipped with remote-operated sampling devices that opened and closed by remote control from the ground. This work was expanded to sample fungi at two heights (1 m and 100 m) over land [34,35], and also over water with a small hand-launched drone and a remote controlled boat equipped with a 3D-printed impinging system [36]. Results for the samples collected with the drone at a height of 50 m show microorganisms (bacteria and fungi) in concentrations of 6 to 9 colony forming units (CFU) per m3 air over saltwater and 12 to 16 CFU m−3 over freshwater. In another study, the same hand-launched drone was used to collect microorganisms over aquatic and terrestrial environments in France and in two states (Louisiana and Virginia) in the U.S. [37].
Despite the significant advances that drone technology has made in our understanding of culturable microorganisms in the lower atmosphere, new tools and technologies are needed to study the unculturable biological particles in the atmosphere, such as pollen grains, sub-pollen particles, and unculturable bacteria and fungi. Recent advances in quadcopter technology, including the ability to mount large sensor packages on the drones [38], have unleashed the potential for new opportunities to study emissions and transport of biological material in the lower atmosphere. Especially in mountainous regions, like the Austrian Alps, where the weather can change instantly within minutes, INPs have the potential to influence locations of emission sources directly. Furthermore, the use of rotary wing drones to sample biological aerosols (e.g., Crazzolara et al. [39]) provides access to remote areas that have limited take-off and landing areas. The overall goal of our work was to develop a low-cost, lightweight drone system to sample bioaerosols potentially linked to heterogeneous ice nucleation. This system was designed to fit on small commercial quadcopters, with the potential to measure ice nucleation activity and fluorescence properties directly (i.e., no culturing of microbes is required). Therefore, the first step was to build and calibrate a sampling system that can collect particles with a sufficient efficiency as well as in different size categories. Additionally, sensors were integrated to collect meteorological data during flights. The second object of this study was to test the new system during a series of sampling missions (12 flights). Samples from this field campaign were analyzed regarding their ice nucleation activity, as well as fluorescence behavior, to detect and characterize biological INPs.

2. Materials and Methods

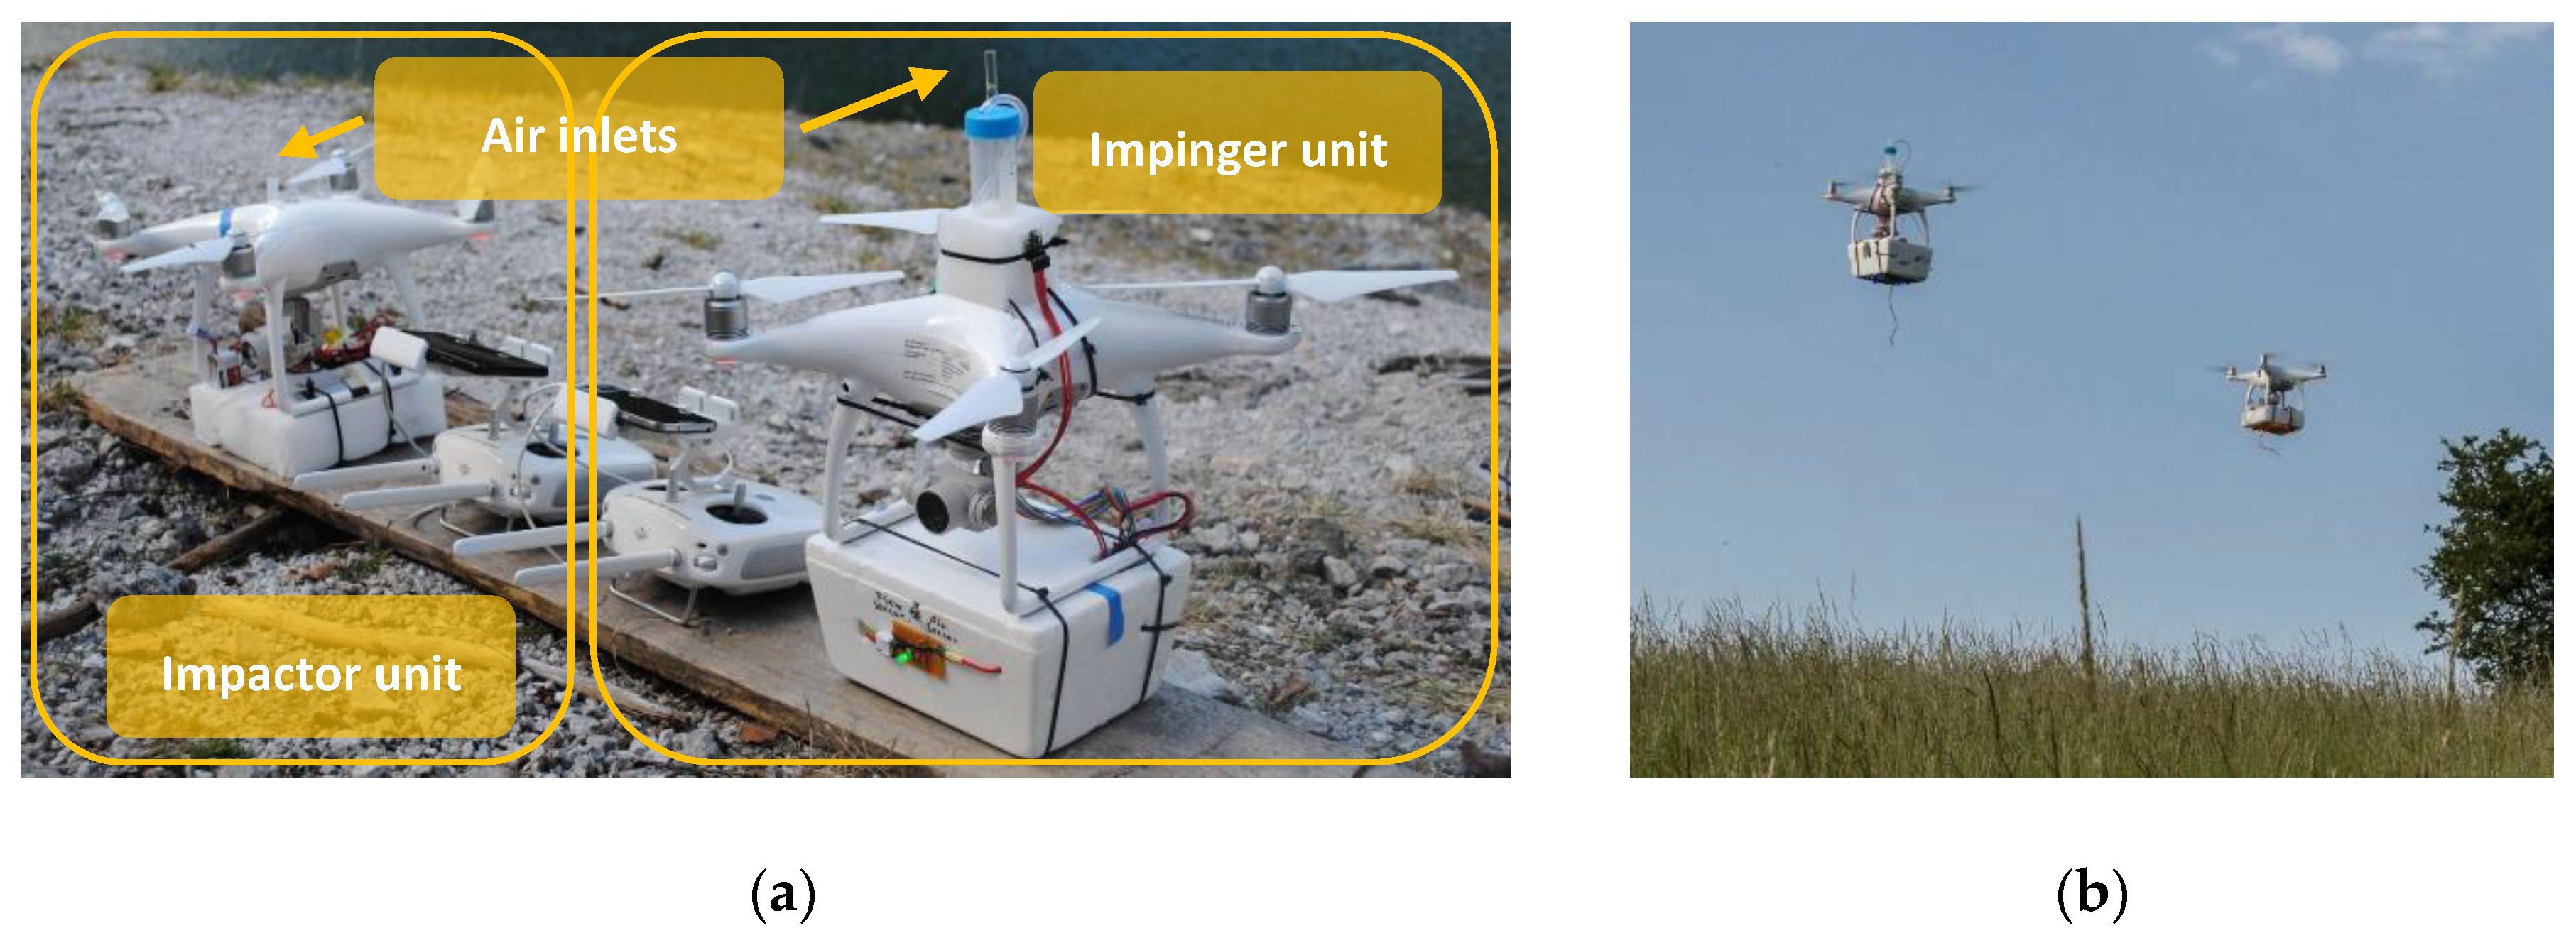
2.1. Sampling Setup and Hardware

The drone-based aerosol particle sampling impinger/impactor (DAPSI) setup was built for usage with small rotary wing UASs (sUASs), in our case Phantom 4 (DJI, China) quadcopters. To avoid reduction in flight times and to ensure a secure flight, weight was kept as low as possible. Therefore, polystyrene boxes were used for the covering, LiPo batteries (1000 mAh, 11.1 V, Wellpower, Lindinger, Austria) were connected to the instruments and sensors, and external remote controls (Fernbedienung 1K Schaltfunktion, Wiltec, Germany) were used to power the units on and off. Since one drone is not able to carry both sampling units, two drones were flown simultaneously. The first drone was equipped with the impinger unit and an additional electric assembly (Figure 1a, right and Figure 1b, left), whereas the second drone carried the impactor setup (Figure 1a, left and Figure 1b, right). The resulting weights of the instruments were 0.57 kg for the impinger unit and 0.69 kg for the impactor unit. Air inlets for both units were placed on top of the drones to minimize the influences of the downwash to the air stream [39,40,41]. A flowchart of the sampling procedure is given in Figure 2. The bioaerosol sampled with DAPSI is subsequently analyzed in the laboratory with microscopic techniques, as described in the Section 2.5.1 and Section 2.5.2.

2.1.1. Impinger Unit

Sterile plastic vials (centrifuge tubes, screw c., sterile 50 mL, Brand, Germany) with an inner diameter of 28 mm were modified to act as an impinger (Imp). Two holes were drilled into the cap of the vial, one to fit a glass pipette (Pasteur pipettes without cotton stopper, Roth, Germany) and another to connect a polyvinyl chloride (PVC) tube. 15 mL of ultrapure water (produced with Millipore® SAS SIMSV001, Merck Millipore, USA) was used as the collection buffer and to assist in measurements of ice nucleation activity, as described in 2.5.2. The tips of the pipettes had an inner diameter of 1 mm and were immersed 30 mm into the liquid. In this particular case, isotonic salt solutions were not applicable since they would have interfered the ice nucleation results due to freezing point depression. To create the intended airflow of 1 L min−1, a vacuum pump (DC: 12 V, Delaman, China) was connected to the PVC tube. Furthermore, a Raspberry Pi (Raspberry Pi 3 model B, Raspberry Pi Foundation, UK) computer was used to monitor temperature, relative humidity and air pressure with an electric sensor module (SEN-BME680, Joy-it, Germany) as well as the PM10 and PM2.5 values from an optical particle counter (OPC, SDS011, Nova Fitness Co., China) with a separate air-inlet. A flow-sensor (AWM5102 VN, Honeywell, USA) was connected to a 10-bit analog to digital converter (ADC, MCP3008-I/P, Microchip, USA). Reading out the digital signal at the input of the Raspberry Pi enabled the calibration of the airflow by controlling the attached voltage via a 100 Ω potentiometer (4 W, AB Elektronik, Germany). The influence of changes in air pressure on the flow-rate during the flights were decided as neglectable when using the system at low altitudes. Resulting values were printed on a screen (SBC-LCD 16 × 2 Display-Module, Joy-it, Germany) and stored on a USB drive. A brief description of the software programmed for the onboard computer is given in Section 2.2. The Imp vial itself was mounted on top of the drone casing, where the further setup was carried below the drone (Figure 1a, right).

2.1.2. Impactor Unit

A small cascade impactor (CI) (SKC Ltd., GB) made of aluminum was used as the main component of the second unit. It collects particles from an aerosol (aerosol particles) at 4 stages in different size distributions (A = 2.5 µm, B = 1.0 µm, C = 0.50 µm, D = 0.25 µm). For creating the necessary airflow of 9 L min−1, a vacuum pump (DC 12 V, Hilitand, China) was connected to the CI outlet and calibrated with the flow-sensor the same way as described above (Section 2.1.1). The air inlet tube was mounted on the drone casing and connected to the CI (Figure 1a, left). The stages of the CI were loaded with aluminum foils (Rotilabo®-Aluminiumfolie, Carl Roth, Germany) which were prebaked at 460 °C for at least 3 h before usage. After sampling, the CI was opened, and foils were stored in sterile petri dishes until fluorescence microscopy was applied in the laboratory.

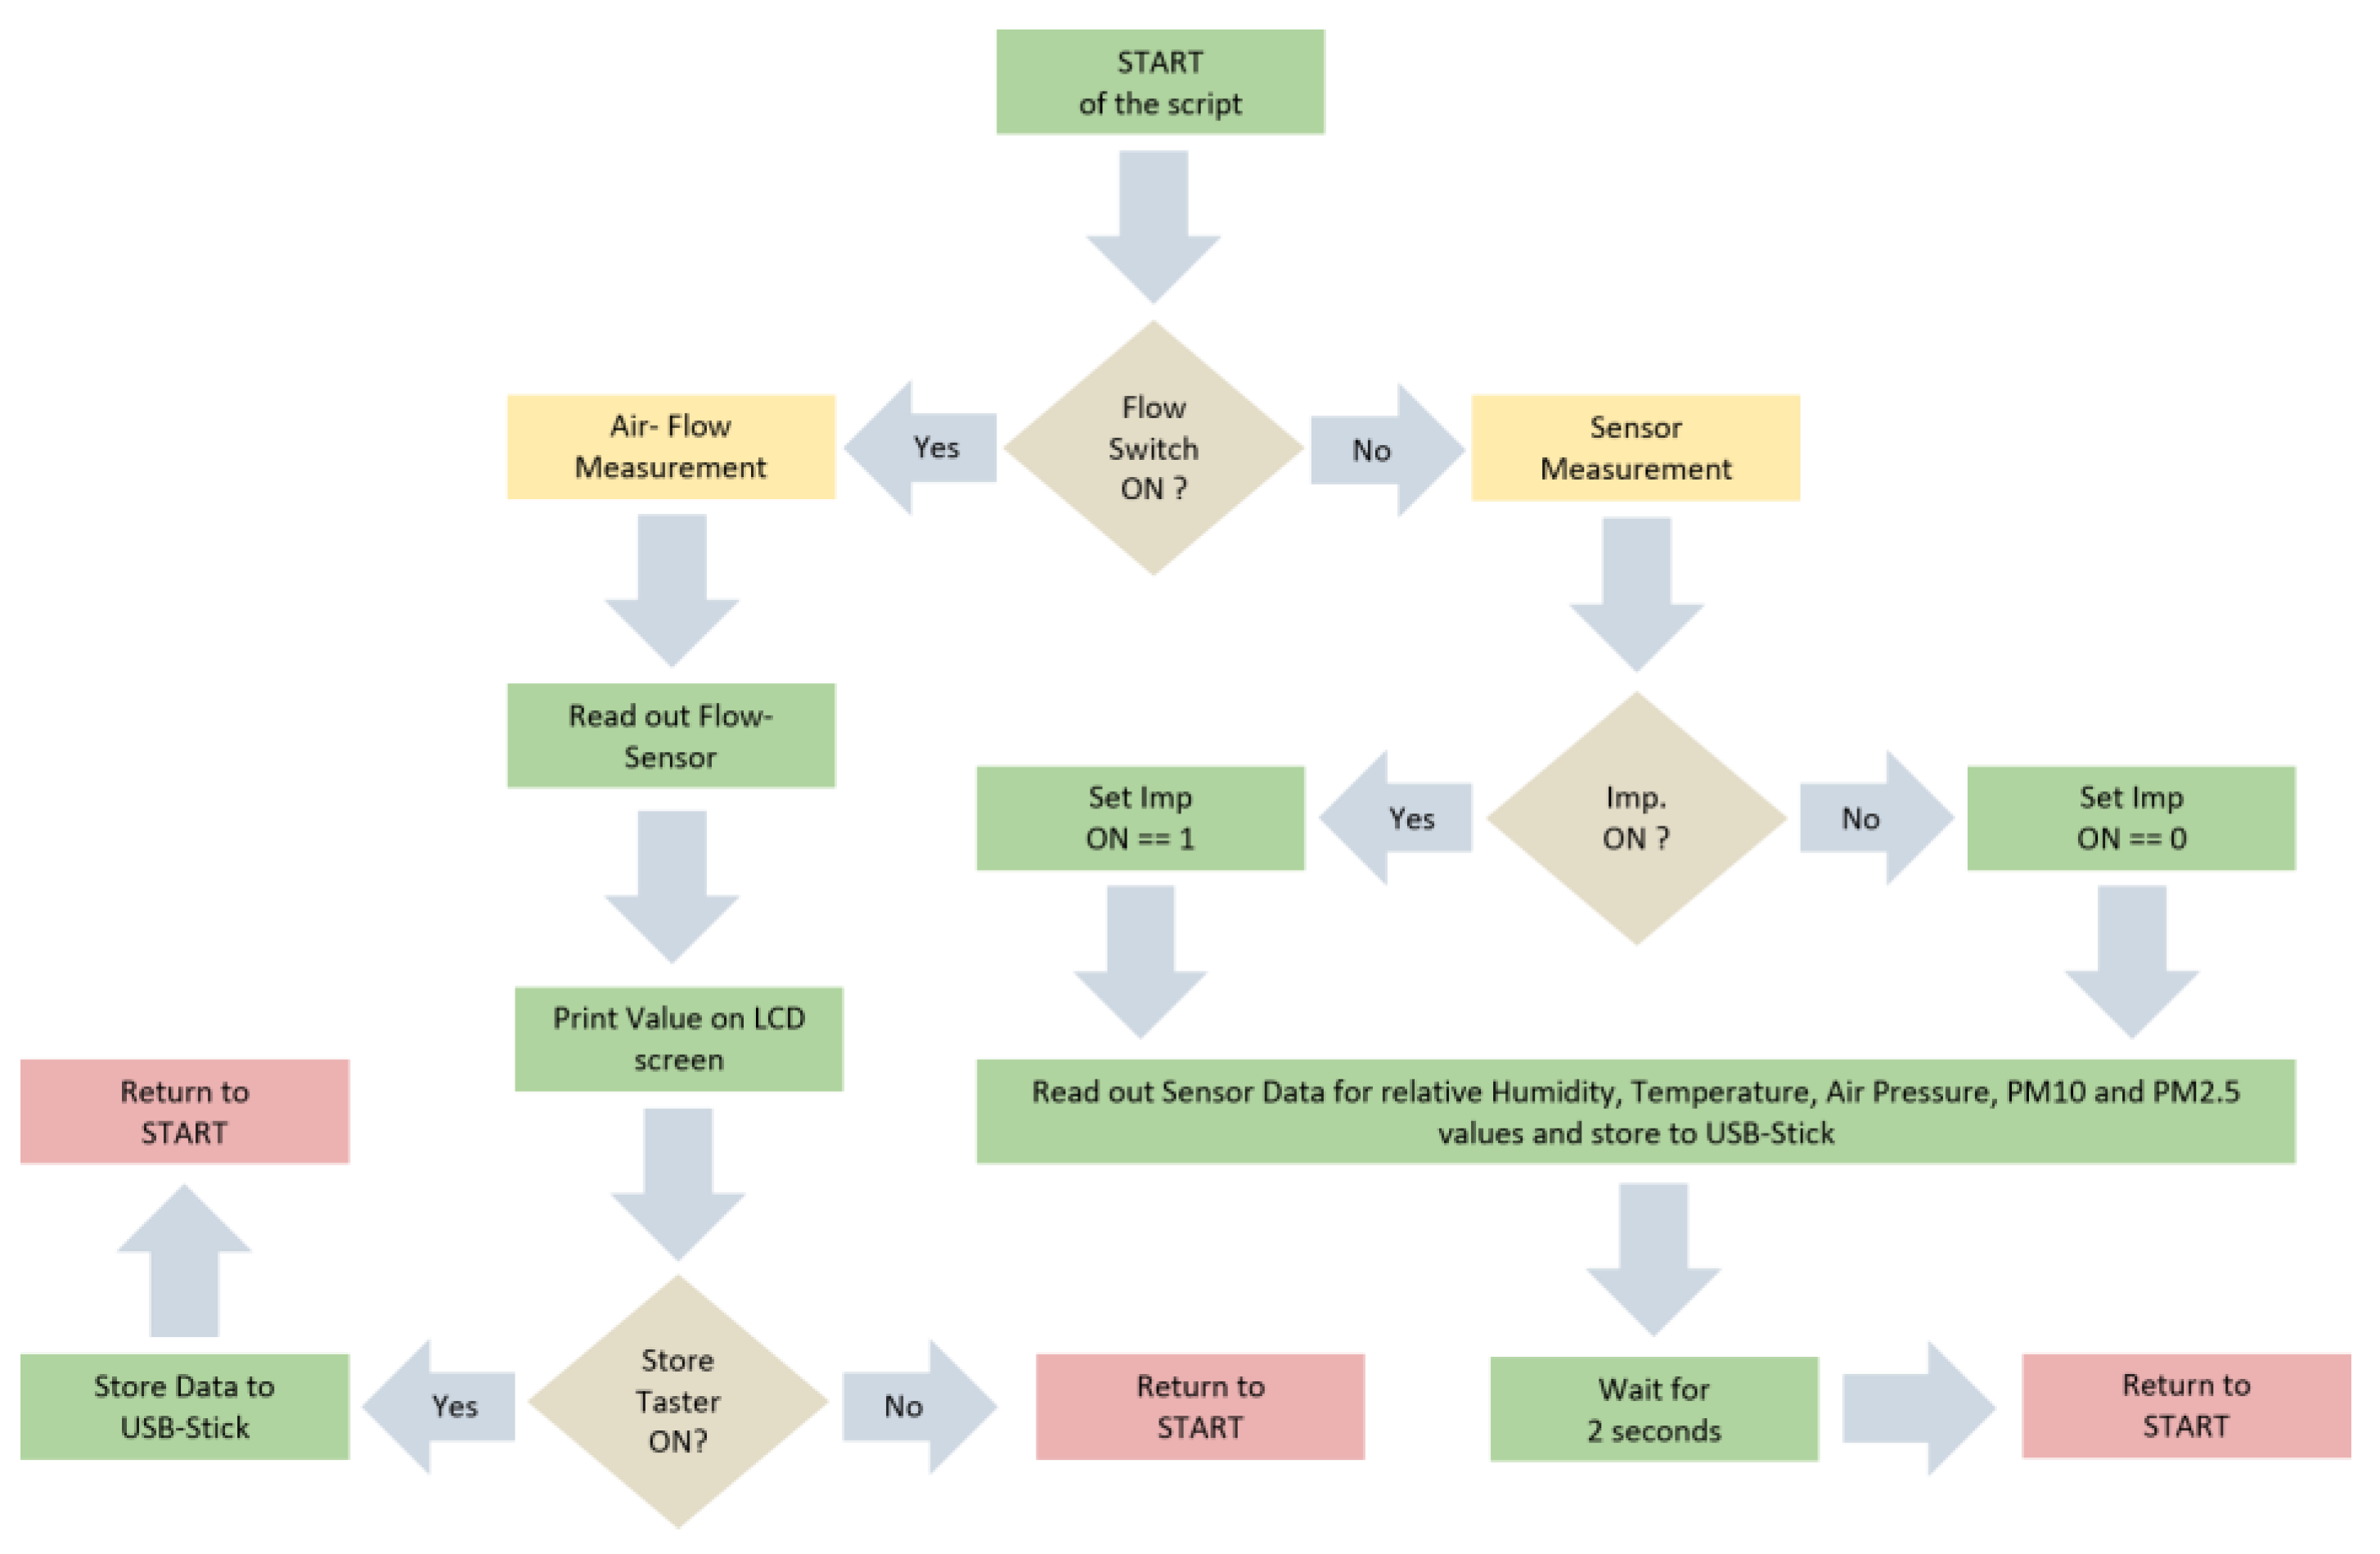
2.2. On-board Software

The software script for the onboard computer (Raspberry Pi 3), which was included in the Imp unit, was programmed in Python. Several modules for sensors and tools were adopted from freeware excess sites. The corresponding flow-chart is shown in Appendix A (Figure A1) and the full source code is available on request to the correspondent author. First, the algorithm checks if the switch for “Flow-Measurement” is set on. If that is the case, the program reads out the digital signal from the ADC connected to the flow-sensor and prints values on the screen of the flow module. Additionally, the software stores data of the flow-measurement on an USB stick, if the button for “Store” is pressed. The flow was adjusted by variating the resistance on the potentiometer in the first step. In the second step, 9–10 values were stored after having an intended constant airflow. When turning the switch off for the “Flow-Measurement”, the “Sensor-Measurement” program starts automatically. It reads out the OPC and the electric sensor and stores values on the USB-stick. If the Imp is switched on via the remote control, an electric signal is created at the input of the computer. Thereafter, an additional signal (“Imp. ON”) is stored in the data set of the air parameters. Thus, we are able to determine the moment of the measurement when we switched on the Imp system and started to sample the aerosol. Sampling intervals were stopped manually and Imp was turned off after 10 min, which gives the signal “Imp. OFF” in the recorded data.

2.3. Impinger Efficiency Test

2.3.1. Sampling of Standardized Aerosol Particles

In order to determine the sampling (i.e., removal) efficiency of the impinging system, polystyrene latex (PSL) spheres (Postnova Analytics, USA) were used as standardized aerosol particles. Similar tests have been described previously for other 3D-printed impinging systems [36]. Three droplets of PSL with 2 µm diameter were added to 100 mL ultrapure water, and an atomizer (Constant Output Atomizer Model 3076, TSI Incorporated, USA) was connected to the suspension and to purified compressed air. The created aerosol passed through a diffusion drying tube with 1.2 L min−1 and was then measured with an OPC (Model 1.109, Grimm Aerosol Techniques, Germany). After the particle concentration had stabilized for several minutes, the Imp was connected and the particle concentration after the Imp vial was measured again for another 10 min. Experiments were repeated with PSL spheres of 0.6 µm diameter.

2.3.2. Sampling of Biological INPs
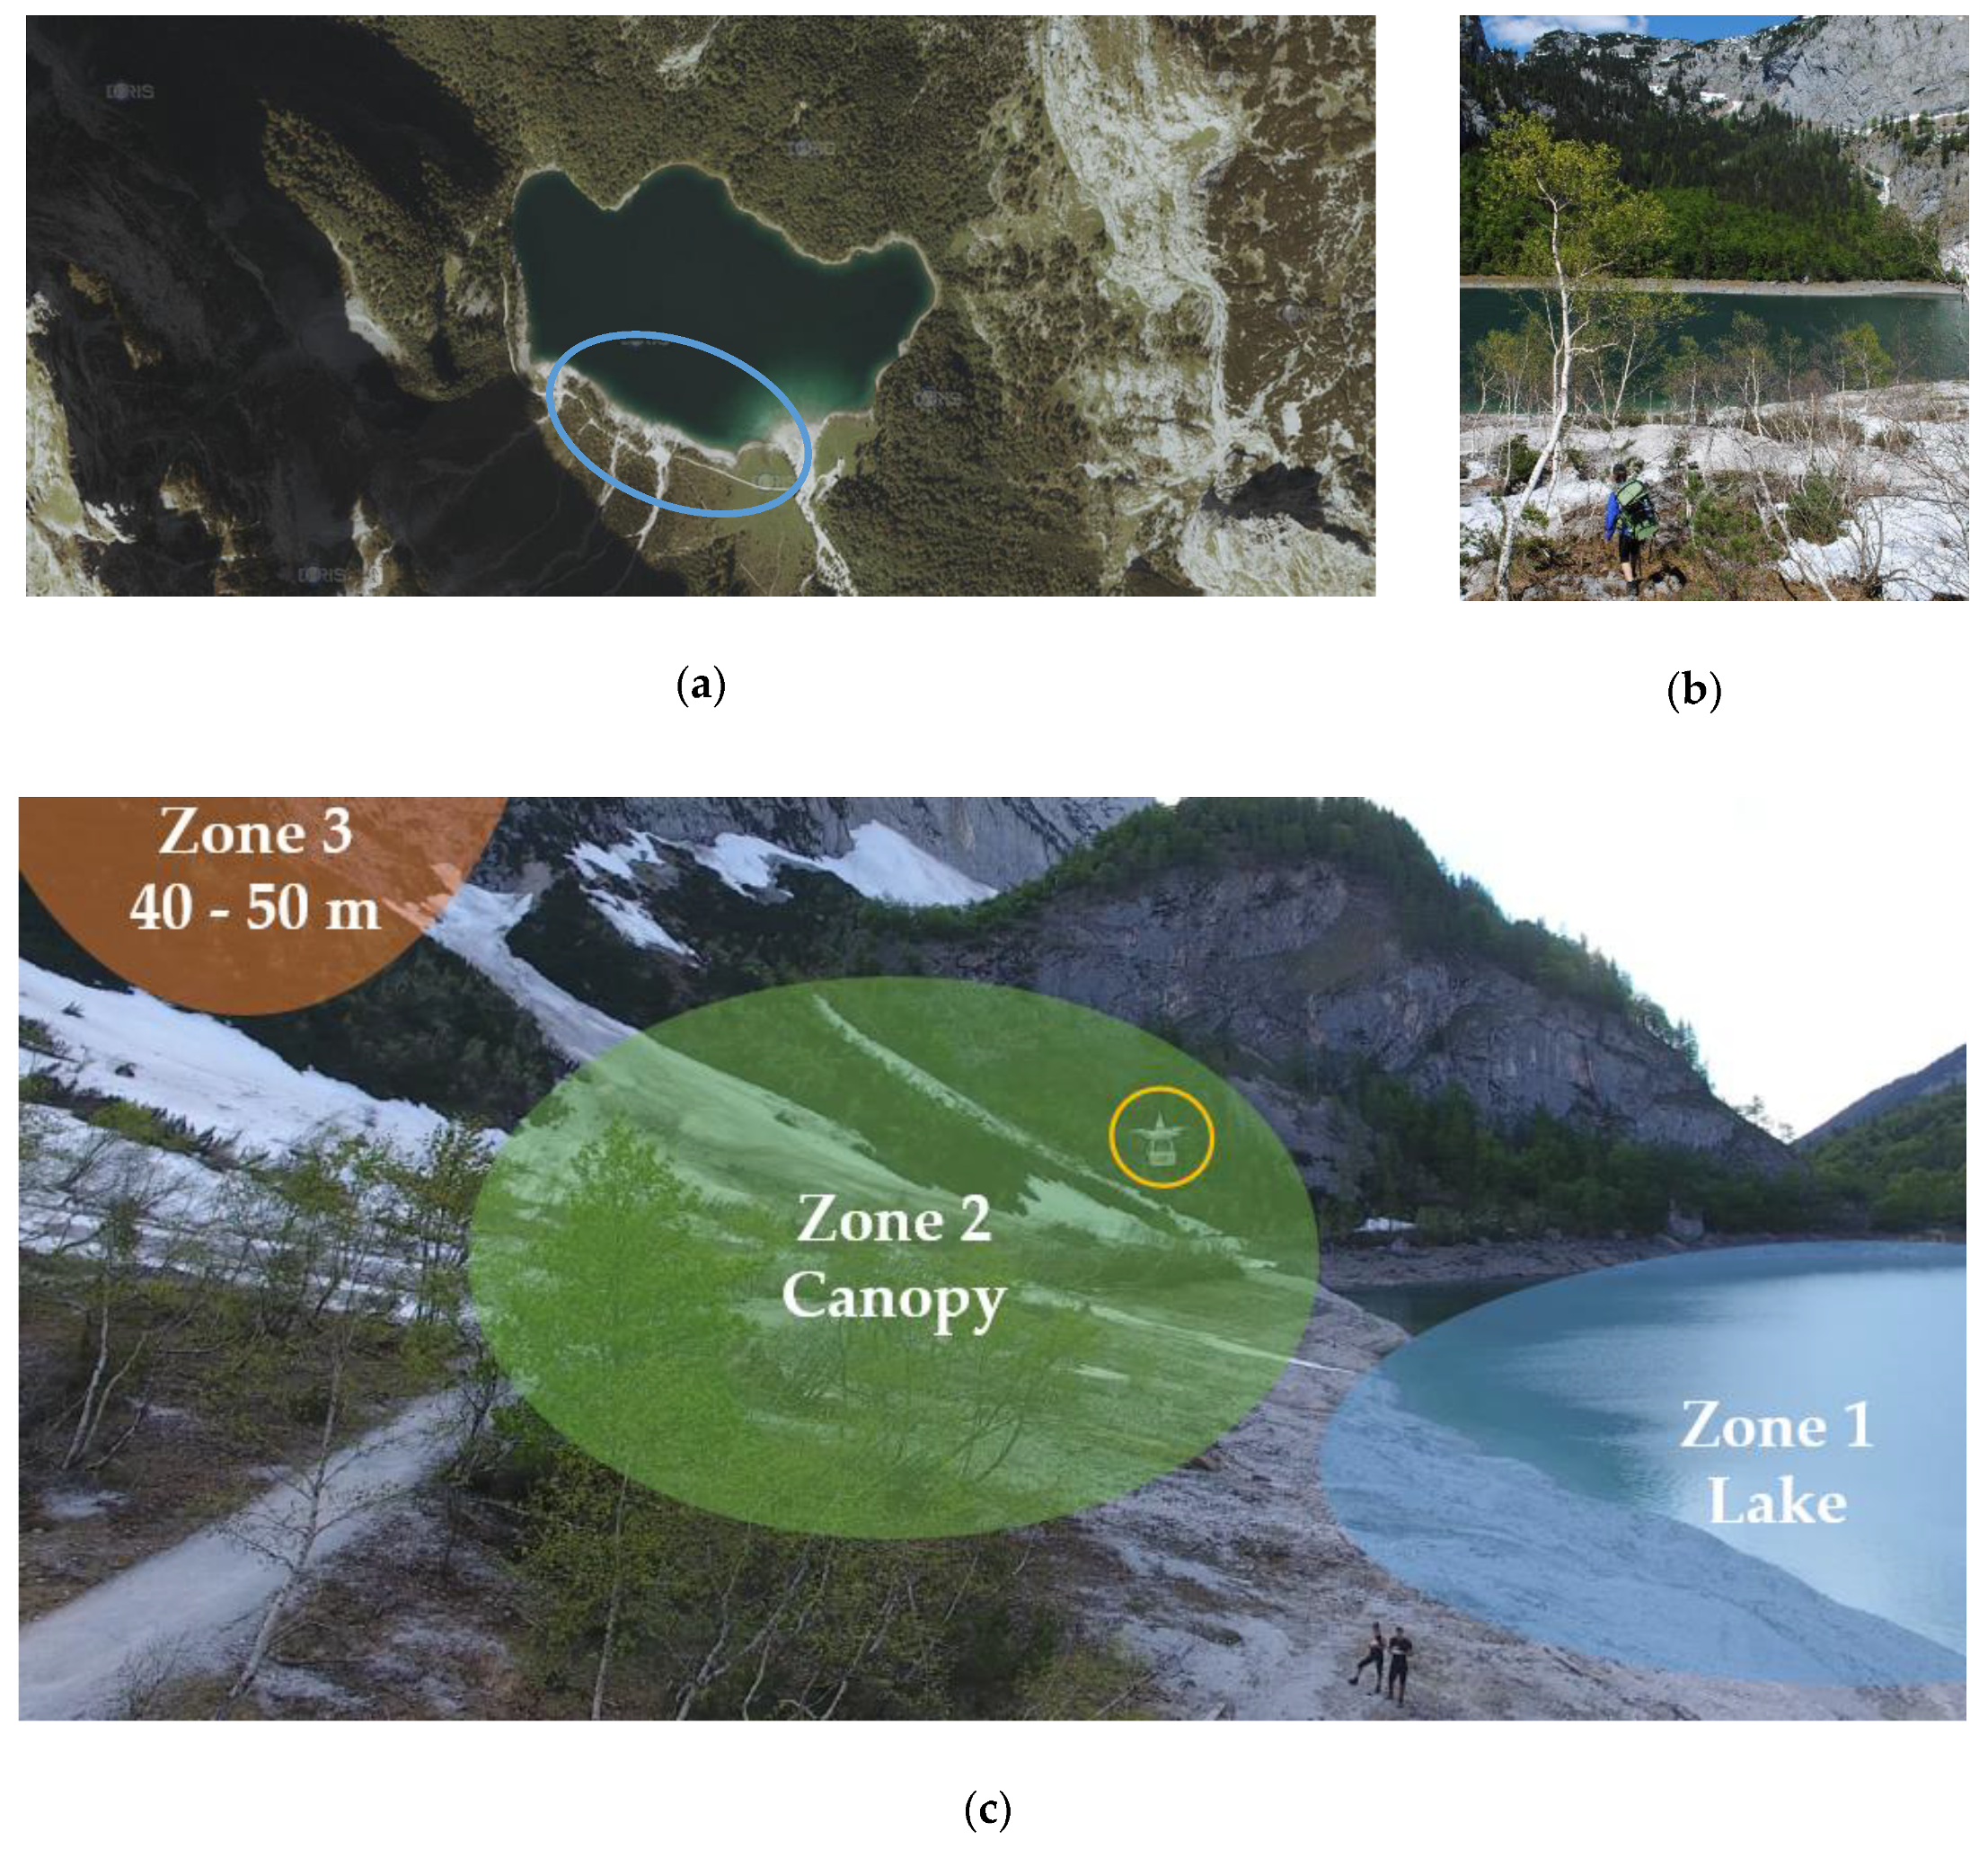
To determine the sampling (i.e., removal) efficiency for biological INPs from aerosols, we suspended 250 mg of birch pollen (Betula pendula, Thermo Fisher Scientific, USA) in 50 mL ultrapure water. After 6.5 h, the suspension was centrifuged, and the pollen grains were filtered off using syringes (5 mL Soft-Ject®, Henke-Sass Wolf, Germany) and sterile filters (0.2 µm cellulose acetate filter, VWR International, USA). The obtained solution, birch pollen washing water (BP-WW), containing INMs [14,17], was atomized by using cleaned compressed air and an atomizer (same set-up as described in 2.3.1 ). Aerosols were dried with a diffusion drying tube and then sampled with a flow rate of 1 L min−1 with two Imp vials in a row. Ice nucleation activity was measured as described later in Section 2.5.2. and the efficiency was calculated by comparing the number of ice nucleation active particles sampled in each vial.

2.4. Study Site

The focus of the first field campaign was on biological INPs emitted from terrestrial sources near a lake “Hinterer Gosausee” located 8 km away from the city Gosau, Upper Austria (Figure 3a). This study site is free from traffic emissions since it is located in the middle of the Austrian Alps surrounded by mountains. Many native birches of the species Betula pendula grow next to the lake (Figure 3b), making it attractive for field studies on biological INP emissions, since pollen, leaves and wood of Betula pendula contain INPs [17,22]. We divided sampling spots into three different areas (Figure 3c). Zone 1 was above the lake, zone 2 was within a few meters of the top of the birch canopy, and zone 3 was at heights between 40 and 50 m above ground. Both instrument packages were used on two drones to approach the zone of interest at the same time. Each zone was investigated with one flight for 10 min per day. The field study took place in the late pollen season (3–4 June 2019) and lasted for two days having mostly sunny weather with a few clouds. Table 1 provides data from all flights. In addition to the onboard sensor records, calculated weather data of the sampling site area are included in Appendix B (Figure A2).
For one sampling zone, both drones (one with the Imp setup, one with the CI setup) were operated simultaneously by two pilots. When each drone reached the desired location and altitude the instruments were powered on with a remote control. Once 10 min of sampling was completed, the Imp and CI instruments were switched off, and the drones landed. Samples of CI and Imp were taken from the drones. Imp vials were stored in a cooler box at 0 °C and CI samples stored in petri dishes. Additional flights proceeded in a similar manner.

2.5. Analytics

2.5.1. Fluorescence Microscopy

A fluorescence microscope was used that consisted of a 100 W metal-halide light source (Nikon Eclipse Ci-L, Nikon, Japan), a color-digital camera (DS-Fi3, Nikon, Japan) and several objectives (Plan Apo, 10× and 40×, Nikon, Japan). A Nikon software (NIS-Elements) was used to control the camera. An epifluorescence unit was used with an excitation filter at 465–495 nm, a dichromatic mirror at 505 nm, and an emission filter at 515–555 nm. A blank sample (heat-treated foils without particles) was recorded and showed a dark background (see Appendix C, Figure A3). Foils from the field campaign were analyzed with different objectives chosen to picture the particles of interest. Optical adjustments in greyscale to optimize intensity were performed in analog and digital functions.

2.5.2. Freezing Experiments

For ice nucleation measurements, the Vienna optical droplet crystallization analyzer (VODCA) technique was used as described elsewhere [17,22]. This method is based on a cryo-microscopy assay in immersion freezing mode. First, 2 µL of the sampled solution was pipetted directly on a glass slide (Menzel-Gläser, VWR, international). Additionally, 4 µL of an inert oil mixture (90 wt.% paraffin, AppliChem, Germany and 10 wt.% lanoline, Acros Organics, USA) was added and an emulsion was created by mixing the phases with a pipette tip. The glass slide carrying the sample emulsion was then placed into a cell, whereat a Peltier element is mounted and controlled by a DC power supply (DP831 A LXI, Rigol, USA). Temperature was measured via a thermocouple (PCE-T312 typ K, PCE, Germany) directly attached on the surface of the Peltier element with a thermo-glue (Wärmeleitkleber WLK DK10, Fischer Elektronik, Germany). A heat exchanger flooded with an ice-water mixture cools the heating side of the Peltier element. Three freezing events were recorded with a digital camera (MDC320 microQ L3CMOS, Hengtech, Germany), and measurements were performed by counting frozen droplets with a diameter in between 15 µm and 40 µm. The cooling rate was set to be 10 K min−1 via a LabView software. To evaluate the cumulative nuclei concentration [3,42], high active samples were diluted prior to the measurement to observe hetero- and homogeneous nucleation in the same experiment. As a reference, we measured BP-WW in different dilutions for heterogeneous ice nucleation and ultrapure water for homogeneous ice nucleation.

3. Results

3.1. Validation of the Impinging System

3.1.1. Efficiency for Sampling PSL Spheres

Imp efficiency was validated with PSL spheres as test aerosols, as described in the methods section. Figure 4 shows the number of particles per size interval (dN/dlogdp) plotted against the diameter (dp) recorded with the OPC. Each datapoint represents a measurement of constant values for 10 min. In the 2.0 µm PSL test run, two main intensity maxima are present (Figure 4a). One at around dp = 2000 nm correspondent to the analyzed PSL and another at dp < 300 nm. The gain at small diameters likely originated from water droplets without PSL spheres. Drying of water in the diffusion drying tubes leads to formation of an aerosol consisting of residues from solutes of the MilliQ system. The test run with 600 nm PSL shows one main maximum from PSL at around dp = 600 nm (Figure 4b).
The calculation of the efficiency E was carried out using Equation (1) as the following:
E = ( 1 C 2 C 1 ) × 100 % ,
where C1 is the aerosol concentration without using an Imp and C2 with using an Imp in the sampling domain. Efficiency was calculated for 2.0 µm sized PSL (interval 615–2250 nm) in the first and the 600 nm sized PSL (interval 375–750 nm) in the second experiment. Table 2 shows the recorded data (mean over 10 min) as well as the calculated efficiencies.
Efficiencies of 96% for the PSL spheres with 2.0 µm and 89% for the spheres with 0.6 µm were observed. We assumed the efficiency to be a function of particle sizes and due to the same mass density of both PSL spheres to be directly proportional to the accompanying particle mass. Our impinging system thus has a high degree of sampling efficiency for particles in the size range of 2.0 to 0.6 μm.

3.1.2. Efficiency for Sampling Biological INPs

Both samples from the Imp vials, which were installed in a row (see Section 2.3.2), showed heterogeneous ice nucleation starting at about −18 °C (onset freezing temperature). Figure 5a shows the freezing curves (fice against T) for both samples as well as ultrapure water and BP-WW as references. Furthermore, the solutions of the Imp vials were diluted prior to ice nucleation measurements to calculate the cumulative nuclei concentration K(T) as stated in Equation (2) [3,42].
K ( T ) = D   ln ( 1 f i c e ( T ) ) V ,
where D is the dilution factor, V is the analyzed droplet volume and fice(T) is the fraction of frozen droplets at a given temperature (counts of frozen droplets at T, divided by frozen droplets at the end of the experiment where T = −40 °C). Figure 5b shows the cumulative nuclei concentration plotted against the given temperature (one line represents the sum of three measurements). Since homogeneous ice nucleation starts bellow −34 °C (Figure 5a, grey line) with VODCA, the sampling efficiency was calculated by using K (34 °C) for the concentrations C1 and C2 in Equation (1). With K1(34 °C) = 0.89 pL−1 and K2(34 °C) = 0.14 pL−1 we calculated an efficiency of 84% for the Imp system to sample biological INPs, such as INMs from birch pollen.

3.2. Field Data

3.2.1. Sensor Monitoring

The data recorded during the flights were plotted against the time. Figure 6 and Figure 7 show the parameters for both sampling days. Vertical lines mark the moments when the Imp setup was turned on or off. To calculate the altitude of the sampled area the barometric Equation (3) was used,
h = ln ( p   p 0 1 ) R T M g   ,
where T is the average temperature, p the pressure in certain altitude, p0 the pressure at starting altitude, R the universal gas constant (8.314 J mol−1 K−1), M the molar mass of the Earth’s air (0.02896 kg mol−1), g the gravitational acceleration (9.806 m s−2) and h the resulting height above ground level. In this equation ideal gas law and constant temperature is assumed. Values of recorded data and the calculated height of the flights are listed below in Table 3.
Considering the temperature gradient during the drone flights on the second day (UA2), a sharp increase right after the start and a decrease in the landing period is visible on every flight measurement (Figure 7). We assume the temperature right above the ground to be cooler than at heights of several meters, since snow was covering the ground in the area where the UAS was started and landed (Figure 3b).
Relative humidity was stable during the flights of the first day (Figure 6), that is, SD ≤ 1.0%. Again, a strong change during take-off and landing intervals on the second day (Figure 7) was recorded, resulting in a SD ≥ 2.0%. High relative humidity at the ground level is likely the consequence of cooled air masses above the snow, and supports the hypothesis considering the low temperatures measured at the take-off and landing locations.
Air pressure decreases exponentially with ongoing heights as stated in the barometric formula (Equation (3)). Here, the variation of the temperature and relative humidity leads to deviations from idealized theoretical behavior. The mean values show that the approached heights of the sampling zones were reached. However, sampling in zone 3 required the setup to be turned on a few seconds before the height was reached, since otherwise the flight time would not be enough to sample for 10 full minutes. Thus, the SD for measurements in zone 3 is higher compared to zone 1 and 2.
PM10 and PM2.5 values recorded with the onboard OPC indicate background aerosol concentrations. The corresponding values were between 0.9 and 10.6 µg m−3 with a significant exception in the first flight in zone 2 raising up to more than 100 µg m−3 (Figure 6). This could be a wind-induced peak in aerosol particle concentrations of biological and/or inorganic matter. Furthermore, the stirred-up dust during landing periods can be seen as peaks in the recorded data after the Imp system was switched off (vertical lines in Figure 6 and Figure 7).

3.2.2. Fluorescent Particles

Fluorescence microscopy showed auto-fluorescent matter on stage D of the impaction foils (size scale 0.25 µm). Figure 8a,b a high concentration of fluorescent particles, smaller than 1 µm, is visible. Figure 8c gives a higher magnification of these particles. This matter is from smallest scale of bioaerosols and could belong to small bacteria (<1 µm), non-living biomolecules (sub-pollen particles) or secondary organic aerosols (SOA) or fragments of broken particles. A few bigger particles in stage A were recorded during the experiments, but too little to make quantified statements. One example is shown in Figure 8d. The particle size and morphology indicate a pollen grain. Other samples from impactor stages B and C are much less intense in auto-fluorescent properties and therefore no significant images were recorded. We assume particle concentrations to be too low in this size scale to capture enough fluorescent particles in 10 min sampling time, (i.e., 90 L sampled air volume). A picture of a control aluminum foil, which was not exposed to air, is attached in Appendix C. Non-fluorescent particles were not recorded during this work. However, the fluorescent particles sampled in this experiment highlight the presence of organic matter at the smallest scale of bioaerosols.

3.2.3. Ice Nucleation Activity

Ice nucleation experiments showed heterogeneous freezing events (>−34 °C) in a few droplets of the emulsions analyzed (Figure 9). The onset temperature of the freezing period was higher for the samples from zone 1 and 2 of both sampling days (UA1 IMP 1: −28.7 °C, UA1 IMP 2: −27.5 °C, UA2 IMP 1: −27.4 °C and UA2 IMP 2: −30.6 °C) than for ultrapure water (< −34.0 °C). However, heterogeneous freezing events occurred less frequently in analyzed droplets than homogenous ice nucleation (UA1 IMP 1 5.6%, UA1 IMP 2 10.6%, UA2 IMP 1 6.9% and UA2 IMP 2 8.1%). A comparison with BP-WW as reference points out a low concentration of INPs in the analyzed samples. Compared to birch pollen, a biological mass concentration of 0.05 µg mL−1 shows a similar percentage of heterogeneous frozen droplets in the nucleation experiments (9.3%). The onset temperature of INMs from birch pollen (−18.1 °C) [17,18,43] and many other biological INPs is higher compared to inorganic [3,44,45,46] or SOA particles [47]. Thus, an inorganic INP or SOA could be responsible for the ice nucleation activity in our samples.

4. Discussion

Recent advances in quadcopter technology, including the ability to mount large sensor packages on the drones [38], have unleashed the potential for new opportunities to study the emission and transport of biological material in the lower atmosphere. Biological materials can act as INPs and thus have an important impact on precipitation processes. In the Austrian Alps, INPs have the potential to influence locations of emission sources directly. We developed DAPSI to study sources and near-surface transport of biological INPs in the field. DAPSI was designed to attach to commercial quadcopters to collect biological particles within about 100 m of the Earth’s surface. Sampling efficiency tests with standardized aerosol particles (96% for 2.0 µm PSL and 89% for 600 nm PSL, Table 2) indicated a size dependent efficiency for the self-built Imp. This is also shown in previous work from Powers et al. regarding a 3D-printed Imp, where the resulting efficiency for 3.0 µm PSL spheres was 99% and for 1.0 µm 75% [36]. Even though correlations between efficiency and PSL size can be seen, the Imp in this study has different geometries and fluid values compared to others, which could explain some of the discrepancies in these observations. The main advantage of our impinging system is the low weight and low cost of the sampling tubes, which can be easily changed during field studies. Regarding the sampling efficiency of biological INPs, tests with aerosolized INMs from birch pollen showed an efficiency level of 86%. Thus, sampling of airborne INMs is possible with the Imp setup of DAPSI. Cryo-microscopy, observing emulsified droplets made directly out of the solution, can be performed if the concentration of INPs (or INMs) is high enough. To determine the minimum amount of INMs to be detected with VODCA, we diluted suspended pollen grains in water, until measured heterogeneous ice nucleation events were less frequent than 10% (Figure 9). This way we obtained a sampling weight of 0.05 µg biomass per mL which is enough to detect heterogeneous freezing events (9.3%) with VODCA. Considering the weight of one pollen grain to be 6.25 ng for Betula pendula [48], a minimum of 120 grains must release INMs to trigger heterogeneous freezing in our sampled solutions. With a flow rate of 1 L min−1, and a flight time of 10 min, the INMs content of 12 grains L−1, that is, 1.2 104 grains per m3 is necessary for positive ice nucleation measurements. Studies of pollination next to the emission source show the content of pollen to be higher by orders of magnitude (104–105 grains per m3) [49,50] than the average concentration measured with pollen traps in urban areas over the whole year (1 to 103 grains per m3) [51]. Hence, DAPSI and similar impinging systems provide the possibility to sample INMs of pollen grains for atmospheric research. Furthermore, freezing assays with more sampling volume have been used in the literature [52,53]. Thus, the detection of INMs in lower concentrations is possible.
Beside sampling abiotic or unculturable particles, the culturing of ice nucleation active microbes (e.g., Pseudomonas syringae [5] or fungi in the genus Fusarium [15,33]) must be considered as a possible method to accumulate INPs for measurements. Our system provides the possibility to investigate culturable microorganisms by replacing the Imp vial with a sterilized one and using a buffered solution. This, however, was not an objective of this study. Since our goal was to measure the content of INPs in aerosols that are already biosynthesized, no cultivation was necessary. Special focus was given to reactions of BAPs with ultrapure water in the subsequent ice nucleation experiments. Therefore, no additives or buffers were used and samples were stored at −20 °C right after field studies to keep biological activity and decomposition as low as possible.
To our knowledge, this is the first application of small rotary-wing drones to analyze INPs in the lower atmosphere. Previous investigations focused on the usage of fixed-wing drones as sampling platforms. In 2017, Schrod et al. analyzed INPs in low and mid altitudes by using remote controlled planes (i.e., Cruiser and Skywalker) [54]. Using this setup in further studies enabled the comparison of Lidar-based measurements with INPs sampled in several elevations [55,56]. The feasibility to combine Lidar data with in-situ measurements from UASs provide estimations of vertical INP concentration profiles before and after cloud formation [55]. Furthermore, it is possible to investigate the role of aerosols containing INPs in atmospheric ice formation [56]. Since deposition freezing mode techniques were used, our results are not directly comparable to these studies. In field campaigns with fixed-wing drones a runway for landing is necessary. The main advantage of small and lightweight drones is the possibility to perform measurements in a range of geographic locations, even when they are challenging to reach (e.g., remote mountains and lakes). However, the weight of our Imp and CI system is quite at the upper limit for the drones. Our setup does not allow a significant increase of flight time without losing onboard sensorics and analytical tools. To increase the sampling air volume, we suggest supplying the Imp systems with higher flow rates and expanding flight times. Using larger rotary-wing drones (e.g., hexacopters as used in Crazzolara et al. [39]) would enable larger payloads, perhaps including both instrument packages (Imp and CI) on the same drone. However, larger drones can produce more propeller downwash, and therefore the air motion needs to be taken into consideration. To reduce influences of self-induced air movements, balloon-based sampling can be carried out. First campaigns in this field took place in England, Norway and Svalbard [57]. Porter et al. sampled INPs with an unmanned remote-controlled balloon equipment (total weight 9 kg) [57]. Results show INPs to be present in a high variation of concentrations and sizes in the northern hemisphere. However, the location of the sampling device is influenced by the wind whenever using a balloon as a carrier. Therefore, this method limits the measurements in spatial resolutions. Furthermore, a small-scale OPC was used in the equipment of the balloon setup in connection with an Arduino microcontroller board.
Small programmable computers in combination with lightweight sensors have become a promising application for research in aerosol science, for example, measurements with small UASs like multicopter drones [58]. Nevertheless, a combination to the DJI logic in form of transmitting data during flights and/or sending signals for turning on or off devices is still challenging due to the closed hardware and software setup of the DJI Phantom 4. Drones with an open access to the technical setup (e.g., 3DR Solo) would provide perspectives in remote controlling and data transmissions with onboard equipment. Furthermore, sampling with well-defined waypoints (i.e., automatic approaching of GPS-points) could increase spatial resolution of flights with UASs. In one example, this technique was used to sample water with DJI Phantom 4 drones above freshwater lakes and analyze the resulting culturable microorganisms [59].
Fractionized sampling with the CI system during the field study, and subsequent analysis with fluorescence microscopy, showed intense particle concentrations for matter smaller than 1 µm. Small airborne bacteria [60], humic-like substances (HULIS) [61], and SOA [62,63,64] represent possible fluorescent particles in this size category reported in literature [65]. The formation of SOA is based on reactions of biological induced emissions of volatile organic compounds (VOCs) with reactive oxygen species (O2, O3, H2O2, ROOH, NOx) and photons [63]. Hence, SOA can be present above rural spots, since terrestrial ecosystems emit VOCs [66].
Results of ice nucleation experiments show onset freezing temperatures in the range between -31 °C and −27 °C for samples in zone 1 and zone 2. Thus, the occurrence of INPs is indicated. Ice nucleation measurements of SOA show similar onset temperatures in literature [47]. Furthermore soot and dust particles nucleate ice at this temperature range [3]. Still, the percentage of heterogeneous frozen droplets remains quite small for all analyzed samples (<15%). We conclude ice nucleation matter to be present above the observed lake and canopy of Betula pendula. Nevertheless, the concentration of the sampled INPs was too low in our cryo-microscopic assay to calculate parameters like the mean freezing temperature or cumulative nuclei concentration. The possibility of measuring ice nucleation with larger droplet sizes [52,53,67], should be considered for future investigations. Thus, analysis with a quantitative methodology, and therefore investigation of transports by creating vertical profiles of INPs concentrations, would be achievable. Furthermore, the impact of atmospheric aging on ice nucleation activity of sampled INPs could be analyzed by measurements in vertical and horizontal resolution in following studies.

5. Conclusions

We conclude DAPSI to be a promising approach developed as a tool for bioaerosol sampling issues. Characterization of the sampling device and first test flights showed future perspectives in INP emission and transport investigations. However, to use DAPSI for field research, several adjustments need to be considered in the future. To measure INPs quantitatively and relate data to scientific questions, a methodology with higher sensitivity is necessary. Therefore, either the sampled air volume, or the sensibility of the freezing assay, needs to be increased. The first adjustment is achievable by using drones with longer flight times and/or increasing the flow rate of the Imp system. Second, method improvements are accessible by analyzing samples with a freezing assay, that includes more sampling volume in the procedure. After these improvements, DAPSI needs to be validated during long-term field campaigns, where INPs can be collected and analyzed in a quantitative matter. In a future scenario with an enhanced DAPSI system attached to drones with higher payloads, biological INPs can be sampled in a wide field of sampling spots up to hundreds of meters above the ground and in nearly every landscape. Possible sampling spots are directly above the canopy of forests, blooming cornfields, and fresh and saltwater lakes. Ice nucleation experiments can be performed without any treatment and fluorescent microscopy shows auto-fluorescent biological material directly as it was collected. Emission processes of non-living bioaerosols (pollen, plant tissues, bacterial- and fungal-fragments) and living bioaerosols (bacteria cells, fungal spores, algae cells) become detectable using this technique. By replacing the ultrapure water with a buffered solution, the system provides an opportunity to sample and cultivate living airborne microorganisms. Therefore, DAPSI has potential in analyzing the transport processes of cultivatable fungi and bacteria in the lower troposphere.
To sum up, DAPSI provides a lightweight, low-cost and easy controllable system for bioaerosol research. Transport processes of high concentrated bio-particles in the lower atmosphere and their ice nucleation and fluorescent characteristics can be analyzed by using an improved methodology with DAPSI or similar systems in combination with sUASs.

Author Contributions

Conceptualization, P.B., T.M.S., H.G. and D.G.S.; Methodology, P.B., T.M.S., J.B. and J.G.; Software, P.B.; Validation, J.B., J.G., P.B. and T.M.S.; Investigations—field measurements, P.B. and T.M.S.; Resources, A.K.-G. and D.G.S.; Data curation, P.B., T.M.S. and H.G.; Writing—original draft preparation, P.B. and T.M.S.; Writing—review and editing, H.G., D.G.S., J.B. and A.K.-G.; Visualization, T.M.S. and P.B.; Supervision and allocation of financial means, H.G.; Project administration, T.M.S. All authors have read and agreed to the published version of the manuscript.

Funding

This research was internally funded by TU Wien.

Acknowledgments

The authors would like to thank Bundesforste Österreich for giving the permission to sample in Gosau. Furthermore, we thank David Wimberger and David Stinglmayr for their support in the laboratory. Teresa M. Seifried and Paul Bieber would like to thank Philipp Baloh for training to fly multicopters. Paul Bieber would like to thank Florian Kleissner for advises concerning technical equipment for remote controlled vehicles. A video of the drone carrying DAPSI above the canopy of birch trees in Gosau, Upper Austria is available online: http://doi.org/10.5281/zenodo.3588399. The source code of the software is available on request to the correspondent author.

Conflicts of Interest

The authors declare no conflict of interest. The funders had no role in the design of the study; in the collection, analyses, or interpretation of data; in the writing of the manuscript, or in the decision to publish the results.

Appendix A

Figure A1. Flowchart of the software script of the main program running on the Raspberry Pi 3 written in Python. Green: Command, Yellow: Start of Sub-Program, Brown: Query, Red: Return to start.
Remotesensing 12 00552 g0a1

Appendix B

Figure A2. Weather data of the first 10 days in June from Gosau, Austria, Europe (47.58°N / 13.53°E, 1215 m altitude). Data adopted from www.meteoblue.com. The green columns highlight time intervals of field studies. No precipitation was recorded since the first of June.
Remotesensing 12 00552 g0a2

Appendix C

Figure A3. Fluorescence microscope image of a control aluminum foil, which was not exposed to air.
Remotesensing 12 00552 g0a3

References

  1. Pruppacher, H. A new look at homogeneous ice nucleation in supercooled water drops. J. Atmos. Sci. 1995, 52, 1924–1933. [Google Scholar] [CrossRef] [Green Version]
  2. Koop, T.; Luo, B.; Tsias, A.; Peter, T. Water activity as the determinant for homogeneous ice nucleation in aqueous solutions. Nature 2000, 406, 611. [Google Scholar] [CrossRef] [PubMed]
  3. Murray, B.; O’sullivan, D.; Atkinson, J.; Webb, M. Ice nucleation by particles immersed in supercooled cloud droplets. Chem. Soc. Rev. 2012, 41, 6519–6554. [Google Scholar] [CrossRef] [PubMed] [Green Version]
  4. Petters, M.D.; Wright, T.P. Revisiting ice nucleation from precipitation samples. Geophys. Res. Lett. 2015, 42, 8758–8766. [Google Scholar] [CrossRef]
  5. Failor, K.; Schmale Iii, D.; Vinatzer, B.; Monteil, C.L. Ice nucleation active bacteria in precipitation are genetically diverse and nucleate ice by employing different mechanisms. ISME J. 2017, 11, 2740. [Google Scholar] [CrossRef] [PubMed] [Green Version]
  6. Aho, K.; Weber, C.; Christner, B.; Vinatzer, B.; Morris, C.; Joyce, R.; Failor, K.; Werth, J.; Bayless-Edwards, A.; Schmale, D. Spatiotemporal patterns of microbial composition and diversity in precipitation. Ecol. Monogr. 2019, 90, e01394. [Google Scholar]
  7. Schnell, R.; Vali, G. Atmospheric ice nuclei from decomposing vegetation. Nature 1972, 236, 163. [Google Scholar] [CrossRef]
  8. Vali, G.; Christensen, M.; Fresh, R.; Galyan, E.; Maki, L.; Schnell, R. Biogenic ice nuclei. Part II: Bacterial sources. J. Atmos. Sci. 1976, 33, 1565–1570. [Google Scholar] [CrossRef] [Green Version]
  9. Maki, L.R.; Galyan, E.L.; Chang-Chien, M.-M.; Caldwell, D.R. Ice nucleation induced by Pseudomonas syringae. Appl. Environ. Microbiol. 1974, 28, 456–459. [Google Scholar] [CrossRef] [Green Version]
  10. Lindow, S.E.; Arny, D.C.; Upper, C.D. Bacterial ice nucleation: a factor in frost injury to plants. Plant Physiol. 1982, 70, 1084–1089. [Google Scholar] [CrossRef]
  11. Wolber, P.K.; Deininger, C.A.; Southworth, M.W.; Vandekerckhove, J.; Van Montagu, M.; Warren, G.J. Identification and purification of a bacterial ice-nucleation protein. Proc. Natl. Acad. Sci. USA 1986, 83, 7256–7260. [Google Scholar] [CrossRef] [Green Version]
  12. Burke, M.; Gusta, L.; Quamme, H.; Weiser, C.; Li, P. Freezing and injury in plants. Annu. Rev. Plant Physiol. 1976, 27, 507–528. [Google Scholar] [CrossRef]
  13. Lee, R.E., Jr.; Costanzo, J.P. Biological ice nucleation and ice distribution in cold-hardy ectothermic animals. Annu. Rev. Physiol. 1998, 60, 55–72. [Google Scholar] [CrossRef] [PubMed]
  14. Fröhlich-Nowoisky, J.; Hill, T.C.; Pummer, B.G.; Yordanova, P.; Franc, G.D.; Pöschl, U. Ice nucleation activity in the widespread soil fungus Mortierella alpina. Biogeosciences 2015, 12, 1057–1071. [Google Scholar] [CrossRef] [Green Version]
  15. Kunert, A.T.; Pöhlker, M.L.; Tang, K.; Krevert, C.S.; Wieder, C.; Speth, K.R.; Hanson, L.E.; Morris, C.E.; Schmale Iii, D.G.; Pöschl, U.; et al. Macromolecular fungal ice nuclei in Fusarium: effects of physical and chemical processing. Biogeosciences 2019, 16, 4647–4659. [Google Scholar] [CrossRef] [Green Version]
  16. Zachariassen, K.E.; Kristiansen, E. Ice nucleation and antinucleation in nature. Cryobiology 2000, 41, 257–279. [Google Scholar] [CrossRef]
  17. Pummer, B.; Bauer, H.; Bernardi, J.; Bleicher, S.; Grothe, H. Suspendable macromolecules are responsible for ice nucleation activity of birch and conifer pollen. Atmos. Chem. Phys. 2012, 12, 2541–2550. [Google Scholar] [CrossRef] [Green Version]
  18. Diehl, K.; Matthias-Maser, S.; Jaenicke, R.; Mitra, S.K. The ice nucleating ability of pollen: Part II. Laboratory studies in immersion and contact freezing modes. Atmos. Res. 2002, 61, 125–133. [Google Scholar] [CrossRef]
  19. Després, V.; Huffman, J.A.; Burrows, S.M.; Hoose, C.; Safatov, A.; Buryak, G.; Fröhlich-Nowoisky, J.; Elbert, W.; Andreae, M.; Pöschl, U.; et al. Primary biological aerosol particles in the atmosphere: a review. Tellus B Chem. Phys. Meteorol. 2012, 64, 15598. [Google Scholar] [CrossRef] [Green Version]
  20. Taylor, P.; Flagan, R.; Miguel, A.; Valenta, R.; Glovsky, M. Birch pollen rupture and the release of aerosols of respirable allergens. Clin. Exp. Allergy 2004, 34, 1591–1596. [Google Scholar] [CrossRef]
  21. Visez, N.; Chassard, G.; Azarkan, N.; Naas, O.; Sénéchal, H.; Sutra, J.-P.; Poncet, P.; Choël, M. Wind-induced mechanical rupture of birch pollen: potential implications for allergen dispersal. J. Aerosol Sci. 2015, 89, 77–84. [Google Scholar] [CrossRef]
  22. Felgitsch, L.; Baloh, P.; Burkart, J.; Mayr, M.; Momken, M.E.; Seifried, T.M.; Winkler, P.; Schmale, D.G., III; Grothe, H. Birch leaves and branches as a source of ice-nucleating macromolecules. Atmos. Chem. Phys. 2018, 18, 16063–16079. [Google Scholar] [CrossRef] [Green Version]
  23. Joung, Y.S.; Ge, Z.; Buie, C.R. Bioaerosol generation by raindrops on soil. Nat. Commun. 2017, 8, 14668. [Google Scholar] [CrossRef] [PubMed]
  24. Hynynen, J.; Niemistö, P.; Viherä-Aarnio, A.; Brunner, A.; Hein, S.; Velling, P. Silviculture of birch (Betula pendula Roth and Betula pubescens Ehrh.) in northern Europe. Forestry 2009, 83, 103–119. [Google Scholar] [CrossRef]
  25. Huffman, J.A.; Prenni, A.; DeMott, P.; Pöhlker, C.; Mason, R.; Robinson, N.; Fröhlich-Nowoisky, J.; Tobo, Y.; Després, V.; Garcia, E. High concentrations of biological aerosol particles and ice nuclei during and after rain. Atmos. Chem. Phys. 2013, 13, 6151. [Google Scholar] [CrossRef] [Green Version]
  26. Wright, T.P.; Hader, J.D.; McMeeking, G.R.; Petters, M.D. High relative humidity as a trigger for widespread release of ice nuclei. Aerosol Sci. Technol. 2014, 48, i. [Google Scholar] [CrossRef] [Green Version]
  27. Gosselin, M.I.; Rathnayake, C.M.; Crawford, I.; Pöhlker, C.; Fröhlich-Nowoisky, J.; Schmer, B.; Després, V.R.; Engling, G.; Gallagher, M.; Stone, E. Fluorescent bioaerosol particle, molecular tracer, and fungal spore concentrations during dry and rainy periods in a semi-arid forest. Atmos. Chem. Phys. 2016, 16, 15165–15184. [Google Scholar] [CrossRef] [Green Version]
  28. Huffman, J.; Sinha, B.; Garland, R.; Snee-Pollmann, A.; Gunthe, S.; Artaxo, P.; Martin, S.; Andreae, M.; Pöschl, U. Size distributions and temporal variations of biological aerosol particles in the Amazon rainforest characterized by microscopy and real-time UV-APS fluorescence techniques during AMAZE-08. Atmos. Chem. Phys. 2012, 12, 11997–12019. [Google Scholar] [CrossRef] [Green Version]
  29. Pratt, K.A.; DeMott, P.J.; French, J.R.; Wang, Z.; Westphal, D.L.; Heymsfield, A.J.; Twohy, C.H.; Prenni, A.J.; Prather, K.A. In situ detection of biological particles in cloud ice-crystals. Nat. Geosci. 2009, 2, 398–401. [Google Scholar] [CrossRef]
  30. Brady, J.M.; Stokes, M.D.; Bonnardel, J.; Bertram, T.H. Characterization of a quadrotor unmanned aircraft system for aerosol-particle-concentration measurements. Environ. Sci. Technol. 2016, 50, 1376–1383. [Google Scholar] [CrossRef]
  31. Chilinski, M.; Markowicz, K.; Markowicz, J. Observation of vertical variability of black carbon concentration in lower troposphere on campaigns in Poland. Atmos. Environ. 2016, 137, 155–170. [Google Scholar] [CrossRef]
  32. Chiliński, M.T.; Markowicz, K.M.; Kubicki, M. UAS as a support for atmospheric aerosols research: Case study. Pure Appl. Geophys. 2018, 175, 3325–3342. [Google Scholar] [CrossRef] [Green Version]
  33. Schmale, D.G., III; Dingus, B.R.; Reinholtz, C. Development and application of an autonomous unmanned aerial vehicle for precise aerobiological sampling above agricultural fields. J. Field Robot. 2008, 25, 133–147. [Google Scholar] [CrossRef]
  34. Lin, B.; Bozorgmagham, A.; Ross, S.D.; Schmale, D.G., III. Small fluctuations in the recovery of fusaria across consecutive sampling intervals with unmanned aircraft 100 m above ground level. Aerobiologia 2013, 29, 45–54. [Google Scholar] [CrossRef]
  35. Lin, B.; Ross, S.D.; Prussin, A.J., II; Schmale, D.G., III. Seasonal associations and atmospheric transport distances of fungi in the genus Fusarium collected with unmanned aerial vehicles and ground-based sampling devices. Atmos. Environ. 2014, 94, 385–391. [Google Scholar] [CrossRef]
  36. Powers, C.W.; Hanlon, R.; Grothe, H.; Prussin, A.J. Coordinated sampling of microorganisms over freshwater and saltwater environments using an unmanned surface vehicle (USV) and a small unmanned aircraft system (sUAS). Front. Microbiol. 2018, 9. [Google Scholar] [CrossRef] [PubMed] [Green Version]
  37. Jimenez-Sanchez, C.; Hanlon, R.; Aho, K.A.; Powers, C.; Morris, C.E.; Schmale, D.G., III. Diversity and ice nucleation activity of microorganisms collected with a small unmanned aircraft system (sUAS) in France and the United States. Front. Microbiol. 2018, 9, 1667. [Google Scholar] [CrossRef] [Green Version]
  38. Nolan, P.; Pinto, J.; González-Rocha, J.; Jensen, A.; Vezzi, C.; Bailey, S.; de Boer, G.; Diehl, C.; Laurence, R.; Powers, C. Coordinated unmanned aircraft system (UAS) and ground-based weather measurements to predict lagrangian coherent structures (LCSs). Sensors 2018, 18, 4448. [Google Scholar] [CrossRef] [Green Version]
  39. Crazzolara, C.; Ebner, M.; Platis, A.; Miranda, T.; Bange, J.; Junginger, A. A new multicopter-based unmanned aerial system for pollen and spores collection in the atmospheric boundary layer. Atmos. Meas. Tech. 2019, 12, 1581–1598. [Google Scholar] [CrossRef] [Green Version]
  40. Villa, T.; Salimi, F.; Morton, K.; Morawska, L.; Gonzalez, F. Development and validation of a UAV based system for air pollution measurements. Sensors 2016, 16, 2202. [Google Scholar] [CrossRef] [Green Version]
  41. Roldán, J.; Joossen, G.; Sanz, D.; del Cerro, J.; Barrientos, A. Mini-UAV based sensory system for measuring environmental variables in greenhouses. Sensors 2015, 15, 3334–3350. [Google Scholar] [CrossRef] [PubMed] [Green Version]
  42. Vali, G. Quantitative evaluation of experimental results an the heterogeneous freezing nucleation of supercooled liquids. J. Atmos. Sci. 1971, 28, 402–409. [Google Scholar] [CrossRef]
  43. Dreischmeier, K.; Budke, C.; Wiehemeier, L.; Kottke, T.; Koop, T. Boreal pollen contain ice-nucleating as well as ice-binding ‘antifreeze’ polysaccharides. Sci. Rep. 2017, 7, 41890. [Google Scholar] [CrossRef] [PubMed] [Green Version]
  44. Niemand, M.; Möhler, O.; Vogel, B.; Vogel, H.; Hoose, C.; Connolly, P.; Klein, H.; Bingemer, H.; DeMott, P.; Skrotzki, J. A particle-surface-area-based parameterization of immersion freezing on desert dust particles. J. Atmos. Sci. 2012, 69, 3077–3092. [Google Scholar] [CrossRef]
  45. Häusler, T.; Gebhardt, P.; Iglesias, D.; Rameshan, C.; Marchesan, S.; Eder, D.; Grothe, H. Ice Nucleation Activity of Graphene and Graphene Oxides. J. Phys. Chem. C 2018, 122, 8182–8190. [Google Scholar] [CrossRef] [PubMed] [Green Version]
  46. Connolly, P.; Möhler, O.; Field, P.; Saathoff, H.; Burgess, R.; Choularton, T.; Gallagher, M. Studies of heterogeneous freezing by three different desert dust samples. Atmos. Chem. Phys. 2009, 9, 2805–2824. [Google Scholar] [CrossRef] [Green Version]
  47. Wang, B.; Lambe, A.T.; Massoli, P.; Onasch, T.B.; Davidovits, P.; Worsnop, D.R.; Knopf, D.A. The deposition ice nucleation and immersion freezing potential of amorphous secondary organic aerosol: Pathways for ice and mixed-phase cloud formation. J. Geophys. Res. Atmos. 2012, 117. [Google Scholar] [CrossRef]
  48. Brown, H.M.; Irving, K. The size and weight of common allergenic pollens: an investigation of their number per microgram and size distribution. Allergy 1973, 28, 132–137. [Google Scholar] [CrossRef]
  49. Šikoparija, B.; Mimić, G.; Panić, M.; Marko, O.; Radišić, P.; Pejak-Šikoparija, T.; Pauling, A. High temporal resolution of airborne Ambrosia pollen measurements above the source reveals emission characteristics. Atmos. Environ. 2018, 192, 13–23. [Google Scholar] [CrossRef]
  50. Faegri, K.; Iversen, J.; Kaland, P.E.; Krzywinski, K. Textbook of Pollen Analysis; Blackburn Press: Lancashire, UK, 2000. [Google Scholar]
  51. Williams, C.G.; Després, V. Northern Hemisphere forests at temperate and boreal latitudes are substantial pollen contributors to atmospheric bioaerosols. For. Ecol. Manag. 2017, 401, 187–191. [Google Scholar] [CrossRef]
  52. Kunert, A.T.; Lamneck, M.; Helleis, F.; Pöschl, U.; Pöhlker, M.L.; Fröhlich-Nowoisky, J. Twin-plate Ice Nucleation Assay (TINA) with infrared detection for high-throughput droplet freezing experiments with biological ice nuclei in laboratory and field samples. Atmos. Meas. Tech. 2018, 11, 6327–6337. [Google Scholar] [CrossRef] [Green Version]
  53. DeMott, P.J.; Möhler, O.; Cziczo, D.J.; Hiranuma, N.; Petters, M.D.; Petters, S.S.; Belosi, F.; Bingemer, H.G.; Brooks, S.D.; Budke, C. The Fifth International Workshop on Ice Nucleation phase 2 (FIN-02): laboratory intercomparison of ice nucleation measurements. Atmos. Meas. Tech. Online 2018, 11. [Google Scholar] [CrossRef] [Green Version]
  54. Schrod, J.; Weber, D.; Drücke, J.; Keleshis, C.; Pikridas, M.; Ebert, M.; Cvetković, B.; Nickovic, S.; Marinou, E.; Baars, H.; et al. Ice nucleating particles over the Eastern Mediterranean measured by unmanned aircraft systems. Atmos. Chem. Phys. 2017, 17, 4817–4835. [Google Scholar] [CrossRef] [Green Version]
  55. Marinou, E.; Tesche, M.; Nenes, A.; Ansmann, A.; Schrod, J.; Mamali, D.; Tsekeri, A.; Pikridas, M.; Baars, H.; Engelmann, R.; et al. Retrieval of ice-nucleating particle concentrations from lidar observations and comparison with UAV in situ measurements. Atmos. Chem. Phys. 2019, 19, 11315–11342. [Google Scholar] [CrossRef] [Green Version]
  56. Ansmann, A.; Mamouri, R.-E.; Bühl, J.; Seifert, P.; Engelmann, R.; Hofer, J.; Nisantzi, A.; Atkinson, J.D.; Kanji, Z.A.; Sierau, B.; et al. Ice-nucleating particle versus ice crystal number concentrationin altocumulus and cirrus layers embedded in Saharan dust:a closure study. Atmos. Chem. Phys. 2019, 19, 15087–15115. [Google Scholar] [CrossRef] [Green Version]
  57. Porter, G.C.E.; Sikora, S.N.F.; Adams, M.P.; Proske, U.; Harrison, A.D.; Tarn, M.D.; Brooks, I.M.; Murray, B.J. Resolving the size of ice-nucleating particles with a balloon deployable aerosol sampler: The SHARK. Atmos. Meas. Tech. 2019. [Google Scholar] [CrossRef]
  58. Barbieri, L.; Kral, S.T.; Bailey, S.C.; Frazier, A.E.; Jacob, J.D.; Reuder, J.; Brus, D.; Chilson, P.B.; Crick, C.; Detweiler, C. Intercomparison of small unmanned aircraft system (sUAS) measurements for atmospheric science during the LAPSE-RATE campaign. Sensors 2019, 19, 2179. [Google Scholar] [CrossRef] [Green Version]
  59. Benson, J.; Hanlon, R.; Seifried, T.M.; Baloh, P.; Powers, C.W.; Grothe, H.; Schmale, D.G. Microorganisms collected from the surface of freshwater lakes using a drone water sampling system (DOWSE). Water 2019, 11, 157. [Google Scholar] [CrossRef] [Green Version]
  60. Gao, M.; Jia, R.; Qiu, T.; Han, M.; Song, Y.; Wang, X. Seasonal size distribution of airborne culturable bacteria and fungi and preliminary estimation of their deposition in human lungs during non-haze and haze days. Atmos. Environ. 2015, 118, 203–210. [Google Scholar] [CrossRef]
  61. Lin, P.; Huang, X.-F.; He, L.-Y.; Yu, J.Z. Abundance and size distribution of HULIS in ambient aerosols at a rural site in South China. J. Aerosol Sci. 2010, 41, 74–87. [Google Scholar] [CrossRef]
  62. Shiraiwa, M.; Yee, L.D.; Schilling, K.A.; Loza, C.L.; Craven, J.S.; Zuend, A.; Ziemann, P.J.; Seinfeld, J.H. Size distribution dynamics reveal particle-phase chemistry in organic aerosol formation. Proc. Natl. Acad. Sci. USA 2013, 110, 11746–11750. [Google Scholar] [CrossRef] [PubMed] [Green Version]
  63. Carlton, A.; Wiedinmyer, C.; Kroll, J. A review of Secondary Organic Aerosol (SOA) formation from isoprene. Atmos. Chem. Phys. 2009, 9, 4987–5005. [Google Scholar] [CrossRef] [Green Version]
  64. Ofner, J.; Krüger, H.U.; Grothe, H.; Schmitt-Kopplin, P.; Whitmore, K.; Zetzsch, C. Physico-chemical characterization of SOA derived from catechol and guaiacol – a model substance for the aromatic fraction of atmospheric HULIS. Atmos. Chem. Phys. 2011, 11, 1. [Google Scholar] [CrossRef] [Green Version]
  65. Lee, H.J.; Laskin, A.; Laskin, J.; Nizkorodov, S.A. Excitation–emission spectra and fluorescence quantum yields for fresh and aged biogenic secondary organic aerosols. Environ. Sci. Technol. 2013, 47, 5763–5770. [Google Scholar] [CrossRef] [PubMed]
  66. Holopainen, J.K.; Gershenzon, J. Multiple stress factors and the emission of plant VOCs. Trends Plant Sci. 2010, 15, 176–184. [Google Scholar] [CrossRef] [PubMed]
  67. Hill, T.C.; Moffett, B.F.; DeMott, P.J.; Georgakopoulos, D.G.; Stump, W.L.; Franc, G.D. Measurement of ice nucleation-active bacteria on plants and in precipitation by quantitative PCR. Appl. Environ. Microbiol. 2014, 80, 1256–1267. [Google Scholar] [CrossRef] [PubMed] [Green Version]
Figure 1. (a) Photograph of the impactor setup (left) as well as the impinger setup (right) attached to the drones before starting the experiment; (b) Photograph of both drones carrying the sampling units during a coordinated test flight at low altitude.
Remotesensing 12 00552 g001
Figure 2. Flow chart of the strategy for sampling and analyses. Bioaerosols of different size distributions (yellow = 2.5 µm, green = 1.0 µm, orange = 0.50 µm, blue = 0.25 µm) are sampled by either a cascade impactor (CI) on one drone or an impinger (Imp) on another drone. Analysis of cascade impactor (CI) samples (aluminum foils with different size ranges) were conducted using fluorescence microscopy, and ice nucleation measurements of Imp samples were performed using cryo-microscopy.
Remotesensing 12 00552 g002
Figure 3. Sampling site located near Gosau, Austria, Europe. (a) Satellite image of the lake called “Hinterer Gosausee”, adapted from Doris interMAP, Land Oberösterreich. The area of interest is encircled in blue (47.50°N, 13.55°E). (b) Picture of the sampling spot on 3rd June, showing birches on the waterfront of the lake. The ground was still covered with snow. (c) Picture taken from a flight of the drone, carrying the impinger setup (encircled in yellow) in sampling zone 2 (green spot) above the birch canopy.
Remotesensing 12 00552 g003
Figure 4. Experiments of the impinger sampling efficiency tests using polystyrene latex (PSL) spheres. Diagrams show particle concentrations against diameters with (orange) and without (blue) impinger in logarithmic scales. The left graph (a) illustrates 2.0 µm PSL and the right one (b) 600 nm PSL. Vertical lines indicate the integration range used for efficiency calculations.
Remotesensing 12 00552 g004
Figure 5. Experiments for impinger (Imp) sampling efficiency regarding biological ice nucleation particles (INPs). One line represents three measurements: (a) freezing experiments of the first and second Imp which sampled biological INPs aerosol in a row, birch pollen washing water (BP-WW) and ultrapure water as references. Vertical grey line divides homogeneous (left) and heterogeneous (right) freezing events. (b) cumulative nuclei concentration (K(T)) for both Imp vials.
Remotesensing 12 00552 g005
Figure 6. Sensor data from the first sampling day (UA1), showing PM10, PM2.5, temperature, pressure, relative humidity in time dependency and the sampling intervals of the impinger (on to off).
Remotesensing 12 00552 g006
Figure 7. Sensor data from the second sampling day (UA2), showing PM10, PM2.5, temperature, pressure, relative humidity in time dependency and the sampling intervals of the impinger (on to off).
Remotesensing 12 00552 g007
Figure 8. Fluorescent particles sampled during flights with the cascade impactor in different zones (lake = 1, canopy = 2, altitude between 40 and 50 m = 3); (a) first day, zone 3, stage D (UA1 CI3 D) ×10, (b) second day, zone 1, stage D (UA2 CI1 D) ×10, (c) first day, zone 3, stage D (UA1 CI3 D) ×40 and (d) first day, zone 3, stage A (UA1 CI3 A) ×40.
Remotesensing 12 00552 g008
Figure 9. Freezing experiments of the analyzed impinger (Imp) samples (frozen fraction of droplets vs. temperature) from the field campaign in Upper Austria (UA) on two different days (1,2) and in three different sampling zones (lake = 1, canopy = 2, altitude between 40 and 50 m = 3). Vertical grey line divides homogeneous (left) and heterogeneous (right) freezing events. Ultrapure water and birch pollen washing water (BP-WW) in a concentration of 0.05 µg mL−1 were measured as a reference.
Remotesensing 12 00552 g009
Table 1. Flight data of the field campaign in Upper Austria (UA) with the drone-based aerosol particles sampling impinger/impactor (DAPSI) are listed below. Samples are sorted by location and date (e.g., UA1, Upper Austria, day 1), sampling system (impinger (Imp) or cascade impactor (CI)) and flight zones (lake = 1, canopy = 2, altitude between 40 and 50 m = 3). The time of flights is given in the Central Europe Summer Time (CEST).
Sample TypeDateStart Time of Sampling (CEST)Duration [min]Approached ZoneMax. Height [m] 1Flow-Rate ± SD [L min−1]Sampled Air Volume [L]
UA1 Imp 13 June 201917:30101101.05 ± 0.03 210.5
UA1 Imp 2 3 June 201916:30102231.01 ± 0.03 210.1
UA1 Imp 33 June 201919:00103521.10 ± 0.03 211.0
UA1 CI 13 June 201917:30101119.02 ± 0.28 290.2
UA1 CI 23 June 201916:30102228.99 ± 0.10 289.9
UA1 CI 33 June 201918:30103539.10 ± 0.03 291.0
UA2 Imp 14 June 201919:23101101.05 ± 0.05 2 10.5
UA2 Imp 24 June 201917:34102141.00 ± 0.01 2 10.0
UA2 Imp 34 June 201918:22103591.09 ± 0.03 2 10.9
UA2 CI 14 June 201919:1110189.01 ± 0.08 290.1
UA2 CI 24 June 201917:34102119.03 ± 0.03 290.3
UA 2CI 34 June 201918:22103548.98 ± 0.04 389.8
1 According to data from DJI, Flight App, 2 Mean value of 10 flow measurements, 3 Mean value of 9 flow measurements
Table 2. Mean measurement values and calculated efficiencies of the Imp PSL validation tests.
PSL Size C 1   [ cm 3 ] C 2   [ cm 3 ] E [%]
2.0 μm116596
0.6 μm 2632889
Table 3. Monitored flight data of the first field campaign in Upper Austria (UA) measured with the SEN-BME680 sensor on the impinger (Imp) setup of DAPSI in different sampling zones (lake = 1, canopy = 2, altitude between 40 and 50 m = 3). Mean value and standard deviation (SD) for temperature (Temp.), pressure (Pres.), relative humidity (r. H.) and calculated heights (c. H.) are listed below. For PM10 and PM2.5 the interval (minima to maxima) of the measured data with the optical particle counter (SDS011) is given.
Sample TypeTemp.
Mean ± SD [°C]
Pres.
Mean ± SD [hPa]
r. H.
Mean ± SD [%]
PM 10
Min.-Max. [µg m³]
PM 2.5 Min.-Max. [µg m³]c. H.
Mean ± SD [m]
UA1 Imp 119.3 ± 0.2887.5 ± 0.236.0 ± 0.91.1 − 4.60.9 − 1.79.5 ± 2.2
UA1 Imp 2 20.2 ± 0.4885.9 ± 0.432.3 ± 0.81.1 − 121.50.9 − 108.816.8 ± 3.6
UA1 Imp 319.3 ± 0.4881.9 ± 1.437.1 ± 1.01.1 − 3.51.0 − 1.845.8 ± 13.8
UA2 Imp 119.4 ± 0.9884.4 ± 0.340.1 ± 2.60.8 − 10.60.8 − 2.98.4 ± 3.0
UA2 Imp 219.6 ± 0.9884.2 ± 0.237.5 ± 2.01.7 − 5.51.3 − 2.510.7 ± 2.2
UA2 Imp 319.8 ± 1.0880.9 ± 1.437.9 ± 3.12.0 − 7.91.2 − 2.442.3 ± 13.8

