1. Introduction
During the rescue and recovery phases following an earthquake, damaged buildings may indicate the locations of trapped people [
1]. Hence, building damage maps are key to post-earthquake rescue and reconstruction. The use of traditional manual field survey methods to obtain building damage information presents relatively high accuracy and confidence. However, there are still some shortcomings such as large workload, low efficiency, high costs and unintuitive information, meaning that these methods cannot meet the requirements for the fast acquisition of building damage information [
2]. With the progress of sensors and space technology, remote sensing can now provide detailed spatial and temporal information for target areas, whilst usually requiring little field work. Therefore, remote sensing has been widely used in various post-disaster rescue operations, being particularly important for earthquake-stricken areas where it is often difficult to conduct field surveys for the first time [
3]. To some extent, previous studies have proved that relatively accurate information of building damage can be obtained from remote sensing data [
4].
Many methods to extract information about building damage, caused by earthquakes, from remote sensing images have been presented [
5,
6,
7]. These can be divided into single-temporal and multi-temporal evaluation methods according to the number of images being used. In single-temporal evaluation methods, only one kind of post-earthquake image is used for the extraction of information. Multi-temporal evaluation methods, in turn, use at least two-temporal images. Due to the influence of data acquisition, sensor revisiting cycle, and filming angle and time, multi-temporal evaluation methods are difficult to be applied in practice [
8]. Single-temporal evaluation methods are less restricted and have become an effective technical means to directly extract and evaluate the damage information of buildings using remote sensing images after earthquakes [
9]. Chen [
10] used object-oriented methods to segment remote sensing images, and classified image objects by Classification and Decision Tree (CART), Support Vector Machine (SVM), and Random Forest (RF) in the machine learning methods. The results showed that, among the three machine learning methods, RF was the best in extracting information about damaged buildings. Janalipour et al. [
11] used high spatial resolution remote sensing images as a background to manually select and extract features based on the fuzzy genetic algorithm, establishing a semi-automatic detection system for building damage. This system has higher robustness and precision compared with machine learning methods such as the RF and SVM. In the single-temporal evaluation methods, the spectral, textural and morphological features of the image are mainly used for its classification. This process is often based on the object-oriented classification algorithm for the extraction of information about building destruction [
12,
13,
14]. However, these object-oriented classification methods present problems such as difficulties in feature space selection and unsatisfactory image segmentation.
In recent years, deep learning technology has achieved great success in the image application field [
15], becoming more and more popular in the applications of remote sensing [
16]. Convolutional Neural Network (CNN) is a common method of deep learning. Since LeNet5 [
17] has achieved satisfactory results in handwritten number recognition tasks compared with traditional methods, a large number of deeper and more complex CNN, such as AlexNet [
18], VGGNet [
19], Inception V3 [
20], and ResNet [
21], have made a great breakthrough in large-scale image classification tasks. These CNN models went deeper and deeper, reaching 152 layers by the time of ResNet. A deeper network layer means that deeper image features can be extracted, making the image classification results more accurate. Compared with traditional object-oriented classification methods, CNN-based methods can select and extract classification features automatically, presenting a strong self-learning ability and robustness [
22]. Meng Chen et al. [
23] proposed a method combining image segmentation with CNN to extract building damage information from remote sensing images, and effectively extracted the damage information of buildings after earthquakes. However, its robustness is largely affected by the accuracy of image segmentation, which affects the effectiveness of the successive tasks and limits practical applications.
With the continuous improvement of basic Geographic Information System (GIS) data in recent years, their applications for the extraction of richer and clearer disaster information have become more popular [
24,
25]. Ye et al. [
8] combined the block information derived from urban road vector data in post-earthquake remote sensing images and constructed a multi-feature classification model with building blocks as its unit. The results showed that this method had high accuracy for the classification of the damage degree of groups of buildings. Therefore, GIS data can be applied to the damage assessment of buildings. In other words, we can accurately achieve the boundary segmentation of the groups of buildings by overlaying the analysis of GIS data and remote sensing images instead of using image segmentation.
To overcome the problem of feature selection and image segmentation in object-oriented classification, this paper proposes a new strategy to extract the damage information of groups of buildings via remote sensing images by combining CNN and GIS data. Using block vector data, all buildings in each block were treated as a group of buildings unit, and the Inception V3 network in CNN was used as the basic classification network to classify the damaged groups of buildings, which was compared with traditional machine learning methods. The rest of this paper is organized as follows.
Section 2 describes the details of the method.
Section 3 provides the descriptions of the study area.
Section 4 presents the analysis of the experimental results. Finally,
Section 5 concludes this paper.
2. Method
2.1. The Basic Architecture of Inception V3
The basic architecture of CNN usually includes alternating overlapping convolution and pooling layers, full connection layer, input layer, and output layer. The convolution layer usually includes convolution operation and nonlinear transformation [
26]. In the Inception V3 network, besides these basic structures, there are some special operations such as the addition of the well-designed Inception Module to replace the last fully connected layer with global average pooling and the addition of the BN (Batch Normalization) [
27] method.
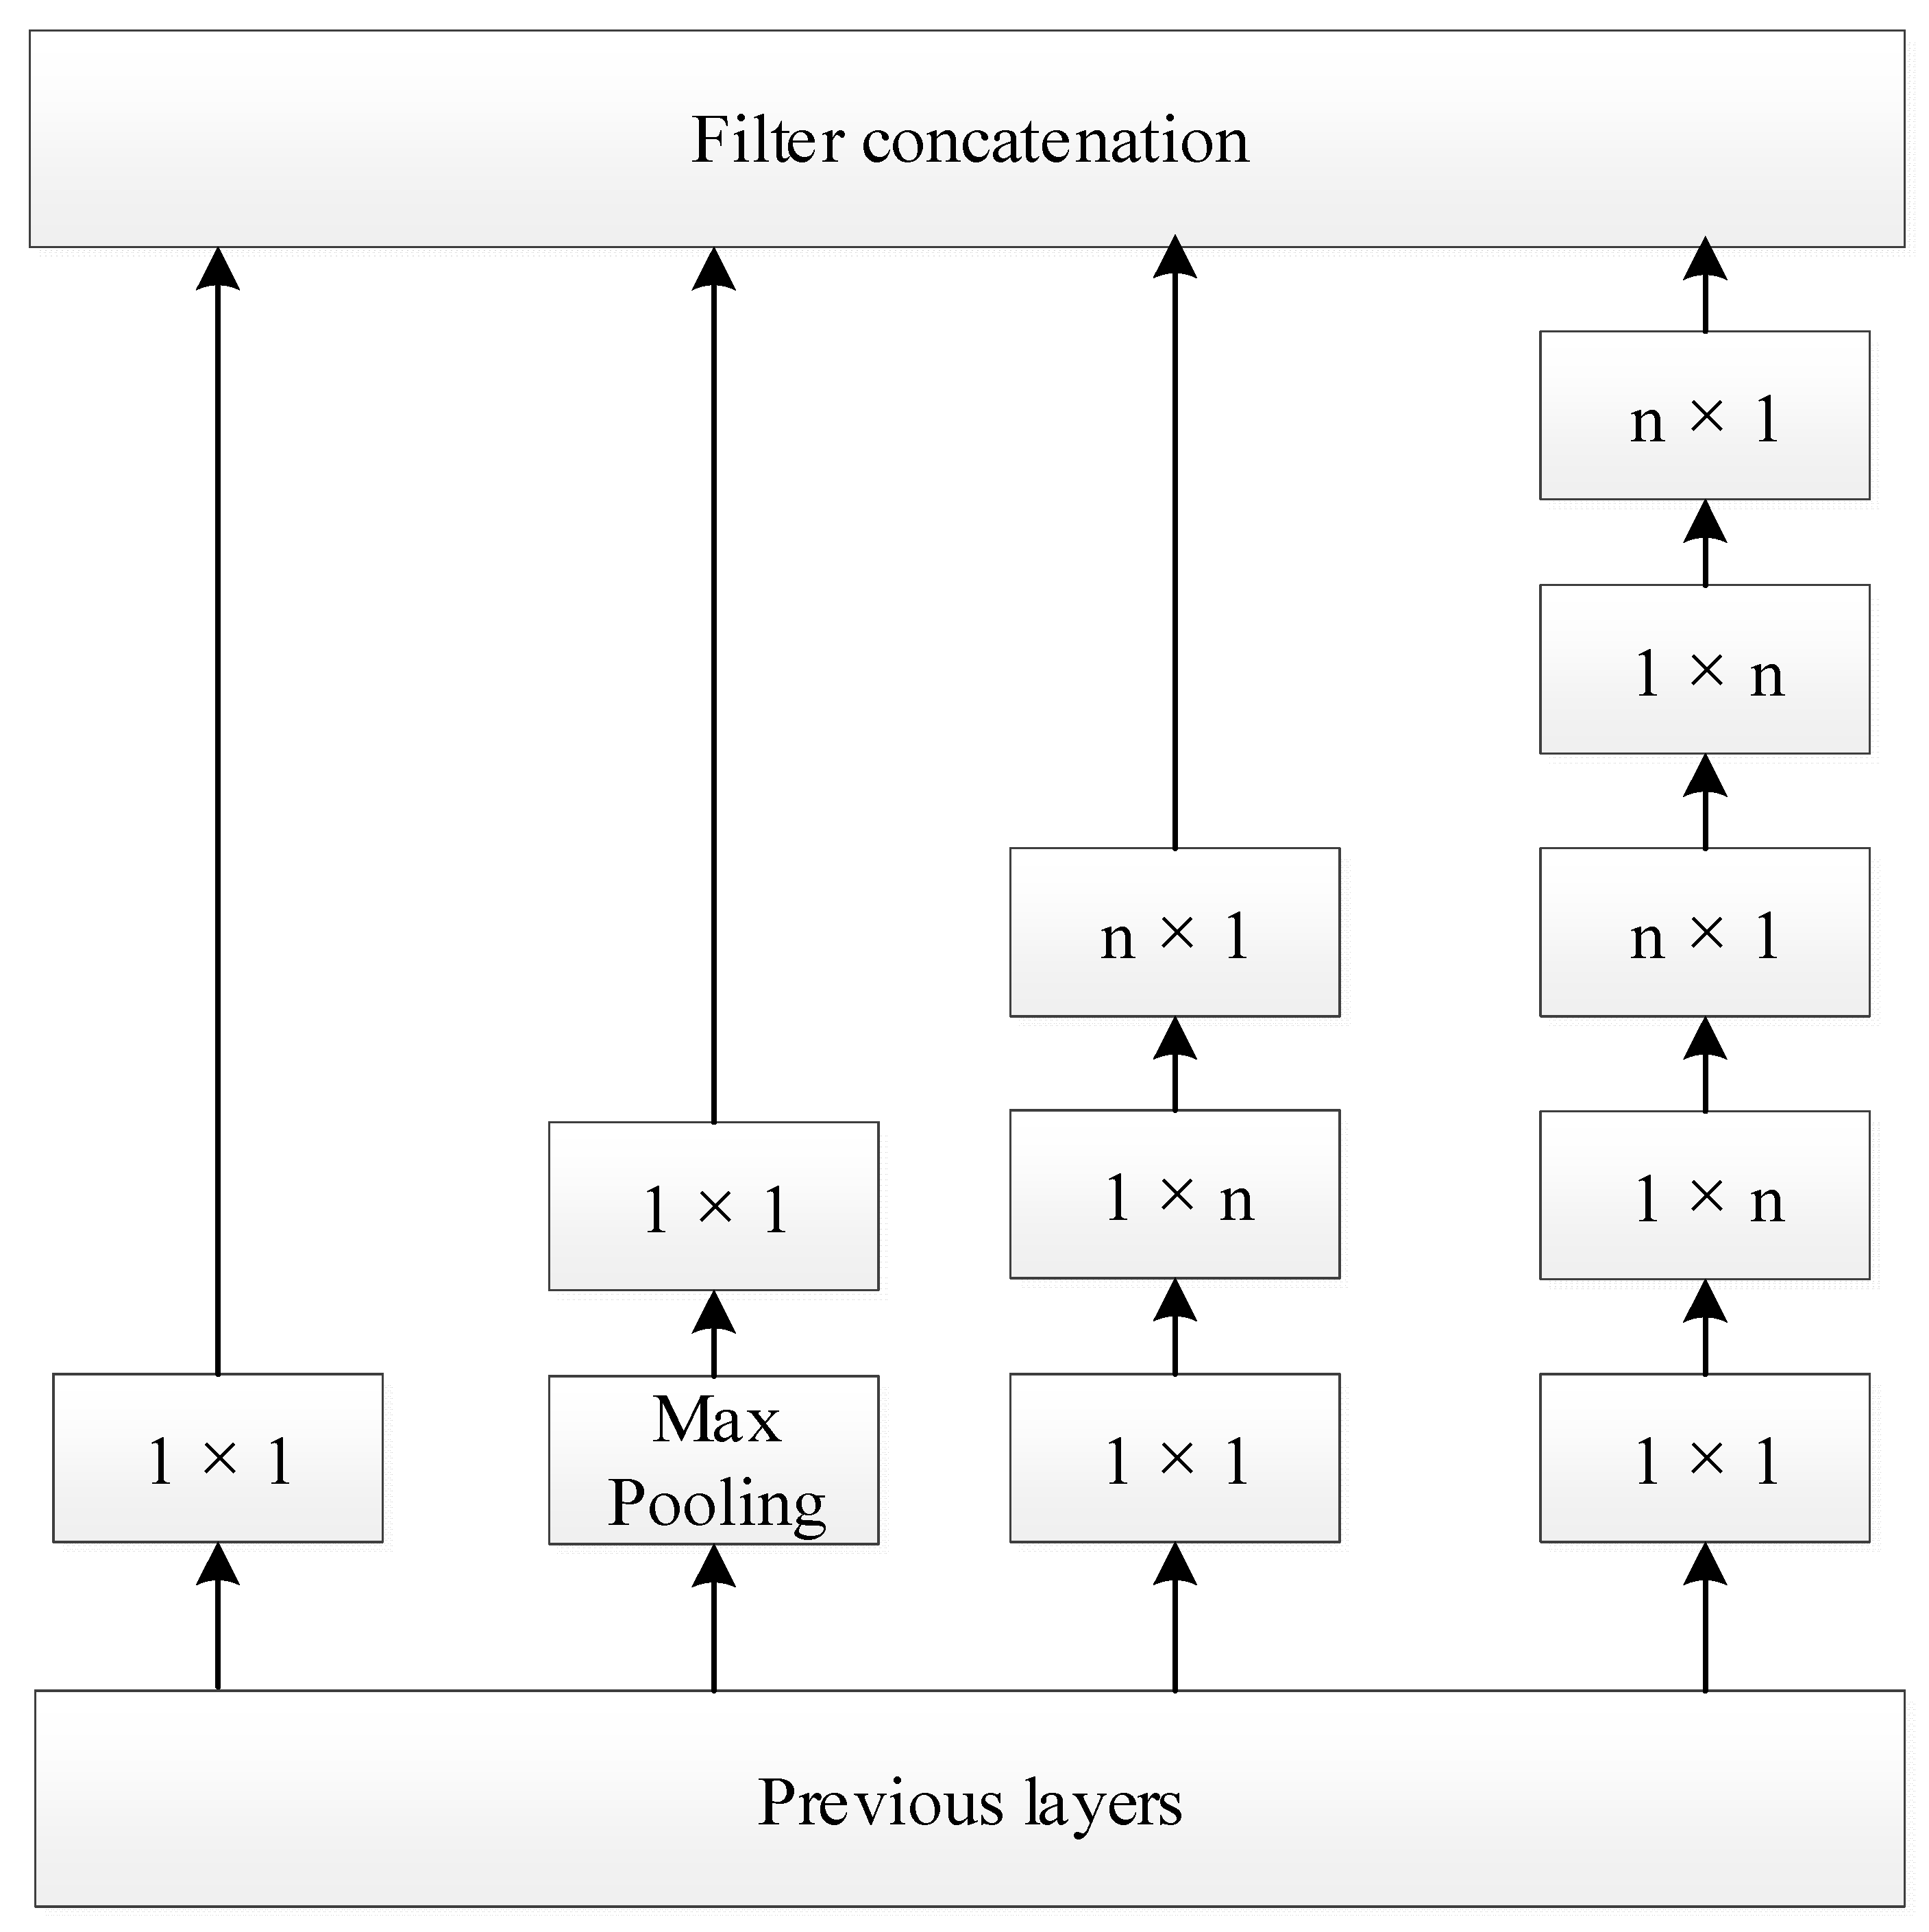
The Inception Module in Inception V3 can improve the efficiency of parameter utilization. One of the structures is shown in
Figure 1. It is similar to a small network in a large network, and its structure can be repeatedly stacked to form a larger network. In the Inception Module structure, the convolution of 1 × 1 can organize information across channels, improve the expression ability of the network, and raise or lower the dimensions of the output channel. Moreover, the idea of spatial asymmetric convolution [
20] is introduced to split a large two-dimensional convolution into two smaller one-dimensional convolutions. This helps to reduce many parameters, accelerate the operation, and reduce the overfitting; on the other hand, it adds a layer of nonlinearity, increases the diversity of features and expands the expression ability of the model and its ability to deal with more and richer spatial features.
Inception V3 removes the last fully connected layer and replaces it with a global average pooling layer. In AlexNet and VGGNet, the full connection layer accounts for almost 90% of all the parameters, which causes overfitting. Therefore, by removing the full connection layer, the model can be trained faster, and overfitting can be reduced.
The BN method added to Inception V3 is one of the most effective regularization methods. When BN is used for a certain layer of the neural network, it will standardize the internal processing of each mini-batch of data, to normalize the output to N (0,1) and reduce the changes in the distribution of internal neurons. It can considerably accelerate the training speed of large convolutional networks and greatly improve the classification accuracy after convergence.
2.2. Method Flow
In this study, to utilize Inception V3, the remote sensing image was cropped into sub-images of S × S pixels, and these sub-images with fixed size were used as an input for the Inception V3. Each sub-image was processed with Inception V3 to output the probability of each category of damage for groups of buildings. The higher the value, the greater the probability of belonging to the damaged category.
Although CNN can well predict the damage category of groups of buildings [
23,
28,
29] in rectangular images with a fixed size, for groups of buildings in each block, it often results in a larger error to predict directly using CNN due to irregular shape and different sizes of blocks. Therefore, this paper proposed a method to avoid the bigger error when using CNN to predict the categories of blocks presenting irregular shapes and different sizes. The main idea of the method was to cut the rectangular image of fixed size in the minimum bounding rectangle of the block according to a specific step size, and the obtained rectangular image could directly predict its category by using CNN. However, many of the obtained rectangular images were outside the block range, so the threshold of the overlap ratio had to be set to filter out rectangular images outside the block range. Finally, the prediction results of all rectangular images within each block were averaged to obtain the category of the block.
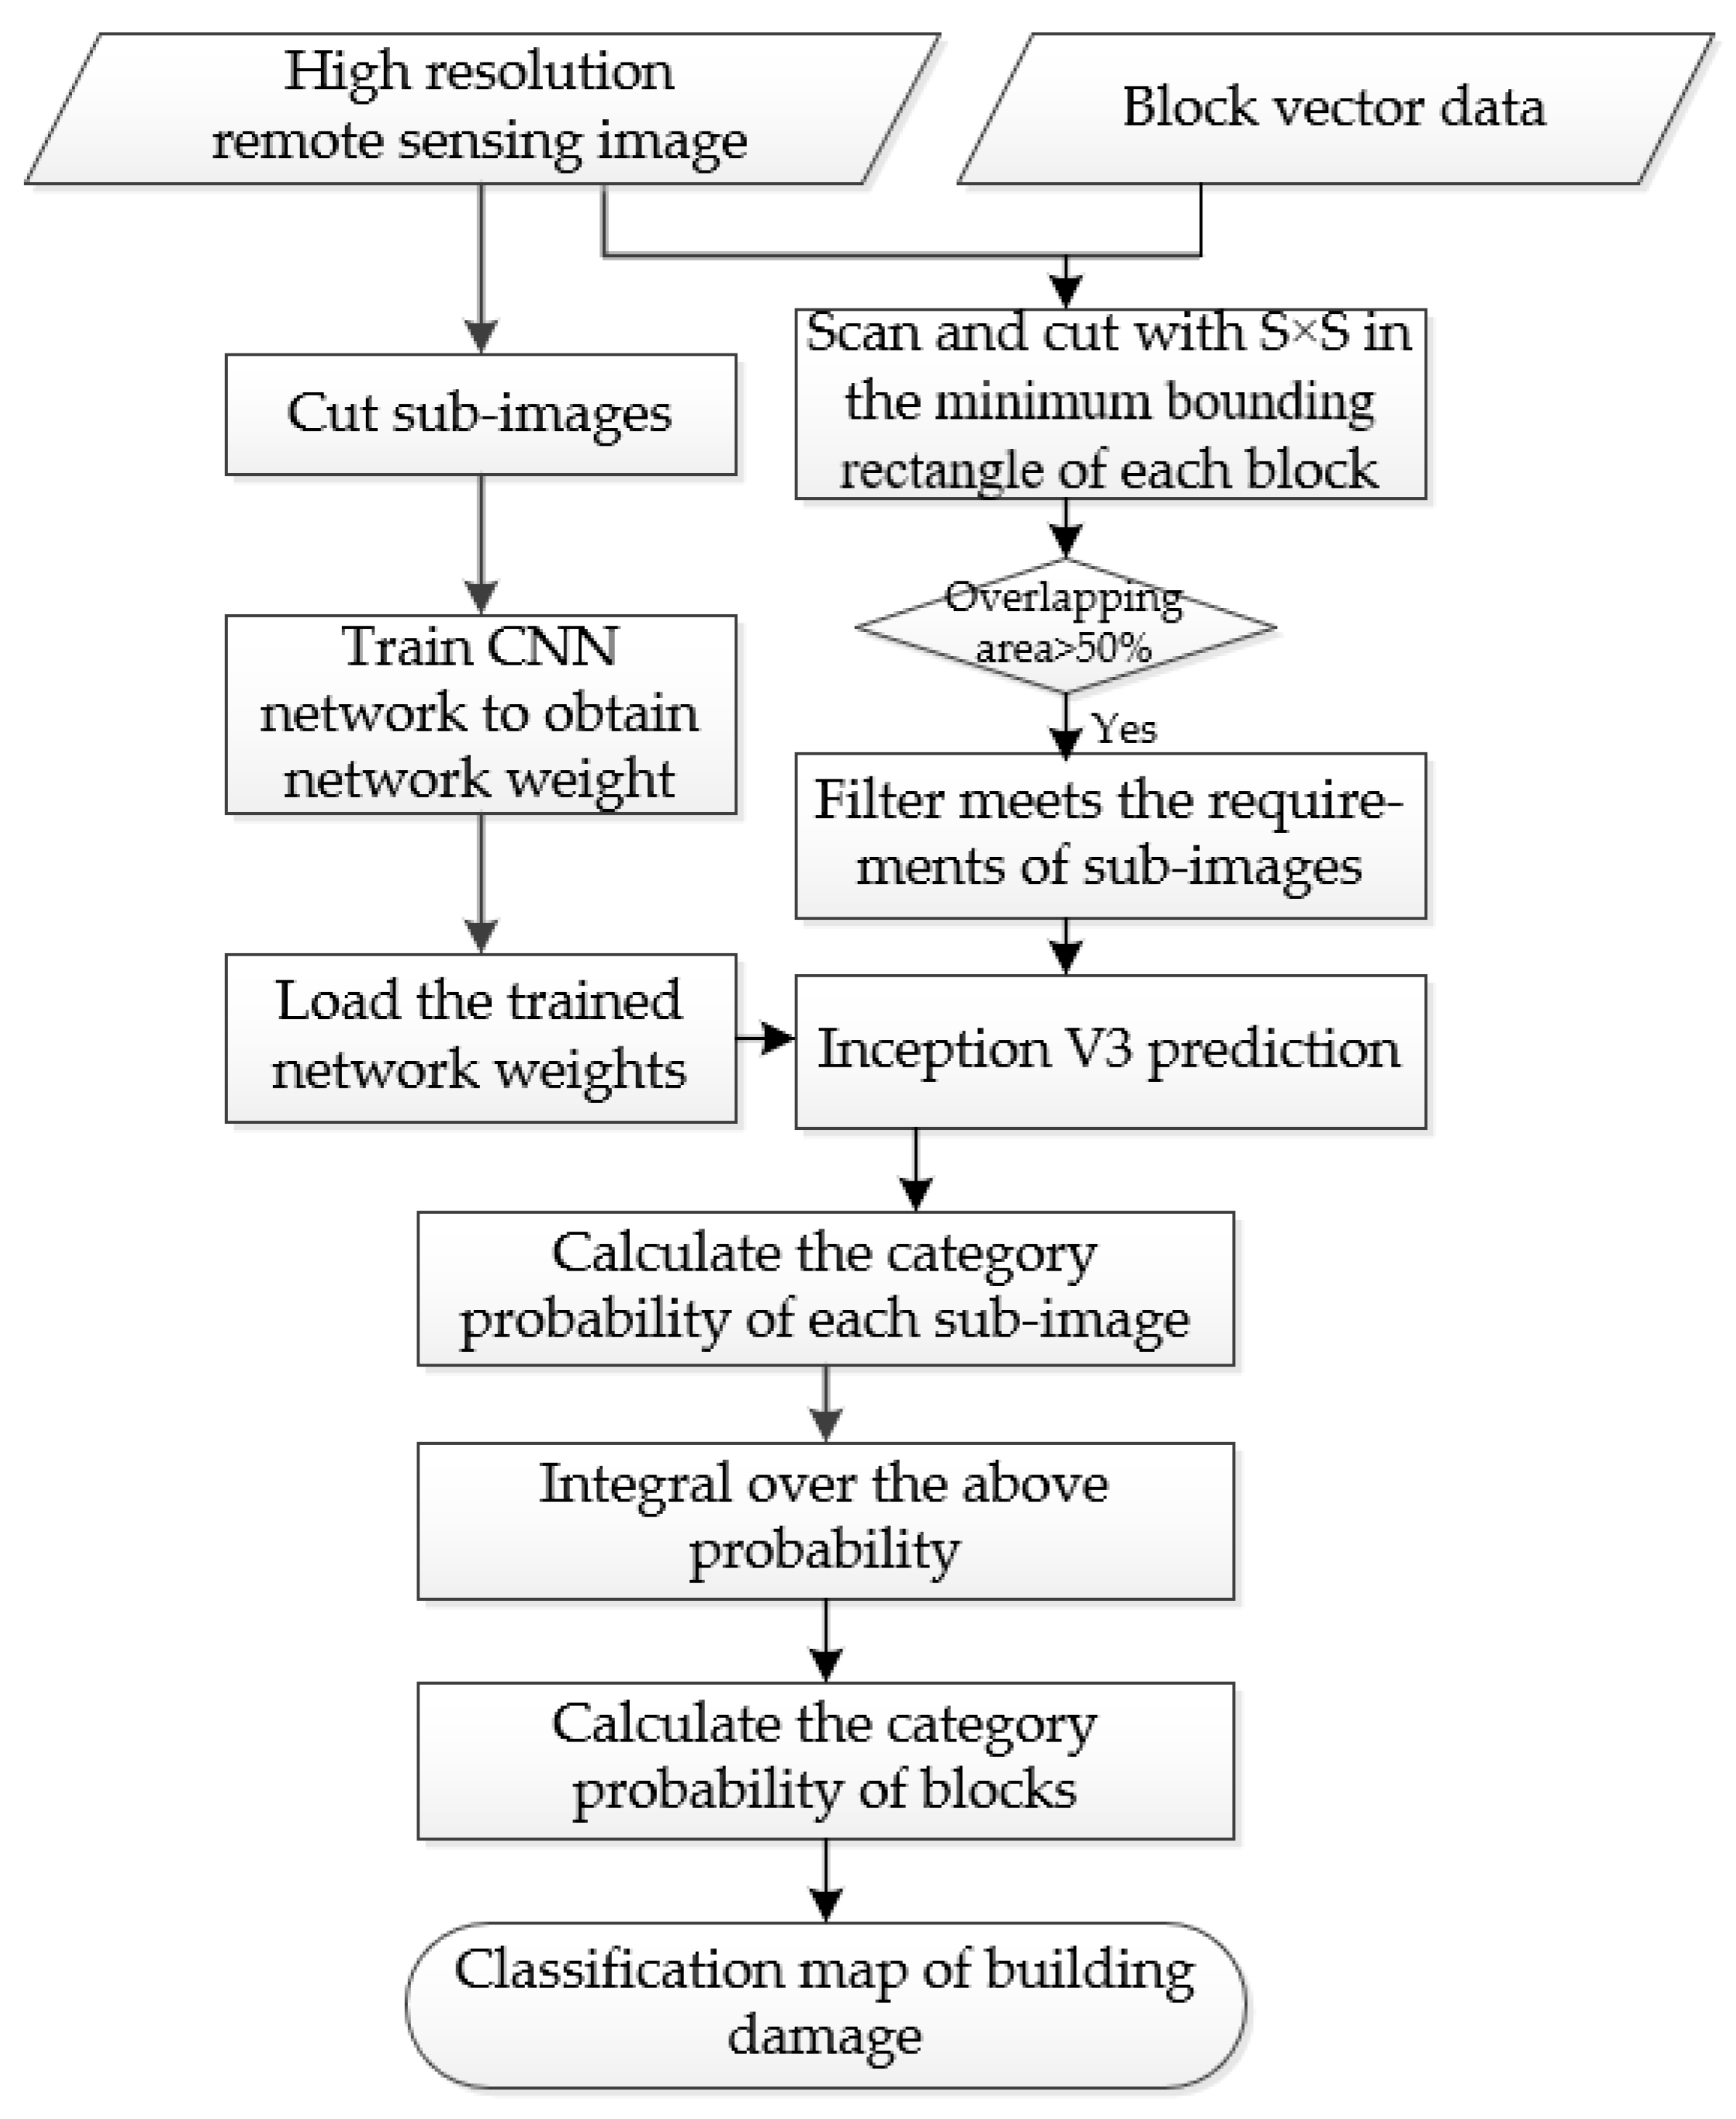
By using the method described above combined with block vector data, the groups of buildings in post-earthquake remote sensing images were classified by the basic processes shown in
Figure 2.
The first part was to cut the remote sensing images into rectangular sub-images with a fixed size and train the Inception V3 network to obtain the trained network weights.
The second part consisted of three steps. First, an S × S window was used to scan the images contained in the minimum bounding rectangle of each block with the step size S, and a certain number of S × S sub-images were obtained. Then, the overlap ratio between each sub-image and its block was calculated, and the sub-images with an overlap area greater than 50% were used as inputs for the Inception V3 in order to predict their category probability. Finally, the category probabilities of all effective sub-images in each block were integrated to obtain the category probability of the block.
2.3. The Improved Convolutional Neural Network (CNN)
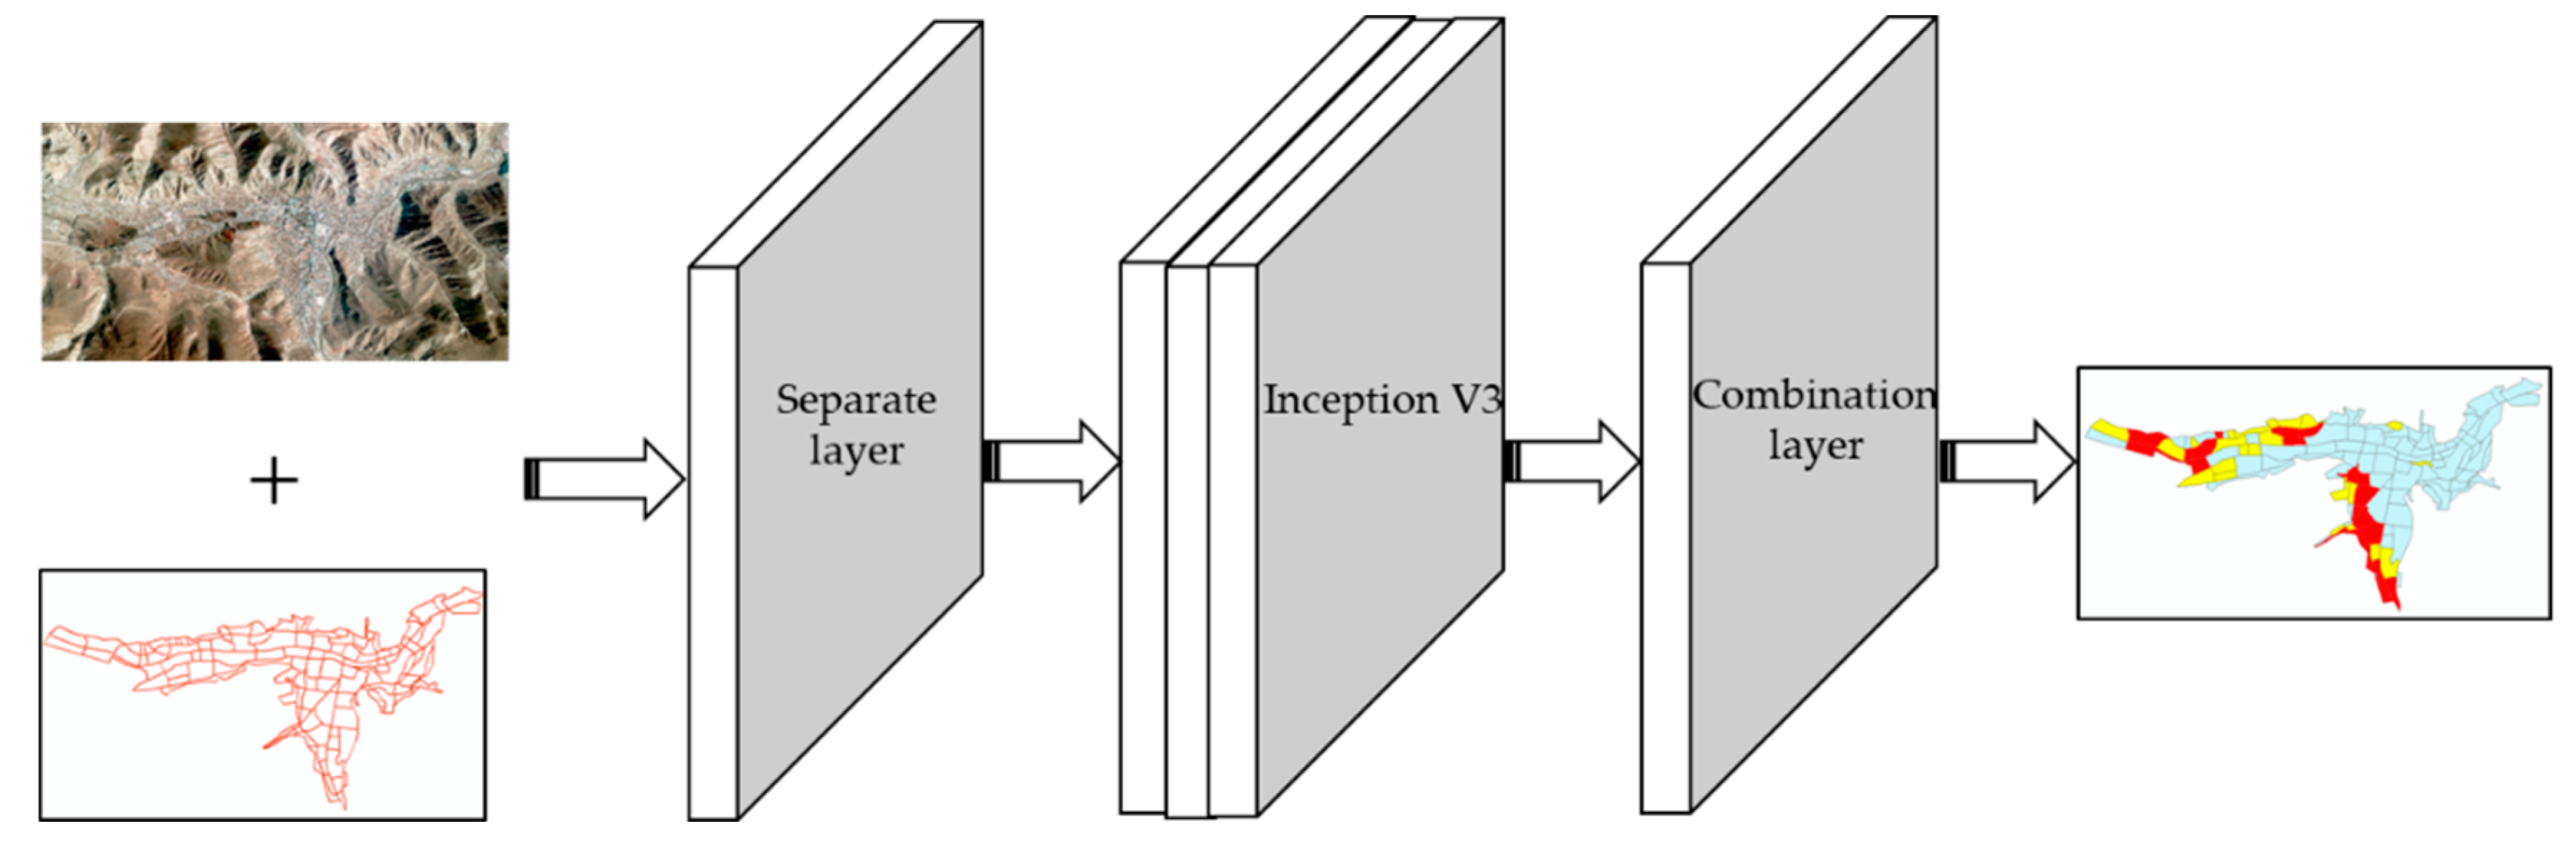
The remote sensing image usually has a larger width than that of the natural image, so they cannot be directly input into traditional CNN for processing. In order to enable the classification network to more easily process large remote sensing images for application and considering that the method proposed in this paper took city blocks as the basic processing unit, superimposition of block vector data for processing was required. Thus, this paper added Separate and Combination layers to Inception V3, as shown in
Figure 3.
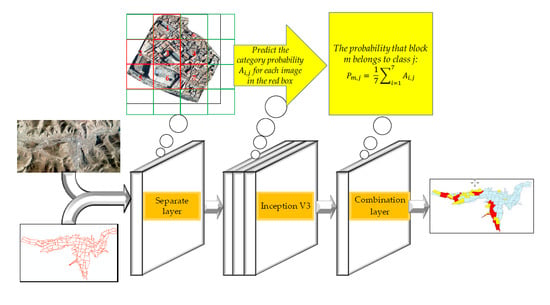
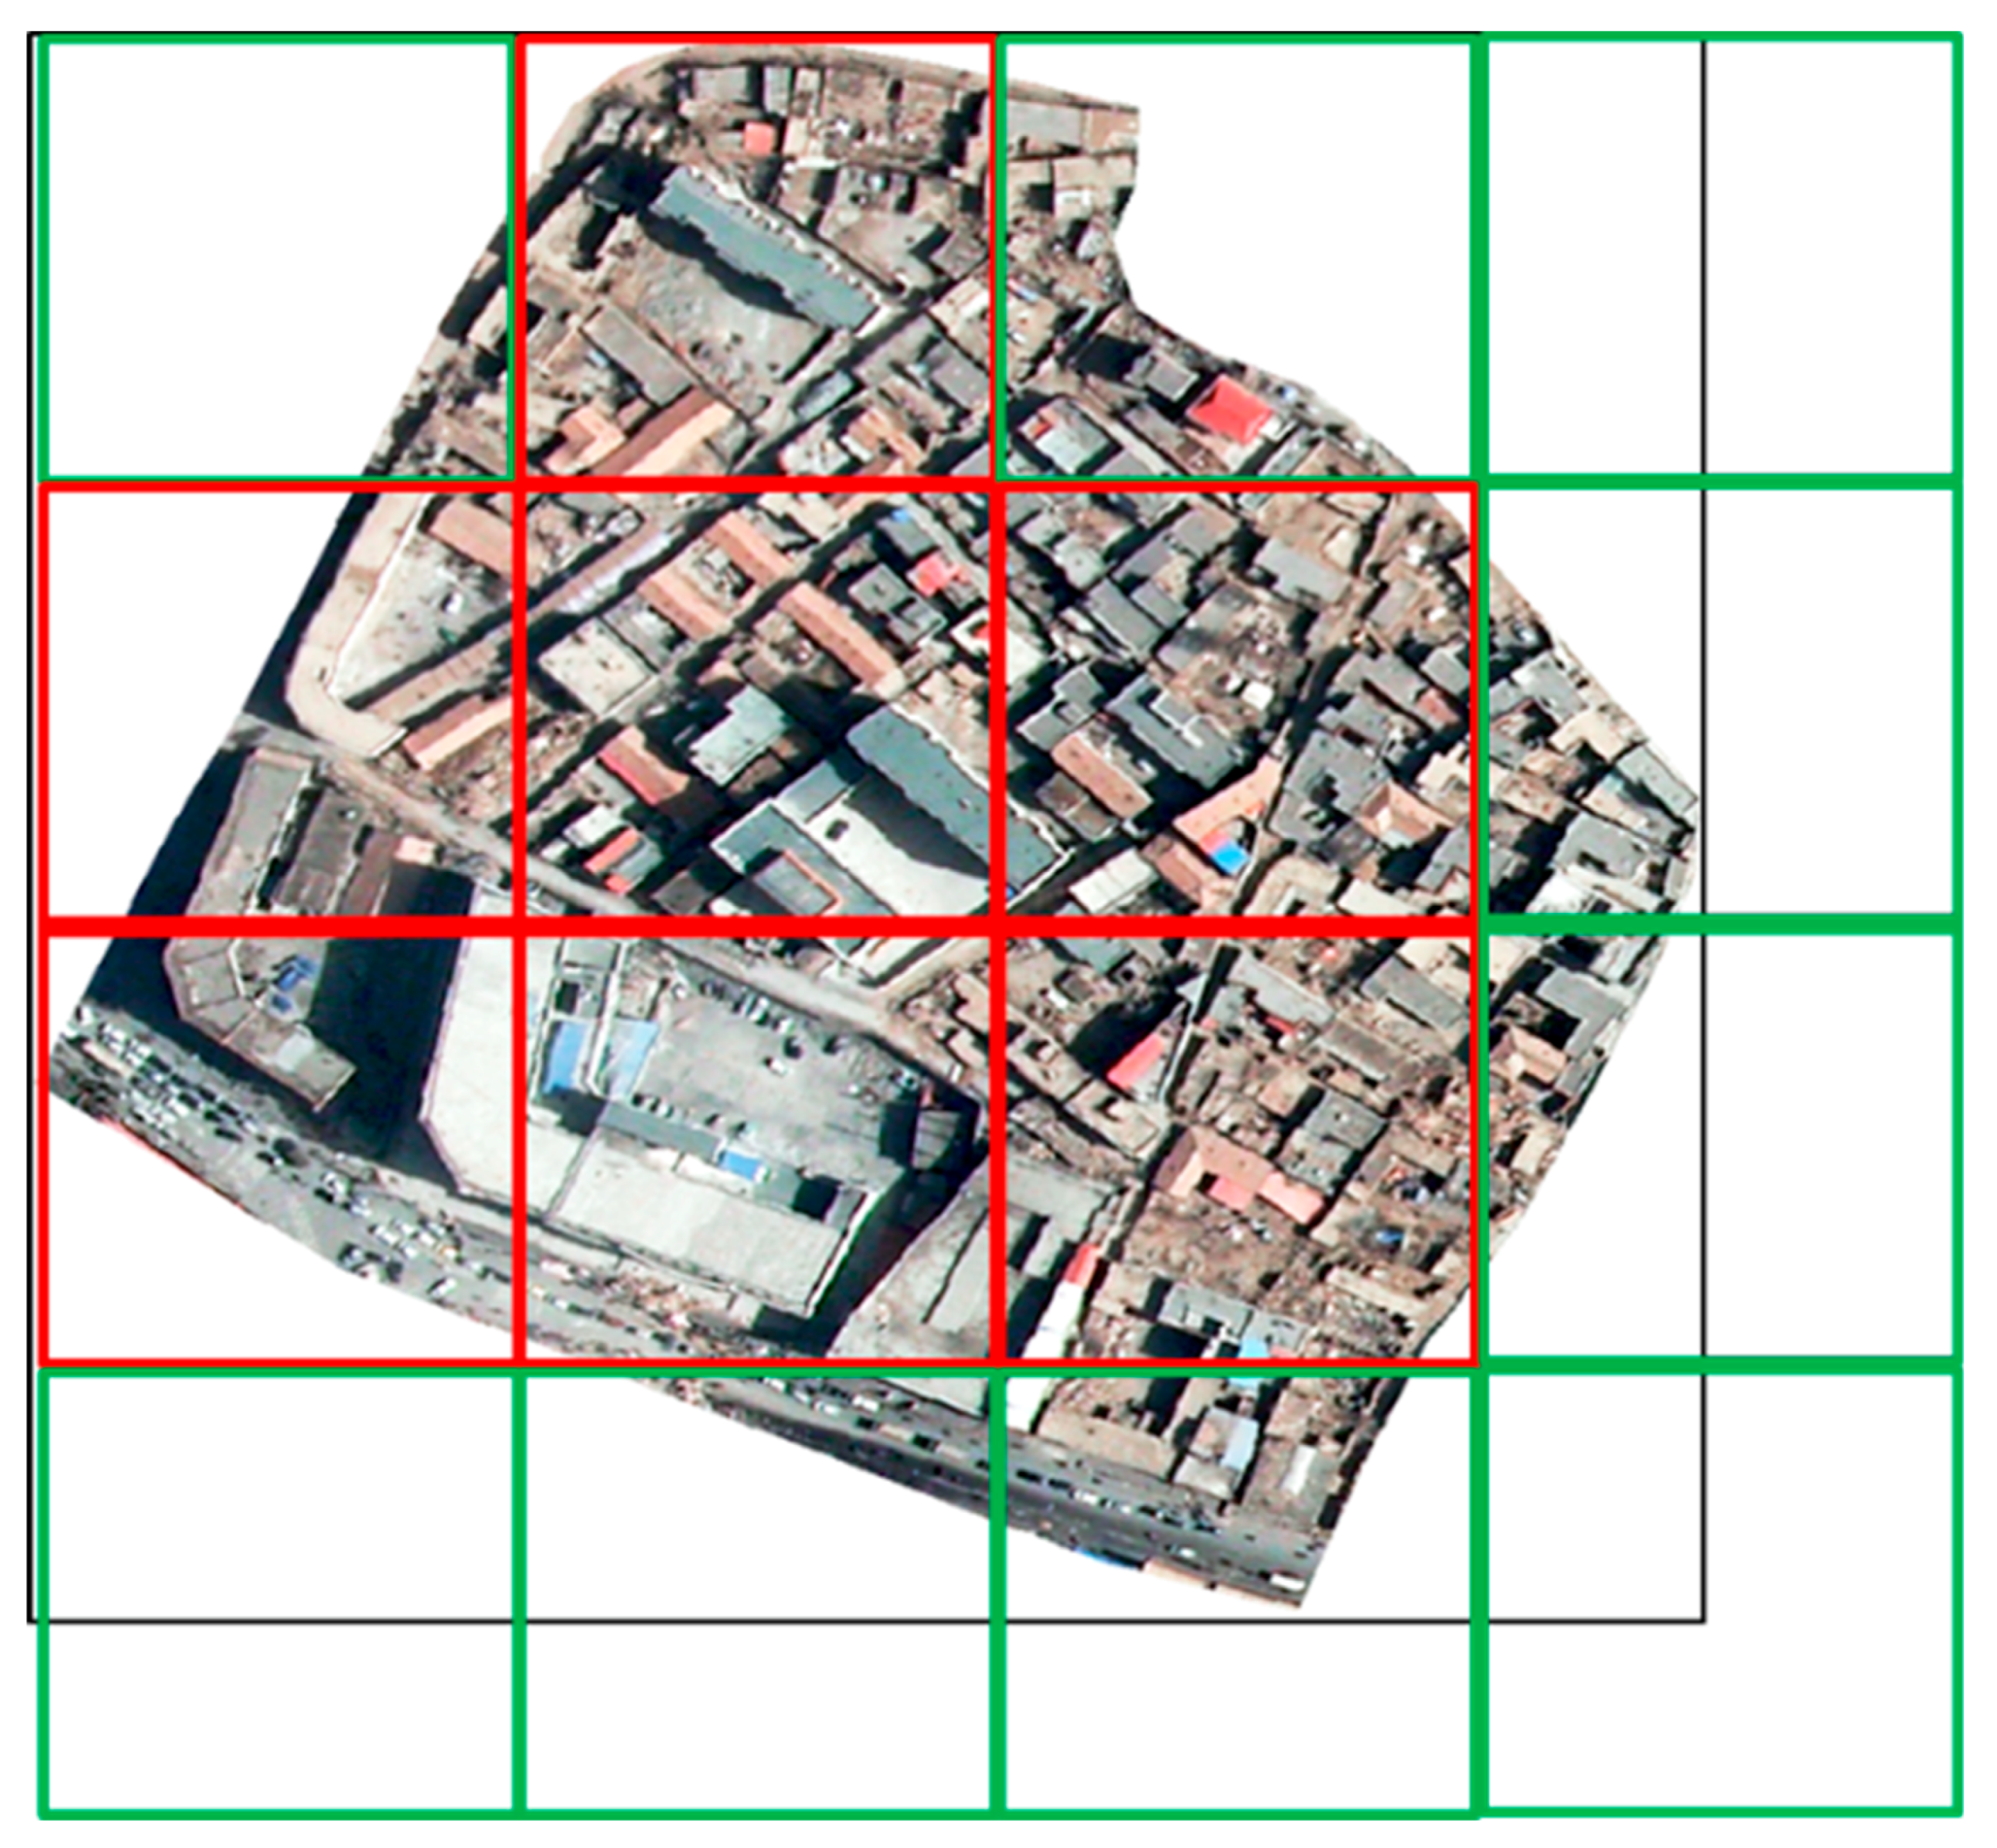
The role of the Separate layer here was to use a sliding window of 224 × 224 to scan and cut with a step size of 224 within the minimum bounding rectangle of each block. Taking block 1 as an example, as shown in
Figure 4, 16 sub-images of 224 × 224 pixels were cut by scanning block 1. Then, the overlap area between these 16 sub-images and block 1 was calculated, and the 7 sub-images in which the overlap ratio was greater than 50% were selected as the valid sub-images, that is, the sub-images belonging to block 1. After the Separate layer, a number of 224 × 224 pixels effective sub-images were generated for each block, and these sub-images were used as the input for the Inception V3 network for classification.
The purpose of the Combination layer was to combine the classification results of all valid sub-images in each block. For example, the function to integrate the probability values of 7 sub-images in block 1 is expressed as:
where
is the probability that the i valid sub-image in block 1 is classified into j class, and
is the probability that block 1 is divided into j class.
3. Data
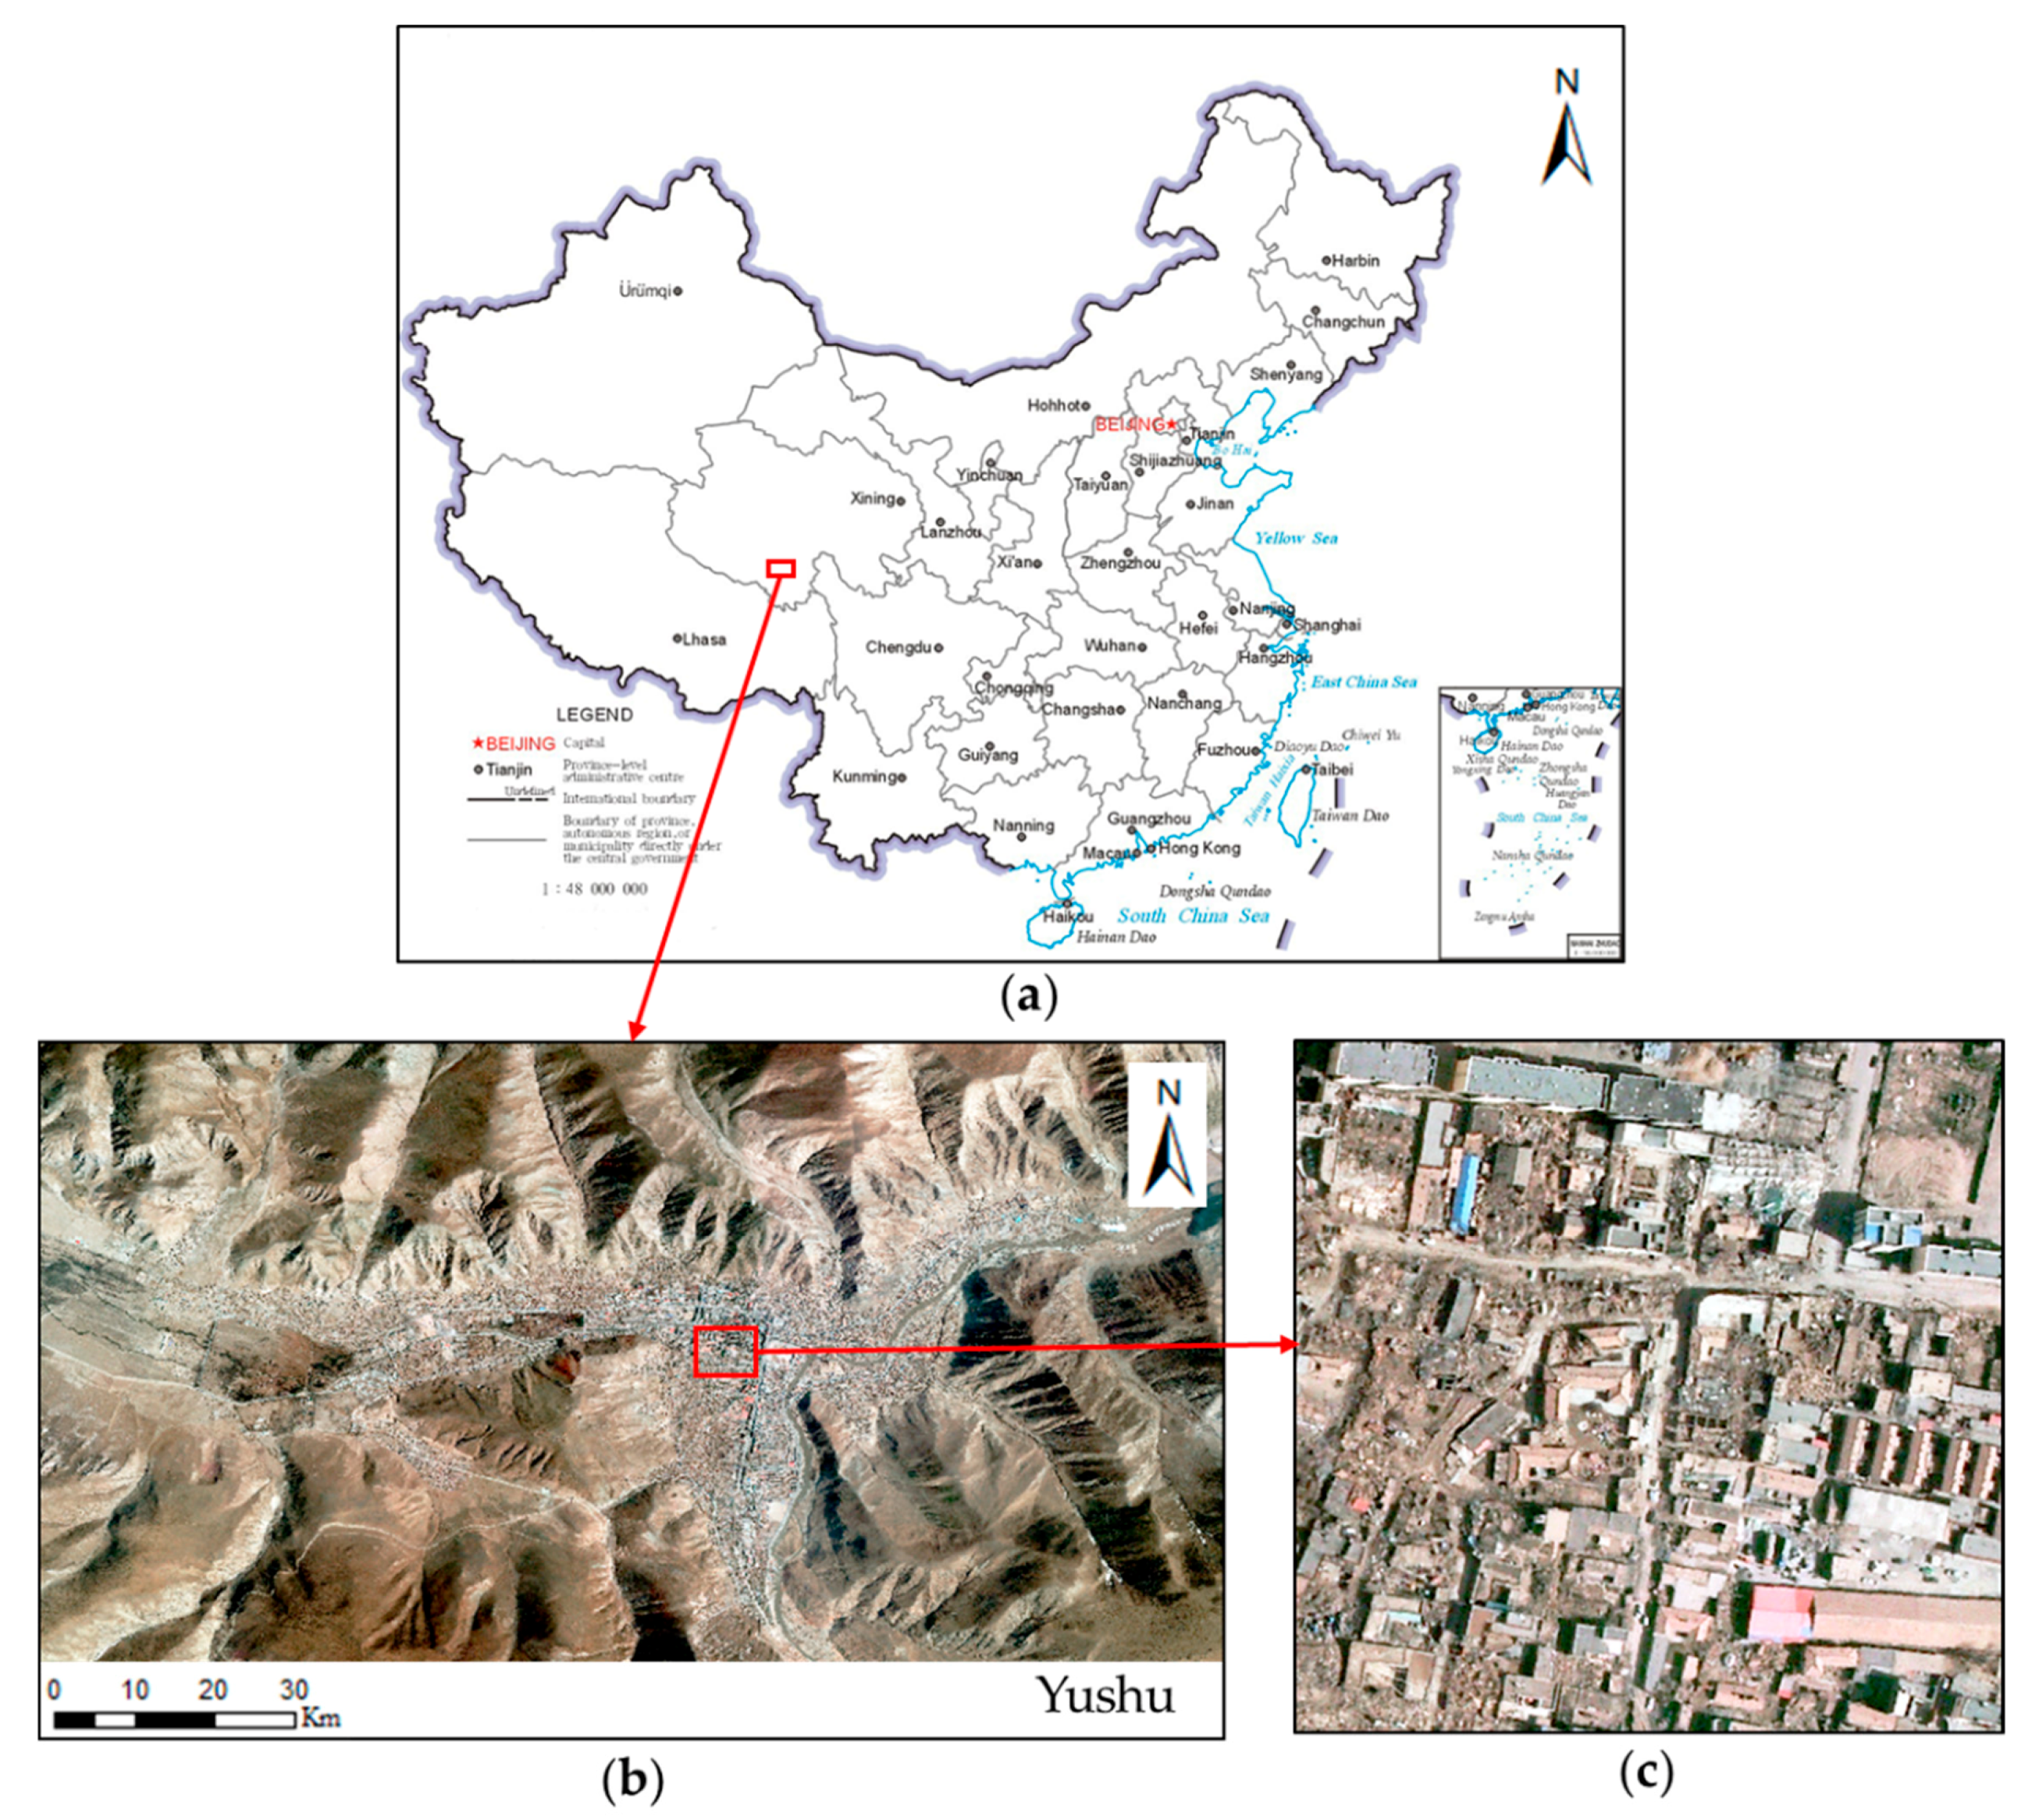
In order to test the effectiveness of this method, 0.5 m-resolution aerial remote sensing images were selected. These images were acquired on the second day after the 7.1-magnitude earthquake in the Yushu Tibetan Autonomous Prefecture of Qinghai Province on 14 April 2010. The studied area was severely affected by the disaster and there were a large number of collapsed buildings (
Figure 5).
The earthquake damage of buildings was divided into five grades according to the “Guidelines for Earthquake Damage and its Loss Assessment” formulated by the China Earthquake Administration and the “Classification Standard for Building Earthquake Damage Levels” formulated by the Ministry of Housing and Urban-Rural Development of China. In remote sensing images, classification is based mainly on the overall and detailed image characteristics of the buildings after the earthquake. Additionally, in the classification process, the sub-study area method is adopted to make a general assessment of the damage degree of all buildings in the sub-study area. In this paper, the sub-study area could be divided into a sub-image of 224 × 224 pixels, or a block. Referring to previous research results [
8,
30,
31], and according to the post-earthquake remote sensing images, this paper divided the damage of the groups of buildings into three levels: serious damage (all destroyed or most collapsed), moderate damage (about half collapsed), and slight damage (generally intact or a small part collapsed). The specific classifications are shown in
Table 1. The collapse rate, c, was the ratio between the number of collapsed buildings (or collapsed building area) and the total number of buildings (or total building area).
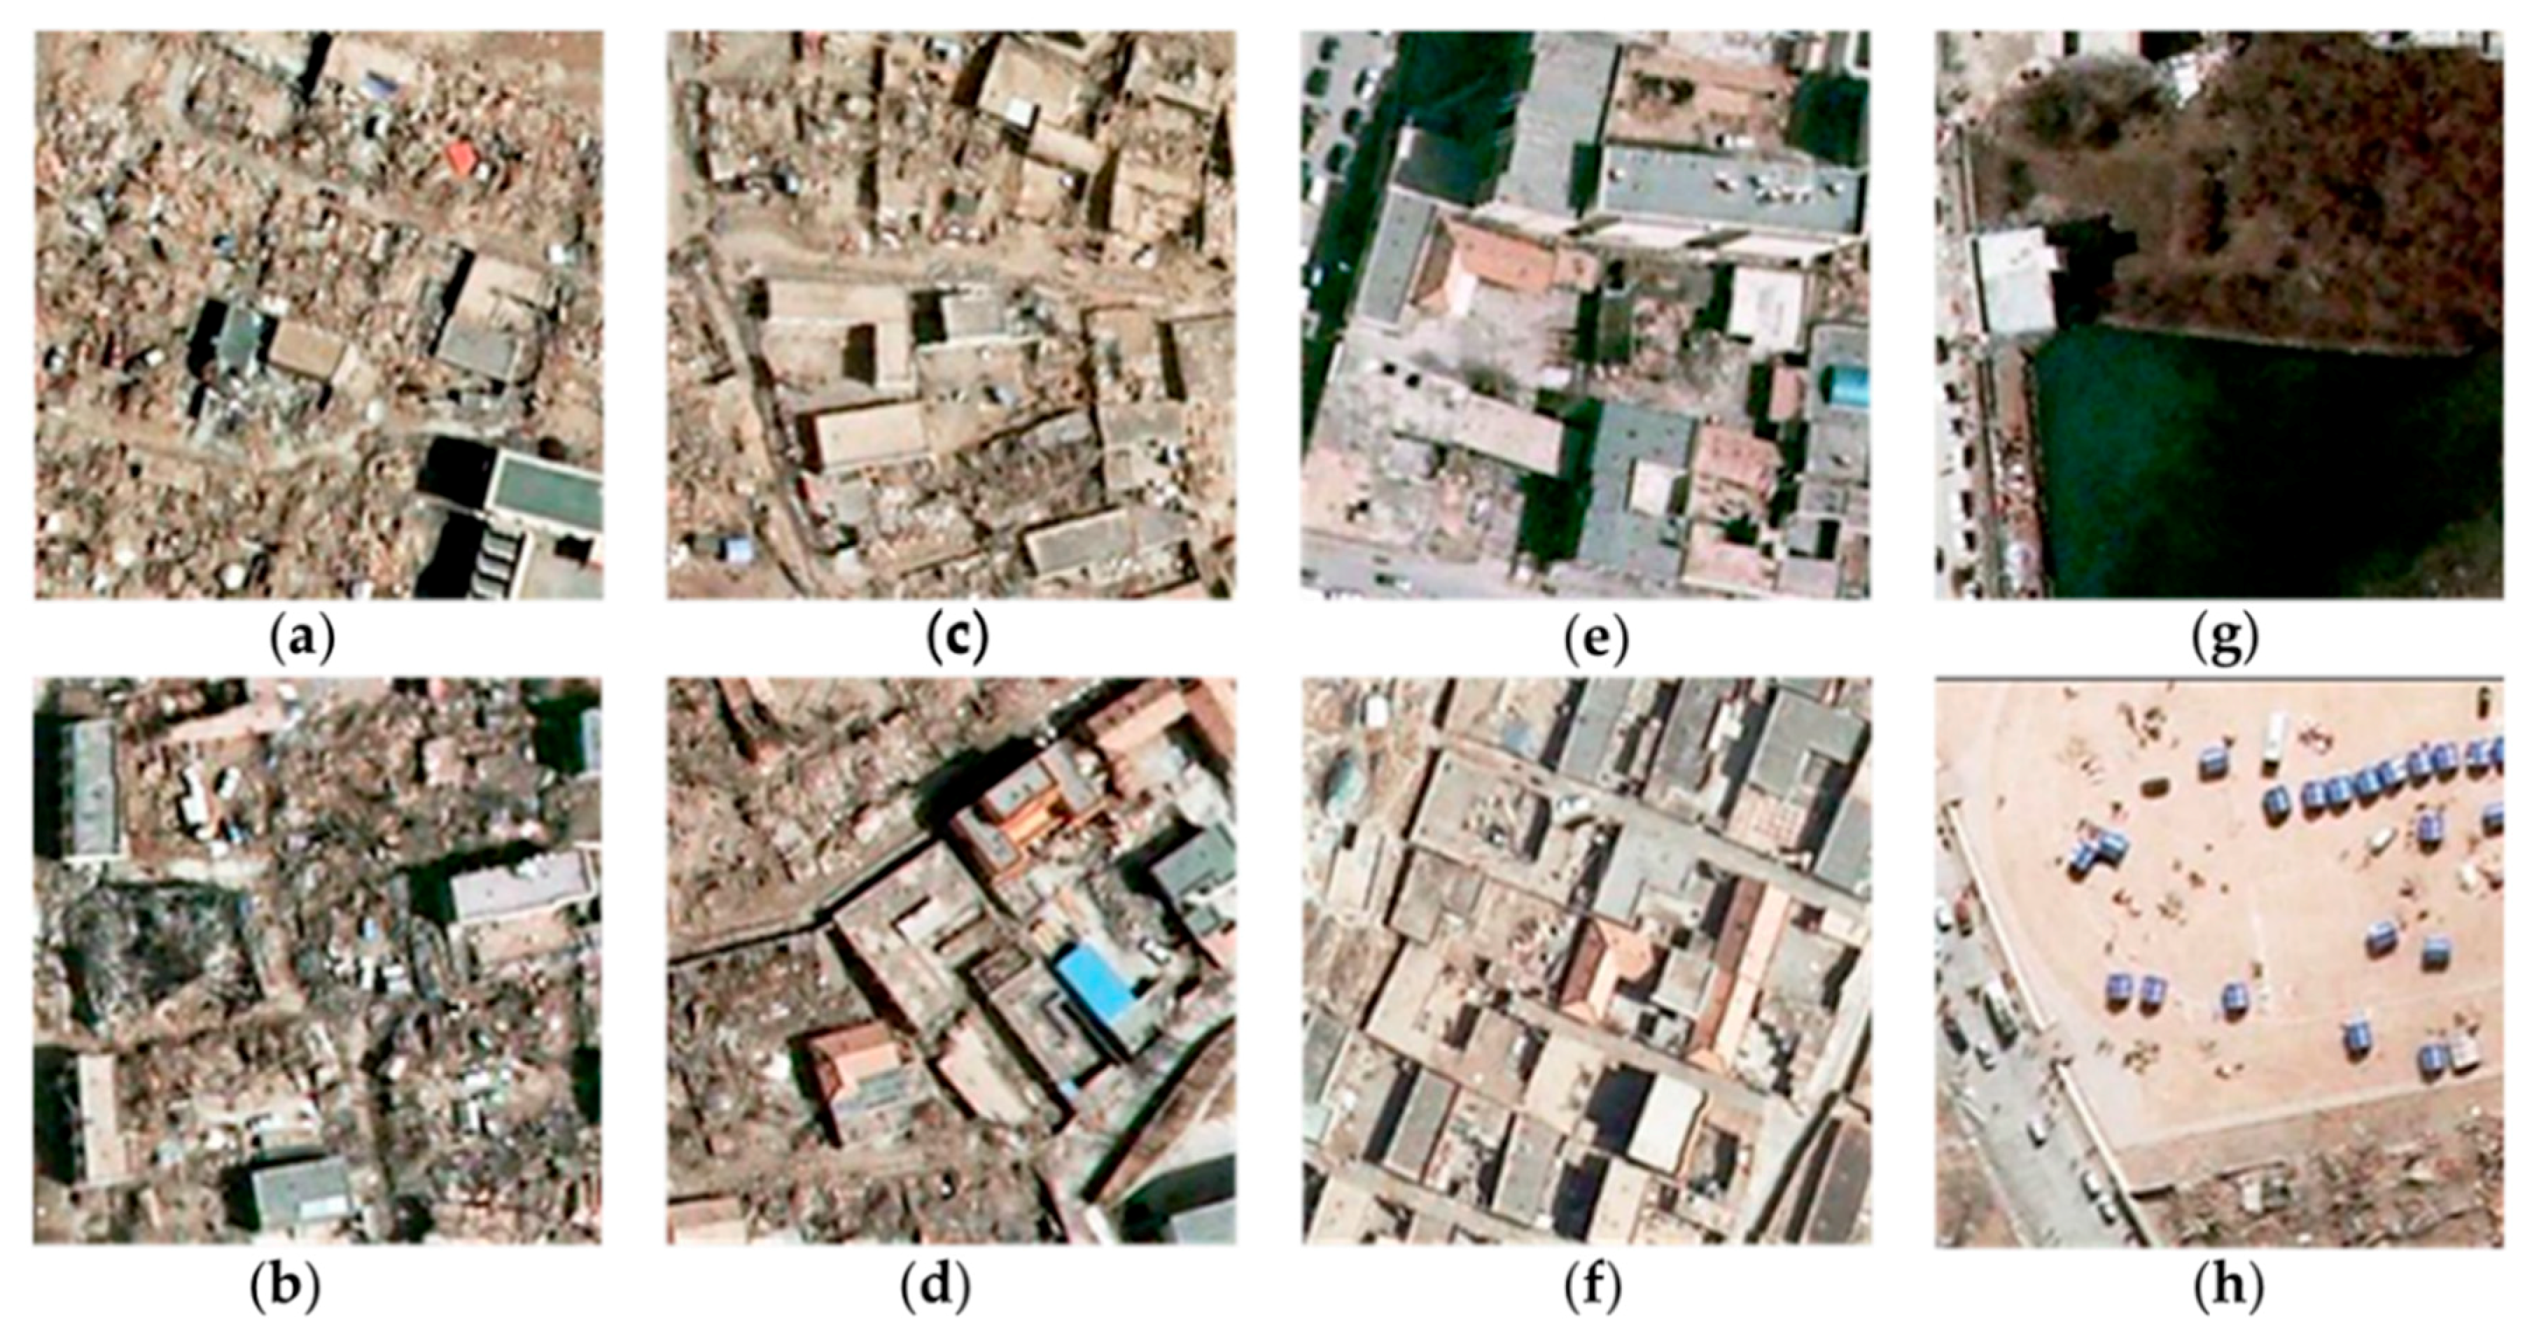
After some necessary processing, the above experimental images can be trained within the CNN. The sub-images of 224 × 224 pixels were clipped from the remote sensing images. Then, one category was assigned to each sub-image by visual interpretation. The samples for each category of
Table 1 are shown in
Figure 6 (where negative samples are open space and water bodies are near buildings, etc.).
Data used for training usually needs to be enhanced, similar to natural images, and processes such as rotation, flipping, and color conversion can be used [
32]. However, this enhancement is different from that applied to natural images. Most objects in natural images can only be rotated at very small angles, yet, the buildings can be rotated at any angle in this study. In addition, remote sensing images are often displayed after being stretched, so data enhanced by stretching could make the Inception V3 model more robust. Through the process of enhancing, a total of 16,803 samples were obtained. These were divided into three groups: 10,764 samples were used as a training set, 4599 as a validation set, and 1440 as a test set.
4. Results and Discussion
4.1. Multi-Feature Machine Learning Classification Method
To compare the accuracy of the results obtained by the method described in this paper with that of the results of traditional machine learning methods, the experiment involving the machine learning method was firstly carried out. First, various features of the image were extracted manually, and then, according to the features extracted from each block, the damage categories of the groups of buildings were classified by the machine learning method.
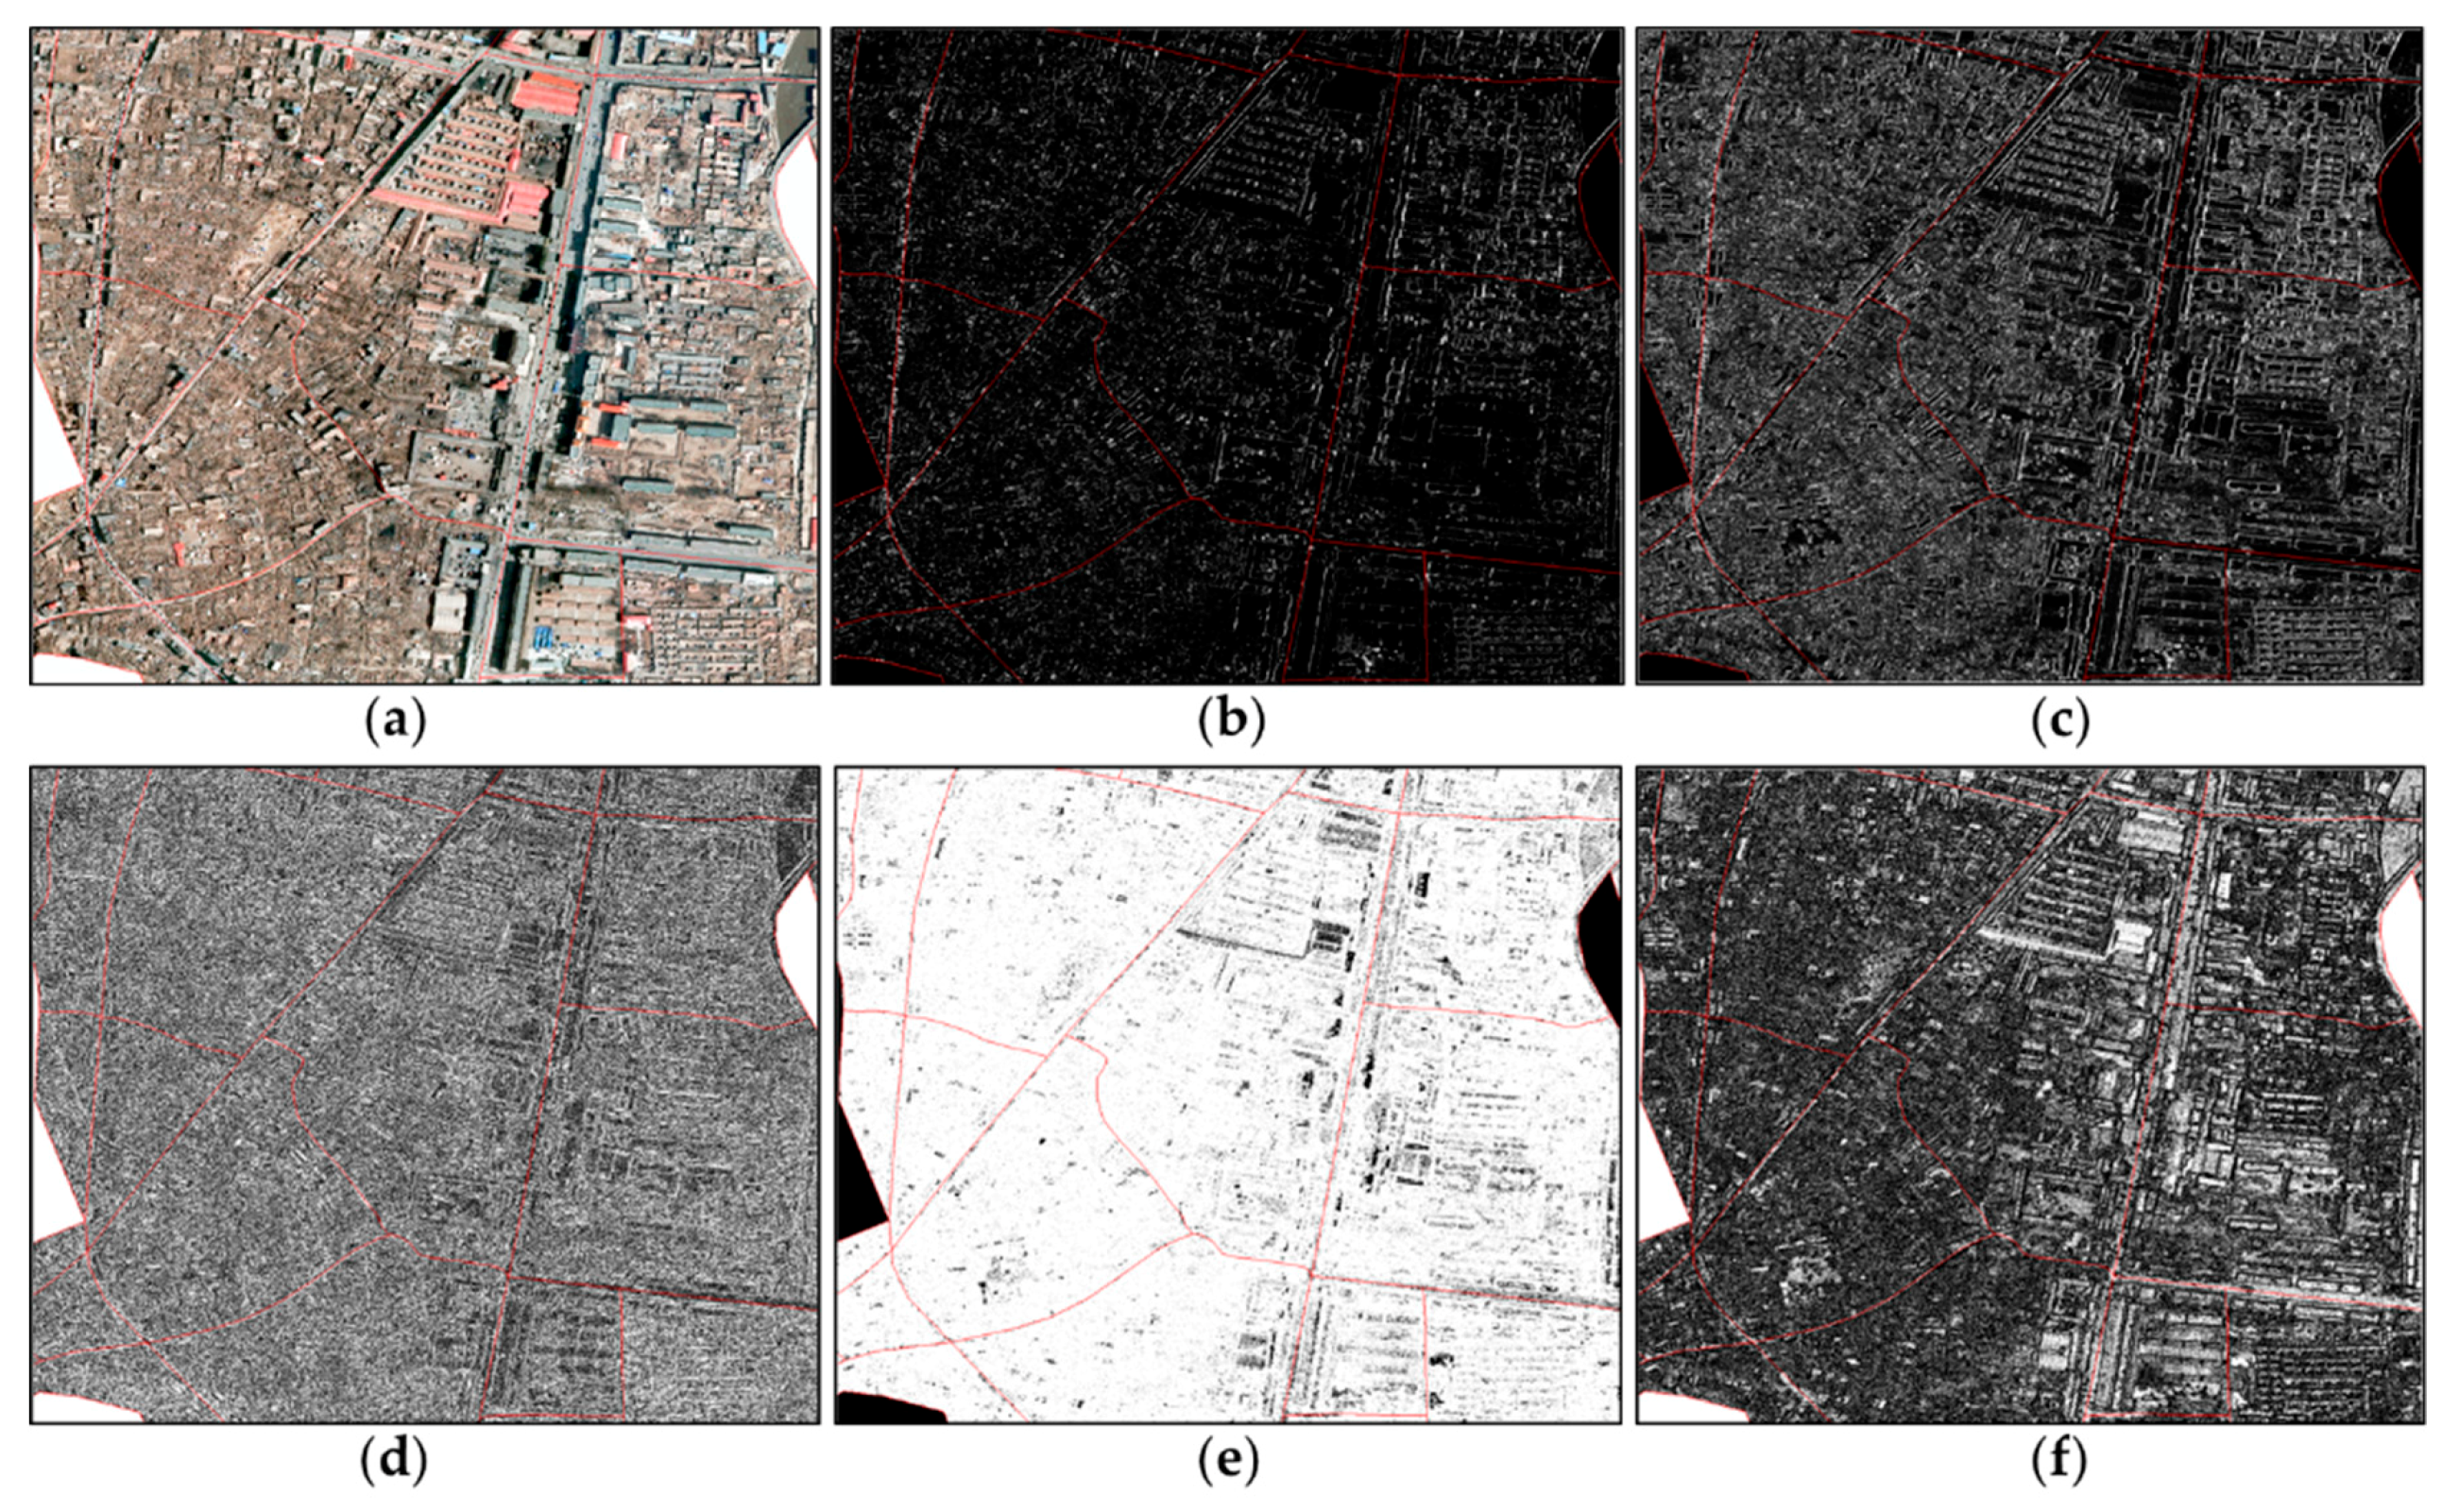
The features selected in this study were: contrast, dissimilarity, correlation, entropy, and homogeneity. The extracted image features are shown in
Figure 7. It can be seen from the original raster image in
Figure 7 that the buildings in the left half of the image were completely collapsed, while the buildings in the right half were less collapsed. Comparing the five characteristic diagrams in
Figure 7, it can be seen that the difference between the collapsed buildings on the left side and the non-collapsed buildings on the right side is clearly reflected in the feature map.
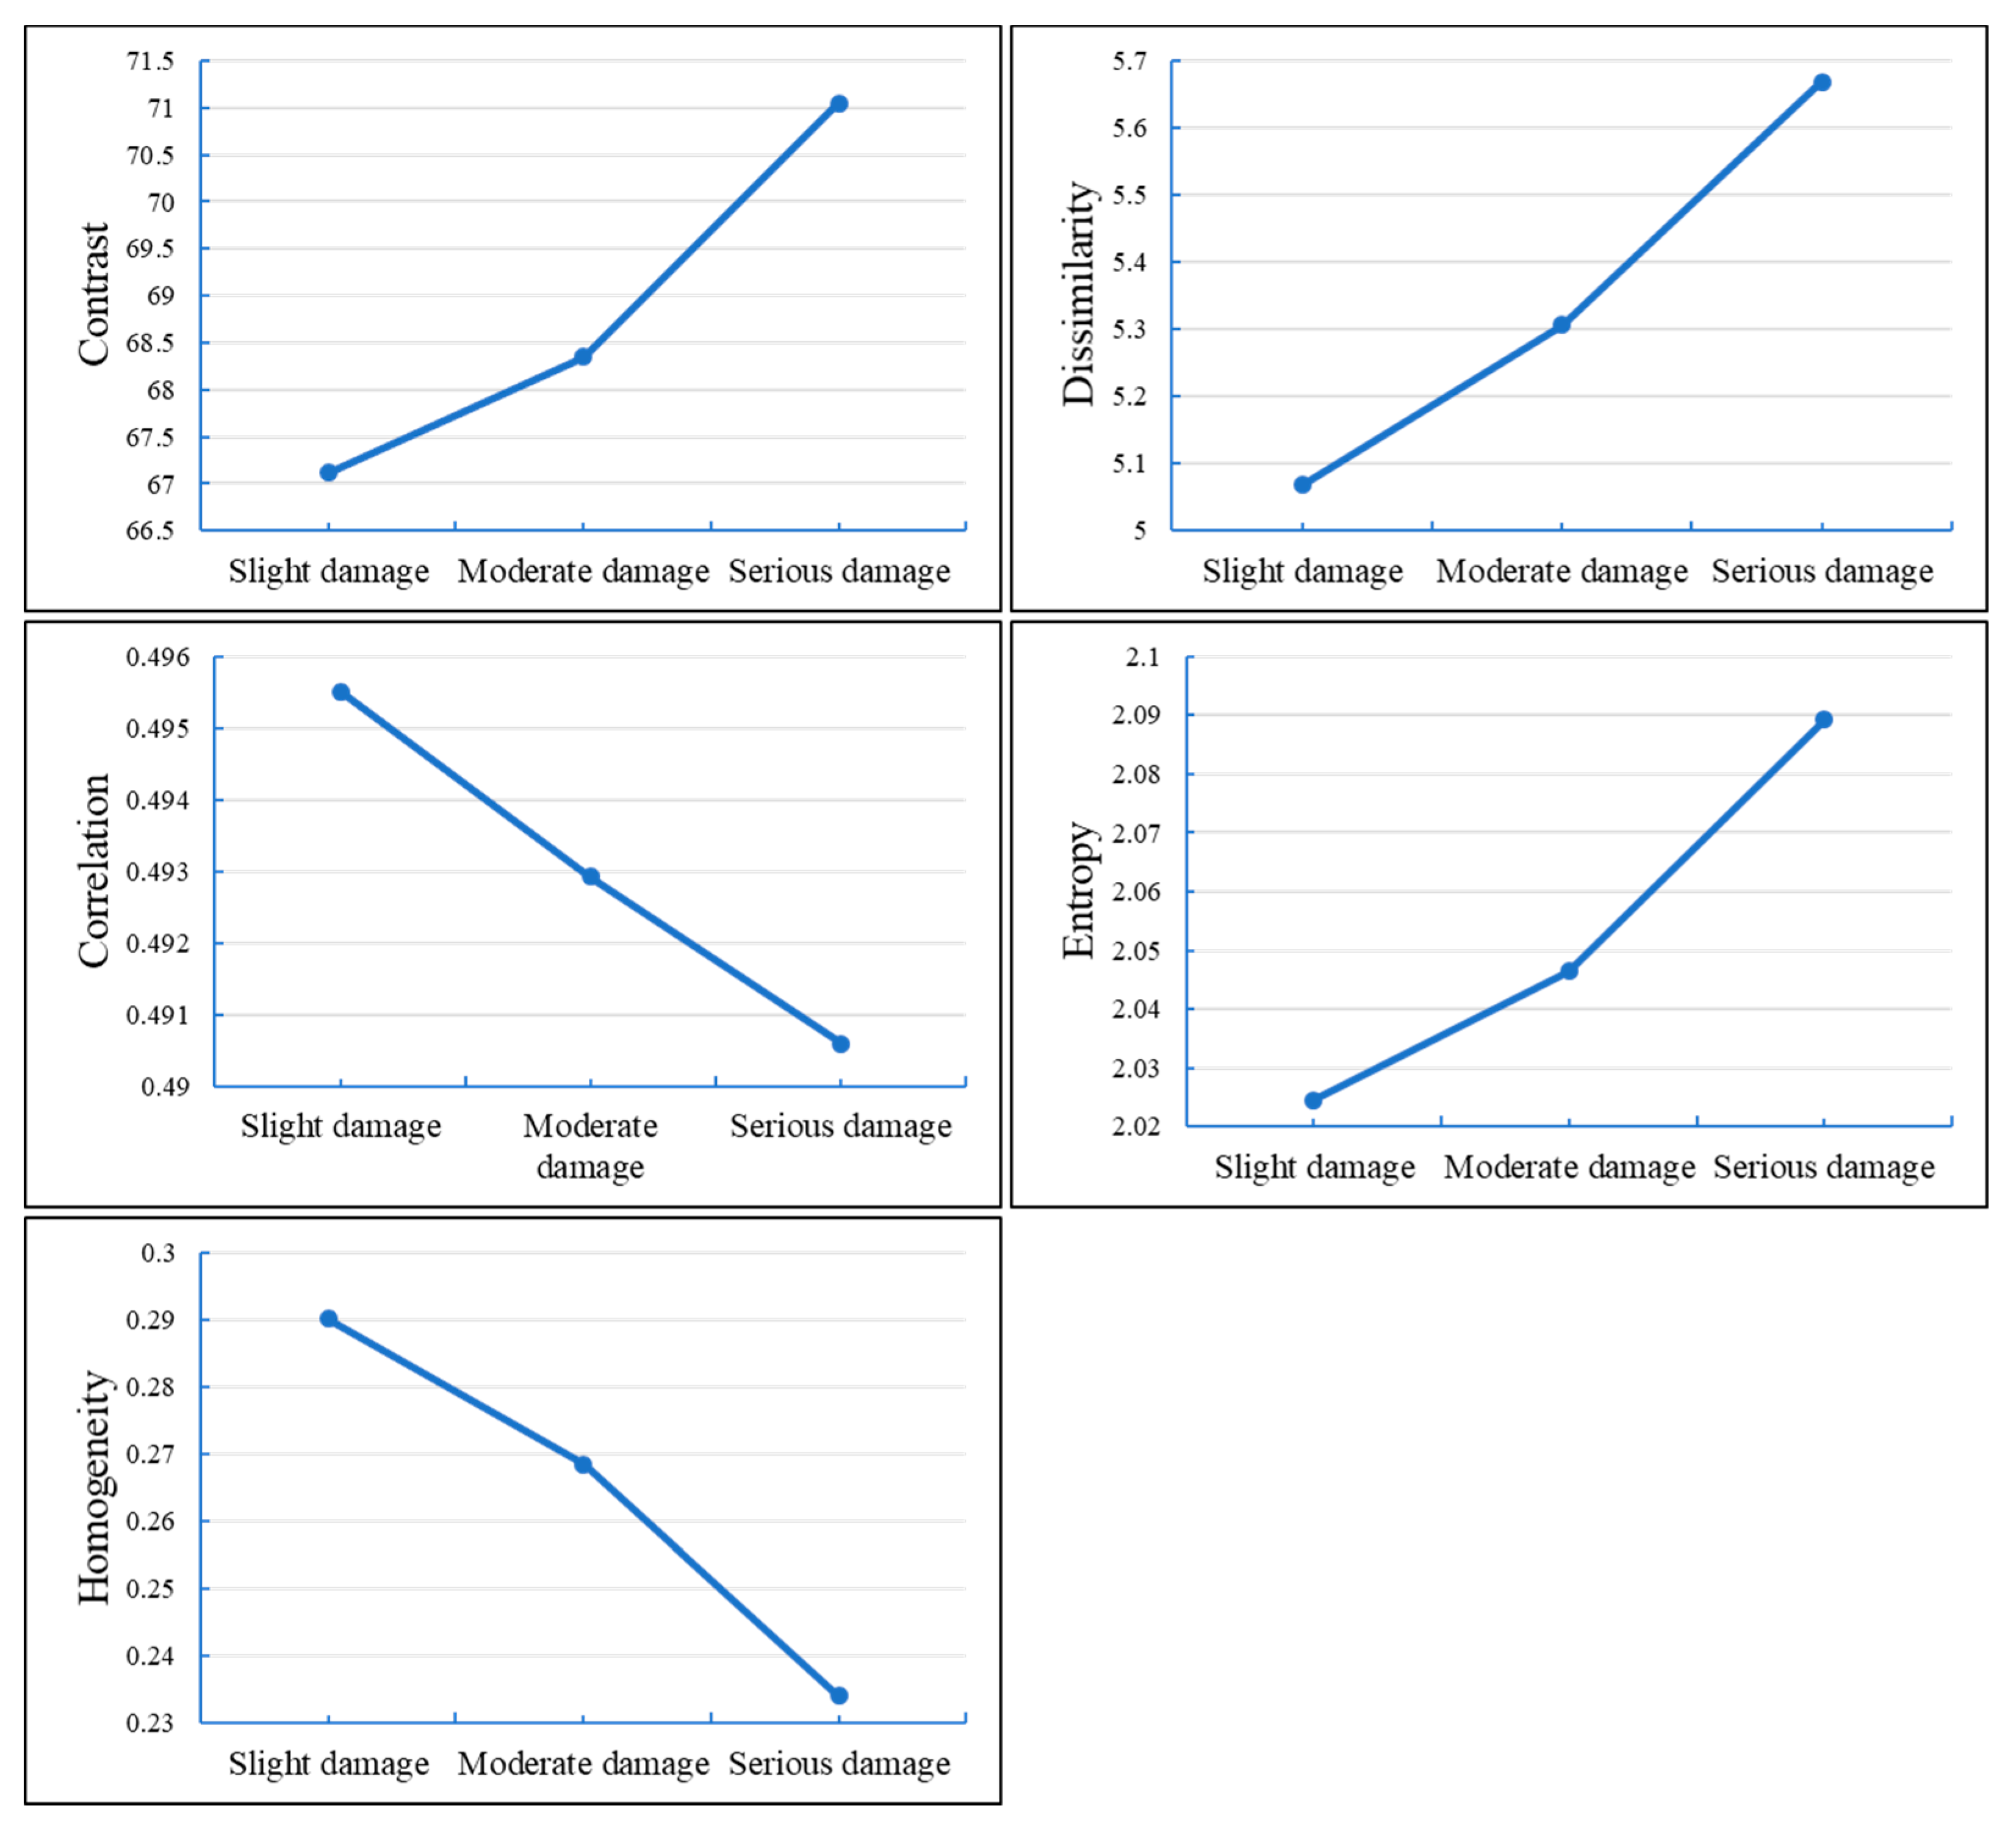
In order to see more easily the range of values of each feature for the different damage categories, a quantitative statistical analysis was conducted for the feature maps of each category of damage, and the results are shown in
Figure 8. Changes in building damage grade cause the values of the five features to change accordingly, which can reflect the damage grade of groups of buildings. Therefore, these five features can be used to classify the damage of groups of buildings.
After completing the feature extraction, the feature maps on each band were superimposed with the block vector data, and the average value of different features in each block were calculated by the ArcGIS software. The results of statistical calculations for multiple features were used as the feature vector of the block to classify the damage of groups of buildings, and the multi-feature classification model was established. According to the statistical results of the aforementioned features, SVM, CART and RF in machine learning methods were used to obtain the classification accuracy of the damage of groups of buildings.
The final classification results obtained by using the three machine learning classifiers are shown in
Table 2. SVM had the highest classification accuracy, reaching 72%. The parameter C corresponding to the optimal accuracy of SVM was 1, which was the penalty coefficient for the classification error item in this classifier. The larger C corresponded to a greater punishment degree for the misclassification of samples. Therefore, the higher the accuracy in training samples, the lower the generalization ability. Conversely, the smaller C corresponded to the more misclassified samples that were allowed in the training sample then the stronger the generalization ability.
4.2. Improved CNN Classification Method
In this study, the deep learning library TensorFlow was used to replicate the Inception V3 network model. To facilitate the model training, the Separate and the Combination layers shown in
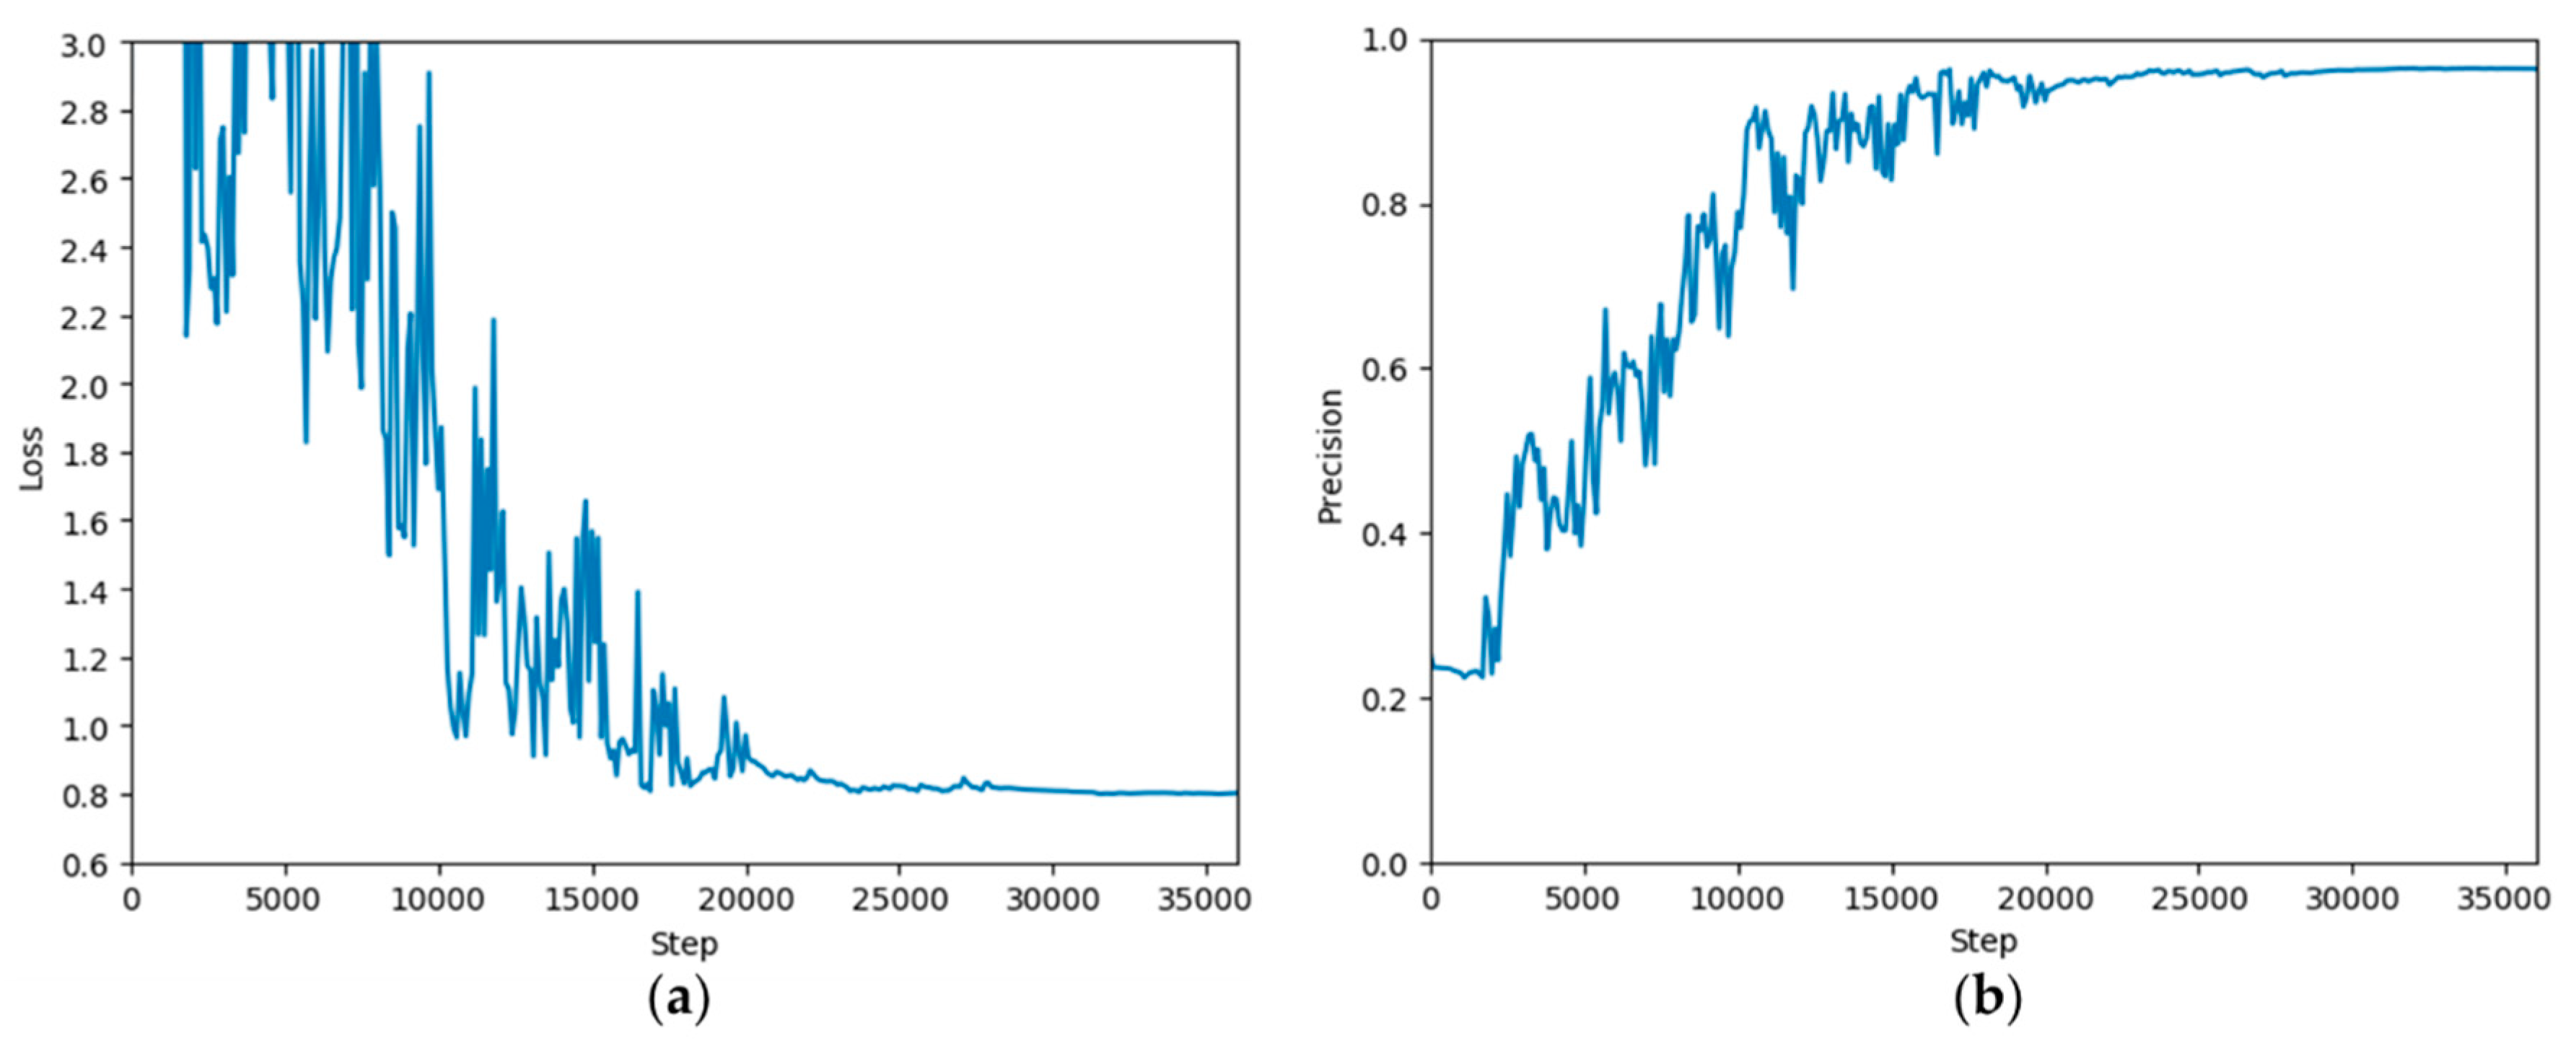
Figure 3 were removed. During the training process, the parameters were gradually optimized and adjusted, and the final parameters were as follows: the optimizer was Stochastic Gradient Descent with mini batches, the batch size was 32, the dropout ratio was 0.5. The learning rate started from 0.01 and dropped to 0.001 when the training reached 20,000 steps, and to 0.0001 at 28,000 steps.
After the training, the accuracy of the Inception V3 model finally reached 96.39% for the verification set. The loss value and accuracy change for the verification set during this training process are shown in
Figure 9.
The trained model was then tested on the test set of 1440 rectangular images, with an accuracy of 92.22%. The confusion matrix between the test results on the test set and the ground truth is shown in
Table 3. The confusion matrix showed that the number of wrong judgements between the serious and the moderate damage was 56 and the number of wrong judgements between the moderate and the slight damage was 52, and there was almost no misjudgment between the serious and the slight damage.
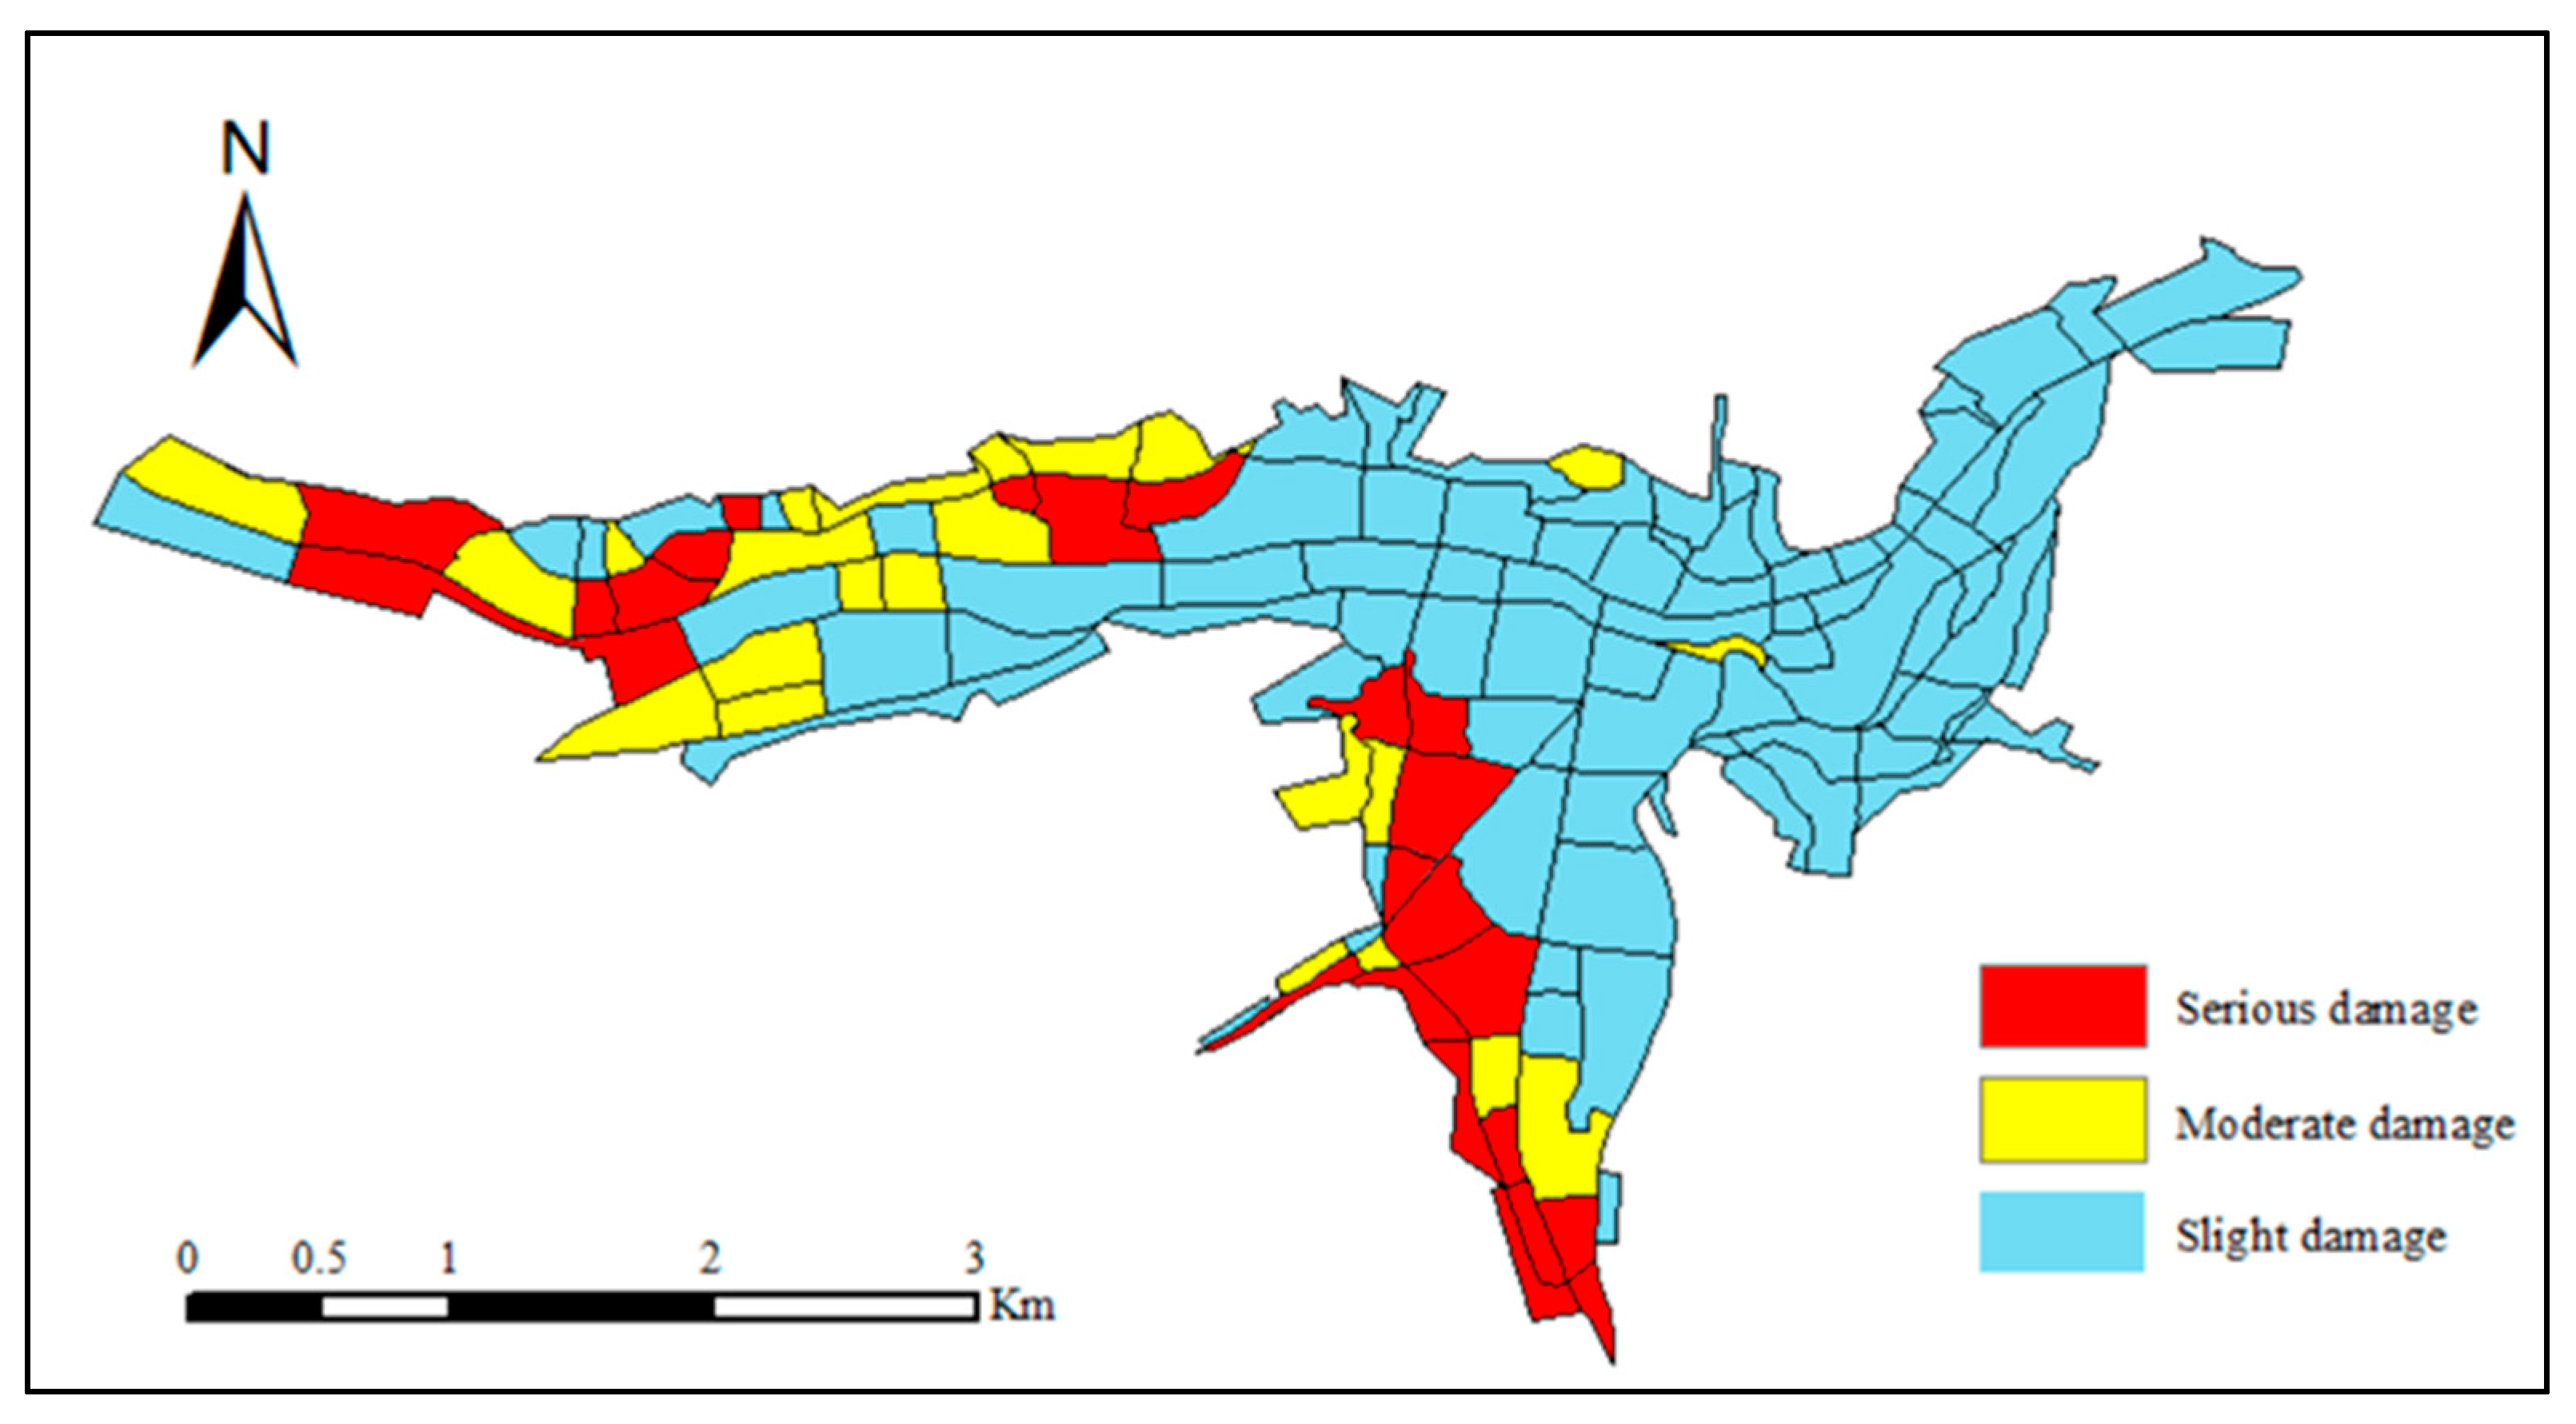
Finally, the Separate and Combination layers were added to the Inception V3 network to directly input aerial images of the Yushu earthquake and the vector map of urban blocks, and to output the vector map of building damage. After completion of the process described above, the building damage information was extracted from the aerial images after the Yushu earthquake (
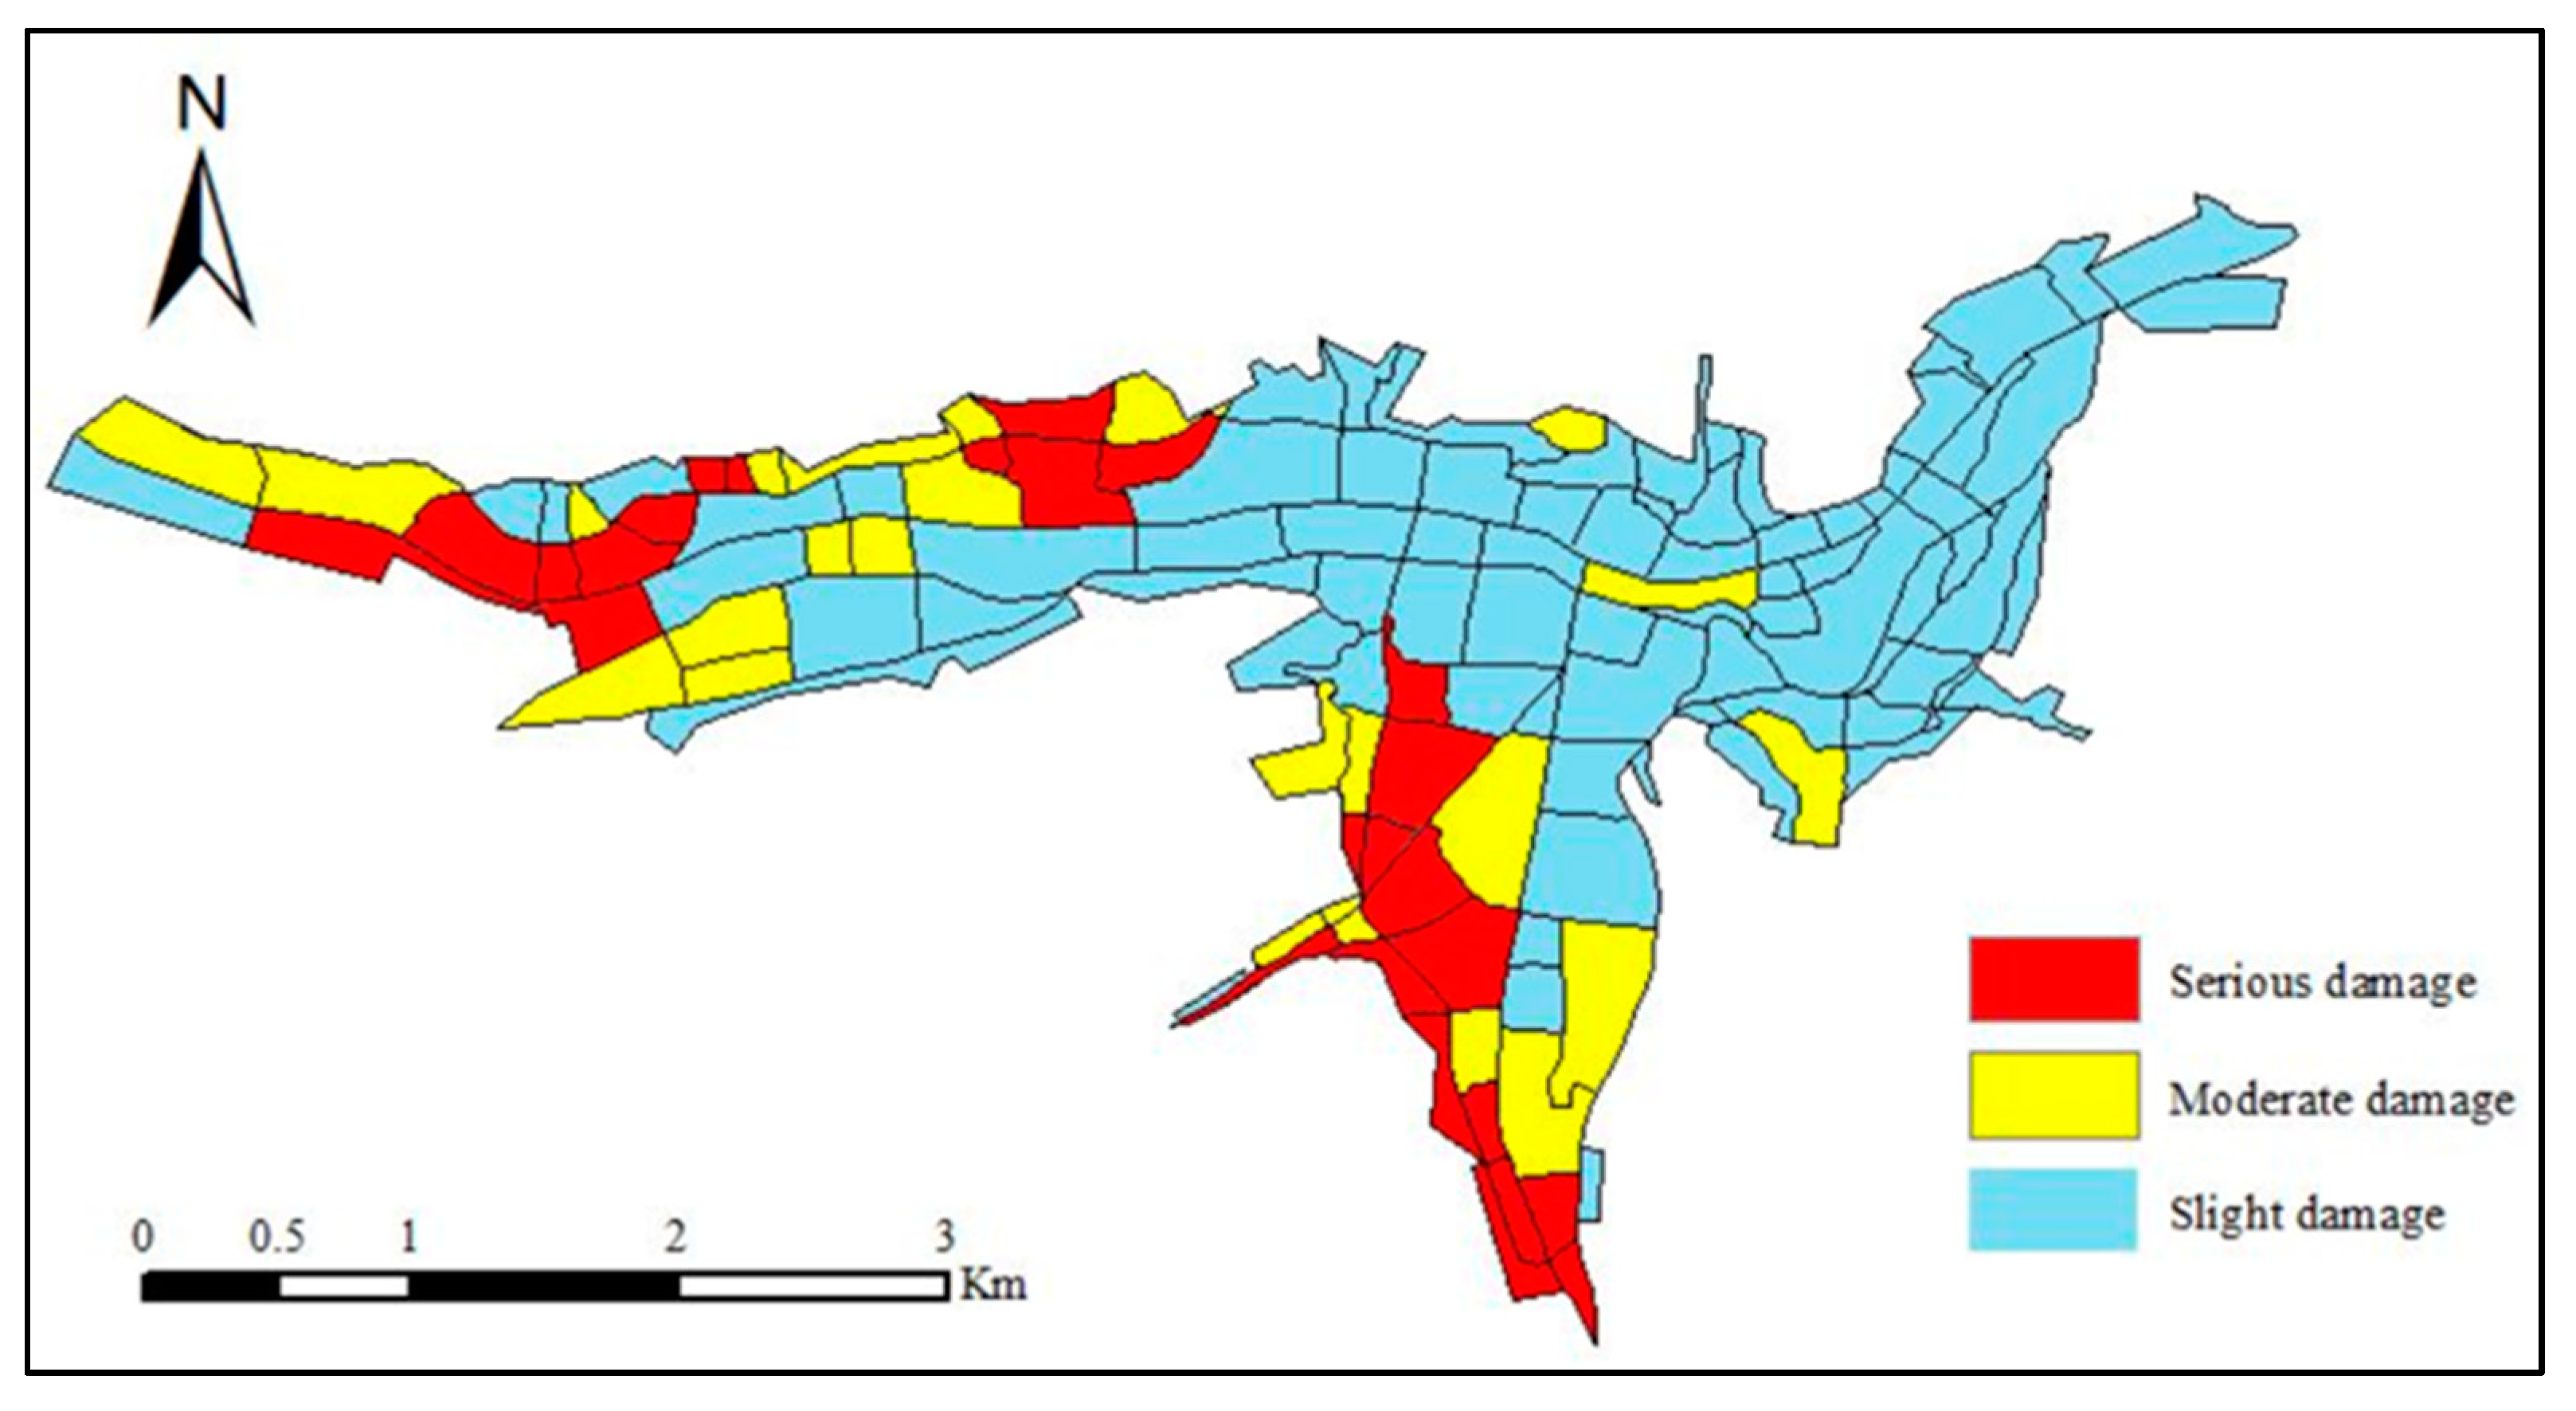
Figure 10). To compare the results extracted by the improved CNN method with the ground truth, visual interpretation was carried out by combining the pre-earthquake and post-earthquake images. The visual interpretation results were taken as the ground truth reference results. The results obtained by visual interpretation is shown in
Figure 11. Together,
Figure 10 and
Figure 11 show that the extraction result was basically consistent with the visual interpretation result, although there were still some misjudgments in some blocks.
To quantitatively compare the results of CNN extraction and visual interpretation, the confusion matrix table is shown in
Table 4. The mis-detected blocks mainly resulted from wrong judgement between the moderate and the slight damage, and the number of wrong judgements between the two categories was 7. Finally, the overall accuracy was 90.07%, and Kappa Coefficient was 0.81.
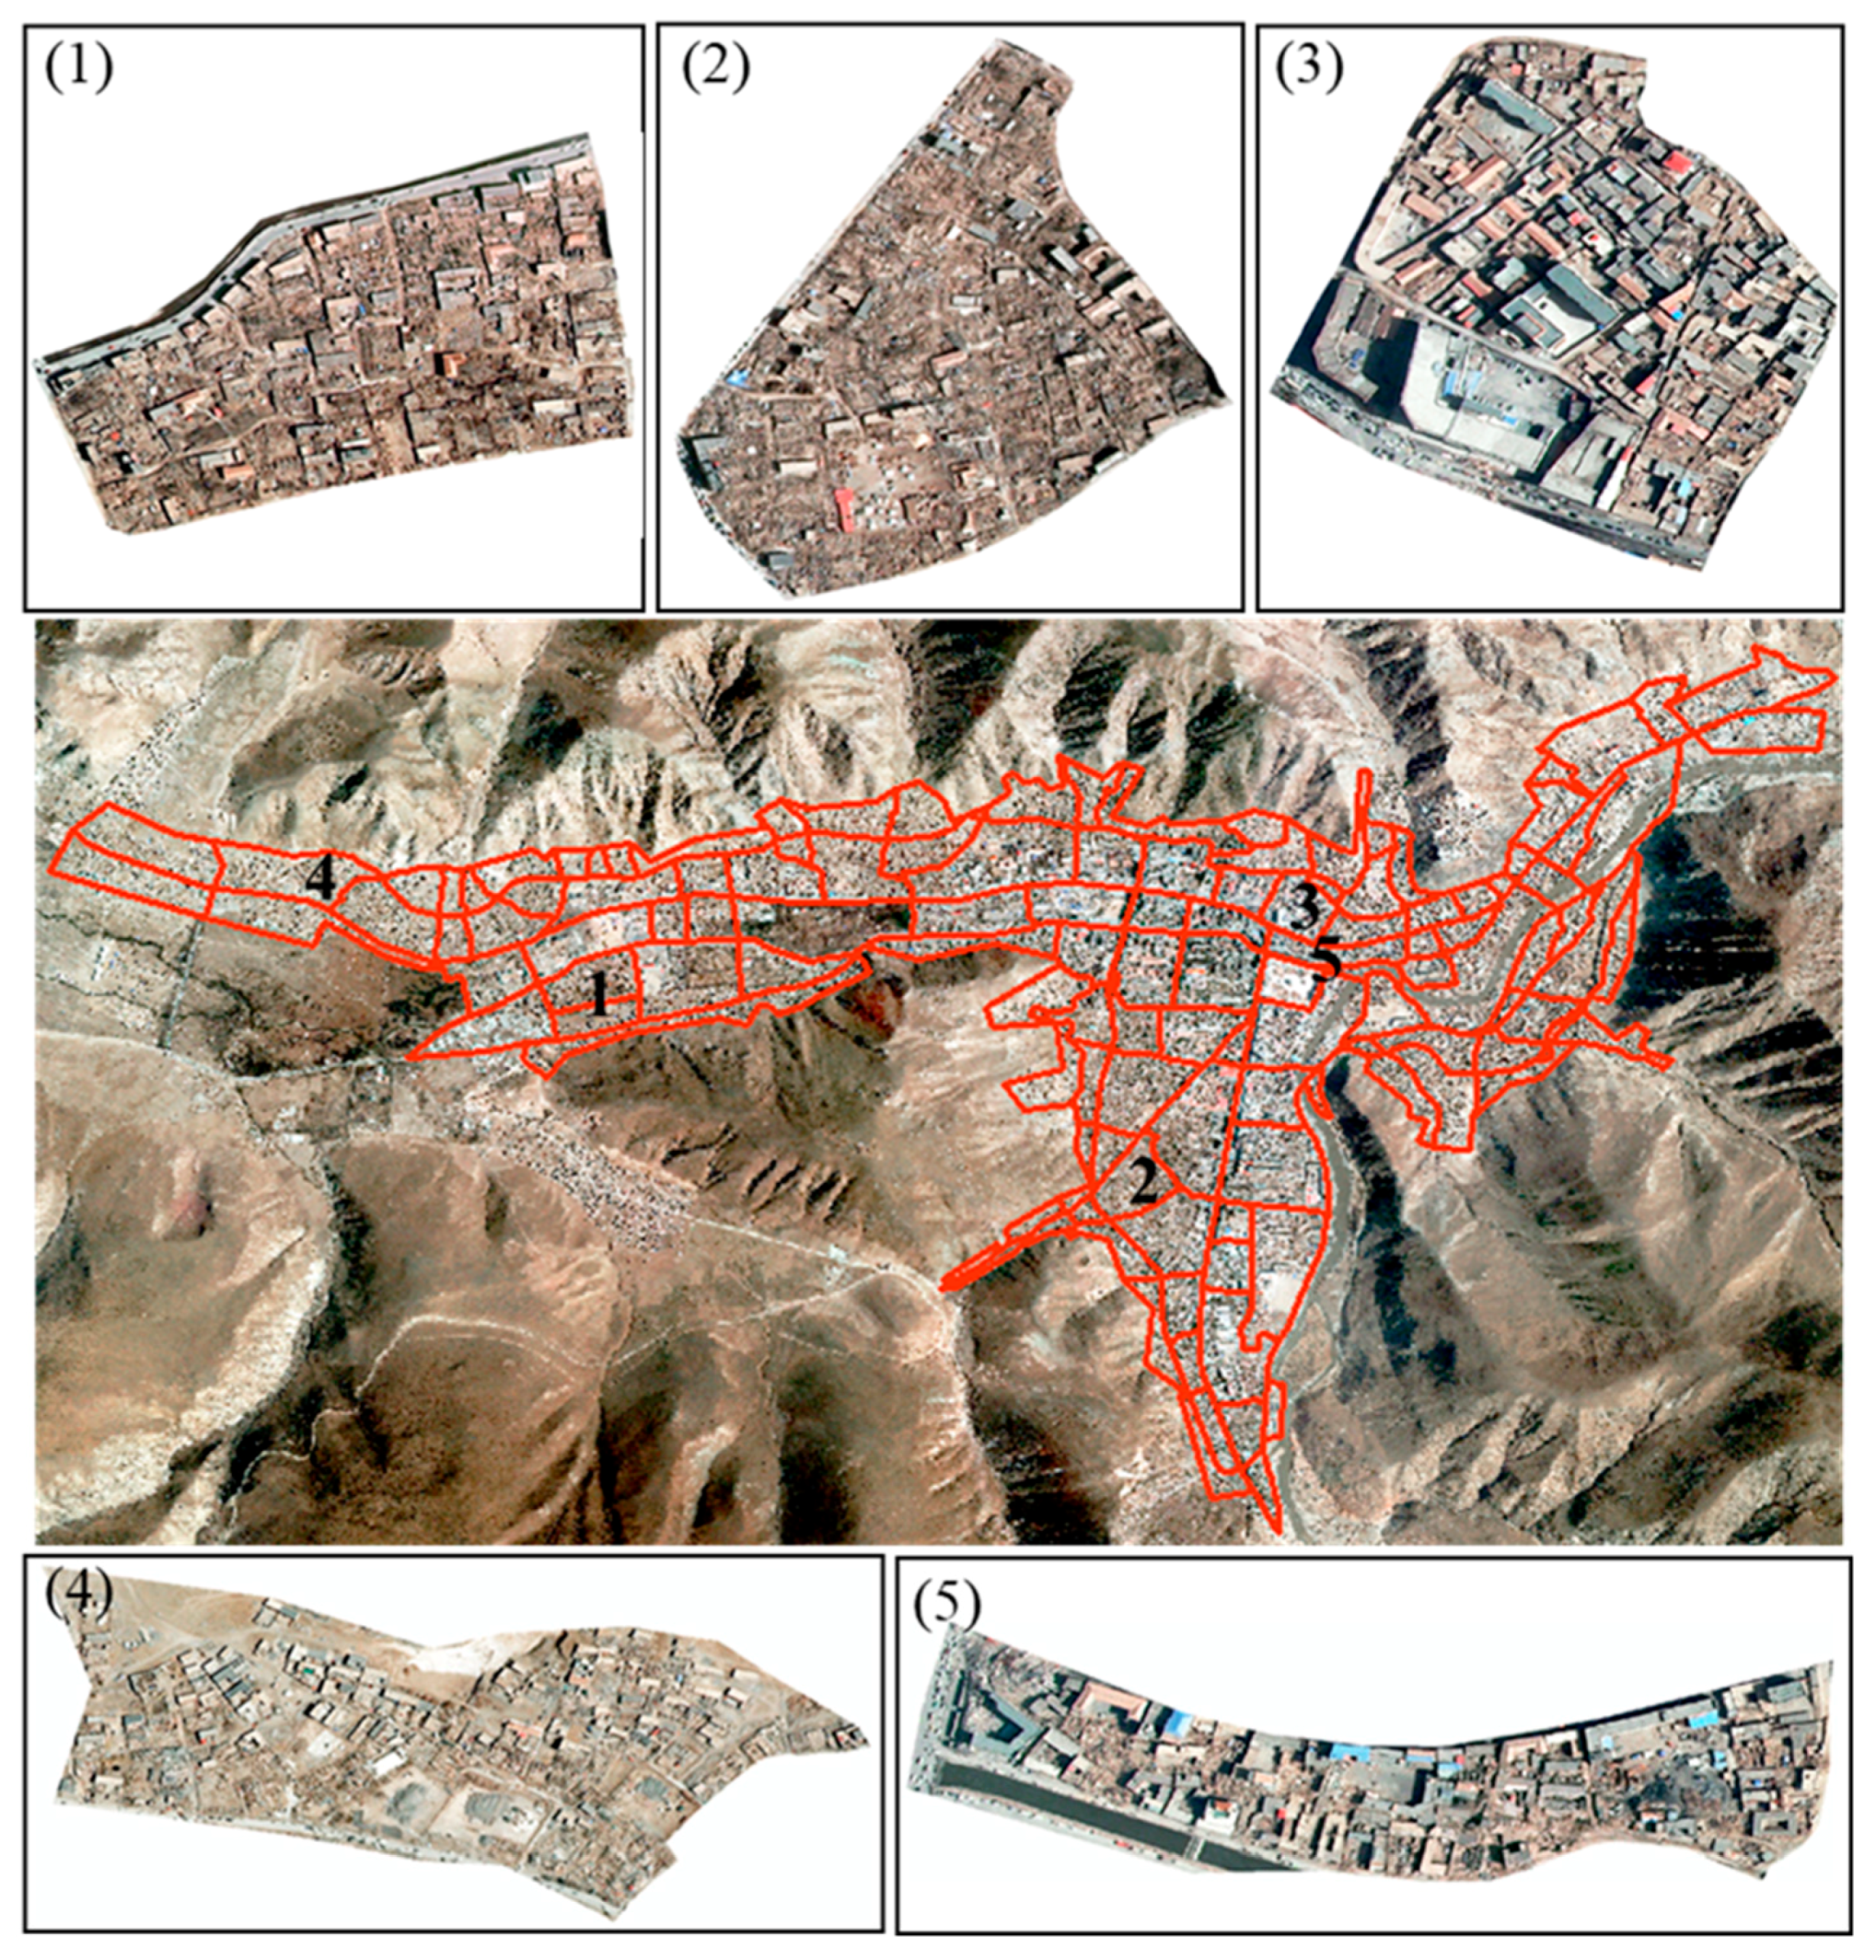
Figure 12 shows examples of some typical blocks. Blocks (1), (2) and (3) are the correct classification blocks, while (4) and (5) are the wrong classification blocks.
Table 5 shows the probability distribution of the classification results of the five blocks in
Figure 12. From the probability of each category, we concluded that the probability difference between the misclassified category and the correct category was not significant, although the classification category was wrong. This indicated that the final classification category was not the only judging criterion for the blocks with difficulty to distinguish collapse types. It was also possible to determine the confidence degree of each collapse type according to the probability of each category, to evaluate the collapse type of each block more accurately.
4.3. Discussion
In this study, some measures were taken to prevent overfitting in the training of the CNN. In fact, there was not enough data on building damage to meet the requirements. When these limited samples were used to train the large CNN, it tended to over fit. For this reason, the data set was enhanced and expanded to increase the diversity of samples. Furthermore, in the training process of the CNN, when the loss function value did not decline after a certain number of steps, the training was terminated in advance to avoid excessive learning.
In this study, the classification of damaged groups of buildings achieved high accuracy through training, but there were also some wrong classifications, which were mainly attributed to the following two reasons. First, the background environment of the high-resolution remote sensing images after an earthquake are far more complex than those of the natural images, so the background environment has a greater impact on the classification results. For example, the characteristics of collapsed adobe house and bare soil are very similar, thus, it is easy to judge bare soil as collapsed adobe house. Second, because the labeling of sample categories is judged by visual interpretation and lacks the support of ground survey data, this may cause some error labels.
The improved CNN approach proposed in this study can be extended to other CNNs. With the continuous advancement of deep learning, a CNN with higher accuracy and better performance will be developed in the near future. Adding Separate and Combination layers to better network architectures may allow the achievement of a better classification effect.
5. Conclusions
By combining an improved CNN approach with GIS data, this paper proposed a new strategy to extract the damage information of groups of buildings in remote sensing images after earthquakes. From our experiment, we found that CNNs could effectively solve the problem of difficult feature selection, which is an advantage over traditional object-oriented classification methods. Compared with the traditional multi-feature machine learning classification method constructed by artificial feature extraction, accuracy is greatly improved, and a satisfactory effect can be achieved. Block vector data in GIS can form a meaningful boundary for groups of buildings, effectively replacing image segmentation and avoiding its fragmentary and unsatisfactory results. At the same time, our method was able to avoid the big error that arises when the CNN is used to predict irregular shapes and different sizes of blocks.
However, due to the limited number of samples used for training in CNN and the confusion between collapsed buildings and bare ground, classification errors for the groups of buildings can be easily caused, meaning that there are still some errors in comparison with the ground truth.
Therefore, extending the training data set, including remote sensing images of different types and resolutions, is future work to be tested for improvement. The methods combining multi-classifiers including CNN should be considered to improve the classification accuracy of groups of buildings.


