Landsat Time Series Assessment of Invasive Annual Grasses Following Energy Development


1
US Geological Survey, Western Geographic Science Center, P.O. Box 158, Moffett Field, CA 94035, USA
2
Independent contractor, Oakland, CA 94609, USA
*
Author to whom correspondence should be addressed.
Remote Sens. 2019, 11(21), 2553; https://doi.org/10.3390/rs11212553
Submission received: 7 September 2019
/
Revised: 11 October 2019
/
Accepted: 25 October 2019
/
Published: 30 October 2019
(This article belongs to the Special Issue Applying Earth Surface Monitoring to Investigate Climate and Land Change Interactions)
Abstract
:Invasive annual grasses are of concern in much of the western United States because they tolerate resource variability and have high reproductive capacity, with propagules that are readily dispersed in disturbed areas like those created and maintained for energy development. Early season invasive grasses “green up” earlier than most native plants, producing a distinct pulse of greenness in the early spring that can be exploited to identify their location using multi-date imagery. To determine if invasive annual grasses increased around energy developments after the construction phase, we calculated an invasives index using Landsat TM and ETM+ imagery for a 34-year time period (1985–2018) and assessed trends for 1755 wind turbines installed between 1988 and 2013 in the southern California desert. The index uses the maximum Normalized Difference Vegetation Index (NDVI) for early season greenness (January-June), and mean NDVI (July–October) for the later dry season. We estimated the relative cover of invasive annuals each year at turbine locations and control sites and tested for changes before and after each turbine was installed. The time series was also mapped across the region and temporal trends were assessed relative to seasonal precipitation. The results showed an increase in early season invasives at turbine sites after installation, but also an increase in many of the surrounding control areas. Maps of the invasive index show a region-wide increase starting around 1998, and much of the increase occurred in areas surrounding wind development sites. These results suggest that invasions around the energy developments occurred within the context of a larger regional invasion, and while the development did not necessarily initiate the invasion, annual grasses were more prevalent around the developments.
Keywords:
exotic species; Bromus tectorum; energy development; time series; Landsat; Google Earth Engine; NDVI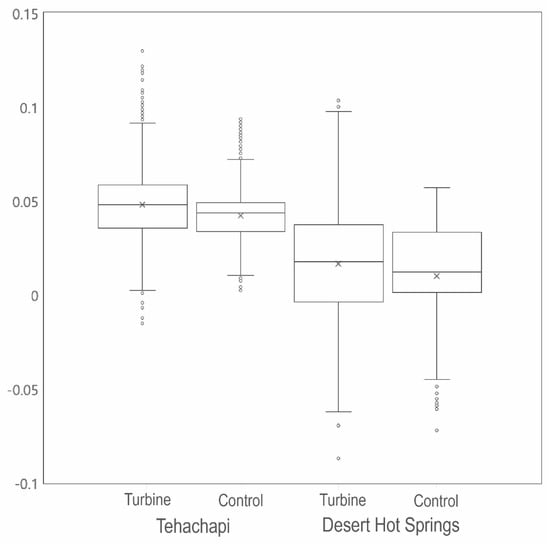
1. Introduction
One of the major ecological consequences of increasing global connectivity is the introduction, establishment, and spread of non-native species into new ecosystems [1]. The rate and extent of biological invasions continues to increase globally [2], often at considerable environmental and economic costs [3]. For instance, in the western United States, both accidental and intentional introductions of non-native plants have contributed to habitat loss and increased wildfire risk [4]. Once established, non-natives can transform ecosystems, complicating land management decision-making and impeding ecological restoration [5]. These issues are magnified in areas where increasing climate variability may be expected. Given the inherent challenges of managing ecosystems and invasive species in a rapidly changing world, information on the geographic distribution of invasive plants, their rate of spread, and the factors contributing to successful invasion are critical for informed management and decision-making.
Plant invasions are often facilitated by changes in land use that create openings through surface disturbances and conduits for dispersal like roads and trails [6,7]. In the arid southwestern United States vegetation loss and habitat fragmentation caused by land uses like urban development, livestock grazing, roads, and off-road recreational vehicle use, and their effects on ecosystems has been well documented [8,9,10]. Surface disturbance and fragmentation from energy exploration and development (EED) is a growing concern throughout the region with both conventional and renewable energy sectors growing at a rapid rate to support national energy demands [11,12,13]. In California for example, much of the recent utility-scale solar energy development has occurred in biologically diverse desert and shrubland regions [14], areas susceptible to invasion by exotic grasses [15]. Once established, non-native annual grasses can create a continuous layer of fine fuels in otherwise sparsely covered desert plant communities and facilitate a cycle of fire in ecosystems not adapted to fire [16]. Energy development infrastructure and materials are also ignition sources [17], potentially helping to accelerate the grass-fire cycle in these areas. The direct relationship between land change driven by EED and the establishment and spread of invasive species in the arid Southwest has not yet been well quantified.
Remote sensing provides a powerful tool to characterize how landscapes change immediately following the EED process, and for monitoring reclamation (aka rehabilitation) and restoration efforts after the initial development [18,19]. EED generally includes a disturbance phase when the site (e.g., oil pad, crane pad), access roads, and transmission corridors are cleared, followed by an interim reclamation or rehabilitation period during operation that reduces the disturbed footprint around the energy site. Remote sensing approaches for mapping the disturbance footprint of energy sprawl typically use high resolution (<1m) aerial imagery for digitization [20] or image classification [21]. Moderate resolution (20–50 m) multispectral data with repeat coverage have proven useful for identifying the location and timing of disturbances, the amount of vegetation loss, and site recovery over time after treatment under various different circumstances [22,23,24]. For example, Waller et al. (2018) estimated vegetation cover continuously across a time series of Landsat satellite images before and after sites were developed for oil and gas extraction on the Colorado Plateau, and developed metrics to estimate site recovery over time. Statistical analysis of factors contributing to recovery indicated that much of the measured recovery could be explained by the presence of exotic annual grasses, and suggests that these techniques can be readily extended to investigate recovery trends in other disturbed systems [19].
Methods for discriminating between native and invasive plants with satellite imagery for mapping patterns of non-natives is a growing focus of environmental remote sensing [25]. Some of the most promising approaches utilize hyperspectral imagery for mapping [26], but this often precludes use for detailed time-series analysis of spatial patterns of spread over large areas. Moderate-low resolution satellites with good temporal coverage like MODIS have generally provided good insights into regional patterns of vegetation productivity in areas dominated by annual grasses [27] but may miss some of the fine-scale landscape patterns. Landsat 30-m resolution data is ideal for time series analysis of invasives both for the spatial resolution and the length of the archive. However, obtaining timely cloud-free observations can be a challenge with only the 16-day return interval, especially in cases where the non-native plant greens up for a brief period during the early season. Recent advances in cloud computing with Google Earth Engine [28] has facilitated the use of Landsat imagery for time series development [29], making it easy to utilize multiple Landsat collections (i.e., TM, ETM+, OLI) and exploit data-rich areas where the paths overlap, increasing the probability of cloud-free images.
Multi-date spectral information can be used to identify and exploit different phenological phases of non-native and native species [30,31]. The non-native annual grasses red brome (Bromus rubens) and cheatgrass (Bromus tectorum) are a major concern for range management and habitat conservation across the western U.S. [32,33], and their spatial and temporal dynamics have been the focus of many recent remote sensing studies [34,35]. Red brome and cheatgrass “green up” earlier than native vegetation, producing a distinct pulse of greenness in the early spring. This pulse can be exploited to identify the location of cheatgrass by using a difference of the spring image with peak cheatgrass greenness vs. early summer image where cheatgrass is senescent [36]. This concept was applied in the Detection of Early-Season Invasives (DESI) approach on the Colorado Plateau [19,37,38] utilizing a differenced spring and summer Normalized Difference Vegetation (NDVI) from multi-date Landsat to produce cheatgrass maps. Boyte et al. (2016) used an Annual Cheatgrass Index that normalizes the spring/summer NDVI difference by the sum of the NDVI of those two dates [35]. The observed greening pulse of cheatgrass is generally greatest during years with high winter/spring precipitation, and during these periods a single NDVI is often sufficient for accurate mapping [39].
In this study we aim to better understand trends and patterns of early season invasive grasses around wind turbine sites across southern California. We hypothesized that initial access road construction and site clearing for turbine construction, and continuing maintenance activity during operation, would contribute to the establishment and spread of invasive grasses around wind energy sites. More specifically, we hypothesized that (1) annual grasses would be greater in the period after the establishment of wind turbines when compared to the period prior, and (2) annual grasses would be greater in the areas surrounding the turbine sites relative to control areas further from the turbine. To determine this, we used Landsat TM and ETM+ imagery from 1985–2018 to develop estimates of invasive grasses and assess whether increases could be detected after installation of wind turbines installed at two study areas in the deserts of southern California, USA.
2. Materials and Methods
2.1. Study Area
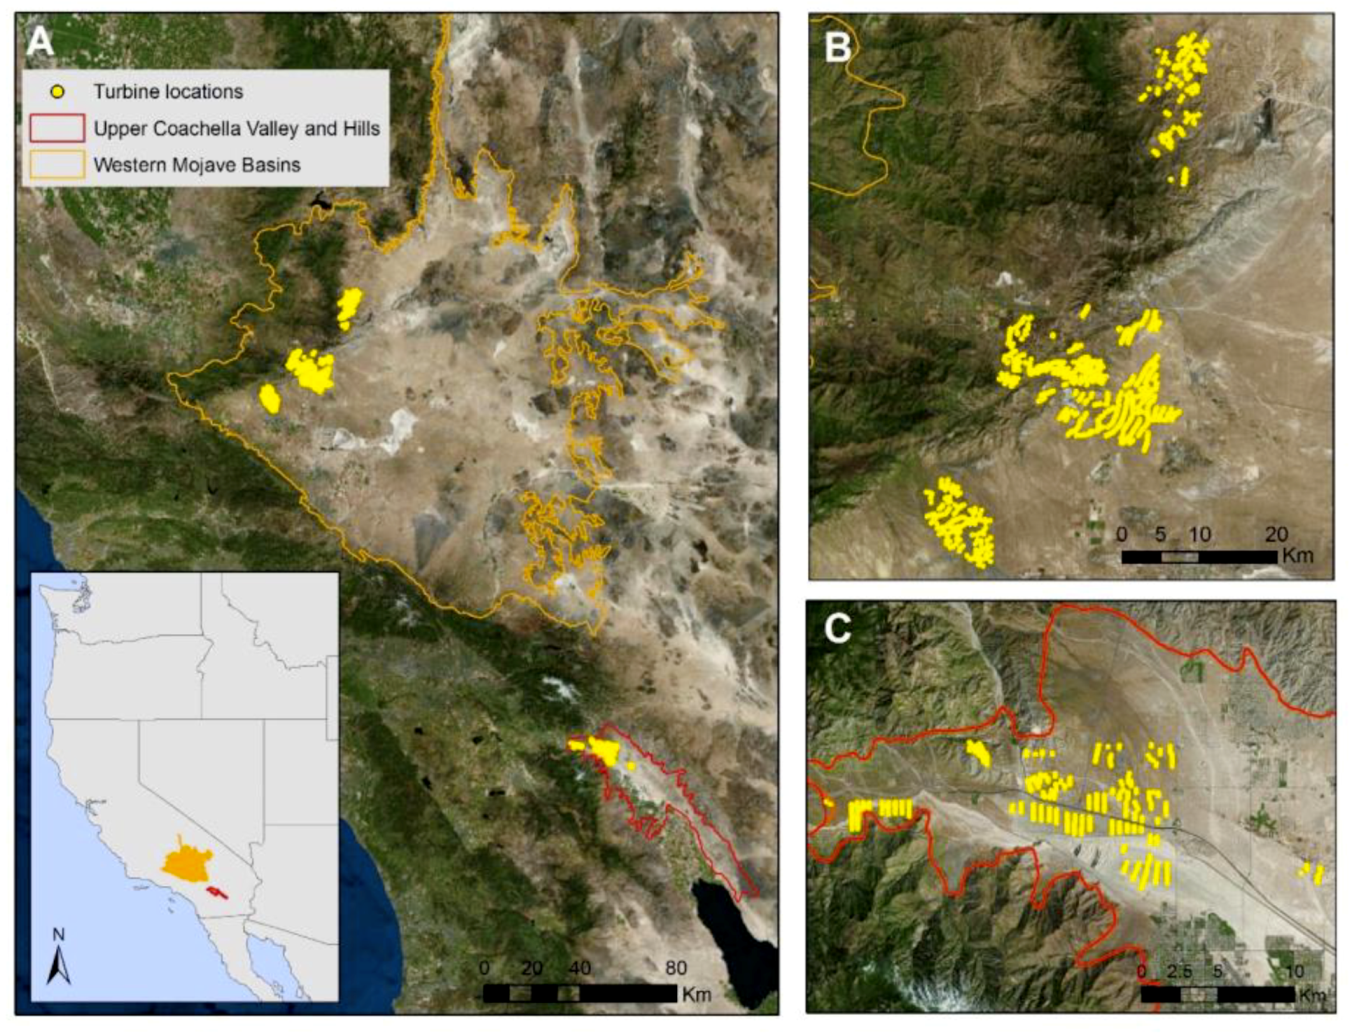
We selected two major wind energy development study areas in the Mojave and Colorado Deserts of southern California, USA. Sites of the northern study area occur at the northwestern edge of the Western Mojave Basins Level IV Ecoregion, near the Tehachapi Mountains (hereafter this area is referred to as Tehachapi) (Figure 1). The southern study area sites occur in the Upper Coachella Valley and Hills Level IV Ecoregion, east of San Gorgonio Pass, between the cities of Palm Springs and Desert Hot Springs (hereafter referred to as Desert Hot Springs) (Figure 1).
The Desert Hot Springs study area has a range in elevation from 210–860 m at the northwest edge of the Colorado Desert. The Tehachapi turbine sites are generally at a higher elevation (840–1280 m), on the edge of the Mojave Desert, with a few turbines along the transition zone from desert scrub to grasslands and woodlands of the Tehachapi Mountains. The Tehachapi study area, on average, receives only slightly more annual average winter precipitation (229 mm) than the Desert Hot Springs (215 mm) (GRIDMET; [40]).
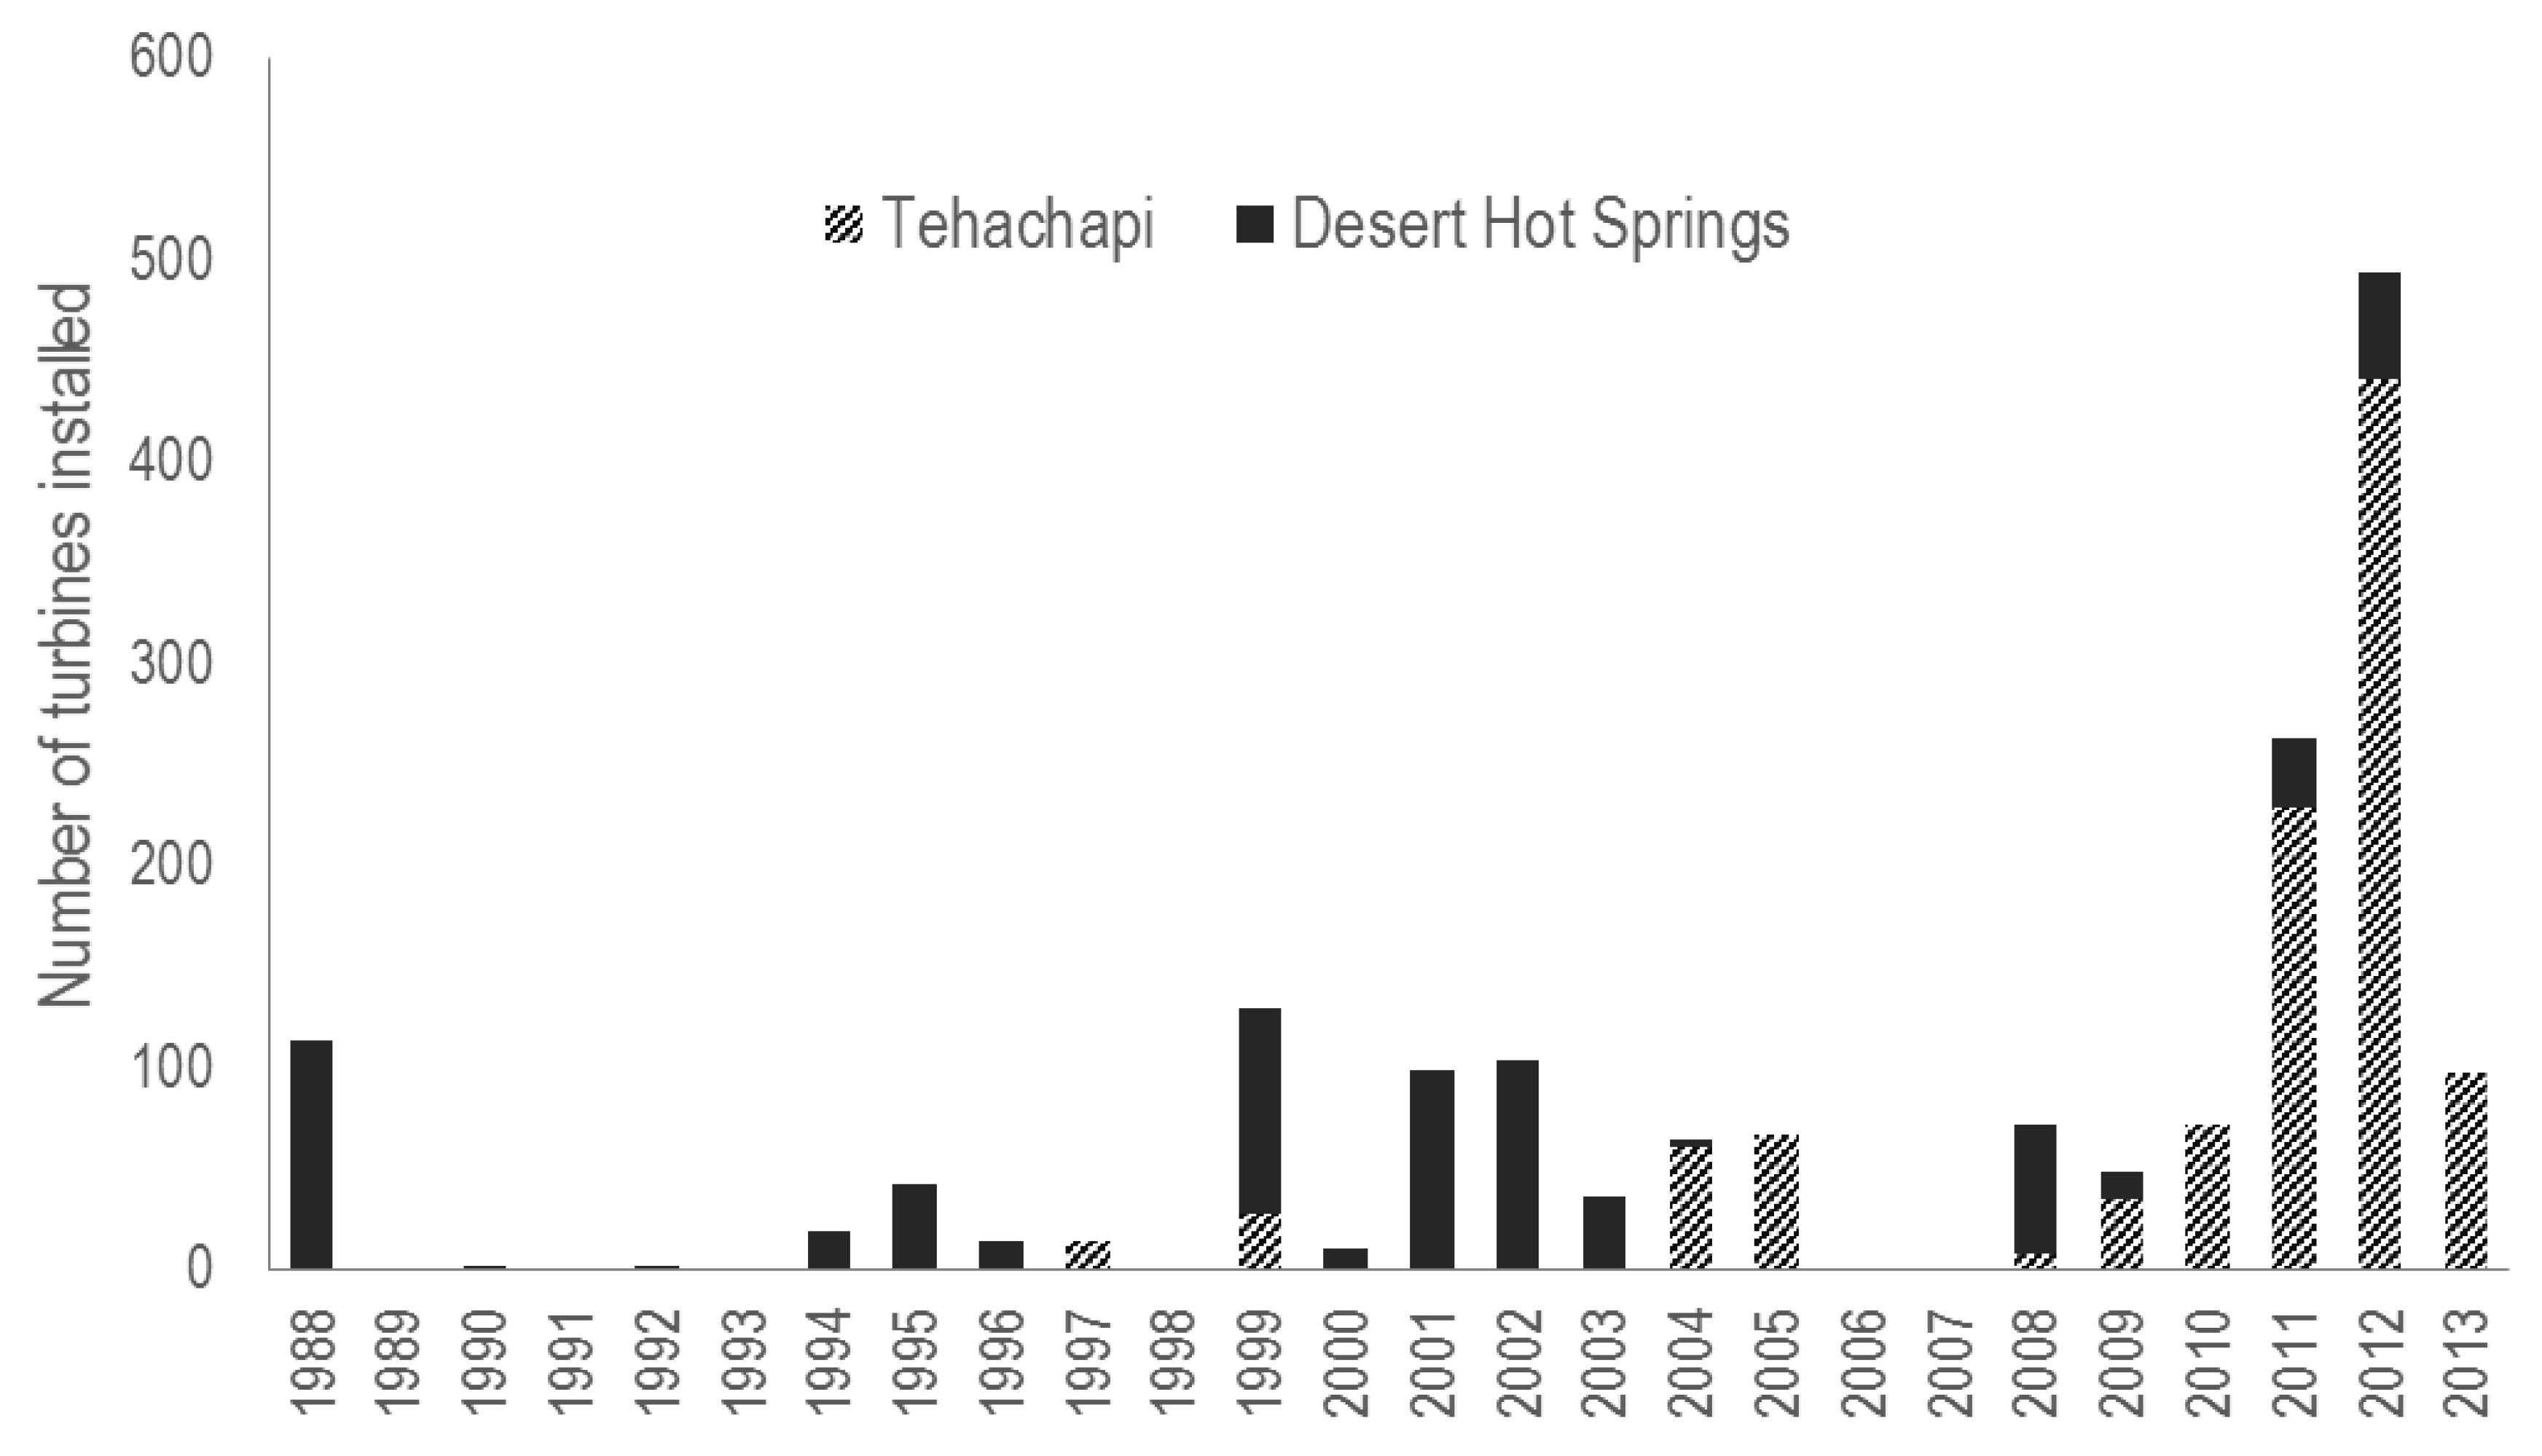
Wind turbine locations and attributes were downloaded from the United States Wind Turbine Database [41]. A range of installation years was selected to ensure at least three years of consistent Landsat data before the installation (most sites have many more years pre-installation) and at least five years post-installation. At these two study areas there were a total of 6736 wind turbines in the database, with 1755 installed between 1988 and 2013. 1050 turbines occur at Tehachapi and 705 at Desert Hot Springs. The Desert Hot Springs turbines were generally installed earlier, with many in the late 1980’s and early 2000’s; the Tehachapi turbines are more recent, with a majority of the installations included in this analysis occurring between 2011–2013 (Figure 2). The Desert Hot Springs turbines are older generation models characterized by lower height, smaller rotor diameter, and less capacity. The average height, from ground to tip of a blade at its apex, is 76 m, and mean turbine rotor diameter is 47 m. Collectively, these southern turbines have a capacity of 485,600 megawatts. The Tehachapi group of turbines, which were generally installed more recently, are 118 m in height on average, with an average rotor diameter of 66 m. Each turbine at this study area produces roughly 3x the megawatt production capacity. The cumulative capacity of all turbines in the northern wind power project is 2.2 million megawatts.
2.2. Sampling Design
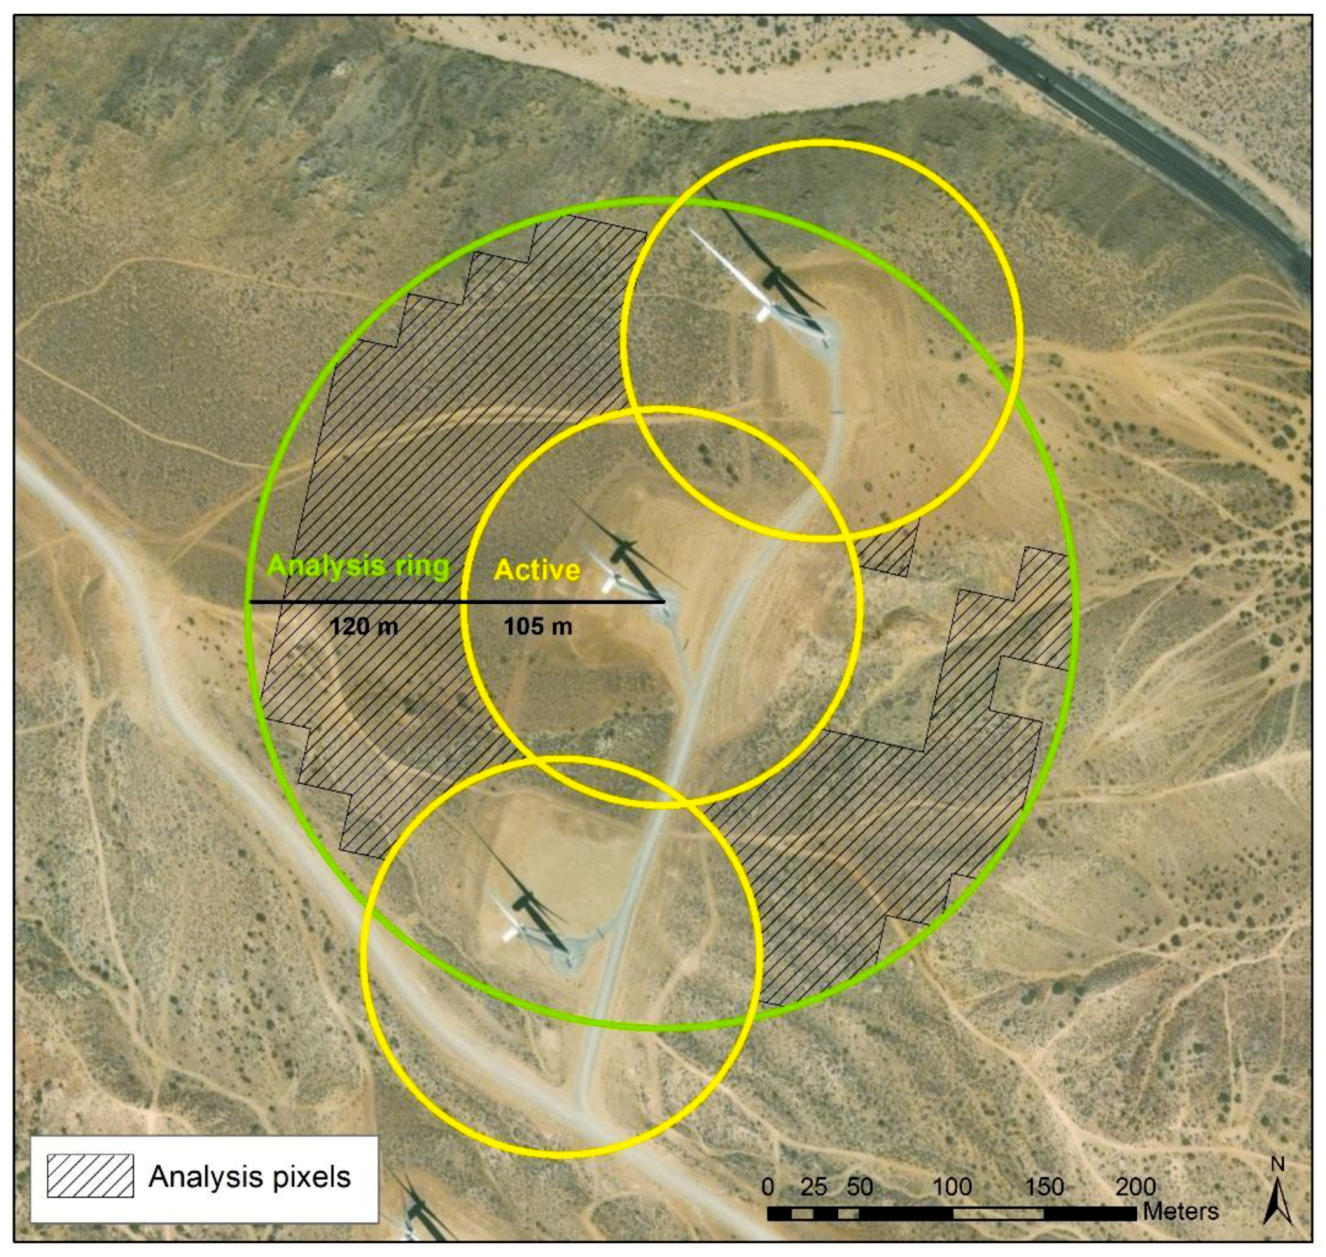
We established a sampling scheme to assess changes in exotic grasses in areas radiating out from disturbed areas surrounding the turbines. The core area within a 105 m radius from the turbines center, which contains the turbine tower, access roads, the permanent gravel turbine pad, as well as reclaimed areas and other disturbances was considered actively used and excluded from analysis. Outside of the 105 m active areas we established 120 m-wide ring that contains the pixels used for analysis (Figure 3). Areas within the ring that intersect with active areas around adjacent turbines were masked out (Figure 3), and pixels with other heavy disturbances and roads were masked using threshold (<0.05) on a vegetation index (NDVI) calculated from a summer 2018 (May–August) Landsat 8 (cloud-masked) median composite image.
For our control sites, we generated a set of random points (n = 4314; 2937 for Tehachapi and 1377 for Desert Hot Springs) based on multiple criteria: points were >500 m from a turbine, were screened for burned areas [42], developed/disturbed areas (i.e., land cover, mines, roads) and vegetation type from the GAP landcover data set [43]. These points, in turn, were subsampled into a control set for each turbine, selecting those points within 2000 m of each turbine and then each point buffered 45 m for sampling the imagery.
2.3. Landsat Time Series of Early Season Invasives
Cloud-masked Landsat 5 and Landsat 7 data were processed from 1985 to 2018 in Google Earth Engine [28] to generate a 34-year time series of an invasives index (Landsat 5: 1985–2011, Landsat 7: 2011–2018). The annual invasives index, modeled after the DESI index [37], uses the contrast in early season and late season NDVI, to estimate the relative amount of invasive annuals at a given location in a given year. We chose our early season time window to extend from January through June due to the potential for early green-up in the warm California desert. The maximum NDVI pixel was selected from all January-June cloud-free scenes for the early season, and the median NDVI from the July-October dry season. We refer to the differenced NDVI product simply as the Early Season Invasives (ESI) index (Equation (1)).
ESI = NDVI max value (January–June) − NDVI median value (July–October)
We generated an ESI time series for turbine rings and for all control points and calculated the mean value within their respective buffers. Data were imported into R [44] for processing to before-installation (1985–) and after-installation (–2018) mean ESI values for each turbine ring, and associated random control points. Data from the installation year was excluded from calculation. To compare results among ESI values before and after turbine construction, as well as between turbines and control areas, we applied fixed-effect analysis of variance (ANOVA) single factor tests.
Kokaly (2011) established DESI index thresholds of >0.1 (high probability) and >0.075 (low probability) based on known location of cheatgrass, and these default thresholds have been applied in other studies on the Colorado Plateau [38] where the initial algorithm was developed. However, because these thresholds are specific to Landsat data collected over the Colorado Plateau, Kokaly suggested user-defined thresholds might prove more effective in other regions [37]. We investigated ESI thresholds values in our study region through comparison with field observations available through CalWeedMapper (https://calweedmapper.cal-ipc.org/maps) and environmental assessment surveys performed by Southern California Edison [45]. CalWeedMapper is an online portal created by the California Invasive Plant Council (Cal-IPC) that integrates and serves plant invasion occurrence data reflected in the Calflora and Consortium of California Herbaria (CCH) databases. The Southern California Edison data contained information of mapped patches of invasive grasses. In CalWeedMapper we queried the database within the USGS quads covering our study turbines and assessed all available observations, but only considered samples that fell within our study period (1985–2018) and had reliable geo-location information. All sites were identified by isolating coordinates, species type (B. rubens or B. tectorum), site description and collection date. A total of 30 sample locations met these requirements, which were a mix of cheatgrass and red brome. Using Google Earth Pro we visually assessed the observation sites and ranked them according to visible herbaceous density and cover (high, moderate and low). We calculated ESI for each sample location from the date of the initial observation through the remainder of the time period, and heuristically identified thresholds across all the sites based on the cover information assigned to the field sample. Ultimately, we identified thresholds in our study area that were slightly more conservative than the original DESI thresholds; These thresholds are: >0.20 (very high probability), 0.15–0.20 (high probability), 0.12–0.15 (moderate probability), 0.10–0.12 (low probability) and <0.10 (none present). Appendix A contains a time series of ESI collected at the sample locations, plotted with winter precipitation from the same locations.
2.4. Regional Trend and Climate Analysis
In order to characterize regional ESI patterns during the time period, and to identify areas with sustained presence of invasive annuals, we summed the raw (non-thresholded) ESI values over 5-year periods for each pixel in the study region and mapped the changes over time. We also evaluated trends in ESI relative to winter precipitation by aggregating 4km daily Gridded Surface Meteorological dataset (GRIDMET; [40] values into monthly totals for October-April of each year and assessed the linear relationship between the two variables.
3. Results
3.1. Comparison of ESI before and after Development
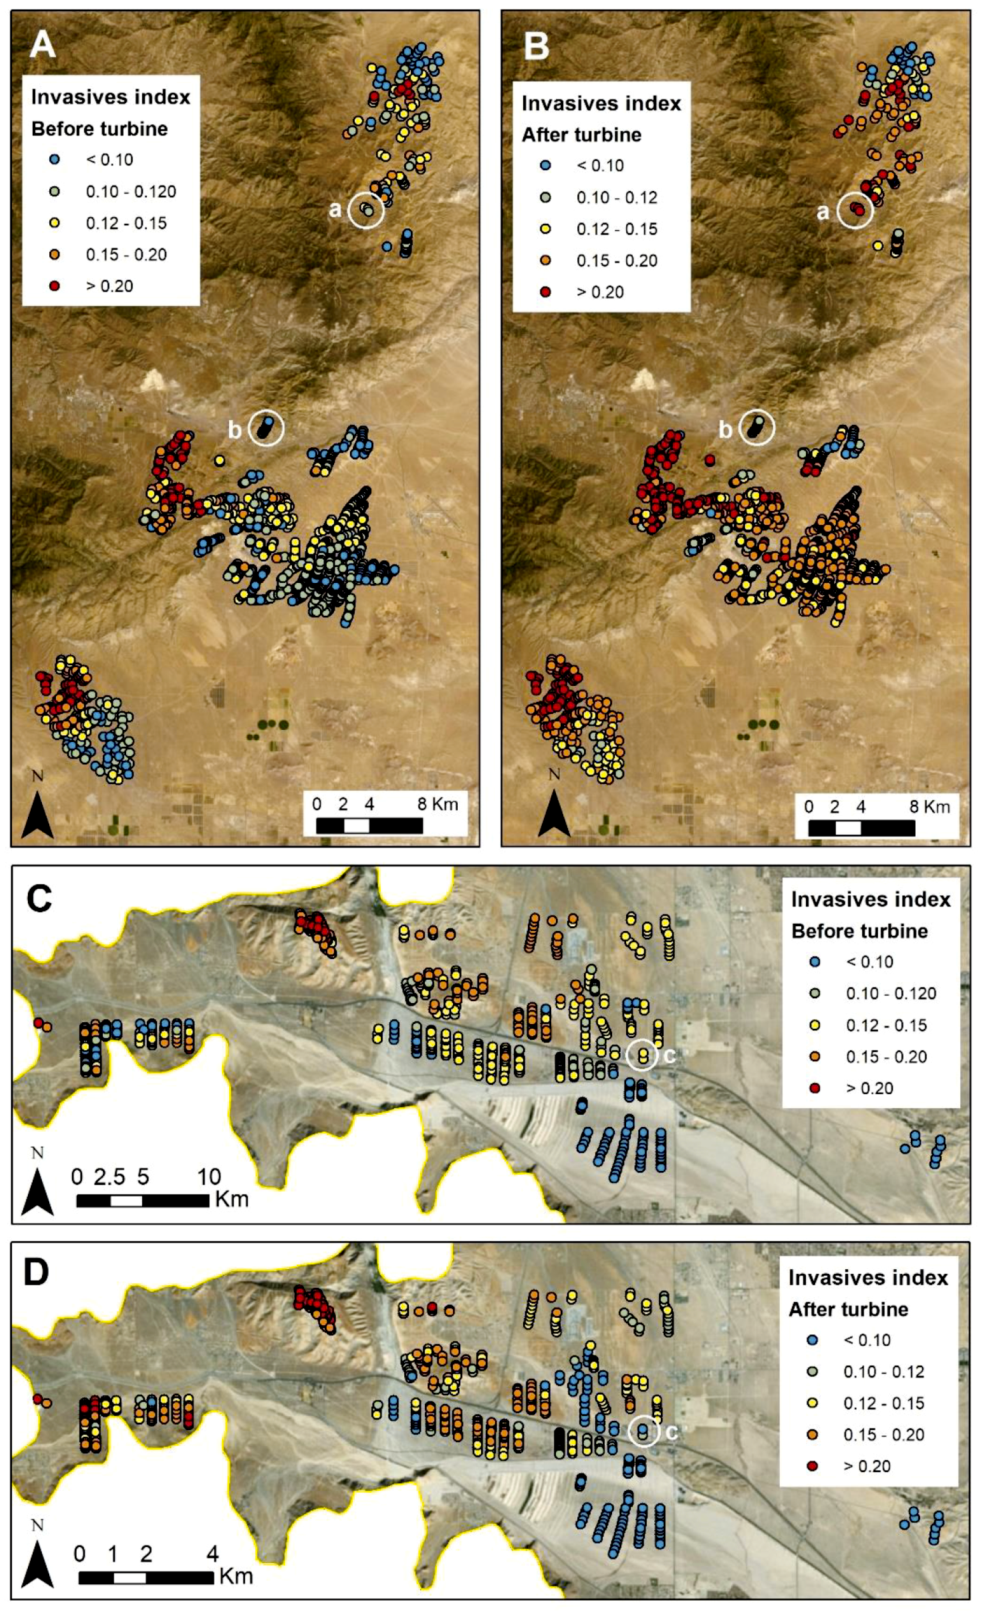
The areas immediately outside the active/disturbed turbine areas widely experienced some increase in ESI after turbine installation when compared to their pre-installation values, with 89% of the 1755 turbines increasing (average of 27% ESI increase) in the period following construction (Figure 4, Table 1). The amount and magnitude of increase varied between the northern and southern study areas (Table 1, Figure 4). In Tehachapi, 99.6% of the turbine sites experienced an increase during the period after installation (mean 38% ESI increase), whereas 71.9% of the southern turbine sites experienced an increase after turbine construction (mean 12% increase). The number of turbines with “very high” (>0.20) ESI values at Tehachapi increased from 94 to 231 in the period after installation (e.g., example “a” in Figure 4) and the number of turbines with no invasives (ESI < 0.10) decreased from 269 to 46 after installation (e.g., example “b” in Figure 4). The number of turbines in Desert Hot Springs with “very high” (>0.20) ESI values increased from 72 to 137 after installation and the number with no invasives (ESI < 0.10) decreased slightly from 145 to 129 after installation. There were several turbines in this area that showed a decline from low-moderate cover to none after installation (e.g., example “c” in Figure 4).
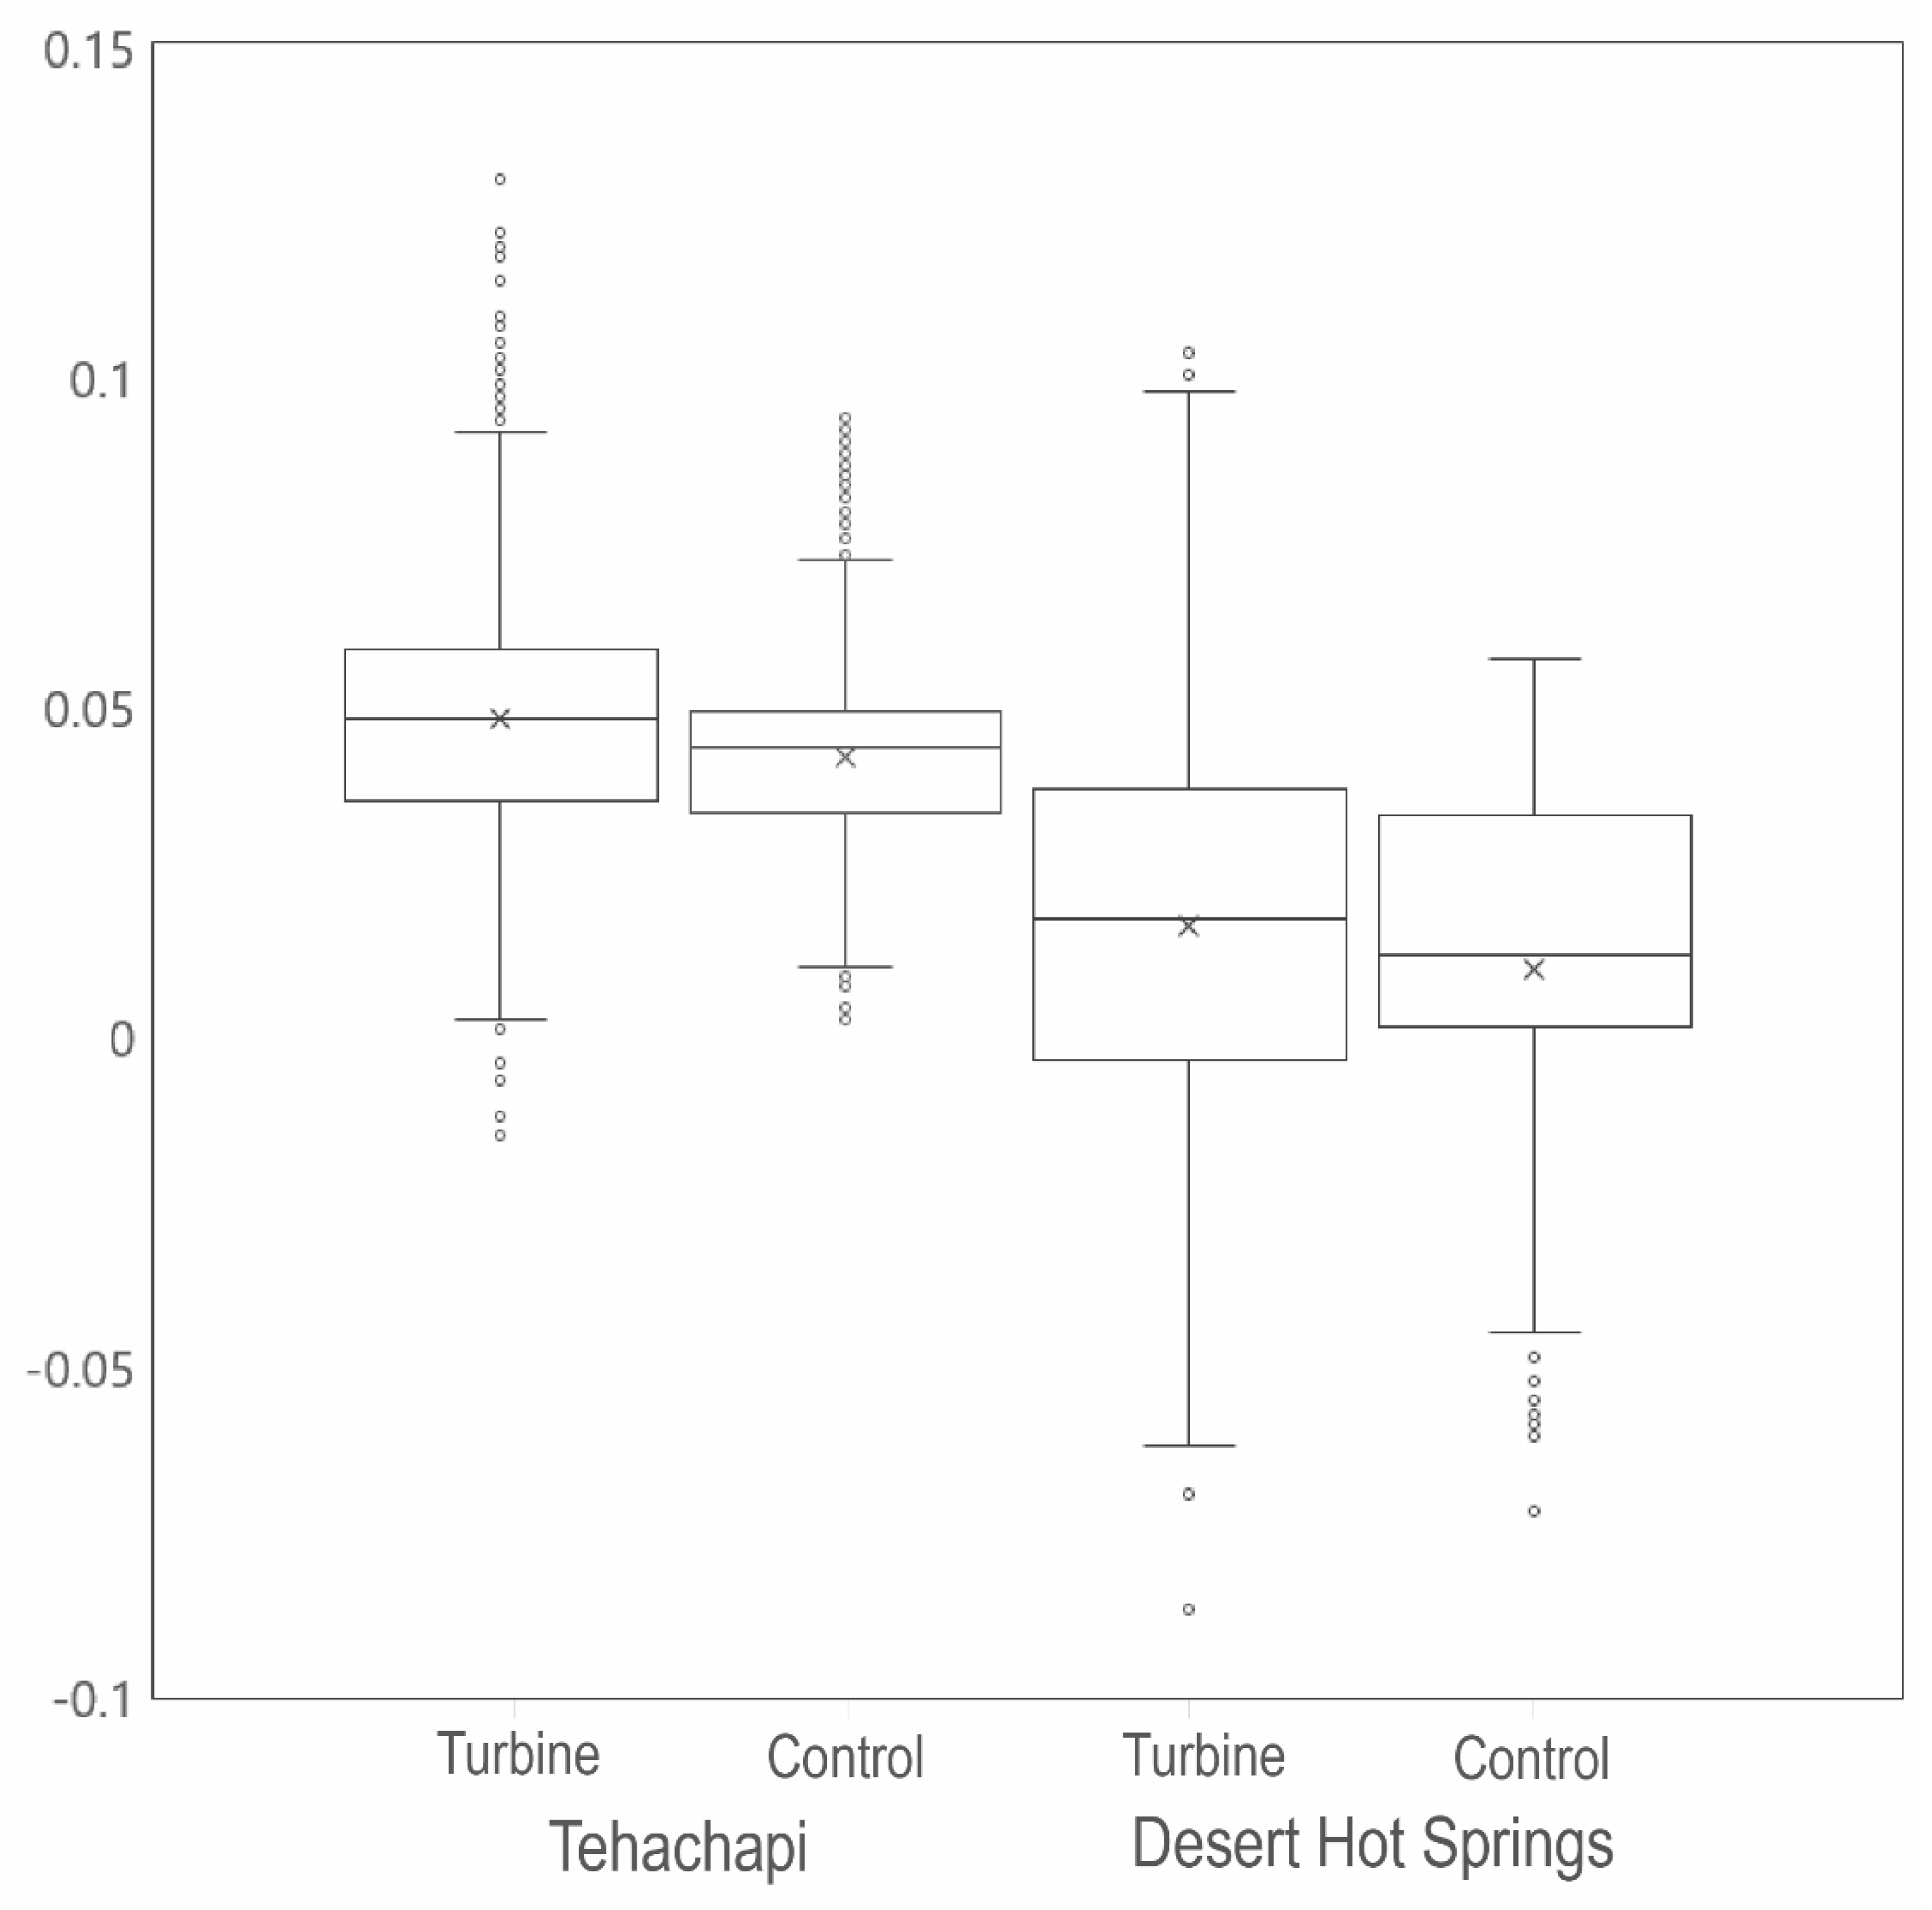
3.2. ESI Changes Relative to Control Areas
Analysis of ESI values at turbines relative to nearby control areas show that turbine sites generally had a greater increase in ESI values after development when compared to controls (Table 1, Figure 5) and these differences were statistically significant for both sites (p < 0.001 at 0.05 CI). The data also indicate that invasive annuals also became more widespread at the control areas during the periods analyzed for their corresponding turbines (Table 1). Just as for the areas immediately surrounding the turbines, patterns varied between the northern and southern parts of the study area. In general, both the turbine sites and control sites had considerably higher ESI at Tehachapi compared to the Desert Hot Springs (Figure 5). 100% of the Tehachapi control sites showed an ESI increase during the period (averaged increase of 36%), while 76% of the Desert Hot Springs controls showed a smaller ESI increase (average increase of 9%). The number of turbine control areas with “very high” (>0.20) ESI values at Tehachapi increased from 1 to 98 during the period, and the number of controls that started with no invasives (ESI < 0.10) decreased from 189 to 45 during the same period. The number of control areas in Desert Hot Springs with “very high” (>0.20) ESI values increased from just 2 to 4 after installation, and the number of control areas with no invasives (ESI < 0.10) changed from 161 to 160.
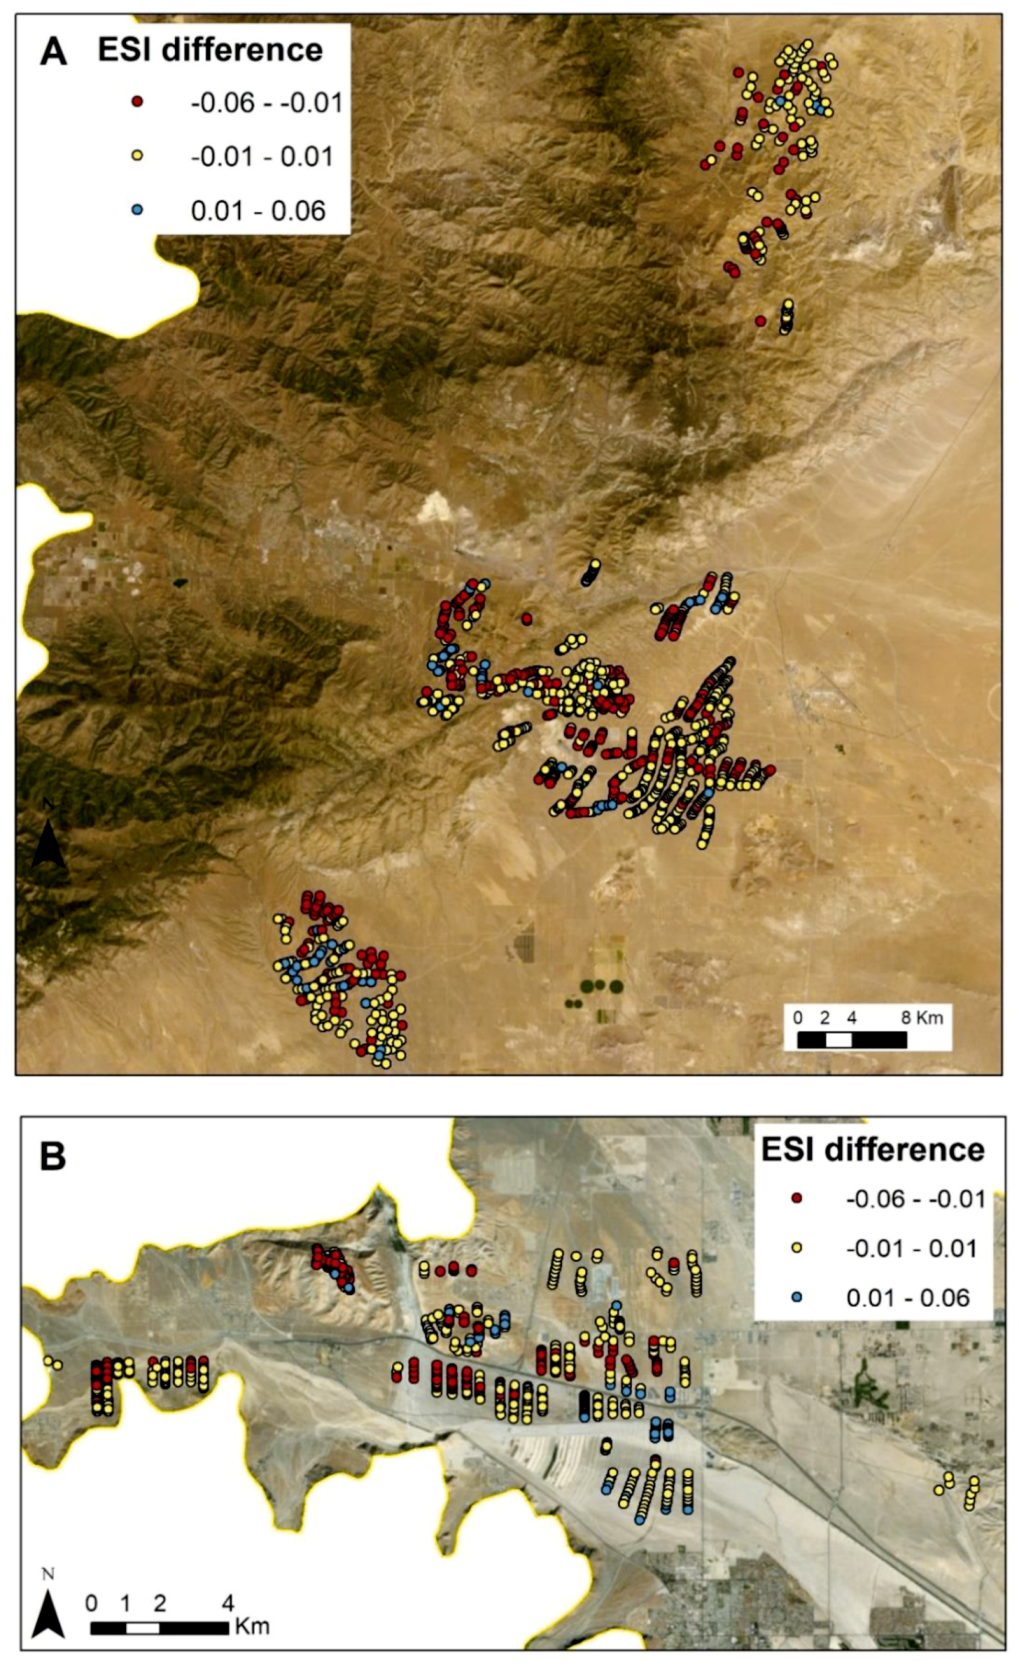
A comparison of ESI values before and after the construction date (post-installation minus pre-installation) at the turbine sites and neighboring control areas indicates that 70% (1223) of the turbine sites had greater ESI increase than the control areas. This pattern is similar across both Tehachapi and Desert Hot Spring study areas, with 727 (69%) and 496 (70%) turbines showing greater ESI increase than the control areas. When mapped out, the ESI difference between the turbines and their control highlights the locations where turbine-related invasions were higher than changes in the surrounding landscape (Figure 6). The change data, which are classified into groups above and below a no-change threshold of −0.01 to 0.01, show that only one third of the turbines (592) had considerably higher (<−0.01) ESI changes than the surrounding controls. These turbine-related invasions show a more clustered pattern in the Desert Hot Springs area when compared to Tehachapi (Figure 6). The magnitude of the difference between turbine and control is important, and the turbines that had highest increase compared to control sites are generally the same turbines that were identified with very high and high ESI values in the period after installation (Figure 4).
3.3. Regional Analysis of ESI and Relationship to Precipitation
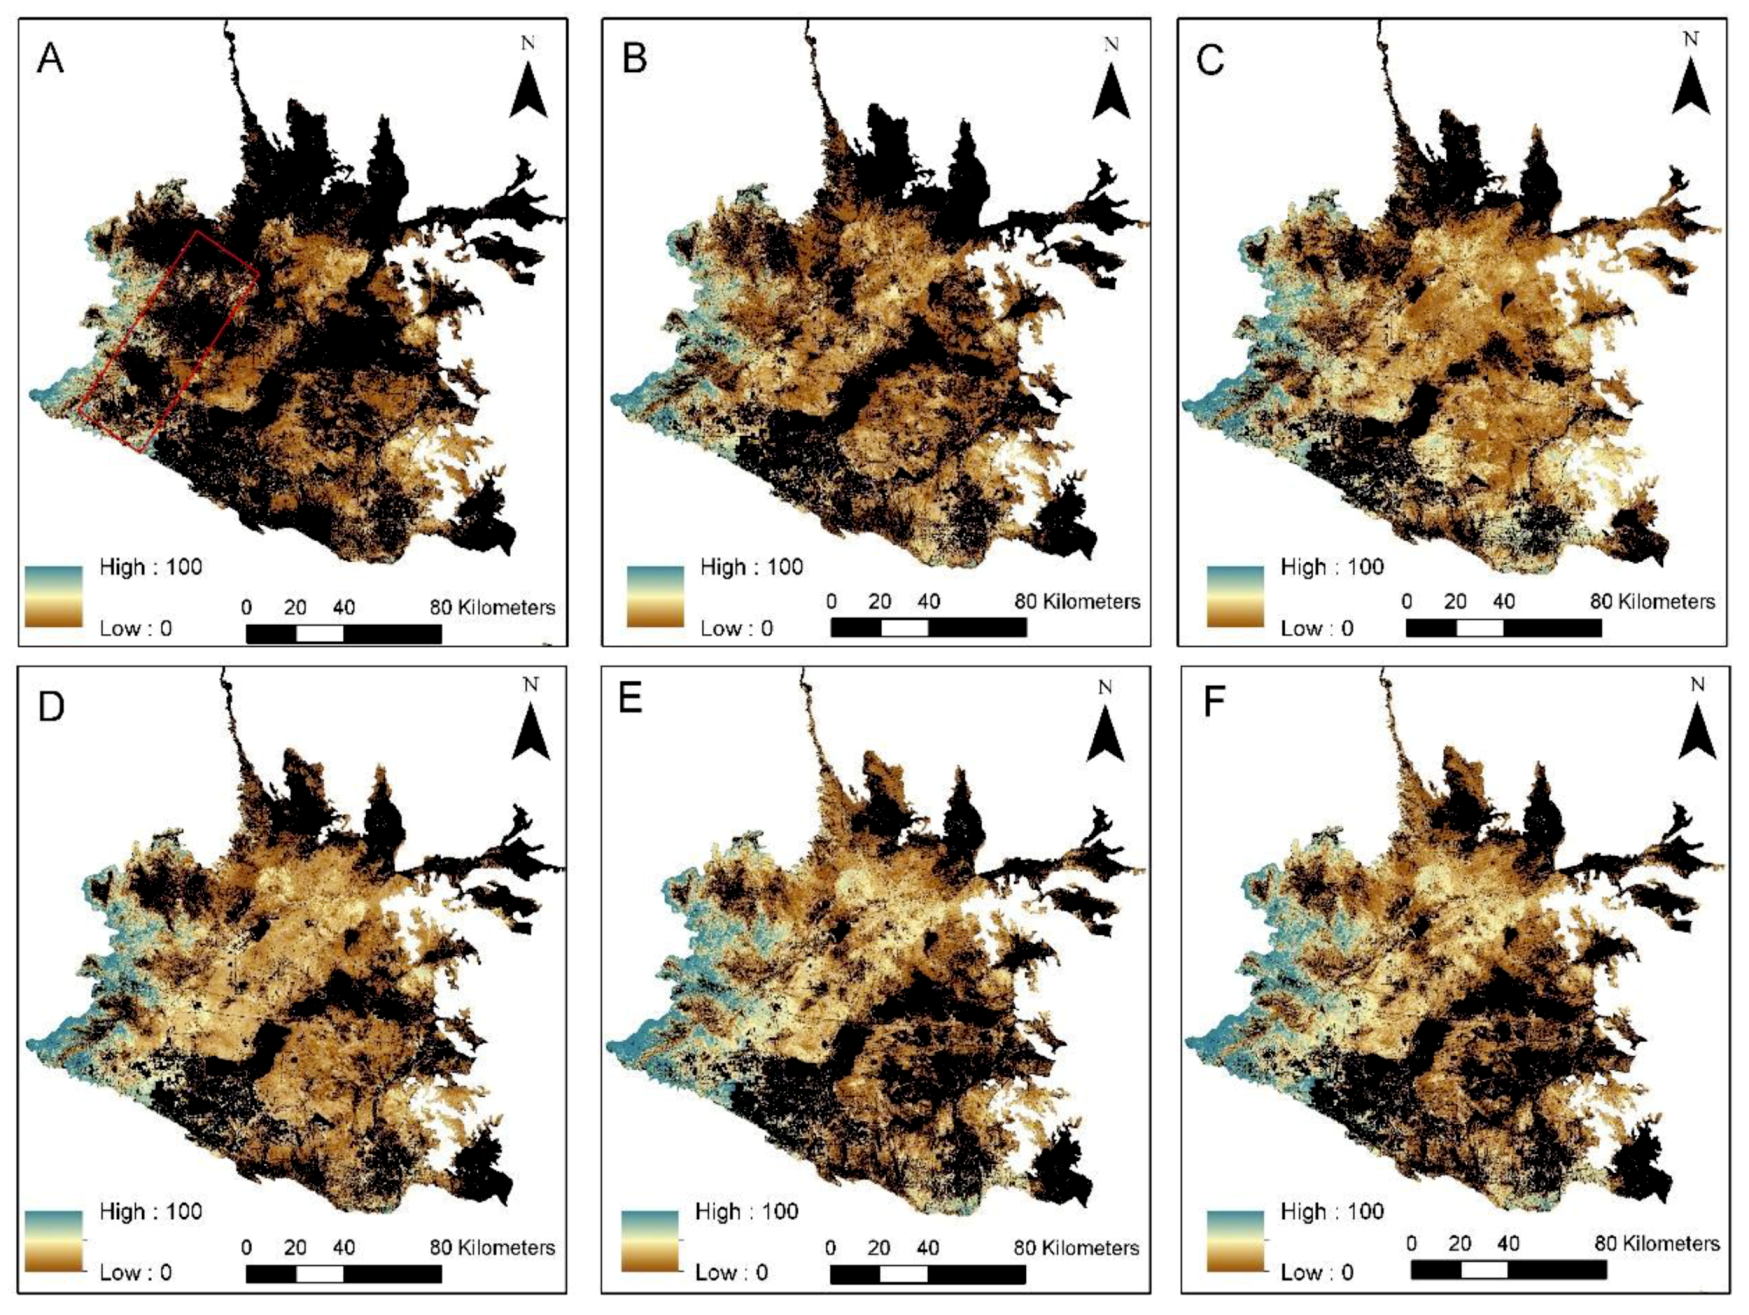
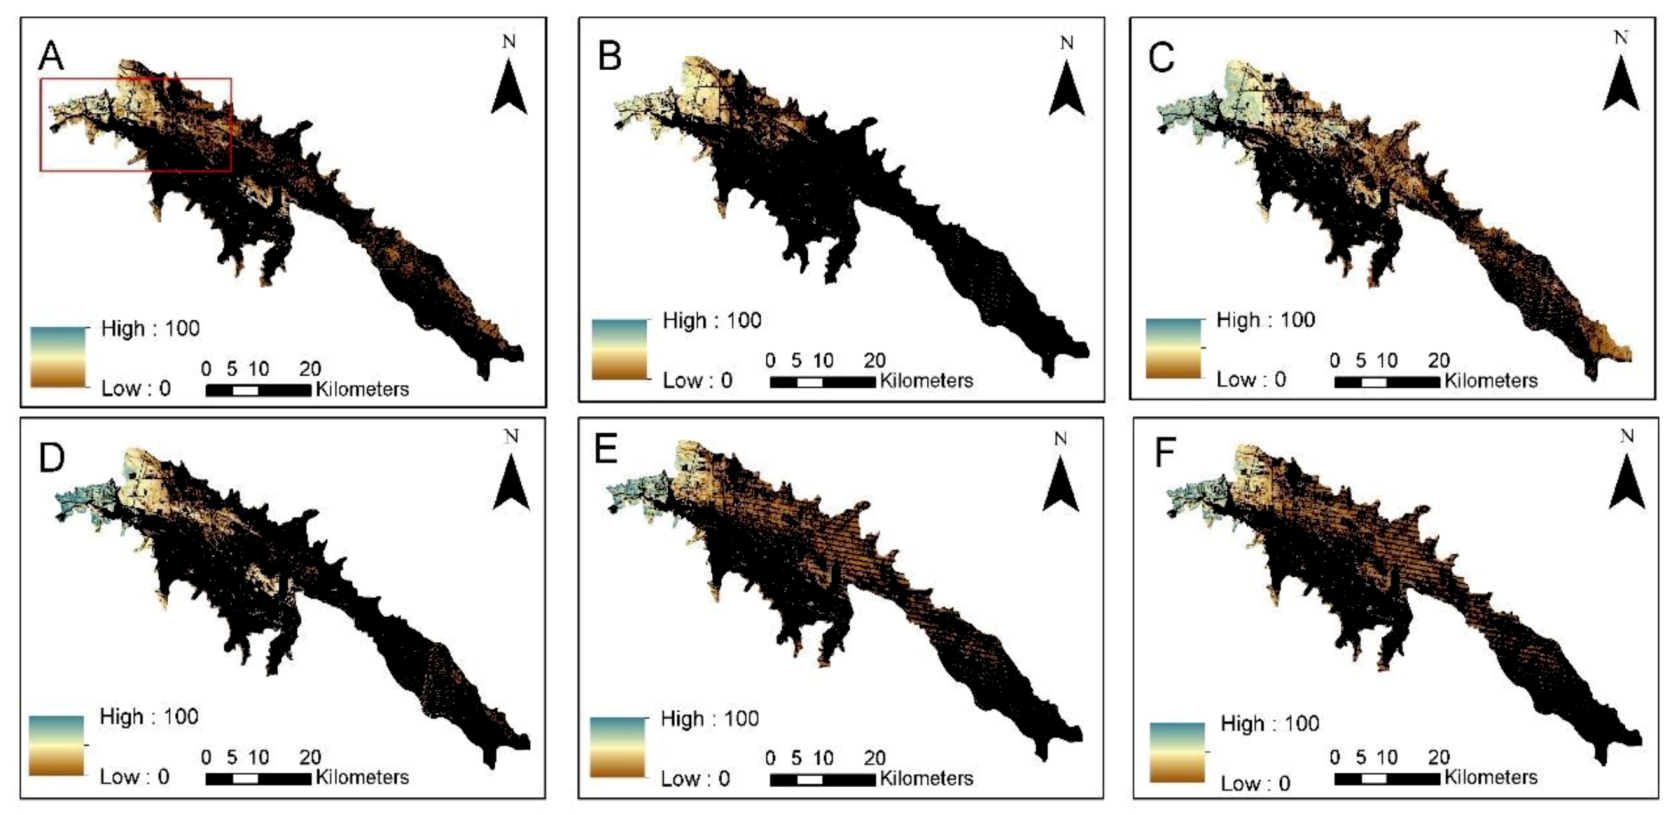
Regionally, areas with consistently high ESI tended to be on the northwestern edge of the Western Mojave Basin ecoregion, and northwestern edge of the Upper Coachella Valley and Hills ecoregion (Figure 7 and Figure 8), both areas that could be considered transition zones for these ecoregions. In the Western Mojave Basin ecoregion, there appears to be a relatively low signal in the areas around the wind developments during the first period from 1989–1993 (Figure 7a), but with a considerable increase that spreads eastward beginning in the 1994–1998 period (Figure 7b). The wind energy areas have consistently high ESI for the remainder of the study period (Figure 7). In the Upper Coachella Valley and Hills ecoregion the wind energy areas have high ESI in the early period (1989–1993, Figure 8a), but the high values become much more extensive after 1998 (Figure 8c).
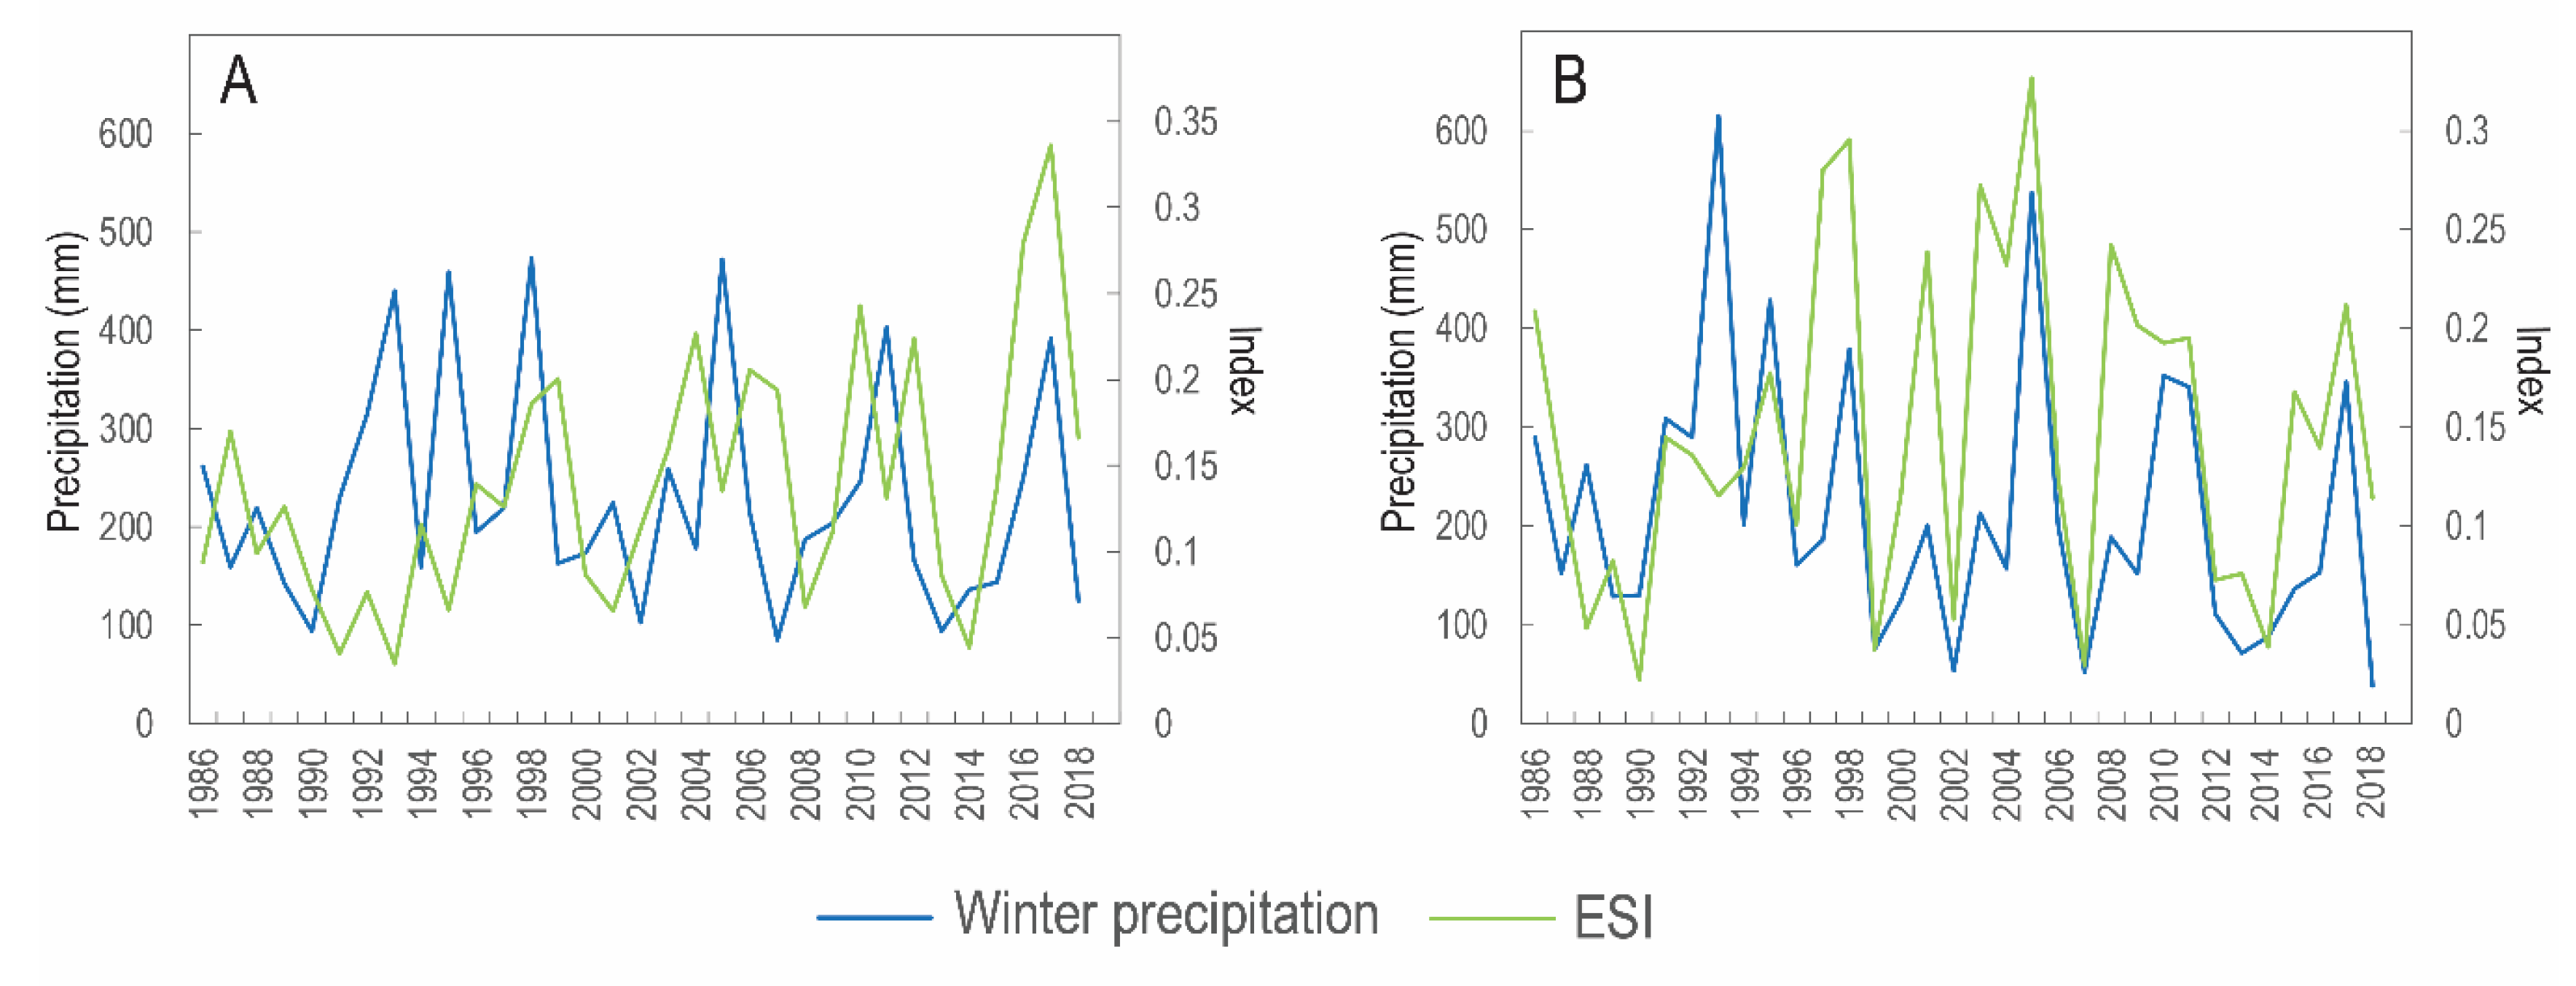
Analysis of ESI values relative to yearly winter precipitation (Oct–April) measured from the turbine sites show that much of the peak ESI occurs during years with high winter precipitation (Figure 9). The linear relationship between winter precipitation and ESI over the entire period (1986–2018) is much stronger at the Desert Hot Springs study area (R2 = 0.26) than Tehachapi (R2 = 0.002), where no obvious relationships exist early in the study period (Figure 9). The relationship between precipitation and ESI gets stronger throughout the study period, and during the period from 1998–2018, the two are highly correlated in Desert Hot Springs (R2 = 0.63), whereas the correlation is strongest for Tehachapi during the last decade of the study (2009–2018; R2 = 0.30). At both sites ESI showed an increasing trend over the period, even while winter precipitation declined slightly.
4. Discussion
The development and use of renewable energy sources is growing globally as economies transition from fossilized carbon to environmentally friendly sustainable energy sources [46], and while green energy holds great promise to reduce global change impacts of fossil fuels, the environmental impacts of these sites need to be carefully considered and managed [47,48]. The growing demand for energy has led to a surge in development in the western U.S., and the clearing of native vegetation for access roads and pads present new opportunities for invasives to take hold and spread. Exotic species present major management challenges in areas where energy developments create new openings for invasion [32,49], and invasions can persist long after the sites have been abandoned. Field studies in southern California have shown that exotic species are more abundant near disturbed energy developments, both at conventional oil and gas fields [50] and wind energy developments [51]. Remote sensing data facilitate landscape-scale detection and monitoring of energy exploration and development (EED) related invasions, providing timely and actionable information to support management decisions by energy industry and government natural resource specialists. Landsat time-series data collected over abandoned oil and gas pads in the Colorado Plateau for example, showed evidence that invasives were a major component of vegetation on reclaimed sites [19], and provided information that can be used to improve reclamation efforts. The application of remote sensing for invasive management is not limited to reclamation; in the Mojave and Colorado deserts, maps of invasive grasses in landscapes surrounding energy development can be used to identify potential fire risk for human settlements and wildlife habitat during a time when electric utilities and energy infrastructure are an increasingly common source of wildfire ignitions.
The development of a 34-year time series invasive index in this study allowed us to assess the difference before and after EED and understand these changes in the context of region-wide changes in invasive cover. Comparing ESI index changes between turbine sites and control sites bears out two key findings. First, the increase in ESI relative to pre-development conditions at turbines is notably higher than the control sites for many turbines. These differences hold when stratifying samples by geography (north and south) or by turbine installation date. Second, although many turbines had higher ESI after turbines were installed, these results do not apply to all turbines sites. Comparing the invasive (ESI) trend geographically by analyzing the difference between turbine and control values at the site level showed that there were some places around the energy development where the change in invasive cover at the control exceeded that of the adjacent turbines, although the differences in values are quite small. These clusters with an inverse pattern, as well as the many sites with very little difference between turbine and control, suggest that there are other factors at play across the study area, in addition to or separate from EED, that contribute to the spread of invasive annuals in the region. Overall it is difficult to conclude that the turbines and the energy infrastructure contributed to the presence of invasives, or if the entire area experienced an overall increase in invasives during the period which contributed to a signal of slightly more invasives in the disturbed areas around the turbines.
Our results showed an increase in ESI in the wind energy sites as well as a considerable regional increase. The maps representing regional patterns of ESI over the study period (1985–2018) provide insight into the scale of invasion in southern California and help to explain why both turbine and control areas showed increasing invasives cover over time. The Tehachapi and Desert Hot Springs wind development sites both are situated in areas of the region that showed sustained high cover of invasives, but the extent to which the disturbance caused by wind energy development contributed to an increase in invasives across the larger landscape remains unknown because various other factors (i.e., past land use, climate, soils) could have set the stage for establishment and spread in these areas. B. tectorum and b. rubens have been present in the study regions since at least the early/mid-1900s [52] and periods of heavy winter rainfall in the 1960s and 1980s likely encouraged regional spread [53,54]. Both study regions have also experienced heavy land uses (grazing, off-highway vehicle use, urban development) in addition to energy development that may have contributed to the regional spread of exotics. However, exotic grass cover has been shown to be correlated with wind disturbance [55], and the simple fact that wind farms are sited in areas with strong, consistent winds is likely a major factor in the local seed dispersal in these areas, and thus the observed increase in the invasives index around wind development sites.
Our analysis of precipitation trends over the study period illustrate that winter precipitation is tightly coupled with annual ESI, especially in recent years. While the relationship between ESI and precipitation is strong during wet years, the overall trends of declining precipitation and increasing ESI suggest that a regional drying may be making the landscape more susceptible to invasives, who quickly exploit available winter precipitation during years of abundant rains. Other studies in the southwest have shown that dryland plants respond more strongly to short-term water availability within periods of sustained aridity [56]. Additional research is needed to investigate the observed regional trends and spatial patterns of ESI that includes additional climate variables (i.e., minimum and maximum temperature), possible climate lag effects, and local-scale disturbances (i.e., nitrogen deposition, grazing history and wind disturbance).
The regional increase in annual exotic species is a concern for fire management in areas with growing human populations, as well as for more remote areas that support endangered or rare desert species [57,58]. Changes in the frequency and size of wildfires in the Mojave Desert are linked to the expansion of brome grasses [59]. Years with high invasive cover near wind turbines is a concern from a fire risk standpoint since turbines are a known source for fire ignition [17,60]. In the summer of 2012, for example, there were two separate instances of turbines igniting and causing grass fires, one in the Tehachapi site and one in the Desert Hot Springs site [61]. While both fires were quickly contained, given increasing herbaceous fuels over time and the continued urban development in California, the mixture of wind turbines and high Bromus spp. cover present a serious hazard putting life and property at risk. Power lines are a main source of ignitions in California [62], and two of the recent deadly fires in California, the 2018 Camp Fire and 2017 Tubbs Fire, were both ignited by sparks from electrical transmission lines in areas that had not been adequately cleared of such fuels. Remote sensing maps of invasives cover and patterns, like those generated for this study, can provide useful geospatial data layers to help fire managers identify areas of high fire hazard potential for fuels reductions, and where these areas overlap with energy infrastructure that may contribute to ignitions. Time series satellite data can also play an important role in monitoring vegetation changes and managing invasive species after fires [63,64].
Protocols are usually put in place prior to energy development to ensure that the project site is properly maintained. These include clearing dry vegetation, limiting potential fuel sources, and designing firebreaks. In addition, the operators are expected to develop species-specific control procedures for high priority invasive weeds [65]. While it is likely that the operators enact these weed control protocols at the pad-level at the two sites, our research shows that the invasives can have an impact at a distance away from the turbine pad and the surrounding disturbed areas. With areas greater than 100 m from the turbine showing a very high likelihood of non-native grasses, weed control efforts at the pad-level may not be effective at preserving the integrity of ecosystems in the surrounding areas.
Our use of ESI shows clear value in mapping annual invasives and identifying differences by creating an annual invasive time series. These seasonal approaches can be used to identify other annuals and exotics that have less of a predictable phenological signal but respond to individual precipitation events or summer precipitation. One example, Brassica tournefortii, categorized as a “Most Invasive Wildland Pest Plants” in California, is an annual invasive that grows around disturbed areas (roads) and ephemeral waterways and responds opportunistically to winter rains [66] in both the Mojave and Sonoran deserts. With some high-resolution information on winter precipitation patterns across these dryland regions, a relative greenness index could be implemented shortly after the rains to identify areas with B. tournefortii that may show uncharacteristic high seasonally differenced NDVI. Studies that leverage precipitation-driven phenology for invasives include Waller et al. (2018) who developed a summer annuals index in the Colorado Plateau to map Salsola spp., which greens up (and quickly senesces) in response to summer precipitation and Wallace et al.(2016) who developed an index that coupled NDVI and precipitation data to map presence of invasive buffelgrass (Pennisetum ciliare) in the Sonoran Desert [67].
5. Conclusions
This application of remote sensing imagery for exotic species detection exploits the relative difference between spring green up and summer senescence annually across the Landsat archive, which provides yearly insights into the amount and distribution of annual grasses on the landscape, and their patterns before and after installation of wind turbines. A higher ESI value suggests that invasive annual plant species are greening-up more in spring, as compared to a more typical pattern in native grasses and forbs with a less vigorous green-up.
We do not have direct evidence that the disturbance from wind turbine installation caused increased invasive species cover relative to the surrounding areas. We found an increase in our ESI index across large areas, and much of the highly invaded areas were around the energy development sites. Our data show that invasive annuals increased after turbine installation at most sites in one of our two study areas, but there is no clear indication that the rate of invasion around the wind energy sites is considerably different than the rest of the adjacent study area (i.e., control areas). More research is needed to establish the causes of increases in our invasives index across many areas of the California deserts, especially in the Tehachapi region. Wind energy development may be one factor among many contributing to the degradation of the desert environment and subsequent invasion by invasive plants. The data we used for this paper see Supplementary Materials.
Supplementary Materials
A GIS shapefile of the data used for this research, that includes turbine IDs, as well as early season invasive (ESI) values for turbines and corresponding control sites summarized before and after the turbine installation date can be found on ScienceBase (https://doi.org/10.5066/P9LSUJWH).
Author Contributions
Conceptualization M.L.V. and C.E.S.; Methodology, M.L.V., C.E.S. and E.K.W.; formal analysis, M.L.V. and C.E.S.; writing—original draft preparation, M.L.V., C.E.S. and E.K.W.; writing—review and editing, M.L.V., C.E.S. and E.K.W.; visualization, M.L.V.
Funding
Funding for this work was provided by the U.S. Geological Survey Priority Ecosystems Sciences Program of the Ecosystems Mission Area, and the U.S. Geological Survey Climate Research and Development and Land Change Science Programs of the Land Resources Mission Area.
Acknowledgments
We thank the USGS Southwest Energy Development and Drought (SWEDD) project team for their feedback and support. We would like to thank Cindy Wallace of the USGS and three anonymous reviewers for their constructive reviews of the manuscript.
Conflicts of Interest
The authors declare no conflict of interest.
Appendix A
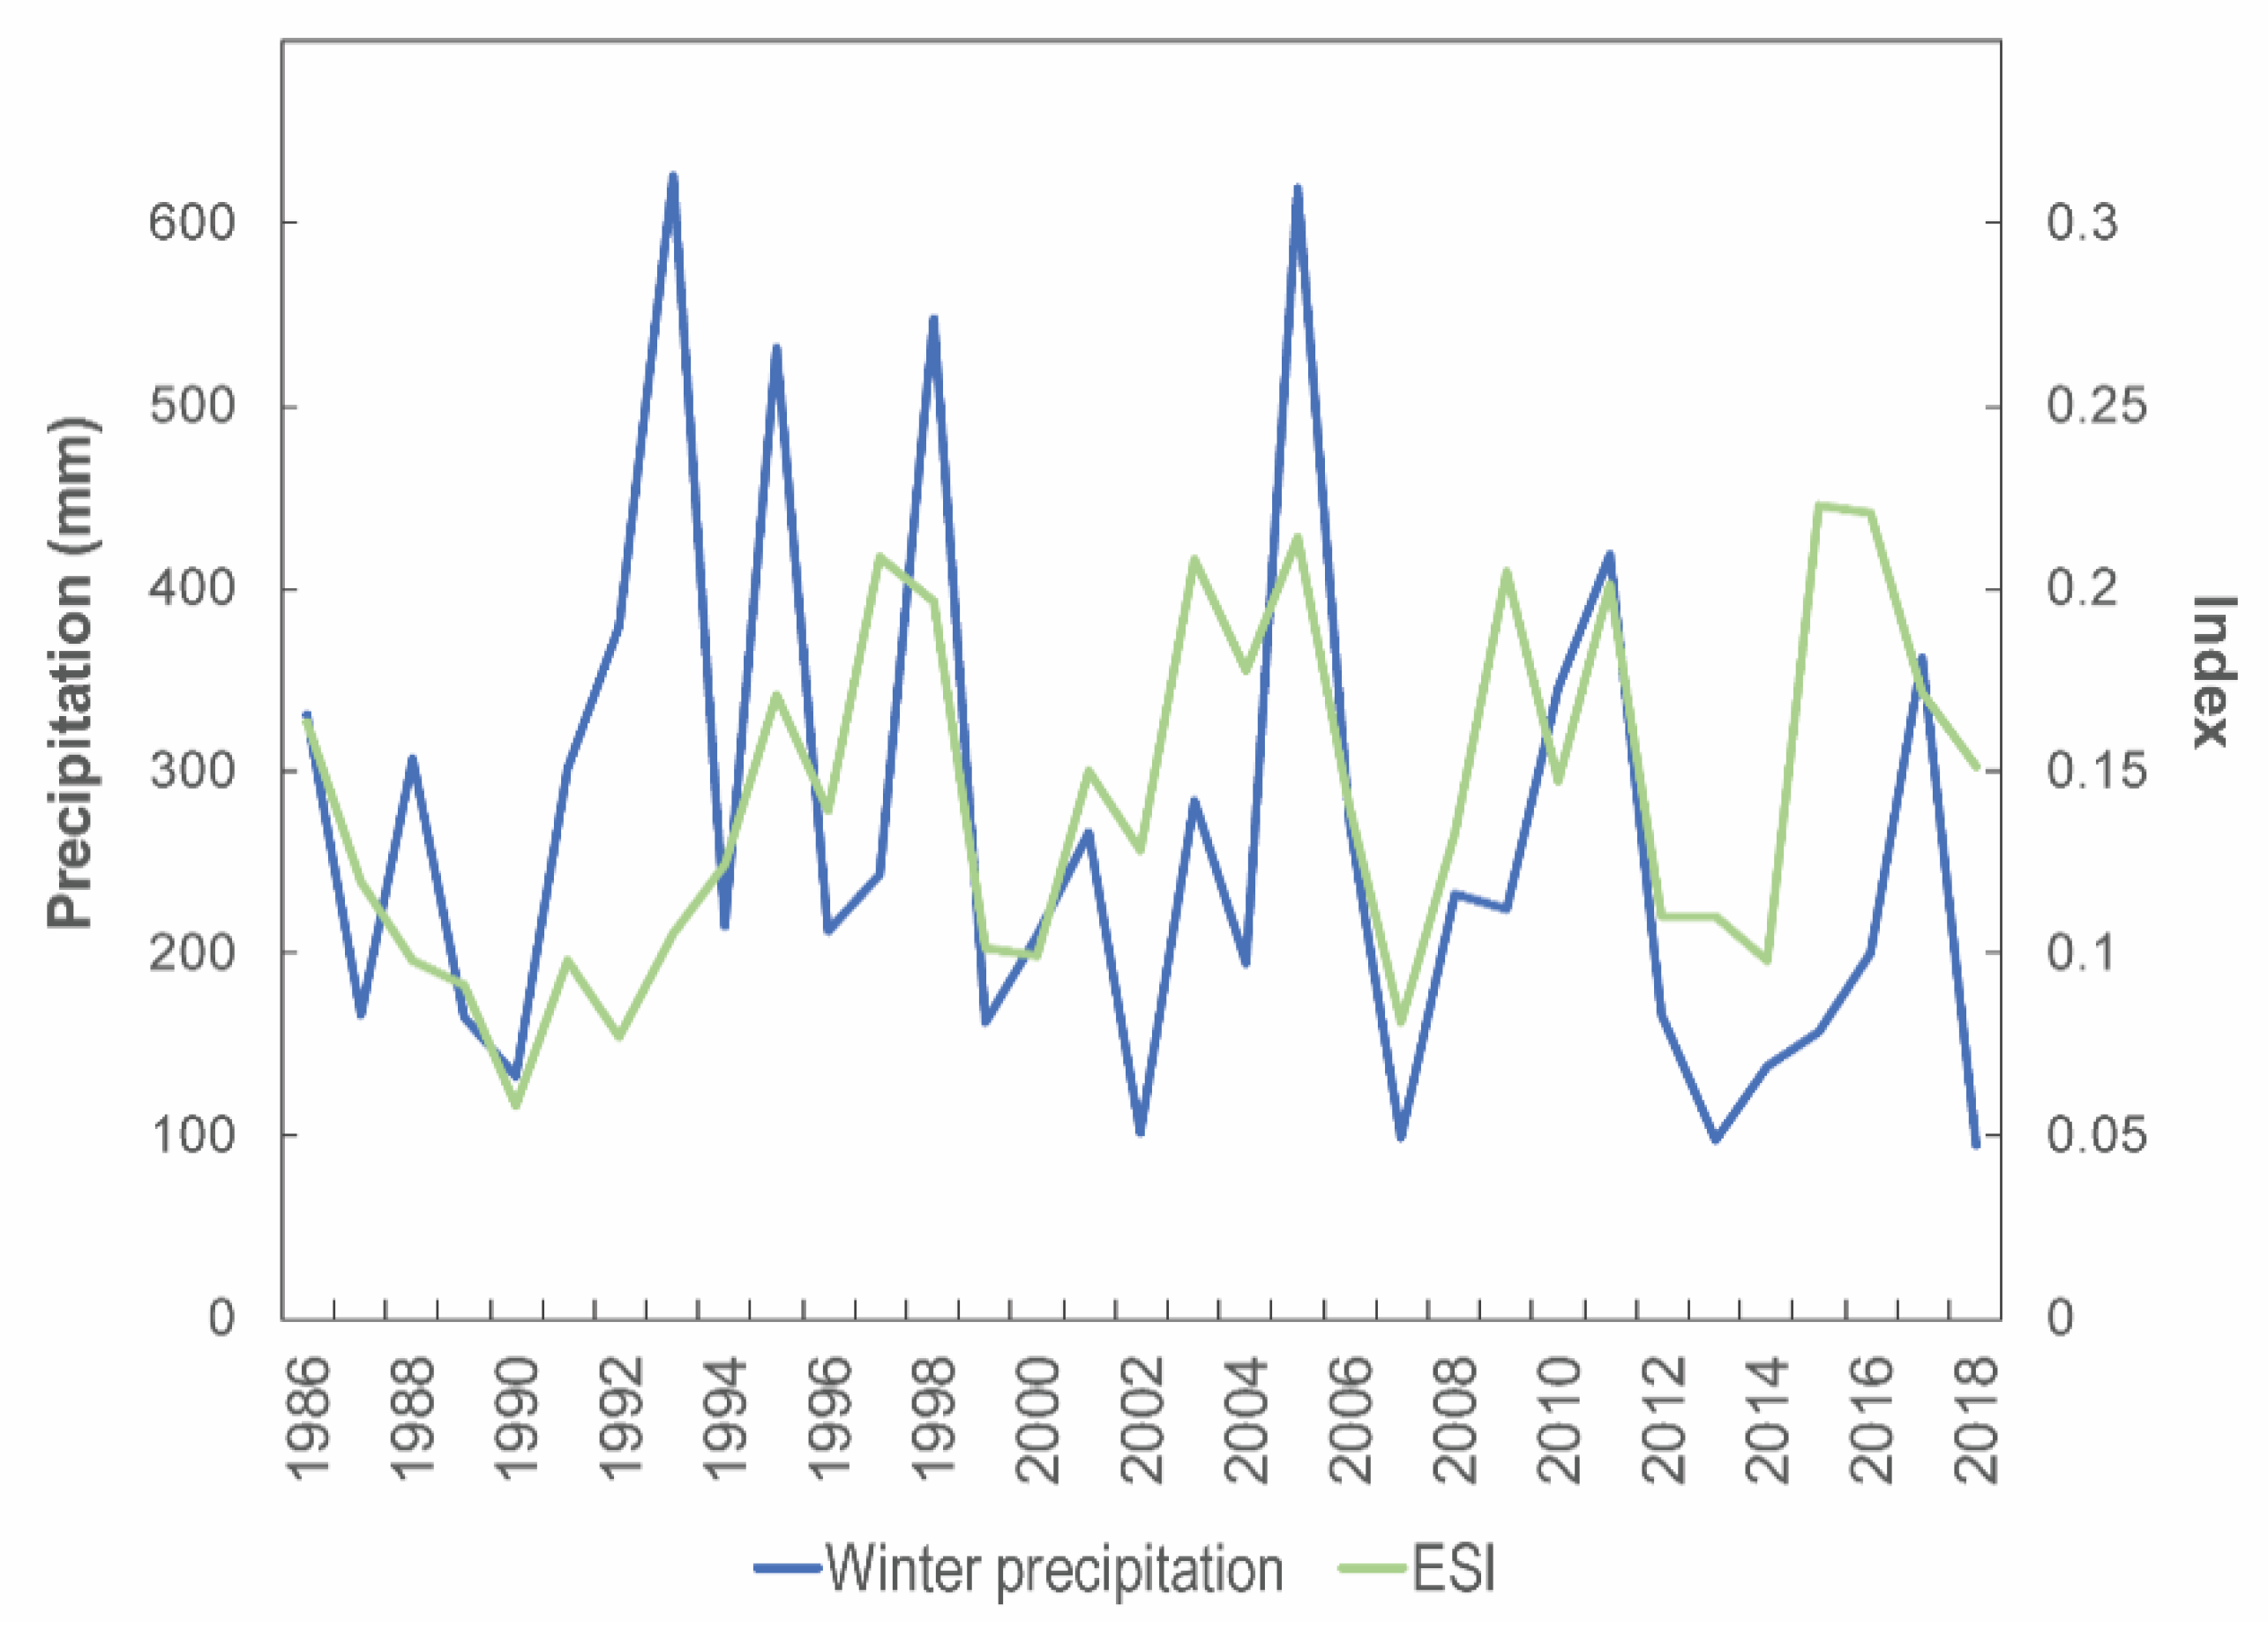
Time series of yearly winter precipitation (Oct–April) and ESI values averaged for B. rubens and B. tectorum field sample locations.
Figure A1.
Time series of yearly winter precipitation (Oct–April) and ESI index values averaged for Bromus rubens (B. rubens) and Bromus tectorum (B. tectorum) sample locations.
Figure A1.
Time series of yearly winter precipitation (Oct–April) and ESI index values averaged for Bromus rubens (B. rubens) and Bromus tectorum (B. tectorum) sample locations.

References
- Vitousek, P.M.; D’Antonio, C.M.; Loope, L.L.; Rejmanek, M.; Westbrooks, R.G. Introduced species: A significant component of human-caused global change. N. Z. J. Ecol. 1997, 21, 116. [Google Scholar]
- Seebens, H.; Blackburn, T.M.; Dyer, E.E.; Genovesi, P.; Hulme, P.E.; Jeschke, J.M.; Pagad, S.; Pyšek, P.; Winter, M.; Arianoutsou, M.; et al. No saturation in the accumulation of alien species worldwide. Nat. Commun. 2017, 8, 14435. [Google Scholar] [CrossRef] [PubMed]
- Pimentel, D.; Zuniga, R.; Morrison, D. Update on the environmental and economic costs associated with alien-invasive species in the United States. Ecol. Econ. 2005, 52, 273–288. [Google Scholar] [CrossRef]
- Brooks, M.L.; D’Antonio, C.M.; Richardson, D.M.; Grace, J.B.; Keeley, J.E.; DiTomaso, J.M.; Hobbs, R.J.; Pellant, M.; Pyke, D. Effects of Invasive Alien Plants on Fire Regimes. BioScience 2004, 54, 677–688. [Google Scholar] [CrossRef] [Green Version]
- Belnap, J.Y.E.; Ludwig, J.A.; Wilcox, B.P.; Betancourt, J.L.; Dean, W.R.J.; Hoffmann, B.D.; Milton, S.J. Introduced and Invasive Species in Novel Rangeland Ecosystems: Friends or Foes? Rangel. Ecol. Manag. 2012, 65, 569–578. [Google Scholar] [CrossRef] [Green Version]
- Christen, D.C.; Matlack, G.R. The habitat and conduit functions of roads in the spread of three invasive plant species. Biol. Invasions 2009, 11, 453–465. [Google Scholar] [CrossRef]
- Gelbard, J.L.; Belnap, J. Roads as Conduits for Exotic Plant Invasions in a Semiarid Landscape. Conserv. Biol. 2003, 17, 420–432. [Google Scholar] [CrossRef]
- Webb, R.H.; Wilshire, H.G. Recovery of soils and vegetation in a Mojave desert ghost town, Nevada, U.S.A. J. Arid. Environ. 1980, 3, 291–303. [Google Scholar] [CrossRef]
- Duniway, M.C.; Herrick, J.E.; Pyke, D.A.; David, T.P. Assessing Transportation Infrastructure Impacts on Rangelands: Test of a Standard Rangeland Assessment Protocol. Rangel. Ecol. Manag. 2010, 63, 524–536. [Google Scholar] [CrossRef]
- Villarreal, M.L.; Webb, R.H.; Norman, L.M.; Psillas, J.L.; Rosenberg, A.S.; Carmichael, S.; Petrakis, R.E.; Sparks, P.E. Modeling Landscape-scale Erosion Potential Related to Vehicle Disturbances Along the USA–Mexico Border. Land Degrad. Dev. 2016, 27, 1106–1121. [Google Scholar] [CrossRef]
- McDonald, R.I.; Fargione, J.; Kiesecker, J.; Miller, W.M.; Powell, J. Energy Sprawl or Energy Efficiency: Climate Policy Impacts on Natural Habitat for the United States of America. PLoS ONE 2009, 4, e6802. [Google Scholar] [CrossRef] [PubMed]
- Copeland, H.E.; Doherty, K.E.; Naugle, D.E.; Pocewicz, A.; Kiesecker, J.M. Mapping Oil and Gas Development Potential in the US Intermountain West and Estimating Impacts to Species. PLoS ONE 2009, 4, e7400. [Google Scholar] [CrossRef] [PubMed]
- Allred, B.W.; Smith, W.K.; Twidwell, D.; Haggerty, J.H.; Running, S.W.; Naugle, D.E.; Fuhlendorf, S.D. Ecosystem services lost to oil and gas in North America. Science 2015, 348, 401–402. [Google Scholar] [CrossRef] [PubMed] [Green Version]
- Hernandez, R.R.; Hoffacker, M.K.; Murphy-Mariscal, M.L.; Wu, G.C.; Allen, M.F. Solar energy development impacts on land cover change and protected areas. Proc. Natl. Acad. Sci. USA 2015, 112, 13579–13584. [Google Scholar] [CrossRef] [PubMed] [Green Version]
- Brooks, M.L.; Berry, K.H. Dominance and environmental correlates of alien annual plants in the Mojave Desert, USA. J. Arid. Environ. 2006, 67, 100–124. [Google Scholar] [CrossRef]
- Klinger, R.; Brooks, M. Alternative pathways to landscape transformation: Invasive grasses, burn severity and fire frequency in arid ecosystems. J. Ecol. 2017, 105, 1521–1533. [Google Scholar] [CrossRef]
- Sun, W.; Lin, W.-C.; You, F.; Shu, C.-M.; Qin, S.-H. Prevention of green energy loss: Estimation of fire hazard potential in wind turbines. Renew. Energy 2019, 140, 62–69. [Google Scholar] [CrossRef]
- Nauman, T.W.; Duniway, M.C.; Villarreal, M.L.; Poitras, T.B. Disturbance automated reference toolset (DART): Assessing patterns in ecological recovery from energy development on the Colorado Plateau. Sci. Total Environ. 2017, 584–585, 476–488. [Google Scholar] [CrossRef]
- Waller, E.K.; Villarreal, M.L.; Poitras, T.B.; Nauman, T.W.; Duniway, M.C. Landsat time series analysis of fractional plant cover changes on abandoned energy development sites. Int. J. Appl. Earth Obs. Geoinf. 2018, 73, 407–419. [Google Scholar] [CrossRef]
- Martinez, C.; Preston, T.M. Oil and gas development footprint in the Piceance Basin, western Colorado. Sci. Total Environ. 2018, 616–617, 355–362. [Google Scholar] [CrossRef]
- Wolaver, B.D.; Pierre, J.P.; Labay, B.J.; LaDuc, T.J.; Duran, C.M.; Ryberg, W.A.; Hibbitts, T.J. An approach for evaluating changes in land-use from energy sprawl and other anthropogenic activities with implications for biotic resource management. Environ. Earth Sci. 2018, 77, 171. [Google Scholar] [CrossRef]
- Norman, L.; Villarreal, M.; Pulliam, H.R.; Minckley, R.; Gass, L.; Tolle, C.; Coe, M. Remote sensing analysis of riparian vegetation response to desert marsh restoration in the Mexican Highlands. Ecol. Eng. 2014, 70, 241–254. [Google Scholar] [CrossRef] [Green Version]
- Storey, E.A.; Stow, D.A.; O’Leary, J.F. Assessing postfire recovery of chamise chaparral using multi-temporal spectral vegetation index trajectories derived from Landsat imagery. Remote Sens. Environ. 2016, 183, 53–64. [Google Scholar] [CrossRef] [Green Version]
- Chowdhury, S.; Chao, D.K.; Shipman, T.C.; Wulder, M.A. Utilization of Landsat data to quantify land-use and land-cover changes related to oil and gas activities in West-Central Alberta from 2005 to 2013. GIScience Remote Sens. 2017, 54, 700–720. [Google Scholar] [CrossRef]
- Bradley, B.A. Remote detection of invasive plants: A review of spectral, textural and phenological approaches. Biol. Invasions 2014, 16, 1411–1425. [Google Scholar] [CrossRef]
- He, K.S.; Rocchini, D.; Neteler, M.; Nagendra, H. Benefits of hyperspectral remote sensing for tracking plant invasions. Divers. Distrib. 2011, 17, 381–392. [Google Scholar] [CrossRef]
- Wallace, C.; Thomas, K. An annual plant growth proxy in the Mojave Desert using MODIS-EVI data. Sensors 2008, 8, 7792–7808. [Google Scholar] [CrossRef]
- Gorelick, N.; Hancher, M.; Dixon, M.; Ilyushchenko, S.; Thau, D.; Moore, R. Google Earth Engine: Planetary-scale geospatial analysis for everyone. Remote Sens. Environ. 2017, 202, 18–27. [Google Scholar] [CrossRef]
- Soulard, C.E.; Albano, C.M.; Villarreal, M.L.; Walker, J.J. Continuous 1985–2012 Landsat Monitoring to Assess Fire Effects on Meadows in Yosemite National Park, California. Remote Sens. 2016, 8, 371. [Google Scholar] [CrossRef]
- Diao, C.; Wang, L. Incorporating plant phenological trajectory in exotic saltcedar detection with monthly time series of Landsat imagery. Remote Sens. Environ. 2016, 182, 60–71. [Google Scholar] [CrossRef]
- Ouyang, Z.-T.; Gao, Y.; Xie, X.; Guo, H.-Q.; Zhang, T.-T.; Zhao, B. Spectral Discrimination of the Invasive Plant Spartina alterniflora at Multiple Phenological Stages in a Saltmarsh Wetland. PLoS ONE 2013, 8, e67315. [Google Scholar] [CrossRef] [PubMed]
- Reid, C.R.; Goodrich, S.; Bowns, J.E. Cheatgrass and red brome; the history and biology of two invaders. In Kitchen, Stanley G.; Pendleton, Rosemary L.; Monaco, Thomas A.; Vernon, Jason, comps. 2008. Proceedings-Shrublands Under Fire: Disturbance and Recovery in a Changing World; 2006 June 6–8; Cedar City, UT. Proc. RMRS-P-52; US Department of Agriculture, Forest Service, Rocky Mountain Research Station: Fort Collins, CO, USA, 2008; Volume 52, pp. 27–32. [Google Scholar]
- Chambers, J.C.; Bradley, B.A.; Brown, C.S.; D’Antonio, C.; Germino, M.J.; Grace, J.B.; Hardegree, S.P.; Miller, R.F.; Pyke, D.A. Resilience to Stress and Disturbance, and Resistance to Bromus tectorum L. Invasion in Cold Desert Shrublands of Western North America. Ecosystems 2014, 17, 360–375. [Google Scholar] [CrossRef]
- Weisberg, P.J.; Dilts, T.E.; Baughman, O.W.; Meyer, S.E.; Leger, E.A.; Van Gunst, K.J.; Cleeves, L. Development of remote sensing indicators for mapping episodic die-off of an invasive annual grass (Bromus tectorum) from the Landsat archive. Ecol. Indic. 2017, 79, 173–181. [Google Scholar] [CrossRef]
- Boyte, S.P.; Wylie, B.K.; Major, D.J. Cheatgrass Percent Cover Change: Comparing Recent Estimates to Climate Change−Driven Predictions in the Northern Great Basin. Rangel. Ecol. Manag. 2016, 69, 265–279. [Google Scholar] [CrossRef]
- Peterson, E.B. Estimating cover of an invasive grass (Bromus tectorum) using tobit regression and phenology derived from two dates of Landsat ETM+ data. Int. J. Remote Sens. 2005, 26, 2491–2507. [Google Scholar] [CrossRef]
- Kokaly, R.F. DESI—Detection of early-season invasives (software-installation manual and user’s guide version 1.0). US Geol. Surv. Open File Rep. 2010-1302 2011, 2010, 1. [Google Scholar]
- Bishop, T.B.B.; Munson, S.; Gill, R.A.; Belnap, J.; Petersen, S.L.; St Clair, S.B. Spatiotemporal patterns of cheatgrass invasion in Colorado Plateau National Parks. Landsc. Ecol. 2019, 34, 925–941. [Google Scholar] [CrossRef]
- Bradley, B.A.; Mustard, J.F. Identifying land cover variability distinct from land cover change: Cheatgrass in the Great Basin. Remote Sens. Environ. 2005, 94, 204–213. [Google Scholar] [CrossRef]
- Abatzoglou, J.T. Development of gridded surface meteorological data for ecological applications and modelling. Int. J. Climatol. 2013, 33, 121–131. [Google Scholar] [CrossRef]
- U.S. Wind Turbine Database. Available online: https://eerscmap.usgs.gov/uswtdb/ (accessed on 5 September 2019).
- Eidenshink, J.; Schwind, B.; Brewer, K.; Zhu, Z.-L.; Quayle, B.; Howard, S. A Project for Monitoring Trends in Burn Severity. Fire Ecol. 2007, 3, 3–21. [Google Scholar] [CrossRef]
- Davidson, A.; McKerrow, A. GAP/LANDFIRE National Terrestrial Ecosystems 2011; U.S. Geological Survey: Reston, VA, USA, 2016.
- R Core Team. R: A language and Environment for Statistical Computing; R Foundation for Statistical Computing: Vienna, Austria, 2019; Available online: https://www.R-project.org/ (accessed on 30 October 2019).
- California Public Utility Commission. California Public Utility Commission 2013; California Public Utility Commission: San Francisco, CA, USA, 2013.
- UNEP, U. Towards a green economy: Pathways to sustainable development and poverty eradication. Nairobi Kenya UNEP 2011. [Google Scholar]
- Gasparatos, A.; Doll, C.N.H.; Esteban, M.; Ahmed, A.; Olang, T.A. Renewable energy and biodiversity: Implications for transitioning to a Green Economy. Renew. Sustain. Energy Rev. 2017, 70, 161–184. [Google Scholar] [CrossRef] [Green Version]
- Jones, N.F.; Pejchar, L.; Kiesecker, J.M. The Energy Footprint: How Oil, Natural Gas, and Wind Energy Affect Land for Biodiversity and the Flow of Ecosystem Services. BioScience 2015, 65, 290–301. [Google Scholar] [CrossRef] [Green Version]
- DiTomaso, J.M. Invasive weeds in rangelands: Species, impacts, and management. Weed Sci. 2000, 48, 255–265. [Google Scholar] [CrossRef] [Green Version]
- Fiehler, C.M.; Cypher, B.L.; Saslaw, L.R. Effects of oil and gas development on vertebrate community composition in the southern San Joaquin Valley, California. Glob. Ecol. Conserv. 2017, 9, 131–141. [Google Scholar] [CrossRef]
- Keehn, J.E.; Feldman, C.R. Disturbance affects biotic community composition at desert wind farms. Wildl. Res. 2018, 45, 383–396. [Google Scholar] [CrossRef]
- Hunter, R. Bromus invasions on the Nevada Test Site: Present status of B. Rubens and B. tectorum with notes on their relationship to disturbance and altitude. Gt. Basin Nat. 1991, 176–182. [Google Scholar]
- Beatley, J.C. Ecological Status of Introduced Brome Grasses (Bromus Spp.) in Desert Vegetation of Southern Nevada. Ecology 1966, 47, 548–554. [Google Scholar] [CrossRef]
- Brown, D.E.; Minnich, R.A. Fire and Changes in Creosote Bush Scrub of the Western Sonoran Desert, California. Am. Midl. Nat. 1986, 116, 411–422. [Google Scholar] [CrossRef]
- Rao, L.E.; Steers, R.J.; Allen, E.B. Effects of natural and anthropogenic gradients on native and exotic winter annuals in a southern California Desert. Plant Ecol. 2011, 212, 1079–1089. [Google Scholar] [CrossRef] [Green Version]
- Bunting, E.L.; Munson, S.M.; Villarreal, M.L. Climate legacy and lag effects on dryland plant communities in the southwestern U.S. Ecol. Indic. 2017, 74, 216–229. [Google Scholar] [CrossRef]
- Lovich, J.E.; Ennen, J.R.; Madrak, S.V.; Loughran, C.L.; Meyer, K.P.; Arundel, T.R.; Bjurlin, C.D. Long-Term Post-Fire Effects on Spatial Ecology and Reproductive Output of Female Agassiz’s Desert Tortoises (Gopherus agassizii) at a Wind Energy Facility near Palm Springs, California, USA. Fire Ecol. 2011, 7, 75–87. [Google Scholar] [CrossRef]
- Esque, T.C.; Webb, R.H.; Wallace, C.S.A.; van Riper, C.; McCreedy, C.; Smythe, L. Desert Fires Fueled by Native Annual Forbs: Effects of Fire on Communities of Plants and Birds in the Lower Sonoran Desert of Arizona. Southwest. Nat. 2013, 58, 223–233. [Google Scholar] [CrossRef]
- Brooks, M.L.; Matchett, J.R. Spatial and temporal patterns of wildfires in the Mojave Desert, 1980–2004. J. Arid. Environ. 2006, 67, 148–164. [Google Scholar] [CrossRef]
- Lovich, J.E.; Agha, M.; Ennen, J.R.; Arundel, T.R.; Austin, M. Agassiz’s desert tortoise (Gopherus agassizii) activity areas are little changed after wind turbine-induced fires in California. Int. J. Wildl. Fire 2018, 27, 851–856. [Google Scholar] [CrossRef]
- Another Wind Turbine fire—This Time in Tehachapi. Available online: https://www.eastcountymagazine.org/another-wind-turbine-fire-%E2%80%93-time-tehachapi (accessed on 27 August 2019).
- Syphard, A.D.; Keeley, J.E. Location, timing and extent of wildfire vary by cause of ignition. Int. J. Wildl. Fire 2015, 24, 37–47. [Google Scholar] [CrossRef]
- Villarreal, M.L.; Norman, L.M.; Buckley, S.; Wallace, C.S.A.; Coe, M.A. Multi-index time series monitoring of drought and fire effects on desert grasslands. Remote Sens. Environ. 2016, 183, 186–197. [Google Scholar] [CrossRef] [Green Version]
- Horn, K.J.; St Clair, S.B. Wildfire and exotic grass invasion alter plant productivity in response to climate variability in the Mojave Desert. Landsc. Ecol. 2017, 32, 635–646. [Google Scholar] [CrossRef]
- Kern County Planning and Community Development Department. Addison Energy Wind Project Draft Environmental Impact Report SCH# 2013091022; Kern County Planning and Community Development Department: Bakersfield, CA, USA, 2013. [Google Scholar]
- Malusa, J.; Halvorson, B.; Angell, D. Distribution of the Exotic Mustard Brassica tournefortii in the Mohawk Dunes and Mountain, Arizona. Desert Plants 2003, 19, 1. [Google Scholar]
- Wallace, C.S.A.; Walker, J.J.; Skirvin, S.M.; Patrick-Birdwell, C.; Weltzin, J.F.; Raichle, H. Mapping Presence and Predicting Phenological Status of Invasive Buffelgrass in Southern Arizona Using MODIS, Climate and Citizen Science Observation Data. Remote Sens. 2016, 8, 524. [Google Scholar] [CrossRef]
Figure 1.
(A) Location of the study turbines in relation to the Western Mojave Basins and the Upper Coachella Valley and Hills Level IV Ecoregions in California. Zooms of (B) the Tehachapi area in the Western Mojave Basins, and (C) the Desert Hot Springs area in the Upper Coachella Valley and Hills ecoregion.

Figure 2.
Number of turbines installed per year between 1988–2013 in the Tehachapi and Desert Hot Springs study areas.
Figure 2.
Number of turbines installed per year between 1988–2013 in the Tehachapi and Desert Hot Springs study areas.

Figure 3.
Sampling occurred within a ring extending from 105 to 225 m from the turbine. The active areas within 105 m of the turbine were excluded from analysis, as were disturbed pixels within the outer ring.
Figure 3.
Sampling occurred within a ring extending from 105 to 225 m from the turbine. The active areas within 105 m of the turbine were excluded from analysis, as were disturbed pixels within the outer ring.

Figure 4.
Early Season Invasives (ESI) index values before and after turbine construction, (A) Tehachapi before, (B) Tehachapi after, (C) Desert Hot Springs before, and (D) Desert Hot Springs after. Index classification values indicate the likelihood of presence: none < 0.10, low 0.10–0.12, moderate 0.12–0.15, high 0.15–0.20, and very high >0.20.

Figure 5.
Boxplots of the difference (post-installation minus pre-installation) in Early Season Invasives (ESI) index values for turbines and control sites at the Tehachapi and Desert Hot Springs wind energy sites. p-values from ANOVA test between turbine and control were <0.001 for both Tehachapi and Desert Hot Springs.

Figure 6.
Difference in Early Season Invasives (ESI) index values before and after turbine construction compared to control areas at (A) Tehachapi and (B) Desert Hot Springs Desert. Data are classified into quantiles, where negative values (red) show areas where the post-installation minus pre-installation ESI changes measured at turbines was greater than at the control sites, and positive values (blue) are where the ESI changes measured at control sites was greater than at the turbines. Yellow values show where ESI changes at turbine and control were similar.

Figure 7.
5-year average ESI values across the Western Mojave Basin ecoregion. Red box in panel A outlines the wind energy areas. Blue values indicate persistent yearly high (>0.2, summed for the period) values over each period. Periods are (A) 1989–1993, (B) 1994–1998, (C) 1999–2003, (D) 2004–2008, (E) 2009–2013, and (F) 2014–2018.

Figure 8.
5-year average ESI values across Upper Coachella Valley and Hills ecoregion. Red box in panel A outlines the wind energy areas. Blue values indicate persistent yearly high (>0.2) values over each period. Periods are (A) 1989–1993, (B) 1994–1998, (C) 1999–2003, (D) 2004–2008, (E) 2009–2013, and (F) 2014–2018.

Figure 9.
Yearly winter precipitation (Oct–April) and ESI values averaged for turbines in the Tehachapi (A) and Desert Hot Springs (B) study sites.
Figure 9.
Yearly winter precipitation (Oct–April) and ESI values averaged for turbines in the Tehachapi (A) and Desert Hot Springs (B) study sites.


Table 1.
Mean and variance of ESI values calculated for turbine rings and control sites before and after the installation period.
Table 1.
Mean and variance of ESI values calculated for turbine rings and control sites before and after the installation period.
| Turbine Rings before Installation | Turbine Rings after Installation | Difference for Turbine Rings | Control Sites before Installation | Control Sites after Installation | Difference for Control Sites | |
|---|---|---|---|---|---|---|
| All (n = 1755) | ||||||
| Mean | 0.1298 | 0.1650 | 0.0352 | 0.1141 | 0.1434 | 0.0292 |
| Variance | 0.0022 | 0.0034 | 0.0009 | 0.0008 | 0.0018 | 0.0006 |
| Tehachapi (n = 1050) | ||||||
| Mean | 0.1263 | 0.1741 | 0.0478 | 0.1169 | 0.1590 | 0.0422 |
| Variance | 0.0019 | 0.0027 | 0.0004 | 0.0007 | 0.0013 | 0.0002 |
| Desert Hot Springs (n = 705) | ||||||
| Mean | 0.1351 | 0.1515 | 0.0164 | 0.1100 | 0.1200 | 0.0100 |
| Variance | 0.0025 | 0.0040 | 0.0010 | 0.0010 | 0.0015 | 0.0006 |
© 2019 by the authors. Licensee MDPI, Basel, Switzerland. This article is an open access article distributed under the terms and conditions of the Creative Commons Attribution (CC BY) license (http://creativecommons.org/licenses/by/4.0/).
Share and Cite
MDPI and ACS Style
Villarreal, M.L.; Soulard, C.E.; Waller, E.K. Landsat Time Series Assessment of Invasive Annual Grasses Following Energy Development. Remote Sens. 2019, 11, 2553. https://doi.org/10.3390/rs11212553
AMA Style
Villarreal ML, Soulard CE, Waller EK. Landsat Time Series Assessment of Invasive Annual Grasses Following Energy Development. Remote Sensing. 2019; 11(21):2553. https://doi.org/10.3390/rs11212553
Chicago/Turabian StyleVillarreal, Miguel L., Christopher E. Soulard, and Eric K. Waller. 2019. "Landsat Time Series Assessment of Invasive Annual Grasses Following Energy Development" Remote Sensing 11, no. 21: 2553. https://doi.org/10.3390/rs11212553
Note that from the first issue of 2016, this journal uses article numbers instead of page numbers. See further details here.