Article

Quantifying Below-Water Fluvial Geomorphic Change: The Implications of Refraction Correction, Water Surface Elevations, and Spatially Variable Error

1
Department of Geography and Environment, School of Social Sciences and Humanities, Loughborough University, Loughborough LE11 3TU, UK
2
Department of Geography, University of Northern Iowa, Cedar Falls, IA 50614, USA
3
Independent Scholar, Southampton, SO16 6DB, UK
*
Author to whom correspondence should be addressed.
Remote Sens. 2019, 11(20), 2415; https://doi.org/10.3390/rs11202415
Submission received: 12 September 2019 / Revised: 12 October 2019 / Accepted: 15 October 2019 / Published: 18 October 2019

Abstract

:
Much of the geomorphic work of rivers occurs underwater. As a result, high resolution quantification of geomorphic change in these submerged areas is important. Currently, to quantify this change, multiple methods are required to get high resolution data for both the exposed and submerged areas. Remote sensing methods are often limited to the exposed areas due to the challenges imposed by the water, and those remote sensing methods for below the water surface require the collection of extensive calibration data in-channel, which is time-consuming, labour-intensive, and sometimes prohibitive in difficult-to-access areas. Within this paper, we pioneer a novel approach for quantifying above- and below-water geomorphic change using Structure-from-Motion photogrammetry and investigate the implications of water surface elevations, refraction correction measures, and the spatial variability of topographic errors. We use two epochs of imagery from a site on the River Teme, Herefordshire, UK, collected using a remotely piloted aircraft system (RPAS) and processed using Structure-from-Motion (SfM) photogrammetry. For the first time, we show that: (1) Quantification of submerged geomorphic change to levels of accuracy commensurate with exposed areas is possible without the need for calibration data or a different method from exposed areas; (2) there is minimal difference in results produced by different refraction correction procedures using predominantly nadir imagery (small angle vs. multi-view), allowing users a choice of software packages/processing complexity; (3) improvements to our estimations of water surface elevations are critical for accurate topographic estimation in submerged areas and can reduce mean elevation error by up to 73%; and (4) we can use machine learning, in the form of multiple linear regressions, and a Gaussian Naïve Bayes classifier, based on the relationship between error and 11 independent variables, to generate a high resolution, spatially continuous model of geomorphic change in submerged areas, constrained by spatially variable error estimates. Our multiple regression model is capable of explaining up to 54% of magnitude and direction of topographic error, with accuracies of less than 0.04 m. With on-going testing and improvements, this machine learning approach has potential for routine application in spatially variable error estimation within the RPAS–SfM workflow.

Graphical Abstract

1. Introduction

High spatial resolution, spatially continuous, accurate, and precise methods for quantifying topographic change in fluvial environments are important for a range of river science and management applications. For instance, such data can provide valuable input to sediment routing and budgeting models (e.g., [1,2]), help predict channel dynamics through the provision of channel texture and roughness data [3,4,5,6], assist in the monitoring of patterns of geomorphic adjustment [7,8] to significant external drivers such as climate change [9], and reveal trends in channel capacity, which in turn feed flood risk models and insurance forecasting [10,11]. Such data are also essential in assessments of habitat quality and availability [12,13]. Significant early work on quantifying topography and geomorphic change, some of which has been undertaken in fluvial environments, made use of photogrammetry [14,15], terrestrial and airborne laser altimetry [8,16,17], and extensive GPS- or total station-based topographic surveys [7,18]. Such studies tend to use either multiple approaches for characterising the exposed and submerged parts of the system separately, which are subsequently fused together, or dense networks of irregularly spaced individual point measurements, which are exceptionally time-consuming to collect and must then be interpolated to form an elevation model. The resulting models typically have spatial resolutions no finer than 1 m/pixel. Ideally, a single method of quantifying topographic change in all parts of the river system could be used to enable more rapid and consistent data acquisition for monitoring and management of river habitats. Such a method should have high accuracy and precision, a very high spatial resolution (i.e., at the grain scale, <0.1 m/pixel), and provide spatially continuous data (typically as rasters or point clouds) rather than interpolations between sparse point samples (such as traditional topographic surveys, total station surveys, global navigation satellite system (GNSS) surveys, and cross sections or longitudinal profiles). This ideal method would be in alignment with the popular ‘riverscape’ paradigm [19], which conceptualises fluvial systems as highly heterogeneous rather than gradually varying and would provide physical habitat data at the grain scale, which is of most relevance to aquatic biota (i.e., <0.1 m spatial resolution over reach-scale extents).
Recently, we have seen a proliferation of studies offering high spatial resolution topographic data over continuous spatial extents in a variety of geomorphological settings, without the need for interpolation between data points (e.g., [4,8,20,21,22,23,24,25,26]). Such studies have demonstrated the use of airborne and terrestrial LiDAR and Structure-from-Motion photogrammetry using imagery from remotely piloted aircraft systems (RPAS). In fluvial environments specifically, the acquisition of survey data is complicated in submerged areas where the effects of refraction, turbidity, and water surface roughness represent well-known challenges [27,28]. However, these submerged spaces are where a majority of fluvial ‘work’ occurs (i.e., erosion and deposition resulting from variations in flow magnitude and shear stress). To date, most fluvial studies aimed at measuring spatially-continuous topography and/or topographic change at high spatial resolutions offer just one of the following:
(a)
Coverage within submerged areas only, for a single point in time. This is particularly applicable in the case of new and emerging technologies, which have not yet progressed much beyond proof of concept. For example, [29] evaluates a range of sensors for deriving fluvial bathymetry data, including a RPAS-mounted hyperspectral sensor with a moderately high spatial resolution of 0.18 m/pixel.
(b)
Coverage for multiple points in time (thereby permitting change assessments) but only for exposed areas, with a specific focus on bank erosion or floodplain dynamics, using one or more survey methods (e.g., [26,30,31,32,33,34]).
(c)
Complete fluvial coverage (i.e., both exposed and submerged areas) but only for a single point in time and requiring the use of a combination of survey methods. For example, [35] uses a combination of helicopter-acquired imagery, processed using Structure-from-Motion (SfM) photogrammetry, for exposed areas and bathymetric echo-sounding in submerged areas. In other settings, such as coastal and shallow marine environments, a combination of approaches is also common (e.g., [36]).
(d)
Complete fluvial coverage for multiple points in time, but with the need for extensive fieldwork to collect calibration data within the submerged parts of the channel, which can be dangerous or prohibitively time-consuming in some settings. For example, [37] uses an optical bathymetric approach on images acquired by RPAS (remotely piloted aircraft system) to obtain data in submerged areas. This approach requires the associated acquisition of bathymetry elevations using a GNSS to calibrate the relationship between the spectral image data and the water depth (from which elevation can be inferred). Similar workflows are employed by [38].
As such, no study has yet demonstrated and rigorously assessed an approach which uses a single method capable of quantifying spatially continuous fluvial geomorphic change at grain scales, both above and below the water surface, without the need to collect extensive calibration data. It is here that this paper aims to contribute.

1.1. Refraction Correction

Since 2015, a method which uses high resolution RPAS (or UAS/unmanned aerial system) imagery, processed using SfM, has been shown as a promising tool for measuring both above-water (bank and floodplain) and below-water (bathymetric) topography at the grain scale in fluvial environments, when paired with refraction correction post-processing [27]. Above-water use of the RPAS–SfM approach has already provided an important step-change in our ability to quantify exposed topography without the greater expense of a terrestrial laser scanning system (e.g., [34,38,39,40]), but its use in submerged areas is less well established, due to the additional challenges posed by the presence of water and, in particular, the effects of refraction. Recently, two key RPAS–SfM methods have been proposed by the authors for use in submerged areas [27,28].
In 2015, Woodget et al. [27] published details of a simple approach for refraction correction of bathymetric elevation models using a small angle approximation. This RPAS–SfM approach generated high resolution orthophotos and digital elevation models (DEMs) of submerged areas. These datasets were analysed in a GIS environment to extract the position and elevation of the water’s edge and create an elevation model for the position of the water surface. Snell’s Law was then applied to this surface to increase the apparent water depths by a multiplier of 1.34 (i.e., the refractive index of clear water) to account for the effects of refraction (which cause the channel bed to appear closer to the camera than it really is). This workflow provides a relatively simple method for use in shallow (<1 m), non-turbid settings and is easily implemented by other researchers and practitioners (e.g., [41,42]). Furthermore, this method was shown to reduce the magnitude of mean errors associated with bathymetric topography estimations by up to 50% (i.e., accuracy of 0.02–0.05 m and precision of 0.06–0.09 m). It was not able, however, to eliminate completely the systematic increase in error with increasing water depth, and difficulties in accurately establishing the position of the water’s edge were noted.
In 2017, Dietrich [28] further developed this method by proposing a more sophisticated multi-angle refraction correction approach. Instead of using the orthophotos and DEMs generated by the RPAS–SfM process, Dietrich used the dense three-dimensional (3D) point clouds (which describe the 3D topography of the scene) and applied an iterative refraction correction method based on the positions and view angles of all the cameras used within the photogrammetric reconstruction of the position of each point in the cloud. As found by [27], the challenges of accurately defining the water’s edge and the compounding effect on bathymetric accuracy were noted. Dietrich’s method requires more inputs than the small angle approach. Guidance on its implementation is available online and is accompanied by a dedicated python script ([43]: pyBathySfM v4.0). Furthermore, Dietrich reports improved error statistics associated with this method of refraction correction, with typical accuracy values of ± 0.01 m and precision values of 0.06–0.08 m. However, a direct comparison of these two approaches using the same input data has not yet been attempted, and nor has either method been tested for quantifying topographic change in the submerged parts of river channels. Therefore, our first objective is to investigate how our RPAS–SfM bathymetric refraction correction methods can be used to accurately measure change in submerged parts of rivers. We include in this a direct comparison of the methods of Woodget et al. [27] and Dietrich [28].

1.2. Water Surface Elevation

Recognising that one of the key impediments to accurate and reliable refraction correction relates to the challenges of defining accurately the position of the water’s edge and the elevation of the water surface, our second objective is to explore different methods for estimating water surface elevations and their influence on the accuracy and precision of below-water topography estimates and estimates of change over time. Knowledge of the water surface elevation is paramount within both refraction correction approaches [27,28], as it forms the lynchpin for computing the apparent water depth, and subsequently the true water depths and refraction-corrected elevations using the geometry of refraction described by Snell’s Law.

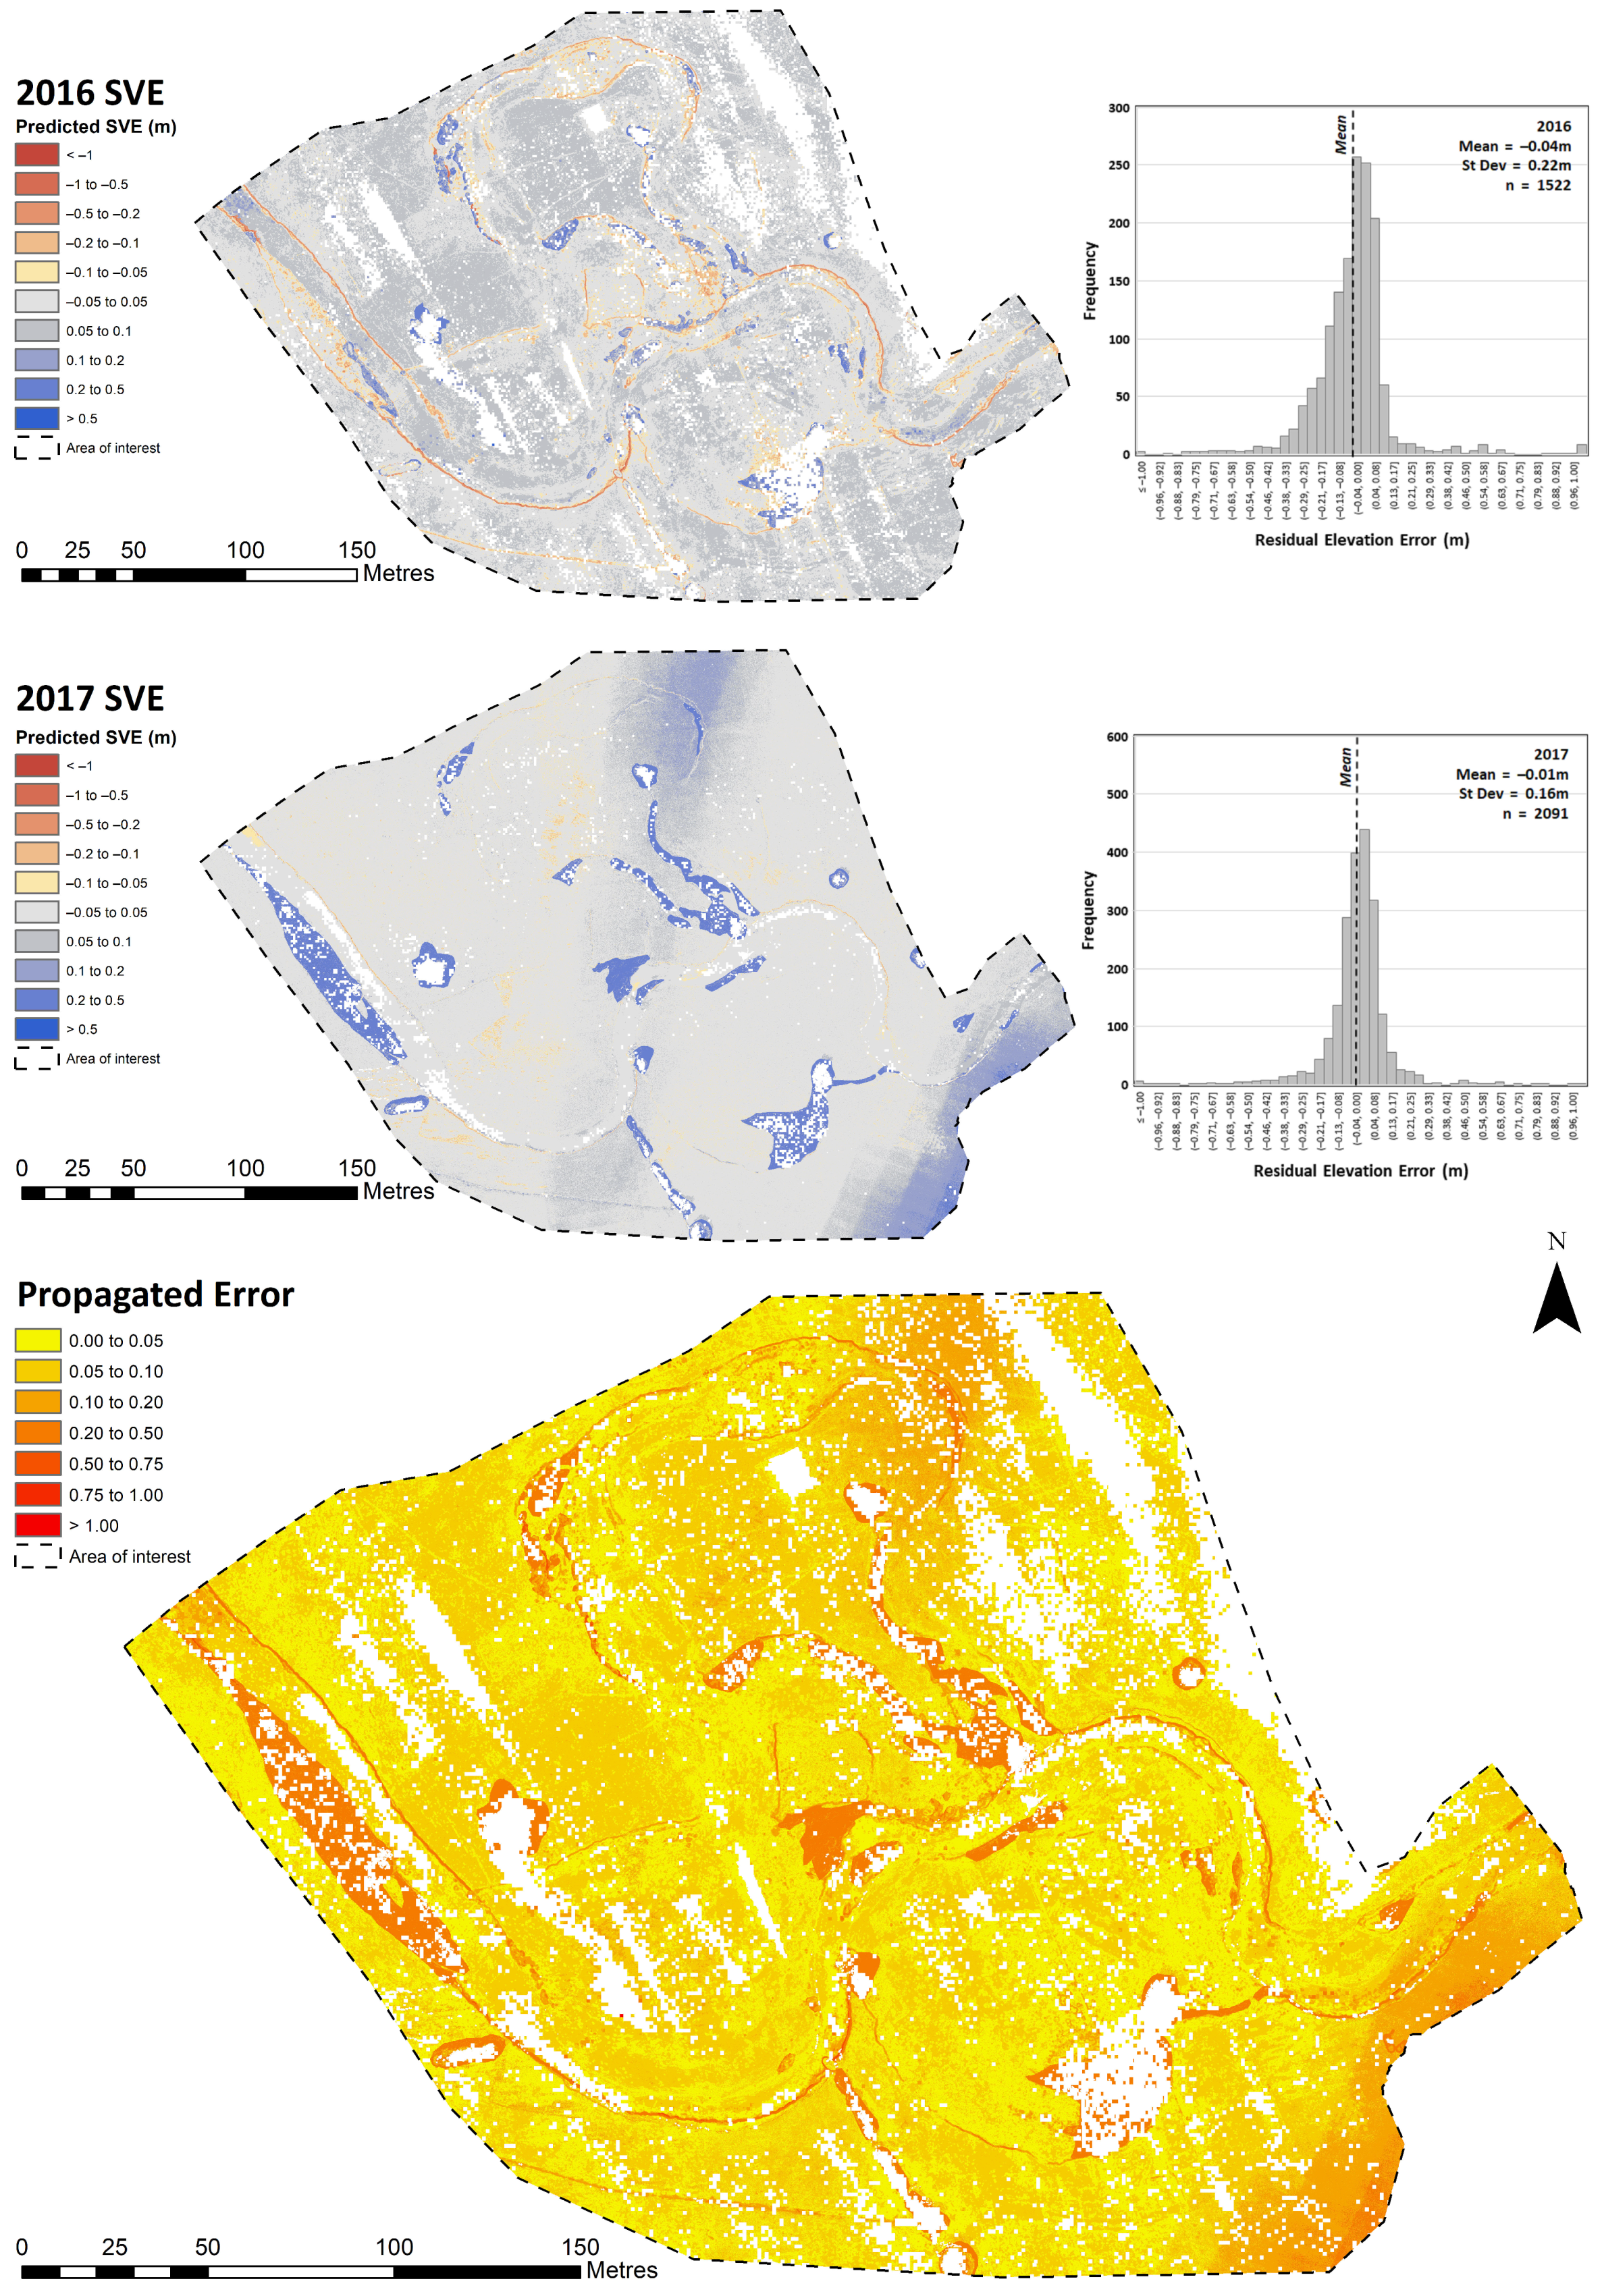
1.3. Spatially Variable Elevation Error

The quantification of topographic elevation change in any setting, and particularly within this initial assessment of refraction-corrected bathymetric change, requires the establishment of appropriate error thresholds for each epoch of data and propagation of this error into models of change, in order to distinguish real change from noise [1,16,23,44]. In the past, geomorphic change detection studies have either (a) recognised the limitations of change quantification but not defined or implemented a specific error threshold (e.g., [45]), or (b) have employed spatially uniform error thresholds based on surface topography, data acquisition method, and/or post-processing (known as a ‘level of detection’ or LoD, e.g., [8,46,47]). However, such broad approaches run the risk of masking real change in some places and detecting change which is not real in others [32,48]. Therefore, as others have done before us, we highlight the need for spatially variable error thresholds [24,32,48,49,50] and implement them within our work to optimise the accuracy of our change measurements. Previously, spatially variable error thresholds have been based on measures associated with broad polygons of wet or dry areas or of different survey methods (e.g., [8,16,38]), or on spatially-continuous measures of local topographic variability such as roughness, grain size, or slope angle or on sampling point density [1,33,48,51]. However, very few studies have tested the combined impact and significance of multiple proxies on elevation error (with the exception of the fuzzy inference systems used by [1]), and none have yet quantified spatially variable error of RPAS–SfM-derived DEMs in submerged areas. Thus, we take this a step further with our final objective, by utilising the full potential of the exceptionally high resolution RPAS imagery (<0.02 m pixel size) to investigate how this detailed information (specifically concerning topographic complexity, landscape composition, and survey quality/conditions) acquired by each RPAS–SfM survey can help to elucidate the direction and magnitude of elevation errors in submerged and exposed areas. Specifically, we explore how this information might be exploited using artificial intelligence approaches (including multiple regression and a machine learning classifier) to inform the development of an appropriate spatially variable error threshold.
To this end, we study specifically the influence of the following variables on elevation error:
  • Topographic complexity: Including slope angle and point cloud roughness.
  • Landscape composition: Including presence/absence of dense vegetation and water depth.
  • Survey quality: Including image quality, SfM point cloud density, and the precision of SfM tie points. We note the latter two SfM variables here are influenced by image texture, and therefore might also be classified as dependent on the nature of the landscape composition.
  • Survey conditions: Including the presence/absence of water surface reflections and roughness and the presence/absence of dark shadows.
These variables can be obtained for each pixel within the RPAS–SfM-derived datasets and many of them have been shown previously to have some bearing on topographic error [1,26,27,48,49,51]. Elevation error is determined by computing the elevation difference between point cloud elevations and the elevation data acquired from >3500 validation points measured using a combination of GNSS and total station surveys. Given that the existing evidence suggests that simple monotonic relationships between these variables and elevation error is unlikely [1,48], we investigate the use of multiple regression and machine learning classification algorithms for predicting elevation error. Machine learning (ML) is a form of artificial intelligence (AI), whereby a ‘machine’ is trained to recognise statistical patterns and trends within data and use them to predict new data outputs. As such, it includes a broad range of algorithms, encompassing everything from simple linear regressions to deep learning-based neural networks [52]. The application of AI/ML for geomorphic error thresholding purposes is novel, with existing studies within freshwater settings applying it predominantly for classification of land cover types from image-derived parameters (e.g., [53,54,55,56]) or for the identification of other specific features of interest such as buildings (e.g., [57]) and invasive species (e.g., [58]). As such, our ultimate aim is to create the first high resolution, spatially continuous SfM-derived topographic change models in submerged fluvial environments constrained by spatially variable error estimates.

2. Materials and Methods

2.1. Site Set-Up

Our field setting is a 600-m-long reach of the River Teme in Herefordshire, near the England/Wales border, where we collected RPAS imagery in August 2016 and August 2017 (Figure 1). This is a lowland, meandering, dynamic, gravel-bed river system with channel widths of 3–13 m and a total catchment drainage area of 160,000 hectares [59]. In-channel hydromorphic diversity is good, palaeochannels are common (often still connected to the main water course), and median grain size (D50) of exposed surfaces is 21.5 mm. Our section of the River Teme has previously experienced significant channel change following a flood event in the winter of 2014–15 (as evidenced by before and after Google Earth imagery).
Prior to the first RPAS image acquisition survey at the River Teme in August 2016, we established six permanent ground survey markers around the outer boundary of our area of interest (PM1–6, Figure 1). These markers comprised a 50-cm-long steel stake, topped with a flat, plastic yellow survey head and sealing cap which features a plumb point recess for accurate alignment of survey poles. We surveyed the position of these markers in August 2016 using a Trimble R8 RTK GNSS (with a manufacturer-reported accuracy 10 mm in horizontal and 20 mm in the vertical) and collected all subsequent survey data relative to these marker positions. Given the sturdy nature of these markers and light grazing land-use in this area, we were confident that the markers would not have moved between surveys and therefore could be used to ensure the accurate alignment of multiple epochs of data. Despite this, we re-surveyed the markers in August 2017 using a Leica VIVA GS10 GNSS and found that the difference from 2016 marker positions was, on average, less than ±0.008 m, ±0.007 m, and ±0.0185 m in XY and Z, respectively. This difference is very minimal and is within the bounds of uncertainty we would expect as a result of random errors, from pole tilt for example. As a result, we assume no movement has occurred within the intervening time. Three of the six markers could not be found on return to the site in 2017, so an additional two markers were added in new locations and surveyed using the Leica VIVA GS10 GNSS (PM7–8, Figure 1). This allows us to maintain the precision of subsequent internal surveys undertaken using a total station.

2.2. RPAS Surveys

In August 2016, we flew manually using a rotary-winged DJI Inspire 1 RPAS over the site at a height of ca. 35 m above ground level. High resolution imagery (<0.02 m ground sample distance (GSD)) was acquired using the associated Zenmuse X3 FC350 camera, predominantly at a nadir viewing angle, with a 60–80% level of overlap. The survey was carried out in dry and calm conditions, with sunny intervals. In August 2017, we acquired our second epoch of high-resolution imagery (<0.2 m GSD) using a DJI Phantom 4 Pro RPAS, which was pre-programmed using DJI’s Ground Station Pro application, to collect imagery at nadir with an 80% overlap from an altitude of ca. 35 m. Prevailing weather conditions were comparable to those in August 2016. We also collected a number of oblique images from higher altitudes with each survey to incorporate into the SfM processing, to avoid the risk of systematic doming errors which can otherwise result from inadequate camera lens calibration models [27,60,61,62].
Prior to each survey, we had distributed a number of ground control points (GCPs) throughout the site (n = 19 in 2016, n = 14 in 2017), ensuring they were positioned to represent the range in elevation distributions across the site (Figure 1). The position of all GCPs was surveyed using a Leica Builder 500 total station in relation to the known positions of the permanent markers.
In 2016, a total of 773 images were acquired, of which 220 images were excluded due to redundancy, blurring, or other visual distortions. In 2017, a total of 1512 images were acquired, of which 471 images were excluded due to redundancy or blurring.

2.3. SfM Processing

Each epoch of imagery was imported into Agisoft’s PhotoScan Pro software for processing using SfM photogrammetry (v.1.4.0 build 5650). Image alignment was undertaken with high accuracy and was optimised following the addition of GCP locations within the model. Exports included a ca. 0.01 m resolution orthophoto, ca. 0.04 m resolution digital elevation model, and a dense 3D point cloud for each survey date. All outputs are referenced to British National Grid (OSGB 1936) using the GCPs and permanent markers established at the site.

2.4. Validation Data

In both 2016 and 2017, independent topographic validation data were acquired shortly after the RPAS flights in both exposed and submerged parts of the site. Elevation (Z) and XY positions of each validation point were recorded using the total station and tied into the same coordinate system using the permanent markers. Efforts were made to collect validation data using a random distribution, whilst maintaining coverage of all key parts of the area of interest. Particular attention was paid to acquiring validation data over a range of water depths and along breaks of slope, to ensure the validation was not biased to the more easily accessible, flatter parts of the site. This sampling strategy was prompted by knowledge that breaks of slope tend to be areas of greatest error within elevation models [1]. A total of 1522 validation points were collected in 2016, and 2091 points in 2017 (Figure 2).

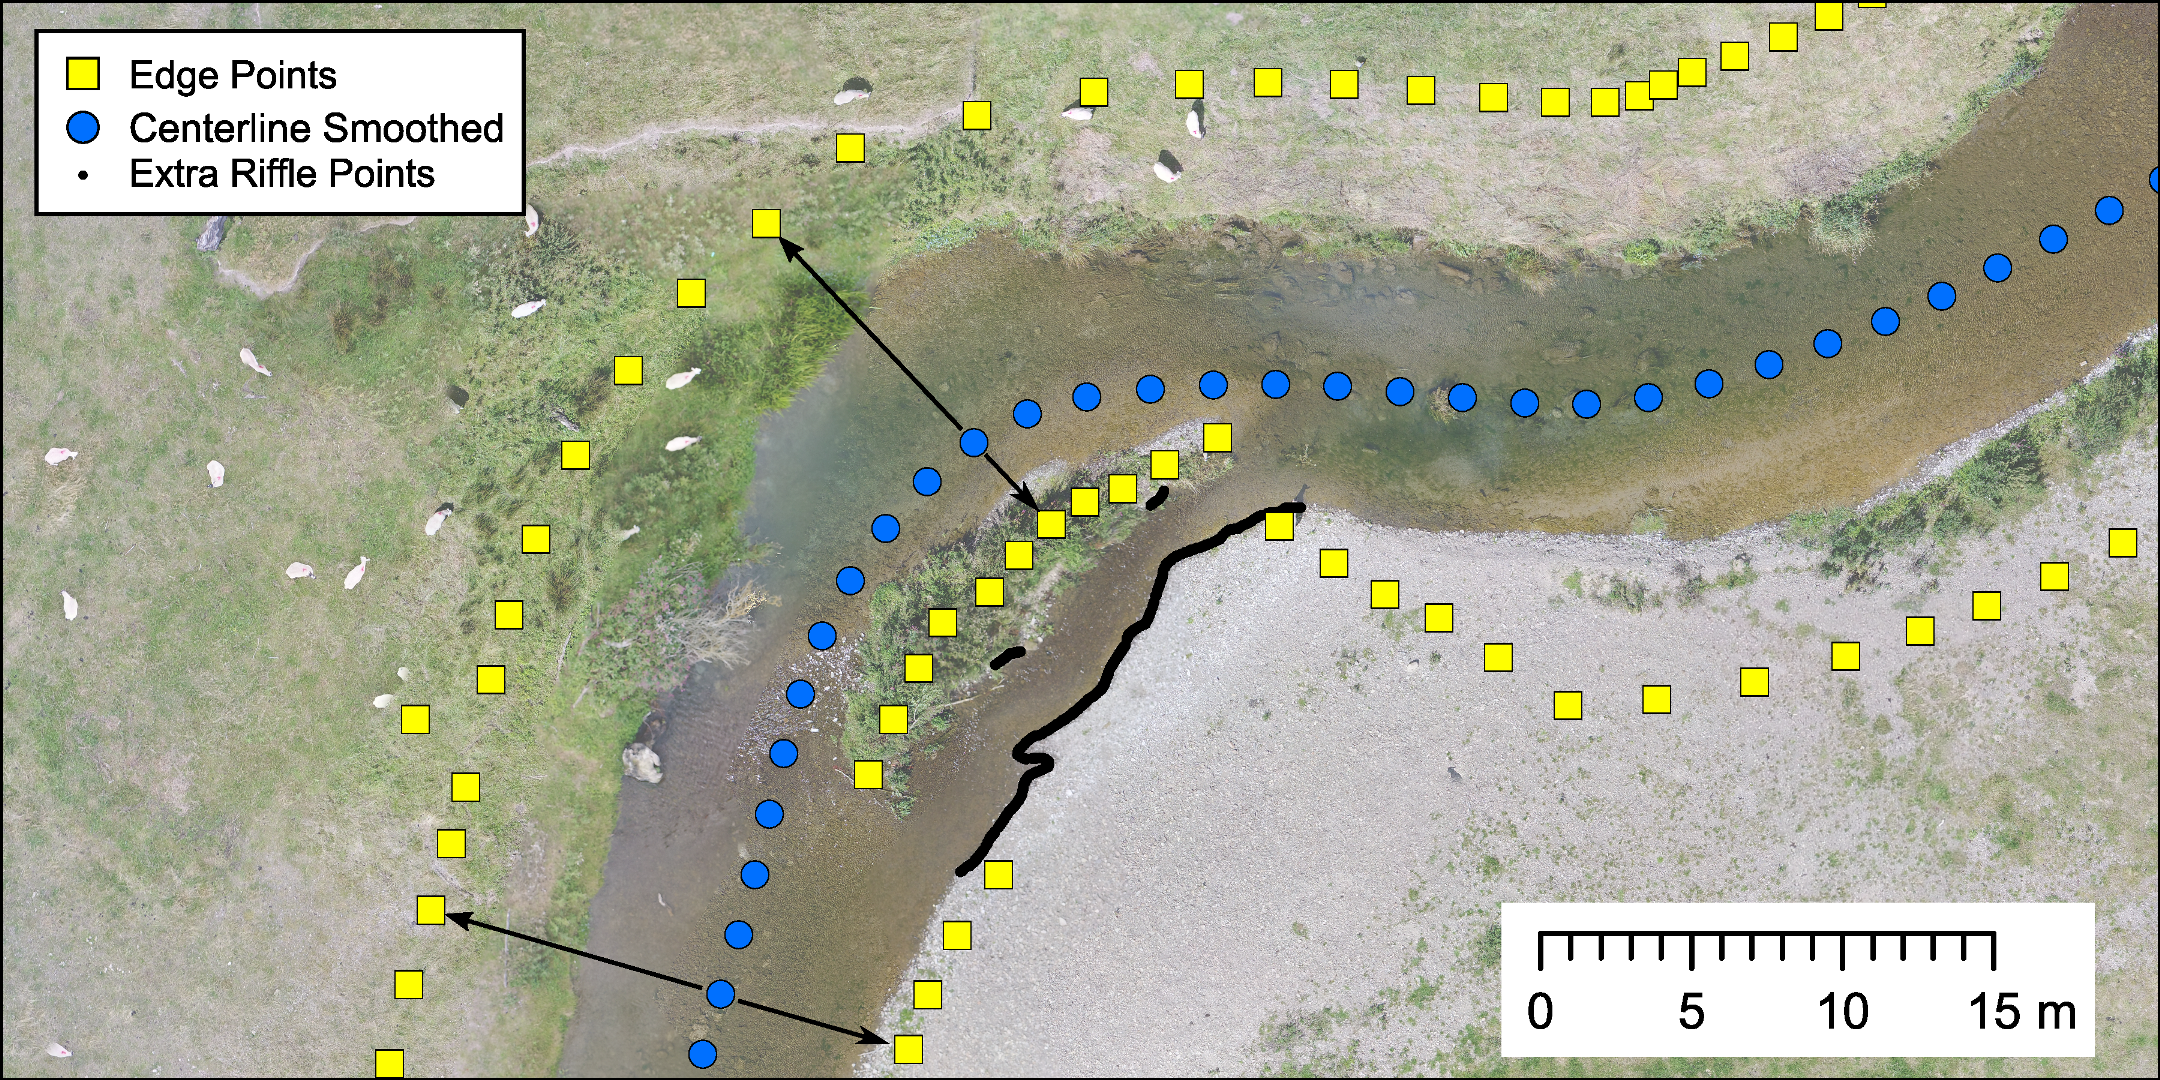
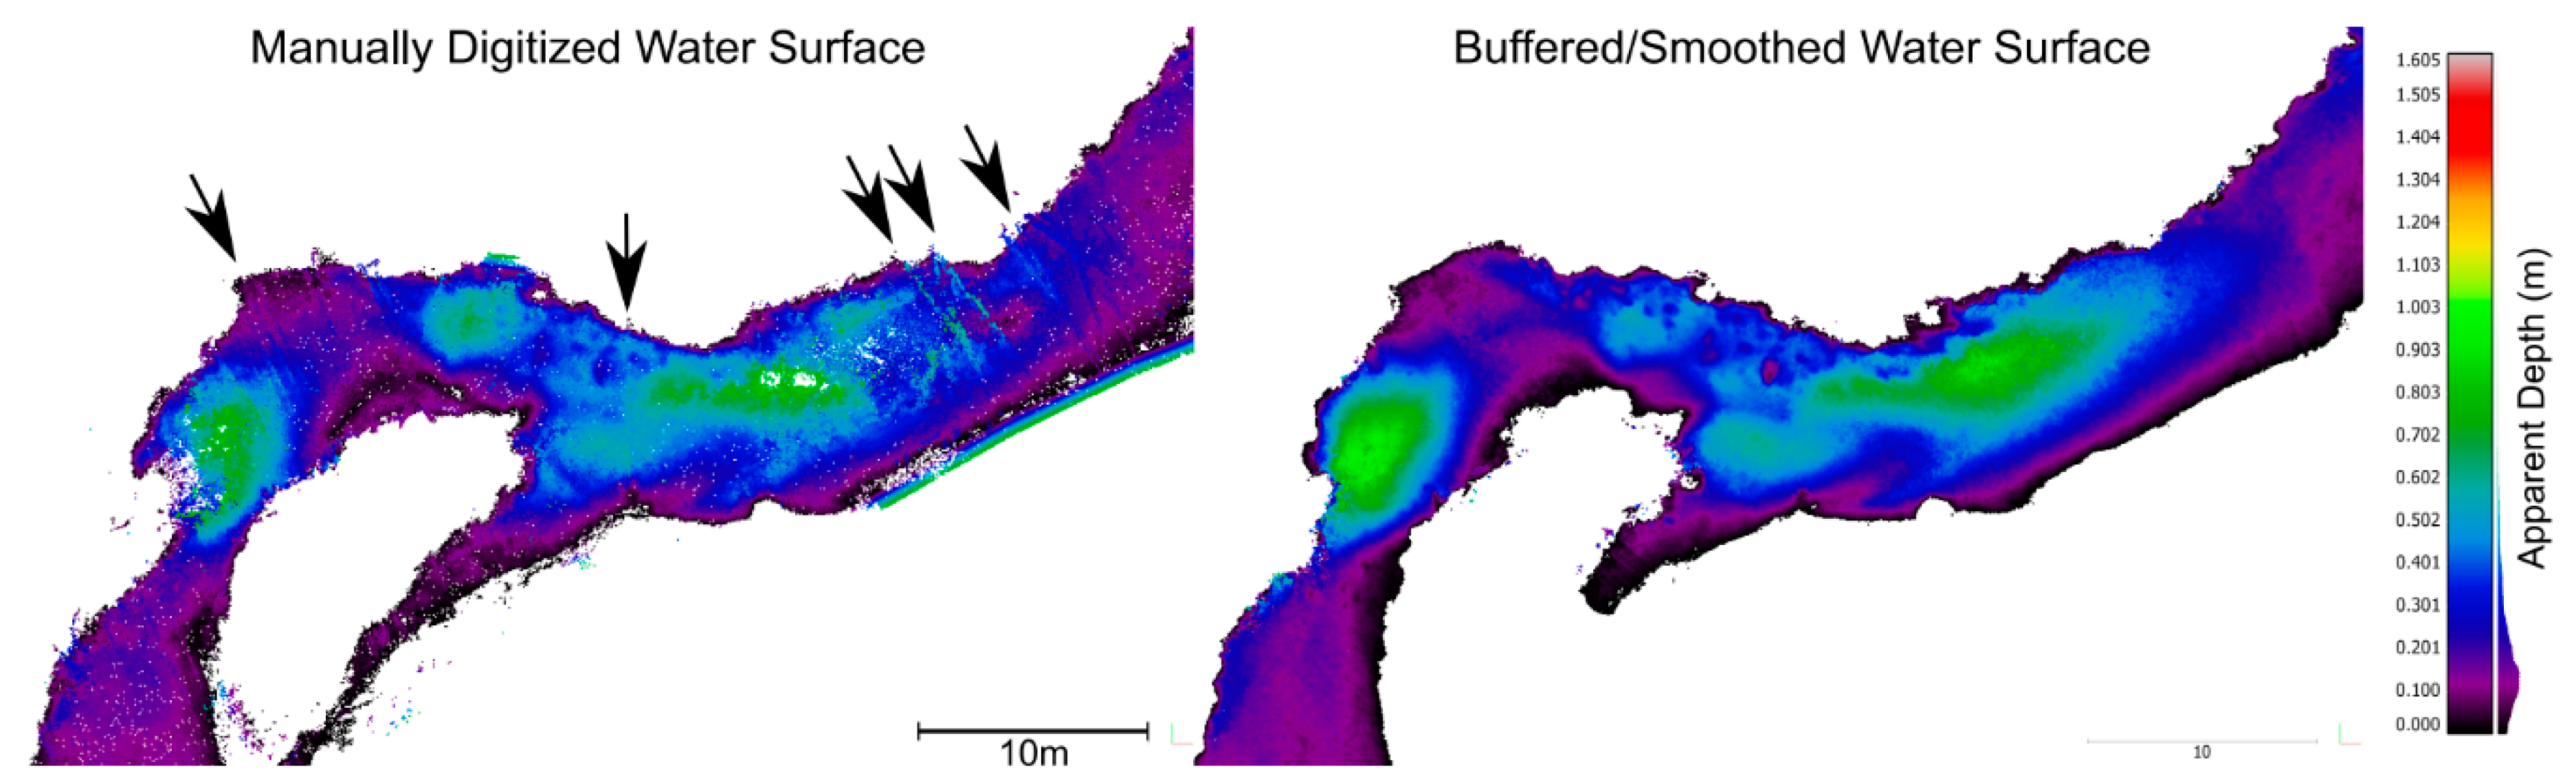
2.5. Water Surface Elevations

Water surface elevations are a critical variable in any refraction correction, since the equations derived from Snell’s Law are in terms of water depth rather than absolute elevations. As discussed in [28], any errors in water surface elevations translate directly as an error into the refraction-corrected depths and, ultimately, the refraction corrected elevations. As in other studies, we choose to approximate the water surface as planar in the cross-stream direction (bank-to-bank) and spatially variable in the downstream direction.
For each dataset, we digitised polyline features at the approximate edges of the water surface. The digitised lines tended to be along areas of exposed sediment where the water’s edges were clearly visible. In the riffles, where the flows were more complex, the polylines followed the main channel (majority of the flow) and in the side channels, additional point features were digitised at regular intervals (~1–2 m) along the water’s edge. The side channel points were not used in the smoothing operation below but were used in the final water surface interpolation.
To extract the elevations along the polyline features, we created a 1 cm buffer polygon on each line segment. The buffer polygons were used to select and extract data points directly from the SfM point clouds in CloudCompare. For the side channels, for all point features, an elevation value was assigned by taking an average of the five nearest point cloud points.
The nature of the extracted point cloud points, with variable elevations at the scale of individual sediment clasts, necessitated that the data be statistically smoothed to generate an average downstream elevation profile that approximated the water’s edge. Downstream distances were assigned to all of the extracted points using a stream normal coordinate transformation [63], where the edge points are transformed into coordinates with downstream (along a centreline) and cross-stream (orthogonal to the centreline) components while also retaining their original X, Y, and Z coordinates.
We tested seven different statistical smoothing filters, mostly in the “local polynomial” class of filters. These included Loess and Lowess, along with their robust counterparts, Savitzky–Golay, Gaussian, and Moving Average. The filtering combined both right and left bank points to best estimate the planar cross-stream elevations. All these filters operate via a smoothing window. The optimal window size for each was determined by trial and error, qualitatively judging the fit quality, e.g., preserving known downstream variability, while suppressing high-frequency “noise” and outliers. Once the windows were optimised, the downstream water surface elevation profiles from the seven different filters were compared to determine the best fit for the given set of input data.
To generate the final water surface for each dataset, we resampled the smoothed profiles at 2 m intervals downstream. The 2 m intervals were along the centreline of the stream and we constructed orthogonal cross-section lines that extended beyond the banks at each interval (Figure 3). The attributes of each 2 m interval point were copied to new point features at the both ends of the cross-section lines. We combined the 2 m interval points with the original side channel points and used a Delaunay triangulation to interpolate all the points into a coherent water surface mesh. For the multi-view refraction correction processing, the mesh was used to calculate apparent depths in the point cloud via a Point-to-Mesh distance calculation. For the small angle correction, the mesh was “rasterised” into a 5 cm cell size GeoTIFF, and the apparent depths calculated by raster subtraction. We assessed the performance of this smoothed water surface by direct comparison with a manually digitised water surface (generated as per [27]), through validation of the derived submerged elevations obtained by the small angle refraction correction procedure outlined below.

2.6. Refraction Correction

In our SfM data, the submerged portions of the point cloud are impacted by the refraction of light at the air–water interface. The result is that the submerged point elevations are too shallow (Figure 4). These points therefore represent the apparent depth ( h a ) based on the water surfaces described above. To correct the point cloud, we used algebraic manipulations of Snell’s Law ( n 1 sin i = n 2 sin r ) to adjust the apparent depth to the “true” depth ( h ).

2.7. Small Angle Refraction Correction

For the small angle refraction correction process, we imported both the ‘old’ and the ‘new’ water surface elevation models into GIS as a raster, alongside the orthophoto and DEM outputs from the SfM process. Following the method of [27], the DEM elevations were subtracted from the water surface elevations to estimate the apparent water depth ( h a ) for each epoch of data. The refraction correction is calculated using the “small angle substitution” by assuming the angles ( r   and   i ) are less than 10°. From this assumption, the sines in Snell’s Law can be substituted with the tangent ( sin θ   tan θ ) d Snell’s Law simplifies to the refractive index of water (1.34) multiplied by the apparent depth:
h = 1.34   × h a
Thus, in GIS, the apparent water depth raster layer is multiplied by 1.34 to create a new, refraction corrected depth raster ( h ). The difference between these two depth rasters ( h h a ) is computed, and the result is subtracted from the original DEM to get corrected absolute elevations. This has the effect of lowering the channel elevations in submerged areas, to counter the underestimation of true bed elevations which occurs as a result of refraction. This process was carried out twice, using first the ‘old’ water surface and then the ‘new’ water surface, so that we could compare the two surfaces directly.

2.8. Multi-View Refraction Correction (BathySfM)

The multi-view refection correction is described in-depth in [28]. With this new research, the software was updated and renamed (now called ‘pyBathySfM’), and is available for download on Github [43]. The new version has additional options and a new graphical user interface to make the tool more user-friendly. The minimum inputs for the bathymetric correction are designed to be software agnostic and include: (1) A point cloud dataset (in CSV format, with a water surface elevations attribute added), (2) the camera positions/orientations (X, Y, Z, Pitch, Roll, Yaw), (3) sensor description (focal length, sensor size [physical and pixel size]). The software calculates all of the points that each camera “sees” in its field of view (calculated via a pinhole camera model). For each point–camera combination, the horizontal distance ( D ) and difference in elevation ( d H ) are calculated and used to derive the angle of refraction ( r ). The point elevation ( Z a ) is subtracted from the water surface elevation ( W S z ) to get the apparent depth ( h a ). From these variables, the other variables in Figure 4 can be calculated (via basic trigonometric functions) and incorporated into the equations derived from Snell’s Law to calculate the true depth ( h ):
h =   x tan i =   h a tan r tan [ sin 1 ( n 2 n 1   sin r ) ]
where i is the angle of incidence, n 1 is the refractive index of fresh water (1.34), n 2 is the refractive index of air (1.0). The average true depth for each point can then be subtracted from the water surface elevation to give the corrected bed elevation of the point ( Z p = W S z   h ¯ ).
As discussed in [28], because each point has a fixed apparent depth with variable refraction angles to each camera, there is a different true depth calculated for each refraction angle (camera). The range of values is small at shallow depths and grows with depth. A range of descriptive statistics (e.g., mean, median, mode, percentile ranks) has been explored and we find that the mean value of all of the calculated h values for each point provides the best statistic. During the course of this research, we found decreased accuracy when the refraction angles ( r ) were higher (>35° off-nadir). These high refraction angles correspond to greater point–camera distances, and also an increase in the amount of water the camera must ‘see’ through to estimate the bed surface. We decided to incorporate a filtering function into the software to add additional output that uses a limited set of the calculated h values, in our case those less than 35° off-nadir.
The output of the multi-view refraction correction is a new point cloud (CSV) that retains all the original attributes and new columns for h a , h , and the corrected absolute elevations ( Z p ).

2.9. Refraction Correction Validation

Using the validation points that we collected in the field (Figure 2), each of which has precise XYZ coordinates, we assessed the accuracy and precision of our models by subtracting the modelled elevations from the validation point elevations. A small number of outliers were identified and excluded from further analyses. The outliers occurred predominantly in areas of overhanging or dense vegetation over the submerged areas. We then subdivided our datasets into the following categories to quantify the distribution of errors resulting from each approach:
5.
Exposed: Exposed areas only, where no refraction correction was necessary.
6.
SmallAngle–Manual: Submerged areas only, using the small angle refraction correction (Equation (1)) and the manually digitised water surface elevations.
7.
SmallAngle–Smooth: Submerged areas only, using the small angle refraction correction (Equation (1)) and the smoothed water surface elevations.
8.
BathySfM–All: Submerged areas only, using the multi-view refraction correction and the smoothed water surface elevations.
9.
BathySfM–Filtered: Submerged areas only, using the angle and distance filtered multi-view angle refraction correction and the smoothed water surface elevations.
We produced histograms and scatterplots to visualise the error distributions and calculated a variety of error statistics as measures of accuracy and precision. We compared the differences in mean errors and standard deviations between approaches to compare the different water surfaces and different refraction correction approaches. We compared the error statistics for all submerged datasets with those obtained for exposed areas, which to date have typically been much more accurate than those reported for submerged areas [27,28].

2.10. Spatially Variable Errors

We began our assessment of spatially variable elevation error by extracting several parameters at the location of each validation point, from both the 2016 and 2017 surveys. Table 1 details each of the 11 parameters and how they were extracted from the RPAS–SfM datasets. We chose these variables because they have been used previously for thresholding error when computing geomorphic change (e.g., [1]) or because we suspected that they have a bearing on error based on our prior experience. In addition, we computed the variability of some parameters (slope, roughness, image quality) within a 0.2 m circular window around each validation point, by extracting the maximum, mean, and standard deviation of values within this window. We performed this step using the Focal Statistics tool within ArcGIS (ESRI Inc.). The purpose of this step is to highlight how positioning errors in X and Y translate into elevation (Z) errors, particularly in areas where elevation changes rapidly (i.e., areas of high slope or roughness). For example, in theory, where there is a large range in slope angle and roughness values within the 0.2 m circular window, we expect greater topographic complexity and, therefore, also potentially greater elevation errors.
We tested our theories by assessing individual linear relationships between each variable and the associated error values obtained from our validation data. We also pioneered a new approach for predicting the spatial variability in elevation error, by combining variables together using multiple regression and through the use of machine learning classification algorithms.
We note that, where applicable, we used the DEMs and point clouds derived from the BathySfM–All refraction correction procedure and the smoothed water surfaces to generate the variables specified in Table 1. Given the lack of a consistently superior refraction correction approach (as reported in the results section below), this choice was subjective and one of the other approaches could have been chosen instead.

2.11. Multiple Regression

The variables listed in Table 1 were considered for inclusion in a multiple linear regression against the elevation errors computed using the validation data. Variables were assessed for collinearity; where two variables demonstrated a strong correlation (defined as having an R2 greater than 0.7), the variable with the weaker relationship with elevation error (as determined by single linear regression) was excluded from further analyses. This was necessary, given the strong correlations between variables such as roughness and focal roughness. The remaining continuous variables (max. slope focal, min. slope focal, water depth, point density, mean image quality focal, roughness focal, and tie point precision) were standardised by dividing by their standard deviation. Binary variables (vegetation, shadows, reflections) were not standardised. We used MS Excel to run a multiple regression using the chosen variables against (a) elevation errors, where both magnitude and direction of error are considered, and (b) absolute elevation errors, where only magnitude of error is considered. We performed multiple regressions on the 2016 and 2017 validation data separately and combined. We judged the performance of the multiple regressions by considering the multiple R, adjusted R square, standard error, and significance values.

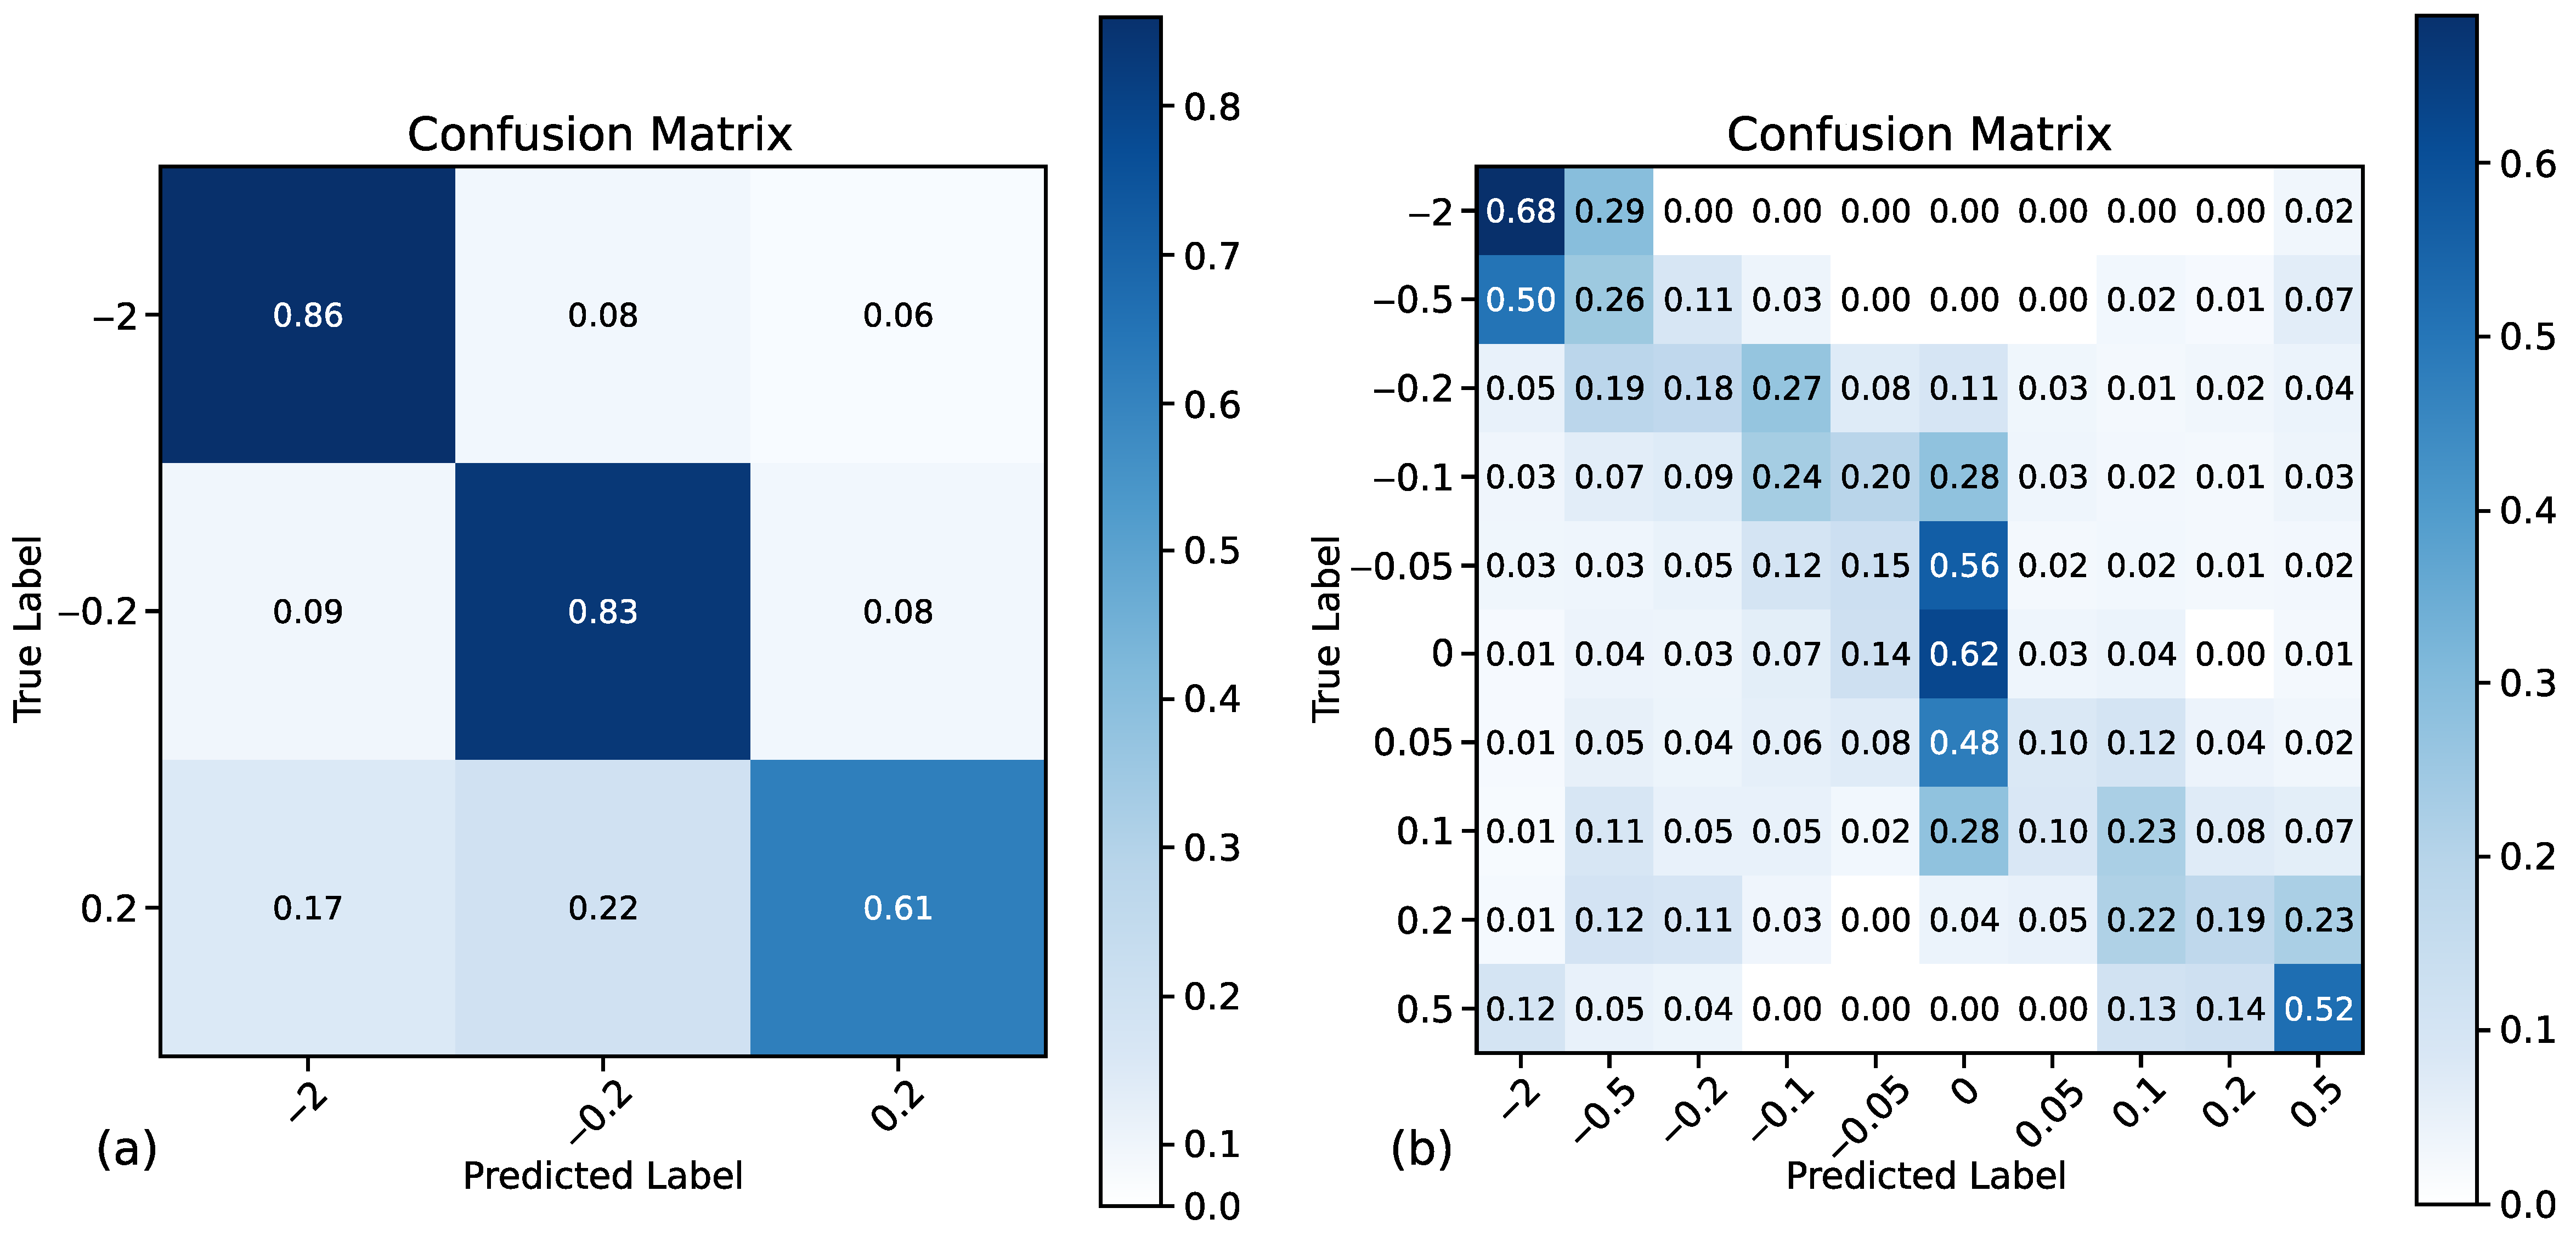
2.12. Machine Learning Classification

For the first time in geomorphic change detection studies, we also investigated the potential of a machine learning classification approach for predicting elevation error for each validation point using the explanatory variables listed in Table 1. We had initially trialled an ML approach which aimed to predict absolute error values (rather than error categories), but we found that significantly larger training datasets would be required to produce meaningful outputs. Therefore, we binned the values into two sets of error classes: A set of 3 classes (<–0.2, –0.2 to 0.2, and >0.2, representing high magnitude negative error, low magnitude error, and high magnitude positive error) and a set of 10 more detailed classes (<–0.5, –0.5 to –0.2, –0.2 to –0.1, –0.1 to –0.05, –0.05 to 0.0, 0.0 to 0.05, 0.05 to 0.1, 0.1 to 0.2, 0.2 to 0.5, >0.5). This turns the problem into a classification problem, rather than a regression problem.
We started by performing an initial investigation of appropriate classification approaches using the Tree-based Pipeline Optimization Tool (TPOT; [64]), which uses a genetic algorithm to search across multiple common classification algorithms. Manual tweaking based on the TPOT results was used to obtain the best balance of accuracy and pipeline complexity. The resulting classifier was a Gaussian Naïve Bayes classifier using all components of a Principal Components Analysis transform of the explanatory variables as input, using the methods implemented in scikit-learn v.0.20.3 [65]. Separate models were created based on the 2016 validation data, the 2017 validation data, and the combined 2016 and 2017 data. During the ML phase, we observed that the class distributions in the training data were strongly imbalanced (e.g., for the three-class problem with the 2017 data, 90% of the validation points were in the central class). This meant that the classifiers were able to achieve a very high accuracy by simply always predicting outputs within this one class. To combat this, we oversampled the training data using the SMOTE algorithm [66], as implemented in the imblearn v.0.4.3 package [67]. Next, we used a stratified five-fold cross validation procedure for assessing the repeatability of the classification. We observed significant variation in results between runs due to very small numbers in some of the classes (particularly for the ten-class problem). As a result, we ran the five-fold cross-validation procedure five times and averaged the results. After this development and validation of the ML approach, we applied the models to the full raster datasets using the rasterio package [68] to handle raster processing. Finally, we assessed the performance of the ML classifier by comparing predicted outputs with those remaining in the validation dataset to compute overall accuracies and class-specific accuracies, the latter being displayed as confusion matrices.
All machine learning analysis was carried out using Python 3.7.1 using numpy v.1.16.2 [69], pandas v.0.24.1 [70], matplotlib v.3.0.3 [71], and Jupyter Notebook v.5.7.4 [72]. Our code is also available to download [73].

2.13. Error Propagation and Change Detection

To detect geomorphic change between the two epochs of data, we subtracted the earlier refraction-corrected elevation dataset (2016) from the later one (2017) to create a DEM of difference (DoD). For both epochs, we used elevation data which had been corrected for refraction in submerged areas using the BathySfM–All method. This choice was subjective, given that complex patterns of performance which exist between the different refraction correction methods (Table 5) and another method could have been chosen instead. To isolate real geomorphic change from noise within the derived DoD, we test the implementation of our multiple regression method for predicting spatially variable error. We had initially also intended to threshold the DoDs using the outputs from our machine learning classification approach. However, as detailed in the results, these outputs were not sufficiently robust for the detailed ten-class problem to be used for error propagation purposes. Still, we provide a map of error predictions from the three-class problems for comparison purposes in Figure 9.
First, we used the variables associated with each data epoch (Table 1) to predict the magnitude and direction of elevation error using the multiple linear regressions. We chose to predict both the magnitude and direction of error to maximise the reliability of error propagation during the subsequent quantification of elevation change. We took all input variables as raster layers in GIS and used Equation (3) to predict elevation error ( S V E ) for every pixel in the respective epochs of data, where MaxSf and MinSf are maximum and minimum slope angles within the 20 cm focal window, h is refraction corrected water depth (using BathySfM–All), D is point cloud density, MeanCQf is mean image quality within the focal window, MeanRf is the mean roughness within the focal window, P is tie point precision, V is vegetation presence, Sh is the presence of shadows, Rc is the presence of surface water reflections or water surface roughness, σ is the standard deviation of each variable (computed from the validation data for both epochs), a–g and i–k are the co-efficients associated with each variable, and θ is the intercept.
S V E = a ( M a x S f σ M a x S f ) + b ( M i n S f σ M i n S f ) + c ( h σ h ) + d ( D σ D ) + e ( M e a n C Q f σ M e a n C Q f ) + f ( M e a n R f σ M e a n R f ) + g ( P σ P ) + ( i × V ) + ( j × S h ) + ( k × R c ) + θ
We performed this computation using the Raster Calculator tool in ArcGIS to output a new raster layer of spatially variable predicted elevation errors for every pixel within each epoch of data ( S V E 2016 and S V E 2017 ). We propagated these individual SVEs into the DoD using the ‘Error Propagation’ tool within the Geomorphic Change Detection v7 plugin for ArcGIS (http://gcd.riverscapes.xyz/). This is based on the approach detailed in Equation (4) [18], where ε D o D is the propagated error in the DoD and S V E 2016 and S V E 2017 are the spatially variable elevation error predictions for each epoch respectively. Finally, we used the GCD toolbox to threshold the DoD on a cell-by-cell basis to quantify the direction and magnitude of change across the entire site.
ε D o D = ( S V E 2016 ) 2 + ( S V E 2017 ) 2

3. Results

3.1. SfM Modelling

The georeferencing accuracy and precision statistics associated with each RPAS–SfM survey are presented in Table 2. An evaluation of the validation points indicated that the errors were normally distributed and not affected by any systematic distortions.

3.2. Water Surfaces

The statistically smoothed water surfaces, derived from the buffered water’s edge points, produced smoothly varying surfaces that provided a better representation of the estimated water surface elevations when assessed visually (Figure 5). This is in contrast to the manually digitised (“point picking”) methods used in past studies [27,28]. By picking individual points (from the raster or point cloud) to represent the water surface, there is an increased chance that small variations in the water’s edge topography (e.g., topographic roughness of digitising blunders) can have a pronounced effect on the water surface elevations. In Figure 5, we see the effect of these digitising errors as cross-stream lines or also cross-stream mesh facets that translate directly into errors in the calculated apparent depth. These apparent depth errors then get transmitted through the refraction correction to the corrected depths.
For each of the smoothing filters, the window size used for smoothing these data was 151 points (from the buffered point cloud points). Since the downstream densities of points were not uniform, the 151-point window size does not correspond to any particular length scale. For others using this method, we suggest testing several different window scales depending on the stream length, point cloud density, and topographic roughness.
The seven statistical filters varied in their representations of the water surface; the most pronounced differences were at transitions into and out of the steeper sections of the study reach. We calculated the range of water surface elevations that each smoothing filter produced along the interpolated centreline of the river. The maximum difference in 2016 was 0.038 m with a mean difference of 0.007 m. In 2017, the maximum difference was 0.18 m with a mean difference of 0.01 m. To illustrate the effect that the different water surface elevations have away from the centreline, we also calculated the range of values at each of the 2016 validation points. For the calculated apparent depth, the maximum difference between the different water surfaces was 0.074 m with an average of 0.006 m. After refraction correction, the maximum difference in the corrected elevations was 0.033 m with a mean difference of 0.003 m. Overall, a qualitative assessment found that the Savitzky–Golay filter gave the best visual match to the water’s edges visible in both years’ orthophotographs.
Table 3 presents the quantitative performance indicators for this smoothed water surface (column 3) compared to the manually digitised water surfaces (column 2) used within the small angle refraction correction calculations for both survey epochs. These results demonstrate an unmitigated improvement in accuracy and precision of submerged elevations with the implementation of the smoothed water surfaces. For the 2016 survey, mean error was reduced by ca. 73% and the standard deviation of error was reduced by ca. 69%. For the 2017 survey, mean error was reduced by 50% and the standard deviation was reduced by ca. 25%. Similar improvements can also be observed in the slope angle of the observed versus predicted relationships and the error ranges (as indicated by the min and max errors).

3.3. Refraction Corrections

Table 3 and Figure 6 present the performance statistics associated with the comparison of different refraction correction approaches. The results in columns labelled 3–5 of Table 3 were all computed using the smoothed water surface elevations and Figure 6 presents only the smoothed water surface results. Here, we observe an inconsistent picture of accuracy and precision between the different refraction correction approaches and data epochs. For 2016, the small angle refraction correction produced the highest mean error (0.041 m) and standard deviations of error (0.065 m), indicating a poorer performance overall. However, for 2017, the poorest performance is observed from the BathySfM–All approach. When assessed by the strength of the observed-versus-predicted relationship (i.e., slope of the linear regression line), the small angle correction seems to perform better than the other correction methods in 2016, albeit with the caveat that the regression line has a slightly negative offset (Figure 6). However, this pattern is not evident in the 2017 data. Similar inconsistencies are observed in the minimum and maximum error values. As such, it is difficult to conclude that one particular refraction correction approach is superior for this particular site. It is important to note, however, that almost all of the approaches using the smoothed water surface provide significantly better representations of the submerged topography than the manually digitised water surface. Furthermore, depending on the exact choice of method, these representations are now typically in line with or better than those obtained in exposed areas.
Because the error statistics (Table 3) and distributions (Figure 6) are quite similar, we employed two statistical tests to evaluate if the errors between the different methods were statistically distinct ( H A ) or came from the same parent distribution ( H ). The tests were a 2-sample Anderson–Darling (AD) and a 2-sample Kolmogorov–Smirnov (KS), both with a p-value threshold of 0.01. For the 2016 corrections, the small angle correction was statistically different than the multi-view corrections using both tests (p = 0.001). However, the two multi-view correction error distributions were not statistically distinct using the AD (p = 0.017) and KS (p = 0.062) tests, meaning that we cannot say with certainty that one method is better than the other. The 2017 corrections were all statistically distinct from one another (p = 0.001).

3.4. Spatially Variable Error

3.4.1. Linear Regressions

Table 4 presents the multiple R values for the linear regressions between each variable and each of two measures of elevation error. The strongest correlations are between variables maximum slope within the focal window (0.52), slope (0.50), and standard deviation of slope within the focal window (0.44) with magnitude-only error. Other variables, including water depth, do not show a correlation with magnitude-only elevation error. When magnitude and direction of error are considered, there is a notable lack of correlation between error and any of the variables considered.

3.4.2. Multiple Regression

Table 5 and Figure 7 present the performance variables associated with the multiple regressions for each epoch of data and epochs combined. All regressions are statistically significant at the 99.9% level. The strongest relationship is between the 2016 variables with magnitude-only elevation error (0.65). Whilst the performance of these multiple regressions (Table 5) is notably better than for the linear regressions for individual variables (Table 4), none of the multiple regression permutations exhibit very strong relationships where the multiple R is greater than 0.7. Standard error is lowest for the 2017 variables and magnitude-only elevation error (0.11 m). Mean residual errors are low (<0.04 m) but the slopes of the observed versus predicted relationships (Figure 7) are far from 1:1. Furthermore, large minimum and maximum residual errors are evident, which push up the standard deviation of residual error (especially for the 2016 dataset). Overall, magnitude-only elevation error is better explained by the variables than is elevation error which has both a magnitude and direction. Combining the 2016 and 2017 datasets degrades the performance metrics in most scenarios.
Both error magnitude and direction (i.e., positive or negative) are necessary for thresholding quantities of change. Therefore, it was these multiple regression relationships, for the 2016 and 2017 datasets separately, which we used to compute spatially variable error using Equation (3), despite their lower multiple R values. Of the variables included in this predictive equation, we found the presence of vegetation to be the most influential: Its exclusion from the multiple regression reduced the multiple R values from 0.54 and 0.53 to 0.42 and 0.35 for the 2016 and 2017 datasets, respectively. The exclusion of most other variables, one at a time, had minimal effect on the multiple R values for both data epochs, yet the inclusion of only the few most significant variables did not produce higher multiple R values than when all variables were included. As a result, we considered it important to include all variables within the multiple regression at this stage. However, future research would benefit from a more thorough exploration of the most significant combinations of variables.
Table 6 details the standard deviation values used to standardise the continuous numerical variables and the co-efficient and intercept outputs of the multiple regressions (Equation (3)). Figure 8 presents the SVE outputs for each epoch and the resultant propagated error.

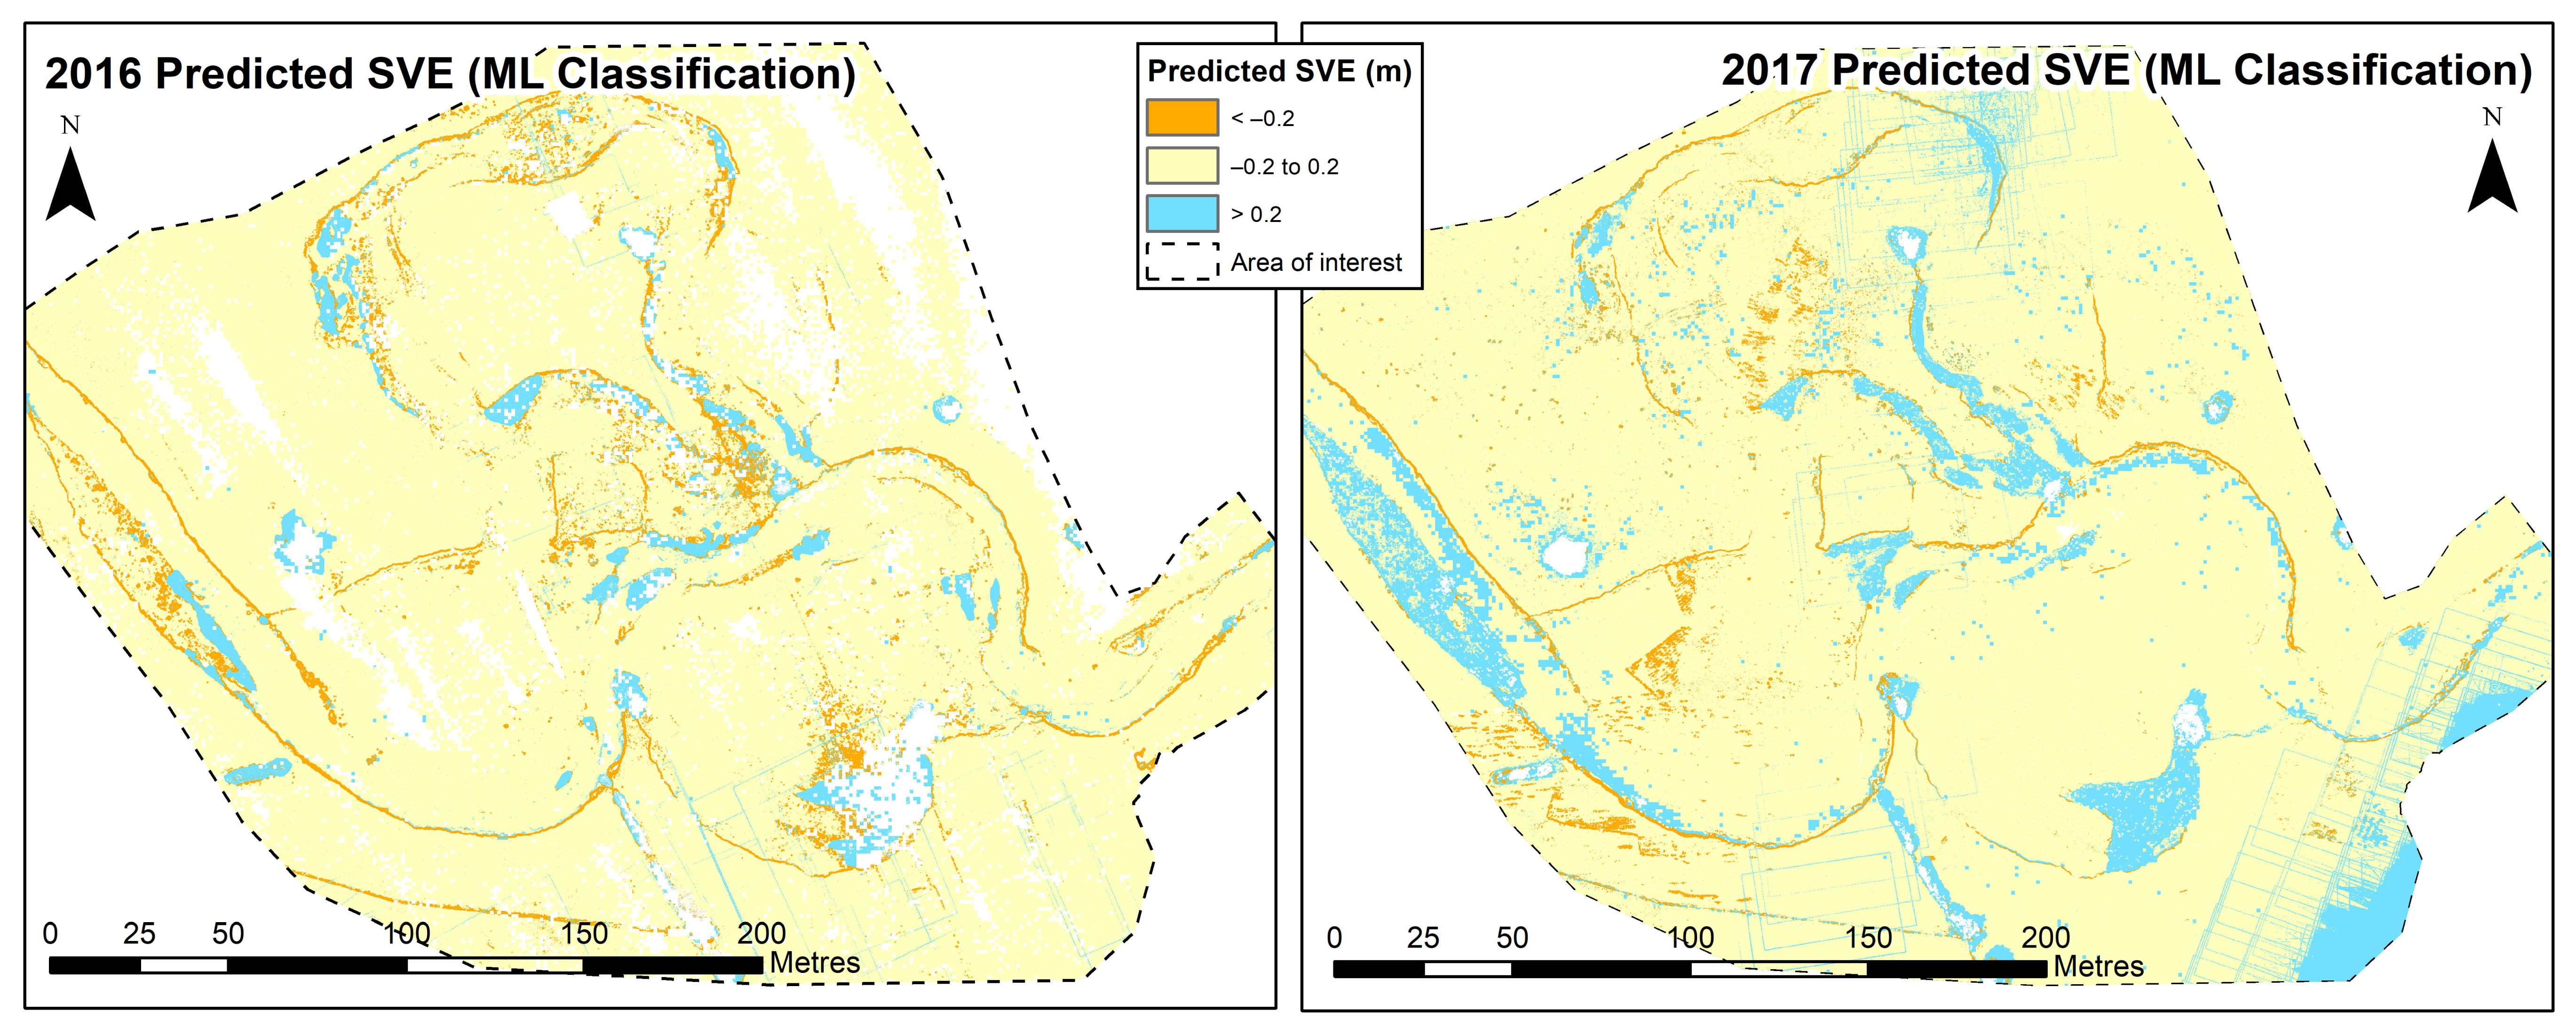
3.5. Machine Learning Classification

Table 7 presents the accuracy results from the ML classification approach. Relatively high accuracies of ca. 75% and F1 scores are returned for the three-class problem, but significantly poorer values are observed for the ten-class problem. There are small differences in accuracy between the different epochs. More detailed information can be seen in the confusion matrices for the 2017 three-class problem (Figure 9a) and the 2017 ten-class problem (Figure 9b). For the three-class problem, these show good accuracy for the lower two classes (>80% accuracy), but a poorer accuracy for the higher class (with misclassifications split between the other two classes). Figure 10 shows the spatial distribution of error predicted using the three-class scenario. The ten-class problem confusion matrix gives highly mixed results, with reasonable accuracy for the lowest class (–2 to –0.5), middle class (0 to 0.05) and the highest class (0.5 to 6.5). The highest levels of misclassification occur for elevations between –0.1 and 0.1, which are often misclassified as being in the 0 to 0.05 class. The confusion matrices for the 2016 dataset and both years combined show similar patterns.

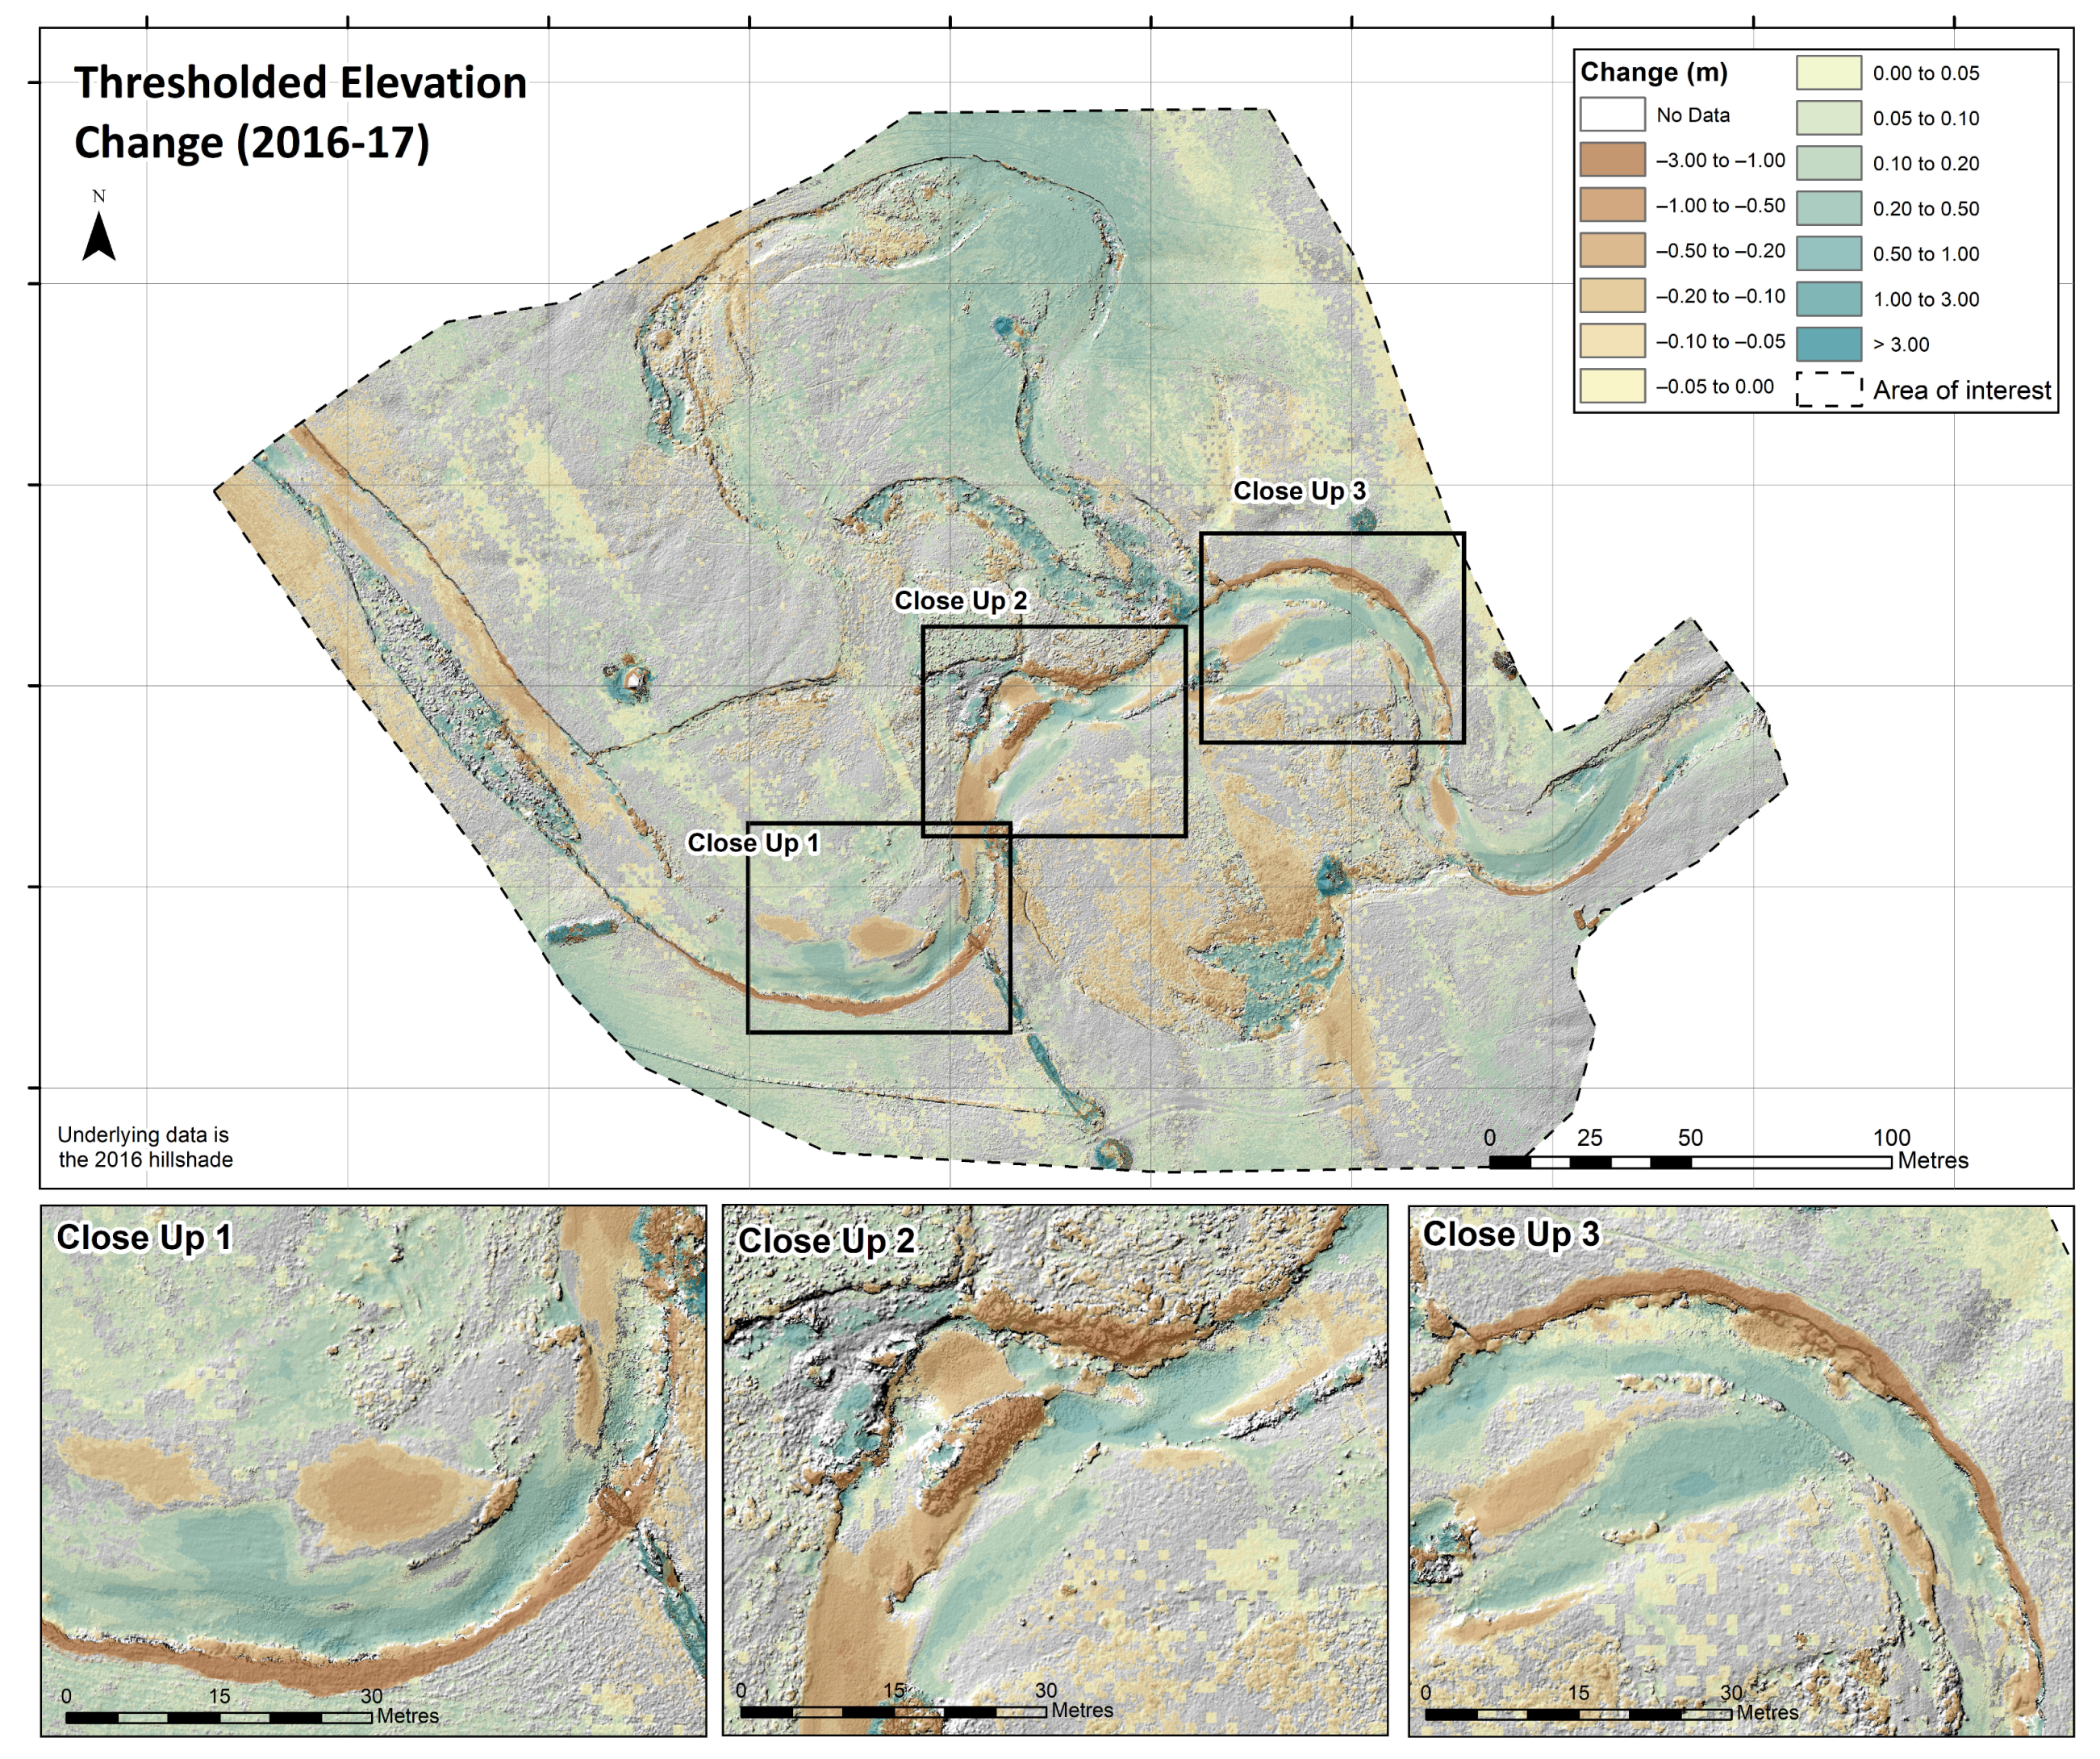
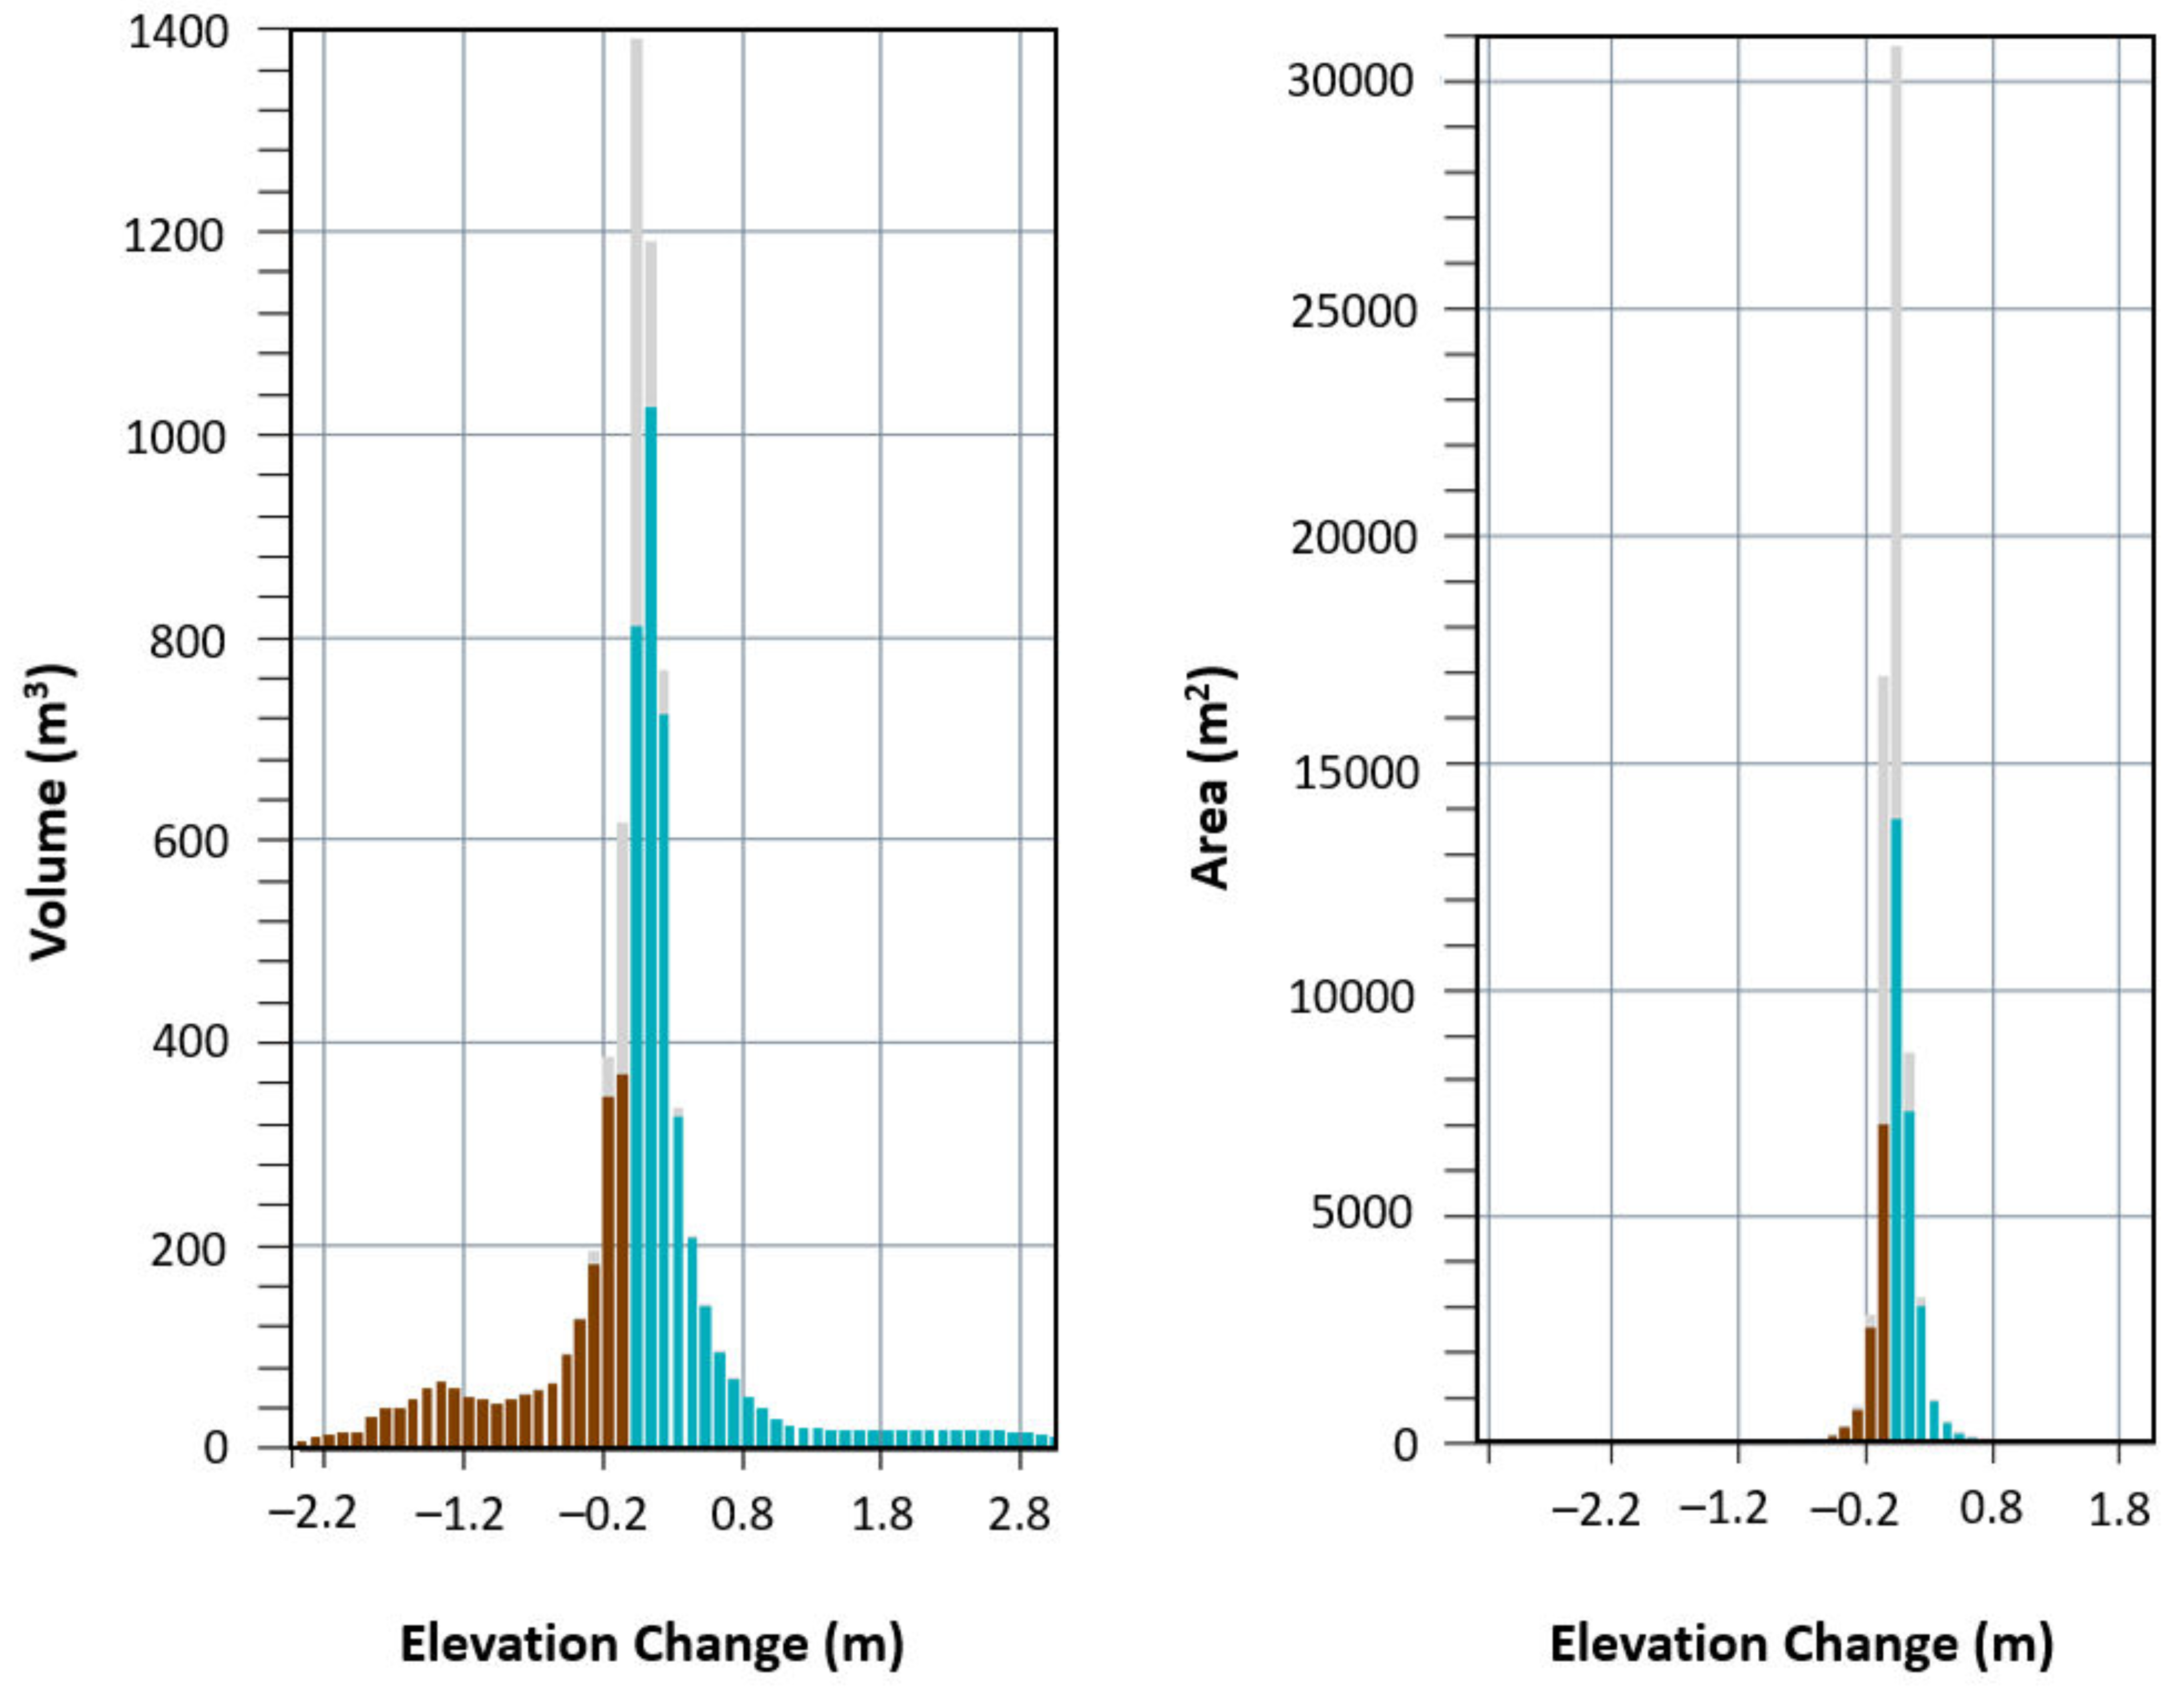
3.6. Geomorphic Change

We used the multiple regression approach as a predictor of the direction and magnitude of elevation errors within our two epochs of data, given the low mean errors associated with this approach (Table 5). We chose not to use the outputs of the ML classification approach on this occasion, given the poor accuracies associated with the ten-class outputs. Whilst the classification results for three-classes are much better, our aim was to predict error with greater precision than is permitted by only three categories of error.
Figure 11 presents a map of geomorphic change at this section of the River Teme, thresholded by our error estimates using the multiple regression approach. Associated statistics which quantify areal and volume change are presented in Figure 12. Over the 1 year period between our surveys, this section of the River Teme experienced a net volume increase of 1155 m3, as indicated by the teal-coloured areas within Figure 11. We note that a proportion of this increase will relate to growth of vegetation (as seen in the vicinity of trees when comparing Figure 11 with Figure 1) and does not solely represent sediment deposition.

4. Discussion

4.1. Refraction Correction

For the first time, our research has demonstrated that our RPAS–SfM refraction correction methods are capable of quantifying above- and below-water fluvial geomorphic change at hyperspatial resolutions, without the need for different methods between exposed and submerged areas or for acquisition of calibration data in submerged areas. This represents a significant time and cost saving compared to existing approaches (e.g., [37]) and has positive implications for surveyor safety, as there is no need to enter the water.
Our accuracy statistics (mean error) indicate that the below-water topographic reconstructions are now broadly as accurate as those obtained in exposed areas, and our precision values (standard deviation) demonstrate that they are significantly more reliable than for exposed areas (Table 3). This may result from a lack of vegetation in submerged areas which generates noise within the point cloud, thereby reducing precision of our topographic reconstructions in much of the exposed parts of the site.
Our results show no consistent pattern of compromise on the accuracy or precision of the topographic data compared with approaches which use different methods in submerged areas and/or those which require calibration data. For example, the accuracy and precision values we report here compare favourably with those reported by [37] and [42] (Table 8), where optical calibration approaches or site-specific refraction correction coefficients are used in submerged areas—both of which require extensive calibration data collected in-channel. Comparison of our results with those of [38] present a mixed picture, with our mean error and standard deviation values being higher but RMSE values being broadly comparable. Further exploration of this is restricted by the limited density of validation points and a lack of information on validation point distribution and water depths within the work of [38].
For the first time, our research has also demonstrated minimal differences in performance of the small angle and multi-view refraction correction methods applied at this site [27,28]. This suggests that either of these methods may be implemented by those wishing to produce similar outputs at their sites, assuming that the basic caveats for successful implementation are met (i.e., predominate camera angles [nadir vs. off-nadir], clear water, water depths < ca. 1.5 m, minimal water surface roughness). Those with a background in GIS may prefer to implement the small angle correction, whilst those familiar with running Python code may prefer the multi-view approach (the latest version has a user-friendly graphical interface). Here, we prefer to use the multi-angle approach as detailed in our GitHub repository [43] as it offers the flexibility to work with large, high-resolution 3D point clouds (rather than 2D rasters) and modify by parameters such as camera view angles, as we used within our BathySfM–Filtered scenario. We suggest that future research should focus on the comparison of these methods over a wider range of study conditions. In particular, establishing, quantitatively, the range of settings in which our refraction correction methods can be applied successfully is of importance. Dedicated laboratory and field experiments which aim to determine the limits of water depth, clarity, and surface roughness would be beneficial and would allow a quantification of the percentage of river environments in which our methods are applicable. Such data will be key for understanding the value of our methods for routine river monitoring and management purposes on a larger scale. Further exploration of the importance of camera view angles would also help inform routine RPAS surveys in such scenarios.

4.2. Water Surface Elevations

Our second key finding is that accurate water surface elevations are critical for accurate refraction correction in submerged areas and are capable of reducing mean elevation errors by 50–73%. Therefore, we recommend the use of our improved water surface estimation approach for all those wishing to reconstruct submerged fluvial topography using RPAS–SfM derived data.
Specifically, our investigations suggest the use of a Savitzky–Golay filter within a smoothing window produces the most accurate results; however, the low variability between the smoothed water surfaces would suggest that the local polynomial regression filters in general (Savitzky–Golay and normal/robust Loess and Lowess filters) are a good choice for characterising the water surfaces. The other filters that we tested (Moving Average and Gaussian) accounted for a large portion of the variability reported in the results, so these filters are not recommended.
One of the key variables in developing these filters is the smoothing/sampling window. In our dataset, the best results came from a 151-point smoothing window. We settled on this window via a trial and error process, along with a qualitative assessment of the “best-fit” of multiple smoothing window sizes. For other datasets, we would encourage researchers to test multiple filter windows to find the most appropriate size for their data. One of the challenges in choosing the correct window size was that smaller window sizes had a tendency to create “uphill” water surfaces in certain sections, influenced by small outliers in the edge point data. In our case, the larger window sizes helped moderate the influence of small-scale variations in the edge points.
Whilst this methodology represents a notable improvement over past studies (i.e., [27,28]), there remain some limitations. The method still relies on having clearly identifiable banks and bars to have sufficient data to perform the statistical smoothing. In river environments where the banks are heavily vegetated or the channel is incised and there are no visible banks, extracting enough information to utilise this method will be challenging. The assumption of a cross-stream planar water surface is a reasonable approximation for most streams, but there are situations where deviations from this assumption could impact the results. Super elevation of the water surface on the outside of meander bends would cause water surface elevations to be higher on the outside of the bend and potentially lower on the inside. In-stream features that cause local hydraulic disturbances (e.g., exposed and submerged sediment clasts, standing waves, or dune bedforms) will also cause locally variable water surface elevations that are not accounted for in our approximation.
Future work should focus on validating this methodology with detailed surveys of the water’s edges, along with direct measurement of the water surface. The ultimate goal will be to develop methods and/or sensors that have application across a wide range of river types and that can be used to extract the water surface elevations, thereby enabling researchers to apply bathymetric corrections over longer river segments without the need for in situ water surface measurements. This will subsequently permit the collection of extensive measurements of river system variables.

4.3. Spatially Variable Error for Geomorphic Change Detection

Our third key finding is a lack of linear correlation between any individual variable and elevation error. This finding is not surprising, given numerous factors are known to contribute to such errors. It reinforces the existing observations that levels of detection used to threshold geomorphic change (in both magnitude and direction) in such settings should not be informed by single variables alone [1,48]. Furthermore, the lack of correlation between error and water depth evidences the success of our improved water surfaces, combined with our refraction correction approach. Previous studies had failed to break down this correlation so successfully (e.g., [27]).
Fourth, we find that multiple linear regressions (which regress elevation error against a combined total of 11 RPAS–SfM-derived variables) are capable of explaining up to 54% of the magnitude and direction of elevation error in our topographic surveys. This is in a scenario where we have controlled for sources of error within the SfM process in so far as is possible/known at the current time (including use of sufficient GCPs which are adequately distributed, a precise internal control network, and both oblique and nadir RPAS imagery to mitigate against systematic camera lens distortions). These multiple regressions allow us to model the spatial variability of error with mean accuracies of 0.01–0.04 m and standard deviations of 0.14–0.22 m. To our knowledge, this is the first such model of spatially variable elevation errors in RPAS–SfM surveys in a geomorphological setting, which allows us to quantify and threshold geomorphic change with a known level of accuracy and precision.
In the last few years, the RPAS–SfM approach has been described as a ‘game-changer’ for quantitative 3D analyses in geomorphology. Despite this, comprehensive, spatially-continuous, quantitative estimates of associated elevations errors at very high spatial resolutions have been lacking. Thresholding calculations of geomorphic change using spatially variable elevation errors is critical for the accuracy and reliability of subsequent quantitative analyses and decision making in a management context. Therefore, we anticipate that with further testing and development of our model over a range of different topographic settings, landscape compositions, and survey qualities/conditions, it has the potential for routine application for error estimation within the RPAS–SfM workflow. However, further testing and development is required to improve on the current limitations of our approach. For instance, we note that 46% of elevation error remains unexplained by our model, and therefore unaccounted for within our maps and statistics of geomorphic change. Whilst mean residual errors are low, we also report notably large minimum and maximum residual elevation errors within our resulting predictions of spatially variable error (Table 5). Such large residual errors are rare (e.g., 85% (2016) to 92% (2017) of validation points have residual errors of ± 0.2 m) but deserve greater attention in future, as they tend to occur in areas of greater geomorphic complexity. Furthermore, we observe a significant lack of a 1:1 relationship between observed and predicted elevation error, as indicated by the slope values in Table 5 and Figure 7. We suspect that these poorer results relate to a number of key limitations to our approach:
Our method assumes a linear relationship between error and the included variables. Whilst this may be appropriate for some variables, such as slope or roughness, it makes less sense for the binary variables, such as vegetation and reflection/surface roughness. In future, rather than noting the presence or absence of vegetation, it may be worth exploring the inclusion of a continuous numerical variable like vegetation height above ground level. Whilst this is less easily computed using RPAS–SfM surveys than airborne LiDAR, for instance, the interpolation or extrapolation of terrain elevations across vegetated areas may go some of the way to ameliorating this current issue. This is likely to be easier in areas of reduced geomorphic complexity, such as for relatively flat floodplains rather than deep-seated landslides.
Our method does not account specifically for elevation error resulting from uncertainties in the co-alignment of the RPAS–SfM surveys with the calibration/validation data. This gives rise to the well-documented situation whereby the magnitude of elevation error is strongly influenced by slope (where relatively small offsets in X and Y result in large errors in Z). However, slope does not lead to a consistent positive or negative elevation error because the orientation of the slope varies in relation to the direction of the XY offset. This goes part of the way to explaining why our multiple regression, which predicted magnitude-only error, outperformed that which attempted to predict both magnitude and direction of error. [49] and [74] suggest that the alignment of elevation data as point clouds using cloud-to-cloud registration or the M3C2 algorithm [21] within CloudCompare can ameliorate this issue and suggest that in future, the calibration/validation data used to develop and test models of spatially variable error should be available as point clouds. We anticipate that calibration/validation data which is larger and denser than our total station survey may be required here, such as that obtained using terrestrial laser scanning. This should be a priority for subsequent development of our model.
To give an indication of the impact of these limitations, we re-ran our model, this time excluding all validation points which fell within areas of dense vegetation or water surface reflections/roughness and/or on slopes of greater than or equal to 70 degrees. The output was a reduction in mean residual error of elevation error predictions from –0.04 to –0.03 m for the 2016 dataset and from –0.01 to –0.003 m for the 2017 dataset. Improved precision values were also observed: from 0.22 to 0.11 m (2016) and 0.16 to 0.09 m (2017). The slopes of the observed versus predicted elevation error relationships (Figure 7) were reduced from 0.1297 to 0.0327 (2016) and from 0.1666 to 0.0964 (2017). This suggests that, as we begin to remove the larger elevation errors from the model (resulting from dense vegetation, steep slopes (i.e., XY offsets) and reflections/roughness), we remove the systematic offsets which the model has ‘learnt’ and are left with what is likely to be random noise.
Whilst we can realistically aim to reconstruct systematic errors (or bias) within models, we will never be able to predict random errors (noise). For this reason, [1] argued that a deterministic model of elevation error can never be constructed unambiguously. As a result, they use a fuzzy inference system for error estimation based on membership of their GPS validation data to three functions: Slope, point density, and point quality. We suggest that a deterministic prediction of error is possible to an extent and, so long as we keep in mind the occurrence of random error in addition to the error we predict, that implementation of a model such as ours is appropriate. With the advent of artificial intelligence, we believe it is only a matter of time and effort, in collating sufficient and appropriate evidence, before machine/deep learning approaches are capable of predicting systematic errors within RPAS–SfM elevation datasets routinely.
Our initial findings suggest that variables associated with topographic complexity and landscape composition (e.g., slope, vegetation) have a greater bearing on elevation error than do variables associated with the SfM process itself (e.g., tie point precision). However, we also note that the relationships between these different variables are complex. For example, the SfM process relies on image texture for tie point identification, yet texture is itself determined by the composition and complexity of the landscape being surveyed. [49] argues that point cloud topographic datasets, thresholded by SfM tie point precision and aligned using the M3C2 approach produce “the most plausible distribution of topographic change” ([49], p. 1782). These results could be interpreted to mean that SfM tie point precision is the most reliable predictor of elevation error in RPAS–SfM surveys. However, whilst [49] accounts for horizontal offsets in this approach, they do not specifically explore the influence of other variables on elevation error. Furthermore, their judgement of the most ‘plausible’ approach is based on qualitative expectations of change at their site, rather than quantitative evidence collected contemporaneously. As such, we suggest that further investigation into the relative importance of a wide range of different variables on elevation error is required, with particular focus on how we might reduce or eliminate such errors. Within this paper, we have demonstrated such an approach for reducing topographic error which results from the presence and depth of water.
Our final key finding is that the machine learning classification approach implemented here is successful only in predicting elevation error within three broad classes: ‘High negative error’, ‘high positive error’, and ‘low error’, with overall accuracies of >75%. Whilst such a classification may be helpful in some broader scale analyses of change, our aim was to develop a method of quantifying spatially variable elevation error more precisely in order to threshold measures of geomorphic change at the high spatial resolutions provided by RPAS–SfM surveys. We anticipate our approach was significantly restricted by the size of the training dataset, which was particularly lacking in data points representing the larger elevation errors. Within the geomorphic-remote sensing community, the collection of validation/training data using traditional surveying approaches (e.g., total station/GPS surveys) is well established. However, as we move towards the exploration of more complex artificial intelligence (AI) tools for developing such predictive relationships, it is likely that we will need to acquire validation/training data on a completely different scale. That is, AI/ML approaches typically require millions of data points to ‘learn’ from, rather than the hundreds or thousands we might employ for standard regressions. Acquisition of such large datasets at scales comparable to high resolution RPAS surveys will require the use of terrestrial or airborne laser scanning. We anticipate that a more advanced ML approach, of which we are already seeing more widespread application within geomorphological fields (e.g., [75]), in combination with a significantly larger training dataset, will facilitate the development of a much improved AI model for predicting spatially variable elevation error for any given topographic dataset derived from the RPAS–SfM workflow.

5. Conclusions

In this research, we have shown that we are able to quantify submerged geomorphic change at levels of accuracy commensurate with the exposed areas of our river system with a single photogrammetric approach and without the need for calibration data. For the aerial imagery we collected (predominantly nadir views), there are minimal differences in results produced by different refraction correction procedures (small angle vs. multi-view), which may allow users a choice of software packages/processing complexity depending on their research objectives. Our improvements to estimations of water surface elevations with statistical smoothing in the downstream direction are critical for accurate topographic estimation in submerged areas and can reduce mean refraction corrected elevation errors by up to 73%. We have shown that machine learning, in the form of multiple linear regressions between error and 11 independent variables, can be used to generate high resolution, spatially continuous models of geomorphic change in submerged areas, constrained by spatially variable error estimates. Our machine learning model is capable of explaining up to 54% of magnitude and direction of topographic error, with accuracies of less than 0.04 m. With on-going testing and improvements, this machine learning approach has potential for routine application in spatially variable error estimation within the RPAS–SfM workflow.

Author Contributions

Conceptualization, A.W.; formal analysis, A.W., J.D., and R.W.; funding acquisition, A.W.; investigation, A.W. and J.D.; methodology, A.W. and J.D.; software, J.D. and R.W.; supervision, A.W.; validation, A.W. and J.D.; writing—original draft, A.W., J.D., and R.W.; writing—review and editing, A.W. and J.D.

Funding

This project was supported in part by funding from the University of Worcester (UK), where Amy Woodget was previously based.

Acknowledgments

We gratefully acknowledge the field assistance of Paul Attwood, Robbie Austrums, James Atkins, Fleur Visser, Mark, Sally and William Woodget, Carlos Puig-Mengual, Cat Fyffe, Steve Dugdale, Katie Long, and John Powell. We thank Mike James, of Lancaster University, for computing tie-point precision of our SfM surveys using his 2017 approach, and Olivia Wilson, of the Ordnance Survey, for expert guidance with the machine learning classification problem. Constructive comments from Patrice Carbonneau, Leonardo Camelo, and three anonymous reviewers helped to improve an earlier version of this manuscript. We also thank the landowners. The code produced in this publication is available online as follows. Machine learning: https://github.com/robintw/WoodgetDietrichWilson2019, Multi-view refraction correction: https://github.com/geojames/pyBathySfM. Please note that we do not provide the RPAS imagery associated with this article, due to landowner privacy concerns.

Conflicts of Interest

The authors declare no conflicts of interest.

References

  1. Wheaton, J.M.; Brasington, J.; Darby, S.E.; Sear, D.A. Accounting for uncertainty in DEMs from repeat topographic surveys: Improved sediment budgets. Earth Surf. Process. Landf. 2010, 35, 136–156. [Google Scholar] [CrossRef]
  2. Kociuba, W. Analysis of geomorphic changes and quantification of sediment budgets of a small Arctic valley with the application of repeat TLS surveys. Z. Fur Geomorphol. Suppl. Issues 2017, 61, 105–120. [Google Scholar] [CrossRef]
  3. Rice, S.; Church, M. Grain size along two gravel-bed rivers: Statistical variation, spatial pattern and sedimentary links. Earth Surf. Process. Landf. 1998, 23, 345–363. [Google Scholar] [CrossRef]
  4. Hodge, R.; Brasington, J.; Richards, K. In situ characterization of grain-scale fluvial morphology using Terrestrial Laser Scanning. Earth Surf. Process. Landf. 2009, 34, 954–968. [Google Scholar] [CrossRef]
  5. Langhammer, J.; Lendzioch, T.; Miřijovský, J.; Hartvich, F. UAV-Based Optical Granulometry as Tool for Detecting Changes in Structure of Flood Depositions. Remote Sens. 2017, 9, 240. [Google Scholar] [CrossRef]
  6. Woodget, A.S.; Austrums, R. Subaerial gravel size measurement using topographic data derived from a UAV-SfM approach. Earth Surf. Process. Landf. 2017, 42, 1434–1443. [Google Scholar] [CrossRef]
  7. Fuller, I.C.; Large, A.R.G.; Milan, D.J. Quantifying channel development and sediment transfer following chute cutoff in a wandering gravel-bed river. Geomorphology 2003, 54, 307–323. [Google Scholar] [CrossRef]
  8. Milan, D.J.; Heritage, G.L.; Hetherington, D. Application of a 3D laser scanner in the assessment of erosion and deposition volumes and channel change in a proglacial river. Earth Surf. Process. Landf. 2007, 32, 1657–1674. [Google Scholar] [CrossRef]
  9. Verhaar, P.M.; Biron, P.M.; Ferguson, R.I.; Hoey, T.B. A modified morphodynamic model for investigating the response of rivers to short-term climate change. Geomorphology 2008, 101, 674–682. [Google Scholar] [CrossRef]
  10. Slater, L.J.; Singer, M.B.; Kirchner, J.W. Hydrologic versus geomorphic drivers of trends in flood hazard. Geophys. Res. Lett. 2015, 42, 370–376. [Google Scholar] [CrossRef] [Green Version]
  11. Coveney, S.; Roberts, K. Lightweight UAV digital elevation models and orthoimagery for environmental applications: Data accuracy evaluation and potential for river flood risk modelling. Int. J. Remote Sens. 2017, 38, 3159–3180. [Google Scholar] [CrossRef]
  12. Newson, M.D.; Newson, C.L. Geomorphology, ecology and river channel habitat: mesoscale approaches to basin-scale challenges. Prog. Phys. Geogr. 2000, 24, 195–217. [Google Scholar] [CrossRef]
  13. Woodget, A.S.; Austrums, R.; Maddock, I.P.; Habit, E. Drones and digital photogrammetry: From classifications to continuums for monitoring river habitat and hydromorphology. Wiley Interdiscip. Rev. Water 2017, 4, e1222. [Google Scholar] [CrossRef]
  14. Lane, S.N.; Richards, K.S.; Chandler, J.H. Developments in monitoring and modelling small-scale river bed topography. Earth Surf. Process. Landf. 1994, 19, 349–368. [Google Scholar] [CrossRef]
  15. Chandler, J. Effective application of automated digital photogrammetry for geomorphological research. Earth Surf. Process. Landf. 1999, 24, 51–63. [Google Scholar] [CrossRef]
  16. Lane, S.N.; Westaway, R.M.; Hicks, D.M. Estimation of erosion and deposition volumes in a large, gravel-bed, braided river using synoptic remote sensing. Earth Surf. Process. Landf. 2003, 28, 249–271. [Google Scholar] [CrossRef]
  17. Charlton, M.E.; Large, A.R.G.; Fuller, I.C. Application of airborne LiDAR in river environments: the River Coquet, Northumberland, UK. Earth Surf. Process. Landf. 2003, 28, 299–306. [Google Scholar] [CrossRef]
  18. Brasington, J.; Langham, J.; Rumsby, B. Methodological sensitivity of morphometric estimates of coarse fluvial sediment transport. Geomorphology 2003, 53, 299–316. [Google Scholar] [CrossRef]
  19. Fausch, K.D.; Torgersen, C.E.; Baxter, C.V.; Li, H.W. Landscapes to Riverscapes: Bridging the Gap between Research and Conservation of Stream Fishes. BioScience 2002, 52, 483–498. [Google Scholar] [CrossRef] [Green Version]
  20. Harwin, S.; Lucieer, A. Assessing the Accuracy of Georeferenced Point Clouds Produced via Multi-View Stereopsis from Unmanned Aerial Vehicle (UAV) Imagery. Remote Sens. 2012, 4, 1573–1599. [Google Scholar] [CrossRef] [Green Version]
  21. Lague, D.; Brodu, N.; Leroux, J. Accurate 3D comparison of complex topography with terrestrial laser scanner: Application to the Rangitikei canyon (N-Z). ISPRS J. Photogramm. Remote Sens. 2013, 82, 10–26. [Google Scholar] [CrossRef] [Green Version]
  22. Lucieer, A.; Jong, S.M.d.; Turner, D. Mapping landslide displacements using Structure from Motion (SfM) and image correlation of multi-temporal UAV photography. Prog. Phys. Geogr. 2014, 38, 97–116. [Google Scholar] [CrossRef]
  23. Clapuyt, F.; Vanacker, V.; Van Oost, K. Reproducibility of UAV-based earth topography reconstructions based on Structure-from-Motion algorithms. Geomorphology 2016, 260, 4–15. [Google Scholar] [CrossRef]
  24. Cucchiaro, S.; Cavalli, M.; Vericat, D.; Crema, S.; Llena, M.; Beinat, A.; Marchi, L.; Cazorzi, F. Monitoring topographic changes through 4D-structure-from-motion photogrammetry: application to a debris-flow channel. Environ. Earth Sci. 2018, 77, 632. [Google Scholar] [CrossRef]
  25. Micheletti, N.; Chandler, J.H.; Lane, S.N. Investigating the geomorphological potential of freely available and accessible structure-from-motion photogrammetry using a smartphone. Earth Surf. Process. Landf. 2015, 40, 473–486. [Google Scholar] [CrossRef]
  26. Brasington, J.; Vericat, D.; Rychkov, I. Modeling river bed morphology, roughness, and surface sedimentology using high resolution terrestrial laser scanning. Water Resour. Res. 2012, 48, W11519. [Google Scholar] [CrossRef]
  27. Woodget, A.S.; Carbonneau, P.E.; Visser, F.; Maddock, I.P. Quantifying submerged fluvial topography using hyperspatial resolution UAS imagery and structure from motion photogrammetry. Earth Surf. Process. Landf. 2015, 40, 47–64. [Google Scholar] [CrossRef]
  28. Dietrich, J.T. Bathymetric Structure-from-Motion: extracting shallow stream bathymetry from multi-view stereo photogrammetry. Earth Surf. Process. Landf. 2017, 42, 355–364. [Google Scholar] [CrossRef]
  29. Legleiter, C.J.; Harrison, L.R. Remote Sensing of River Bathymetry: Evaluating a Range of Sensors, Platforms, and Algorithms on the Upper Sacramento River, California, USA. Water Resour. Res. 2019, 55, 2142–2169. [Google Scholar] [CrossRef]
  30. Vaaja, M.; Hyyppä, J.; Kukko, A.; Kaartinen, H.; Hyyppä, H.; Alho, P. Mapping Topography Changes and Elevation Accuracies Using a Mobile Laser Scanner. Remote Sens. 2011, 3, 587–600. [Google Scholar] [CrossRef] [Green Version]
  31. Schaffrath, K.R.; Belmont, P.; Wheaton, J.M. Landscape-scale geomorphic change detection: Quantifying spatially variable uncertainty and circumventing legacy data issues. Geomorphology 2015, 250, 334–348. [Google Scholar] [CrossRef] [Green Version]
  32. Miřijovský, J.; Langhammer, J. Multitemporal Monitoring of the Morphodynamics of a Mid-Mountain Stream Using UAS Photogrammetry. Remote Sens. 2015, 7, 8586–8609. [Google Scholar] [CrossRef] [Green Version]
  33. Cook, K.L. An evaluation of the effectiveness of low-cost UAVs and structure from motion for geomorphic change detection. Geomorphology 2017, 278, 195–208. [Google Scholar] [CrossRef]
  34. Hamshaw, S.D.; Bryce, T.; Rizzo, D.M.; O’Neil-Dunne, J.; Frolik, J.; Dewoolkar, M.M. Quantifying streambank movement and topography using unmanned aircraft system photogrammetry with comparison to terrestrial laser scanning. River Res. Appl. 2017, 33, 1354–1367. [Google Scholar] [CrossRef]
  35. Javemick, L.; Brasington, J.; Caruso, B. Modeling the topography of shallow braided rivers using Structure-from-Motion photogrammetry. Geomorphology 2014, 213, 166–182. [Google Scholar] [CrossRef]
  36. Starek, M.J.; Giessel, J. Fusion of uas-based structure-from-motion and optical inversion for seamless topo-bathymetric mapping. In Proceedings of the 2017 IEEE International Geoscience and Remote Sensing Symposium (IGARSS), Fort Worth, TX, USA, 23–28 July 2017; pp. 2999–3002. [Google Scholar]
  37. Flener, C.; Vaaja, M.; Jaakkola, A.; Krooks, A.; Kaartinen, H.; Kukko, A.; Kasvi, E.; Hyyppä, H.; Hyyppä, J.; Alho, P. Seamless Mapping of River Channels at High Resolution Using Mobile LiDAR and UAV-Photography. Remote Sens. 2013, 5, 6382–6407. [Google Scholar] [CrossRef] [Green Version]
  38. Tamminga, A.D.; Eaton, B.C.; Hugenholtz, C.H. UAS-based remote sensing of fluvial change following an extreme flood event. Earth Surf. Process. Landf. 2015, 40, 1464–1476. [Google Scholar] [CrossRef]
  39. Fonstad, M.A.; Dietrich, J.T.; Courville, B.C.; Jensen, J.L.; Carbonneau, P.E. Topographic structure from motion: a new development in photogrammetric measurement. Earth Surf. Process. Landf. 2013, 38, 421–430. [Google Scholar] [CrossRef]
  40. Carrivick, J.L.; Smith, M.W. Fluvial and aquatic applications of Structure from Motion photogrammetry and unmanned aerial vehicle/drone technology. Wiley Interdiscip. Rev. Water 2019, 6, e1328. [Google Scholar] [CrossRef]
  41. Bagheri, O.; Ghodsian, M.; Saadatseresht, M. Reach scale application of UAV+SfM methods in shallow rivers hyperspatial bathymetry. In Proceedings of the ISPRS—International Archives of the Photogrammetry, Remote Sensing and Spatial Information Sciences, Kish Island, Iran, 23–25 November 2015; Copernicus GmbH: Göttingen, Germany, 2015; Volume XL-1-W5, pp. 77–81. [Google Scholar]
  42. Shintani, C.; Fonstad, M.A. Comparing remote-sensing techniques collecting bathymetric data from a gravel-bed river. Int. J. Remote Sens. 2017, 38, 2883–2902. [Google Scholar] [CrossRef]
  43. Dietrich, J.T. pyBathySfM v4.0; GitHub: San Francisco, CA, USA, 2019. [Google Scholar] [CrossRef]
  44. Fisher, P.F.; Tate, N.J. Causes and consequences of error in digital elevation models. Prog. Phys. Geogr. 2006, 30, 467–489. [Google Scholar] [CrossRef]
  45. Sear, D.A.; Milne, J.A. Surface modelling of upland river channel topography and sedimentology using GIS. Phys. Chem. Earthpart B Hydrol. Ocean. Atmos. 2000, 25, 399–406. [Google Scholar] [CrossRef]
  46. Brasington, J.; Rumsby, B.T.; McVey, R.A. Monitoring and modelling morphological change in a braided gravel-bed river using high resolution GPS-based survey. Earth Surf. Process. Landf. 2000, 25, 973–990. [Google Scholar] [CrossRef]
  47. Jaud, M.; Grasso, F.; Le Dantec, N.; Verney, R.; Delacourt, C.; Ammann, J.; Deloffre, J.; Grandjean, P. Potential of UAVs for Monitoring Mudflat Morphodynamics (Application to the Seine Estuary, France). ISPRS Int. J. Geo-Inf. 2016, 5. [Google Scholar] [CrossRef]
  48. Milan, D.J.; Heritage, G.L.; Large, A.R.G.; Fuller, I.C. Filtering spatial error from DEMs: Implications for morphological change estimation. Geomorphology 2011, 125, 160–171. [Google Scholar] [CrossRef]
  49. James, M.R.; Robson, S.; Smith, M.W. 3-D uncertainty-based topographic change detection with structure-from-motion photogrammetry: precision maps for ground control and directly georeferenced surveys. Earth Surf. Process. Landf. 2017, 42, 1769–1788. [Google Scholar] [CrossRef]
  50. Seier, G.; Stangl, J.; Schöttl, S.; Sulzer, W.; Sass, O. UAV and TLS for monitoring a creek in an alpine environment, Styria, Austria. Int. J. Remote Sens. 2017, 38, 2903–2920. [Google Scholar] [CrossRef]
  51. Heritage, G.L.; Milan, D.J.; Large, A.R.G.; Fuller, I.C. Influence of survey strategy and interpolation model on DEM quality. Geomorphology 2009, 112, 334–344. [Google Scholar] [CrossRef]
  52. Chollet, F. Deep Learning with Python, 1st ed.; Manning Publications: Shelter Island, NY, USA, 2017; ISBN 978-1-61729-443-3. [Google Scholar]
  53. Rivas-Casado, M.; González, R.B.; Ortega, J.F.; Leinster, P.; Wright, R. Towards a Transferable UAV-Based Framework for River Hydromorphological Characterization. Sensors 2017, 17. [Google Scholar] [CrossRef]
  54. Buscombe, D.; Ritchie, A.C. Landscape Classification with Deep Neural Networks. Geosciences 2018, 8, 244. [Google Scholar] [CrossRef]
  55. Liu, T.; Abd-Elrahman, A.; Morton, J.; Wilhelm, V.L. Comparing fully convolutional networks, random forest, support vector machine, and patch-based deep convolutional neural networks for object-based wetland mapping using images from small unmanned aircraft system. GIScience Remote Sens. 2018, 55, 243–264. [Google Scholar] [CrossRef]
  56. Milani, G.; Volpi, M.; Tonolla, D.; Doering, M.; Robinson, C.; Kneubühler, M.; Schaepman, M. Robust quantification of riverine land cover dynamics by high-resolution remote sensing. Remote Sens. Environ. 2018, 217, 491–505. [Google Scholar] [CrossRef]
  57. Boonpook, W.; Tan, Y.; Ye, Y.; Torteeka, P.; Torsri, K.; Dong, S. A Deep Learning Approach on Building Detection from Unmanned Aerial Vehicle-Based Images in Riverbank Monitoring. Sensors 2018, 18. [Google Scholar] [CrossRef] [PubMed]
  58. Baron, J.; Hill, D.J.; Elmiligi, H. Combining image processing and machine learning to identify invasive plants in high-resolution images. Int. J. Remote Sens. 2018, 39, 5099–5118. [Google Scholar] [CrossRef]
  59. Heritage, G.L.; Hemsworth, M.; Hicks, L. Restoring the River Teme SSSI: A River Restoration Plan—Technical Report Draft (v4.2); JBA for Natural England: Skipton, UK, 2013. [Google Scholar]
  60. James, M.R.; Robson, S. Mitigating systematic error in topographic models derived from UAV and ground-based image networks. Earth Surf. Process. Landf. 2014, 39, 1413–1420. [Google Scholar] [CrossRef] [Green Version]
  61. Wackrow, R.; Chandler, J.H. Minimising systematic error surfaces in digital elevation models using oblique convergent imagery. Photogramm. Rec. 2011, 26, 16–31. [Google Scholar] [CrossRef] [Green Version]
  62. Chandler, J.H.; Fryer, J.G.; Jack, A. Metric capabilities of low-cost digital cameras for close range surface measurement. Photogramm. Rec. 2005, 20, 12–26. [Google Scholar] [CrossRef]
  63. Legleiter, C.J.; Kyriakidis, P.C. Forward and Inverse Transformations between Cartesian and Channel-fitted Coordinate Systems for Meandering Rivers. Math. Geol. 2006, 38, 927–958. [Google Scholar] [CrossRef]
  64. Olson, R.S.; Urbanowicz, R.J.; Andrews, P.C.; Lavender, N.A.; Kidd, L.C.; Moore, J.H. Automating Biomedical Data Science through Tree-Based Pipeline Optimization. In Applications of Evolutionary Computation, Proceedings of EvoApplications 2016; Springer: Berlin, Germany, 2016. [Google Scholar]
  65. Pedregosa, F.; Varoquaux, G.; Gramfort, A.; Michel, V.; Thirion, B.; Grisel, O.; Blondel, M.; Prettenhofer, P.; Weiss, R.; Dubourg, V.; et al. Scikit-learn: Machine Learning in Python. J. Mach. Learn. Res. 2011, 12, 2825–2830. [Google Scholar]
  66. Chawla, N.V.; Bowyer, K.W.; Hall, L.O.; Kegelmeyer, W.P. SMOTE: Synthetic Minority Over-sampling Technique. J. Artif. Intell. Res. 2002, 16, 321–357. [Google Scholar] [CrossRef]
  67. Lemaître, G.; Nogueira, F.; Aridas, C.K. Imbalanced-learn: A Python Toolbox to Tackle the Curse of Imbalanced Datasets in Machine Learning. J. Mach. Learn. Res. 2017, 18, 559–563. [Google Scholar]
  68. Mapbox. Rasterio v1.0. 2018. Available online: https://github.com/mapbox/rasterio (accessed on 12 December 2018).
  69. van der Walt, S.; Colbert, S.C.; Varoquaux, G. The NumPy Array: A Structure for Efficient Numerical Computation. Comput. Sci. Eng. 2011, 13, 22–30. [Google Scholar] [CrossRef] [Green Version]
  70. McKinney, W. Data Structures for Statistical Computing in Python. In Proceedings of the 9th Python in Science Conference, Austin, TX, USA, 28 June–3 July 2010; pp. 51–56. [Google Scholar] [CrossRef]
  71. Hunter, J.D. Matplotlib: A 2D Graphics Environment. Comput. Sci. Eng. 2007, 9, 90–95. [Google Scholar] [CrossRef]
  72. Kluyver, T.; Ragan-Kelley, B.; Pérez, F.; Granger, B.E.; Bussonnier, M.; Frederic, J.; Kelley, K.; Hamrick, J.B.; Grout, J.; Corlay, S.; et al. Jupyter Notebooks-a publishing format for reproducible computational workflows. In Proceedings of the 20th International Conference on Electronic Publishing, Göttingen, Germany, 9 June 2016; pp. 87–90. [Google Scholar]
  73. Wilson, R.T.; Woodget, A.S. Code for Woodget, Dietrich and Wilson; GitHub: San Francisco, CA, USA, 2019. [Google Scholar] [CrossRef]
  74. Carbonneau, P.E.; Dietrich, J.T. Cost-effective non-metric photogrammetry from consumer-grade sUAS: Implications for direct georeferencing of structure from motion photogrammetry. Earth Surf. Process. Landf. 2017, 42, 473–486. [Google Scholar] [CrossRef]
  75. Buscombe, D. SediNet: A configurable deep learning model for mixed qualitative and quantitative optical granulometry. EarthArXiv 2019. [Google Scholar] [CrossRef] [Green Version]
Figure 1. Location map and site overviews (orthoimagery) from 2017 and 2016 surveys.
Remotesensing 11 02415 g001
Figure 2. Validation datasets for 2017 and 2016.
Remotesensing 11 02415 g002
Figure 3. Water surface interpolation points. Centreline points (circles) are generated from the statistical smoothing operations. Edge points (squares) are copies of the centreline shifted orthogonally (black arrows) to create a solid interpolation surface that extends beyond the wetted channel. Additional points are added along the riffles to handle the more complex topography in the side channels.
Remotesensing 11 02415 g003
Figure 4. Diagram illustrating through water refraction geometry. Illustrating an off-nadir field of view (FOV) from the camera location ( X c , Y c , Z c ) down to the water surface ( W S z ). Point ( X a , Y a , Z a ) is at the apparent depth ( h a ) and represents the uncorrected SfM point cloud elevations. Point ( X p , Y p , Z p ) is the “true” position as the “true” depth ( h ) that the refraction correction is solving. D is the point camera distance, d H is the elevation difference, r is the angle of refraction, i is the angle of incidence, x is the point/water interface distance, n 1 and n 2 are the refractive indicies of air and water. From [28], used with permission.
Remotesensing 11 02415 g004
Figure 5. Comparison of two methods for water surface delineation, manually "picked" edge points (left, e.g., [27,28]) and the method used in this paper using statistically smoothed elevation profiles (right). Colours represent the apparent depth (ha) calculated from each water surface method, the black arrows on the manually digitised surface highlight cross-stream errors/artefacts.
Remotesensing 11 02415 g005
Figure 6. Error histograms and scatterplots for 2016 (top half) and 2017 (bottom half) comparing the three methods tested: Small angle correction (left column), unfiltered multi-view correction (BathySfM–All, centre column), filtered multi-view correction (BathySfM–Filt, right column).
Remotesensing 11 02415 g006
Figure 7. Observed versus predicted elevation errors for (a) 2016 and (b) 2017 datasets, using the multiple linear regression approach for both error magnitude and direction.
Remotesensing 11 02415 g007
Figure 8. Predicted spatially variable elevation error maps for 2016 and 2017 datasets (with histograms of residual error associated with these predictions) and propagated error map (subsequently used to threshold elevation change)—all generated using data from the multiple regression approach.
Remotesensing 11 02415 g008
Figure 9. Confusion matrices for the 2017 data classification, for the (a) three-class and (b) ten-class problem. The matrices are normalised, summing to 1.0 along the rows. Classes are labelled with their lower bound (so in part (a), a label of –2 represents the class of –2 to –0.2).
Remotesensing 11 02415 g009
Figure 10. Predicted spatially variable elevation error maps for 2016 and 2017 datasets generated using data from the three-class machine learning classification approach.
Remotesensing 11 02415 g010
Figure 11. Elevation change map (2016–17), thresholded by elevation errors predicted using the multiple regression approach.
Remotesensing 11 02415 g011
Figure 12. Quantities of elevation change (2016–17) in terms of volume (left) and area (right). Note that the x-axes have been truncated for clarity purposes. Total areal lowering was 8097 m2, total areal raising was 17,570 m2, and net volume difference was +1155 m3.
Remotesensing 11 02415 g012
Table 1. Variables used for the prediction of elevation error within the RPAS–SfM surveys. Total number of validation samples for 2016 was 1522 and for 2017 was 2091. Sample size refers to the percentage of validation points which were assigned to each specific parameter (no data areas apply to some validation points). Where variables are binary, the number of validation points falling within each category is also given.
Parameter (Type)SymbolMethod of ExtractionType: Range/UnitsSample Size: Count (%)
20162017
Slope angle
(topographic complexity)
SRPAS–SfM DEMs imported to ArcGIS. 3D Analyst extension was used to compute slope angles. Focal (f) statistics for slope within a 0.2 m circular window of each validation point also computed.Continuous:
0–90°
1522 (100%)2091
(100%)
Point cloud roughness
(topographic complexity)
RRPAS–SfM point clouds imported to CloudCompare. ‘Compute geometric features’ tool used to compute roughness for each point in the cloud within spherical kernels with a 0.4 m radius. Roughness is defined as the distance between the point and the best fitting plane computing from all the surrounding points which fall within the kernel. Rasterised at 0.1 m pixel size and exported to ArcGIS. Smaller pixel sizes were found to produce too many holes in the resulting raster. Focal statistics for roughness within a 0.2 m circular window of each validation point also computed.Continuous:
0–0.34 m
1515
(99.5%)
2090
(99.9%)
Point cloud density
(survey quality/ landscape composition)
DRPAS–SfM point clouds imported to CloudCompare and rasterised according to the number of points falling within each 0.05 m grid cell. Raster exported to ArcGIS. Continuous:
0–64 count
1522 (100%)2091
(100%)
Water depth
(landscape composition)
hComputed using the multi-view refraction correction process and smoothed water surface, as detailed within this paper (BathySfM–All).Continuous:
0–1.97 m
355
(23.3%)
1170
(56%)
Image quality
(survey quality)
CQImage quality estimates are provided by PhotoScan Pro on a scale of 0 to 1 and based on the level of image sharpness in the best focused area of the image. Images with quality values of less than 0.5 are generally not recommended for use in subsequent processing. Image quality data were exported from PhotoScan Pro and the average quality of cameras that ‘see’ each point was appended to that point. Point–camera connections were calculated in the same way as the BathySfM correction.Continuous:
0–1
1522
(100%)
2086
(99.8%)
Tie point precision
(survey quality/ landscape composition)
PComputed using the tie point precision method presented by [49]. Tie points are rasterised at 1 m pixel size and exported from CloudCompare to ArcGIS. The tie points form the sparse point cloud from the PhotoScan Pro software, therefore exporting at a finer resolution would lead to large holes in the resulting raster.Continuous:
0–4.8 m
1342
(88.2%)
1884
(90.1%)
Vegetation presence
(landscape composition)
VRPAS–SfM orthophotos imported to ArcGIS. Editor toolbar used to visually identify and map areas of particularly dense vegetation or tree coverage.Binary:
[0] = Not present
[1] = Present
1522 (100%)
[0] = 89.5%
[1] = 10.5%
2091
(100%)
[0] = 90.5%
[1] = 9.5%
Presence of water surface reflection
(survey conditions)
RcRPAS–SfM orthophotos imported to ArcGIS. Editor toolbar used to visually identify and map areas of notable water surface reflections.Binary:
[0] = Not present
[1] = Present
1522 (100%)
[0] = 98%
[1] = 2%
2091 (100%)
[0] = 94.3%
[1] = 5.7%
Presence of shadows
(survey conditions)
ShRPAS–SfM orthophotos imported to ArcGIS. Editor toolbar used to visually identify and map areas of dark shadowing.Binary:
[0] = Not present
[1] = Present
1522 (100%)
[0] = 99.5%
[1] = 0.5%
2091 (100%)
[0] = 98.3%
[1] = 1.7%
Table 2. Georeferencing accuracy statistics (all values in metres).
MeanSt Dev95% Conf.RMSEMINMAX
2016X0.0000.0210.0410.020–0.0470.030
Y0.0000.0270.0520.026–0.0460.047
Z–0.0010.0170.0340.017–0.0290.035
2017X0.0000.0350.0680.034–0.0540.056
Y0.0000.0590.1160.057–0.0960.076
Z0.0000.0060.0130.006–0.0180.006
Table 3. Refraction correction accuracy and precision statistics (all values in metres, except slope).
20162017
Correction Method(1) Exposed Only(2) Small Angle– Manual(3) Small Angle– Smooth(4) Bathy SfM–All(5) Bathy SfM–Filtered(1) Exposed Only(2) Small Angle– Manual(3) Small Angle– Smooth(4) Bathy SfM–All(5) Bathy SfM–Filtered
Mean Error0.0240.1500.0410.0160.0270.0650.0340.017–0.0550.006
St Dev of Error0.2350.2050.0650.0610.0620.2260.1050.0790.1010.079
Regression Slope0.9420.9150.9970.9890.9920.9400.9031.0681.0571.060
Min Error–1.710-0.645–0.130–0.156–0.152–1.235–0.293–0.269–0.439–0.282
Max Error1.0971.4030.5010.4450.4821.5662.2610.5200.4850.513
Table 4. Multiple R values for linear regressions of individual variables with elevation error.
(a) Elevation Error—Magnitude and Direction(b) Elevation Error—Magnitude Only
VariableCombined20162017Combined20162017
Slope–0.10–0.200.000.500.470.56
Max. Slope Focal–0.12–0.240.000.520.530.53
Min. Slope Focal–0.06–0.09–0.030.370.390.39
St. Dev. Slope Focal–0.12–0.250.040.440.440.45
Water Depth (BathySfM–All)–0.050.01–0.11–0.15–0.10–0.19
Point Density–0.12–0.14–0.100.280.230.43
Image Quality Mean–0.04–0.01–0.070.050.070.02
Image Quality Mean Focal–0.04–0.01–0.070.060.070.02
Roughness 40 cm–0.04–0.170.120.310.220.41
Roughness 40 cm Focal–0.05–0.190.140.380.300.49
Tie Point Precision0.050.020.070.060.140.06
Table 5. Performance of multiple regressions. NC denotes variables which were not computed.
(a) Elevation Error—Magnitude and Direction(b) Elevation Error—Magnitude Only
Performance VariableCombined20162017Combined20162017
Multiple R0.470.540.530.610.650.63
Adjusted R Square0.220.290.280.370.420.40
Standard Error (m)0.170.180.140.130.140.11
Significance (p-value)<0.01<0.01<0.01<0.01<0.01<0.01
Slope (obs vs. pred)NC0.16660.1297NCNCNC
Mean Residual Error (m)NC–0.04–0.01NCNCNC
Max Residual Error (m)NC1.481.09NCNCNC
Min Residual Error (m)NC–4.48–1.23NCNCNC
St Dev Residual Error (m)NC0.220.16NCNCNC
Table 6. Standard deviations, co-efficients, and intercept values (multiple regression parameters).
VariableStandard DeviationMultiple Regression Co-Efficients/Intercept
Epochs Combined20162017
Maximum Slope Focal (MaxSf)20.3411–0.0674–0.0281
Minimum Slope Focal (MinSf)5.4814–0.0059–0.0034
Refraction Corrected Water Depth (h)0.20610.0140–0.0228
Point Cloud Density (D)4.1113–0.0071–0.0747
Mean Image Quality Focal (MeanCQf)1.9848–0.0010–0.0266
Mean Roughness Focal (MeanRf)0.0150–0.02120.0333
Point Cloud Precision (P)0.38630.04370.0019
Presence of Vegetation (V)N/A0.26040.2354
Presence of Shadows (Sh)N/A–0.45880.0616
Presence of Reflections (Rc)N/A0.05110.0084
Intercept (θ)N/A0.15331.1812
Table 7. Accuracy results for each of the classifications performed.
ClassesEpochAccuracyF1 Score
3 classes201678%0.83
201776%0.81
Both74%0.80
10 classes201626%0.22
201731%0.30
Both29%0.27
Table 8. Comparison of RPAS-based approaches to below-water topographic reconstruction and change detection.
This PaperFlener et al. [37]Tamminga et al. [38]Shintani and Fonstad [42]
Refraction correction approachCo-efficient for clear water (1.34): Small angle & multiviewOptical calibrationOptical calibrationSite specific co-efficient
Calibration data needed?NoYesYesYes
Validation points 1522–2093197 GPS points + extra ADCP points (not reported)76–82167
Survey size600 m reachca. 150 m reach (20–30 m wide)800 m reach140 m reach
Validation survey typeDifferential GNSS + total stationRTK GPS + ADCPRTK GPSRTK GPS
Validation point layoutRandom distribution over a range of water depths Zig-zag pattern along channel over range of water depthsNot reported12 evenly spaced channel cross sections
Maximum water depth (m)1.431.50Not reported1.25
Mean error (m)0.006–0.0410.117–0.11960.0001–0.00070.009
RMSE (m)0.063–0.1150.163–0.2210.095–0.098Not reported
Standard deviation (m)0.061–0.101Not reported0.009–0.0230.172

