Volcano Monitoring from Space Using High-Cadence Planet CubeSat Images Applied to Fuego Volcano, Guatemala


1
Department of Geological and Mining and Engineering Sciences, Michigan Technological University, 1400 Townsend Drive, Houghton, MI 49931, USA
2
Department of Earth and Environmental Sciences, University of Milano-Bicocca, 20126 Milano, Italy
3
Istituto di Geologia Ambientale e Geoingegneria-sez. di Milano, C.N.R, 20131 Milano, Italy
*
Author to whom correspondence should be addressed.
Remote Sens. 2019, 11(18), 2151; https://doi.org/10.3390/rs11182151
Submission received: 23 June 2019
/
Revised: 23 August 2019
/
Accepted: 6 September 2019
/
Published: 16 September 2019
(This article belongs to the Special Issue Remote Sensing of Volcanic Processes and Risk)
Abstract
:Fuego volcano (Guatemala) is one of the most active and hazardous volcanoes in the world. Its persistent activity generates lava flows, pyroclastic density currents (PDCs), and lahars that threaten the surrounding areas and produce frequent morphological change. Fuego’s eruption deposits are often rapidly eroded or remobilized by heavy rains and its constant activity and inaccessible terrain makes ground-based assessment of recent eruptive deposits very challenging. Earth-orbiting satellites can provide unique observations of volcanoes during eruptive activity, when ground-based techniques may be too hazardous, and also during inter-eruptive phases, but have typically been hindered by relatively low spatial and temporal resolution. Here, we use a new source of Earth observation data for volcano monitoring: high resolution (~3 m pixel size) images acquired from a constellation of over 150 CubeSats (‘Doves’) operated by Planet Labs Inc. The Planet Labs constellation provides high spatial resolution at high cadence (<1–72 h), permitting space-based tracking of volcanic activity with unprecedented detail. We show how PlanetScope images collected before, during, and after an eruption can be applied for mapping ash clouds, PDCs, lava flows, or the analysis of morphological change. We assess the utility of the PlanetScope data as a tool for volcano monitoring and rapid deposit mapping that could assist volcanic hazard mitigation efforts in Guatemala and other active volcanic regions.
1. Introduction
Persistently active volcanoes are an ever-present threat to populations and infrastructure exposed to primary and secondary volcanic hazards on their flanks. Continuous, ground-based monitoring by local or regional volcano observatories plays an essential role in hazard mitigation in such locations. When ground-based techniques are impractical or too hazardous, Earth-orbiting satellites can be a valuable tool for volcano monitoring. However, satellite remote sensing techniques can be limited by temporal and/or spatial resolution, particularly in rapidly evolving situations.
Satellite remote sensing (or Earth observation, EO) has played an increasingly important role in volcano surveillance over the past few decades, concurrent with technological advances in satellite sensors [1,2,3,4,5]. The principle applications of EO data in volcanology include volcanic gas and ash monitoring [6,7,8], monitoring of heat fluxes [9,10,11,12,13], optical measurements [14,15,16], mapping of ground deformation [17,18], geological mapping [19,20] and geological hazard assessment [21,22,23]. The main factors limiting the efficacy of EO data for volcano monitoring are the temporal and spatial resolution of the measurements, which are seldom optimized simultaneously in satellite instruments. Temporal resolution is arguably the most critical, since volcanic activity remains largely unpredictable and can produce dynamic phenomena that can be difficult to track and analyze in real-time during rapidly evolving crisis situations. Several volcanic eruptions in 2018 demonstrated the need for rapid response, including: Kilauea (Hawaii) in May 2018; Agung and Anak Krakatau (Indonesia) in November–December 2018; Mayon (Philippines); Piton de la Fournaise (Reuniòn Island); and Mount Etna (Italy) [24].
Commonly-used pushbroom visible-infrared satellite sensors, such as those deployed on the USGS Landsat or European Sentinel-2 satellites, have intermediate-high spatial (~10–20 m), but low temporal (days to weeks) resolution (Table 1). Since 2008, with the open access of Landsat archives, “time series” images have been used to analyze natural processes. High acquisition frequency allows for a more complete understanding of geological dynamics [25]. Here, we explore some volcanological applications of a new EO paradigm that can provide observations with both high spatial and temporal resolution: constellations of small satellites or ‘CubeSats’. The use of a constellation of CubeSats provides a higher cadence than is possible with the use of a single satellite, whilst also providing high spatial resolution by minimizing swath width. One of the pioneers in this field is Planet Labs Inc. [26], which has operated an expanding constellation of over 100 CubeSats (informally called ‘Doves’) since 2014. The Planet constellation provides three or four band (visible to near-infrared) PlanetScope (PS) imagery of the entire land surface of the Earth with ~3 m spatial resolution and a temporal cadence of ~1–72 h (Table 1). Although the temporal resolution of current CubeSat constellations is lower than that provided by geostationary satellites, their spatial resolution is several orders of magnitude higher, with a pixel size of ~3 m compared with pixel sizes of 0.25–2 km for geostationary imagers. In some cases, consecutive data acquisition by Planet Doves in the same ‘flock’ (or overlapping flocks) can provide multiple images of the same region within a few minutes. These characteristics, along with an academic open data access policy, make PS data appealing for monitoring of volcanic activity or other dynamic geophysical phenomena resulting in surface change (e.g., landslides, earthquakes).
We use Fuego volcano (Guatemala; Figure 1) as the target of this initial study. Fuego is a persistently active volcano. It has produced several paroxysmal eruptive events in the last three years, providing a rich opportunity to analyze PS imagery. Paroxysmal eruptions at Fuego follow extended periods of lower-level activity, and typically begin with continuous lava fountains and lava flows, followed by tephra fallout and pyroclastic density currents (PDCs), which present the greatest threat to the surrounding areas. Due to its persistent activity and subsequent remobilization of deposits by rainfall, the morphology of Fuego and the barrancas (valleys) that radiate from its summit is in a constant state of flux, both in the near-vent region and on the lower flanks.
We focus here on activity at Fuego in February 2018. We assess the utility of optical PS data for monitoring activity within Fuego’s active vent region and for mapping eruption deposits using the Normalized Difference Vegetation Index (NDVI) [27,28] and visual analysis. Of particular interest is whether PS data can assist with ‘rapid response’ mapping of eruption deposits that could be eroded or removed by rainfall soon after emplacement, since the volume and extent of such deposits can provide critical information on eruption magnitude and on the threat of secondary volcanic hazards, such as lahars. Monitoring and mapping of such ephemeral deposits is also important for probabilistic mapping of volcanic hazards around Fuego.
2. Background
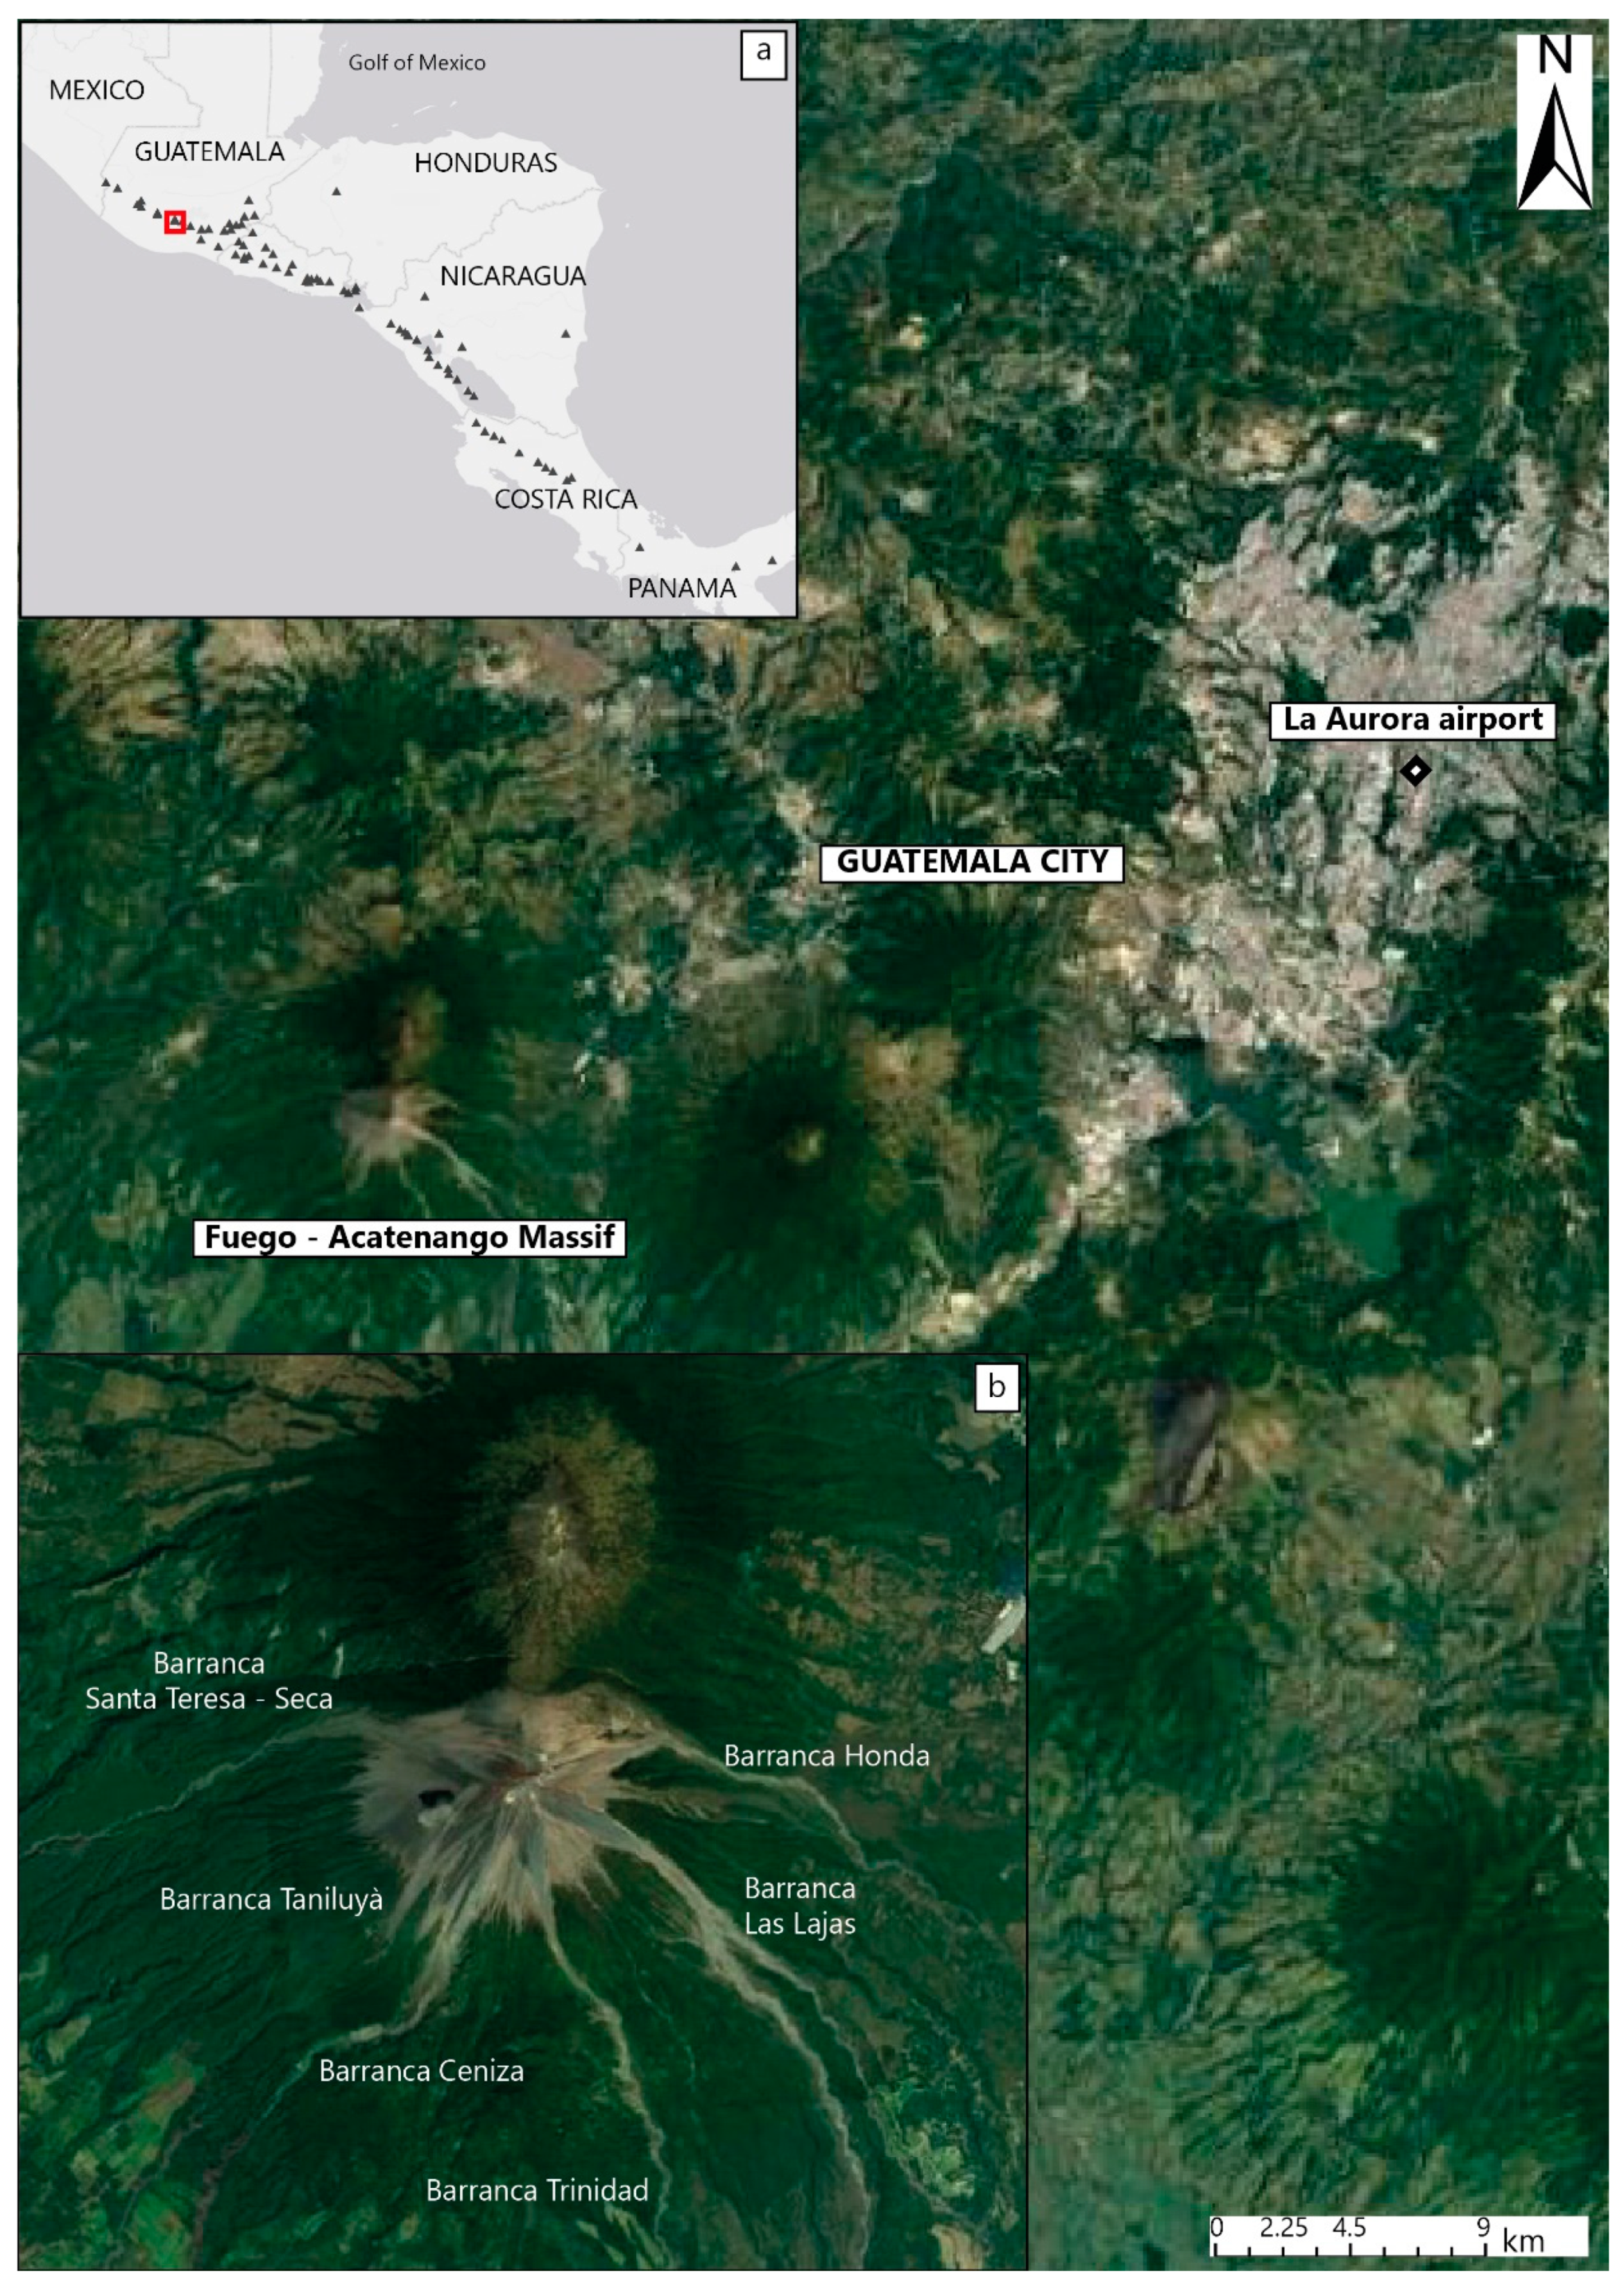
Fuego (alt. 3763 m; 14.4° N, 90.8° W) is the southernmost and youngest of five vents comprising the Fuego-Acatenango massif, located on the Central American volcanic arc (CAVA) in Guatemala (Figure 1). The CAVA is a chain of Quaternary stratovolcanoes linked to subduction of the Cocos plate under the Caribbean plate [29,30]. Fuego is one of the most active volcanoes in Central America, with over 60 recorded eruptions since 1524 [31]. Most of Fuego’s historic eruptions have been classified with a Volcanic Explosivity Index (VEI) of 2 or 3, interspersed with several larger VEI 4 events, the most recent of which occurred in 1974 [31,32,33,34]. The region surrounding Fuego is highly populated, with ~9000 people living within the high hazard zone potentially threatened by PDCs, and more than one million within 30 km of the volcano. Larger eruptions of Fuego also potentially threaten the national capital (Guatemala City) and main international airport, which are only ~40 km away. During the 3 June 2018 eruption of Fuego the ash emissions forced the closure of the La Aurora International Airport in Guatemala City.
Fuego undergoes long periods of relatively low background activity, interrupted by periods of intense, or ‘paroxysmal’, activity that consists of lava flows, lava fountains and PDCs [33,34]. The latter are typically channelled down one or more of the barrancas (valleys) on the flanks of the volcano (Figure 1b), and can be a significant hazard, either by directly impacting populated areas or by providing material for lahars during the rainy season [32,35]. This broad range of eruptive styles makes Fuego’s activity both scientifically interesting and challenging to forecast. Furthermore, the persistent activity results in constant morphological variation in the vent region and on the flanks (barrancas), which is difficult to track using ground-based observations.
Fuego was very active in 2018, with 3 paroxysmal eruptions in February, June, and November. We focus here on the 31 January–2 February 2018 eruption, a Strombolian event of VEI 2 (Figure 2) that was well-captured in PS data. The June 2018 eruption, which resulted in extensive loss of life and damage to infrastructure, involved a more complex sequence of events, and will be the subject of a separate paper. The 31 January–2 February 2018 eruption started with continuous lava fountains and two lava flows, directed NW from the summit. Subsequently, PDCs formed on the east flank and deposited material in two of the seven barrancas which surround the edifice. A significant amount of ash was also emitted and dispersed predominantly to the west by prevailing winds. The activity was also monitored by webcams, providing a visible record of the sequence of events. PS images collected before, during and after the eruption provide a novel, detailed perspective on the volcanic activity for monitoring and mapping the distribution of the volcanic deposits.
3. Data and Methods
3.1. The Planet Labs CubeSat Constellation
The Planet Labs (PL) CubeSat constellation comprises (as of early 2019) over 150 CubeSats or ‘Doves’, each roughly 10 × 10 × 30 cm in size (i.e., three-unit or 3U CubeSats), orbiting in two near-polar, Sun-synchronous (SS) orbits with ~8° and ~98° inclination at an altitude of ~475 km. Each Dove carries a telescope and a 6600 × 4400 pixel CCD array, which acquires both visible (red–green–blue or RGB) and near-infrared (NIR) PS data with 12-bit radiometric resolution. PS scenes are frame images (i.e., an entire scene is imaged by the CCD at an instant in time, unlike pushbroom sensors) with approximate dimensions of 25–30 × 8–10 km, and a native spatial resolution of 3.7 m, resampled to 3 m for delivery. The Doves have been deployed since 2014 in ‘flocks’ from various launch vehicles. Early CubeSats (operational in 2014–2017) were released from the International Space Station (ISS) into the ISS orbit with 52° inclination at ~375 km altitude, whereas more recent PS data (including the data used in this study) are acquired by the near-polar SS-orbiting flocks (Table 2). The Dove constellation images the entire Earth landmass on a daily basis, with overpass times in the local morning hours. To achieve daily contiguous global coverage, the swaths of each consecutive Dove overlap in the across-track direction, providing the opportunity for multiple scene acquisitions within a few minutes in the overlap region [35]. Planet Labs also operates a fleet of five RapidEye satellites and 14 SkySats, which provide even higher spatial resolution.
Several PS data products with different processing levels are available; here we use the ‘Analytic_SR’ data products which are 16-bit calibrated orthorectified surface reflectance data with a positional accuracy of better than 10 m.
3.2. Data Processing
This study of the February 2018 activity at Fuego is based on change detection techniques-a comparison of images pre, syn and post-eruption of the same area at different times. The activity at Fuego permits the evaluation of PS data for a variety of eruption products including lava flows, trephra fall deposits and PDCs.
PS imagery was browsed, and products downloaded using the Planet Explorer interface [26]. Images from before and after the 31 January–2 February eruption were identified, inspected for cloud cover and clarity, and downloaded. Visual inspection of the images was performed by selecting suitable RGB colour stretching values to highlight volcanic deposits and structures. Images were merged and cropped to the extent of the area of interest. Visual comparison of pre- and post-eruption images was performed to identify and map changes, including new deposits produced by tephra fall, lava flows and PDCs. Visual comparisons primarily used the visible bands, but the NIR band was also used in some cases (substituting for the green band in the RGB composite images), particularly when changes in vegetation cover due to the volcanic activity were involved. Where new eruptive material was deposited over areas previously covered by vegetation, a simple change detection strategy based on the NDVI difference was applied. NDVI values were calculated for each image from the surface reflectance values, corresponding to the red and NIR bands [38,39]. We then subtracted the NDVI values in the pre-eruption images from the post-eruption NDVIs, for spatially collocated pixels, yielding a raster dataset of pre/post-eruption NDVI differences. A negative NDVI difference thus indicated areas where vegetation has been damaged and/or covered by volcanic deposits; the NDVI difference can have any value between −1 and 1, from completely unvegetated (or ash-covered) to completely vegetated (or ash-free). To simplify the interpretation a threshold was chosen, usually −0.1 or −0.125, to represent the change that was considered significant and interpreted as being produced unequivocally by the deposition of volcanic material (e.g., tephra fall). Cloud cover limits the use of reflectance based remote sensing data in the visible and NIR bands. Clouds and cloud shadows were visually identified and masked in all the images; such masks were then applied to exclude cloudy areas and any associated noise and biases from the data analysis. Finally, the raster maps obtained from the NDVI differences were simplified, by applying a low-pass filter (e.g., 15 × 15 neighbour pixel average operation) to the threshold maps and converting them to polygons that mapped the tephra-covered areas.
The NDVI difference approach in general is not suitable for detecting changes in areas that were originally non-vegetated, like the upper flanks of the volcano or the active barrancas. In such cases other band combinations can be tested to see if a suitable band or combination of bands could be used to detect and identify the new deposits. In particular, the visible and NIR bands of a pre-eruption image were subtracted from the corresponding band of the post-eruption image. A trial-and-error approach was adopted using single bands (e.g., pre-eruption Band 1 minus pre-eruption Band 1, etc.) but results were not satisfactory. Also, the same band on pre and post-eruption dates was analyzed with the same approach as NDVI differences for a time-dependent analysis.
Processing of the visible, NDVI and other band combinations yielded a series of maps of changes between the pre- and post-eruption images, which were then interpreted in terms of new eruptive deposits and other volcanic processes. Additionally, volcanic structures in the vent region and upper flanks of Fuego were also mapped visually using RGB images. PDCs can be highly erosive; they engrave channels and incorporate pre-existing material as they move downhill. This produces characteristic features along the PDC path that can be detected by comparing pre- and post-eruption images. Comparing images from a longer time-series with those captured during short-livedevents allow us to distinguish changes in crater morphology associated with background and paroxysmal activity.
4. Results
Eruptive deposits and volcanic structures mapped with the methods previously described were compiled into a GIS platform (ArcGis,Ⓡ Environmental Systems Research Institute, Redlands, California, United States) for interpretations and analysis. Here we describe the different types of deposits and structures separately as interpreted from our analysis.
4.1. Lava Flows
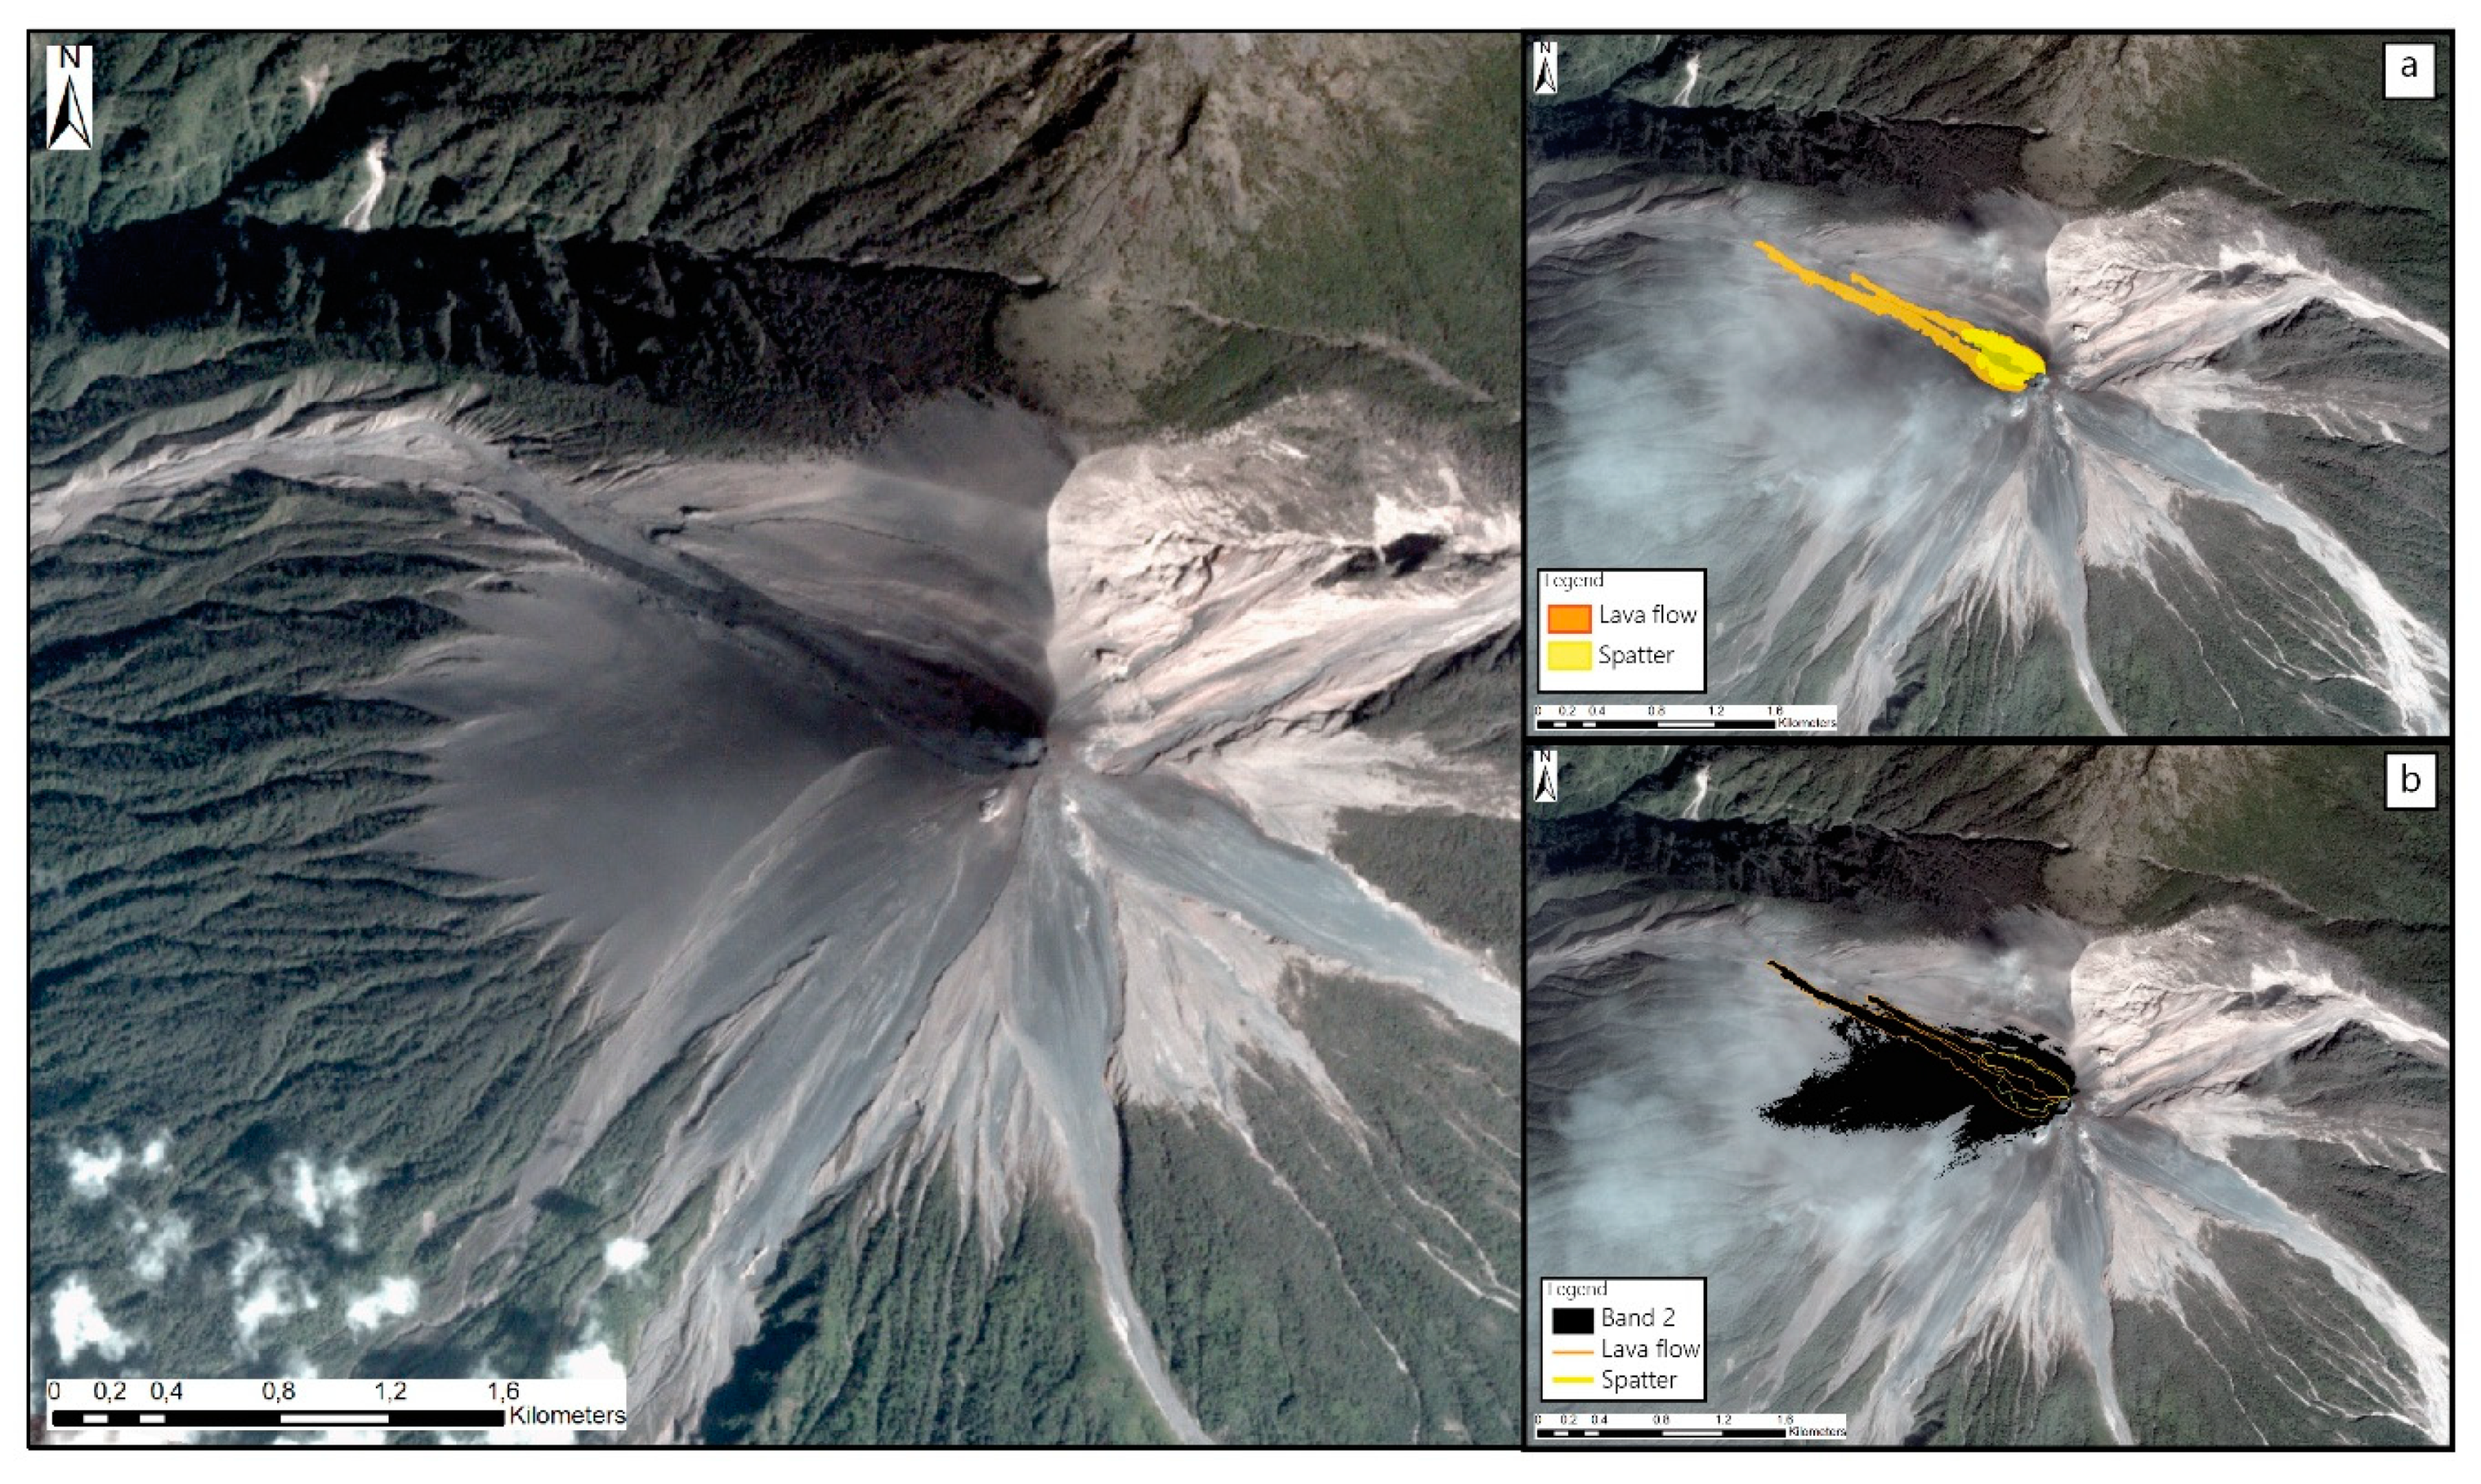
Deposits optically identified and interpreted as two lava flows erupted during the February 2018 paroxysm are shown in Figure 3. These lava flows moved down the NW slope of Fuego. The longest of the two reaches a length of ~2000 m and they respectively cover areas of 0.12 and 0.18 km2. They are representative of the beginning of the activity; a Strombolian style eruption characterized by sustained lava fountains and bombs. At the beginning of the activity the upper flank is characterized by spatter deposits and lava flows (Figure 3a). Distinguishing these deposits is difficult because of the lack of contrast between them. In this case, the morphology plays a crucial role for the distinction between the smoother lava flows and the rugged surface of the spatter deposit. Automated detection of different deposits on the highest part of the edifice is more difficult. In fact, neither the NDVI difference nor any other simpler band operation gives good results for this kind of deposits. It is still possible to map the darker material using single bands and appropriate thresholds. Figure 3b shows band-2 pixel values with digital numbers (DN) <3000 (in a 16-bit image) in the vent region; similar results were obtained for the other three bands. The result is closer to the optical map of the deposits shown in Figure 3a, but with some additional signal (likely due to tephra fall) on the upper west flank.
4.2. Tephra fall
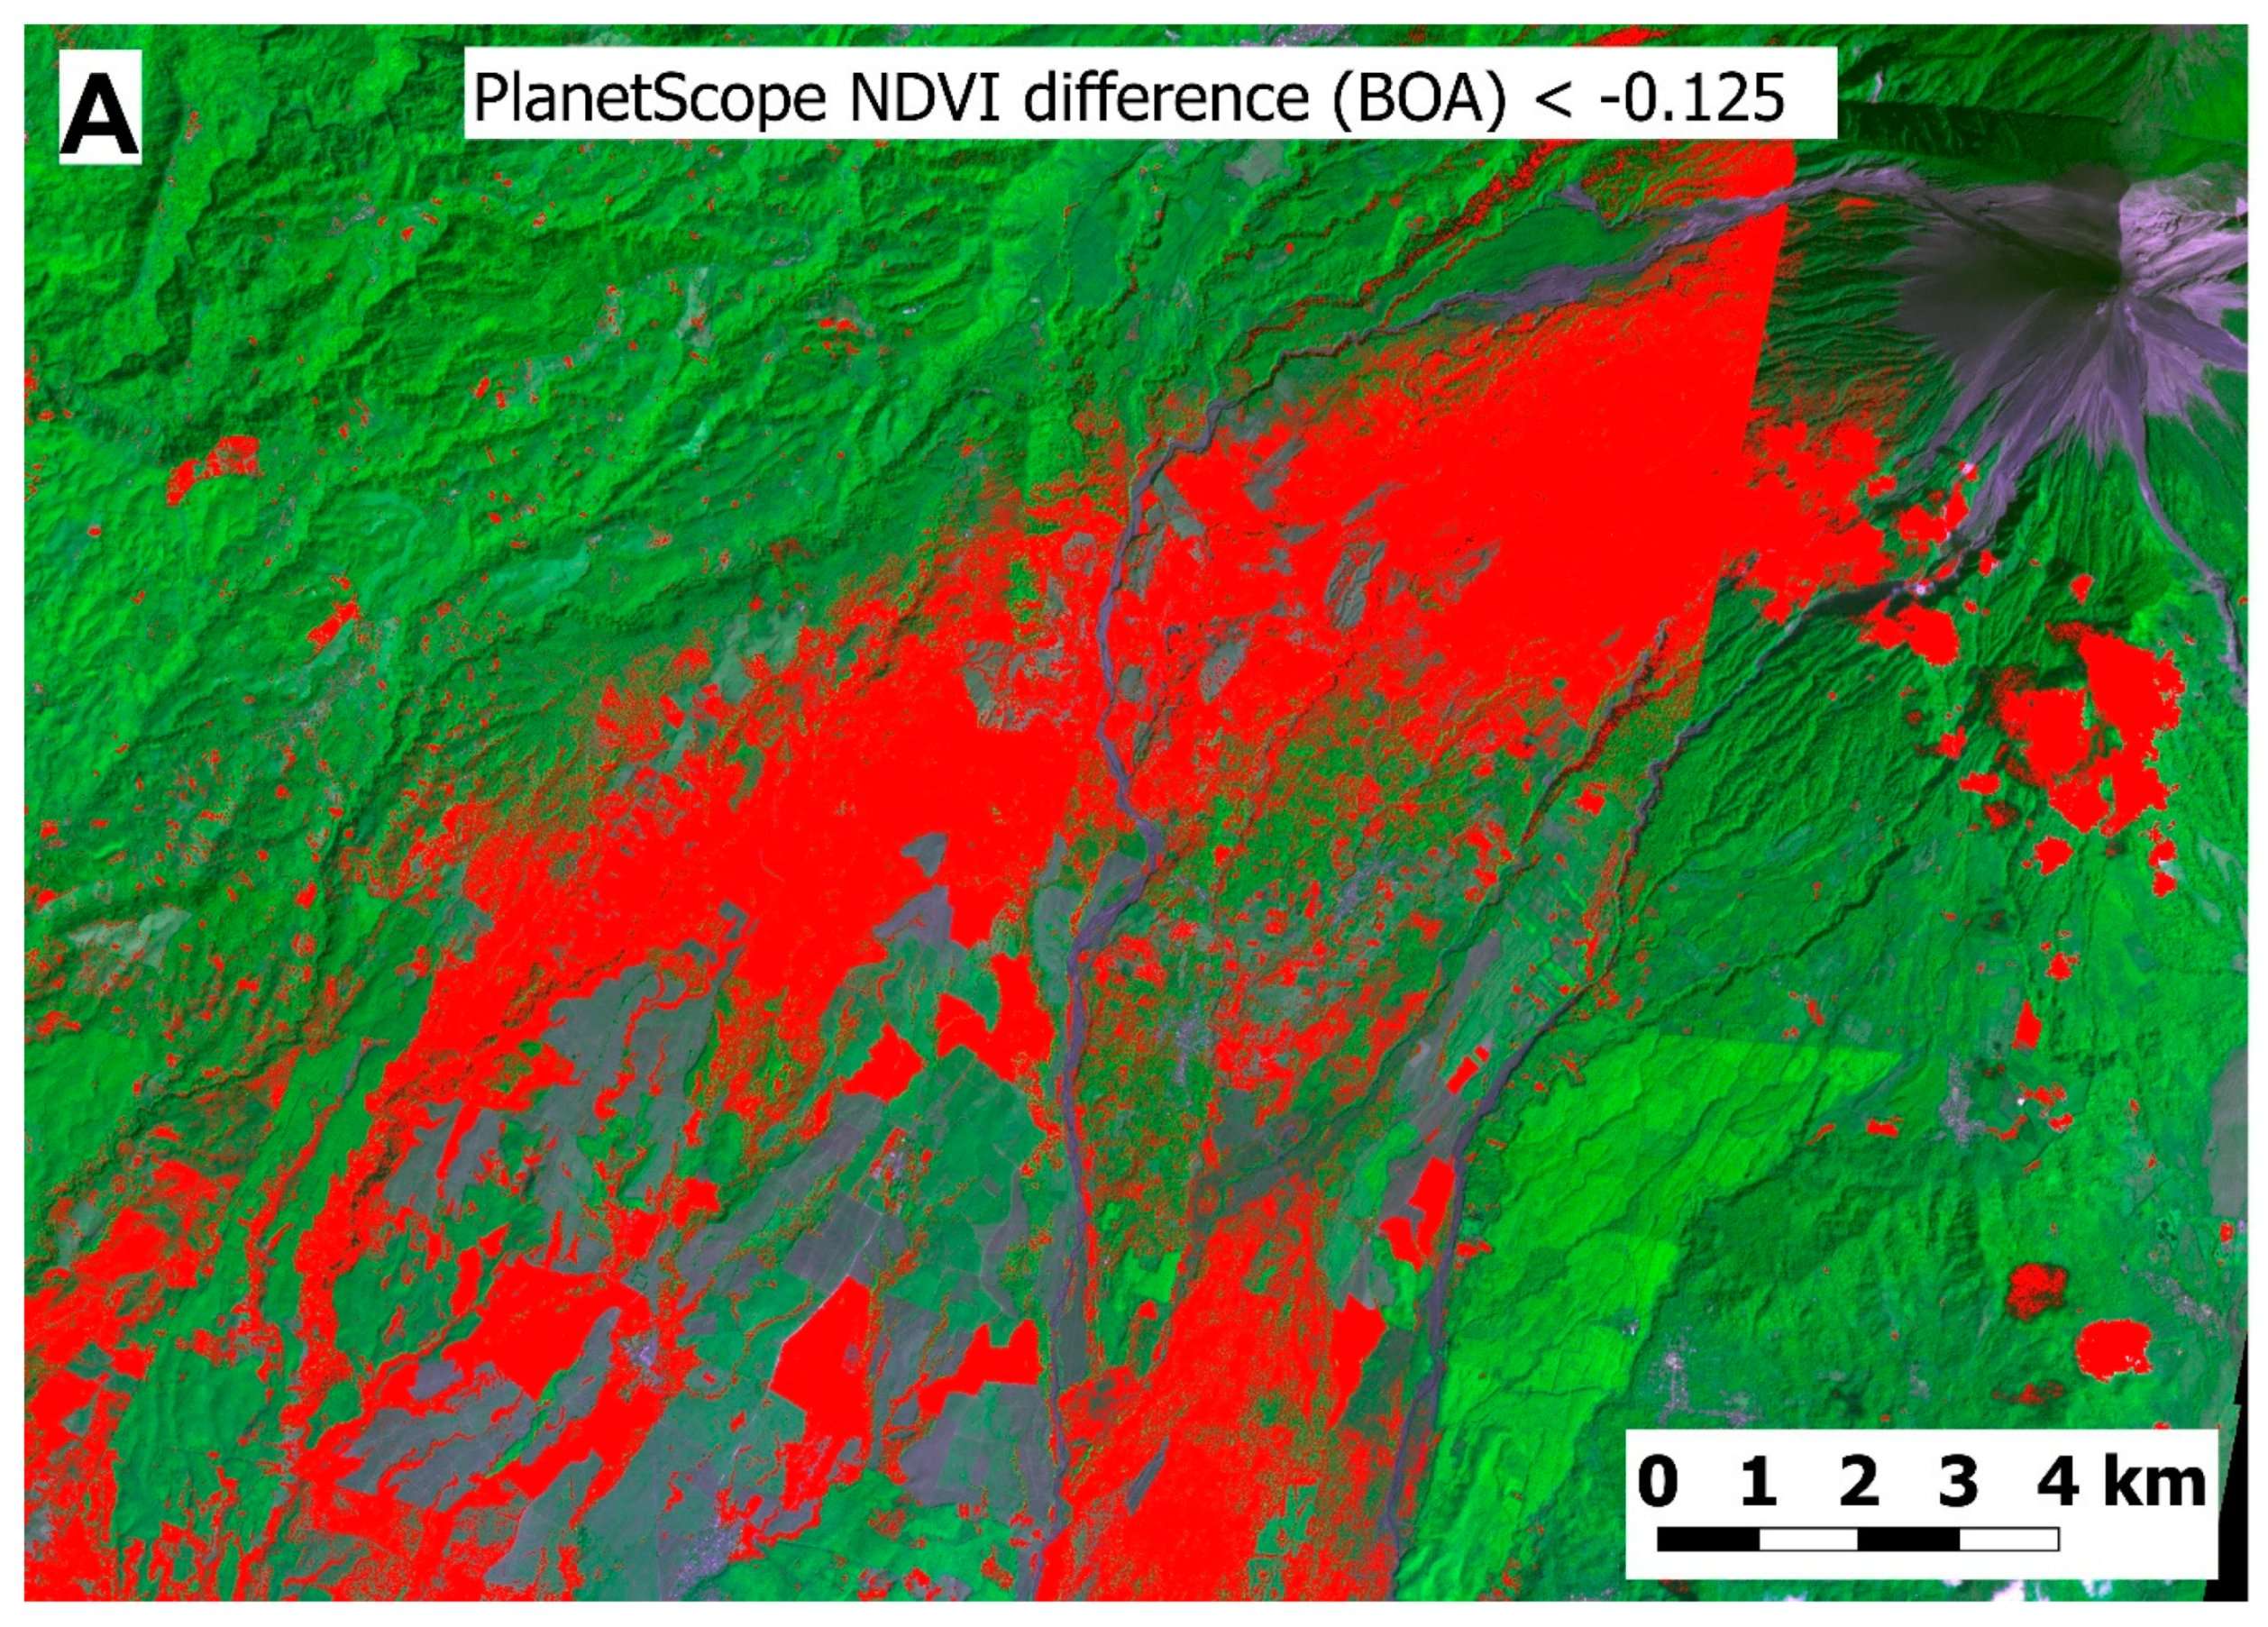
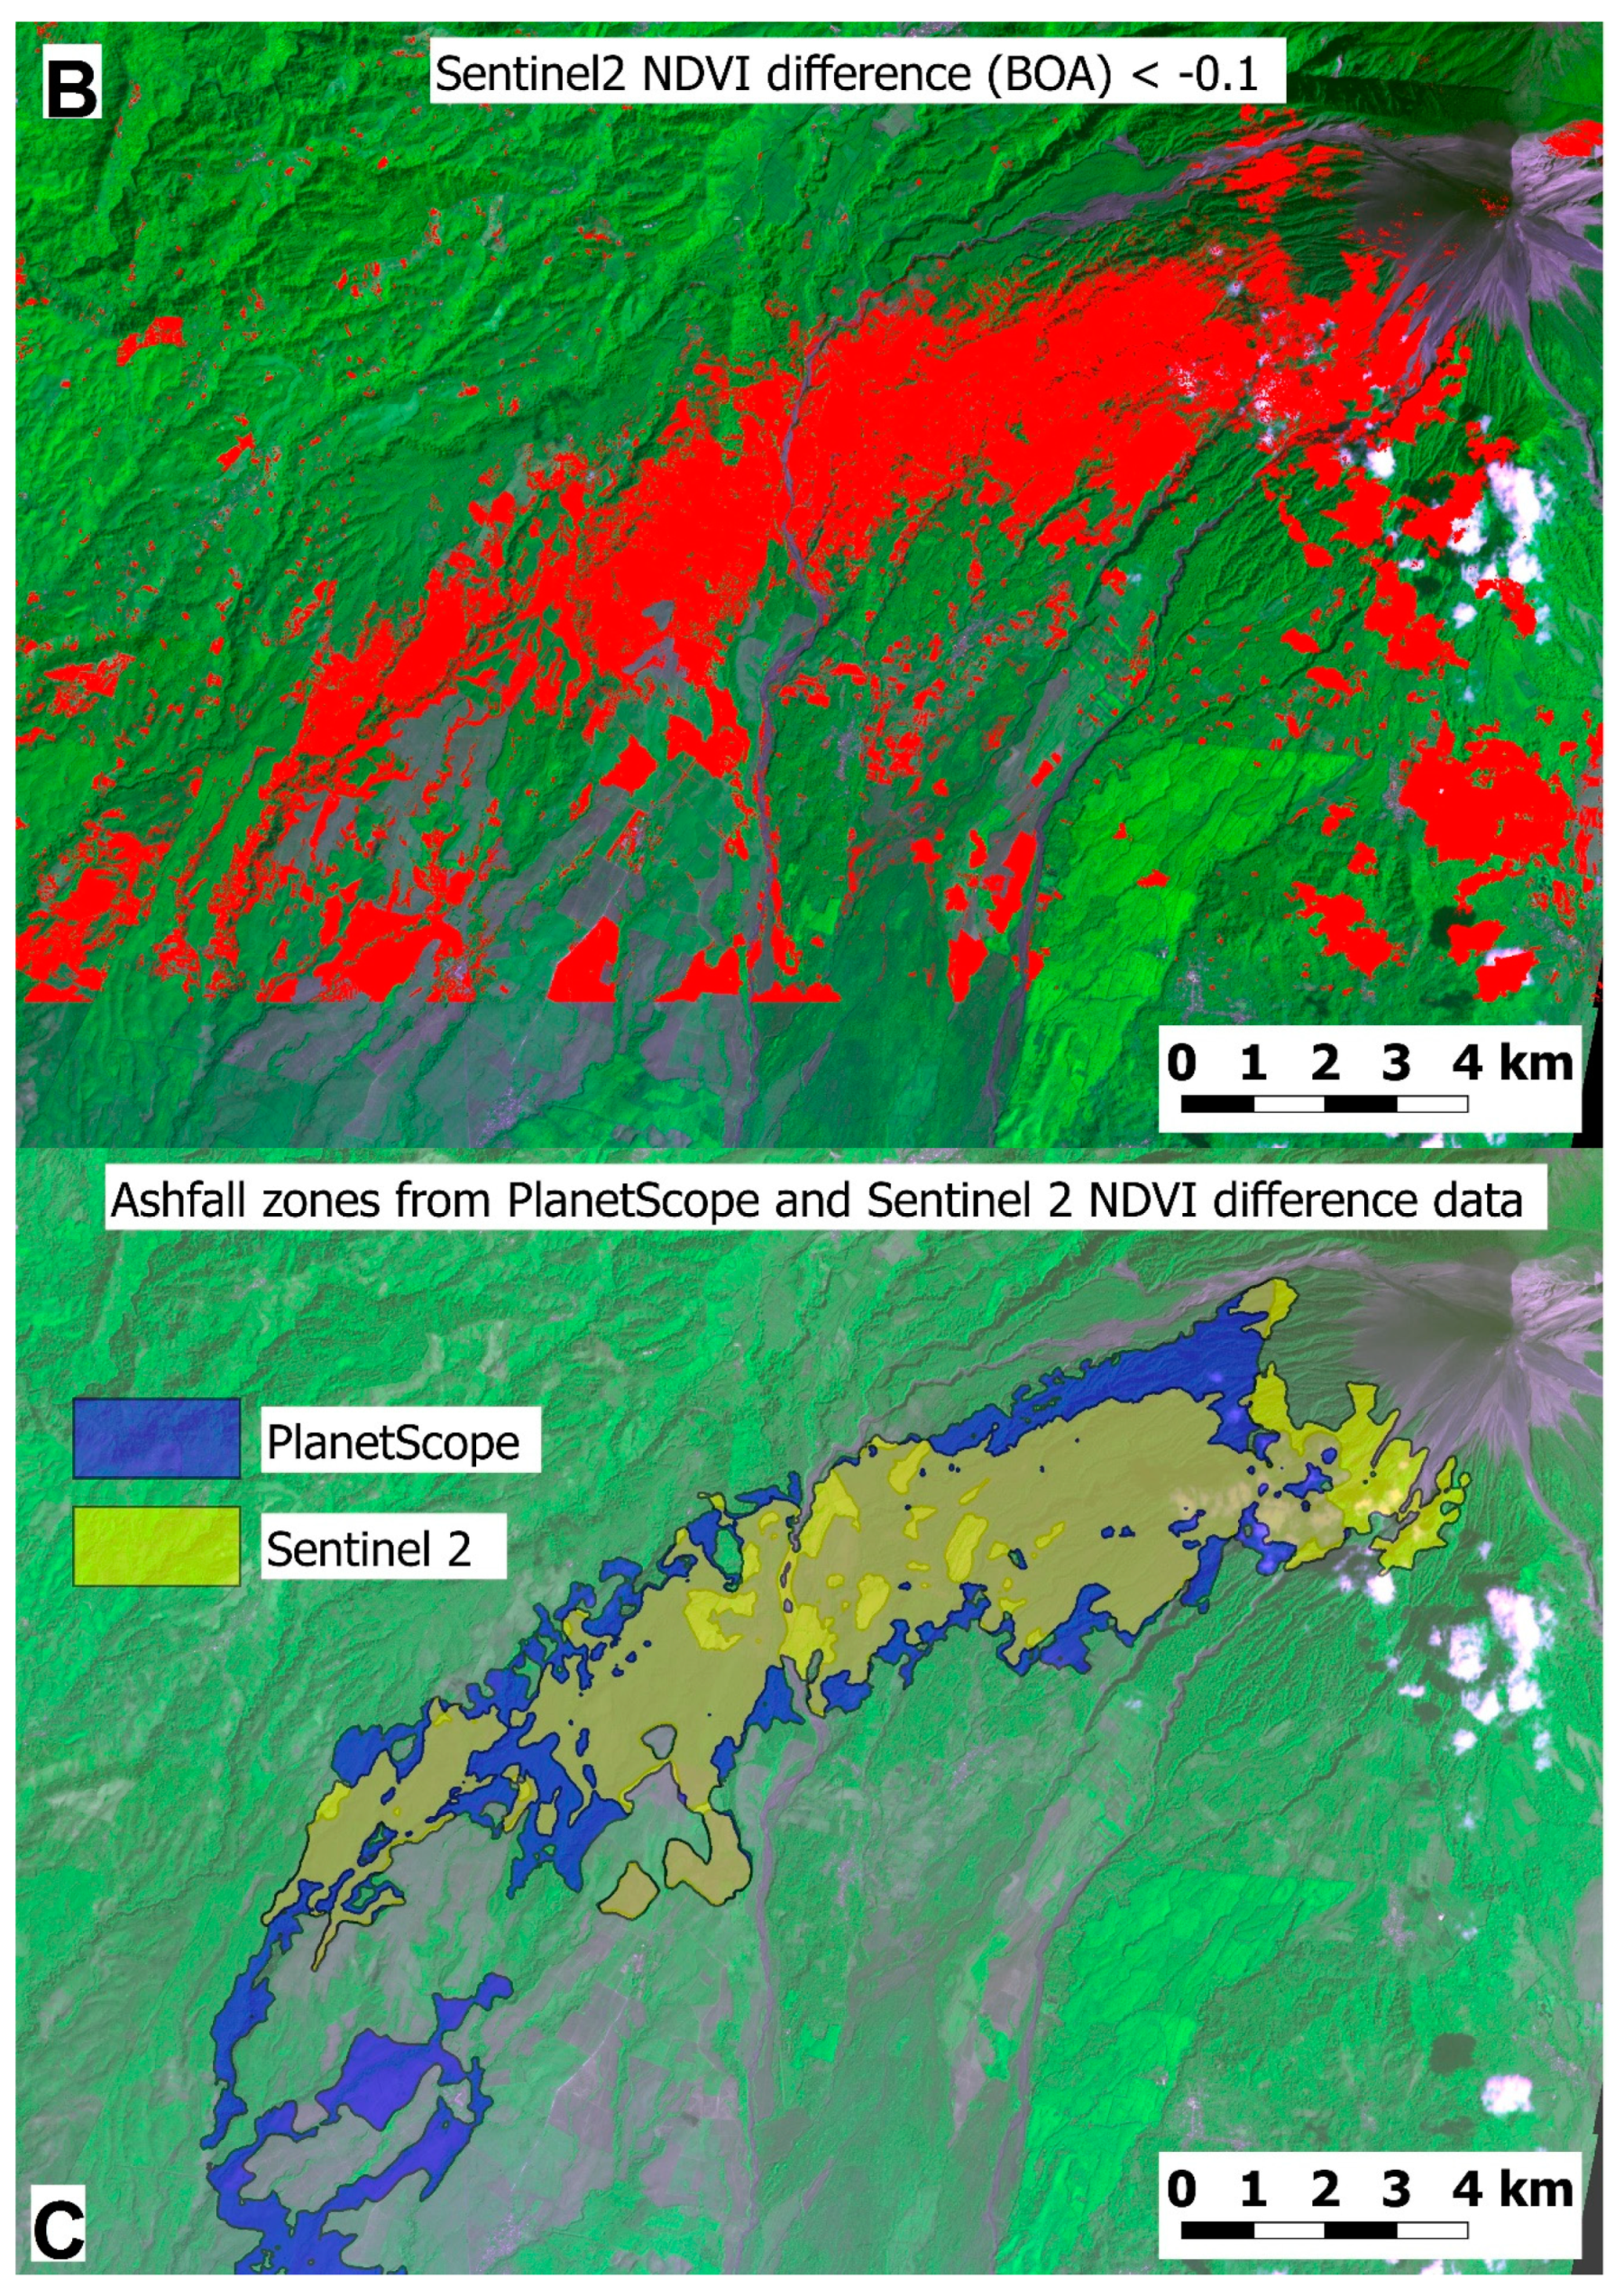
During the February 2018 paroxysm the eruption column reached over 6000 m height (Figure 2) and was mostly dispersed to the west of the volcano. Figure 4 shows the tephra deposit extent obtained from the NDVI difference method. One other image source (Sentinel 2) was also processed in a similar way for comparison. For the PS images, the NDVI difference is calculated using an image collected in January 2018 and another right after the eruption. In order to have a meaningful comparison between PL and Sentinel 2, the post-eruption images are both from 4 February (Figure 5), with pre-eruption images from 9 January (PS) and 10 January (Sentinel 2). Slightly different thresholds were used to delineate the tephra fall covered areas for each image source; for the PS imagery a threshold of −0.125 was used for the NDVI difference values (i.e., pixels with an NDVI difference <−0.125 were considered to be covered with ash) which gives an area of 41.5 km2 for the ash covered vegetation. For Sentinel 2 data, a NDVI difference threshold of −0.1 was used, which results in an ash covered area of 35.6 km2. Deposits derived from the two data sources are similar to each other in shape and orientation (Figure 4), and both show limitations in detecting the very proximal tephra fall deposits (i.e., in non-vegetated areas).
4.3. Pyroclastic Density Currents
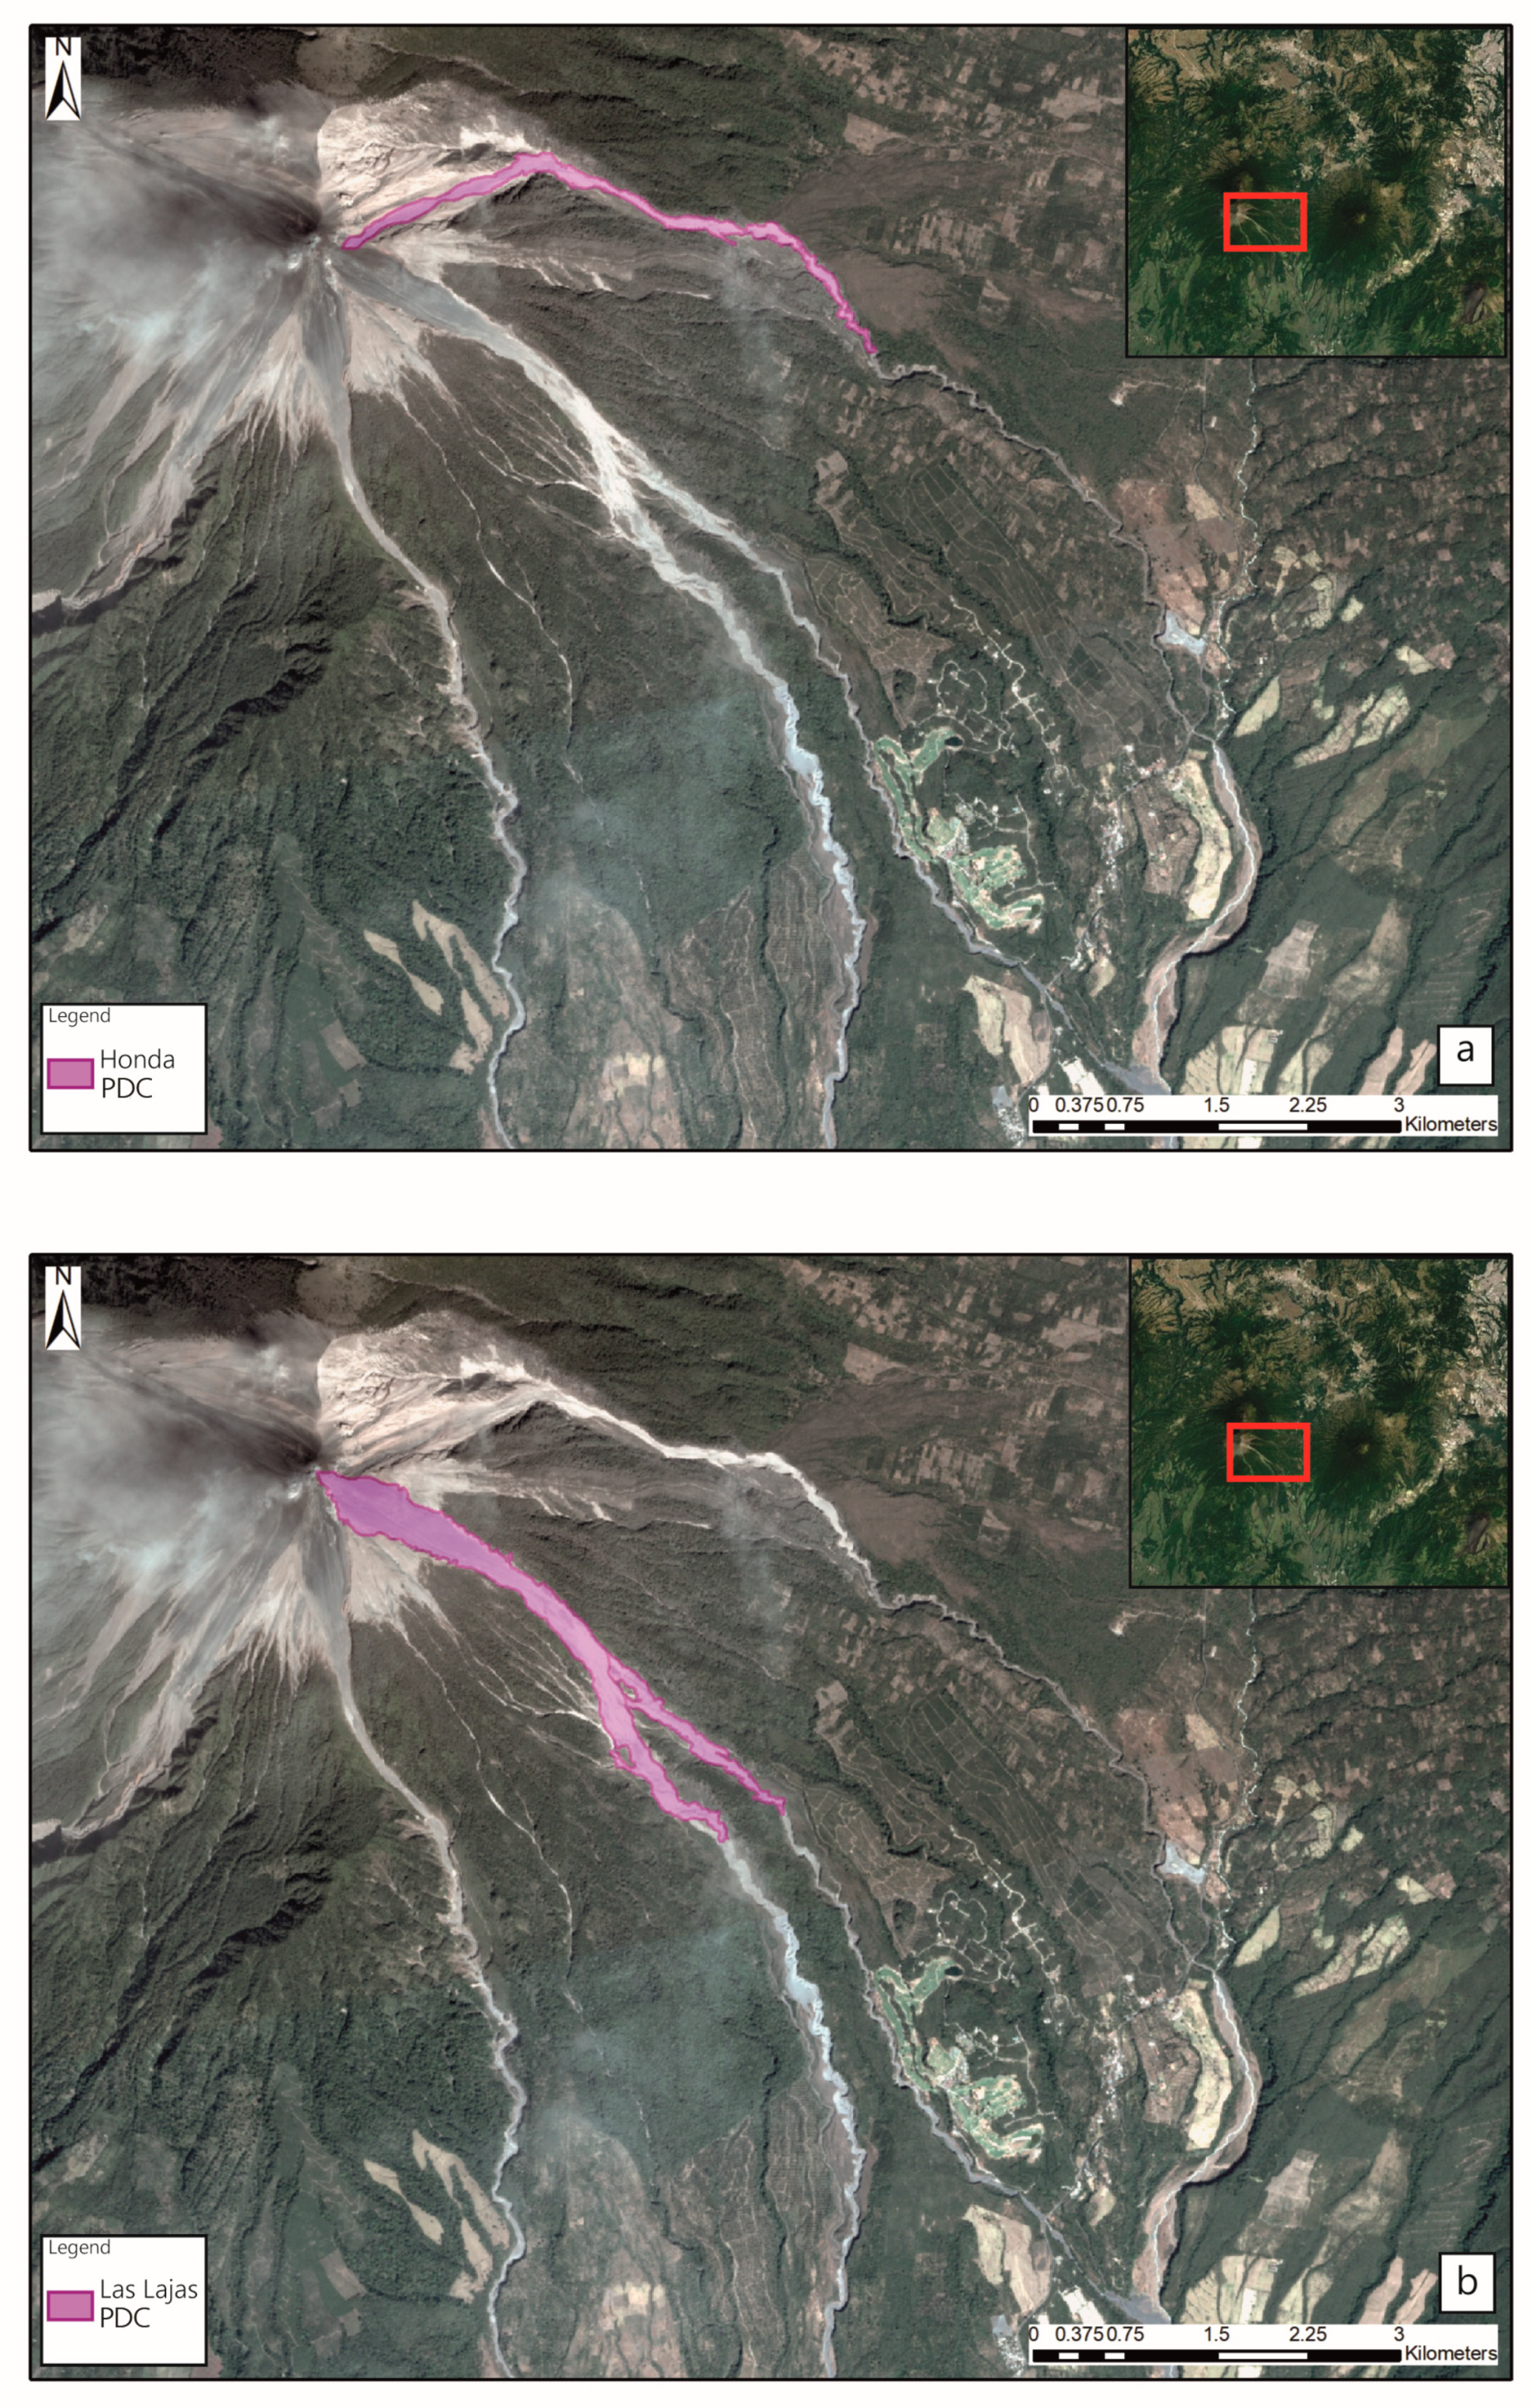
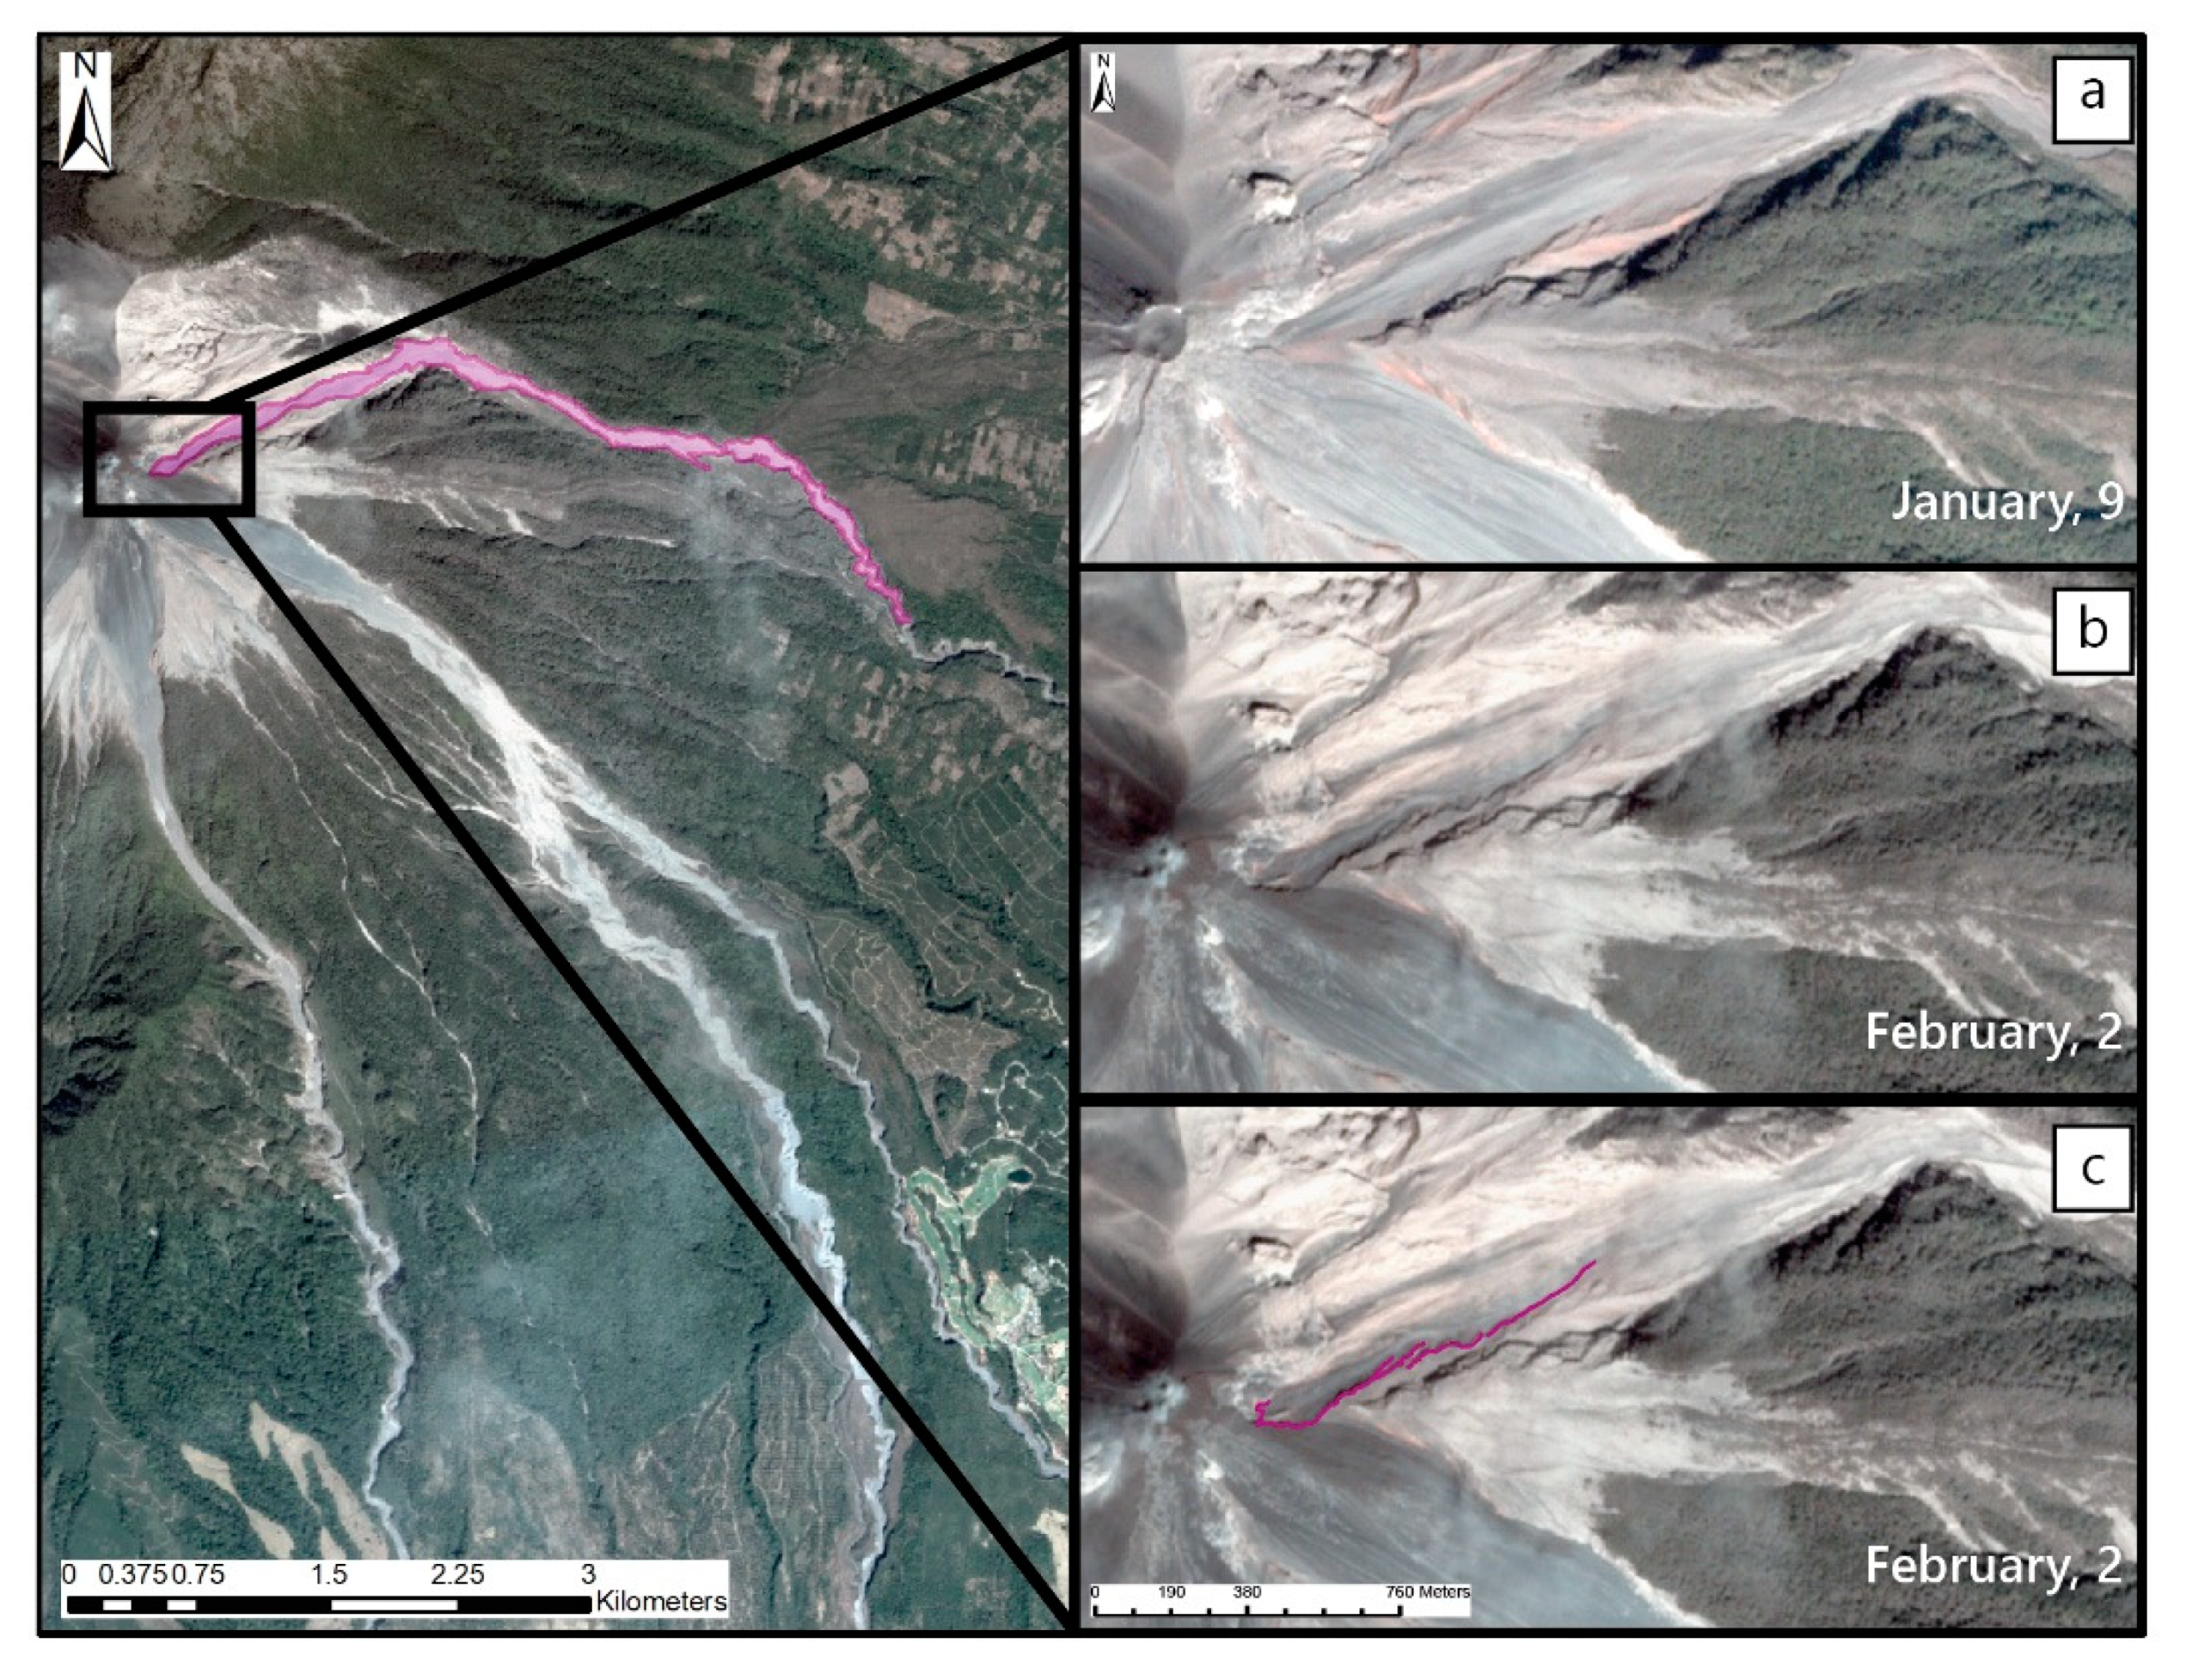
The PDC deposits from the eruption were mapped visually and are shown in Figure 6. The PDC material in Barranca Las Lajas and El Jute covers an area of 1.24 km2. The second PDC deposited in Barranca Honda covered an area of 0.43 km2. The use of automated methods (e.g., NDVI or other indices or single band differences) to delineate the deposits was not successful for the whole deposit in any of the barrancas, due to the lack of pre-existing vegetation in these zones. Figure 7 demonstrates the value of high spatial resolution PS imagery for identifying morphological changes associated with eruptive activity. A scar located SE of the Fuego vent region in the upper reaches of Barranca Honda indicates erosion and/or collapse of the steep upper flanks. The orientation of the scar suggests that the derived material must have contributed to the PDC emplaced in barranca Honda.
4.4. Structures Near the Vent and the Upper Cone Area
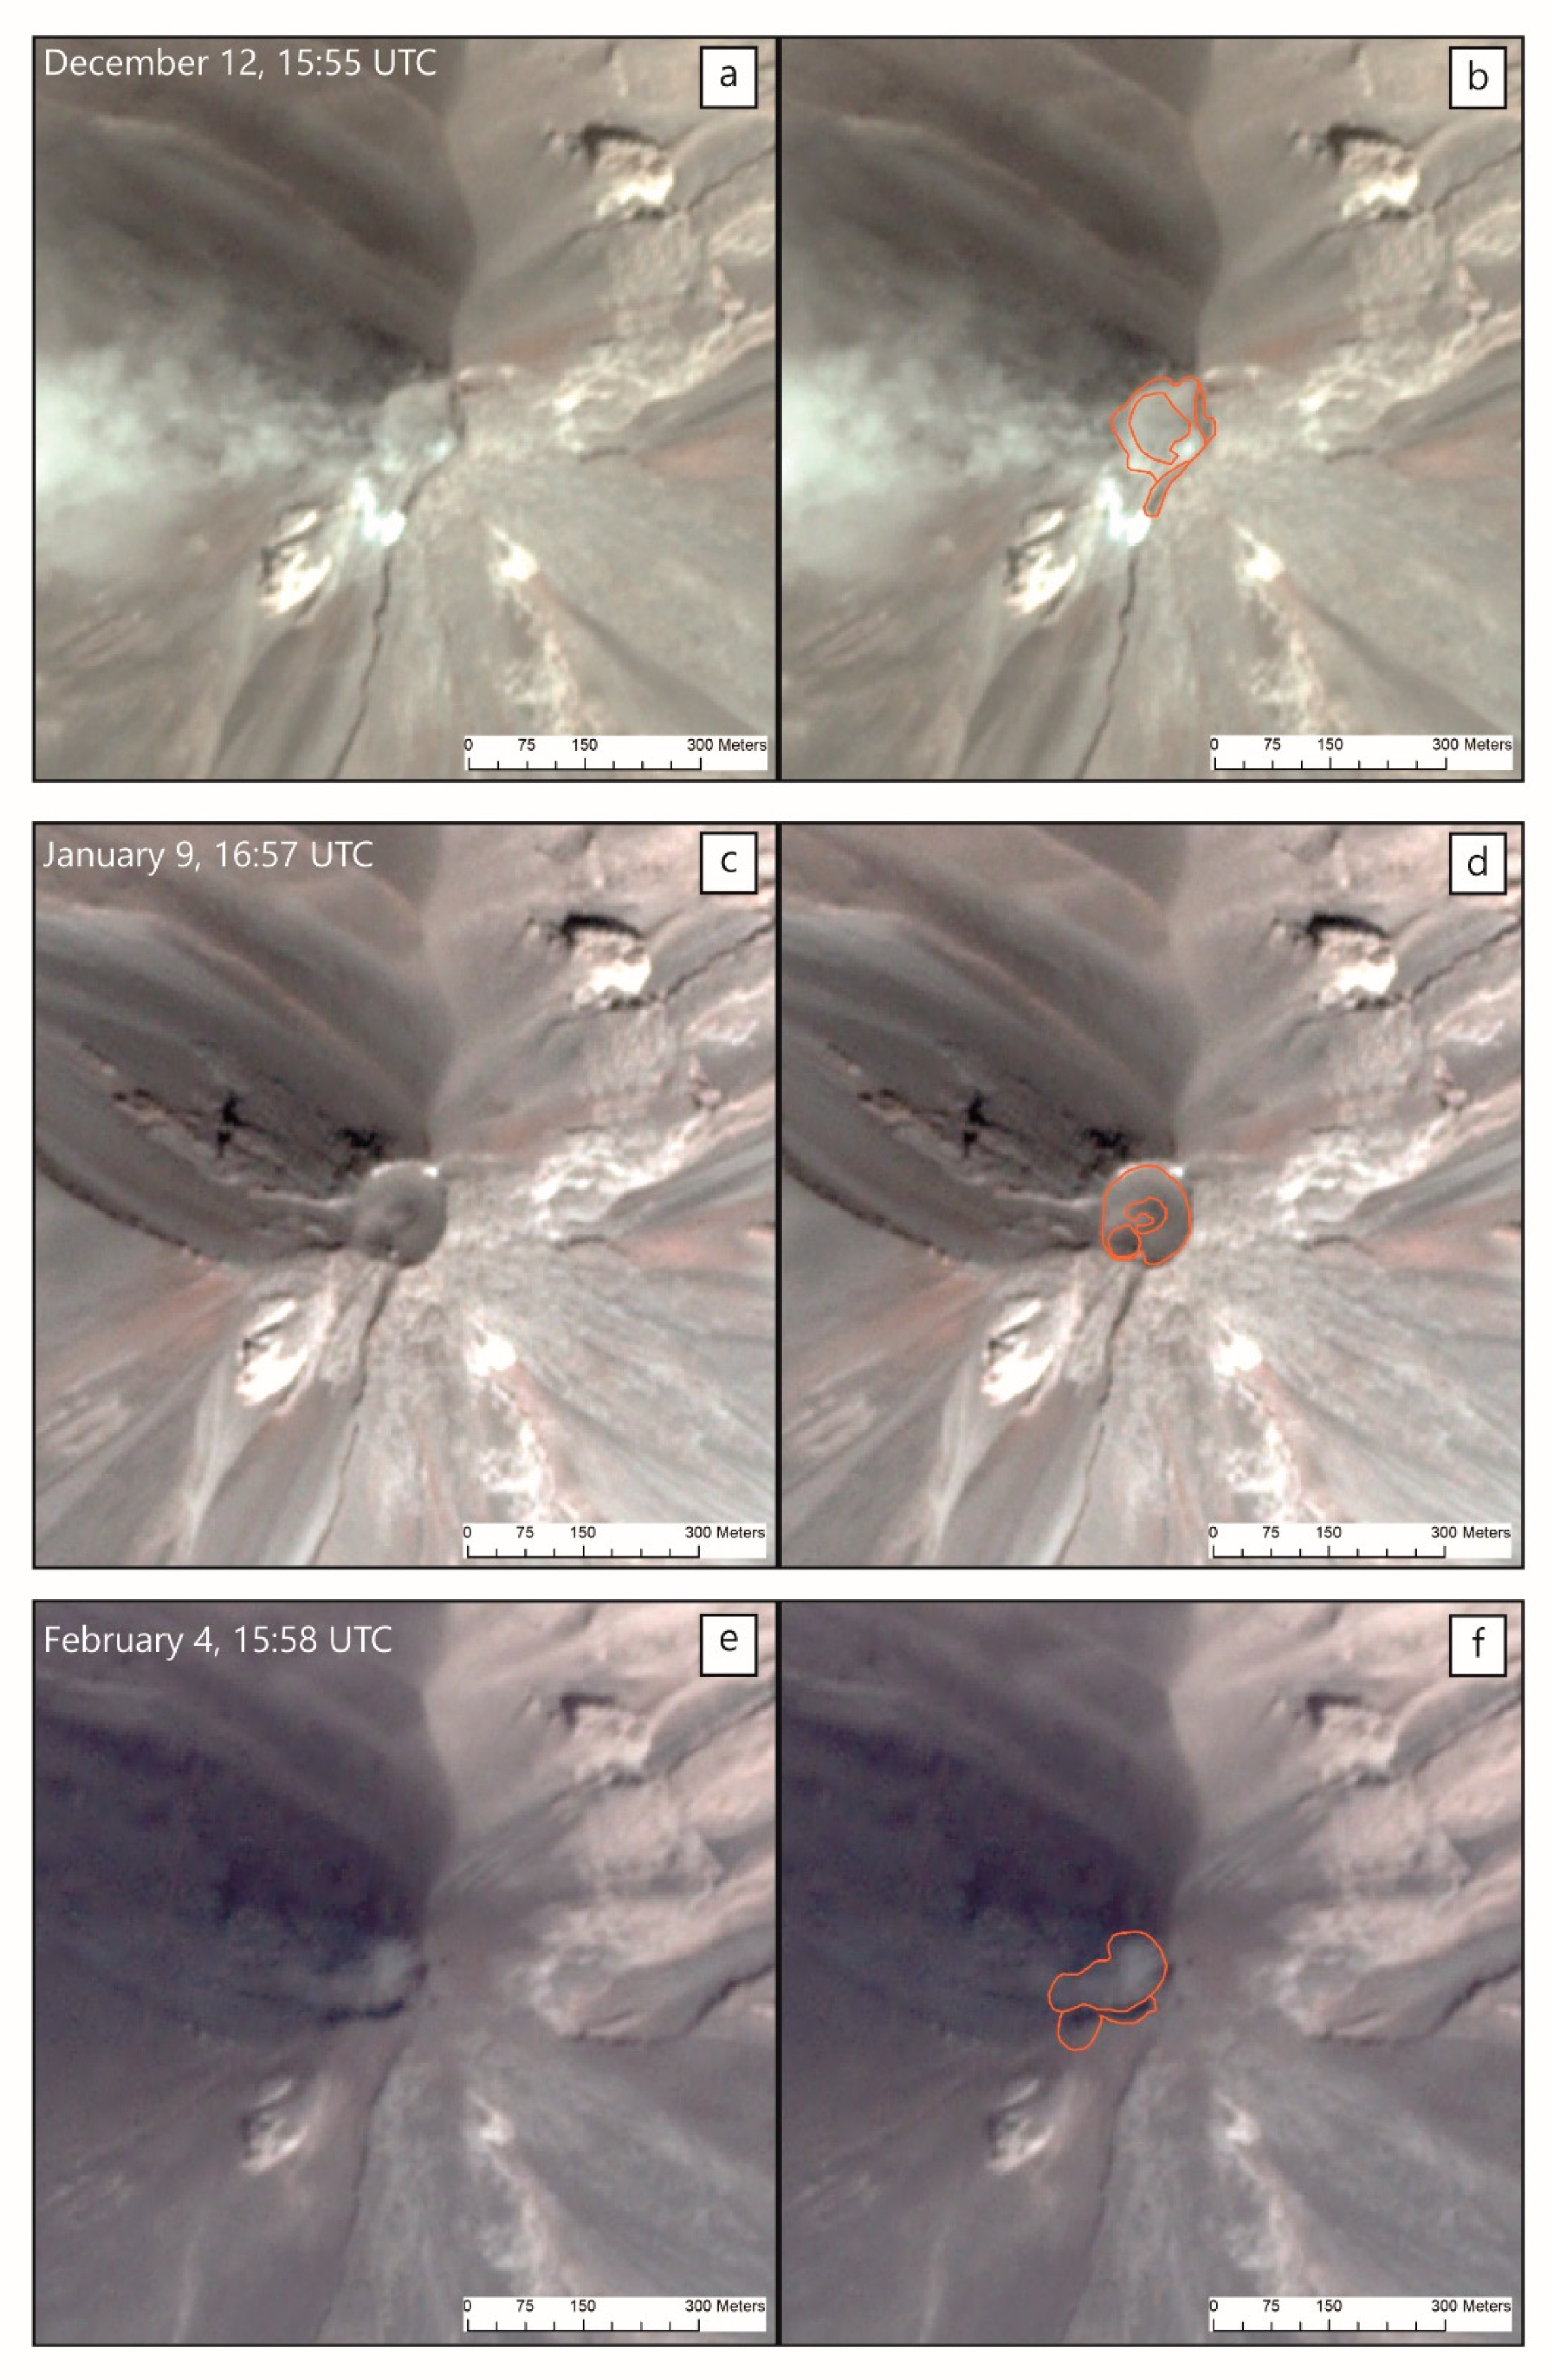
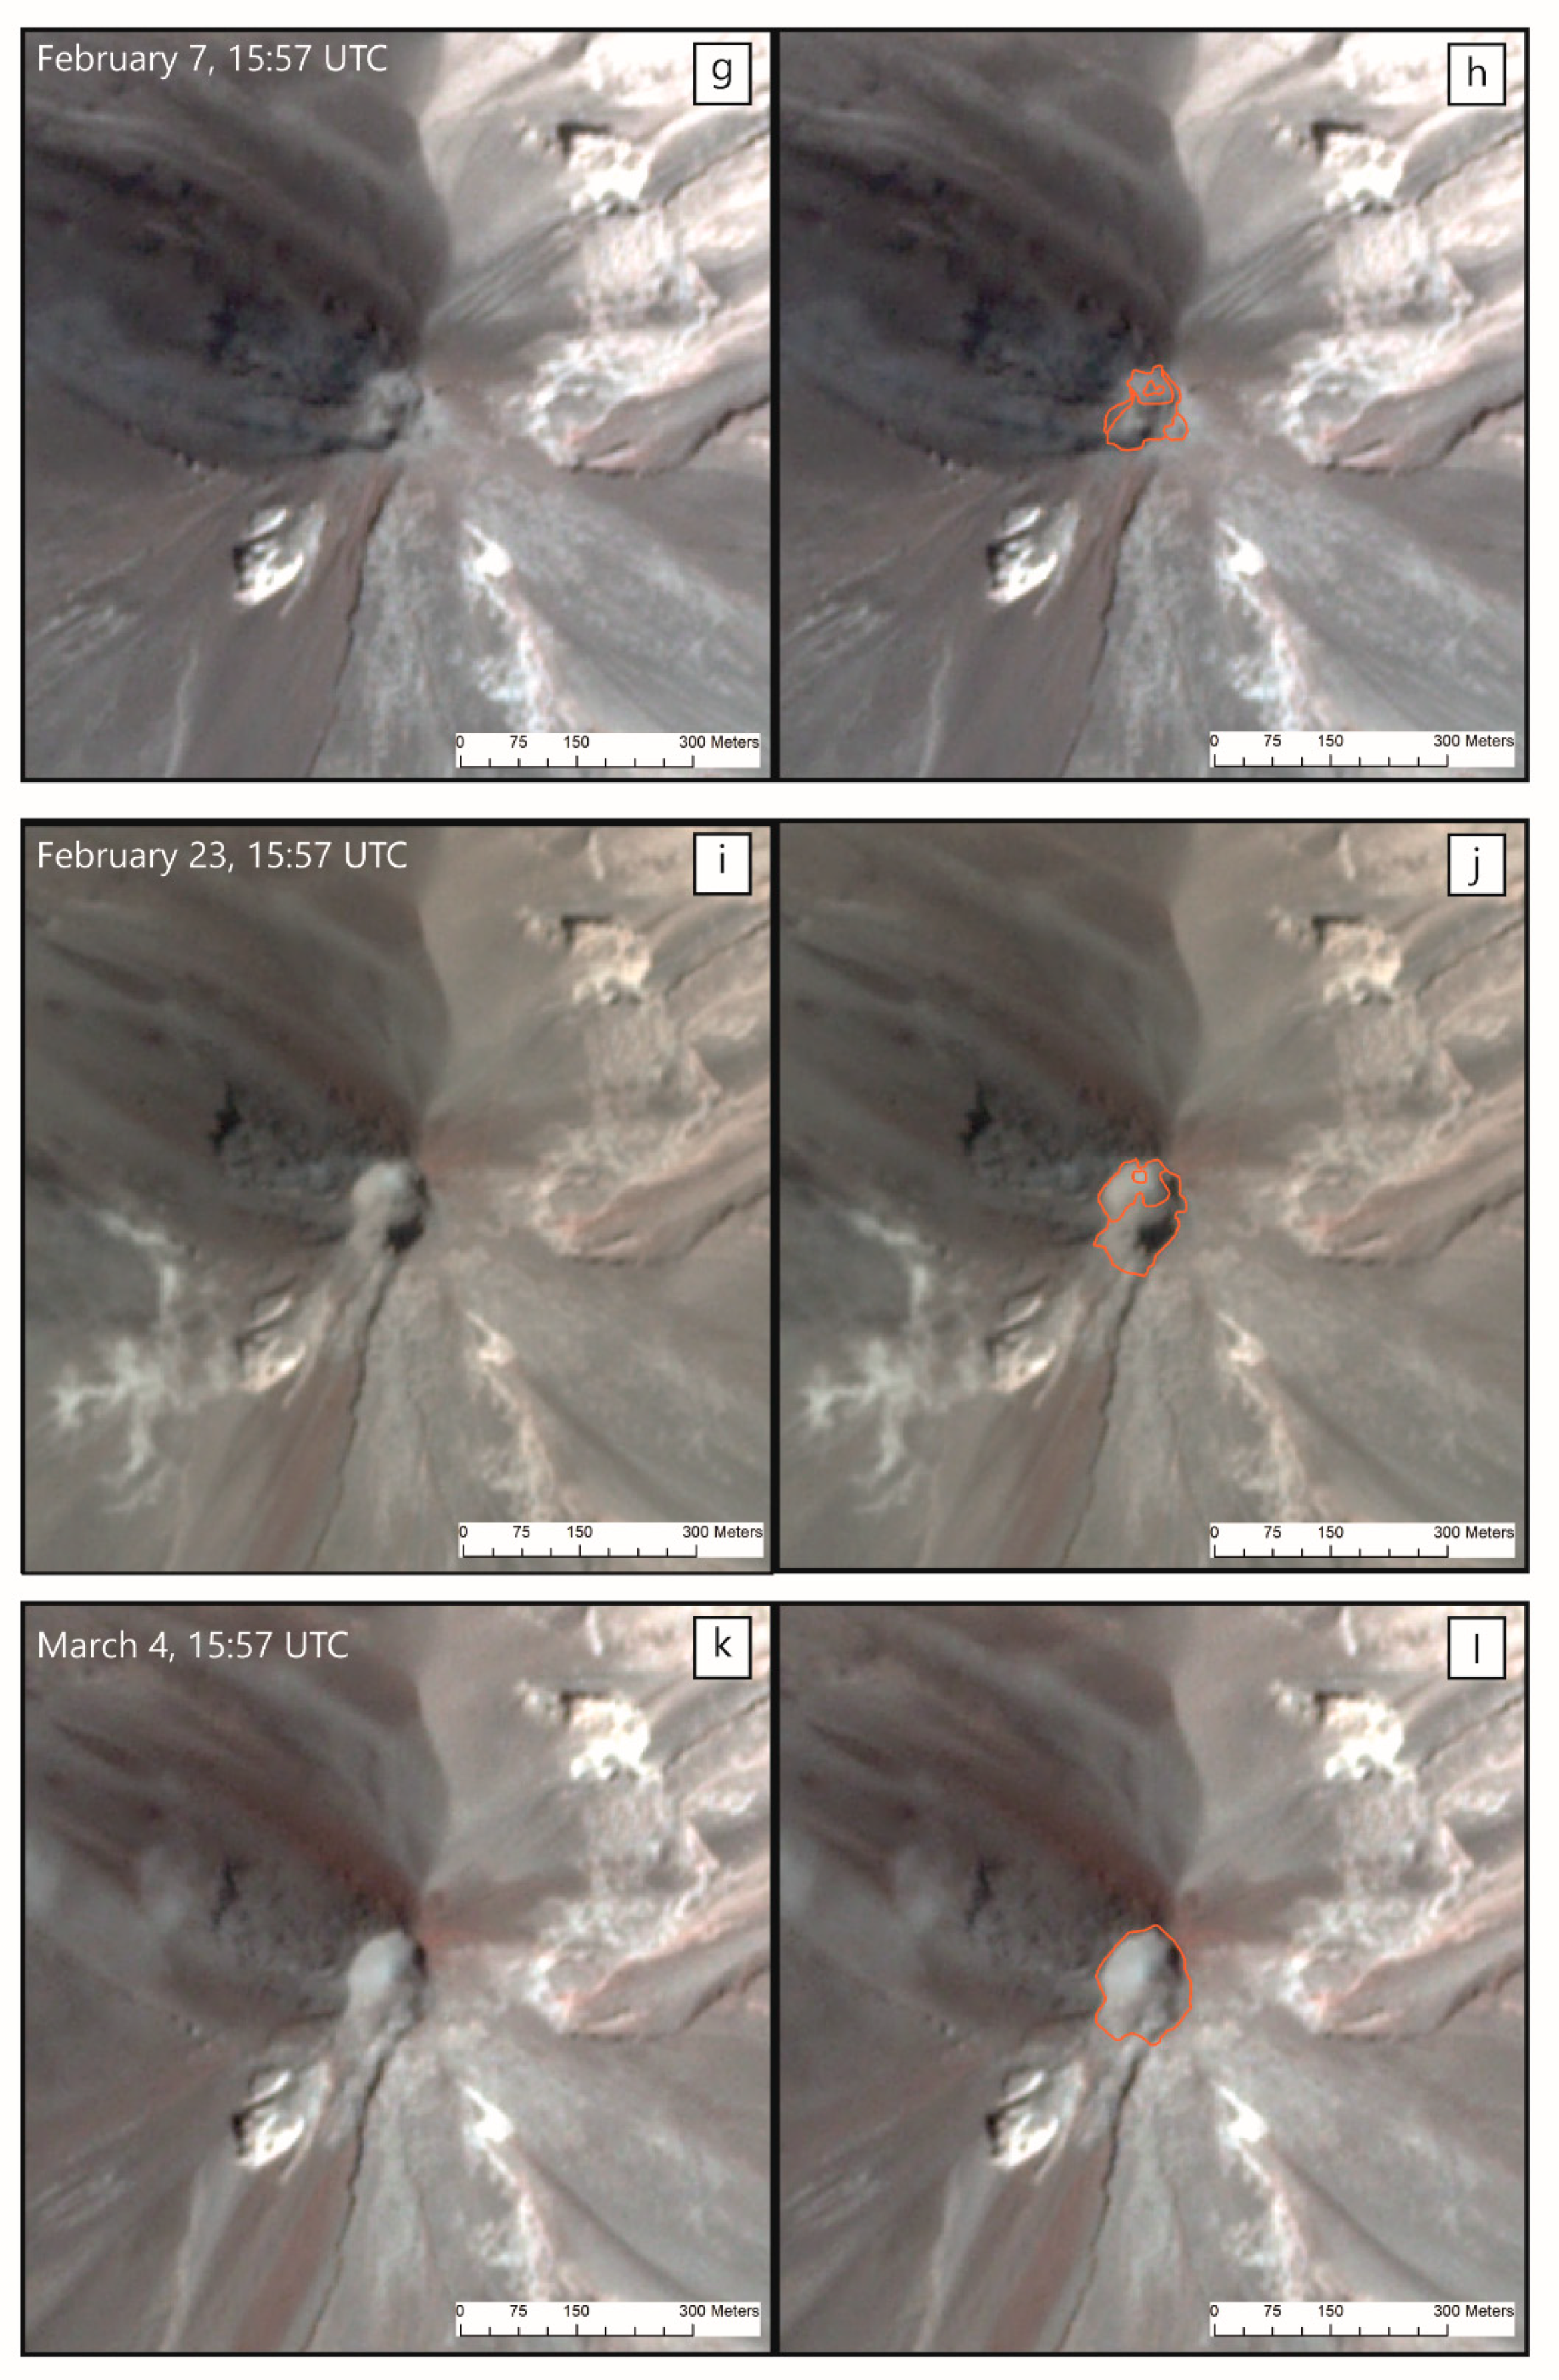
The persistent activity of Fuego volcano, including background activity, causes frequent and often continuous variations in the morphology of the summit. Tracking such changes, which may provide important indications of future activity, is very challenging from the ground and typically requires overflights by manned or unmanned aircraft, which may be infrequent. Figure 8 shows some of these changes identified using PS imagery collected over a period of ~ 4 months, from December 2017 to March 2018. A roughly circular vent in December 2017 evolved into a well-defined circle with a clear summit crater in January 2018. During the paroxysmal activity at the end of January and beginning of February 2018 the crater morphology changes substantially and material appears to overspill down the upper west flank. In subsequent images, cycles of crater excavation and infilling can be discerned (Figure 8). The high temporal and spatial resolution of PS imagery thus provides a novel ability to track morphological variations in the inaccessible regions of active volcanoes, such as Fuego, before, during and after eruptions.
5. Discussion
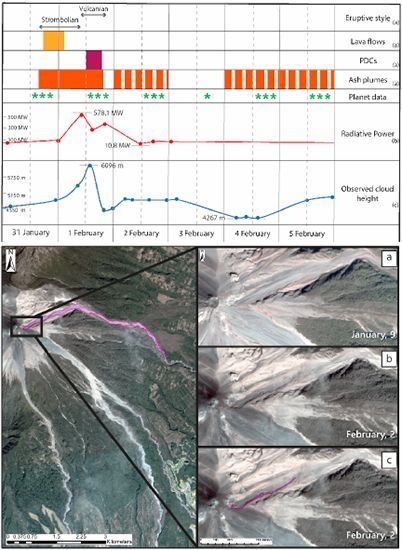
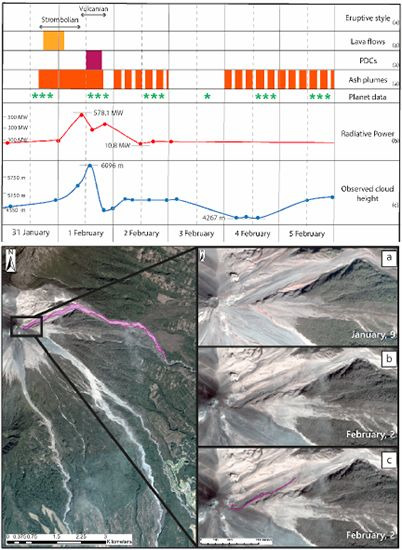
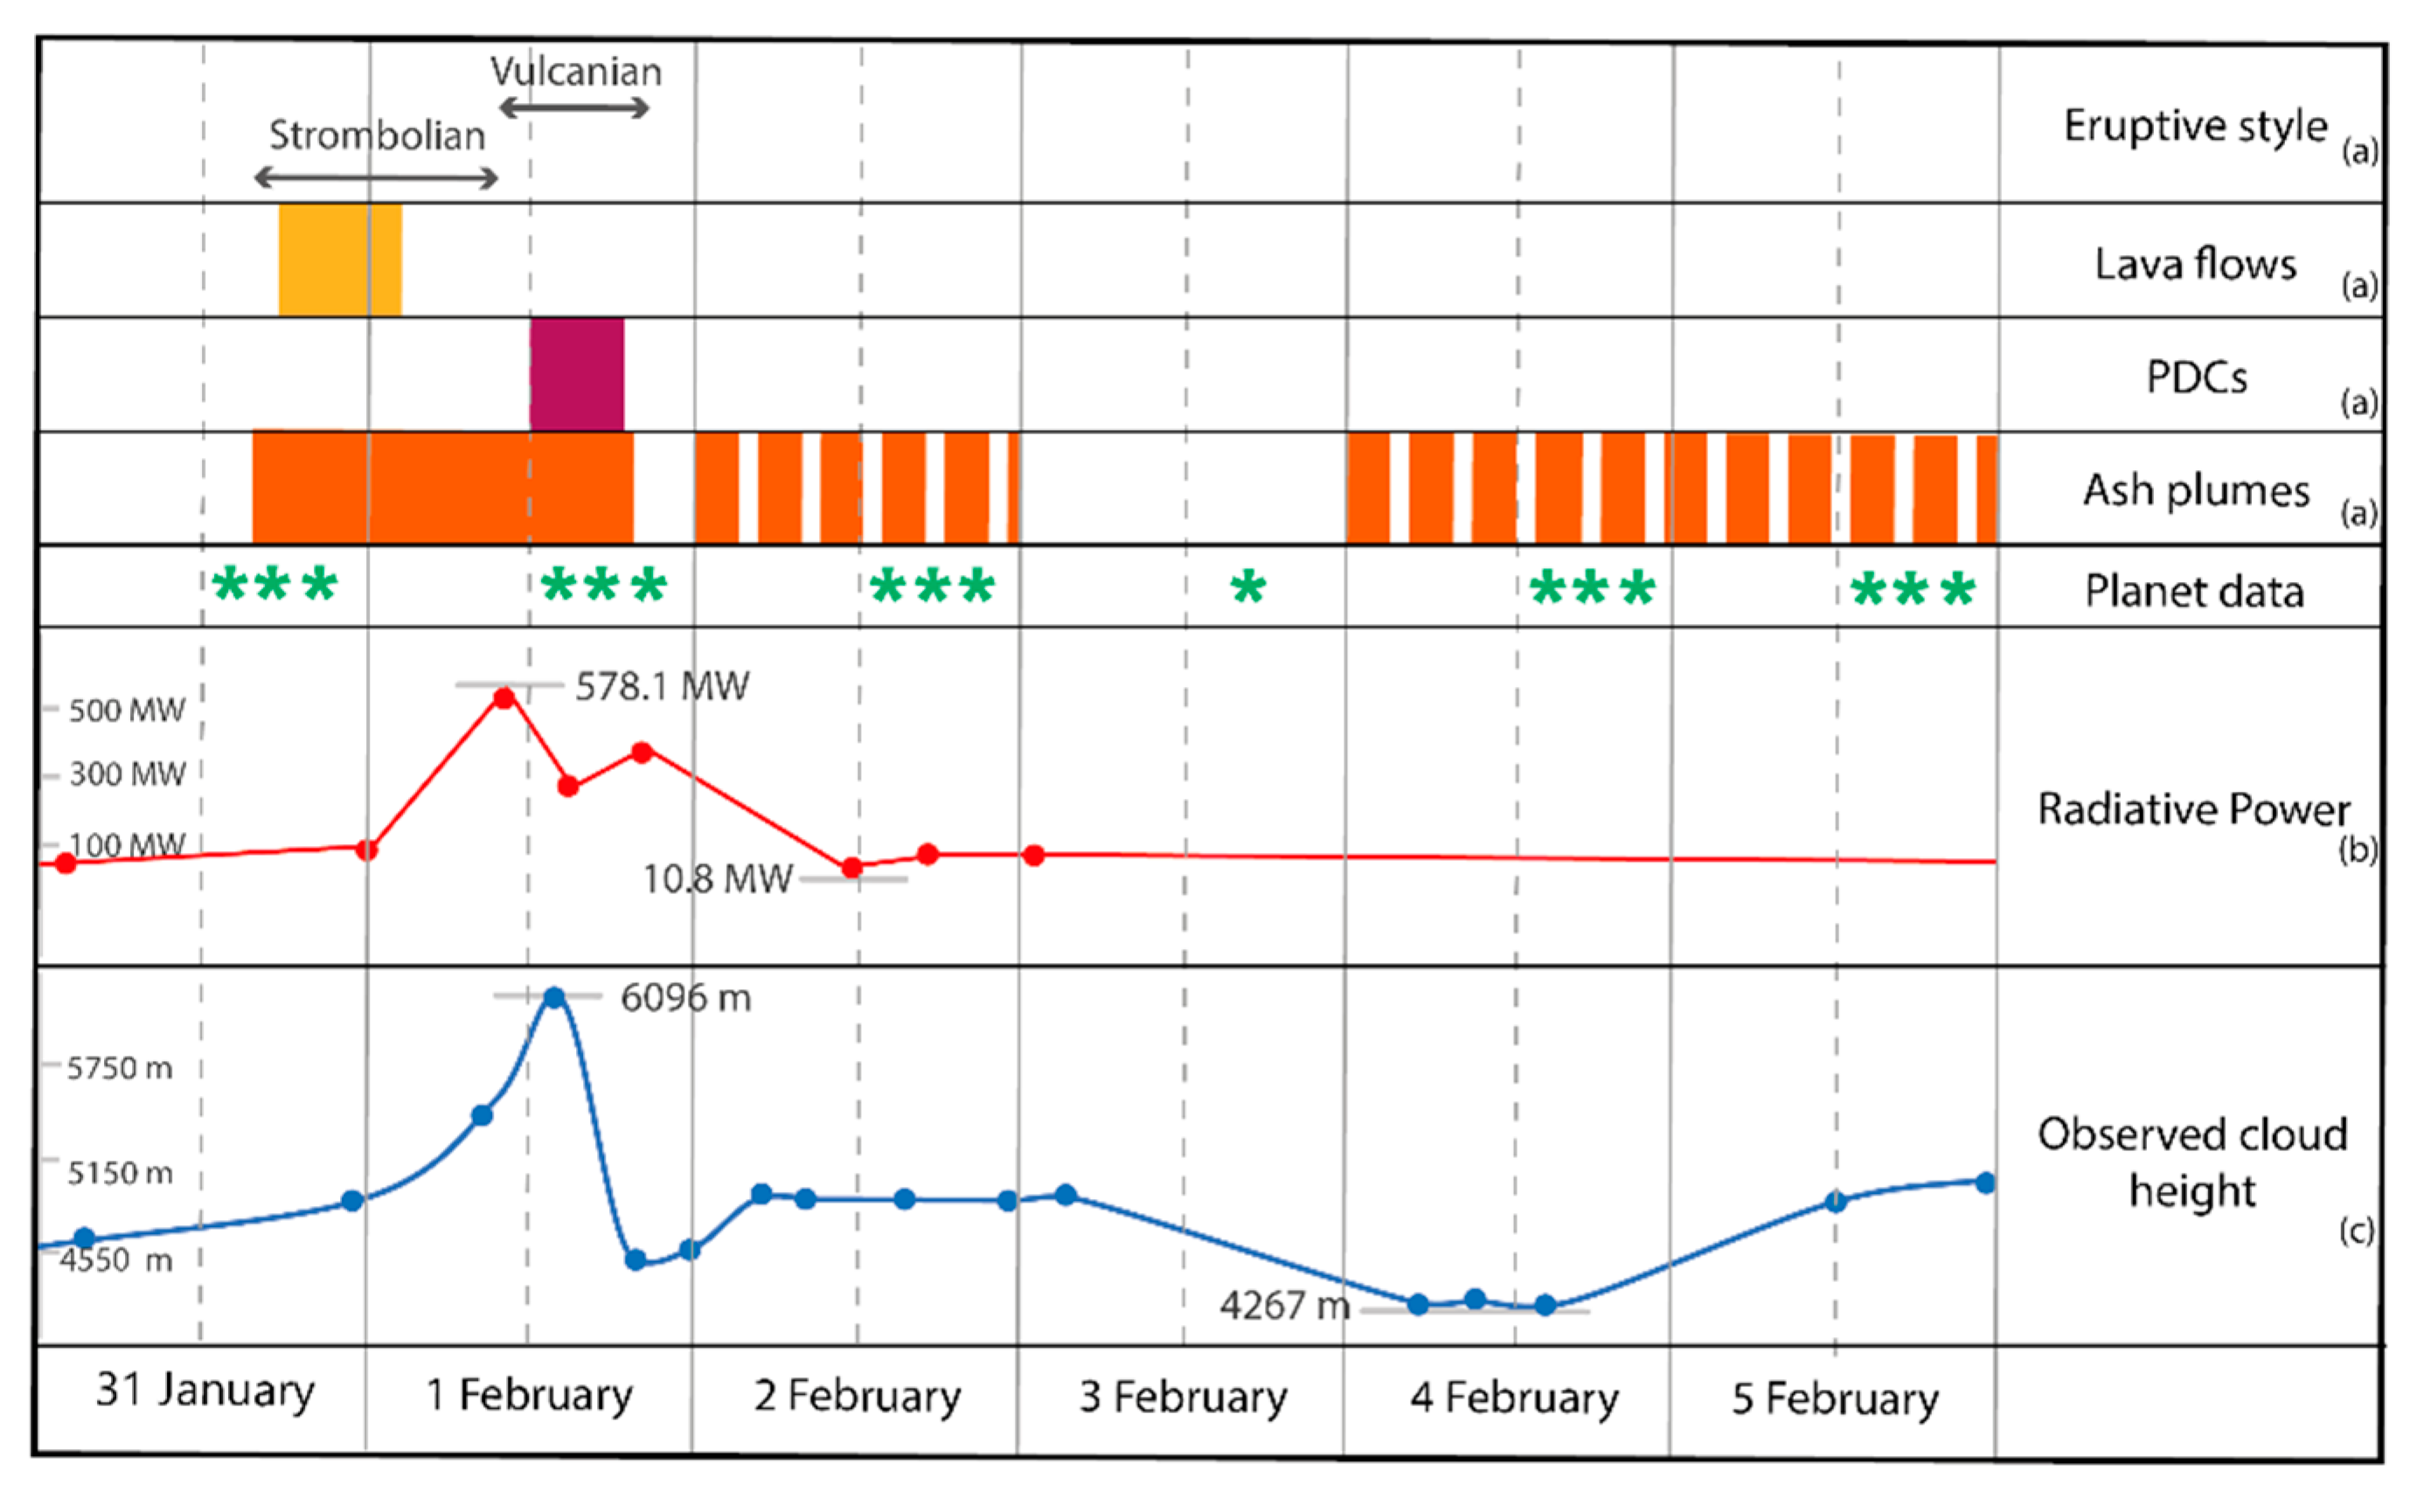
The February 2018 eruption of Fuego lasted for approximately 20 h [24], and a summary of the activity is shown in Figure 2. The activity was captured by a monitoring webcam on the SE-flank of the volcano, located ~6 km from the vent. A video of the webcam images that tracks the full eruption can be accessed at https://youtu.be/JHwKFPTGAQk and https://youtu.be/4jdfmf3j4ww. Two types of activity can be distinguished: Strombolian to violent-Strombolian activity, characterized by lava fountains, lava flows and a small eruptive column developing over the active vent, and a second type of activity generating PDCs. The variety of eruptive processes and products generated during this short eruption presents a unique opportunity to test the capability of PL satellite data to identify and map volcanic deposits quickly after they have been emplaced.
In the case of the lava flows, the visual mapping using the visible bands gives good results. Attempts to use band differences or index-based methods (e.g., NDVI) did not work well. Although fresh (still hot) lava flows can be mapped using thermal (usually TIR and SWIR) bands [15], our results show that mapping lava flows with high resolution (~3 m pixel size) visible images can be a good alternative provided the new lava flows show enough contrast with the background. The Smithsonian Institution Global Volcanism Program (GVP) reported a maximum length of 800 m for the lava flows, but from the mapping, it is clear that the length reaches ~2000 m for the longest branch and ~1500 m for the shorter lobe (Figure 3). This shows that the detailed mapping possible with PS images can significantly improve the estimation of such parameters. The two branches in the lower part of the lava flow are easily identified from the visible bands but closer to the vent region it is necessary to do a more detailed analysis. The use of a threshold on a single band highlights a larger area which comprises spatter, lava flows and tephra. Visual mapping of the February 2018 lava flows allows us defining some important volcanological features and better understand the importance of this eruption in the history of the Fuego volcano. According to [33] the mean thickness of recent lava flows, which are mainly basaltic in composition, is 2 to 4 m, therefore we estimate an approximate total volume of 900,000 m3 of lava was emitted during this eruption (the total area of lava flows is 0.30 km2, with an average thickness of 3 m). Considering the eruption duration (~20 h), we derive an approximate effusion rate of 12 m3/s. The total volume of lava flows and PDCs (the latter being more difficult to assess, as discussed below) confirms a VEI of 2 [24] for the studied eruption. According to [33], the lava flow length, volume and effusion rate of the February 2018 activity are values typical of paroxysmal eruptions of Fuego. It is worth noting that this paroxysmal eruption occurred only five months before a VEI 3 eruption (June 2018).
Similar considerations apply to the mapping of PDC deposits. Our attempt to map the PDCs using single bands or NDVI differences did not give good results, similar to the lava flows. For smaller eruptions of Fuego, such as in February 2018, the material is confined to the channels on the flanks of the edifice, which, for the most active barrancas, are usually non-vegetated, making the use of change detection techniques based on NDVI difference methods more difficult or impossible. A larger event, such as the June 2018 eruption (VEI 3), produces a larger volume of deposits that may overspill the barrancas or cover less frequently impacted areas downstream, so that the detection can be done not only visually but also based on change detection methods. In the February 2018 case, visual mapping based on visible band combinations worked well.
For the tephra fall mapping analysis the NDVI difference technique gave better results, and we consider this a much better alternative to visual mapping of the deposit, given the gradational boundaries of the tephra fall deposits, i.e., the transition from areas with heavy tephra fall to areas with no tephra fall is smooth and may be difficult to define visually. We highlight that this technique can be used with other sensors that include the necessary bands (visible and NIR). Figure 5 shows a comparison between the results obtained from the analysis performed on PL and Sentinel 2 images, and the results show a good agreement, however the practical implications of higher spatial resolution (~3 m PS pixel compared with the 10 m Sentinel-2 pixel) and temporal cadence (up to daily for PS compared with ca. five days for Sentinel 2) can be significant.
Deposition of volcanic material can change the reflectance of the land surface, depending on the type of surface cover present before the volcanic material is deposited, and on the type of volcanic deposit. If the new volcanic material has very different reflectance properties from the pre-existing surface material, the deposition of the new material will result in a strong reflectance change, and possibly also a strong reflectance contrast with the surrounding areas. For volcanoes in highly vegetated regions (a majority of the volcanoes in tropical and temperate regions), like Fuego volcano, the new volcanic material will often deposit on top of previously vegetated terrain which will result in a strong reflectance change, as volcanic material and vegetation have very different reflectance spectra. We exploit these characteristics by using a NDVI difference technique to detect changes in vegetated areas caused by new deposited material. Although the technique does not work well for non-vegetated areas, the detection of new deposits in such areas is often very difficult, in general, because the new volcanic deposits can have virtually the same reflectance as the pre-existing material and, therefore, a general spectral technique with a limited number of bands may not be able to detect those changes. In such cases a visual inspection may be a quick, simple and effective alternative. Our goal, then, is to focus on the deposition of material in vegetated areas, where we know the NDVI difference method has a high chance of success, as is the case for the tephra fall deposit, described in this paper. For other types of deposits in other areas we use a visual inspection approach, to illustrate that the images can still be useful when analyzed in that way.
It is quite apparent that the NDVI difference results have a sharp boundary near the vent area when showing the mapped tephra fall region (Figure 4). This is most likely due to the presence of ash in the air for the pre-eruption image (from 9 January 2018), as Fuego is a very active volcano. This illustrates that care must always be taken to interpret the data and, in this case, recognize such artefacts.
Finally, the higher spatial resolution of the PS images permits detailed mapping of structural and morphological changes associated with the volcanic activity. The scar at the head of Barranca Honda (Figure 7) is an example of the detail that PS data provides. This structure is interpreted as either a collapse or erosion feature associated with the generation or transit of PDCs through that area, and the identification of this structure in the image acquired immediately after the eruption, puts its possible origin (and the corresponding interpretation) in the necessary volcanological context.
The comparison between PS and other satellite data sources underlines the strength of the PL products. In addition to high spatial resolution, the high temporal cadence permits detailed monitoring and offers a higher probability of obtaining useful data (e.g., Figure 5). The ability to monitor the morphological evolution of otherwise inaccessible volcanic vents is a novel feature of PS images (e.g., Figure 8). A similar analysis to that shown here for Fuego could be applied to volcanoes where lava dome growth or the accumulation of potentially unstable material on the upper flanks constitutes a potential hazard (e.g., through the generation of PDCs) or, in general, where deposited material could be later mobilized, producing lahars. Such analysis could reduce the potential exposure of field-based scientists to volcanic hazards by highlighting potential threats and providing an alternative to field-based deposit mapping. Access and processing of PS data can be performed relatively quickly; locating, downloading, preprocessing, visual inspection and quantitative analysis (e.g., NDVI differences) can take < 1 h to a few hours for a trained analyst. Rapid assessment of volcanic hazards is particularly important in highly populated areas [40], where timely monitoring of volcanic activity (e.g., deposition of volcanic products) and frequently updated products are necessary for hazard mitigation.
6. Conclusions
Persistently active volcanoes such as Fuego provide an excellent test of PS images as a resource for mapping relatively small and ephemeral, yet significant, volcanic deposits. The paroxysmal activity of February 2018 produced a range of deposits with variable spatial and spectral characteristics which could be mapped using visual analysis and change detection techniques based on single bands or the NDVI. We have shown how such deposit mapping yields estimates of eruption volume and magnitude, with important implications for subsequent activity. The high spatial resolution and temporal cadence of PS imagery also permits the identification of new deposits and morphological changes on scales of a few meters, which are a poorly understood aspect of frequently active volcanoes. These characteristics also proved to be a valuable tool for monitoring pre-eruptive and eruptive phases, which is often impossible from the ground. Similar methods could be applied to other active volcanoes during volcanic crises. We conclude that PS images represent a valuable new resource for volcano monitoring that promises to increase our understanding of, and ability to observe, volcanic processes.
Supplementary Materials
The following are available online at https://www.mdpi.com/2072-4292/11/18/2151/s1, Table S1: Planet Labs imagery timeline data entry for Figure 2.
Author Contributions
Conceptualization: A.A., S.C. and R.E.-W.; formal analysis: A.A. and R.E.-W.; funding acquisition: S.C. and G.G.; investigation: A.A.; methodology: S.C. and R.E.-W.; resources: S.C.; supervision: S.C., R.E.-W. and G.G.; validation: R.E.-W.; visualization: A.A.; writing—original draft, A.A.; writing—review and editing: A.A., S.C., R.E.-W. and G.G.
Funding
This research received no external funding.
Acknowledgments
We thank Planet Labs Inc. for providing an exciting new source of Earth observation data. We also acknowledge the International Geological Masters in Volcanology and Geotechniques (INVOGE) program, which promoted international cooperation between the University of Milano Bicocca and Michigan Technological University. The comments of three anonymous reviewers significantly improved the paper.
Conflicts of Interest
The authors declare no conflict of interest.
References
- Dean, K.; Dehn, J.; McNutt, S.; Neal, C.; Moore, R.; Schneider, D. Satellite imagery proves essential for monitoring erupting Aleutian Volcano. Eos. Trans. Am. Geophys. Union. 2002, 83, 241–247. [Google Scholar] [CrossRef]
- Pieri, D.; Abrams, M. ASTER watches the world’s volcanoes: A new paradigm for volcanological observations from orbit. J. Volcanol. Geotherm. Res. 2004, 135, 13–28. [Google Scholar] [CrossRef]
- Ramsey, M.; Dehn, J. Spaceborne observations of the 2000 Bezymianny, Kamchatka eruption: the integration of high-resolution ASTER data into near real-time monitoring using AVHRR. J. Volcanol. Geotherm. Res. 2004, 135, 127–146. [Google Scholar] [CrossRef]
- Thomas, H.E.; Watson, I.M. Observations of volcanic emissions from space: Current and future perspectives. Nat. Hazards. 2010, 54, 323–354. [Google Scholar] [CrossRef]
- Herold, M.; Scepan, J.; Clark, K.C. The use of remote sensing and landscape metrics to describe structures and changes in urban land uses. Environ. Plan. Econ. Space. 2002, 34, 1443–1458. [Google Scholar] [CrossRef]
- Carn, S.A.; Krueger, A.J.; Krotkov, N.A.; Yang, K.; Evans, K. Tracking volcanic sulfur dioxide clouds for aviation hazard mitigation. Nat. Hazards. 2008, 51, 325–343. [Google Scholar] [CrossRef]
- Campion, R.; Martinez-Cruz, M.; Lecocq, T.; Caudron, C.; Pacheco, J.; Pinardi, G.; Hermans, C.; Carn, S.; Bernard, A. Space-and ground-based measurements of sulphur dioxide emissions from Turrialba Volcano (Costa Rica). Bull. Volcanol. 2012, 74, 1757–1770. [Google Scholar] [CrossRef]
- Carn, S.A.; Clarisse, L.; Prata, A.J. Multi-decadal satellite measurements of global volcanic degassing. J. Volcanol. Geotherm. Res. 2016, 311, 99–134. [Google Scholar] [CrossRef]
- Carter, A.J.; Ramsey, M.S.; Belousov, A.B. Detection of a new summit crater on Bezymianny Volcano lava dome: Satellite and field-based thermal data. Bull. Volcanol. 2007, 69, 811–815. [Google Scholar] [CrossRef]
- Vaughan, R.G.; Keszthelyi, L.P.; Lowenstern, J.B.; Jaworowski, C.; Heasler, H. Use of ASTER and MODIS thermal infrared data to quantify heat flow and hydrothermal change at Yellowstone National Park. J. Volcanol. Geotherm. Res. 2012, 233–234, 72–89. [Google Scholar] [CrossRef]
- Wessels, R.L.; Vaughan, R.G.; Patrick, M.R.; Coombs, M.L. High-resolution satellite and airborne thermal infrared imaging of precursory unrest and 2009 eruption at Redoubt Volcano, Alaska. J. Volcanol. Geotherm. Res. 2013, 259, 248–269. [Google Scholar] [CrossRef]
- Wright, R.; Blackett, M.; Hill-Butler, C. Some observations regarding the thermal flux from Earth’s erupting volcanoes for the period of 2000 to 2014. Geophys. Res. Lett. 2015, 42, 282–289. [Google Scholar] [CrossRef]
- Norini, G.; Groppelli, G.; Sulpizio, R.; Carrasco-Núñez, G.; Dávila-Harris, P.; Pellicioli, C.; Zucca, F.; De Franco, R. Structural analysis and thermal remote sensing of the Los Humeros Volcanic complex: Implications for volcano structure and geothermal exploration. J. Volcanol. Geotherm. Res. 2015, 301, 221–237. [Google Scholar] [CrossRef]
- Flynn, L.P.; Harris, A.J.L.; Wright, R. Improved identification of volcanic features using Landsat 7 ETM+. Remote Sens. Environ. 2001, 78, 180–193. [Google Scholar] [CrossRef]
- Lu, D.; Li, G.; Valladares, G.S.; Batistella, M. Mapping soil erosion risk in Rondônia, Brazilian Amazonia: Using RUSLE, remote sensing and GIS. Land Degrad. Dev. 2004, 15, 499–512. [Google Scholar] [CrossRef]
- Carter, A.J.; Ramsey, M.S. ASTER- and field-based observations at Bezymianny Volcano: Focus on the 11 May 2007 pyroclastic flow deposit. Remote Sens. Environ. 2009, 113, 2142–2151. [Google Scholar] [CrossRef]
- Lanari, R.; Lundgren, P.; Sansosti, E. Dynamic deformation of Etna Volcano observed by satellite radar interferometry. Geophys. Res. Lett. 1998, 25, 1541–1544. [Google Scholar] [CrossRef] [Green Version]
- Hooper, A.; Zebker, H.; Segall, P.; Kampes, B. A new method for measuring deformation on volcanoes and other natural terrains using InSAR persistent scatterers. Geophys. Res. Lett. 2004, 31, 23. [Google Scholar] [CrossRef]
- Ramsey, M.S.; Fink, J.H. Estimating silicic lava vesicularity with thermal remote sensing: A new technique for volcanic mapping and monitoring. Bull. Volcanol. 1999, 61, 32–39. [Google Scholar] [CrossRef]
- Kervyn, M.; Ernst, G.G.J.; Goossens, R.; Jacobs, P. Mapping volcano topography with remote sensing: ASTER vs. SRTM. Int. J. Remote Sens. 2008, 29, 6515–6538. [Google Scholar] [CrossRef]
- Joyce, K.E.; Belliss, S.E.; Samsonov, S.V.; McNeill, S.J.; Glassey, P.J. A review of the status of satellite remote sensing and image processing techniques for mapping natural hazards and disasters. Prog. Phys. Geogr. Earth Environ. 2009, 33, 183–207. [Google Scholar] [CrossRef] [Green Version]
- Arnous, M.O.; Green, D.R. GIS and remote sensing as tools for conducting geo-hazards risk assessment along Gulf of Aqaba coastal zone, Egypt. J. Coast. Conserv. 2011, 15, 457–475. [Google Scholar] [CrossRef]
- Pallister, J.S.; Schneider, D.J.; Griswold, J.P.; Keeler, R.H.; Burton, W.C.; Noyles, C.; Newhall, C.G.; Ratdomopurbo, A. Merapi 2010 eruption—Chronology and extrusion rates monitored with satellite radar and used in eruption forecasting. J. Volcanol. Geotherm. Res. 2013, 261, 144–152. [Google Scholar] [CrossRef]
- Smithsonian Institution, Recent bulletin report. Bulletin of the Global Volcanism Program. Available online: https://volcano.si.edu/volcano.cfm?vn=342090 (accessed on 9 September 2019).
- Zhu, Z. Change detection using landsat time series: A review of frequencies, preprocessing, algorithms, and applications. ISPRS J. Photogramm. Remote Sens. 2017, 130, 370–384. [Google Scholar] [CrossRef]
- Planet Team, Planet Application Program Interface: In Space for Life on Earth. San Francisco, CA. 2017. Available online: https://api.planet.com. (accessed on 9 September 2019).
- Tucker, C.J.; Pinzon, J.E.; Brown, M.E.; Slayback, D.A.; Pak, E.W.; Mahoney, R.; Vermote, E.F.; El Saleous, N. An extended AVHRR 8-km NDVI dataset compatible with MODIS and SPOT vegetation NDVI data. Int. J. Remote Sens. 2005, 26, 4485–4498. [Google Scholar] [CrossRef]
- Grainger, R.G.; Peters, D.M.; Thomas, G.E.; Smith, A.J.A.; Siddans, R.; Carboni, E.; Dudhia, A. Measuring volcanic plume and ash properties from space. Geol. Soc. Lond. Spec. Publ. 2013, 380, 293–320. [Google Scholar] [CrossRef] [Green Version]
- Chesner, C.A.; Rose, W.I., Jr. Geochemistry and evolution of the fuego volcanic complex, Guatemala. J. Volcanol. Geotherm. Res. 1984, 21, 25–44. [Google Scholar] [CrossRef]
- Manea, V.C.; Manea, M.; Ferrari, L. A geodynamical perspective on the subduction of Cocos and Rivera plates beneath Mexico and Central America. Tectonophysics 2013, 609, 56–81. [Google Scholar] [CrossRef]
- Martin, D.P.; Rose, W.I., Jr. Behavioral patterns at Fuego volcano, Guatemala. J. Volcanol. Geotherm. Res. 1981, 10, 67–81. [Google Scholar] [CrossRef]
- Davies, D.K.; Quearry, M.W.; Bonis, S.B. Glowing avalanches from the 1974 eruption of the volcano Fuego, Guatemala. Geol. Soc. Am. Bull. 1978, 89, 369–384. [Google Scholar] [CrossRef]
- Lyons, J.J.; Waite, G.P.; Rose, W.I.; Chigna, G. Patterns in open vent, Strombolian behavior at Fuego volcano, Guatemala, 2005–2007. Bull. Volcanol. 2009, 72, 1–15. [Google Scholar] [CrossRef]
- Waite, G.P.; Nadeau, P.A.; Lyons, J.J. Variability in eruption style and associated very long period events at Fuego volcano, Guatemala. J. Geophys. Res. Solid Earth. 2013, 118, 1526–1533. [Google Scholar] [CrossRef]
- Kuenzi, W.D.; Horst, O.H.; McGehee, R.V. Effect of volcanic activity on fluvial-deltaic sedimentation in a modern arc-trench gap, southwestern Guatemala. Geol. Soc. Am. Bull. 1979, 90, 827–838. [Google Scholar] [CrossRef]
- MODVOLC, near-real-time satellite monitoring of global volcanism using MODIS. Available online: http://modis.higp.hawaii.edu/ (accessed on 9 September 2019).
- NOAA Satellites and Information Service, Current Volcanic Ash Advisories. Available online: https://www.ssd.noaa.gov/VAAC/messages.html (accessed on 9 September 2019).
- Richardson, A.J.; Wiegand, C.L. Distinguishing vegetation from soil background information. Photogramm. Eng. Remote Sens. 1977, 43, 1541–1552. [Google Scholar]
- Bannari, A.; Morin, D.; Bonn, F.; Heute, A.R. A review of vegetation indices. Remote Sens. Rev. 1995, 13, 95–120. [Google Scholar] [CrossRef]
- Loughlin, S.C.; Sparks, R.S.J.; Sparks, S.; Brown, S.K.; Jenkins, S.F.; Vye-Brown, C. Global Volcanic Hazard and Risk; Cambridge University Press: Cambridge, UK, 2015; pp. 1–80. [Google Scholar]
Figure 1.
Location of the Fuego-Acatenango Complex. (a) Location of Fuego volcano in the Central American Volcanic Arc. (b) Detail of the main barrancas channels surrounding the Fuego edifice.
Figure 1.
Location of the Fuego-Acatenango Complex. (a) Location of Fuego volcano in the Central American Volcanic Arc. (b) Detail of the main barrancas channels surrounding the Fuego edifice.

Figure 2.
Timeline of the February 2018 eruption of Fuego and its main physical and volcanological features. Data sources: (a) Smithsonian Institution Global Volcanism Program (GVP) [24]; Planet Labs data coverage [26]; (b) MODVOLC website [36]; (c) VAAC database [37]. Planet labs imagery timeline is in Table S1.

Figure 3.
PlanetScope image of Fuego on February 2, 2018; 15:57 UTC. (a) Lava flows and spatter deposits optically mapped are shown in orange and yellow respectively. (b) Result for single Band 2, using a threshold DN < 3000, for comparison.
Figure 3.
PlanetScope image of Fuego on February 2, 2018; 15:57 UTC. (a) Lava flows and spatter deposits optically mapped are shown in orange and yellow respectively. (b) Result for single Band 2, using a threshold DN < 3000, for comparison.

Figure 4.
Tephra fall deposit mapped using NDVI difference analysis of (A) PlanetScope and (B) Sentinel 2 images from 9th 10th January and 4th February 2018. Threshold values of –0.1 for Sentinel 2, and–0.125 for PlanetScope were used to identify the ash covered areas shown in red in (A) and (B). (C) Shows the areas that can be identified as ash covered by the NDVI differences in each set of satellite images after applying a low-pass filter and converting them to polygons (only taking the connecting polygons along the expected dispersal axis). BOA = Bottom of Atmosphere. Background image is a PlanetScope image from February 4, 2018 at 15:58 UTC.


Figure 5.
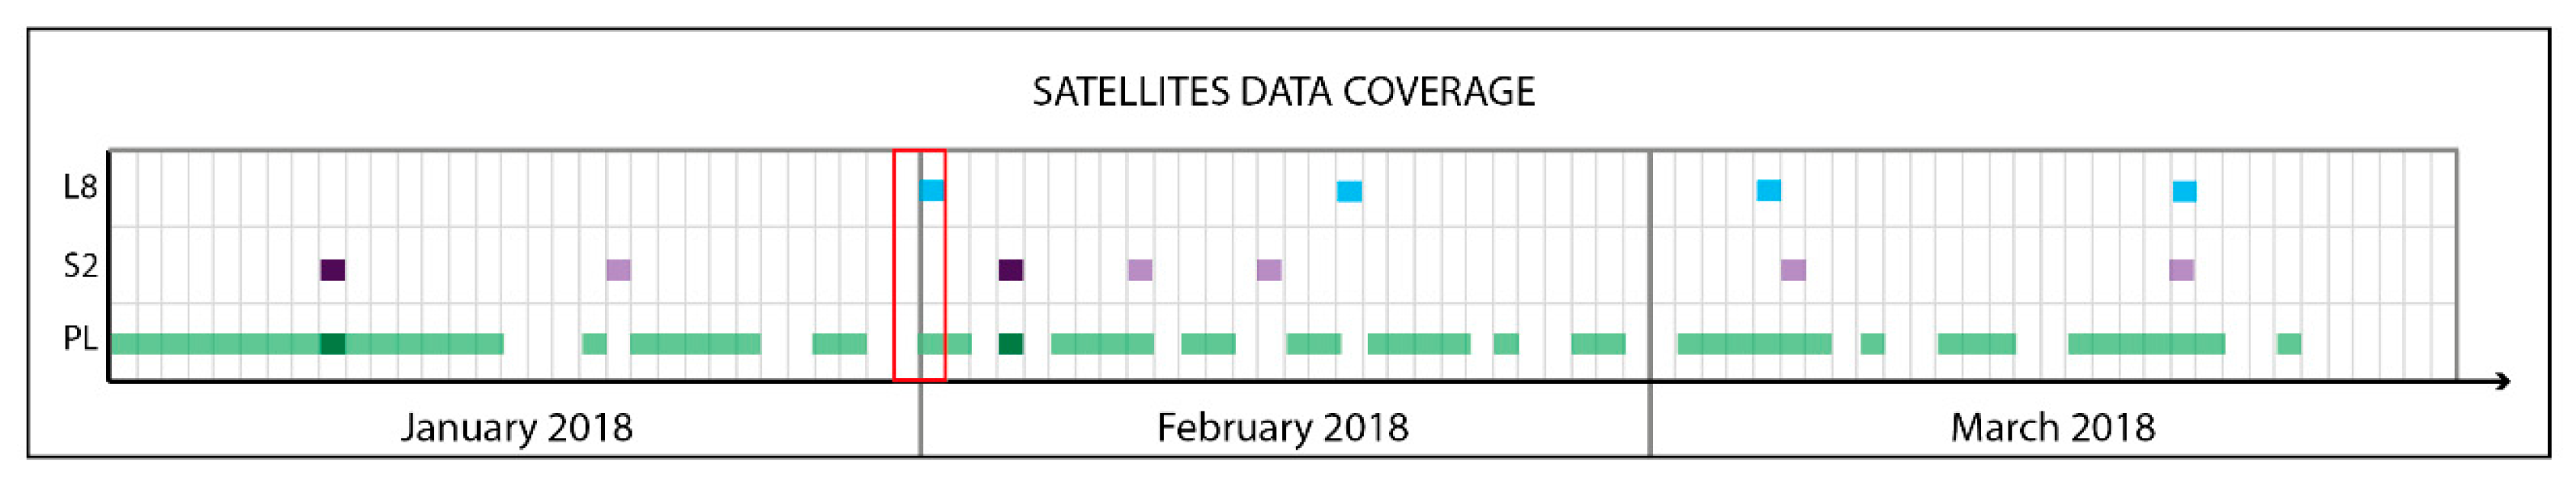
Schematic three-month timeline for satellite data coverage of Landsat 8 (L8), Sentinel 2 (S2) and Planet Labs (PL). Only usable data, with no cloud coverage over the study area are considered. Images selected for NDVI analysis are marked with darker colours. The red box shows the February 2018 event period.
Figure 5.
Schematic three-month timeline for satellite data coverage of Landsat 8 (L8), Sentinel 2 (S2) and Planet Labs (PL). Only usable data, with no cloud coverage over the study area are considered. Images selected for NDVI analysis are marked with darker colours. The red box shows the February 2018 event period.

Figure 6.
PDC deposits in (a) Barranca Honda and (b) Barranca Las Lajas and El Jute visually mapped using PlanetScope imagery. The inset shows the location of the displayed area. Background image is from February 2, 2018 at 15:57 UTC.
Figure 6.
PDC deposits in (a) Barranca Honda and (b) Barranca Las Lajas and El Jute visually mapped using PlanetScope imagery. The inset shows the location of the displayed area. Background image is from February 2, 2018 at 15:57 UTC.

Figure 7.
PlanetScope images of Fuego collected on January 9, 2018 at 16:57 UTC and February 2, 2018 at 15:57 UTC, showing morphological changes pre- (a) and post-eruption (b). The February 2 PlanetScope image (c) shows the presence of a scar formed during the February 2018 paroxysm, in the upper reaches of Barranca Honda.

Figure 8.
PlanetScope images of Fuego collected between December 2017 and March 2018, showing the evolution of the vent region of Fuego volcano. Left panels (a, c, e, g, i, and k) show the images without annotations; right panels (b, d, f, h, j, and l) show the mapped morphology and significant changes (orange lines). Figures a-d display the pre-eruption phase, whereas figures e–l represent the morphology right after the event to one month from it.


Table 1.
Characteristics of optical satellite instruments currently used for volcano monitoring.
| Criteria | Planet Labs | Sentinel 2 | Landsat 8 | MODIS | ASTER | VIIRS | Digital Globe |
|---|---|---|---|---|---|---|---|
| Bands (wave length) | 4–5 (440–900 nm) | 13 (497–2190 nm) | 8 (0.45–12.5 µm) | 36 (0.405–14.385 µm) | 14 (0.52–11.62 µm) | 22 (0.412–12.01 µm) | 4–16 (450–2373 nm) |
| Night-time imagery | No | No | Yes | Yes | Yes | No | No |
| TIR/SWIR | No | Yes | Yes | Yes | Yes | Yes | Yes |
| Spatial resolution | 0.8–5 m | 10–60 m | 15–30 m | 250–1000 m | 15–90 m | 500–1000 m | 0.5–1.85 m |
| Cadence | <1–72 h | 5–10 d | 16 d | 6–12 h | Highly variable (days to weeks) | 24 h | Highly variable (days to months) |
| Product level | 1B | 1C | 2 | 1A–B | 1C | 1 | / |
Table 2.
Specifications of Planet Labs deployments in International Space Station (ISS) and Sun synchronous orbits (SSO).
Table 2.
Specifications of Planet Labs deployments in International Space Station (ISS) and Sun synchronous orbits (SSO).
| Criteria | PlanetScope (PS2) | |
|---|---|---|
| Deployment | ISS orbit | SSO orbit |
| Orbit altitude | 400 km | 475 km |
| Max/min latitude coverage | 52° | 81.5° |
| HFOV | 21.8 km | 24.6 km |
| VFOV | 14.5 km | 16.4 km |
| Area | 316 km2 | 405 km2 |
| Max image strip per orbit | 8100 km2 | 20,000 km2 |
| Analytic resolution | 16 bit | 16 bit |
© 2019 by the authors. Licensee MDPI, Basel, Switzerland. This article is an open access article distributed under the terms and conditions of the Creative Commons Attribution (CC BY) license (http://creativecommons.org/licenses/by/4.0/).
Share and Cite
MDPI and ACS Style
Aldeghi, A.; Carn, S.; Escobar-Wolf, R.; Groppelli, G. Volcano Monitoring from Space Using High-Cadence Planet CubeSat Images Applied to Fuego Volcano, Guatemala. Remote Sens. 2019, 11, 2151. https://doi.org/10.3390/rs11182151
AMA Style
Aldeghi A, Carn S, Escobar-Wolf R, Groppelli G. Volcano Monitoring from Space Using High-Cadence Planet CubeSat Images Applied to Fuego Volcano, Guatemala. Remote Sensing. 2019; 11(18):2151. https://doi.org/10.3390/rs11182151
Chicago/Turabian StyleAldeghi, Anna, Simon Carn, Rudiger Escobar-Wolf, and Gianluca Groppelli. 2019. "Volcano Monitoring from Space Using High-Cadence Planet CubeSat Images Applied to Fuego Volcano, Guatemala" Remote Sensing 11, no. 18: 2151. https://doi.org/10.3390/rs11182151
Note that from the first issue of 2016, this journal uses article numbers instead of page numbers. See further details here.