Towards an Underground Utilities 3D Data Model for Land Administration


1
Singapore-ETH Centre, Future Cities Laboratory, ETH Zürich, Singapore 138602, Singapore
2
Geoscience & Digital Eaeth Centre (INSTeG), Research Institute for Sustainable Environment, Universiti Teknologi Malaysia, Johor Bahru 81310, Malaysia
3
Department of Geoinformation, Faculty of Built Environment and Surveying, Universiti Teknologi Malaysia, Johor Bahru 81310, Malaysia
4
Singapore Land Authority, Singapore 307987, Singapore
5
Institute of Geodesy and Photogrammetry, ETH Zürich, 8093 Zürich, Switzerland
6
Geomatik + Vermessung Stadt Zürich, 8004 Zürich, Switzerland
*
Author to whom correspondence should be addressed.
Remote Sens. 2019, 11(17), 1957; https://doi.org/10.3390/rs11171957
Submission received: 6 July 2019
/
Revised: 14 August 2019
/
Accepted: 15 August 2019
/
Published: 21 August 2019
(This article belongs to the Special Issue Remote Sensing for Land Administration)
Abstract
:With the pressure of the increasing density of urban areas, some public infrastructures are moving to the underground to free up space above, such as utility lines, rail lines and roads. In the big data era, the three-dimensional (3D) data can be beneficial to understand the complex urban area. Comparing to spatial data and information of the above ground, we lack the precise and detailed information about underground infrastructures, such as the spatial information of underground infrastructure, the ownership of underground objects and the interdependence of infrastructures in the above and below ground. How can we map reliable 3D underground utility networks and use them in the land administration? First, to explain the importance of this work and find a possible solution, this paper observes the current issues of the existing underground utility database in Singapore. A framework for utility data governance is proposed to manage the work process from the underground utility data capture to data usage. This is the backbone to support the coordination of different roles in the utility data governance and usage. Then, an initial design of the 3D underground utility data model is introduced to describe the 3D geometric and spatial information about underground utility data and connect it to the cadastral parcel for land administration. In the case study, the newly collected data from mobile Ground Penetrating Radar is integrated with the existing utility data for 3D modelling. It is expected to explore the integration of new collected 3D data, the existing 2D data and cadastral information for land administration of underground utilities.
1. Introduction
Rapid urbanization creates a strong need to optimize land use in densely populated cities. Attention is thus shifting from the very limited available space above ground to generation and increased use of underground spaces. Comparing to the above ground, underground is an unseen space. The trench for the building and maintenance of underground infrastructure costs a lot of money, as well as faces high risks. A prerequisite for including the underground in urban planning is the availability of sufficiently complete, accurate and up-to-date 3D maps of the underground. However, such maps are not yet widely available, if at all, and the required data acquisition is much more challenging than for spaces above ground.
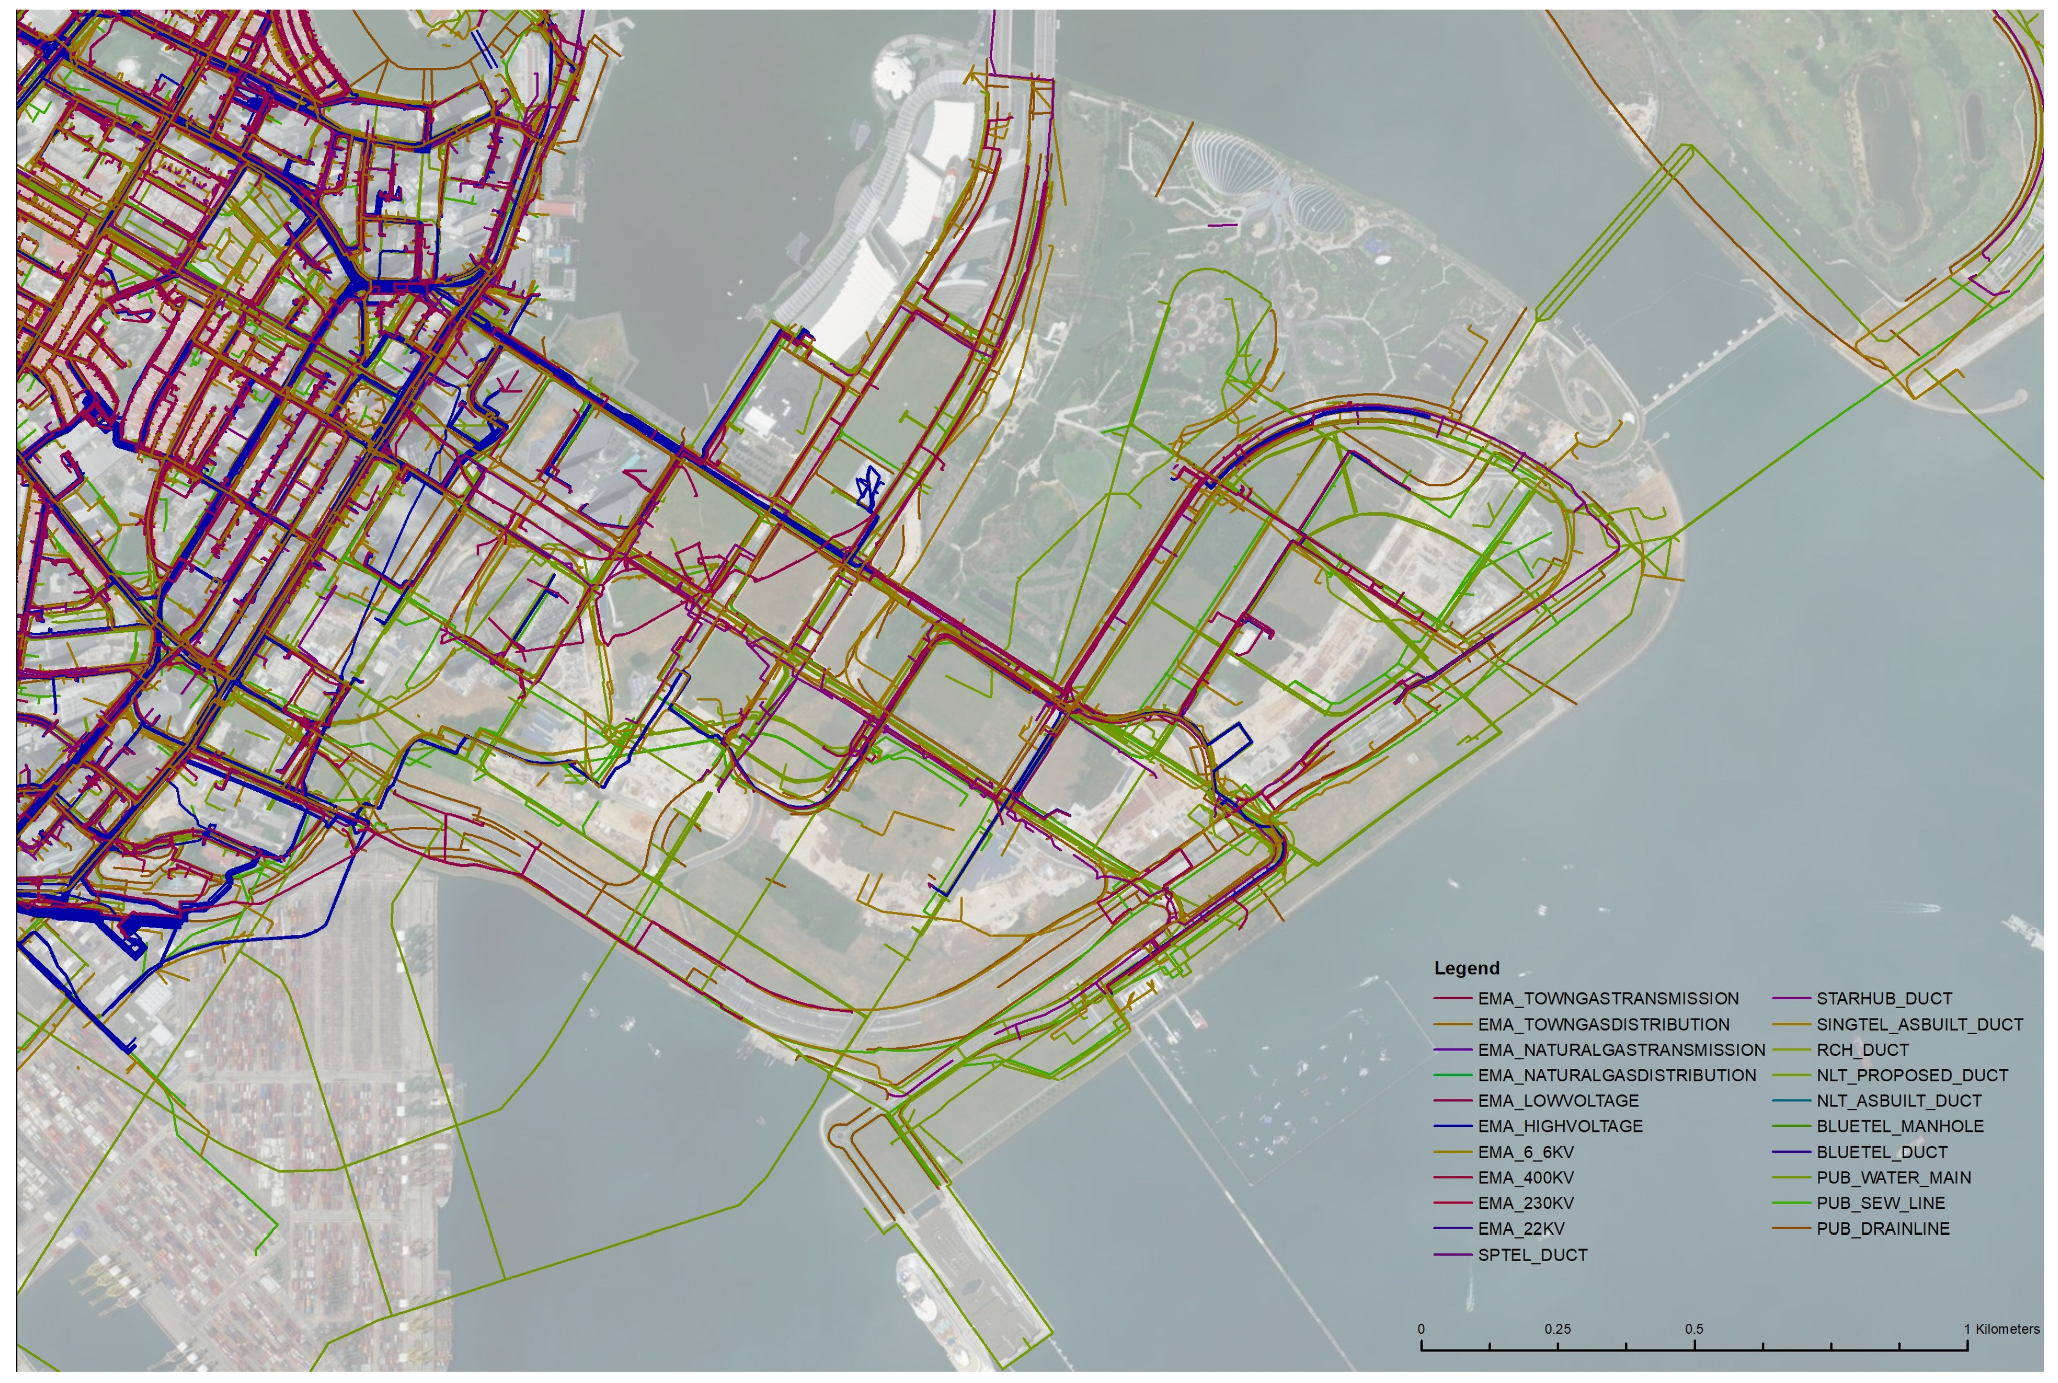
With a population of more than five million living in an area of 720 square kilometres, Singapore has revealed a plan for placing infrastructure underground [1]. Currently, a data sharing platform, which is called GeoSpace, is maintained by the Singapore Land Authority (SLA) and used by government agencies (e.g., utility owners, land developers, and land owners) to establish a 2D map of Singapore underground including utility services. Figure 1 shows an example in the Marina Bay region of Singapore includes water supply, sewage, drainage, telecommunication and power grid networks. All the existing data are the 2D format. The 2D visualization with overlap pipelines has limitation to provide accurate and reliable information about underground utilities to various applications.
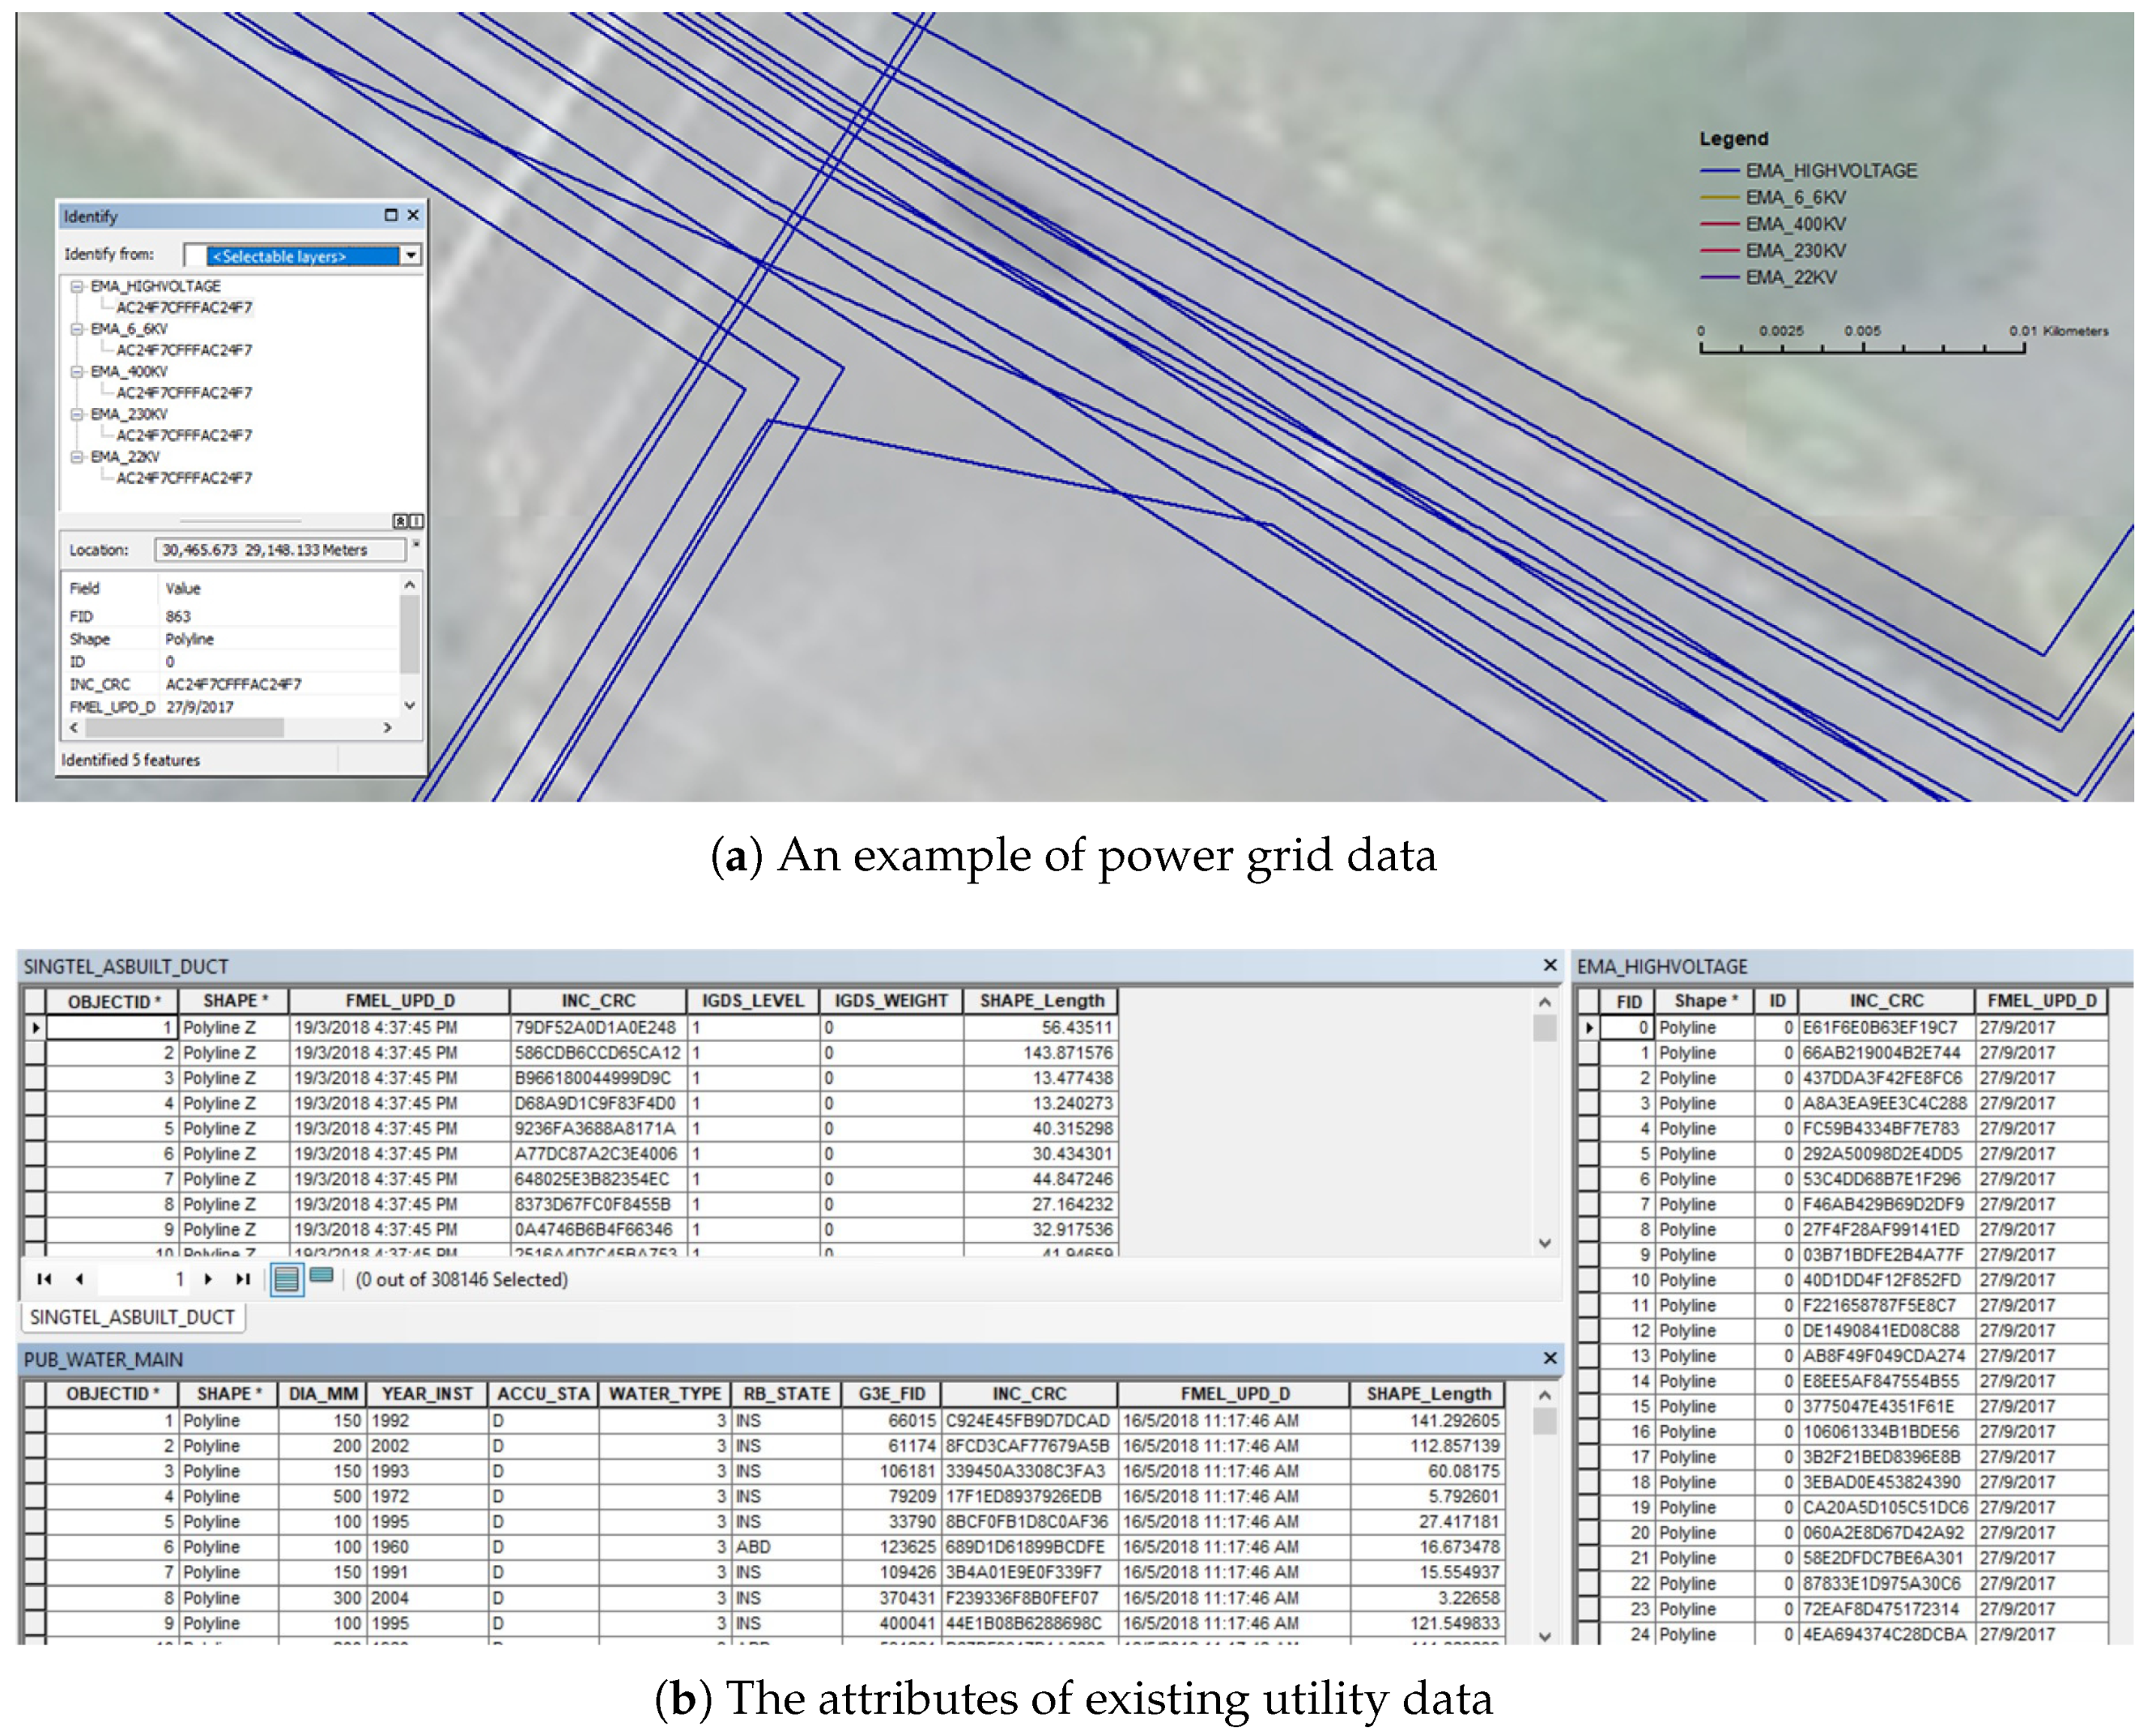
To observe the existing data, we zoom in to a corner of the Marina Bay region. Figure 2a presents five layers of different power grid networks. In the real world, the five different power grid networks may be located at the same place and different depths. However, these data have the same x, y value in the database, which makes them impossible to identify in the vertical space and distinguish them in 2D. All of the existing data are as-build data. We can not trust them to present the real situation of underground utility networks. From Figure 2b, the limited attributes are provided from the current database. Only the main water pipes have a diameter. Most of them have 2D geospatial information. In addition, data owners have more details of existing utility data. However, most of them are 2D data as well. Depending on the requirement of the application, some data owners try to collect 3D data. There are some issues during the data capture to usage. Without the utility survey standard, some of them only use the traditional survey method to get the 3D points data of pipelines and overlay on the existing data. Nobody can guarantee the quality of these data. Meanwhile, because of the limitation of the existing data model, it is difficult to integrate 3D data with the existing 2D data. Update cycles were observed to be infrequent and slow, which is once per six months. We not only need time information in the data model to maintain utility database frequently, but also should improve data governance procedures for updating. In general, some issues prevent these data from being sufficient for urban planning, land administration, and on-site work. In fact, many existing databases, not only the ones in Singapore, contribute incompletely to the spatial understanding of the underground because of similar restrictions. In particular:
- The data are often only 2D i.e., lacking depth information entirely, or 2.5D (i.e., featuring depth as an attribute to a horizontal position rather than as an independent coordinate. Furthermore, the depth information may be sparse with depths measured at few locations only, e.g., at accessible manholes, and it may be ambiguous because it is not always clear whether the values represent depth relative to a specific surface with unknown elevation or height relative to an established height datum.
- It is unknown whether the data represent the current situation, the possibly different as-built state, or just the as-designed state. Furthermore, the geometric accuracy and the completeness of the area often unknown.
- Much of the attribute information (e.g., diameter, material, installation date) required to support specific applications is not available or does not represent the appropriate level of detail.
- There is a lack of standards for organizing the data and semantic information of underground utilities, impairing data sharing and use of the shared data.
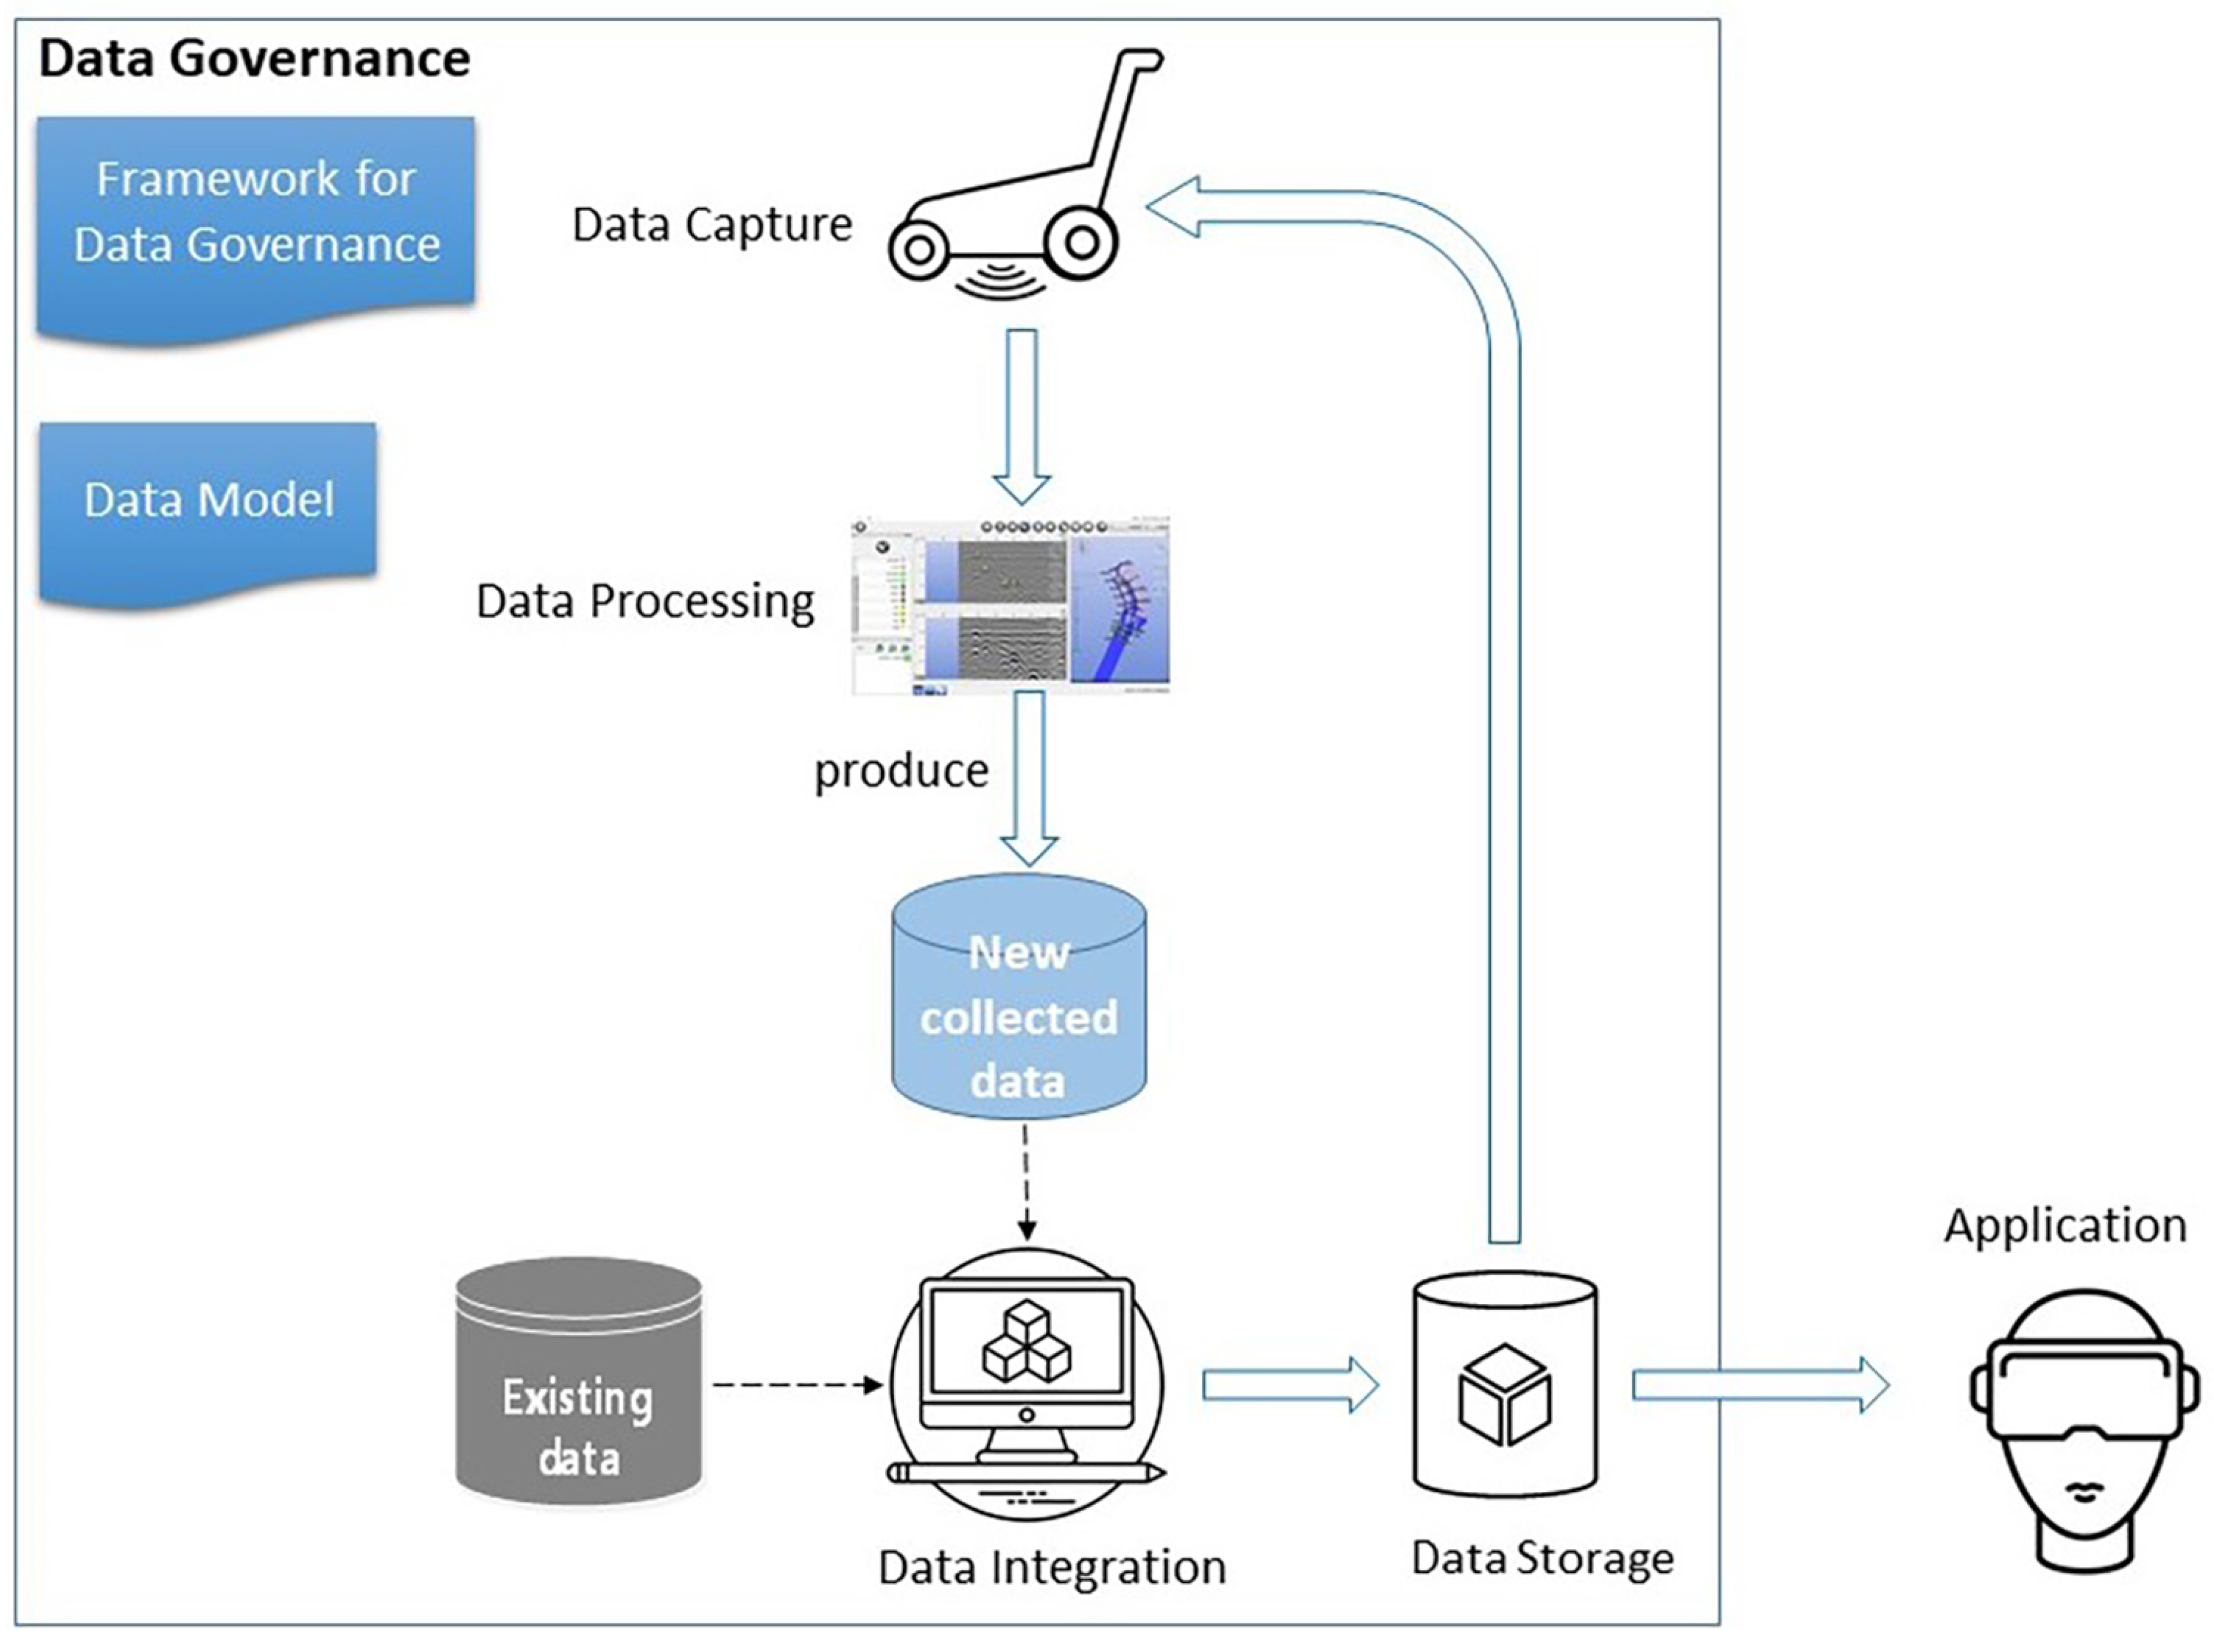
Overall, the reliable and accurate 3D data of utility networks are sorely demanded. Therefore, the Singapore-ETH Centre together with the SLA and the Geomatics Department of the City of Zürich have started a related project under the name “Digital Underground” [2]. The initial goals of this project are to develop a road map, a data model and a concept for deriving a unified and complete 3D map of the relevant underground structures (in particular of utilities and spaces like corridors or tunnels). Collecting best practices for underground utility mapping is a special focus within the project. Figure 3 describes the workflow of data governance for 3D underground utility mapping. In the data capture, different types of survey techniques (e.g., Ground Penetrating Radar (GPR), Gyro-based system) are explored and compared to find the optimal underground utility survey approach. After the data processing, the newly collected data should be integrated into the existing database aiming to improve the information of underground utility. As the backbone of the 3D underground utility map, the 3D consolidated database of underground utilities should be developed for data storage. This is a loop workflow. The data capture could improve and update the database. At the same time, the underground utility database should provide information to support data capture. In order to organize these four steps, we need two main components in the data governance. One is the framework to manage different roles and communication between them in data governance. The other is the underground utility data model, which is a conceptual model to describe the structure and content of geodata independent from the used hard- and software systems. It will provide the standard for the presentation of geometrical information, data quality management and various applications. This paper focuses on the design of the framework of data governance and underground utility data model. To ensure legal compliance, efficiency, and resilience of these utility networks, the reliable 3D underground utility data could shed light on their ownership and operation [3]. Then, the underground utility data can be used in various applications. To provide sufficiently and consistently accurate information about underground utilities, it is necessary to fill the gap between engineering practices and mapping disciplines. Meanwhile, we need to find the solution for how to use the existing data and integrate it with newly collected data.
Here, we focus on underground utilities, ignoring other underground structures that eventually need to be represented in the same 3D database as the utilities. This work aims at bridging the gap between underground utility surveying and data governance for land administration. Our proposal addresses the following:
- The organization of different phases and roles from data capture to usage. It is necessary to make a clear definition of different roles. During this work process, the communication between different roles (e.g., data producers, owners and users) is very important.
- Different roles have different rights to access, change, delete or add data. These permissions must be defined and maintained administratively.
- Building and updating the 3D map of the underground requires integration of datasets of a different type, quality and source. Data may originate from recent surveying e.g., using GPR or self-contained sensors tracking their movement through a pipe. Data for building a map may also be derived from other databases. This integration requires handling various data formats, and quantifying and properly taking into account the respective data quality.
- The underground data need to be convertible into the data formats required by a variety of different applications and end users without loss of relevant information.
Subsequently, we first introduce related works on 3D underground utility data acquisition and review the underground utility data governance for land administration in some countries or regions. In Section 3, we propose a framework to resolve the above issues about data governance and explain the design of a 3D underground utility data model. In Section 4, we briefly summarize a Singapore case study covering the work process from large scale GPR-based data acquisition to 3D visualization. We conclude with a summary and an outlook on future work.
2. Related Works
2.1. The technologies for 3D underground utility data acquisition
Information about the buried utility networks can be retrieved without any excavation underground utility mapping using non-destructive technologies. However, this is more challenging than above ground mapping. Established approaches for surveying (e.g., photogrammetry, laser scanning, total station measurements or global positioning system) require clear line-of-sight between the instrument and the points to be measured, or between these points and the satellites. They are applicable to (parts of) utility networks while those are exposed in an open pit, e.g., during construction. In some special cases, and with considerable effort, it may even be possible to use such technologies inside buried utilities. However, underground utility mapping comprising detection, location and identification of buried utilities requires approaches without excavation [4,5]. Subsurface geophysical technologies [6,7], such as Ground Penetrating Radar or Electromagnetic Locators, can be used for this purpose [5,8]. In addition, a gyroscope-based system [9] is available for measuring the trajectory of certain utilities (newly laid pipelines with a suitable radius through which the measurement system can travel). Table 1 lists the technologies used for utility mapping with a general review of their accuracy. As positioning using a GPR requires manual processing, manufacturers typically do not mention any type of horizontal or depth measurement accuracy. However, surveying standards such as PAS128 [10] provide some accuracy indications for GPR. According to PAS128, a horizontal accuracy of 250 mm or + 40% of detected depth (whichever is greater) can be achieved when using one of Pipe and Cable Locator (PCL) and GPR, and a horizontal accuracy of 150 mm or + 15% of detected depth (whichever is greater) when using both. Additionally, PAS128 indicates that a depth measurement accuracy of 40% of buried depth can be achieved when using one of PCL and GPR, and 15% of buried depth when both are used. However, PAS128 does not elaborate on how these numbers have been established. In this paper, we focus on GPR due to its popularity in underground utility mapping [5] and on a gyroscope-based system as it is not limited by the depth of the pipeline, by other utilities nearby or by electromagnetic disturbances [9].
2.1.1. Ground Penetrating Radar (GPR)
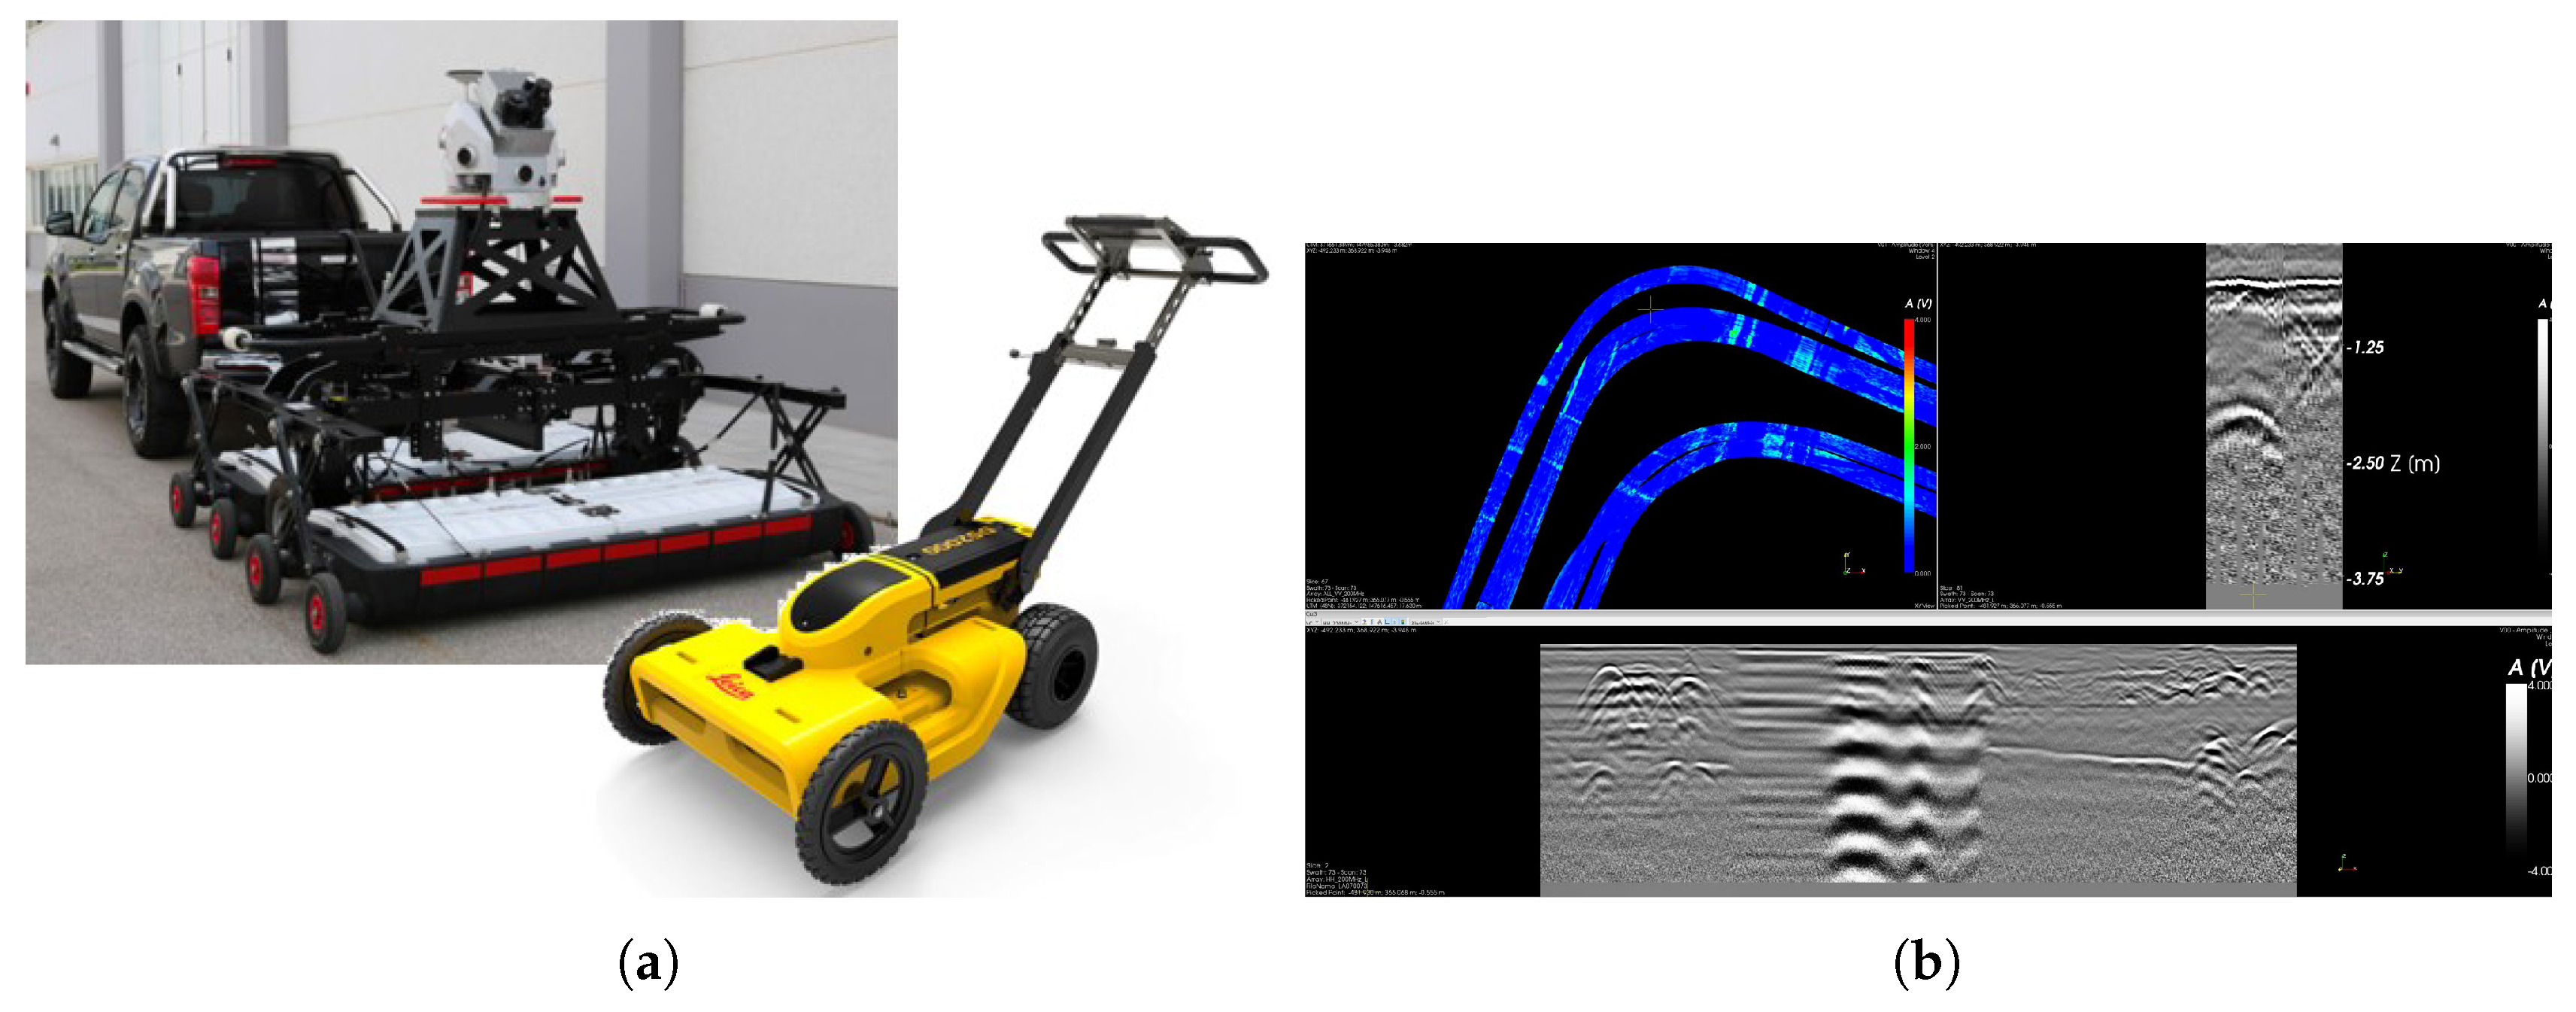
GPR is a widely used technology for characterizing structures in the underground. It is based on recording the delay and power of electromagnetic (EM) signals scattered and reflected at discontinuities of the permittivity. Such discontinuities are associated with differences in materials or differences in material properties allowing for detecting, e.g., man-made objects, holes, and layers of different composition or water content in the underground [11,12]. GPR is used for a variety of applications, among them geophysical exploration, archaeology, and inspection of buried utility networks [13,14]. Depending on the type of transmitted signals, impulse radar systems and continuous wave radar systems that are distinguished, with the former being more common [15]. The penetration depth, i.e., the maximum depth at which discontinuities can be detected using GPR is on the order of a few centimeters to a few tens of meters, depending on the soil characteristics, transmission power, signal stacking time and the frequency, which typically ranges from 10 MHz to 4 GHz. Lower frequencies require bigger antennas but facilitate higher penetration depths. Higher frequencies, on the other hand, yield better spatial resolution and thus allow for correctly locating smaller objects or distinguishing objects at smaller distances [13]. 3D information is obtained by moving the radar antennas along the ground surface, recording data quasi-continuously, and subsequently analyzing the data tomographically. Figure 4a shows two examples of GPR instruments, one being integrated with a mobile mapping trailer, and the other one a manually pushed cart.
Although GPR measurement can be very accurate, the responses may vary according to the measurement. A so-called B-scan (i.e., a 2D distance-depth representation of the underground) (see Figure 4b for an example) can be very challenging and is normally done by an experienced radargram analyst. The experience can be generated from a series of signal traces along a trajectory. B-scan normally represented by black and white colours indicative of the different signal strengths and polarities of the objects. These signals are analyzed for anomalous responses. If the positions of these anomalies form a linear line, it is interpreted as a utility feature. The interpretation of B-scan is subjected to the expertise of the radargram analyst or GPR specialist. Such interpretation experience can be gained from a regularly used system of proper training provided by the manufacturer or consultant.
2.1.2. Gyroscope-Based Systems
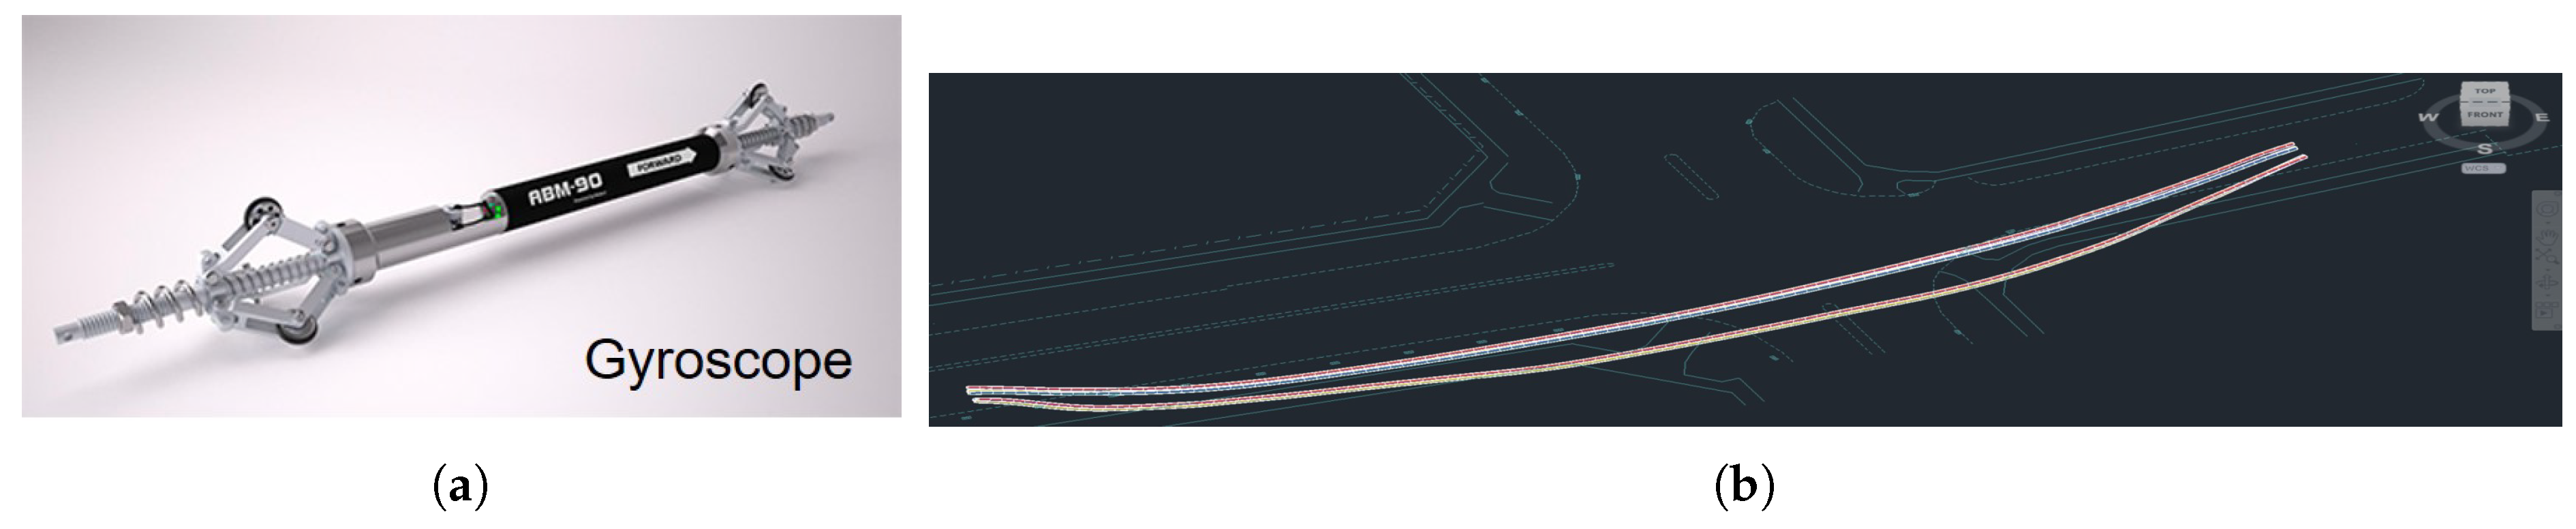
Utilities with a diameter of more than about 5 cm through which a probe can travel may be accessible to mapping with an inertial measurement unit (IMU). The IMU measures the 3-axis acceleration and 3-axis rotation rates that can be integrated over time yielding position and orientation changes of the unit. If the unit is mounted within a probe and the probe travels through the utility (typically a pipe), it can record the trajectory of the probe—and thus the 3D coordinates of points along the axis of the utility [9].
The potential benefits of such a measurement system are that (i) it can acquire the as-built information of the suitable utilities even if they are buried at a depth exceeding the penetration depth of GPR, (ii) the location can be geometrically more accurate than using above-ground measuring technologies for the location of underground structures, (iii) it can acquire data irrespective of the properties of the surrounding underground (e.g., soil composition, water content) and of electromagnetic fields, and (iv) that the probe can be equipped with additional sensors capturing more information than just the coordinates (e.g., diameter, the radius of curvature, corrosion). Major disadvantages are that (i) only pipes with sufficient diameter, sufficient minimum radius or curvature and accessibility can be measured, (ii) depending on the measurement system, the pipe needs to be empty during the measurement i.e., the service of the utility is interrupted, (iii) the accuracy of the 3D coordinates degrades rapidly with time such that only short parts of the utility, with known coordinates of the start and end point, can be measured if high accuracy is needed, and (iv) additional provisions may be required, e.g., short periods through which the probe remains stationary while moving fast at others. Figure 5b shows an example of such a probe and a 3D map of utilities mapped using it.
At present, GPR seems to be of paramount importance for mapping the underground utilities. However, there are others’ current technology that overcomes the shortcoming of GPR available on the market, such as laser scanning or gyro-based system. No single detection technique can detect the entire type of utilities in every location. Hence, GPR is not the only solution for underground utility mapping, as using more technologies increases the detection capability, coverage, efficiency and accuracy. Irrespective of the data acquisition technologies chosen, the information extracted from the measurements, in particular 3D locations, needs to be integrated with attributes of the respective utilities, e.g., type and dimension, in a geospatial database to support 3D visualization, urban planning and other applications.
2.2. The Review of Underground Utility Data Governance
Some utility data models have been developed for storage, visualization, exchange, and analysis in the geospatial domain. Obviously, the general data model is not enough to reach all the requirements from different users. In order to develop the 3D data model for the land administration of underground utilities, this work reviews the underground utility data governance in land administration from some countries and the existing data models that are related to underground utility networks and land administration.
2.2.1. Underground Utility Data Governance for Land Administration
The rapid urbanization and increasing complexity of urban spaces worldwide present an urgent need to provide much more and precise information for land usage. Obviously, 2D cadastral information and visualization are not enough for current land administration. During the past decade, a number of works have been conducted to study on the 3D cadastre from various aspects, such as legal, organization and technique [16,17,18]. The Land Administration Domain Model (LADM) [19] is an important legal framework to define and integrate concepts and terminology of Land Administration for 3D representations. As an international standard, the LADM provides a flexible conceptual schema from three main aspects: organizations, rights and spatial in formations [17]. The integration of 2D and 3D information in the LADM can provide solutions for 3D cadastre. The LADM has two classes (LA_LegalSpaceutilityNetworke and ExPhysicalUtilityNetwork) specifically describe information about the underground utility, which is not enough to define the 3D geometric and topological characteristics and support to land administration of underground utility.
In recent years, some researchers or government agencies have begun to consider the cadastre for underground infrastructures. To analyze the impact of 4D cadastres in the registration of underground utilities, Döner et al. [20] compared the physical and legal registration of utilities in three countries (Turkey, the Netherlands and Queensland, Australia). Obviously, all of them are supported by a 4D cadastral registration. Pouliot and Girard [18] provided a discussion about the integration of underground utility networks in the land administration system. Based on the case study of Quebec, they discussed three key questions in the following:
- Do we need to register underground objects?
- Should underground networks be registered in the Land Register, with the same specifications as land parcels?
- Which information should be part of the registration process?
Some countries and institutions have implemented or at least conceptualized the 3D mapping of underground utility network and their management in a related cadastral system. Until now, a few countries have utility data with cadastral information and related legislation, includes Switzerland, The Netherlands, Turkey, United Kingdom, Serbia, Sweden, Croatia [21,22].
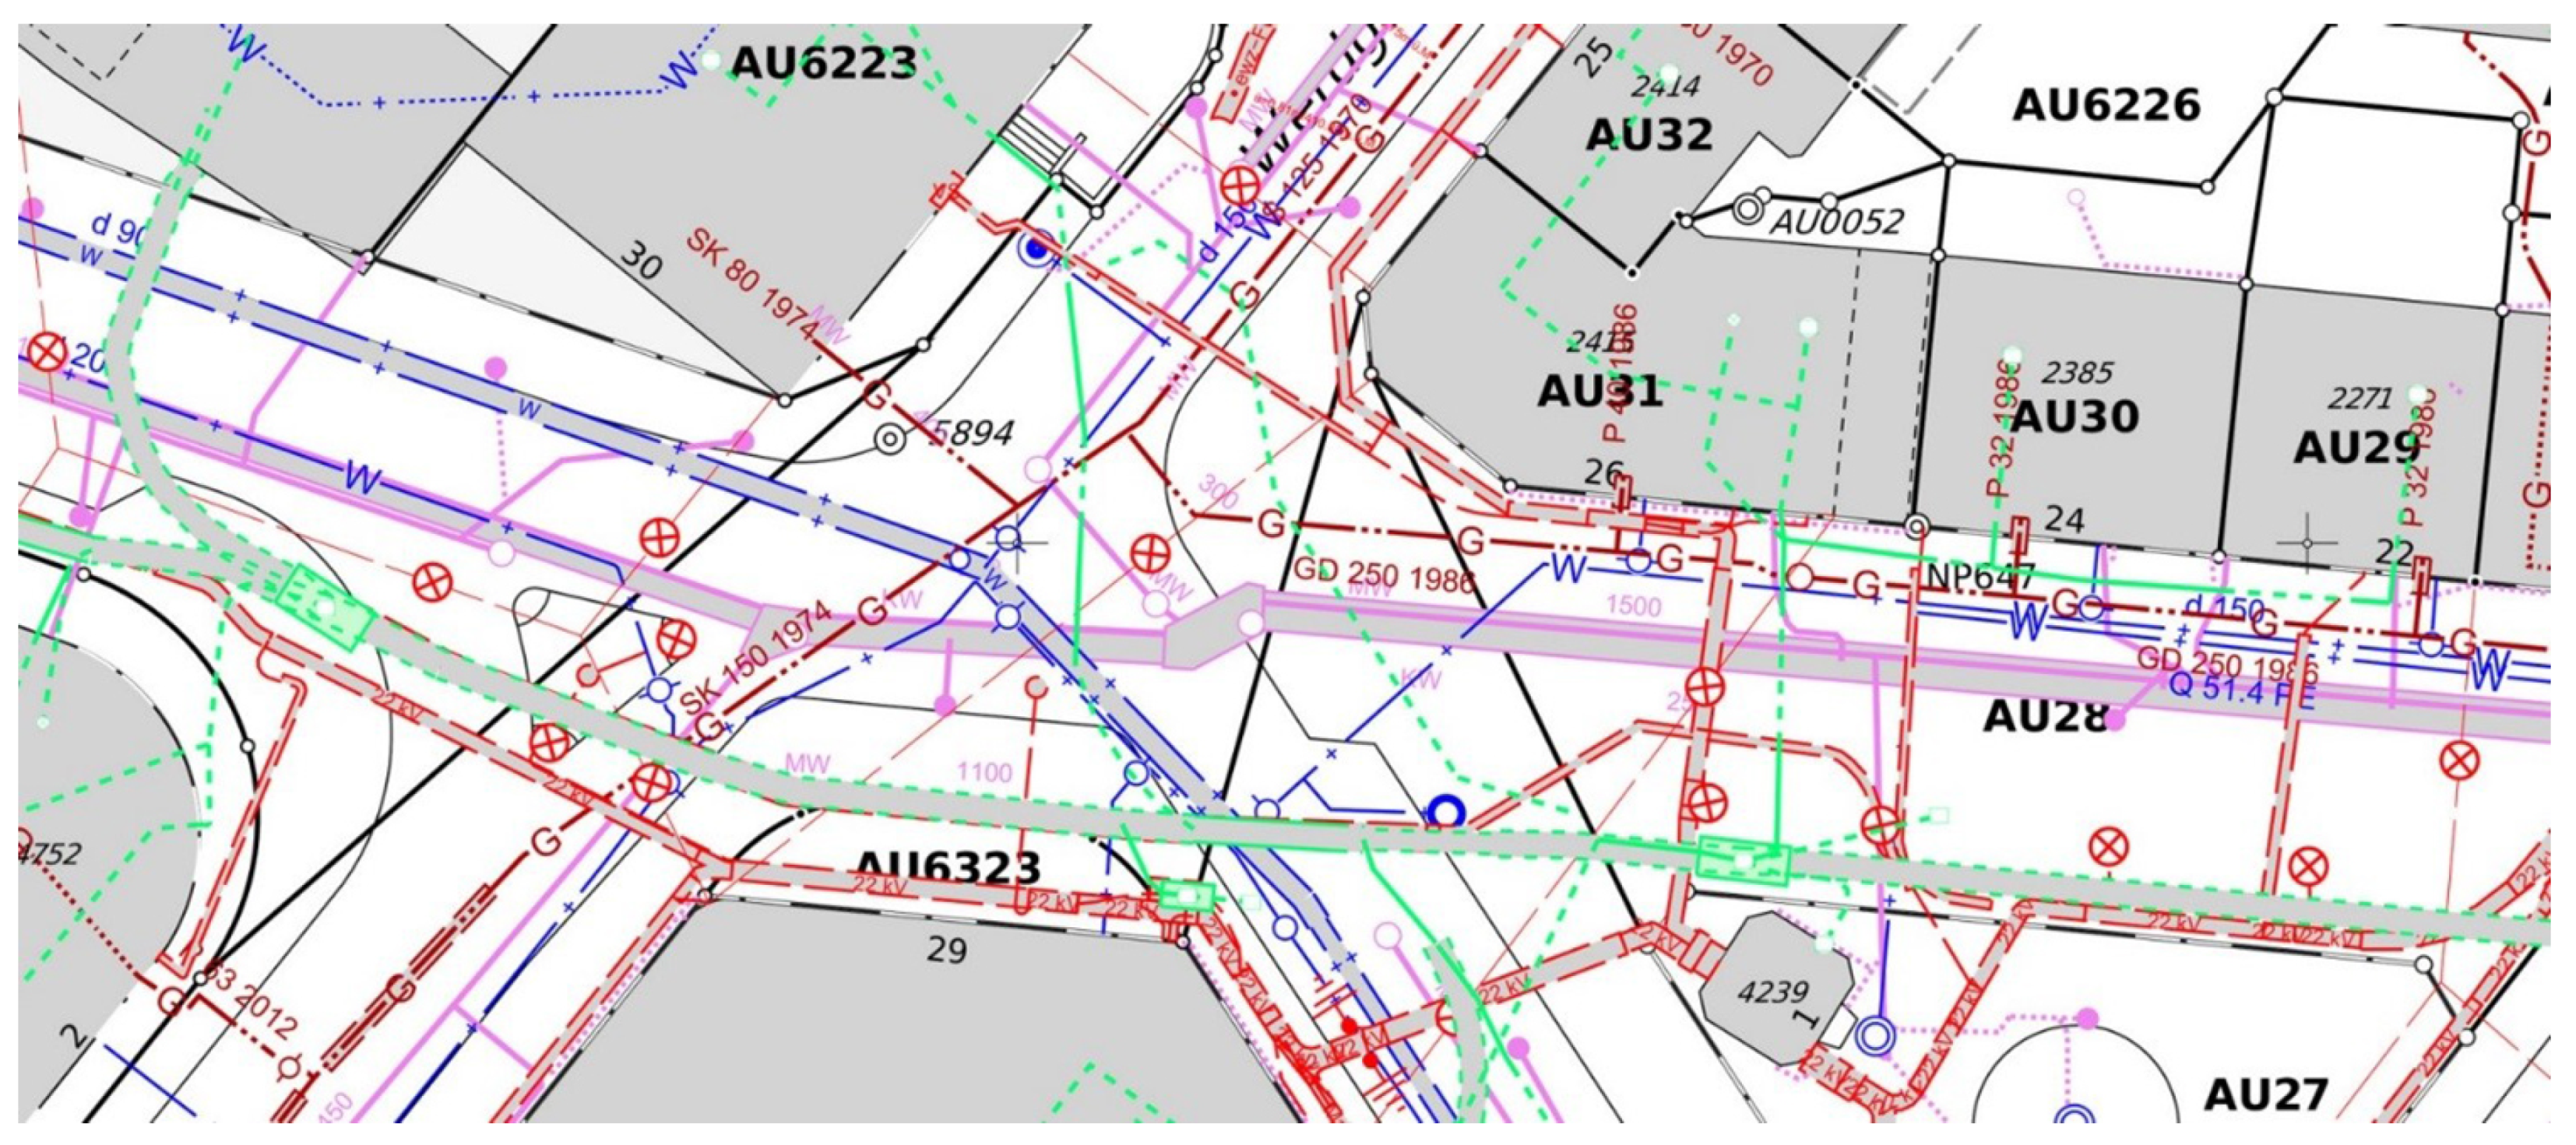
In Switzerland, the Canton of Zürich started to establish a comprehensive Canton-wide utility cadastre map based on the Cantonal Act on Geoinformation of 2011 [23], derived from the Federal Act on Geoinformation of 2007 [24] and the Cantonal Regulation on Utility Cadastre of 2012 [25]. The regulation sets a deadline for each municipality to deliver and maintain a digital utility map latest until 2021. The City of Zürich has its own utility cadastre since 1999 and set up a governance framework with the corresponding utility providers [26]. Figure 6 shows an example of the utility map of the City of Zürich. The utility cadastre is a subset of the utility documentation of the utility owners. The most important media are included: gas, water, sewage, district heating, power, and telecommunications. SIA 405 [27] is a well-defined standard by the SIA (Swiss society of engineers and architects) for the exchange and publication of utility data. The data model LKMap, part of SIA 405, was introduced to define a unified visualisation/presentation of the utility map. The data are automatically delivered through well defined interfaces at least once a week by the utility owners to the cadastre operator (GeoZ) (central data storage). The utility owners are surveying and using partly 3D coordinates. During the exchange of information between owners and the operator, the information is not yet considered.
A number of laws related to the exchange of information on utility location exist in the Netherlands. In 2018, the law for storage and exchange of underground utility information was amended. To accommodate the changes introduced by that law as well as the EU INSPIRE guidelines, the KLIC-WIN program was launched. KLIC-WIN is a program (initiated by the digging sector in the Netherlands) that guides, develops and implements changes triggered by the introduction of both the WIBON, which is the law on information exchange of above ground and underground networks, and the new EU INSPIRE guidelines for utility network information retrieval. KLIC-WIN aims to introduce some changes that are required to comply with the new WIBON law and INSPIRE guidelines:
- Representation of utility information according to a new information model,
- The ability to (optionally) centrally store utility information at Kadaster,
- The gradual change of utility data formats for delivery to end users (from raster now to vector data in 2019 and/or beyond).
Furthermore, Serbia extends its LADM based country profile to include utility information for utility network cadastre [28]. Based on this data model, they will develop a system to register and maintain the ownership of the underground utility network. The United Kingdom began the registry of underground utilities and created a national underground assets mapping platform in 2018. The register aims to show where electricity and telecom cables, and gas and water pipes are buried and is intended to prevent both accidents and disruption to the economy. In Croatia, the utility cadastre information contains the type, purpose, basic technical features, and location of built utility lines, and lists the names and addresses of their managers [29]. The Croatia changed the law to organize the physical registration of utilities at a national level since 2016 [30]. Moreover, Canada has developed 3D maps of underground utility networks as well [18,31]. In general, some countries have 2D visualization of utility networks on cadastral map, legal document about utility data governance, registration of legal ownership of utility networks by law. Most of them begin to develop the 3D/4D utility cadastre. All of the current work is just beginning and ongoing. This has been a new challenging topic in recent years.
2.2.2. The 3D Data Model for Underground Utility Networks
The CityGML utility network Application Domain Extension (ADE) [32] focuses mainly on three aspects: (i) the general 3D geometric of network components; (ii) the 3D topographical structure of the entire utility network; and (iii) the functional information of different types of the network [32,33]. Based on the general concepts of the utility network, different types of utility networks can be implemented with their specific function [32]. Moreover, the interdependence between utility network features and city objects can be presented in 3D space [34]. Because this data model is an extension of CityGML [35], which is the popular standard for 3D city modelling (e.g., building), it is beneficial to integrate information of utility networks to the infrastructures to support urban planning and the other city studies. However, it does not consider the accuracy of the data. Some works begin to extend the existing data model to consider many more details about utility networks, such as [36], represent geographical uncertainties of utility locations based on CityGML Utility Network ADE.
The Industry Foundation Classes (IFC) utility model [37] is an ISO standard for data exchange of buildings in the architecture and civil engineering domain [32]. In the utility part, it describes 2D and 3D geometries of utility elements. Meanwhile, two different ways of connection are defined to describe the relationship between supply service components within the building, which is a logical and physical connection. In addition, it has a comprehensive semantic definition of utility network objects. However, this standard only focuses on the building level and lacks spatial information.
The INSPIRE Data Specification on Utility and Government Services—Technical Guidelines [38] organize the basic information of utility networks and administrative services of utility networks in a city or country range. It is a part of INSPIRE, which is a standard of the European Union to describe the spatial information of infrastructures. However, the INSPIRE Utility networks are lacking a definition of 3D geometric information of utility networks.
ESRI Utility Network model [39] provides a GIS-based utility solution to represent the basic logical and physical structure of all types of utility networks, which is composed of edges and junctions. This model is a general utility data model to represent the 2D geometric information and connections of the utility networks.
Until now, there has not been an international standard that has been widely used for 3D modelling of underground utility [40]. Although some existing standardized data models have been developed to integrate multi-utility networks, they can not guarantee the information to be reliable [3]. In order to develop a comprehensive utility database, we have the challenge to integrate different types of utility datasets from multiple surveying techniques, as well as the existing 2D data. Table 2 compares four popular utility data models relevant to the objectives of this work. Obviously, most of the existing utility data models are to focus on the 3D representation, and include 3D geometric and topological information. The existing data models provide a good reference to describe the geometric and spatial information of utility networks in 3D. Nevertheless, none of them considers the accuracy of data of underground utility networks. On the one side, the survey technique directly impacts the data accuracy. However, industry service providers are not usually aware of these extensive standards [3]. On the other side, different applications might use data at different levels of accuracy. Hence, we need an ideally 3D utility data model to support mapping procedures and control accuracy of underground utility network data.
On the basis of their discussion and the situation of Singapore, it is necessary to register the utility segments as the legal objects in the land administration system, which helps to identify the ownership of underground utility. An integral approach needs to be developed based on legislative and technology solutions. It is essential to establish a degree of reliability and consistency between data produced by different service providers. It is essential to standardize the practices regarding the use of those techniques and various information management. In the underground utility data model, land parcel, as an important role in the land administration, should be connected to the underground utility networks [18,21].
3. Design of the 3D Data Model for Underground Utility Networks
3.1. A Framework for Utility Data Governance
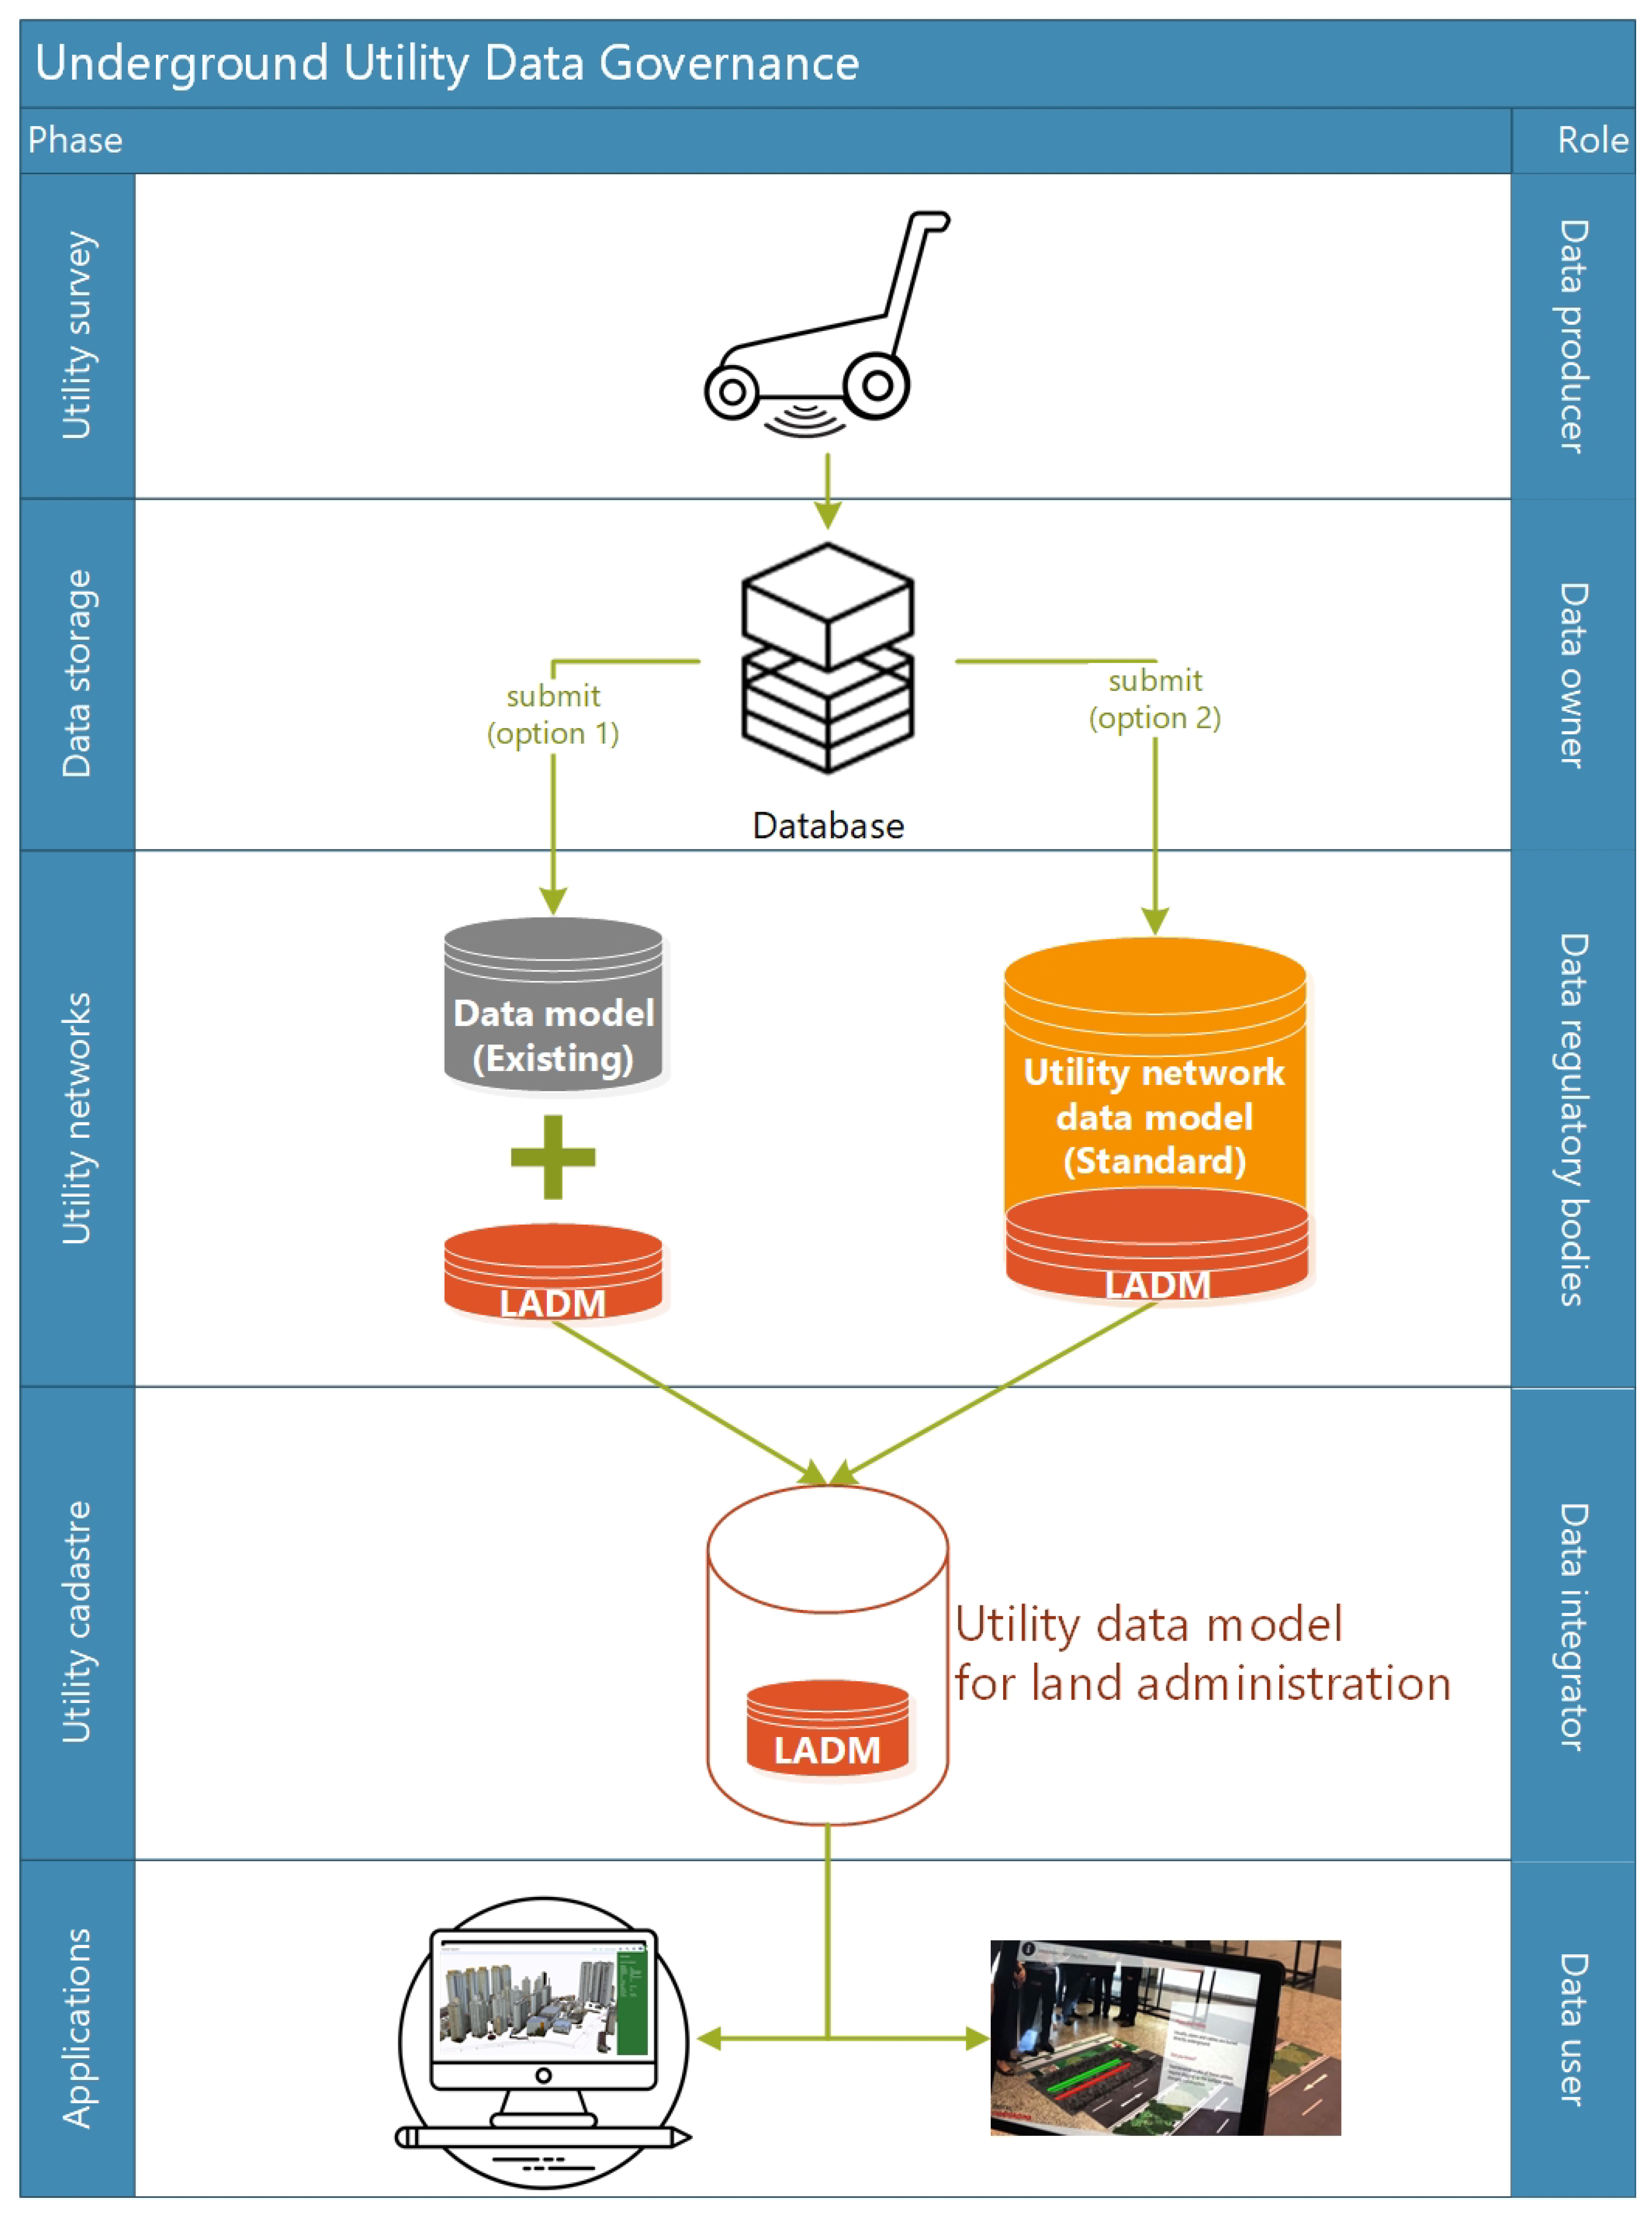
From data capture to usage, the whole work process includes several participants in different stages. Hence, in order to improve the communication between different organizations at each phase, our previous work [3] proposed a framework for underground utility data governance. After observing the current work process in Singapore, this framework has been improved to organize the entire work process (Figure 7). This framework consists of five roles that are listed in the following:
- The data producer is the surveying constructor and/or surveyor in the data regulatory bodies’ organization. In the utility survey phase, the data producer captures data in the field work and submits data to the utility network database.
- The data owner manages their collected data. This role could be companies or data regulatory bodies.
- Data regulatory bodies are government agencies, such as SLA or Public Utilities Board (PUB) of Singapore. They manage their utility data based on their utility network data model. The data regulatory bodies should provide clear permission for data integrator to use and the predefined subset of utility data.
- The data integrator integrates all kinds of utility network data and manages the utility cadastre information in a city or country. In the phase of utility cadastre management, the data integrator should provide the required information for the application to users. This role builds a bridge between the data regulatory bodies and users.
- Data users can use utility data for utility cadastre management applications.
In this work process, the surveyor as data producer captures data during the field work. After that, the data will be submitted to data owner (e.g., PUB) who needs to manage their own utility networks data. According to the requirements of government, the utility data will be submitted to data regulatory bodies (e.g., PUB and SLA). There are two options for data submission. A general utility network data model will be designed as a standard to manage underground utility data for data regulatory bodies. If the data regulatory body does not have any utility data model, they can use this standard data model. If they have their utility data model, they can continue to use it or change to use the standard one. A consolidated 3D utility data model will be designed to support utility cadastre management. The data integrator (e.g., SLA) needs to integrate data of different kinds of utility networks. The LADM plays as a connection component to build a relationship between the general utility network data model and utility cadastre data model in the utility cadastre management. Meanwhile, the LADM will connect the underground utility network to the land administration of above ground. Finally, the underground utility data model should support applications in land administrative management.
3.2. 3D Underground Utility Data Model for Land Administration
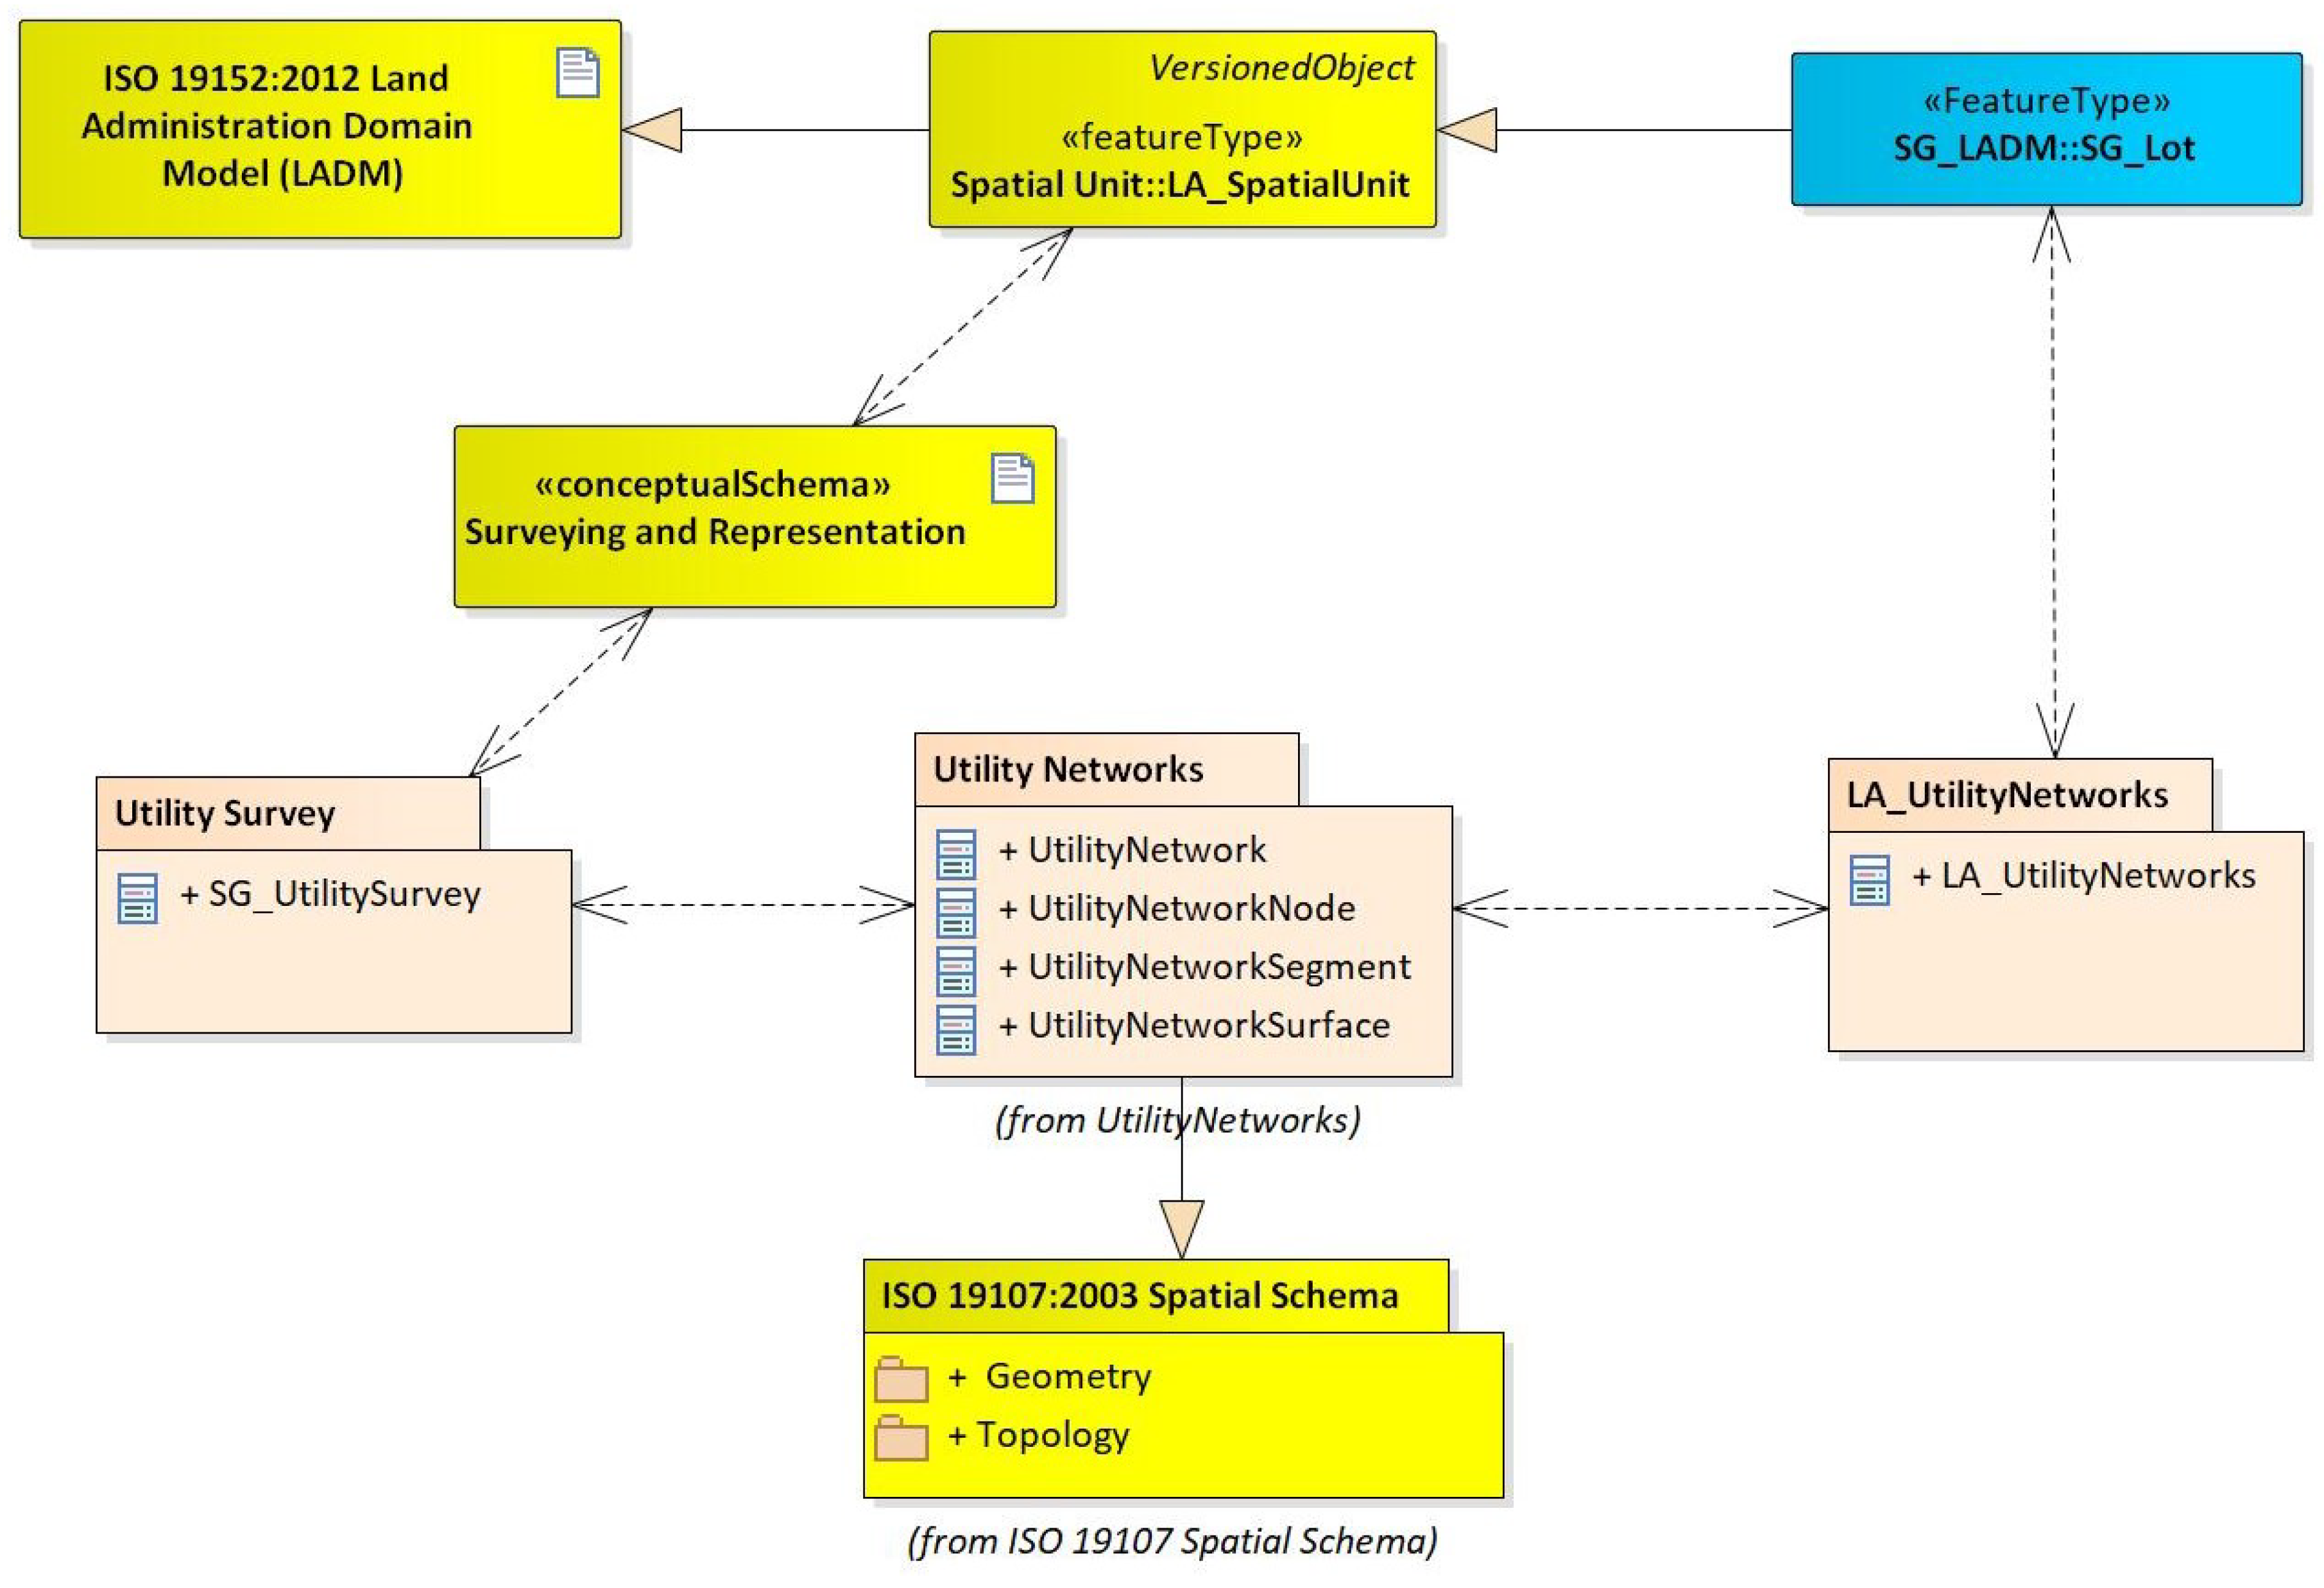
Current work focuses on the conceptual design of a 3D underground utility data model and connects it to land administration. In order to understand the demands of underground utility data users, a workshop was organized to learn the work process and needs of land administration in Singapore. This studying includes four application domains: land acquisition and purchase, planning and coordination, land transfer and sale, and land leasing. Currently, the existing data sources are the hardcopy of the utility network, 2D CAD and 2D geospatial information. There is an urgent demand of 3D geospatial information of underground utility and space to evaluate underground environment and support reallocation, land sales and the other applications. Therefore, the 3D underground utility data model includes three packages to organize the basic information and structure of utility networks, utility survey information, and the land administration information (Figure 8). In order to connect the 3D underground utility data model to the information of land administration, these three packages inherit from the Singapore cadastral data model and LADM (ISO 19152). Meanwhile, the geometric and spatial definition are inherited from the spatial schema data model ([41]).
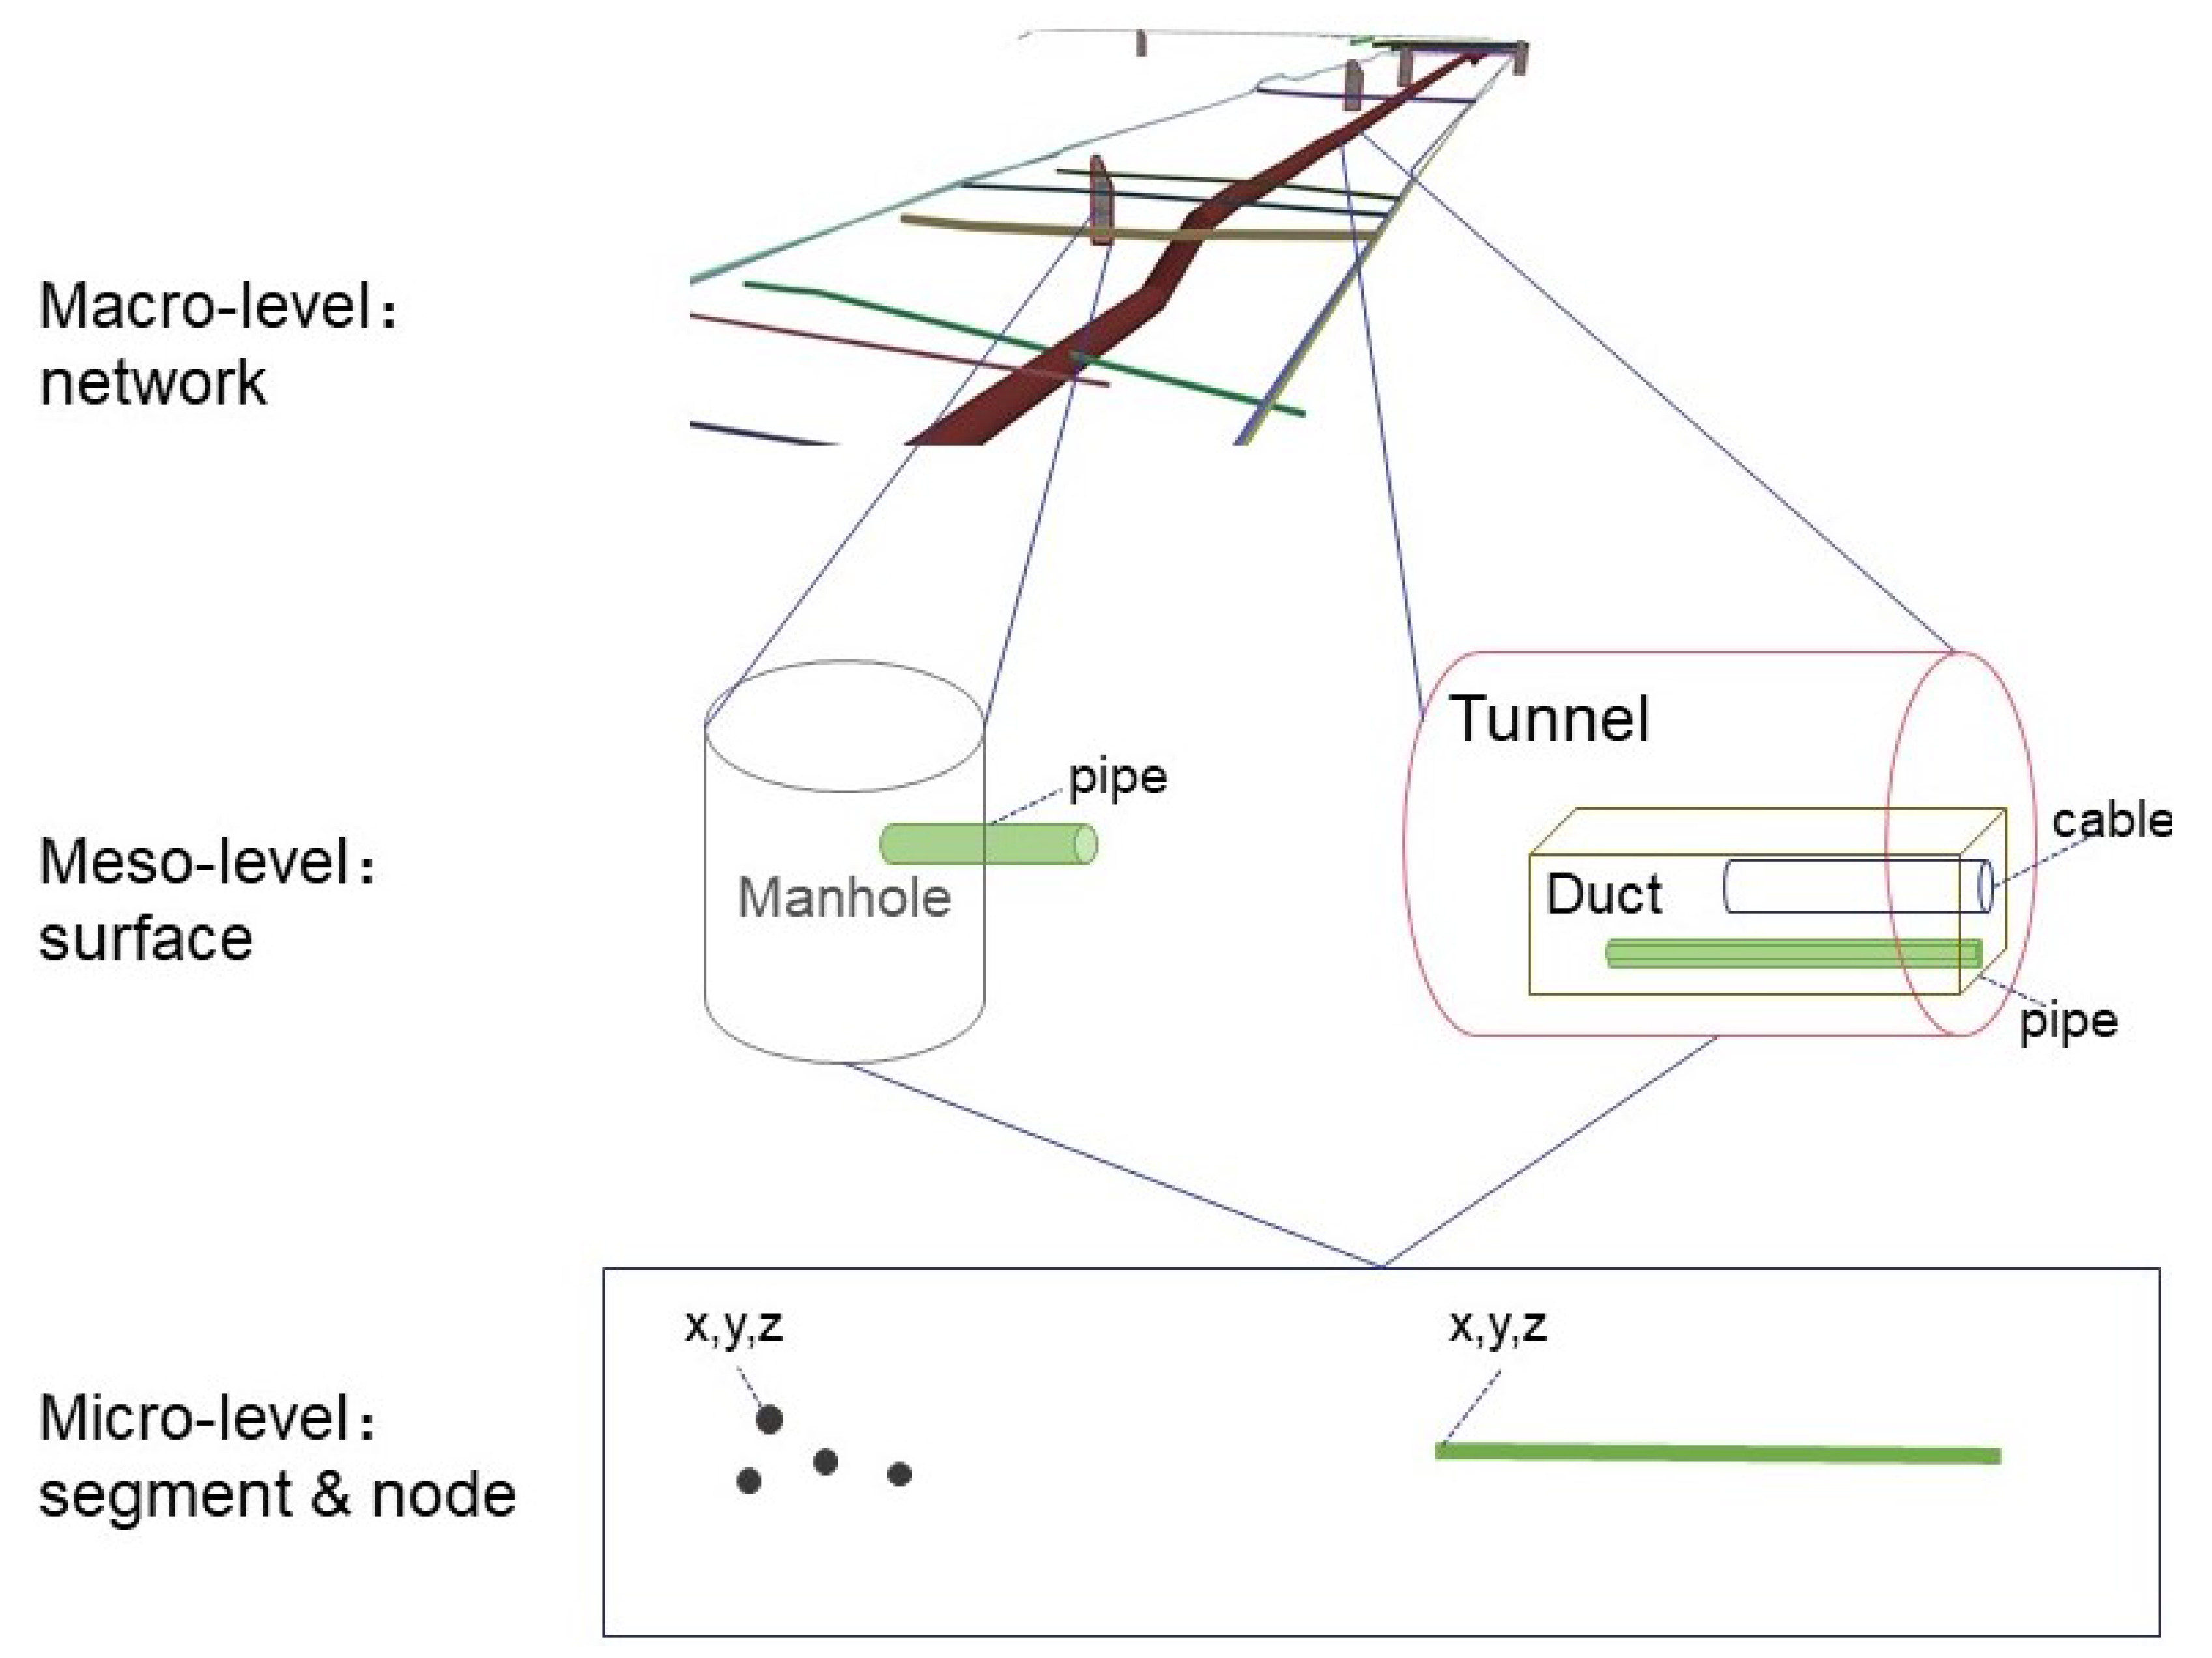
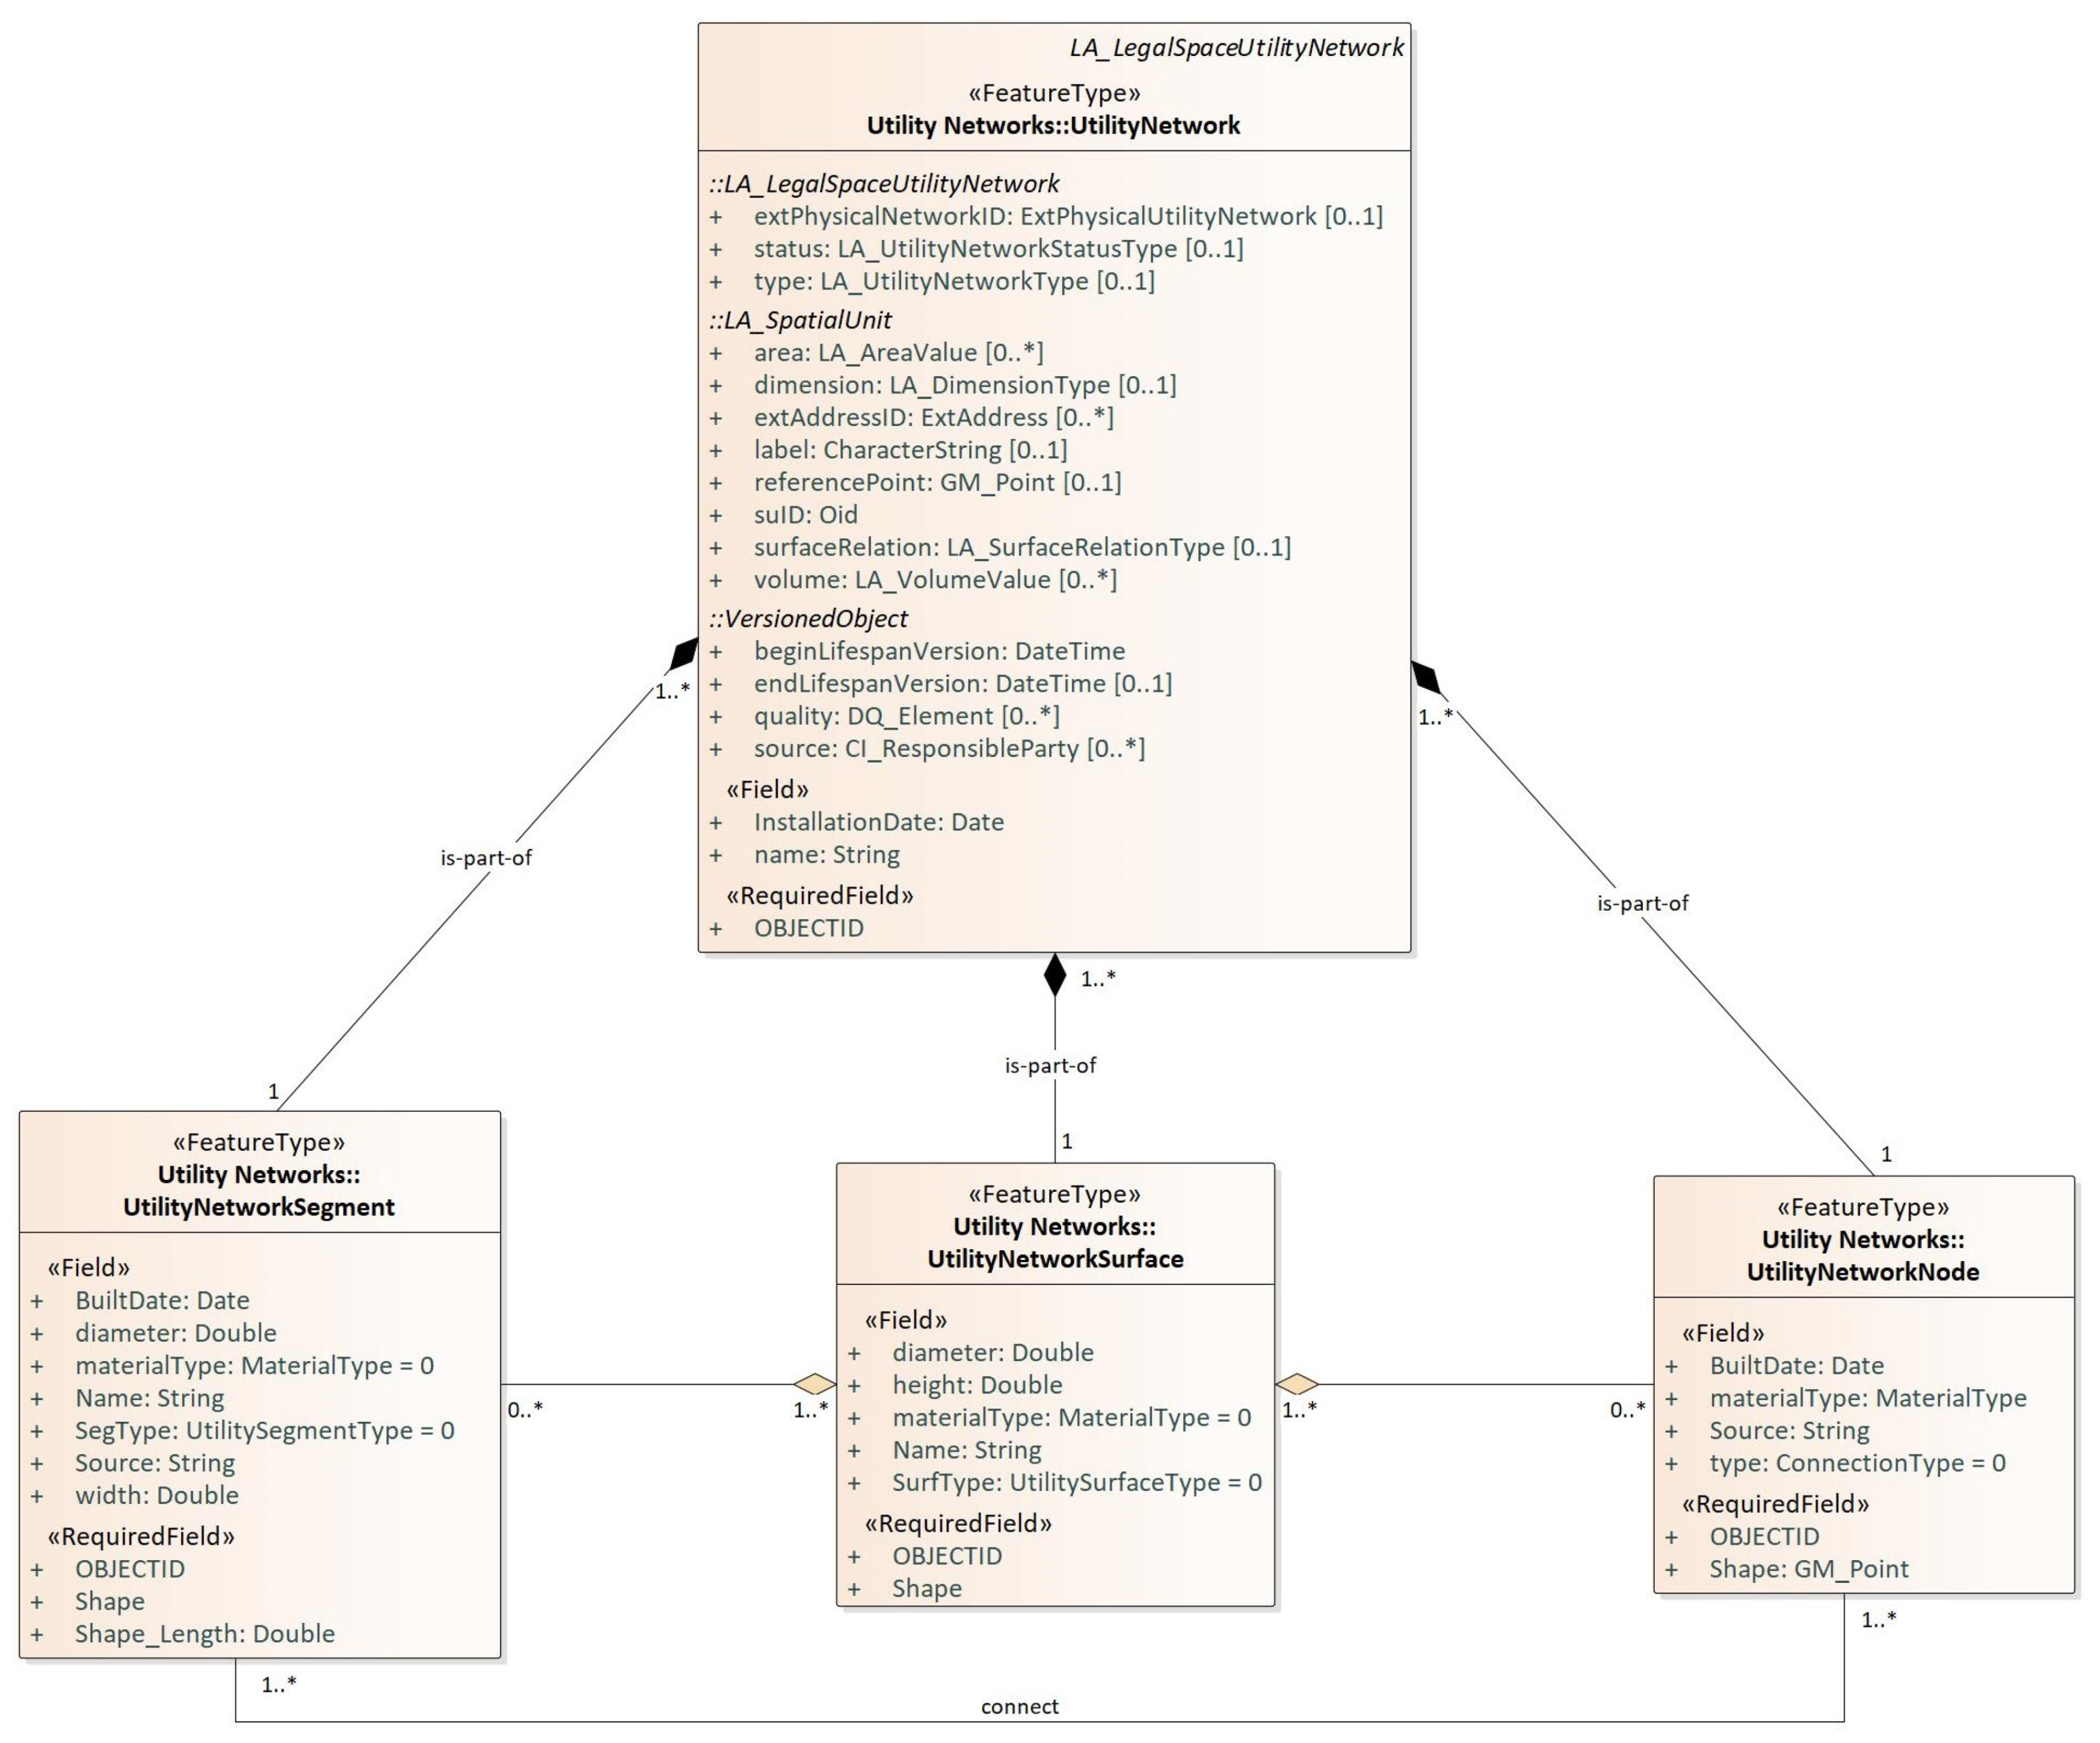
The Utility Networks package describes the basic information of utility networks, which includes geometric, spatial and physical information. Based on the partonomy (part–whole) relationships, this work defines the hierarchy of utility networks in three levels (Figure 9). The macro-level is the whole utility networks, which is described by the UtilityNetwork class with the basic information of utility networks, such as the type, and material of utility networks. The meso-level is the surface of the utility networks, which is the part of the utility networks. The surface could be the tunnel, duck, manhole and the other types of space in the utility networks. Hence, the aims of UtilityNetworkSurface class are to describe the types and 3D geometric information (e.g., diameter) of surface. The micro-level is the basic elements of utility networks, which includes nodes and segments of utilities. The node is a connection point in the network, which is defined by the UtilityNetworkNode class. The segment is the line segment of the utility, which is defined by the UtilityNetworkSegment class. The relationship between micro and meso level helps to transform 2D to 3D data as well. Figure 10 shows the relationships of different classes in the Utility Network package and basic attributes of each class. The values of utility networks type inherit from LA_LegalSpaceUtilityNetwork in the LADM (ISO 19152) [19].
The LA_UtilityNetworks class aims to describe the land administration information of utilities. On one side, it connects to the utility network surface in order to identify the land administration information of different parts of utility networks. On the other side, it connects to the cadastral parcel from the Singapore cadastral data model and LADM [19]. The spatial relationship is used to describe the relationship of cadastral parcels and utilities, which includes contain, cross and touch. This class could support ownership management of utilities and land administration management.
The Utility Survey class aims to organize utility survey information. It could help to manage survey status and accuracy of data. The Utility Survey class inherits attributes of the survey from the Singapore cadastral data model. Furthermore, the ground conditions and survey methods are related to the accuracy of data directly. Hence, the Utility Survey class integrates information from Standard and Specification for Utility Survey in Singapore [42]. Meanwhile, the Utility Survey class builds the connection between utility networks and LA_Point, LA_BoundaryFace and LA_SpatialSource in the Surveying and Representation package. The Evaluate attribute describes the method to check the accuracy of surveying data. If the accuracy of the data is unknown, the value of Evaluate is null. In future work, the accuracy level should be defined to be based on the depth level, soil condition and survey method.
4. Case Study
This initial study aims to integrate of GPR data and the existing underground utility data and land cadastral data in the form of the geospatial database. It aims to find a reasonable work process to bridge the gap between data capture and application. Moreover, this implementation can help to improve the design of a 3D data model for underground utility.
4.1. Study Area and Datasets
This initial study was conducted at around Lorong 2, 3 and 4 at Toa Payoh, which is located in the northern part of Singapore. This is one of the pilot study sites in our project to deploy a mobile mapping platform, namely Pegasus: Stream (https://idsgeoradar.com/products/ground-penetrating-radar/pegasus-stream) combines a Stream EM GPR (IDS Georadar, part of Hexagon, Switzerland) and Leica Pegasus Two (Leica geosystem AG, part of Hexagon, Switzerland) photo and laser scanner for massive 3D mapping of above and underground features. The data captured by the Pegasus: Stream is geo-referenced using an on-board GNSS receiver and IMU and a distance measurement instrument (DMI). The Stream EM GPR contains a large number of array antennae, with dual frequencies (200 MHz and 600 MHz). The antennae transmit and receive in two distinct polarizations (HH and VV), allowing the reconstruction of a 3D underground utility network with a single pass of the GPR. Table 3 shows the technical specification of the Stream EM GPR.
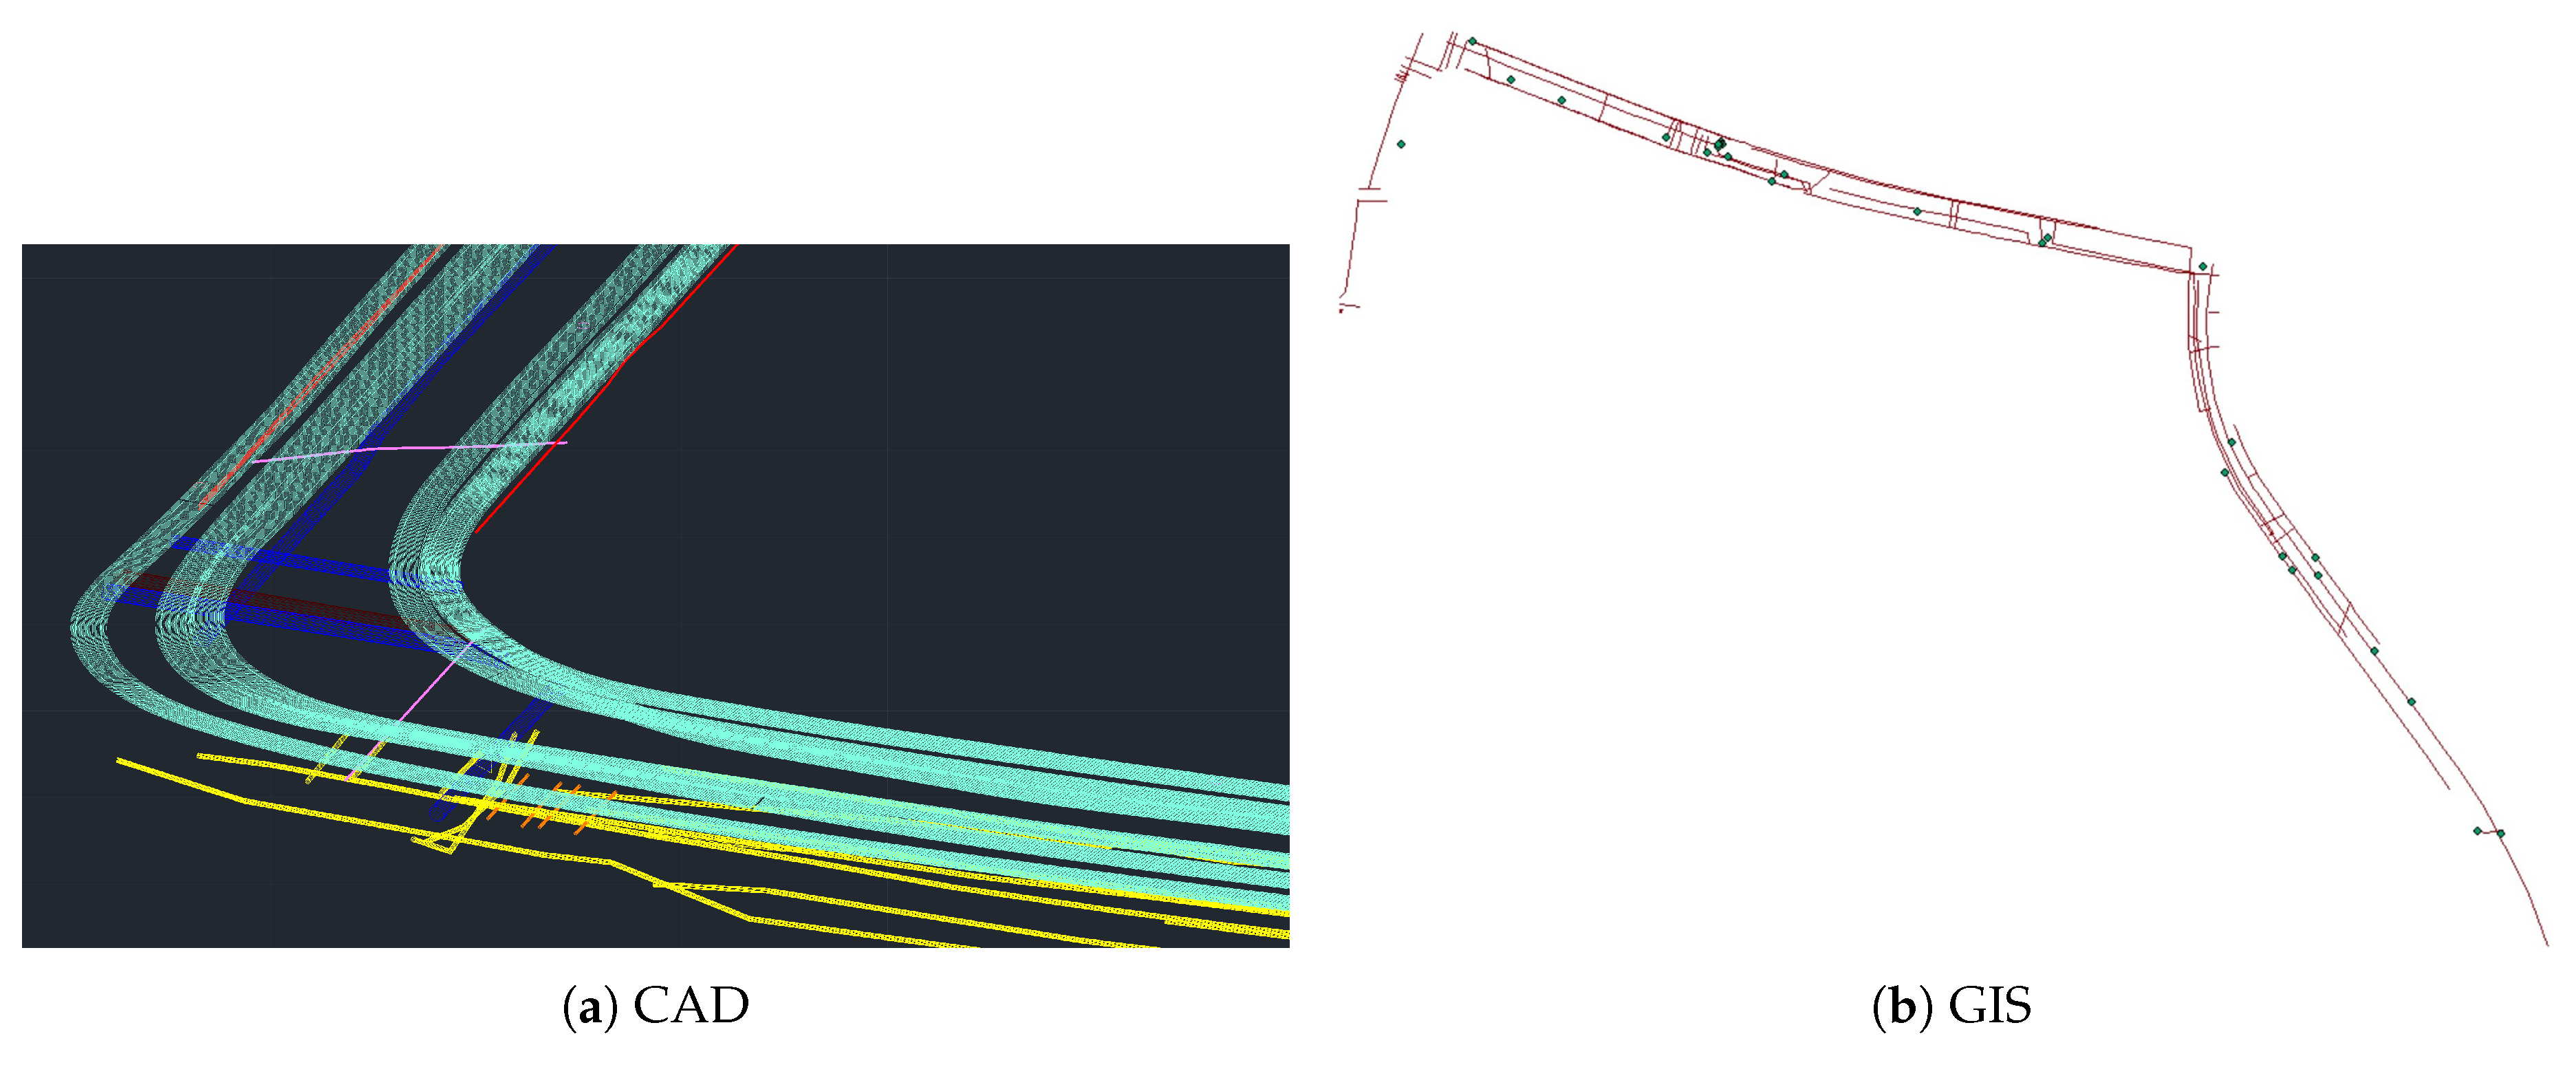
The scanning site is a 1.8 km long bi-directional 4-lane asphalt road in an inland area of Singapore that has seen development since the 1960s. This study was conducted to investigate the feasibility of GPR for large scale underground utility mapping for the purpose of improving the quality of existing utility map information. The data were collected at a driving speed of about 15 km/h. All of the acquired data were post-processed and interpreted to detect and extract underground utilities using a commercial off-the-shelf processing software along with the GPR system. At the current stage, we do not use point cloud data of the above ground. The identified utilities were then transferred to CAD/GIS format with x, y, z values as points and lines for 3D data modelling and visualization using the same processing software. Figure 11 shows an example of GPR data in CAD (Figure 11a) and GIS (Figure 11b) format.
The existing datasets from Geospace and cadastral data from Singapore Land Authority were used as secondary data to obtain or improve the attributes of utilities that were extracted from the radargram and to explore the relationship between the above land administration information and underground utilities. These existing utility data are as-build data from utility services (e.g., power, water, gas, telecommunication and sewerage) and cadastral information in 2D form. Of these datasets, it contains only a small portion of the information that has a diameter with updated time and type. It possesses challenges for land planning with such limited information.
4.2. 3D Visualisation
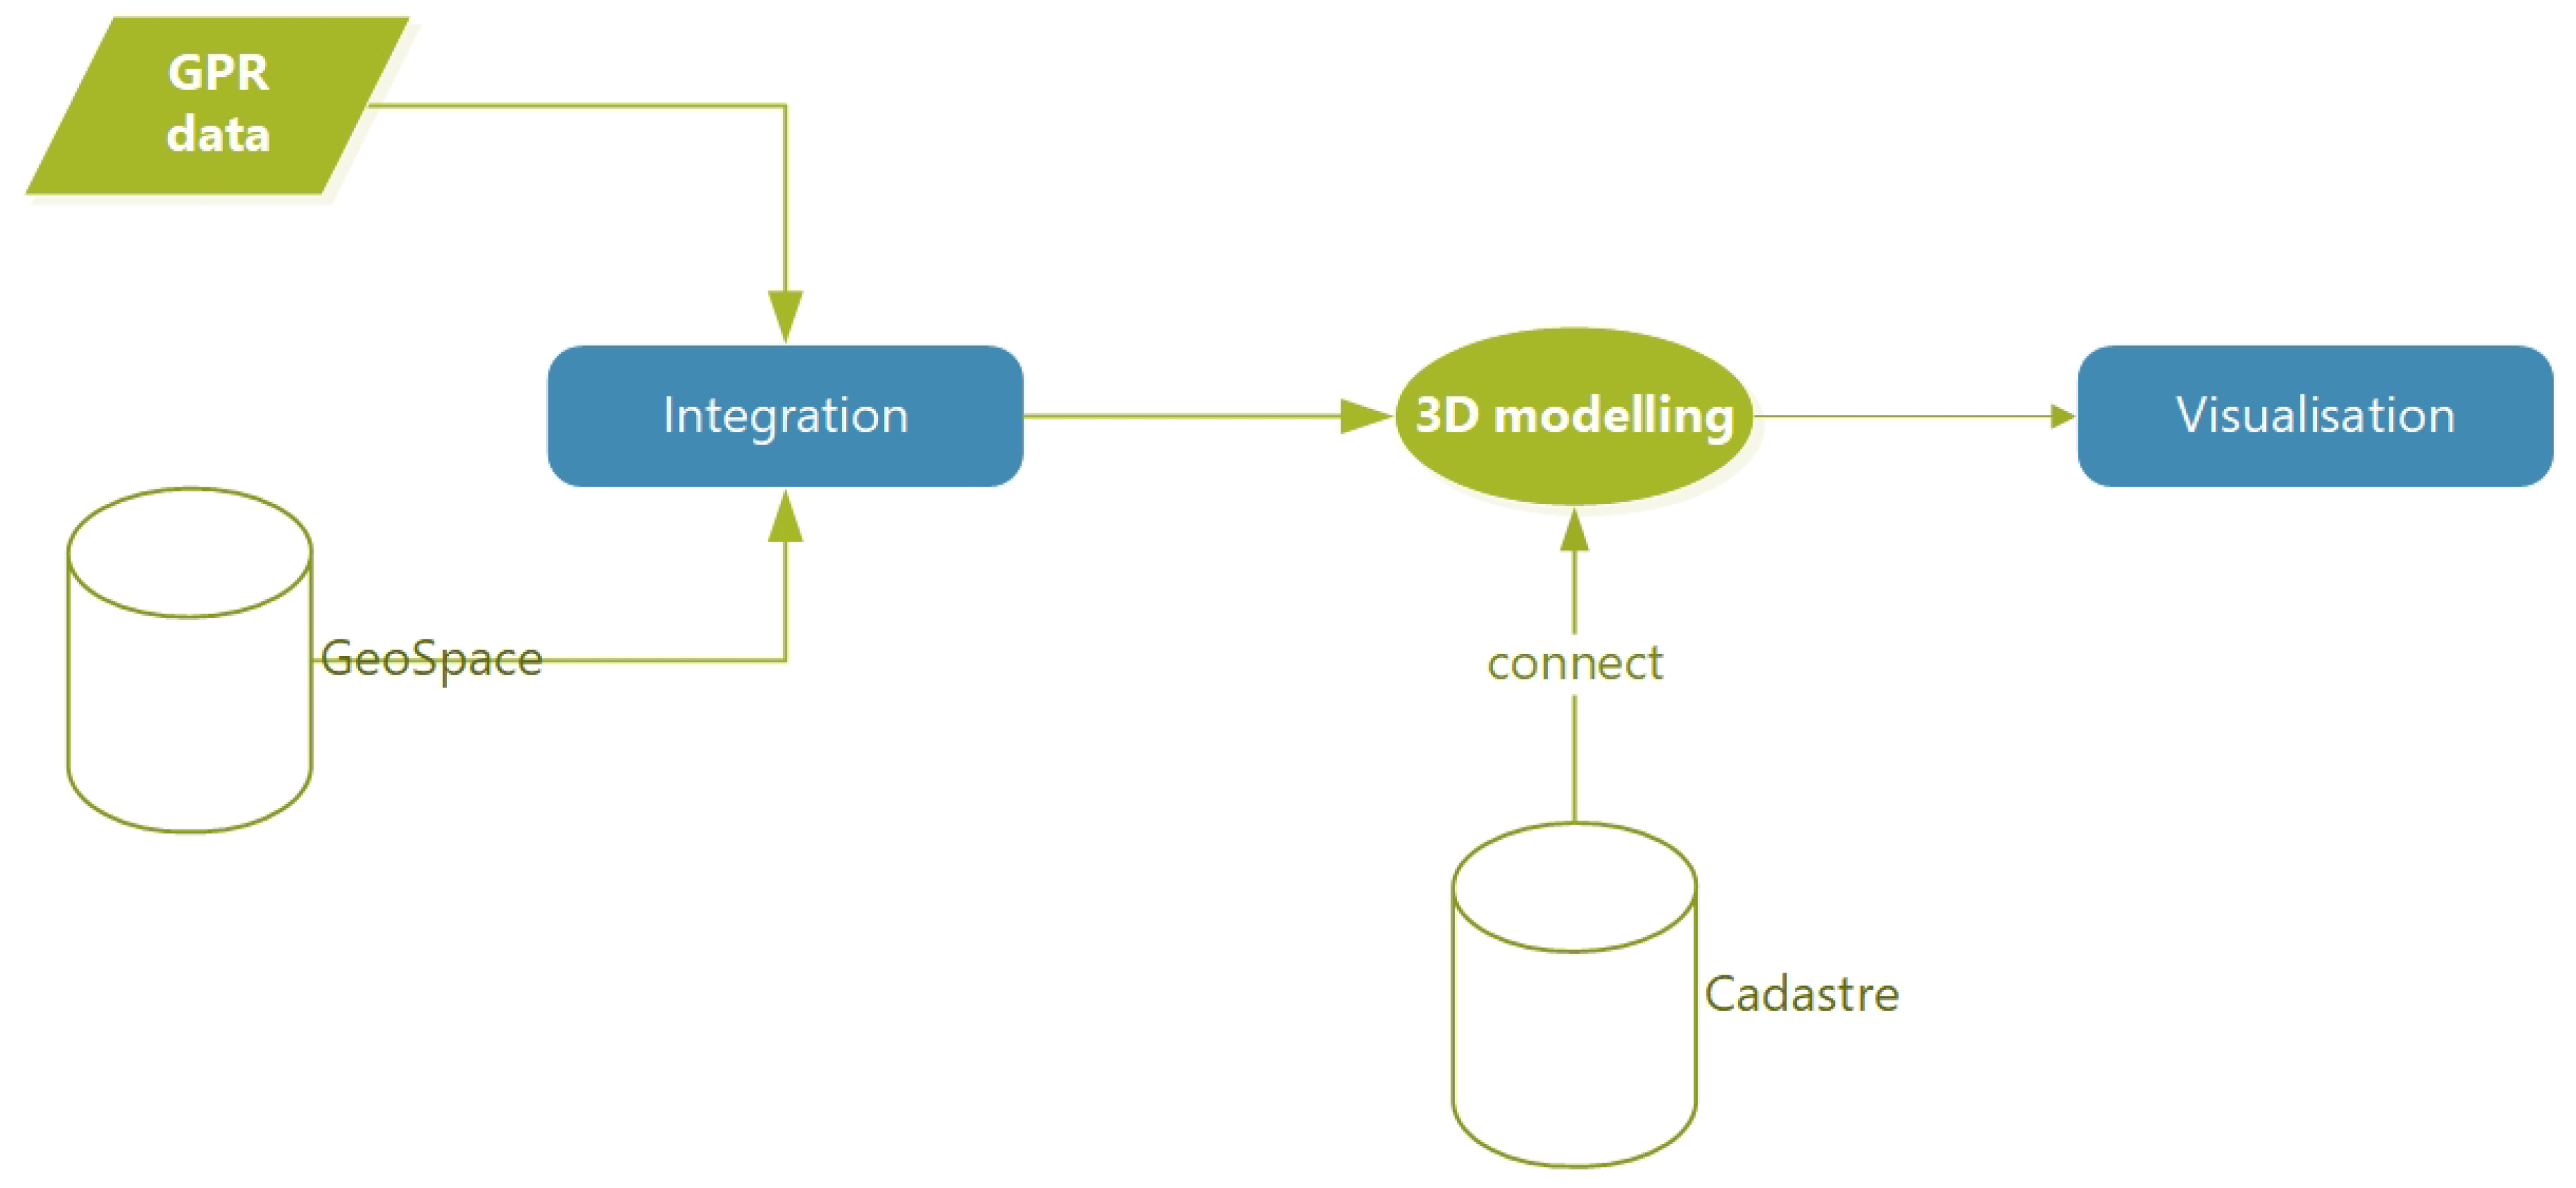
To develop the 3D utility data model for land administration, the underground utilities need to be connected to the land parcels. Figure 12 explains the work process in this case study. The data model is designed in UML and exported to XML format, which can be imported into ArcGIS as a geodatabase schema. Based on the database schema, the GPR data can be loaded as utility network components in polyline and point. According to the information from the existing utility data and GPR data, the utilities can be modelled in 3D (multipath). The 3D modelling is realized manually in the ArcSence and CityEngine.
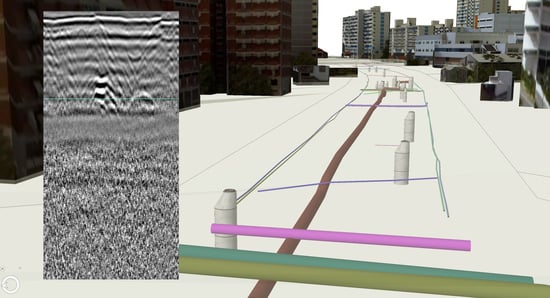
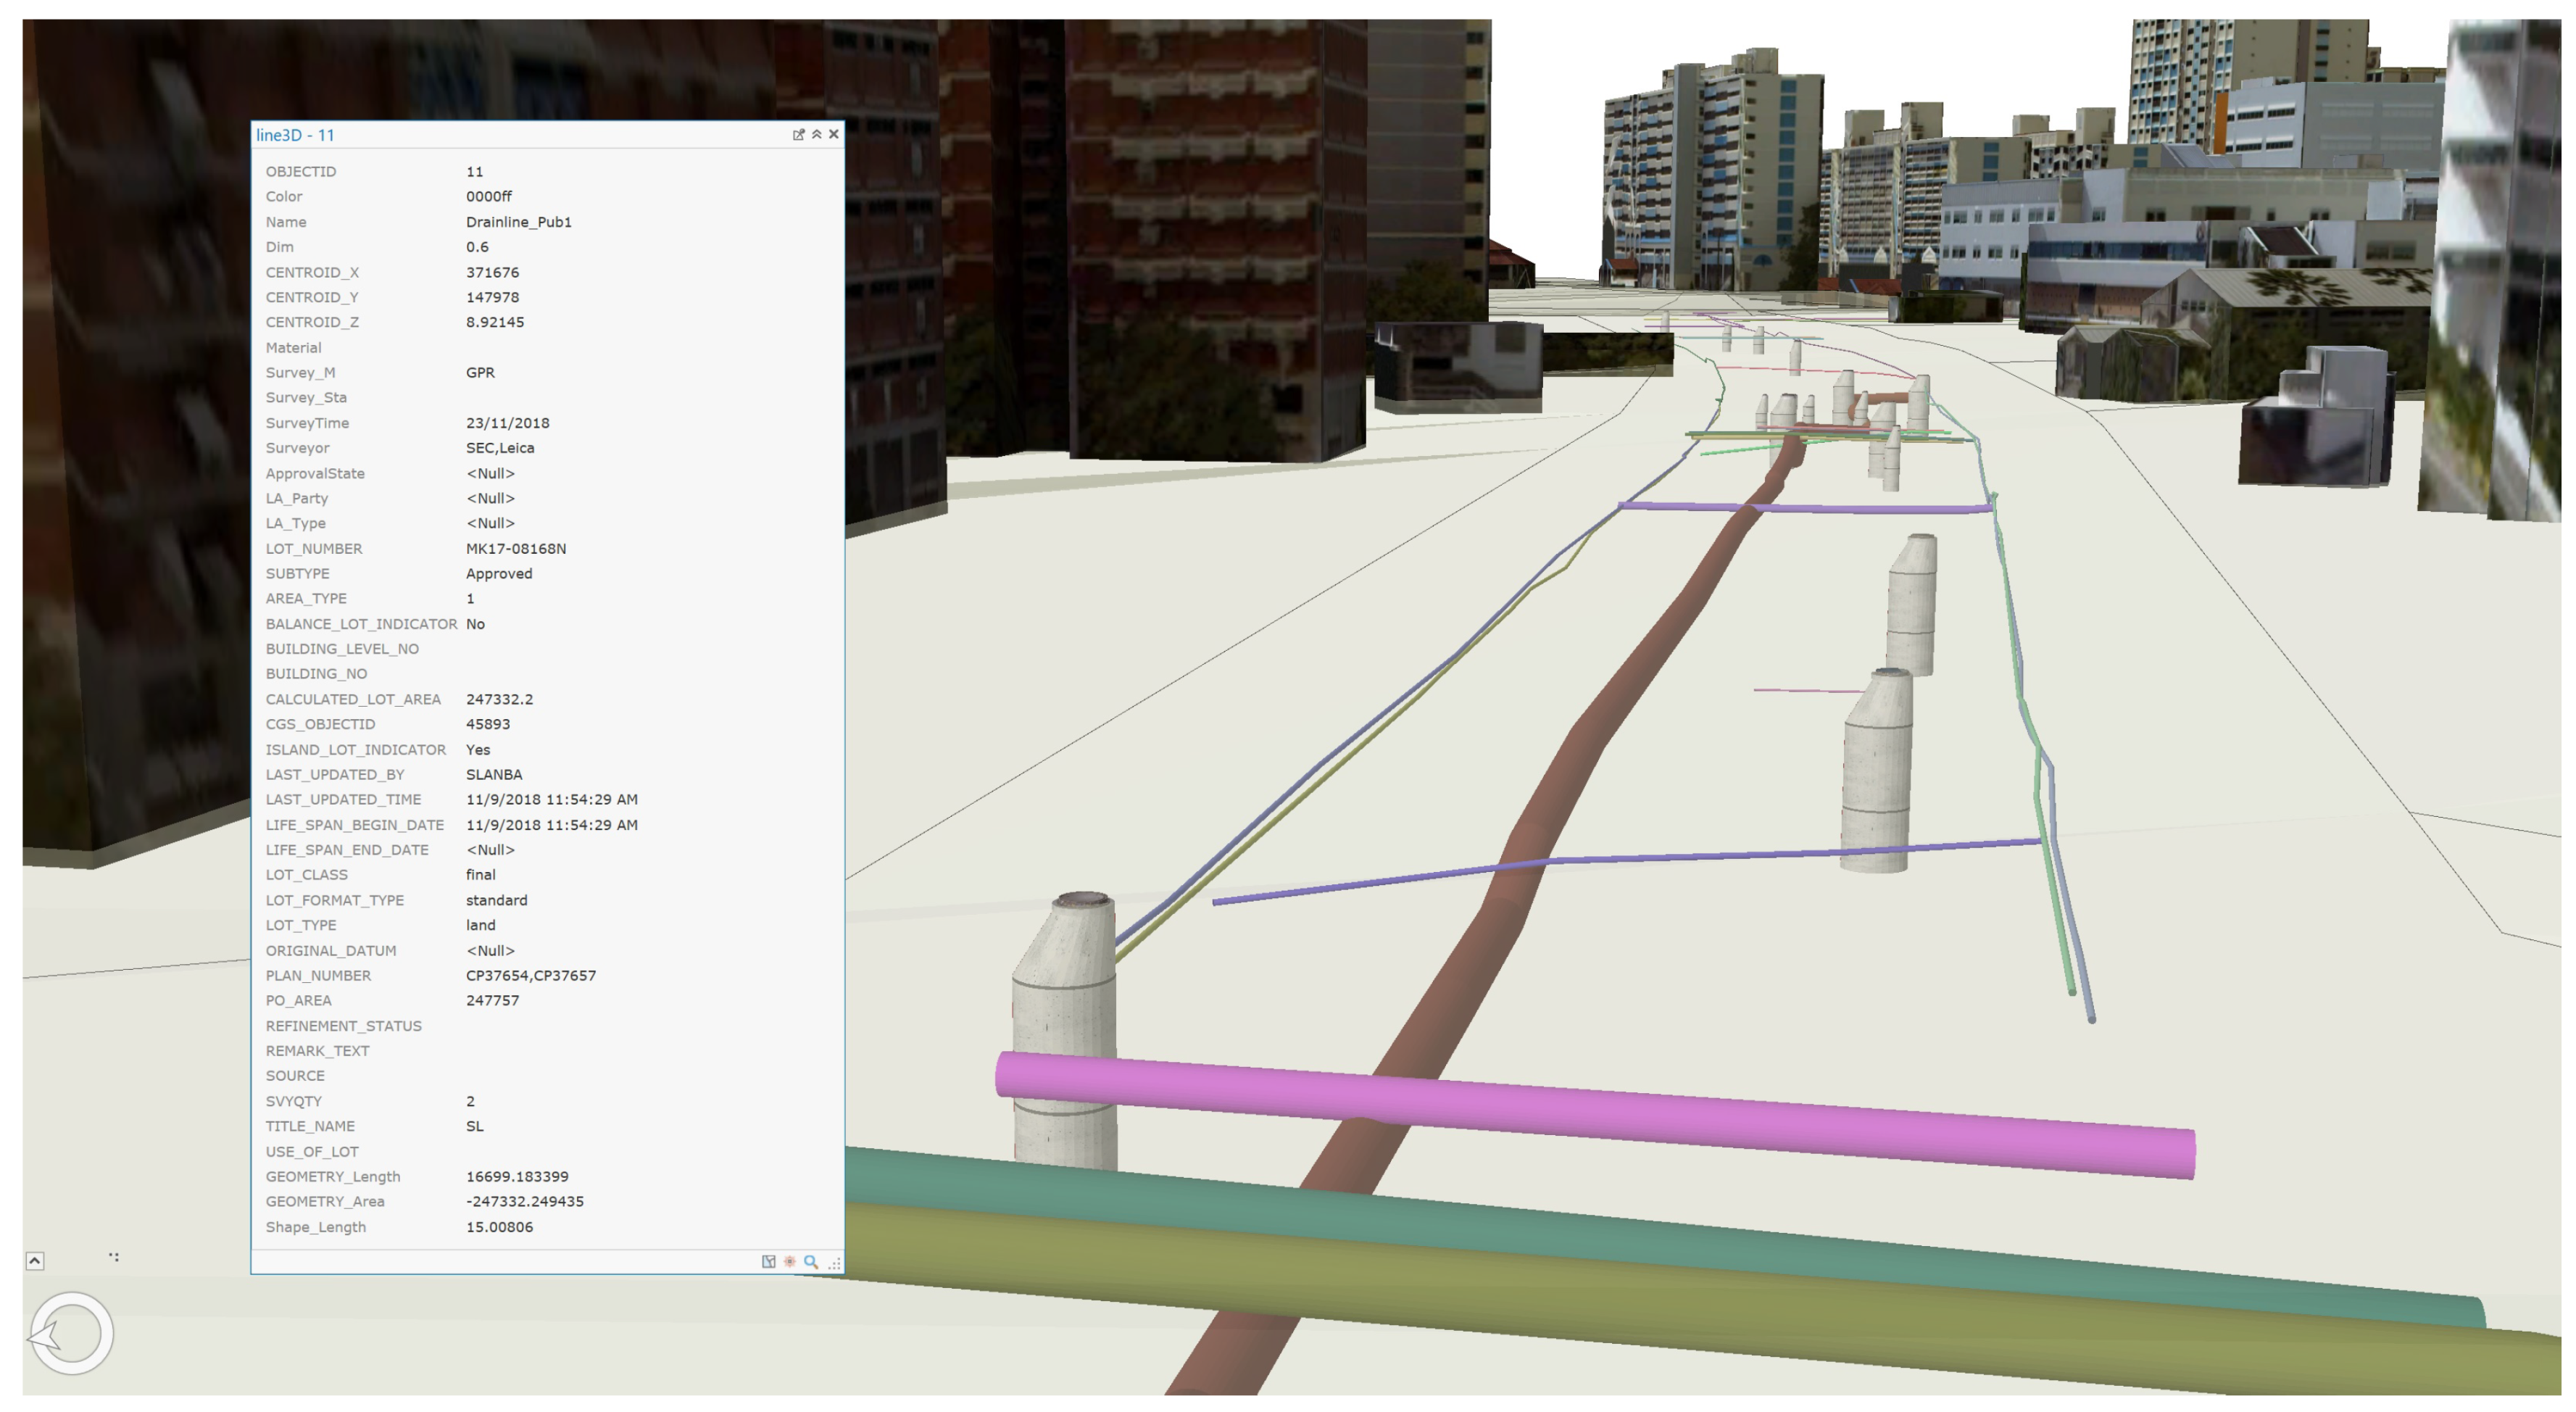
In order to get the related land administration information, the utility networks data can be integrated with a cadastral parcel through their spatial relationships. Because the existing cadastral data are in 2D, the current work only considers the pipeline within the cadastral parcel in 2D. In order to improve the accuracy of data in 3D, the current cadastral data have to be extended to 3D so as to support more spatial relationships (e.g., cross and touch). Figure 13 shows an example of 3D visualization of utilities with objects above ground. As shown in the figure, the selected pipeline is highlighted in pink. The information shown in the pop window includes spatial data from GPR and other attributes about the underground utility survey and land cadastral information above ground.
4.3. Discussion
This is a simple implementation to explore the work process of 3D modelling of underground utility from the GPR data and existing 2D data. Because GPR cannot capture the diameters, material and some attributes of utilities, it is necessary to extract these information from the GeoSpace database for 3D modelling. Depending on the spatial relationship (e.g., overlap, within) of the GPR data and existing utility data, some of the utilities from GPR data can be connected to the existing utility data. Because of two main limitations, there is a big challenge to improve the accuracy of data during the manual integration of the GPR and existing data. First, the existing utility data are as-build data which may not be reliable enough for updating work. Second, the existing utility data are in 2D data, which is difficult to identify utilities accurately. Hence, the future work needs to find the solution to detect much more attributes of utilities from GPR data. In addition, the tentative integration of underground utility and land cadastral data helps to improve the development of the data model for land administration.
5. Conclusions
This paper proposes to develop a consolidated 3D data model of underground utilities for land administration. The work includes two parts. On the one hand, a framework for data governance is designed to organize the workflow of utility data survey, management and application through five roles. Through the understanding of current workflow in the utility data usage, this work needs to clearly define the operations and rights of each role in the work process of 3D underground utility mapping. On the other hand, a 3D data model of underground utilities is designed with 3D spatial information, i.e., utility survey information, and land administration information of underground utilities. In order to fill the gap between data capture and usage, this data model has the following main tasks:
- Integrating utility networks data from varying non-destructive surveying technologies. Moreover, it proposes an idea to manage the data accuracy based on the parameters, ground condition and other information during the field survey. This is a first step towards bridging the gap between data acquisition and data management for 3D underground utility mapping.
- Integrating the existing data and GPR data. As mentioned earlier, GPR data cannot get the diameters and types of utilities. This way helps to improve the attributes of utilities from GPR data. Moreover, it is also a process to transform utility data from 2D to 3D.
- In the data integration, the key step is to connect the utility network data model with the LADM for 3D cadastral management of underground utility in Singapore. It is useful to support ownership management applications and build the relationship between utilities and land parcels. Such a reliable and consolidated centralized repository of underground utility data will provide a crucial basis for land administration of underground infrastructures.
A case study is implemented based on the GPR data from the large scale mobile underground utility mapping. The initial implementation transform GPR data from CAD to GIS format and 3D visualization of utilities based on the 3D utility data model. In order to get land administration information, the utility networks have been connecting to the cadastral parcel. The accuracy and details of utility networks need to be improved in future work, such as the spatial relationship between utilities and cadastral parcels. To fully support the land administration of underground space, the 3D utility data model should eventually be extended to include other underground objects and infrastructures in the future, such as underground substations, pedestrian links, common services tunnels, road and rail networks, etc.
This is an ongoing work and in the initial stage. Two main aspects of limitations need to be improved in future work. First, for the accuracy of utility data. Obviously, the GPR data are not enough to provide comprehensive 3D underground utility networks. The other kinds of data (e.g., Gyroscope) should be integrated to provide more precise attributes for underground utilities. Moreover, the details of the shapes and structures of utilities need to be improved. Second, the next step of the data model development will improve the definition of land administration for underground utilities. Additionally, in order to develop a comprehensive underground utility database, it is necessary to explore the methods to use the existing data and integrate it with newly collected data. The 3D data model should be extended to be 4D (3D + time) to support data updating. A showcase will be developed to realize land administration of underground utility based on a 3D underground utility data model. This will work with a selected agency as data regulatory body and the preferred data integrator. They will help us to evaluate and improve the framework and definition of the data model. After that, recommendations from this showcase will be used to extend the data model include other underground infrastructures and develop the platform of underground space management to support various applications in Singapore.
Author Contributions
Conceptualization, J.Y. and K.H.S.; methodology, J.Y. and K.H.S.; implementation, J.Y.; Data curation, J.Y. and S.W.J.; writing—original draft preparation, J.Y.; writing—review and editing, S.W.J., K.H.S., G.S. and A.W.; visualization, J.Y.; supervision, G.S. and A.W.
Funding
Underground-related studies and projects fund (USPF), Ministry of National Development and is sponsored by the Singapore Land Authority.
Acknowledgments
This publication has been realized as part of the project “Digital Underground: 3D Mapping of Utility Networks” at the Future Cities Laboratory, established by ETH-Zürich and Singapore’s National Research Foundation (NRF), and operating under the auspices of the Singapore-ETH Centre.
Conflicts of Interest
The authors declare no conflict of interest.
References
- The Urban Redevelopment Authority (URA). Draft Master Plan 2019—Proposals for an Inclusive, Sustainable and Resilient City; Urban Redevelopment Authority: Singapore, 2019. Available online: www.ura.gov.sg/Corporate/Media-Room/Media-Releases/pr19-13 (accessed on 20 August 2019).
- Jaw, S.W.; Van Son, R.; Khoo, V.H.S.; Schrotter, G.; Loo, R.W.K.; Teo, S.S.N.; Yan, J. The Need for a Reliable Map of Utility Networks for Planning Underground Spaces. In Proceedings of the 2018 17th International Conference on Ground Penetrating Radar (GPR), Rapperswil, Switzerland, 18–21 June 2018; pp. 1–6. [Google Scholar]
- Yan, J.; Jaw, S.W.; Son, R.V.; Soon, K.H.; Schrotter, G. Three-dimensional data modelling for underground utility network mapping. ISPRS Int. Arch. Photogramm. Remote Sens. Spat. Inf. Sci. 2018, XLII-4, 711–715. [Google Scholar] [CrossRef]
- Hao, T.; Rogers, C.; Metje, N.; Chapman, D.; Muggleton, J.; Foo, K.; Wang, P.; Pennock, S.; Atkins, P.; Swingler, S.; et al. Condition assessment of the buried utility service infrastructure. Tunn. Undergr. Space Technol. 2012, 28, 331–344. [Google Scholar] [CrossRef]
- Lai, W.W.L.; Dérobert, X.; Annan, P. A review of ground penetrating radar application in civil engineering: A 30-year journey from locating and testing to imaging and diagnosis. NDT E Int. 2018, 96, 58–78. [Google Scholar]
- Ni, S.H.; Huang, Y.H.; Lo, K.F.; Lin, D.C. Buried pipe detection by ground penetrating radar using the discrete wavelet transform. Comput. Geotech. 2010, 37, 440–448. [Google Scholar] [CrossRef]
- Rogers, C.; Hao, T.; Costello, S.; Burrow, M.; Metje, N.; Chapman, D.; Parker, J.; Armitage, R.; Anspach, J.; Muggleton, J.; et al. Condition assessment of the surface and buried infrastructure—A proposal for integration. Tunn. Undergr. Space Technol. 2012, 28, 202–211. [Google Scholar] [CrossRef]
- Lagüela, S.; Solla, M.; Puente, I.; Prego, F.J. Joint use of GPR, IRT and TLS techniques for the integral damage detection in paving. Constr. Build. Mater. 2018, 174, 749–760. [Google Scholar] [CrossRef]
- van Disseldorp, R. Unique Autonomous Pipeline Mapping System. In Proceedings of the 2nd Pipeline Technology Conference, Hannover, Germany, 16–17 April 2007. [Google Scholar]
- The British Standards Institution. PAS 128:2014 Specification for Underground Utility Detection, Verification and Location; BSI Standards Limited: London, UK, 2014. [Google Scholar]
- Sato, M. GPR and Its Application to Environmental Study; Center for Northeast Asia Studies (CNEAS), Tohoku University: Miyagi, Japan, 2001. [Google Scholar]
- Lunt, I.A.; Hubbard, S.S.; Rubin, Y. Soil moisture content estimation using ground-penetrating radar reflection data. J. Hydrol. 2005, 307, 254–269. [Google Scholar] [CrossRef]
- Lai, W.W.L.; Chang, R.K.W.; Sham, J.F.C. A blind test of nondestructive underground void detection by ground penetrating radar (GPR). J. Appl. Geophys. 2018, 149, 10–17. [Google Scholar] [CrossRef]
- Desai, L. Underground Utility Survey. Imper. J. Interdiscip. Res. (IJIR) 2016, 2, 4. [Google Scholar]
- Yelf, R.J. Application of ground penetrating radar to civil and geotechnical engineering. Electromagn. Phenom. 2007, 7, 18. [Google Scholar]
- van Oosterom, P. Research and development in 3D cadastres. Comput. Environ. Urban Syst. 2013, 40, 1–6. [Google Scholar] [CrossRef]
- Van Oosterom, P.; Lemmen, C. The Land Administration Domain Model (LADM): Motivation, standardisation, application and further development. Land Use Policy 2015, 49, 527–534. [Google Scholar] [CrossRef]
- Pouliot, J.; Girard, P. 3D Cadastre: With or without Subsurface Utility Network? International Federation of Surveyors (FIG): Athens, Greece, 2016; OCLC: 831214525. [Google Scholar]
- International Standards Organization. ISO 19152: Geographic information—Land Administration Domain Model (LADM); ISO Copyright Office: Geneva, Switzerland, 2012. [Google Scholar]
- Döner, F.; Thompson, R.; Stoter, J.; Lemmen, C.; Ploeger, H.; van Oosterom, P.; Zlatanova, S. 4D cadastres: First analysis of legal, organizational, and technical impact—With a case study on utility networks. Land Use Policy 2010, 27, 1068–1081. [Google Scholar] [CrossRef]
- Döner, F.; Thompson, R.; Stoter, J.; Lemmen, C.; Ploeger, H.; Oosterom, P.v.; Zlatanova, S. Solutions for 4D cadastre—With a case study on utility networks. Int. J. Geogr. Inf. Sci. 2011, 25, 1173–1189. [Google Scholar] [CrossRef]
- Oosterom, P.V.; Stoter, J.; Ploeger, H. Initial Analysis of the Second FIG 3D Cadastres Questionnaire: Status in 2014 and Expectations for 2018. In Proceedings of the 4th International FIG 3D Cadastre Workshop, Dubai, UAE, 9–11 November 2014. [Google Scholar]
- Kantonales Geoinformationsgesetz (KGeoIG). 2018. Available online: www.zhlex.zh.ch/Erlass.html?Open&Ordnr=704.1 (accessed on 26 July 2019).
- Geoinformation Act, GeoIA. 2007. Available online: www.admin.ch/opc/en/classified-compilation/20050726/index.html#fn1 (accessed on 26 July 2019).
- Leitungskatasterverordnung (LKV). 2012. Available online: www.zhlex.zh.ch/Erlass.html?Open&Ordnr=704.14 (accessed on 26 July 2019).
- Kanton Zürich. Leitungskataster-Stadt Zurich. Zürich. 2017. Available online: www.stadt-zuerich.ch/ted/de/index/geoz/geodaten_u_plaene/leitungskataster.html (accessed on 26 July 2019).
- Geodaten zu Ver-und Entsorgungsleitungen. 2012. Available online: www.webnorm.ch/null/null/sia%20405/d/2012/D/Product (accessed on 26 July 2019).
- Radulović, A.; Sladić, D.; Govedarica, M.; Ristić, A.; Jovanović, D. LADM Based Utility Network Cadastre in Serbia. ISPRS Int. J. Geo-Inf. 2019, 8, 206. [Google Scholar] [CrossRef]
- Vu, N.; Roi, M.; Markovinovi, D. Towards 3D and 4D Cadastre in Croatia. In Proceedings of the 4th International Workshop on 3D Cadastres, Dubai, UAE, 9–11 November 2014; pp. 261–280. [Google Scholar]
- Vučić, N.; Roić, M.; Mađer, M.; Vranić, S.; Van Oosterom, P. Overview of the Croatian Land Administration System and the Possibilities for Its Upgrade to 3D by Existing Data. ISPRS Int. J. Geo-Inf. 2017, 6, 223. [Google Scholar] [CrossRef]
- Tan, L.C.; Looi, K.S. Towards a Malaysian multipurpose 3D cadastre based on the Land Administration Domain Model (LADM)—An empirical study. In Proceedings of the 5th FIG Land Administration Domain Model Workshop, Kuala Lumpur, Malaysia, 24–25 September 2013; pp. 24–25. [Google Scholar]
- Becker, T.; Nagel, C.; Kolbe, T.H. Integrated 3D Modeling of Multi-Utility Networks and Their Interdependencies for Critical Infrastructure Analysis. In Advances in 3D Geo-Information Sciences; Springer: Berlin/Heidelberg, Germany, 2011; pp. 1–20. [Google Scholar]
- Becker, T.; Nagel, C.; Kolbe, T.H. Semantic 3D modeling of multi-utility networks in cities for analysis and 3D visualization. In Progress and New Trends in 3D Geoinformation Sciences; Springer: Berlin/Heidelberg, Germany, 2013; pp. 41–62. [Google Scholar]
- Hijazi, I.; Kutzner, T.; Kolbe, T.H. Use Cases and their Requirements on the Semantic Modeling of 3D Supply and Disposal Networks; Kulturelles Erbe erfassen und bewahren-Von der Dokumentation zum virtuellen Rundgang, 37; Wissenschaftlich-Technische Jahrestagung der DGPF: Würzburg, Germany, 2017; pp. 288–301. [Google Scholar]
- Gröger, G.; Kolbe, T.H.; Nagel, C.; Häfele, K.H. OGC City Geography Markup Language (CityGML) Encoding Standard; Version 2.0, OGC doc no. 12-019; Open Geospatial Consortium: Wayland, MA, USA, 2012. [Google Scholar]
- Scholtenhuis, L.L.o.; Duijn, X.d.; Zlatanova, S. Representing geographical uncertainties of utility location data in 3D. Autom. Constr. 2018, 96, 483–493. [Google Scholar] [CrossRef]
- Liebich, T. IFC 2x Edition 3. In Model Implementation Guide, Version 2.0; buildingSMART International: Hertfordshire, UK, 2009. [Google Scholar]
- JRC. D2.8.III.6 INSPIRE Data Specification on Utility and Government Services—Technical Guidelines; European Commission Joint Research Centre: Brussels, Belgium, 2013. [Google Scholar]
- ESRI. What Are Geometric Networks? ESRI, USA, 2017. Available online: https://desktop.arcgis.com/en/arcmap/10.3/manage-data/geometric-networks/what-are-geometric-networks-.html (accessed on 17 August 2019).
- Lieberman, J.; Ryan, A. OGC Underground Infrastructure Concept Study Engineering Report; OGC Engineering Report; Open Geospatial Consortium: Wayland, MA, USA, 2017. [Google Scholar]
- International Standards Organization. ISO 19107:2003(en), Geographic information—Spatial Schema; ISO Copyright Office: Geneva, Switzerland, 2003. [Google Scholar]
- Singapore Land Authority. Standard and Specifications for Utility Survey in Singapore; Singapore Land Authority: Singapore, 2017.
Figure 1.
An example of utility data in the Marina Bay region of Singapore (source: Singapore Land Authority, 2018).
Figure 1.
An example of utility data in the Marina Bay region of Singapore (source: Singapore Land Authority, 2018).

Figure 2.
The issues of existing utility data (Source: Singapore Land Authority, 2018).

Figure 3.
Workflow of underground utility mapping.

Figure 4.
Examples of GPR instruments (a) and GPR data (b); the data show a radargram of a longitudinal cross section of the top-most about 2.85 m along an asphalt paved road (bottom), a perpendicular cross section of one lane (top right) and the top view of the scanning tracks covered by GPR measurements (top left).

Figure 5.
An example of a gyroscope-based pipeline measurement system (a) and the 3D map of the measured pipes (b).
Figure 5.
An example of a gyroscope-based pipeline measurement system (a) and the 3D map of the measured pipes (b).

Figure 6.
Utility map of City of Zürich (Source: Geomatik + Vermessung Stadt Zürich).

Figure 7.
The framework of underground utility network data governance.

Figure 8.
The overview of packages of the 3D underground utility data model.

Figure 9.
Multilevel structure of utility networks.

Figure 10.
The classes diagram of utility networks.

Figure 11.
GPR data in CAD and GIS format.

Figure 12.
Implementation process.

Figure 13.
A result example of 3D visualization with land administration information.


Table 1.
Data capture methods for underground utility services.
| Method | Technology | Use Case | Typical (Primary) Data | Accuracy |
|---|---|---|---|---|
| Conventional surveying | Total Station | Open pit | Sparse point trajectory | Measure distance up to 1500 m; accuracy about 1.5 mm + 2 parts per million. |
| Laser scanning photogrammetry | Open pit | Dense point cloud | Handheld: depends on the distance to the subject and the quality of scan reconstruction; Desktop: consistent accuracy within the constrained scan volume. | |
| Geophysical | GPR | Buried | Radargram | Horizontal: 250 mm or +40% of detected depth |
| Electromagnetic | PCL | Buried | Set of points | 3% for <3 m; 5% for 3–5 m |
| Gyro-based | IMU-based system | Buried newly laid | Dense point trajectory | XY - 0.25%; Z - 0.1% |
| Electromagnetic RFID | Marker tagging | Buried | Sparse set of points | X, Y, Z axes: ±10 cm; max. depth: 1.5 m |
Table 2.
Comparison of model characteristics.
| CityGML Utility Network ADE | ArcGIS Utility Networks | INSPIRE Utility Networks | IFC | |
|---|---|---|---|---|
| 3D representation modelling | ||||
| -3D geometries | + | - | - | ++ |
| -Topological aspects | ++ | ++ | ++ | ++ |
| -Hierarchical modelling | ++ | . | ++ | + |
| Land Administration | - | - | - | - |
| Data quality management | - | - | - | - |
-: no support, .: basic support, +: sophisticated support, ++: comprehensive support.
Table 3.
Technical specifications of the Stream EM GPR.
| Overall weight | 228 kg (500 lbs) |
| Max. acquisition speed | 15 kph (9mph) |
| Positioning | Survey wheel and/or GPS or Total Station |
| Scan Rate per Channel (@512 samples/scan) | 87 scans/sec |
| Scan Interval | 17 scans/m @ 200 MHz 33 scans/m @ 600 MHz |
| Antenna Footprint | Width 1.84 m |
| Number of Channel | 38 |
| Antenna Central | 200 MHz (34 channels) |
| Frequencies | 600 MHz (4 channels) |
| Antenna Spacing | 6 cm |
| Antenna Polarization | Horizontal (HH) and Vertical (VV) |
© 2019 by the authors. Licensee MDPI, Basel, Switzerland. This article is an open access article distributed under the terms and conditions of the Creative Commons Attribution (CC BY) license (http://creativecommons.org/licenses/by/4.0/).
Share and Cite
MDPI and ACS Style
Yan, J.; Jaw, S.W.; Soon, K.H.; Wieser, A.; Schrotter, G. Towards an Underground Utilities 3D Data Model for Land Administration. Remote Sens. 2019, 11, 1957. https://doi.org/10.3390/rs11171957
AMA Style
Yan J, Jaw SW, Soon KH, Wieser A, Schrotter G. Towards an Underground Utilities 3D Data Model for Land Administration. Remote Sensing. 2019; 11(17):1957. https://doi.org/10.3390/rs11171957
Chicago/Turabian StyleYan, Jingya, Siow Wei Jaw, Kean Huat Soon, Andreas Wieser, and Gerhard Schrotter. 2019. "Towards an Underground Utilities 3D Data Model for Land Administration" Remote Sensing 11, no. 17: 1957. https://doi.org/10.3390/rs11171957
Note that from the first issue of 2016, this journal uses article numbers instead of page numbers. See further details here.