1. Introduction
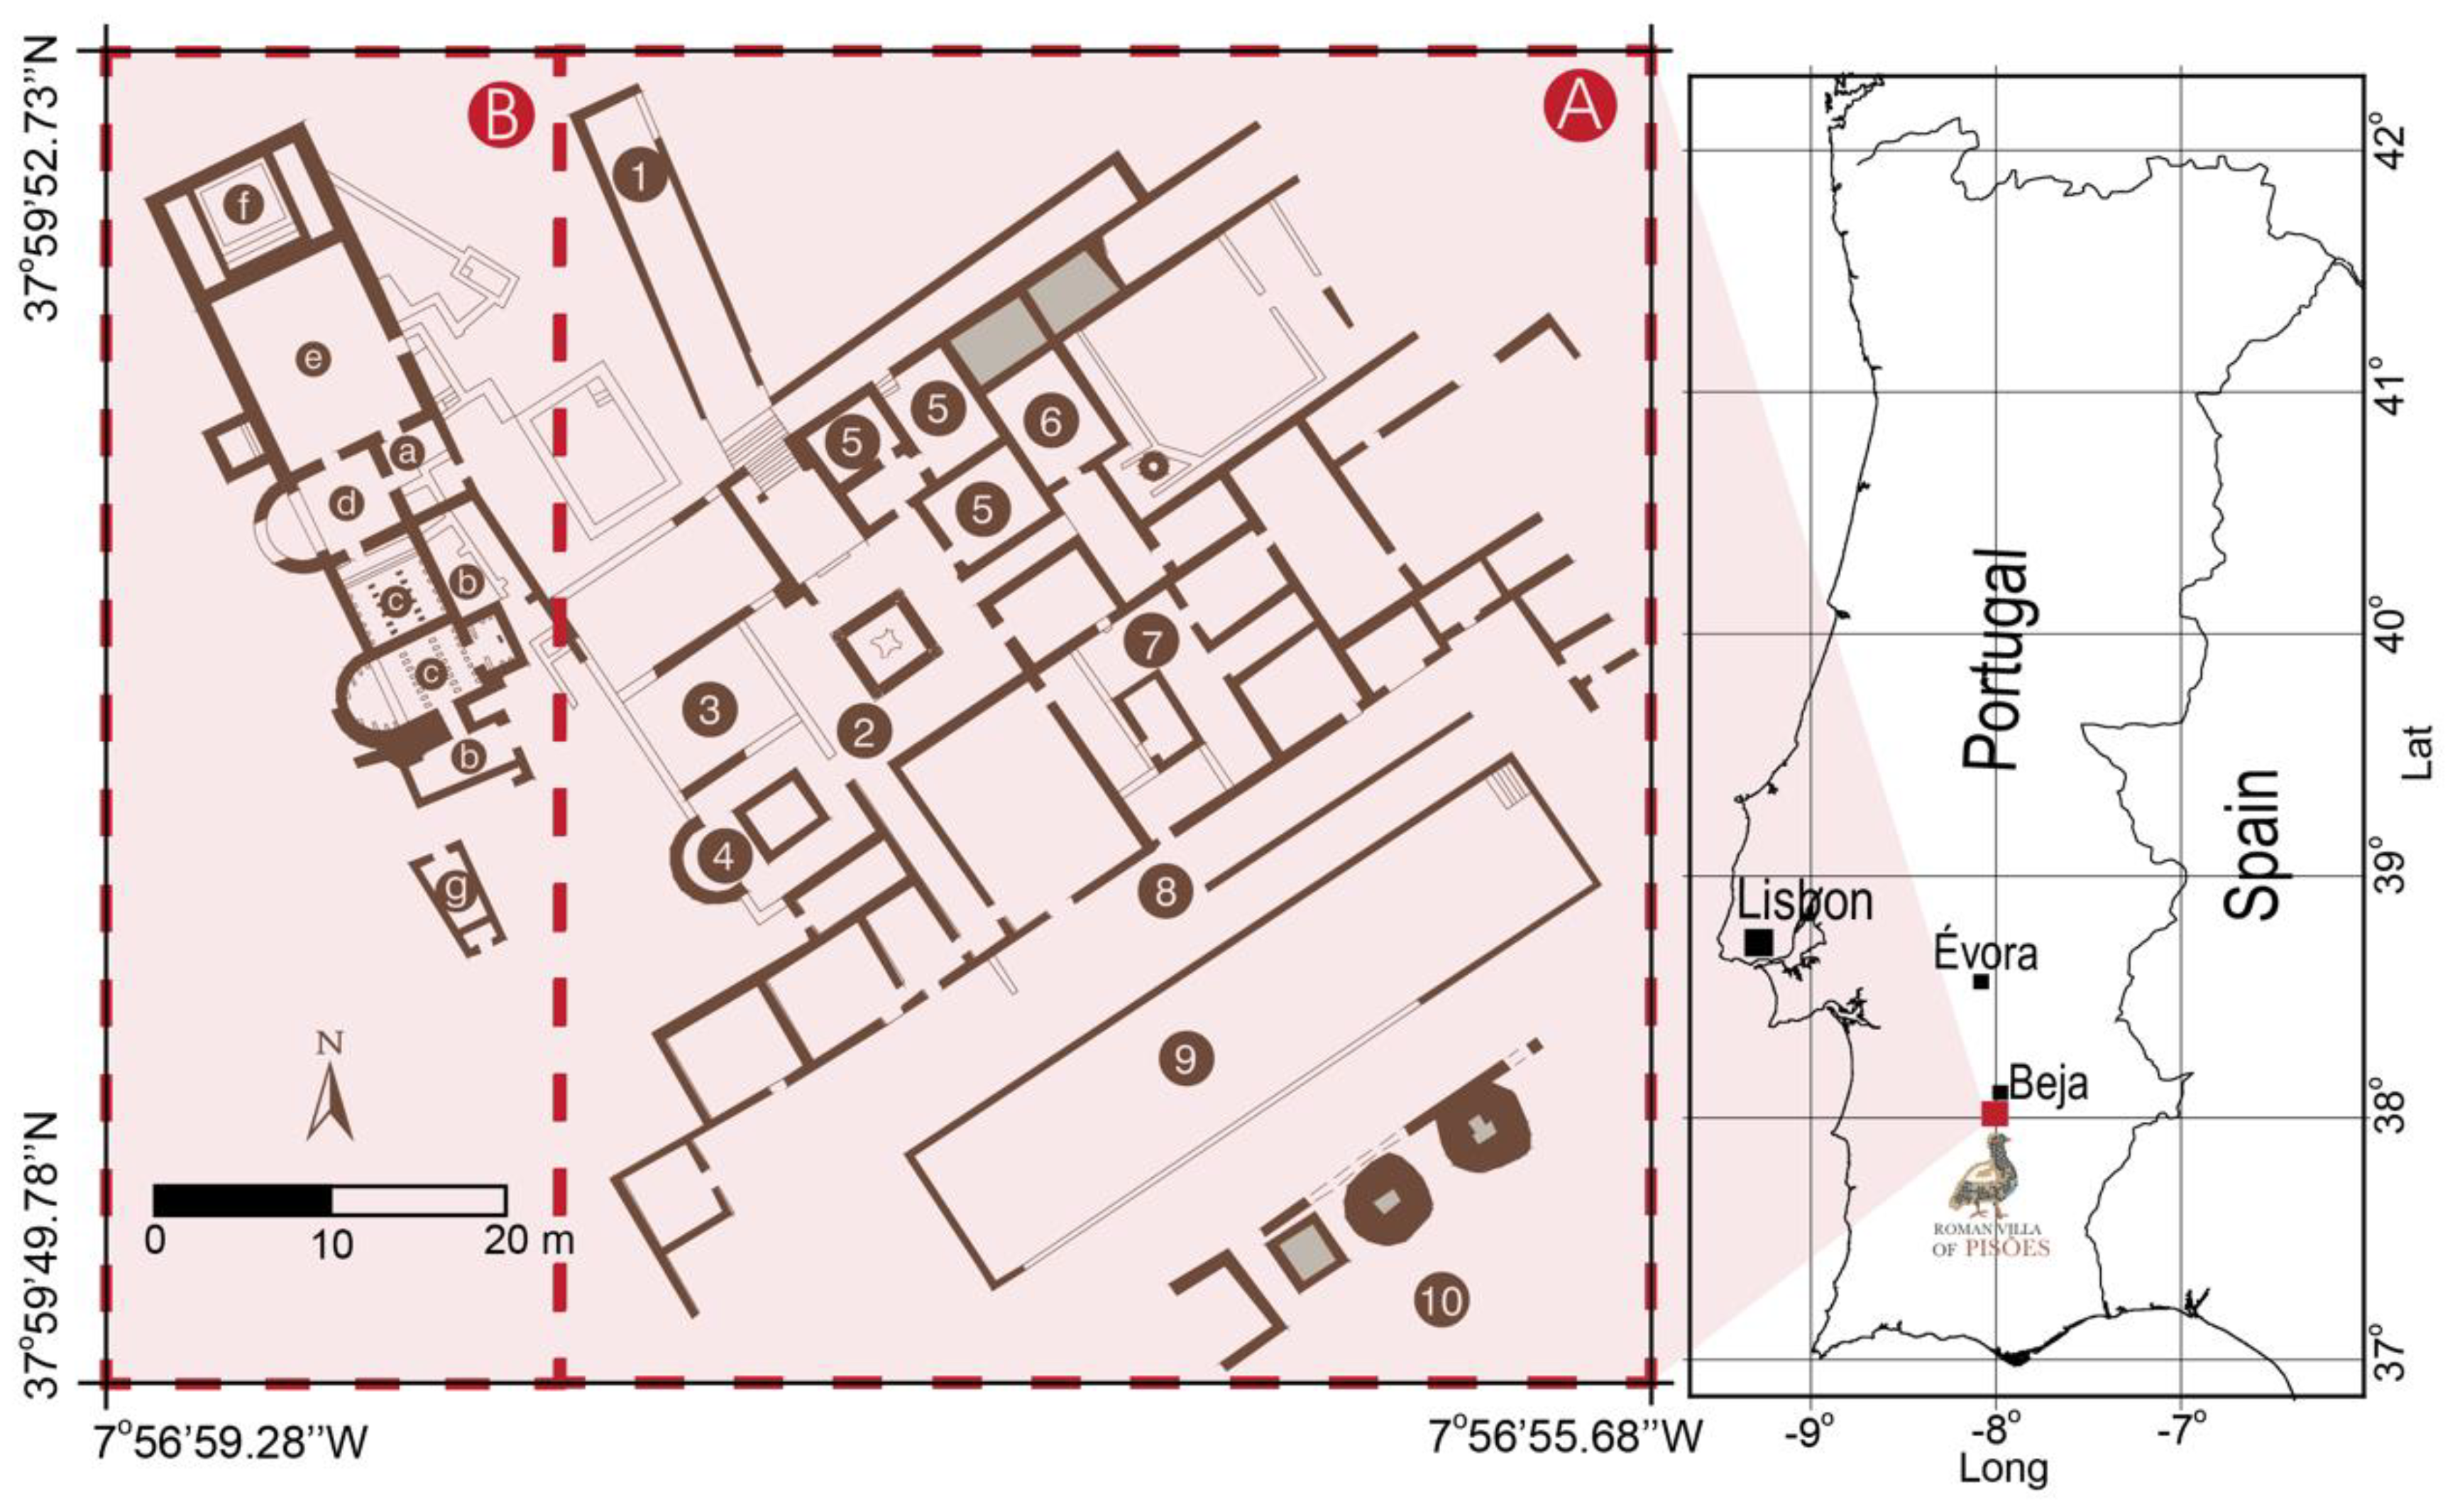
The Roman Villa of Pisões (
Figure 1) is located 10 km south of Beja (Portugal). This villa was discovered accidentally in 1967 and is considered by the academic and scientific community to be a heritage site of the greatest cultural relevance and was classified as a property of public interest in 1970. The excavations made during the 1970s revealed a pars urbana (residential house) of a singular monument of the Roman province of Lusitania composed of more than 40 divisions, distributed around a small peristyle in the tradition of the Italian atrium, which is gathered around the four-colonnaded space (
Figure 1). The south facing, large porticoes with columns open to face a large water mirror with a length of 40 m, one of the largest of this type in private residences throughout the Iberian Peninsula [
1]. The architectural design and type of structures [
2], refinement of the decoration, especially the great quality of the floor covering materials, mosaics and marbles [
3,
4], bring to mind a luxurious residence with proven occupation between the 1st and 6th centuries A.D. [
1]. In addition to the residence, the thermal baths are considered to be the most relevant examples of private baths [
5], which are remarkably well-preserved in some compartments, with an entire heating system that allowed the circulation of hot air between double walls and under the pavements of the rooms. This complex system of brick arched roof, known as hypocaust, is exceptionally well preserved [
6].
Despite the relevance attributed to this villa, the pars rustica and pars fructuaria remain underground and undiscovered. The knowledge about the excavated areas remains poor due the scarcity of documentation resulting from the excavations made at that time, a lack of stratigraphic sequences, and the absence of other studies performed thereafter.
In 2017, the University of Évora assumed the tutelage of the villa with the commitment to promote multidisciplinary scientific research to study, preserve, value, and disseminate that heritage [
7]. Thus, the investigation returned to Pisões, and the ongoing work aims to conduct a multidisciplinary research approach based on two essential pillars: a) Analysis and interpretation of structures and artifacts already known and b) research of underground structures. Due to the fact that the preservation aspect guides the dynamics of this plan, all activities are defined to develop, refine, and apply research methodologies that minimize impacts, rigorously reproduce the geometric and functional memory of the structures, and ensure the scrupulous preservation of all data collected throughout the whole site.
Archaeological geophysics are noninvasive survey techniques that are sometimes used for the analysis of architectural elements and artifacts of the Roman villae [
8,
9], but in the Roman villae located in Lusitania, these methodologies have rarely been used. The study of Roman material culture found in archaeological excavations still mostly relies on typological and comparative approaches. However, in recent years, the approaches in this field have changed with the introduction of archaeometric and geophysical analyses to promote the inspection of structures prior to interventions of excavation or conservation, e.g., [
10,
11], and to contribute to a better understanding of the site and works of the people who lived in that villa.
Unmanned aerial photogrammetric survey is a technique widely used in the study and documentation of Roman mosaics [
12,
13,
14], but to date, there are few bibliographic examples that employ geophysical methods to inspect Roman mosaics. Most of these works use the ground penetrating radar method (GPR) as the better technique to obtain detailed information on these structures. That said, all of them focus their studies on evaluating the degree of conservation and the humidity concentration through the amplitude reflection analysis in 2D-GPR profiles [
15,
16] or consider horizontal slices of 40 cm thickness in 3D-GPR sets to detect anomalies within a wall covered by mosaic [
17]. In this context, the present study is the first where a Roman mosaic is investigated to know how it has been constructed and what its internal stratigraphy is. Effectively, the analysis of man-made materials such as stones, bricks, mortars, marble, and mosaics can provide significant clues to resolve archaeological issues, shedding light on topics related to the raw material provenance and their structural characterizations, thus deepening our knowledge of the technology used by the Romanized population that lived at Pisões.
Since the discovery of Pisões, one of the more relevant issues associated with it is the abundance of leisure elements and the quality of the covering materials, especially the collection of floor mosaics. In an interview with “Diário de Notícias” (national newspaper) on February 21, 1967, which was a few days after the discovery, the archaeologist stated, “In the soil observed so far, we have found two species of mosaics, one of opus signinum and the other with geometric designs in white, dark blue and red…".
Later, the excavations uncovered mosaics with figures of nature and geometrics drawings in approximately 40 division floors of the urban pars. This collection of mosaics is notable, both for its eclectic nature and richness of iconology, presenting geometric and naturalistic compositions, and for the quality of its execution, from the oldest monochromaticity to the most recent polychromaticity [
6,
18].
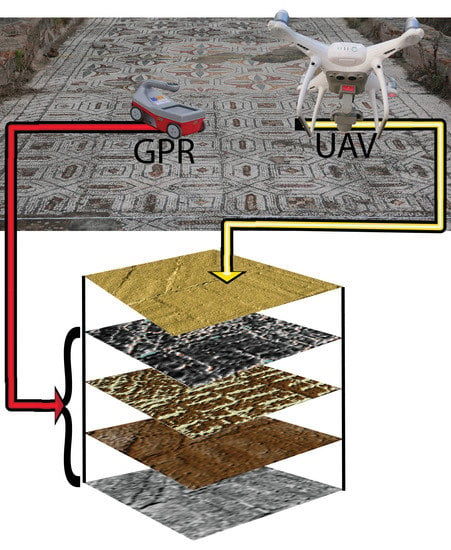
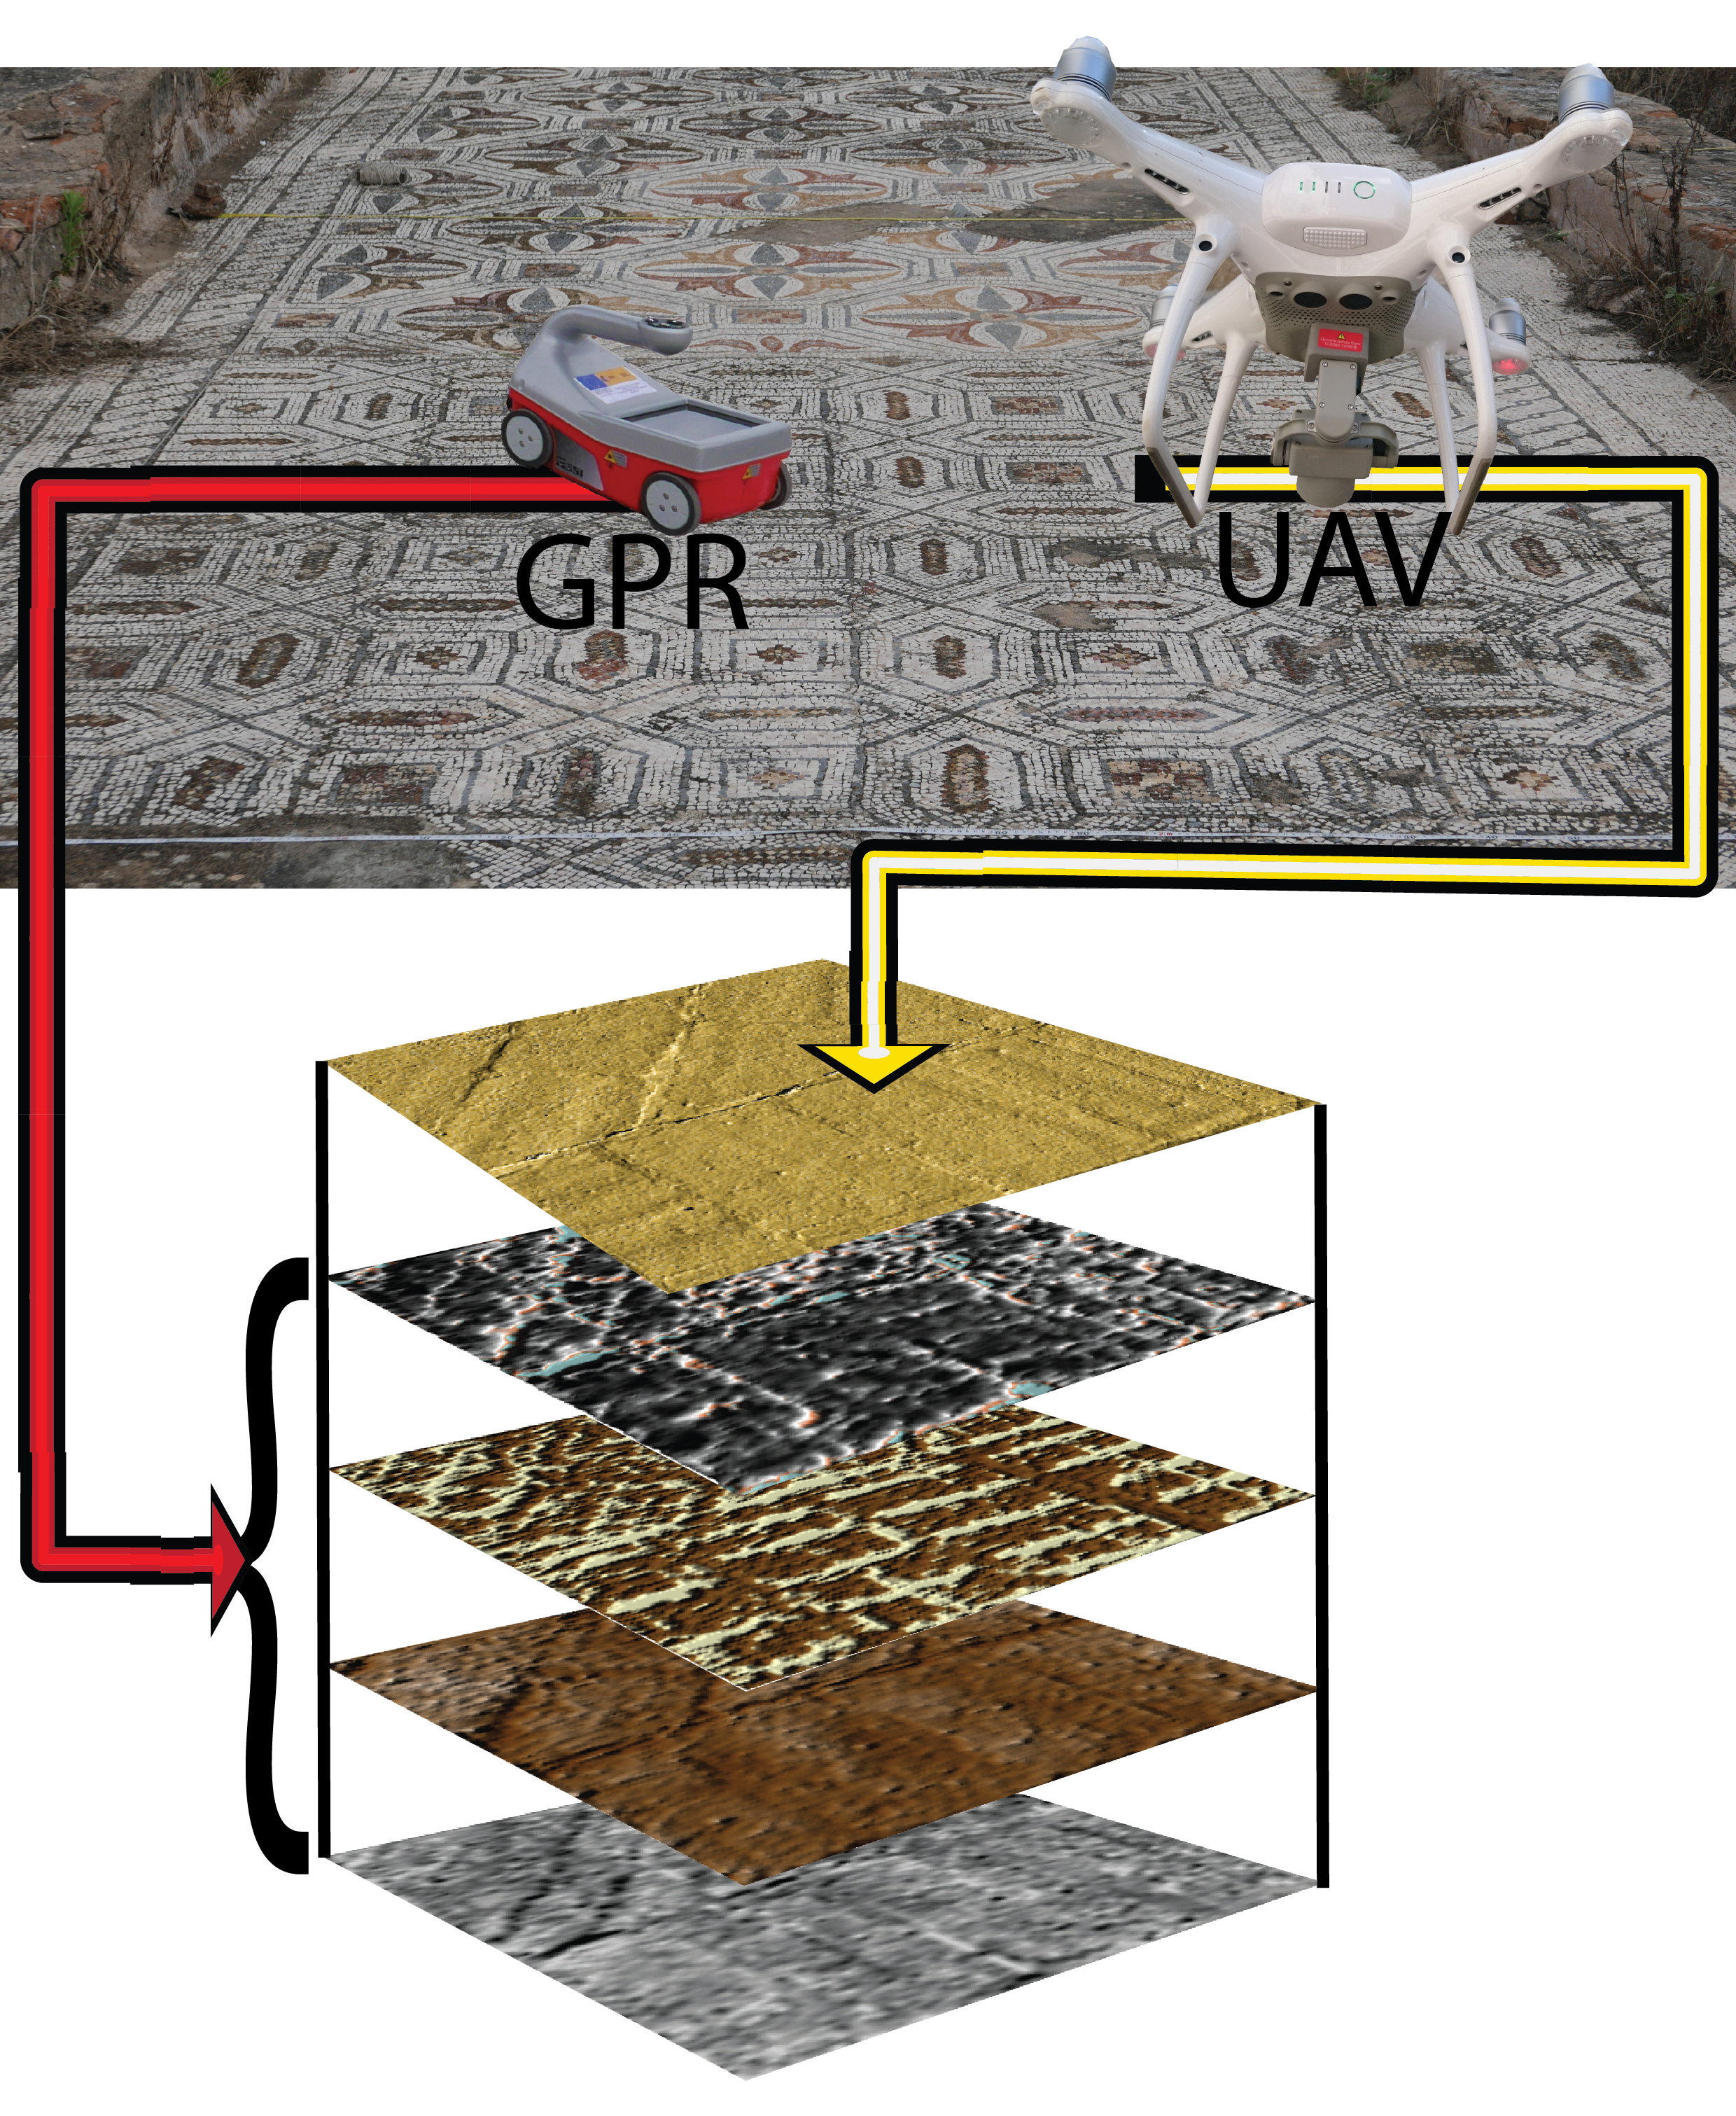
In this paper, the constituting layers characterization of the floor mosaic substrate from the Roman archaeological site of Pisões was carried out. The work, completed using noninvasive geophysical and photogrammetric methods, allowed us to obtain evidence of the construction process, which is adequate as a model for the documentation of ancient pavements and can be used prior to conservation actions. Additionally, we intend to show that a Roman mosaic, understood as an archaeological structure, does not consist of only beautiful superficial drawings defined by the tesserae, but is a much more complex element that must be considered in its entirety.
2. Materials and Methods
2.1. Manufacturing Processes of the Roman Floor
The term mosaic is associated with the presence of a tesserae and represents the result of a mixing of arts and techniques from different parts of the Roman Empire, and mosaics are used as decorative elements in many environments [
19]. The different aspects related to artistic styles or historical cultural issues represented on the surface of the mosaics is widely documented. However, when we look for the invisible structure that demonstrates how the substrate of the well-studied mosaics was formed, the information is scarce or absent. Concerning this question, practically all works cite the treatise of Architecture of Vitruvius, De Architectura, written in the 1st century B.C. and translated into nearly all languages [
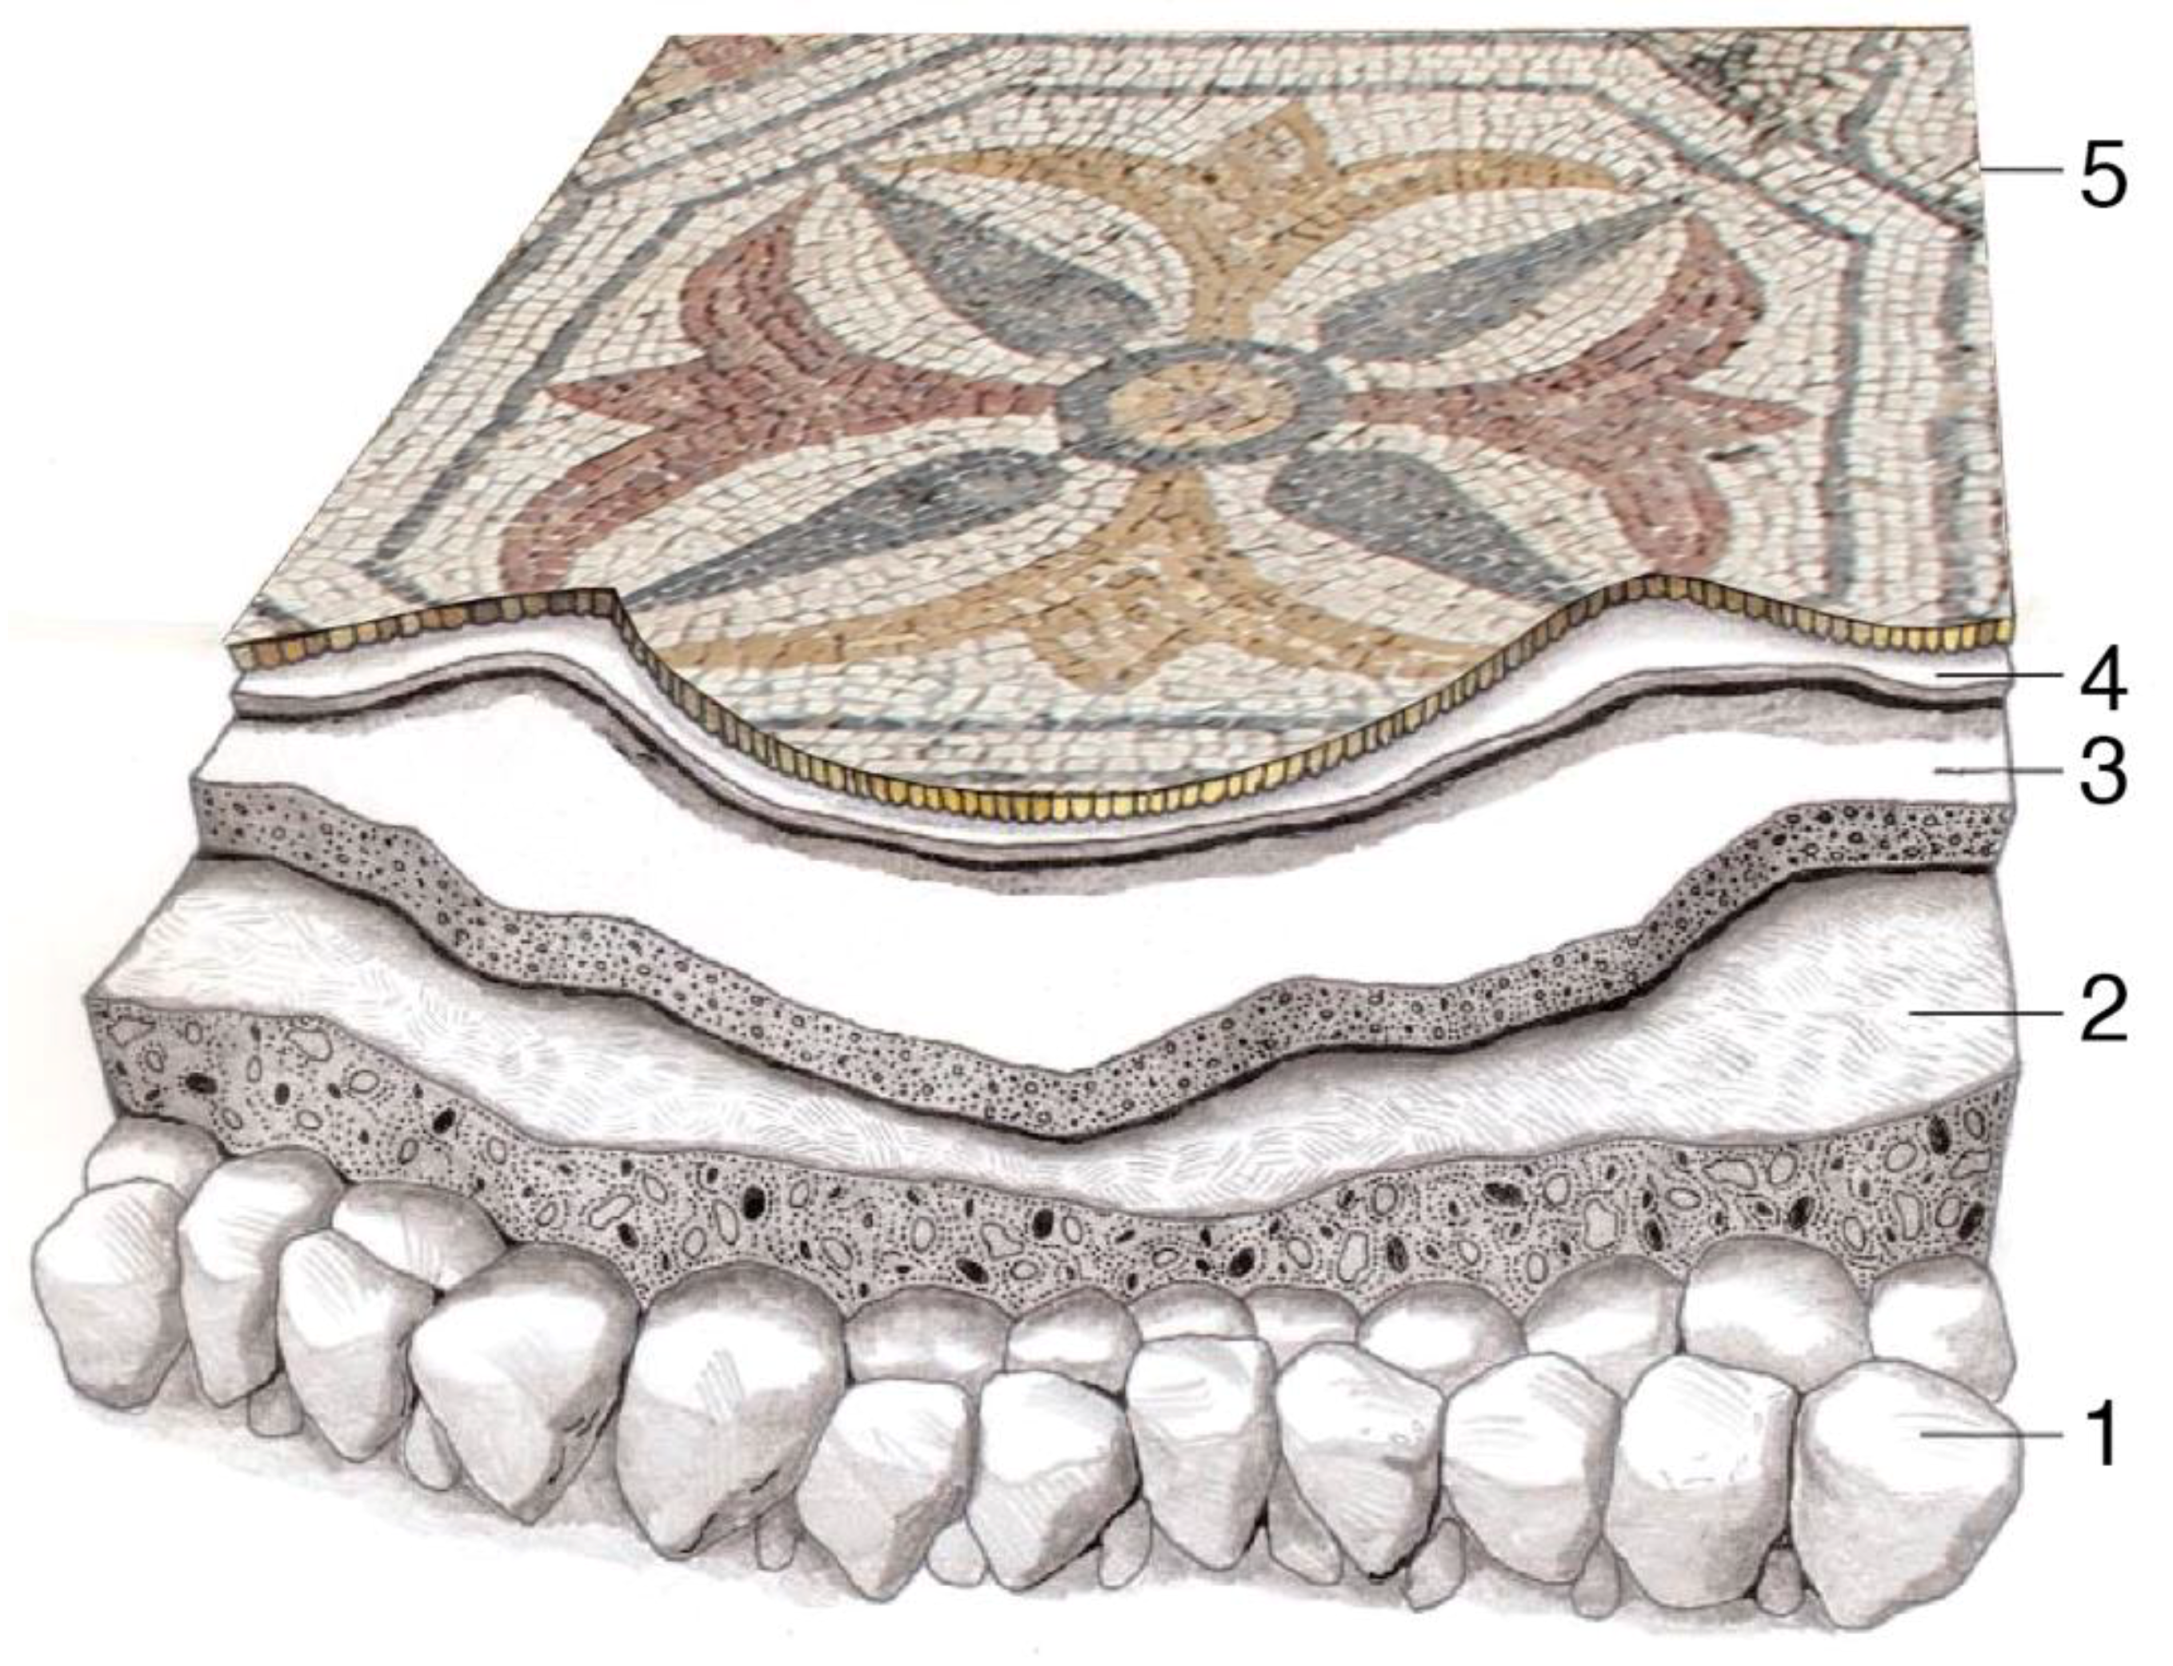
20]; the author documents the techniques used for the preparation of mosaic pavements, highlights the impermeability issue of the mosaic in terms of functionality, and supplies the ideal method to ensure impermeability. Summarizing Vitruvius’s rules, the floor mosaic foundation should be manufactured with the following stratigraphy (
Figure 2):
- (1)
The first layer, called statumen, is made of stones approximately 12 cm thick “each of which is not less than a handful”, laid vertically on the ground, without mortar between the stones, which gives stability to the pavement and favors the flow of infiltrated waters.
- (2)
The second layer, called rudus, is spread over the statumen and consists of a mortar of sand and gravel (three quarters) mixed with lime (a fourth part). This layer is rammed by means of wooden stamps until a unified level is formed, which is then left to dry. The thickness of this layer is at least 22 cm.
- (3)
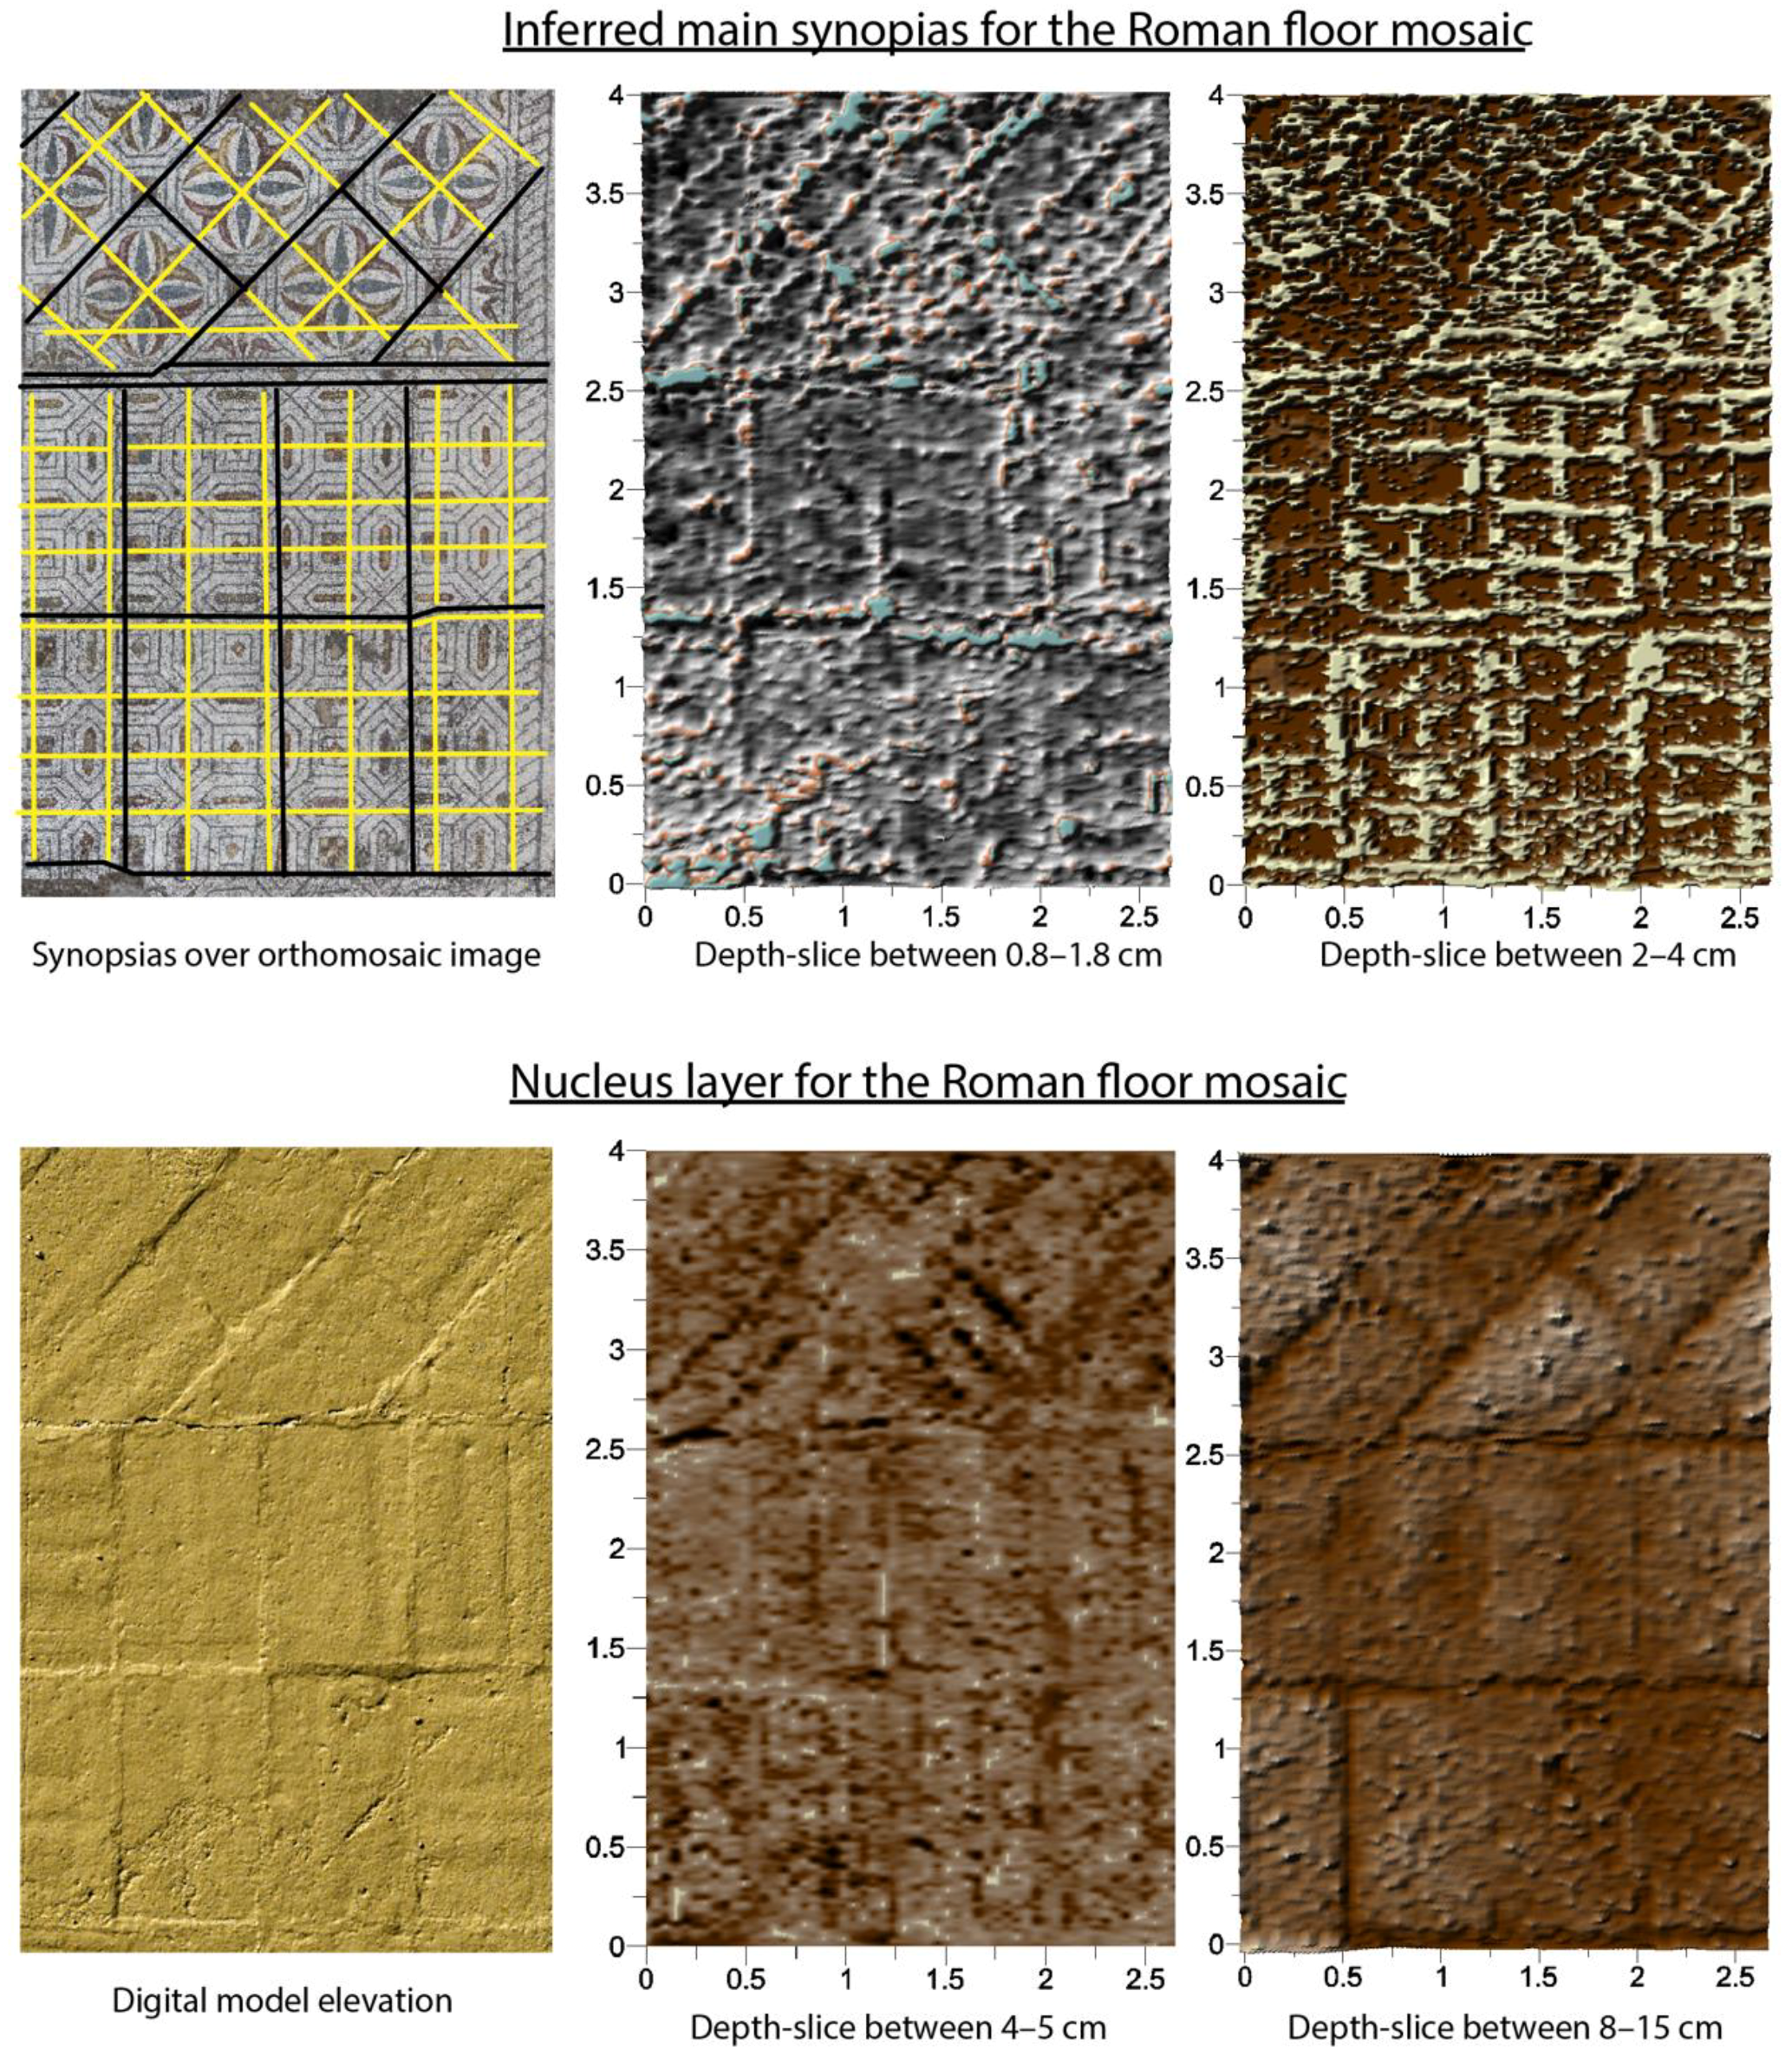
The third layer, called the nucleus, is a ceramic mortar that is 11–15 cm thick, made of powdered pottery and lime in proportions of three to one, respectively, and this mortar is spread over the rudus and allowed to dry. This layer is the hardest and most impermeable of the three layers. The purpose of this layer was to allow drainage of surface waters.
- (4)
On top of the nucleus, a bedding layer of mortar very rich in lime is thinly applied in small sections over the nucleus. This thin layer is applied according to the forecast of the working day and fresh enough to mark the reference points of the drawing (sinopia) or geometric or figurative design. Tesserae are inserted in this layer before the mortar dries.
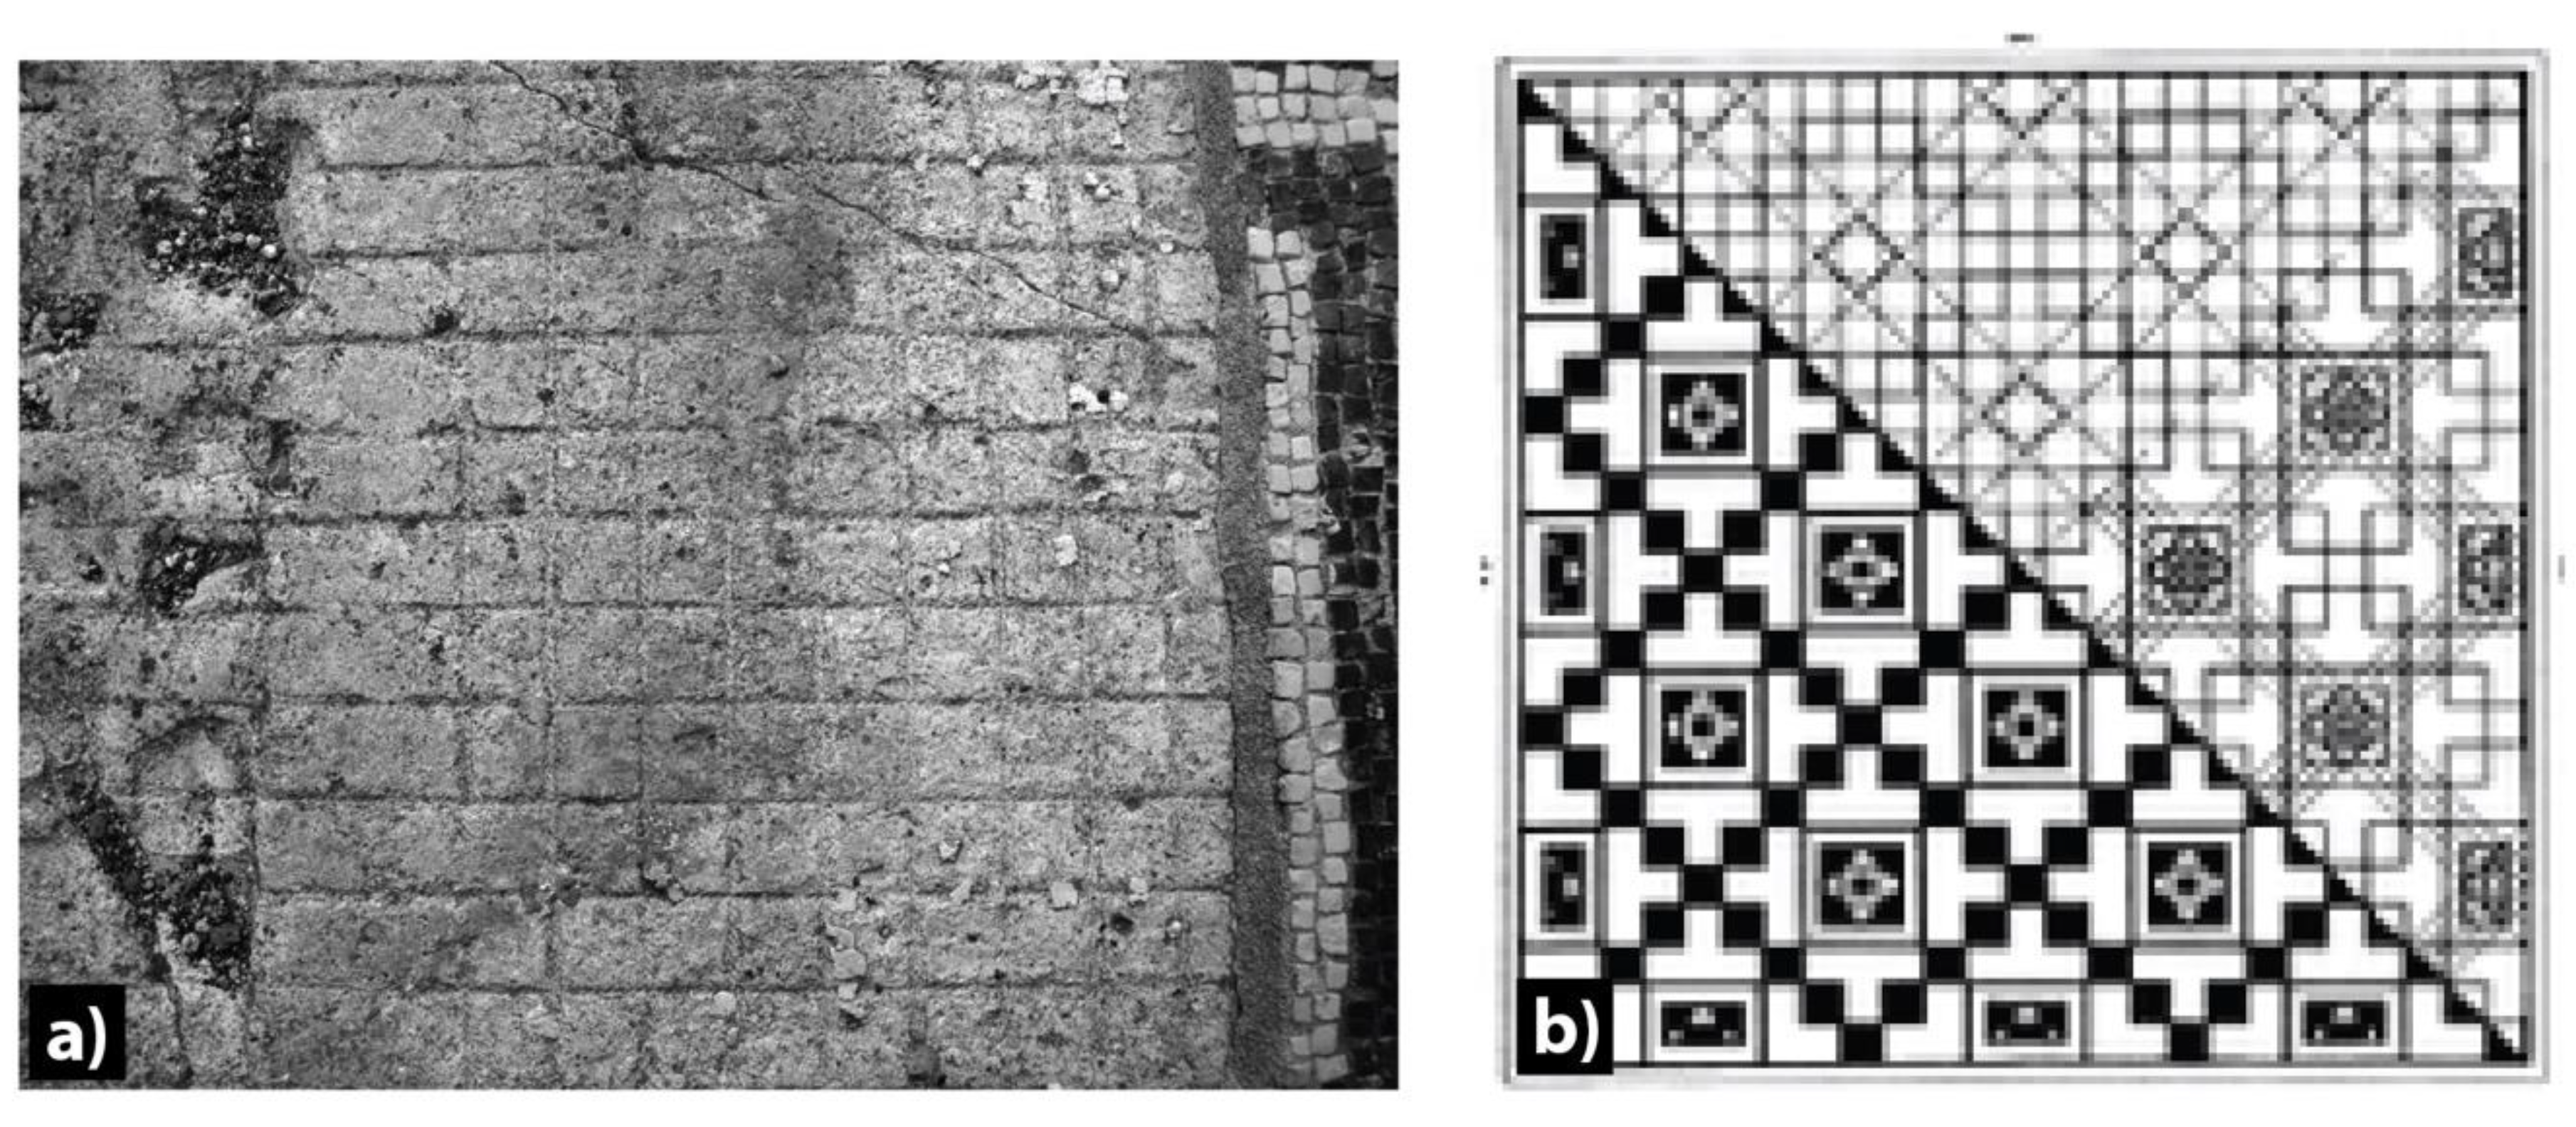
As the placement of tesserae demanded a fresh lime bedding mortar, it was necessary to plan the dimension of the bedding mortar panels as a function of the capacity to fix the tesserae during the drying time. Thus, each panel represents a work planning unit, and in some mosaics, the boundary between these panels can be observed.
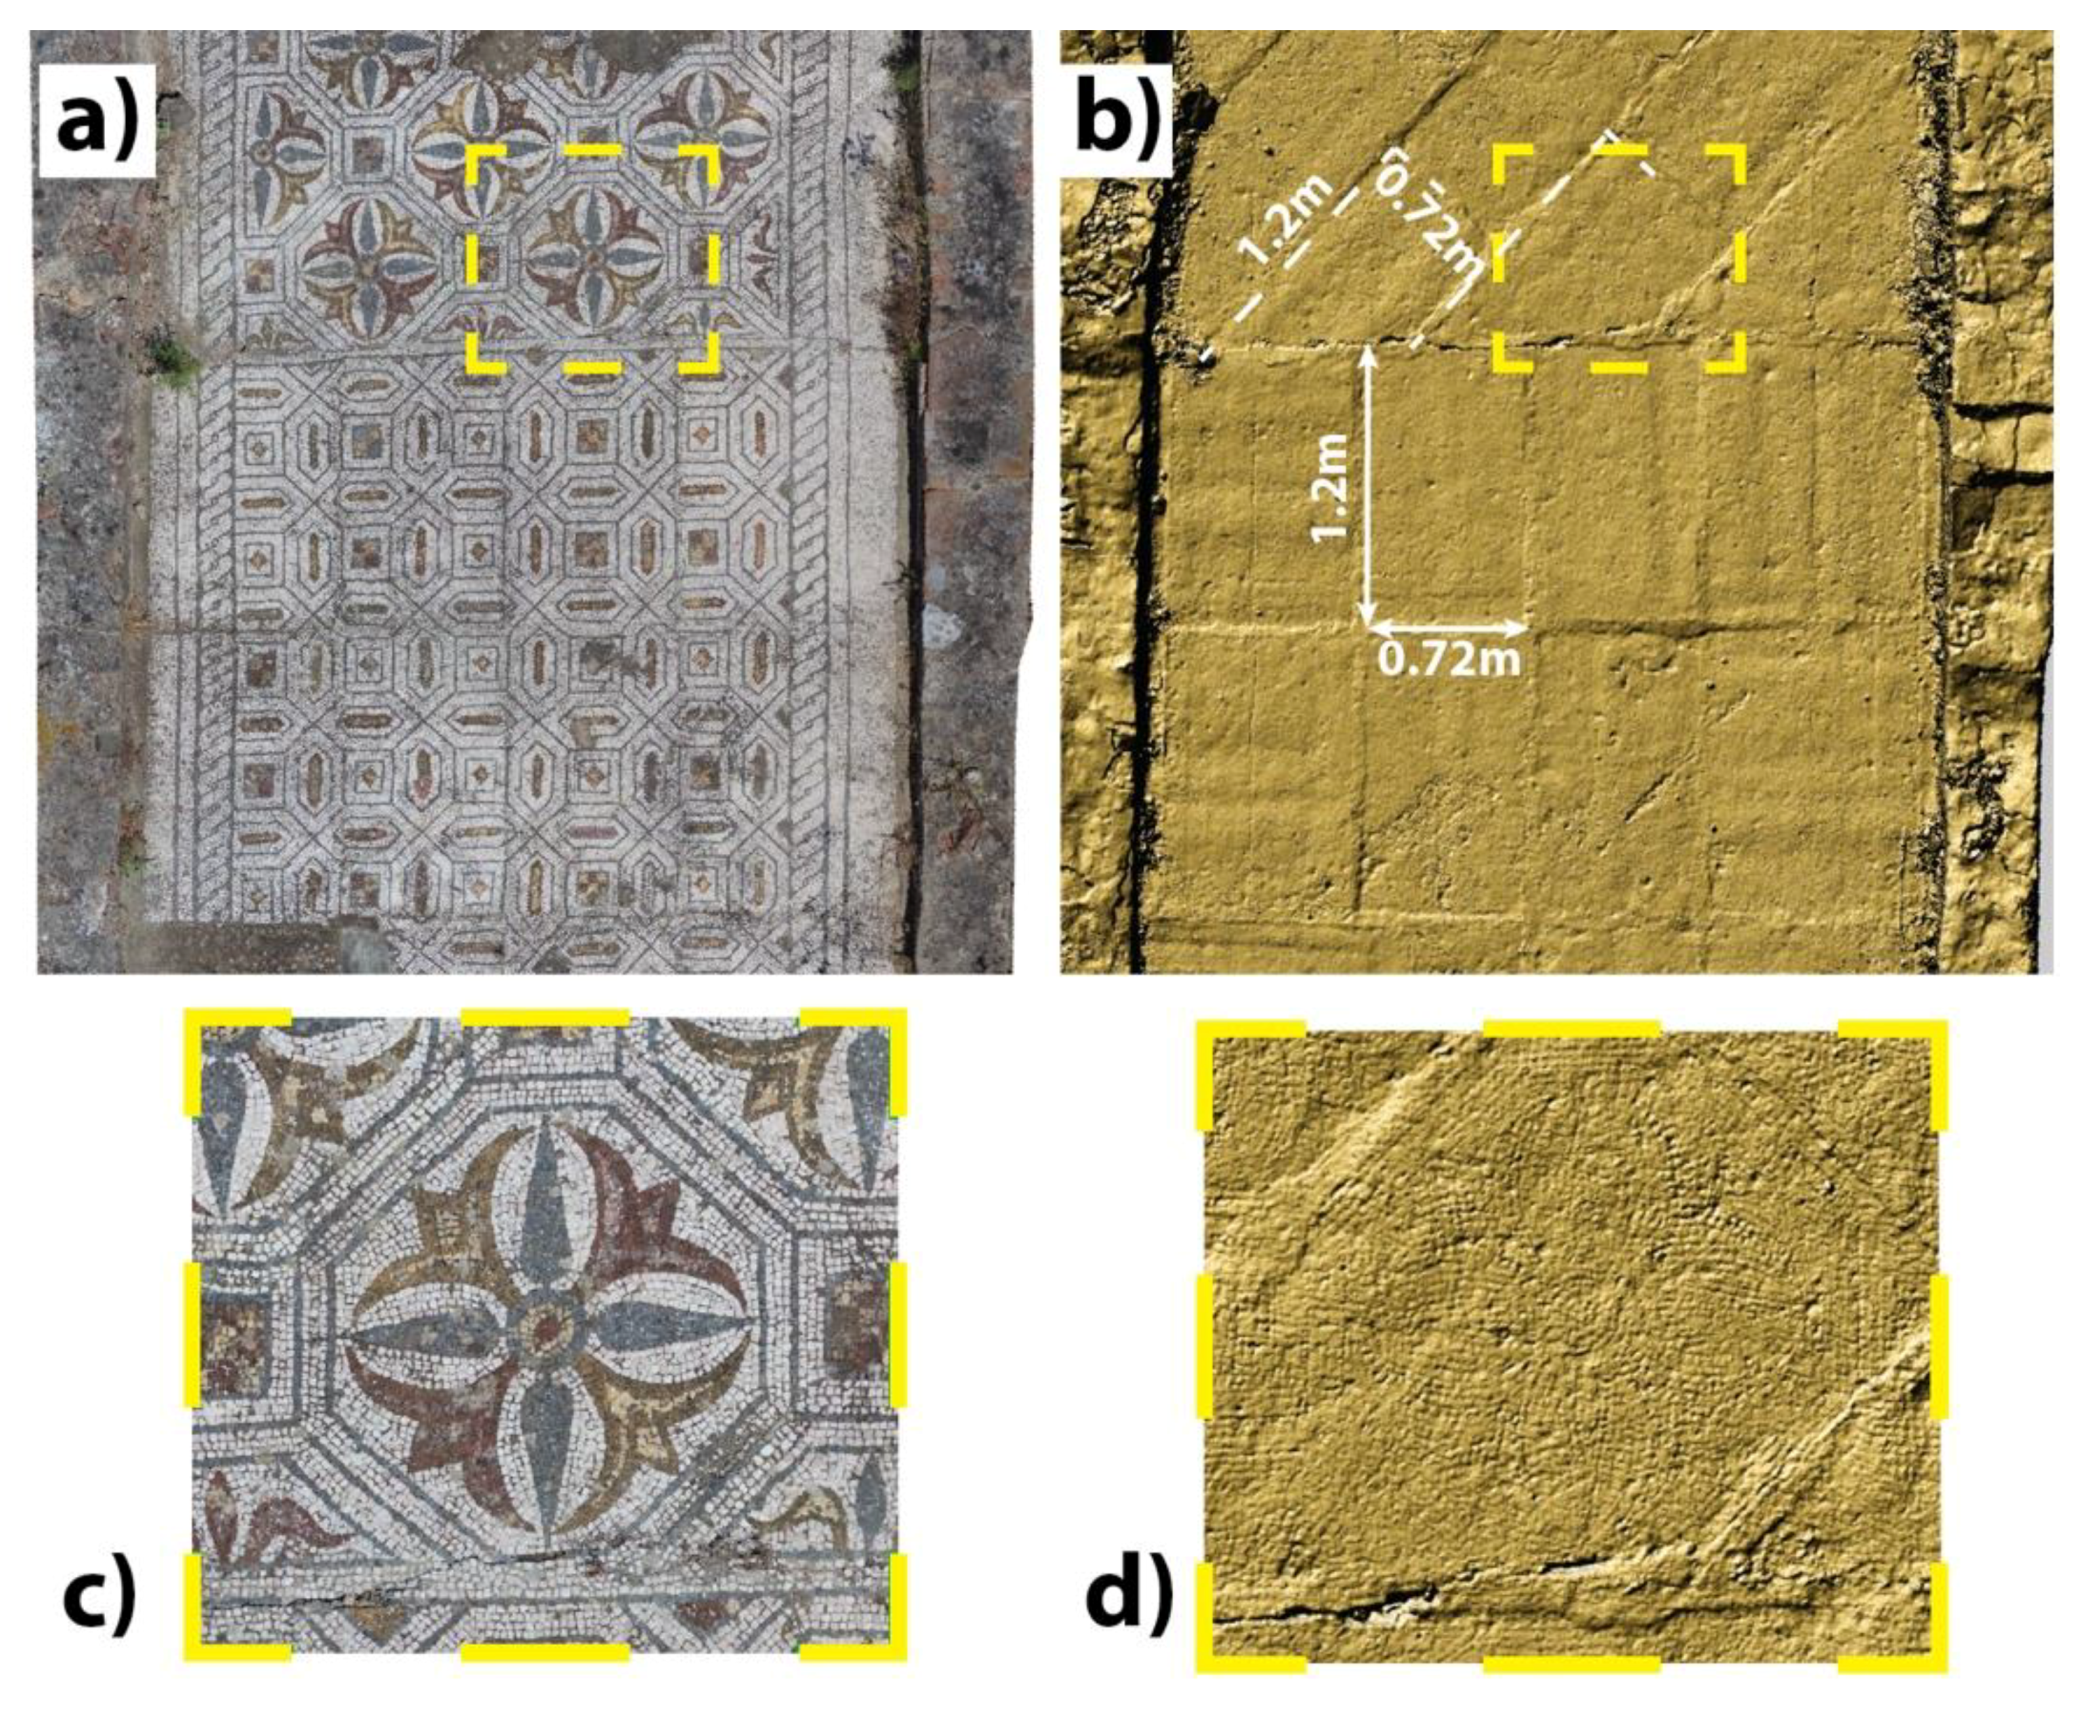
The tesserae were placed according to previously defined patterns, figurative or geometric, and were drawn through incisions in the bedding mortar; some of the imprints were captured under some mosaics (
Figure 3a). These geometrically etched guides, called sinopia, were made with simple instruments that formed part of the common masonry tools: Rulers, calibers, compasses, nails, and ropes. Once the general pattern was established (
Figure 3b), the specific drawings were painted with chalk or charcoal, whereas for the repetitive motifs that formed part of the decoration of borders and edges, templates could be used.
According to [
23], the pavements examined in past and modern archaeological excavations do not necessarily display the stratigraphy described in the ancient treatise of Vitruvius or others, as in [
24]. Frequently, the thickness and the nature of their constituent materials vary among sites or even within the same building among pavements, which justifies investigations accounting for the whole structure of the pavement.
2.2. Surface Analysis of the Studied Mosaic
The studied mosaic is dated from the early 3rd century A.D. [
3]. The mosaic covers the northern corridor of 15.5 m × 3.0 m, which provides access to the pars urbana (
Figure 1). This floor was repaired during the last conservation intervention, which was carried out by the University of Évora [
7], and this intervention consisted of vegetal species removal and surface cleaning with water and biocide application by means of nylon brooms.
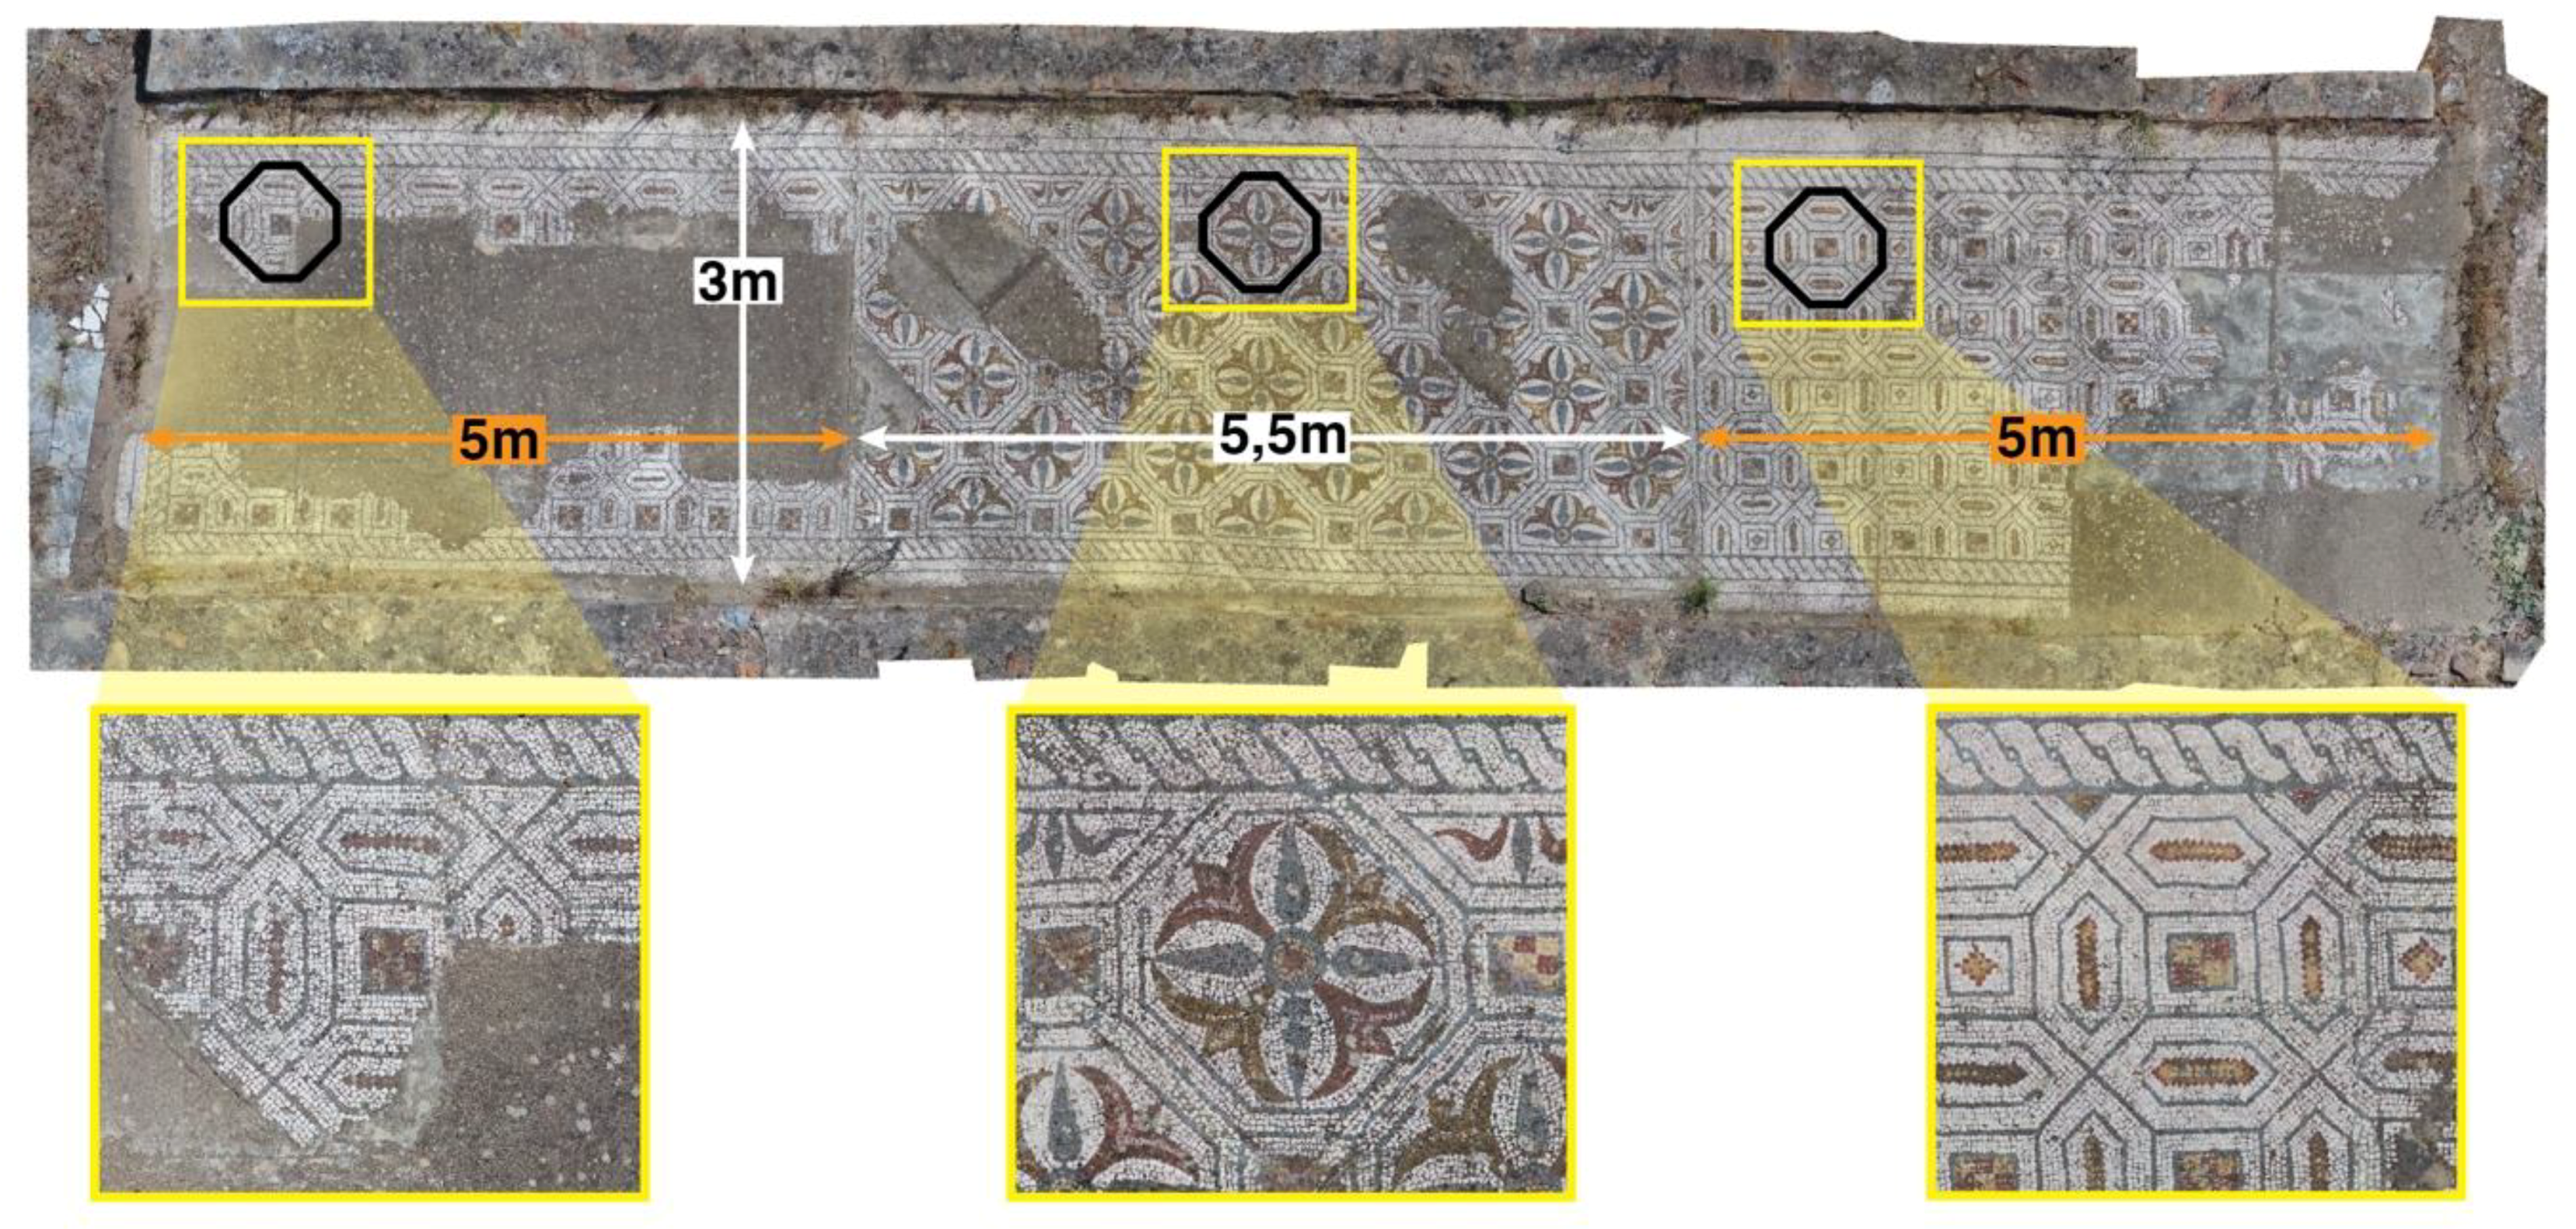
The mosaic is formed by a decorative geometric composition of large octagons (
Figure 4), outlined with a black filet over a white background. Three distinctive geometric compositions fill the inner octagons. At the ends of the corridor, there are defined panels (5 m in length each) formed by colored squares and diamonds on the same white background, and this pattern is repeated in all octagons; in the central zone (5.5 m), the octagons are filled with rosettes that are the same colors as the ends panels, creating a beautiful decorative effect. The composition is completely enveloped by a simple guilloche border produced with a double row of gray tesserae over the same white background [
18]. The same constituent elements and forms are found in the two mosaic fragments of Merida [
25], which leads to the assumption that the same model was used for the mosaics at both sites.
2.3. Unmanned Aerial Vehicle (UAV) Imagery Acquisition and Processing
As a first product of the noninvasive analysis, a UAV was used to survey all of the Roman Villa of Pisões exposed area. The orthophoto and digital surface model (DSM) generated were used to map the area and provide a reference for further excavation, management, and monitoring works. A DJI Phantom 4 Pro UAV was used to acquire RGB imagery and Agisoft Photoscan was used for processing. Geodesic accuracy of the final products was possible by using five ground control points (GCP’s). Four of these ground control points were temporary ones, placed in the corners of the surveyed area, and built on big screens with a pattern and a cross to be easily seen in the UAV imagery. Another GCP was collected approximately in the middle of the area, using a point in the mosaic pattern easily seen in the photos. The methodology used for this first task is the one detailed in [
26]. The GCP’s were collected using a Spectra Precision Epoch 50 GNSS receiver configured with base and rover antennas. Acquisition was made using post-processing kinematic (PKK), with further coordinate correction made with data from the fixed station of Beja, which belongs to the ReNEP network (GNSS National Network of Permanent Stations), which is the Portuguese service for geolocation based in fixed stations. High resolution images of these products, in jpeg format, can be downloaded from
http://www.dct.uminho.pt/pisoes/ORTHO_HD_PISOES_GENERAL.zip (orthomosaic) and
http://www.dct.uminho.pt/pisoes/DSM_PISOES_GENERAL.zip (DSM).
To detail the survey of the mosaic area that was studied, close-range photogrammetry was used, and a high-resolution orthophoto image and DSM were obtained for the mosaic surface.
The imagery data and final georeferenced products were also obtained by using a UAV and photogrammetric processing. The UAV used in this study (DJI Phantom 4 Pro) was equipped with a 20 megapixel camera, a 1 inch sensor, and a mechanical shutter. The camera was stabilized with a 3 axis gimbal. To capture the aerial data, two individual flights at low altitudes (~1.5 m) were conducted using manual control because there is no automatic flight control software that can be used at such low altitudes. The application DJI Go 4 was used to configure the UAV and to monitor and control the flight. This UAV had an obstacle avoidance system, which the manufacturer calls “Vision System”. This system is based on three optical sensors (to frontward, backward, and downward obstacle avoidance), an ultrasonic sensor (as a redundancy to downward obstacle avoidance), and two infra-red sensors for leftward and rightward obstacle avoidance. The downward obstacle avoidance sensors were configured to 1.5 m distance to automatically avoid the UAV to get below that height. Phantom 4 Pro can use the Vision System to accurately hover over a point with a vertical precision of ±0.1 m and a horizontal precision of ±0.3 m, according to the manufacturer. This position system was based on image analysis of the features below the UAV, obtained with the pair of small cameras that are also used for obstacle avoidance. This system was automatically used when both radio control sticks were put in the middle position. The UAV was then maneuvered very carefully with small shifts along the X axis, taking pictures when the UAV was completely still, until a complete stripe over the mosaic was completed. After a small shift along the Y axis was made and small shifts along X axis were again performed, pictures were taken. This time-consuming procedure ensured that all obtained pictures had enough overlap, both in X and Y axis, to be able to produce an orthomosaic and a DSM.
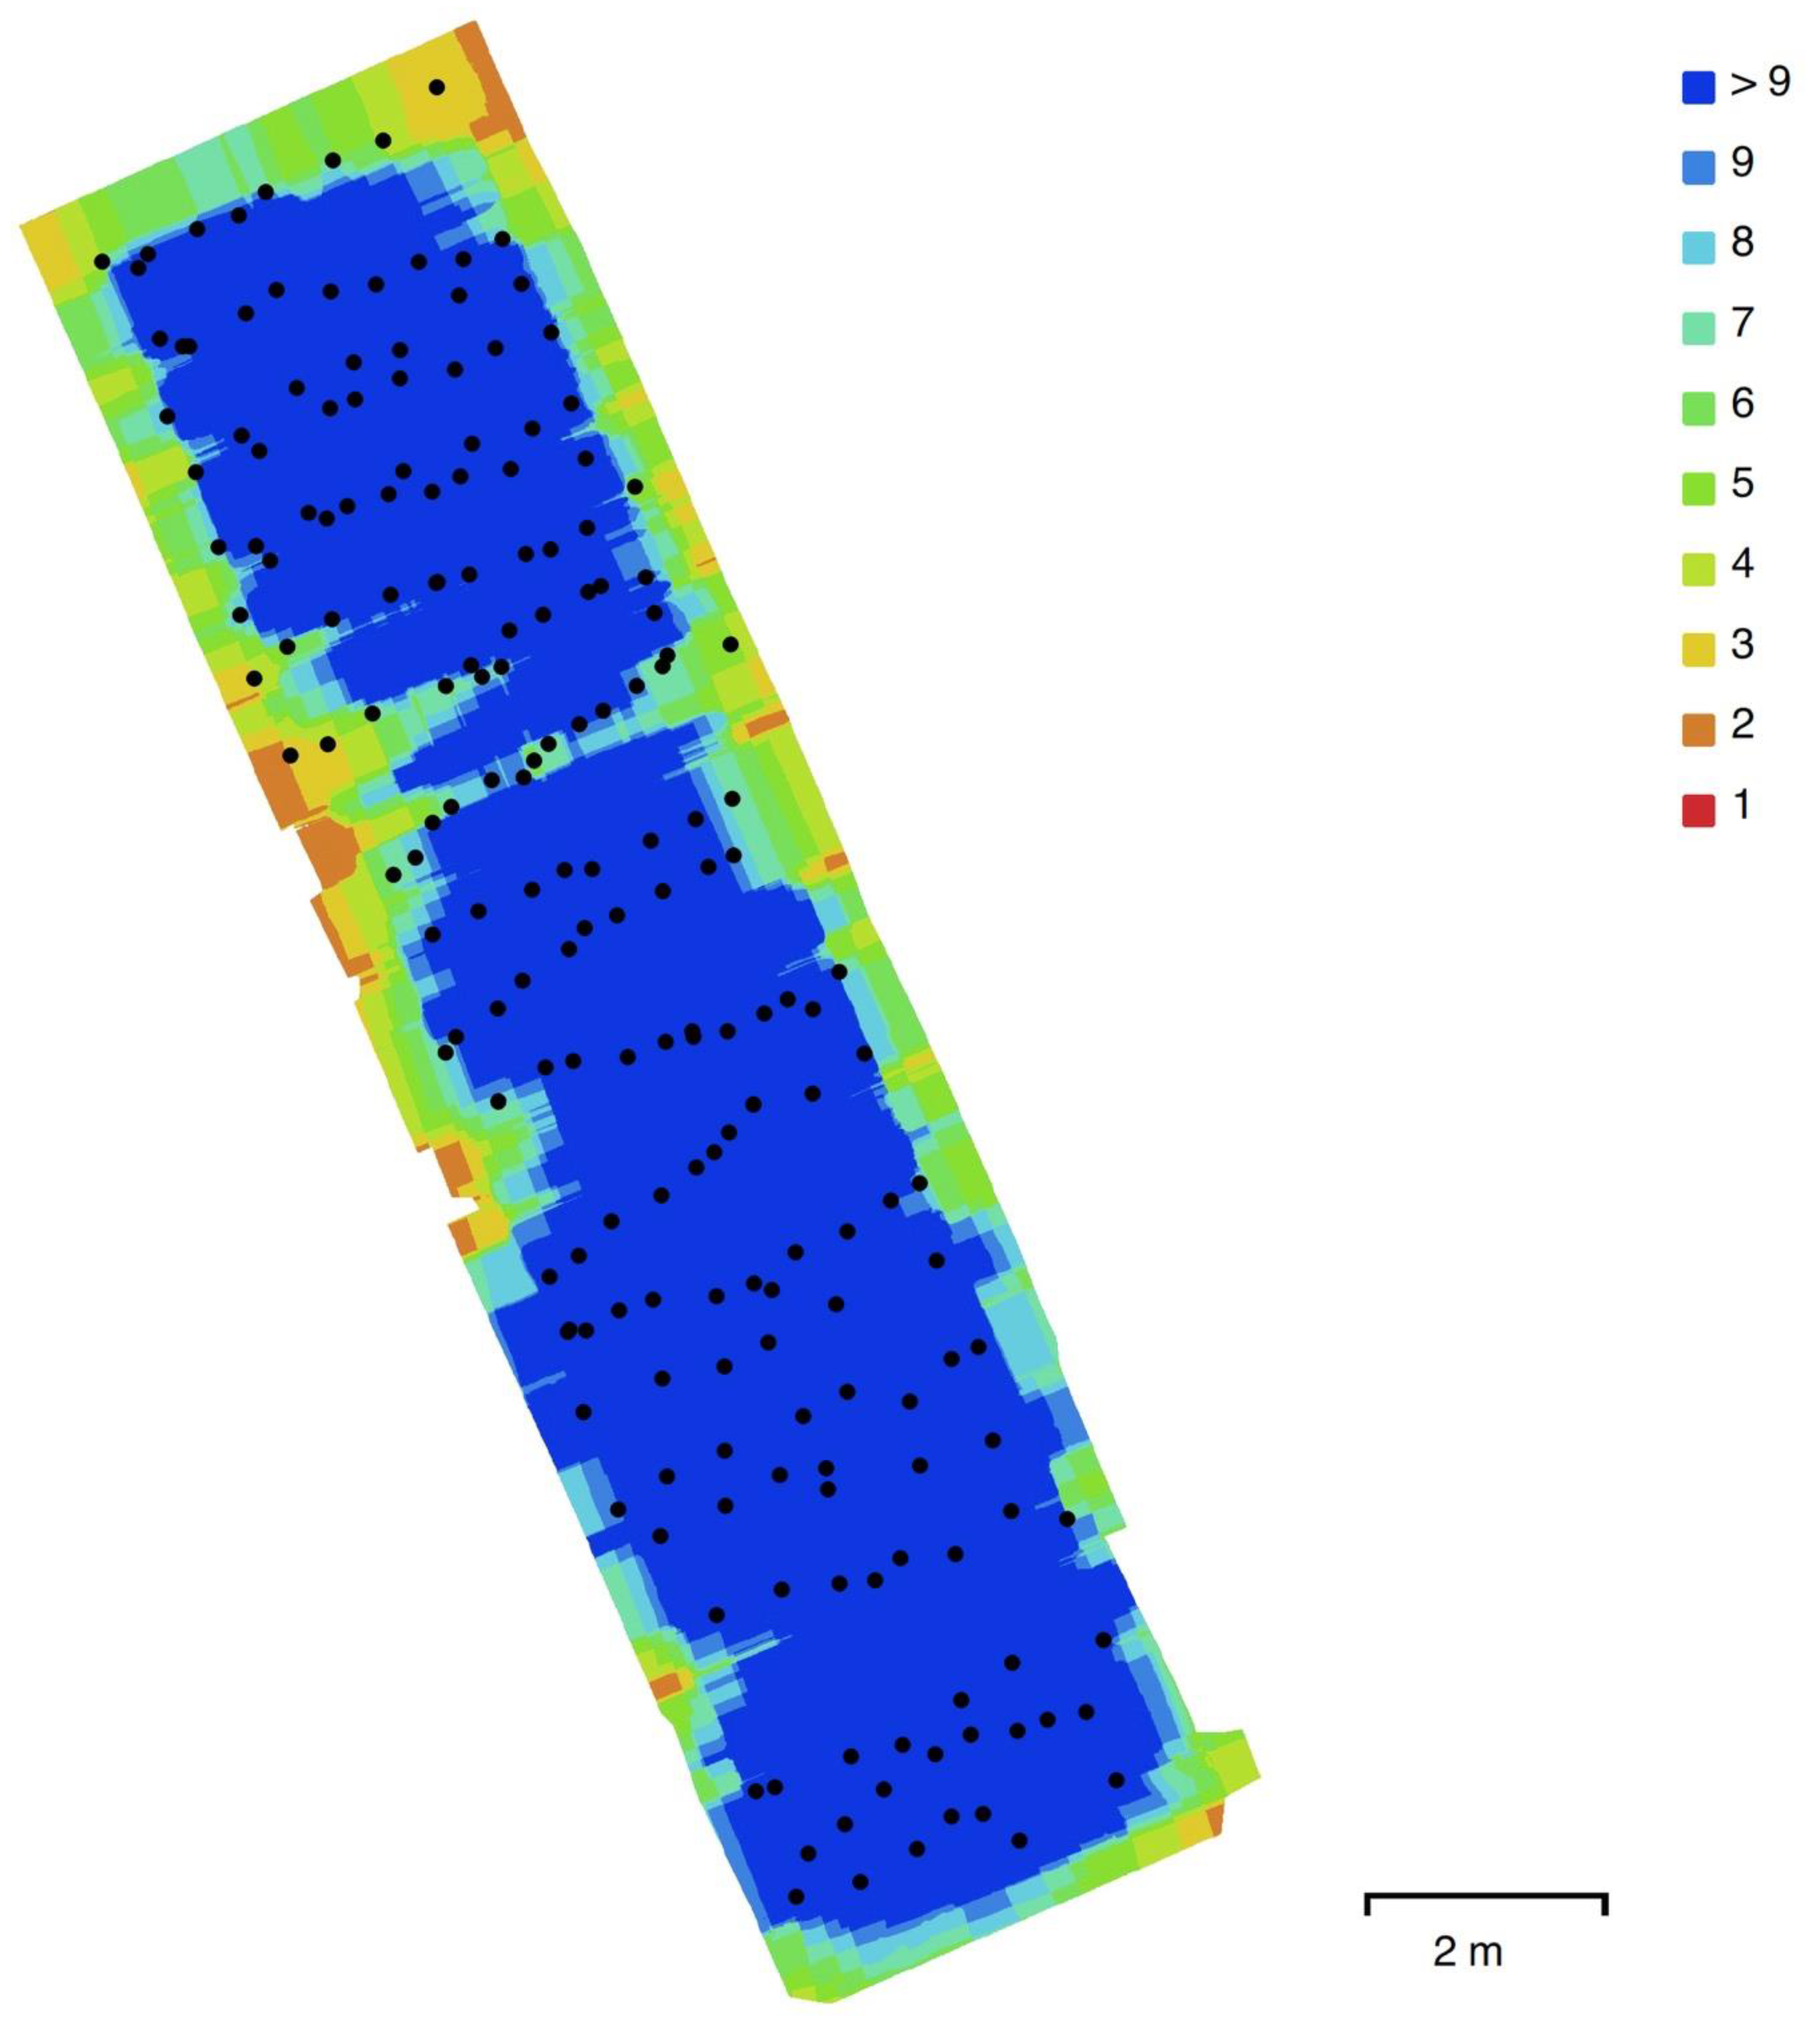
In total, 191 pictures were taken, covering 69.9 m
2 of area. A battery exchange was necessary to complete all the surveyed area using this technique.
Figure 5 shows the position of each camera as well as the amount of overlap obtained.
The use of the UAV was chosen as opposed to a manual handheld camera because it allowed us to make a high-resolution orthomosaic of the whole mosaic extension without walking on it unnecessarily, and it was more practical to obtain perfectly vertical pictures from an elevated standpoint without too many shadows or obstructions, such as the photographer’s own feet.
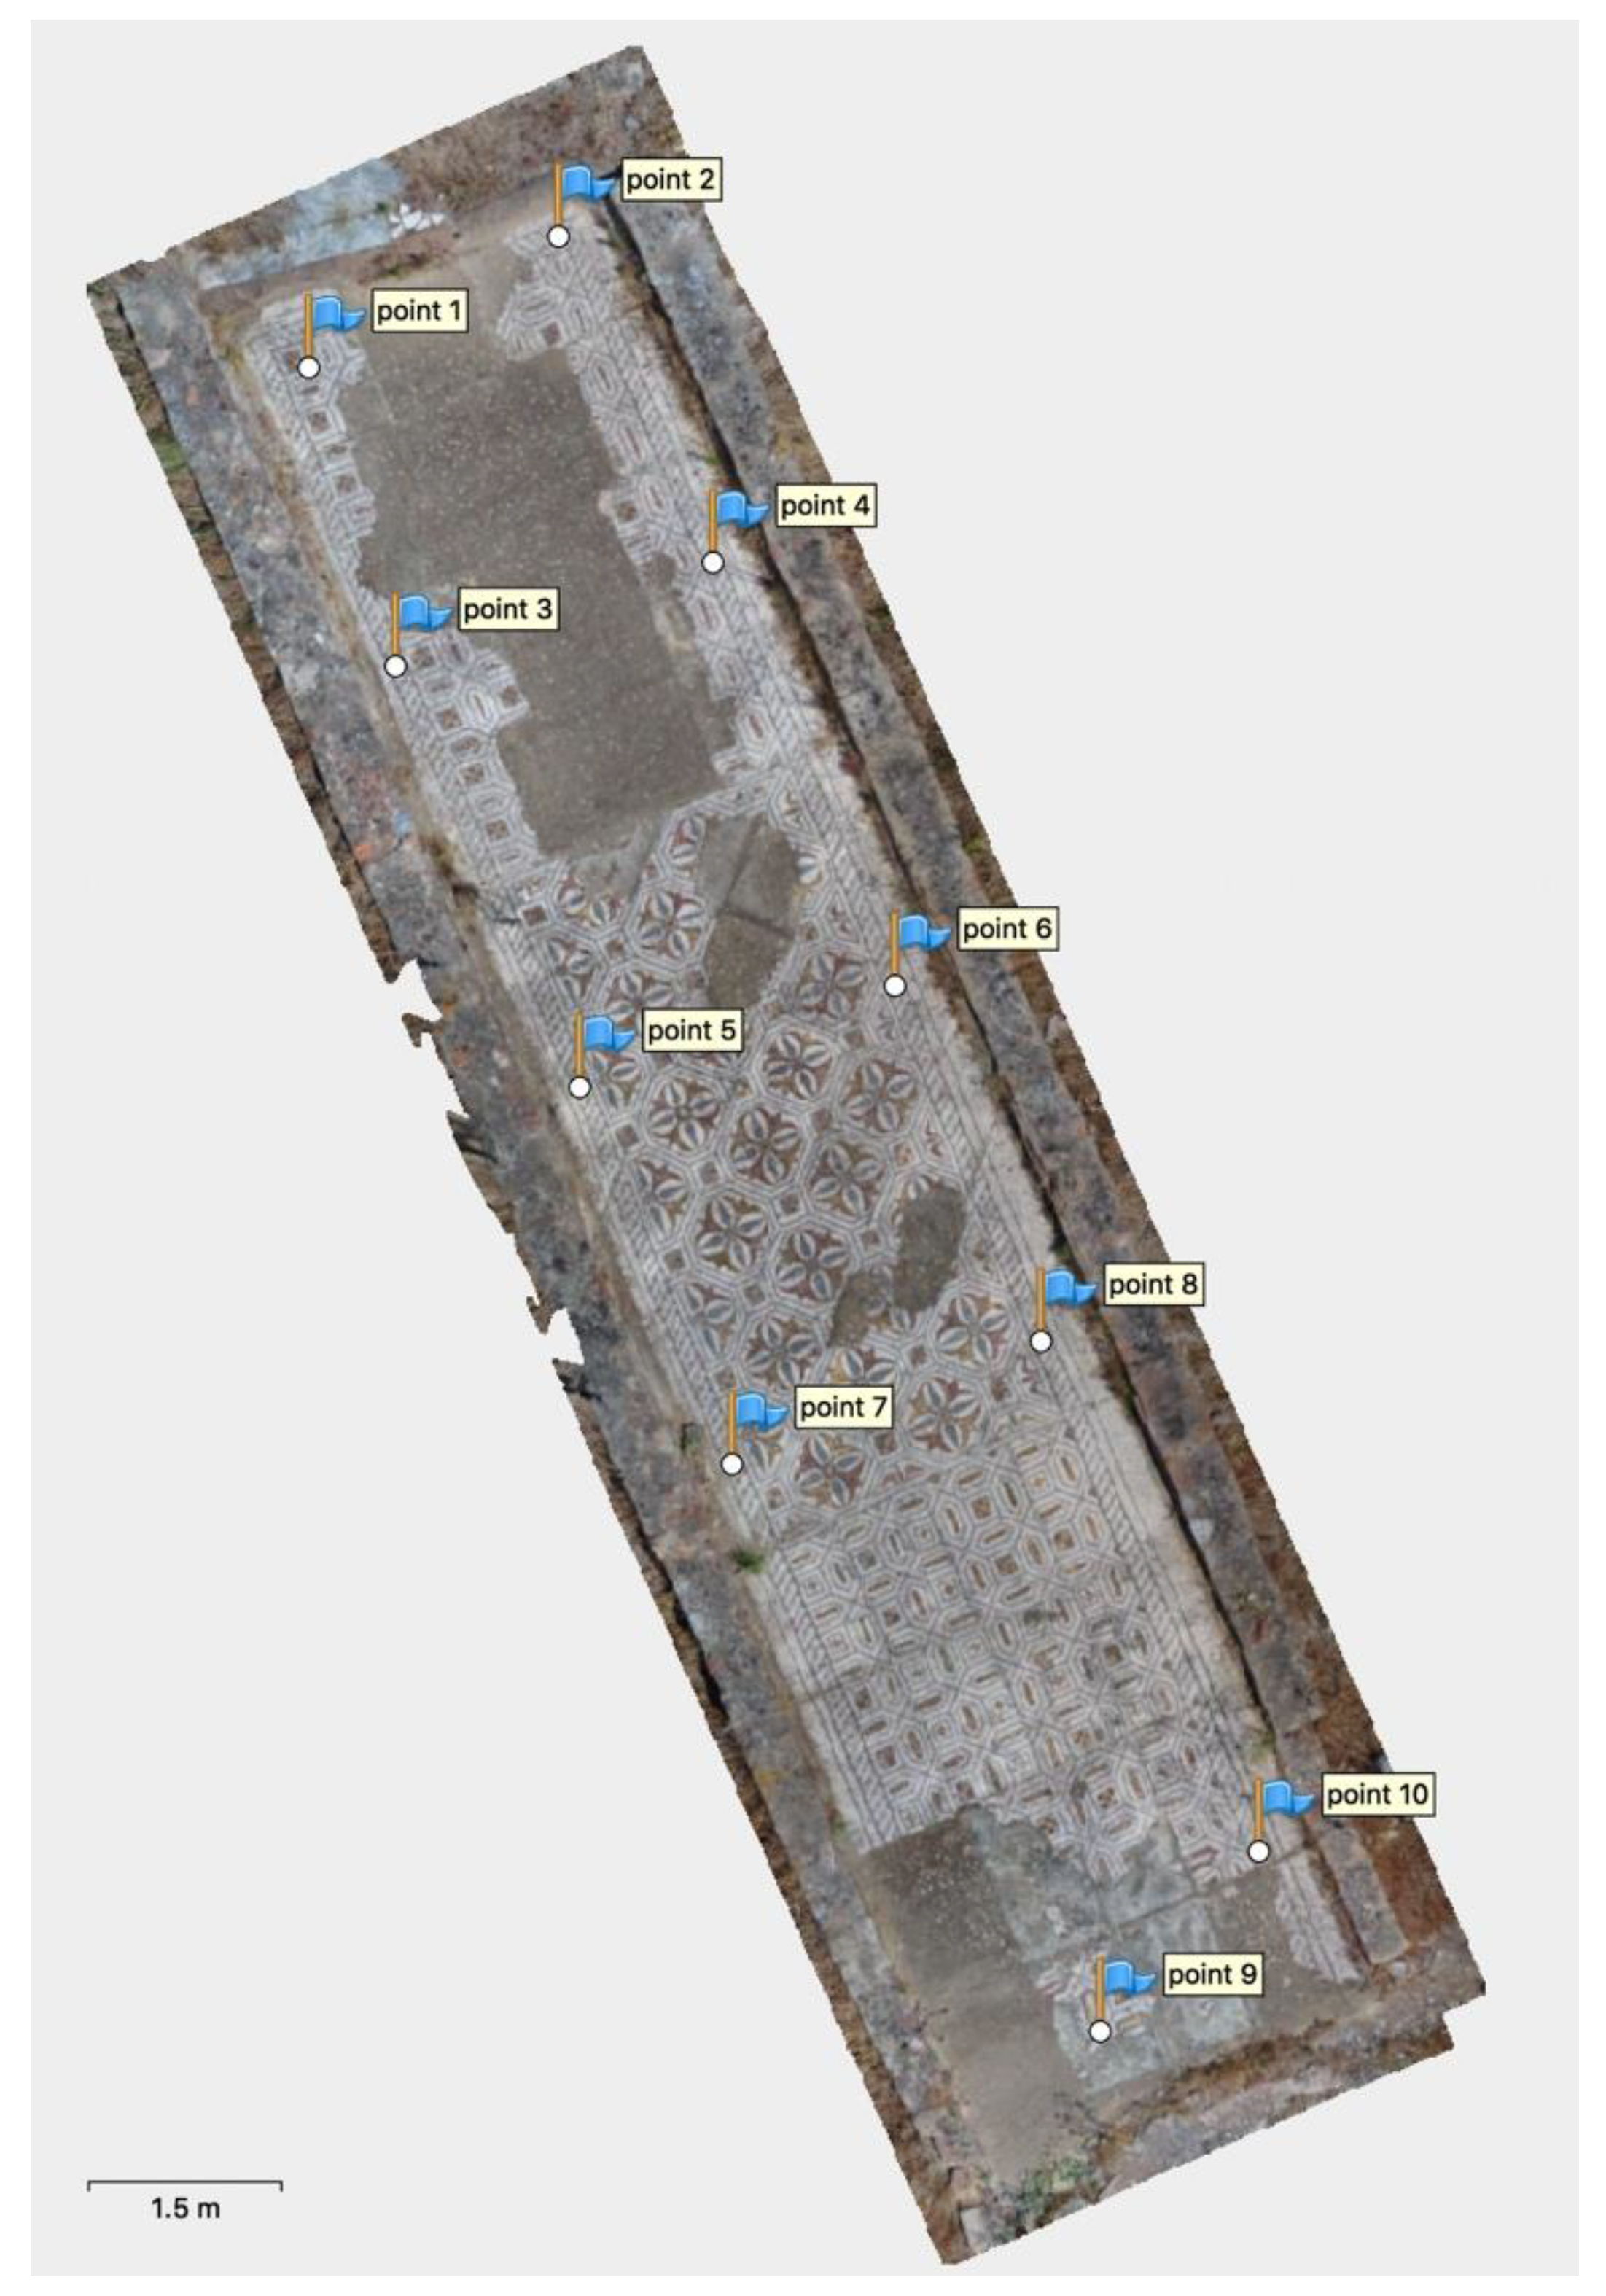
To perform the data processing, the first step was the photo alignment. The highest accuracy was used as well as the generic preselection and reference preselection parameters. In the advanced parameters, the key point limit was set to 60,000 and the tie point limit was set to 4000. Masks were used to exclude areas in the images where the UAV’s shadow was present. Adaptative camera model fitting was also used. After this step, points with a reprojection error bigger than 0.50 were excluded from the sparse point cloud. In total 4305 points were excluded and 102,222 were maintained. After this step, a dense cloud with medium quality and a mesh was built, only to help in the placement of GCP’s because they were, this way, placed automatically in each photo. To ensure the geometrical accuracy and georeferencing of the photogrammetry products, ten GCP’s, which were mostly distinguishable features of the mosaic pattern, were used in the processing chain. The positions of these GCPs relative to the surveyed area are illustrated in
Figure 6. The measurement of GCP coordinates was performed using a differential Spectra Precision Epoch 50 GNSS system. The average easting, northing, and altitude errors of the collected coordinates were 0.001 m, 0.002 m, and 0.010 m respectively. After the point cloud optimization, the resulting average errors were: 0.003686 m East; 0.002260 m North; 0.00988 m Altitude. The total RMS error was 0.004435 m and 0.415 pixels. The coordinate system used was PT-TM06/ETRS 89 (EPSG: 3763) which is the official coordinate reference system in Portugal mainland.
After this step the dense point cloud was rebuilt using the ultra-high quality parameter and moderate depth filtering. A total of 442291309 points were generated. Although not necessary for this study, a mesh was also built using the dense cloud as source. The parameters used were height field (2.5 D) as surface type, face count set to high, and, in the advanced tab, interpolation was set to “enabled”.
Finally, a very high-resolution digital surface model (DSM) and an orthomosaic of the mosaic area were generated. In both cases, all the parameters were the default ones. The source of data for the DSM was the dense cloud and for the orthomosaic was the DSM. The calculated ground sampling distance (GSD) of the products was 0.47722 mm. The results of the mosaic survey can be downloaded, in high resolution jpeg format from
http://www.dct.uminho.pt/pisoes/DSM_PISOES_MOSAIC.zip (DSM) and
http://www.dct.uminho.pt/pisoes/ORTHO_PISOES_MOSAIC.zip (orthomosaic). Some small portions of the DSM near the walls appear miscalculated due to the presence of moving vegetation, as can be easily seen in the orthomosaic. The photogrammetry processing using “structure from motion” is a very time consuming task that usually requires important hardware features to process data in the best quality possible. For all the photogrammetric processing in this work the computer used was an Apple MacPro with a Xeon E5 octacore 3 GHz processor, 128 GB of RAM, one SSD with 1 Terabyte disk, two internal AMD FirePro D500 graphical processing units and two external Nvidia GeForce GTX 1080 Ti graphical processing units (capable of 11.34 teraflops of processing power each).
2.4. Inner Analysis of the Studied Mosaic
2.4.1. Data Acquisition and Processing
GPR uses electromagnetic waves generated by an antenna moving on the surface. These waves penetrate in the subsurface and a part of their energy is reflected on the materials composing the structure, returning to the surface where they are detected on another antenna. The results are radar sections (radargrams) in which the x-axis represents the antenna survey line and the y-axis defines the propagation time of the radar wave in your path. In the case of floors and walls, a 1600 MHz antenna was used because it allows distinguishing reflectors of up to 50 cm inside. In the case of a 400 MHz antenna the investigation range is 3 m (approx.)
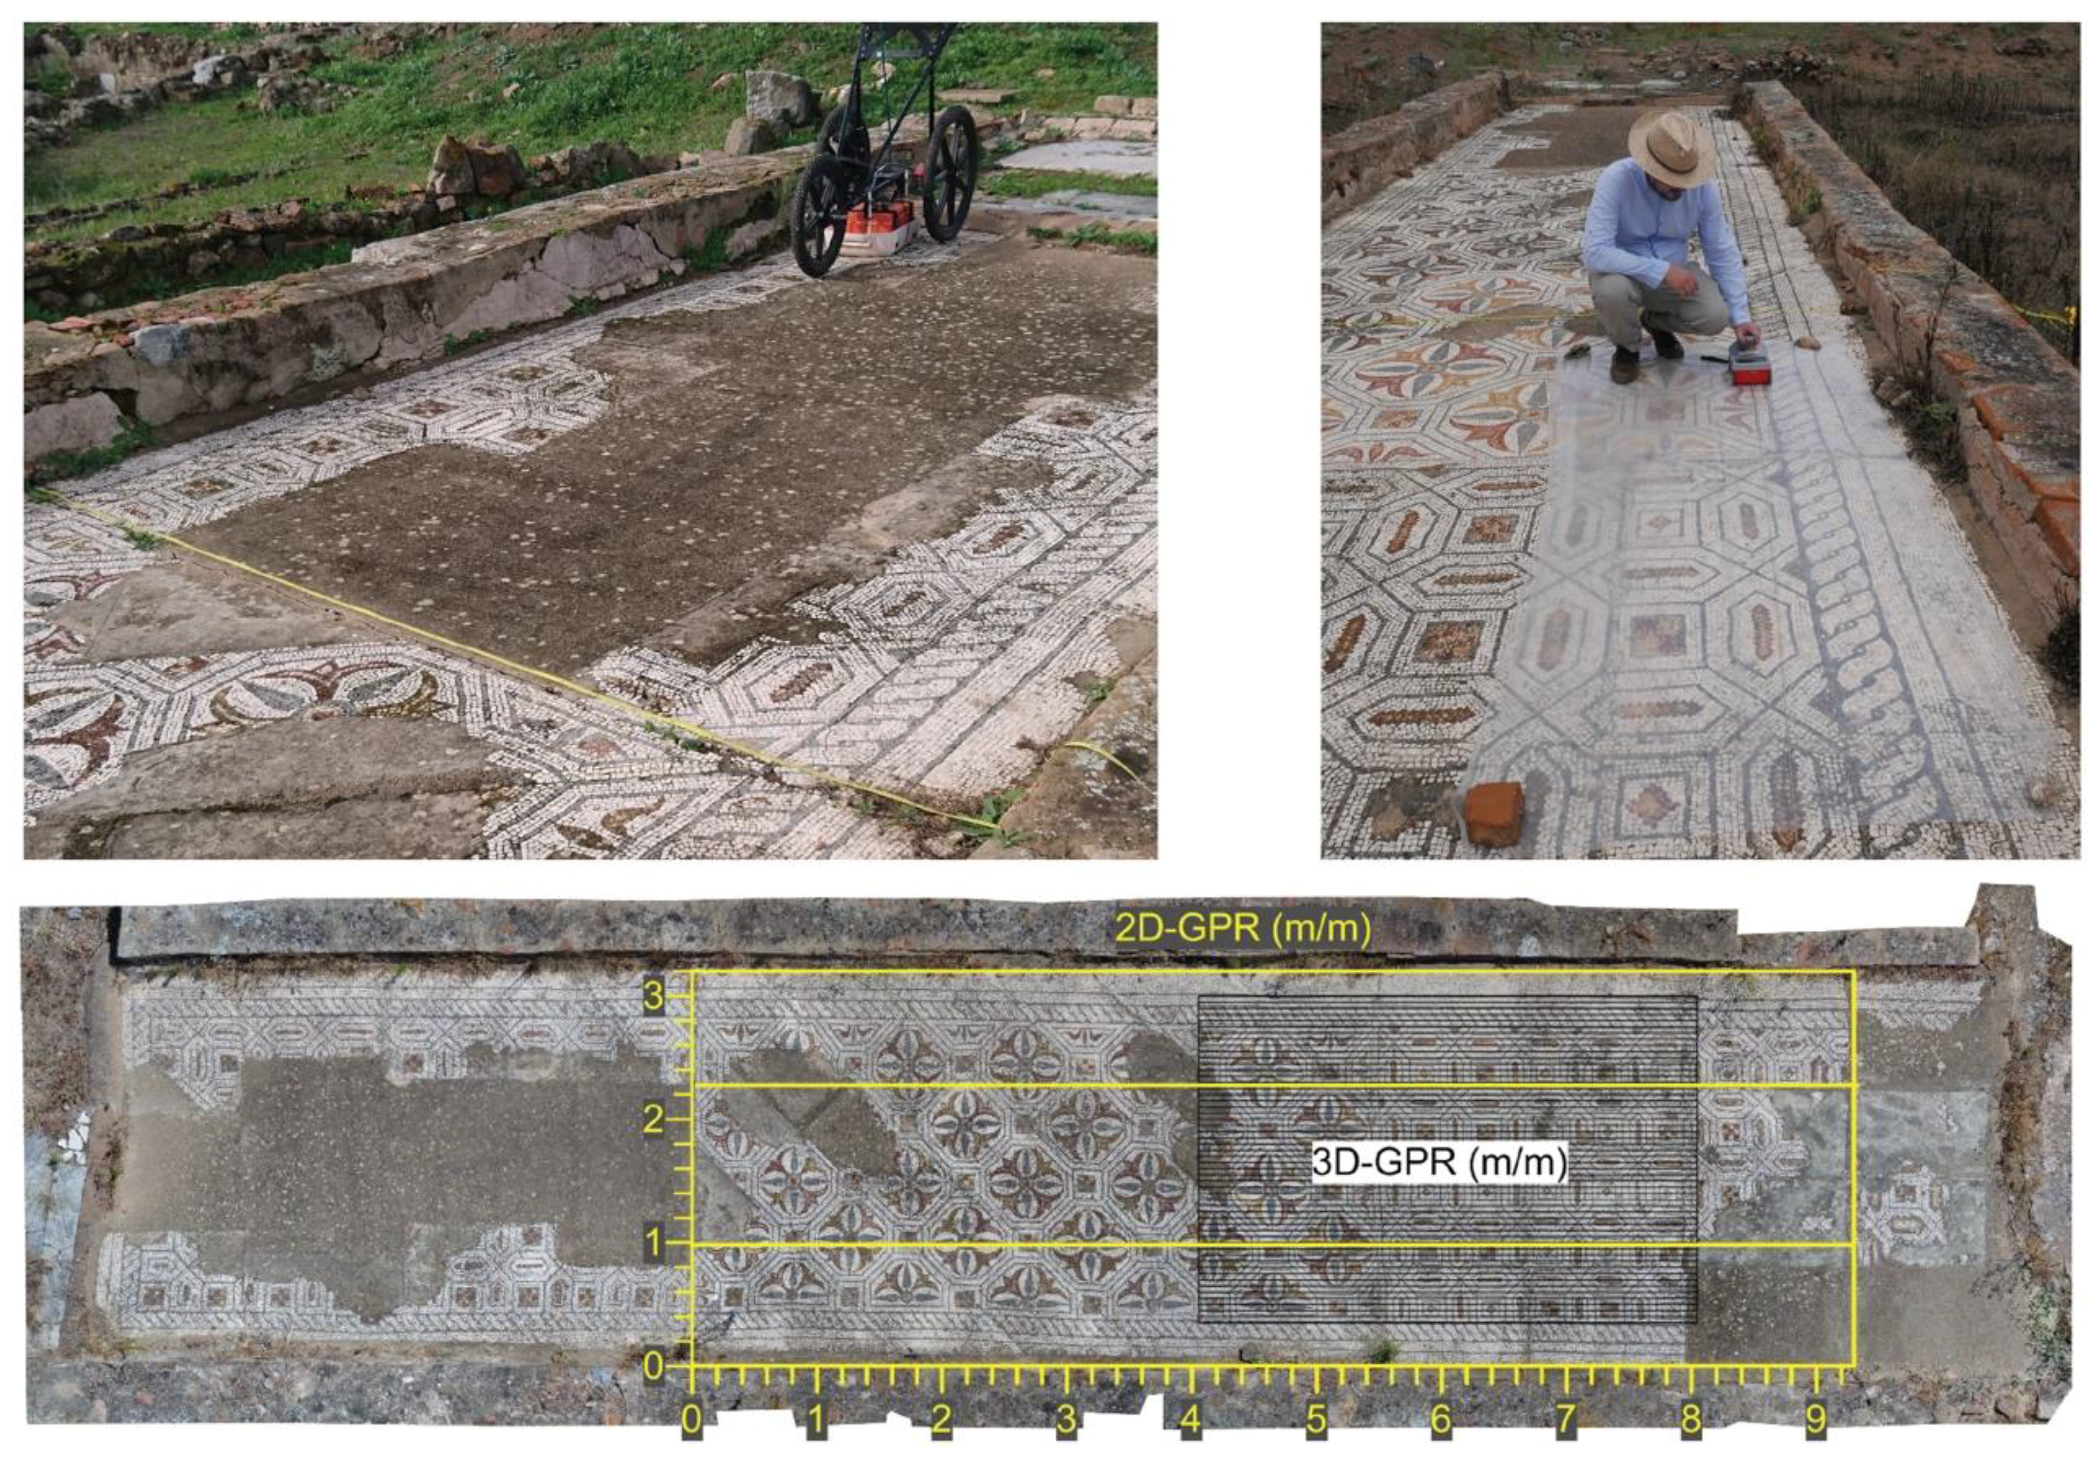
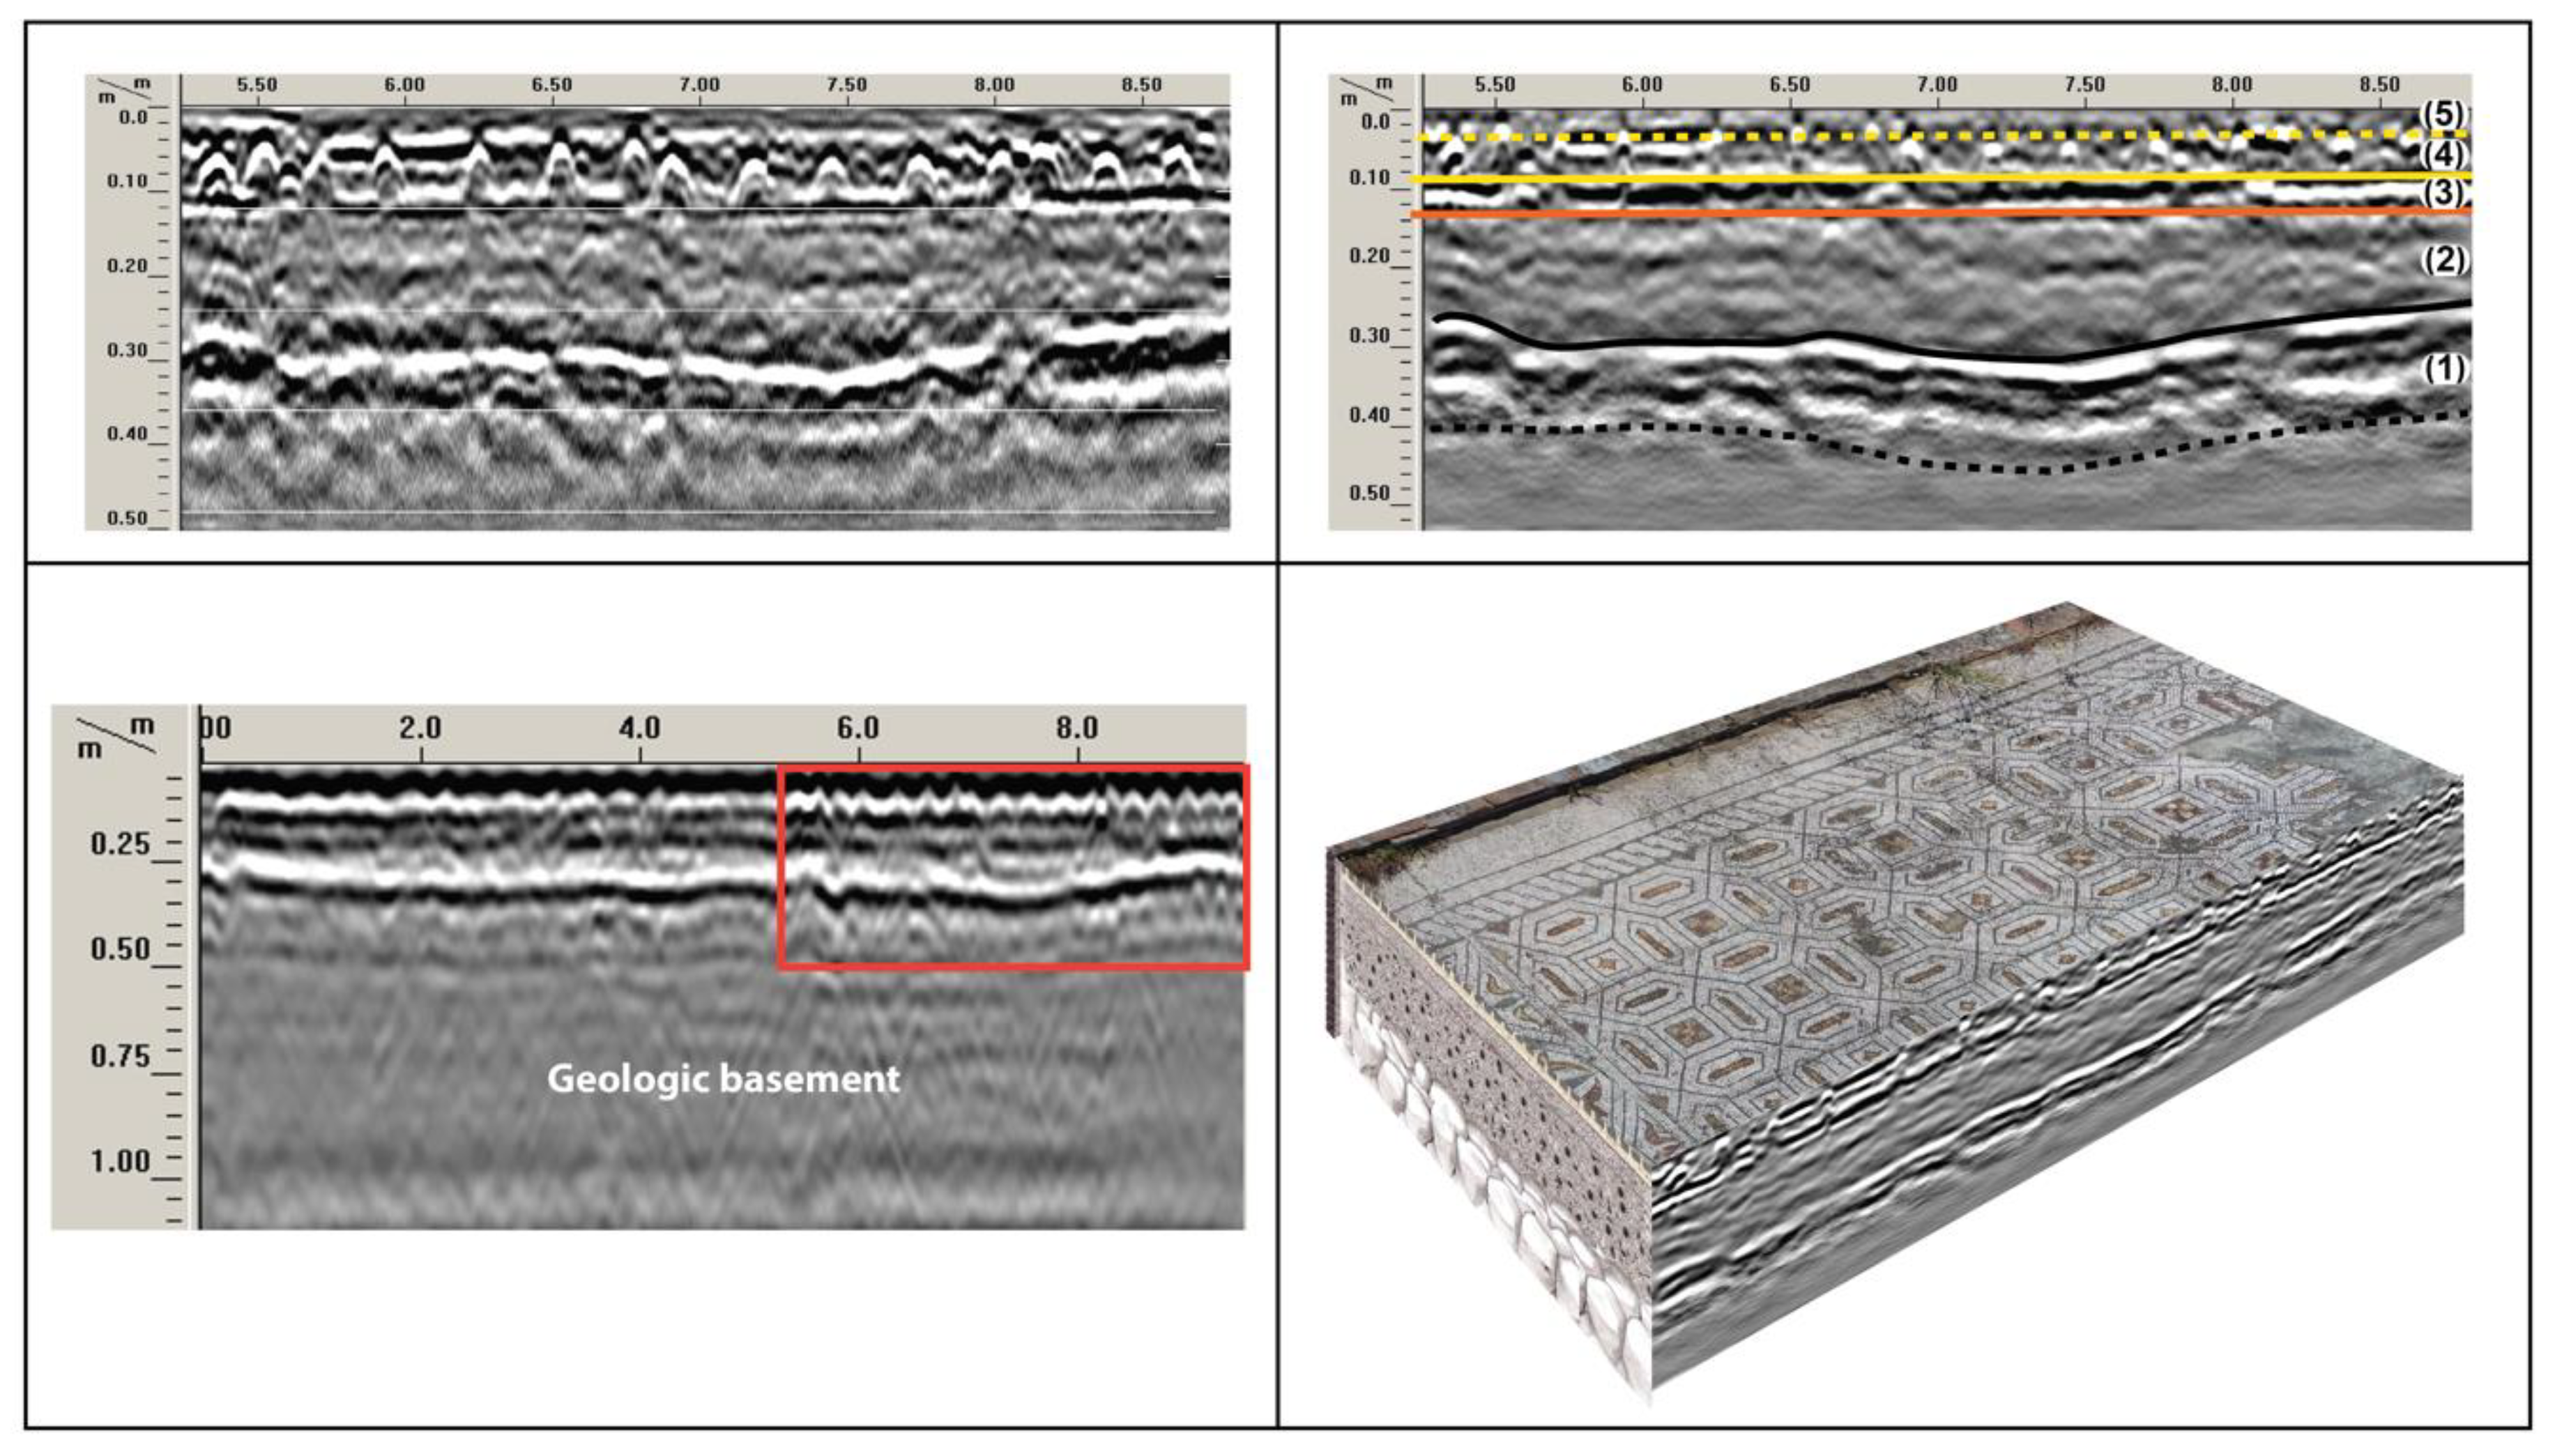
The selected mosaic portion has been recognized on two sensor resolution scales; first, a 2D-GPR survey was carried out using a 400 MHz antenna (yellow rectangle in
Figure 7, lower image). These profiles were placed every 50 cm (approx.) along the width of the mosaic, and their lengths exceeded the dimensions of the study area in order to obtain a general vertical inner view. Second, we used a 1600 MHz antenna to conduct a 3D-GPR survey based on parallel profiles spaced 0.05 m apart (black rectangle in
Figure 7, lower image) to obtain detailed volumetric images of the mosaic. The most significant acquisition parameters for both surveys are presented in
Table 1.
The data processing was performed with RADAN-7 (GGSI, Inc.) commercial software, and for the 2D and 3D images, our own design codes were also used for presentation [
27]. As the quality of the acquired signal in this study was good, conservative flow processing was applied (
Table 2), which was mainly aimed at increasing the signal amplitude (gain corrections) and, most importantly, to increase the vertical and lateral resolutions (deconvolution operator). To determine the average dielectric permittivity, an exhaustive analysis of the velocities was performed by adjusting some diffractions in the 400 MHz antenna profiles.
2.4.2. Methodological Aspects: Resolution and Feature Identification
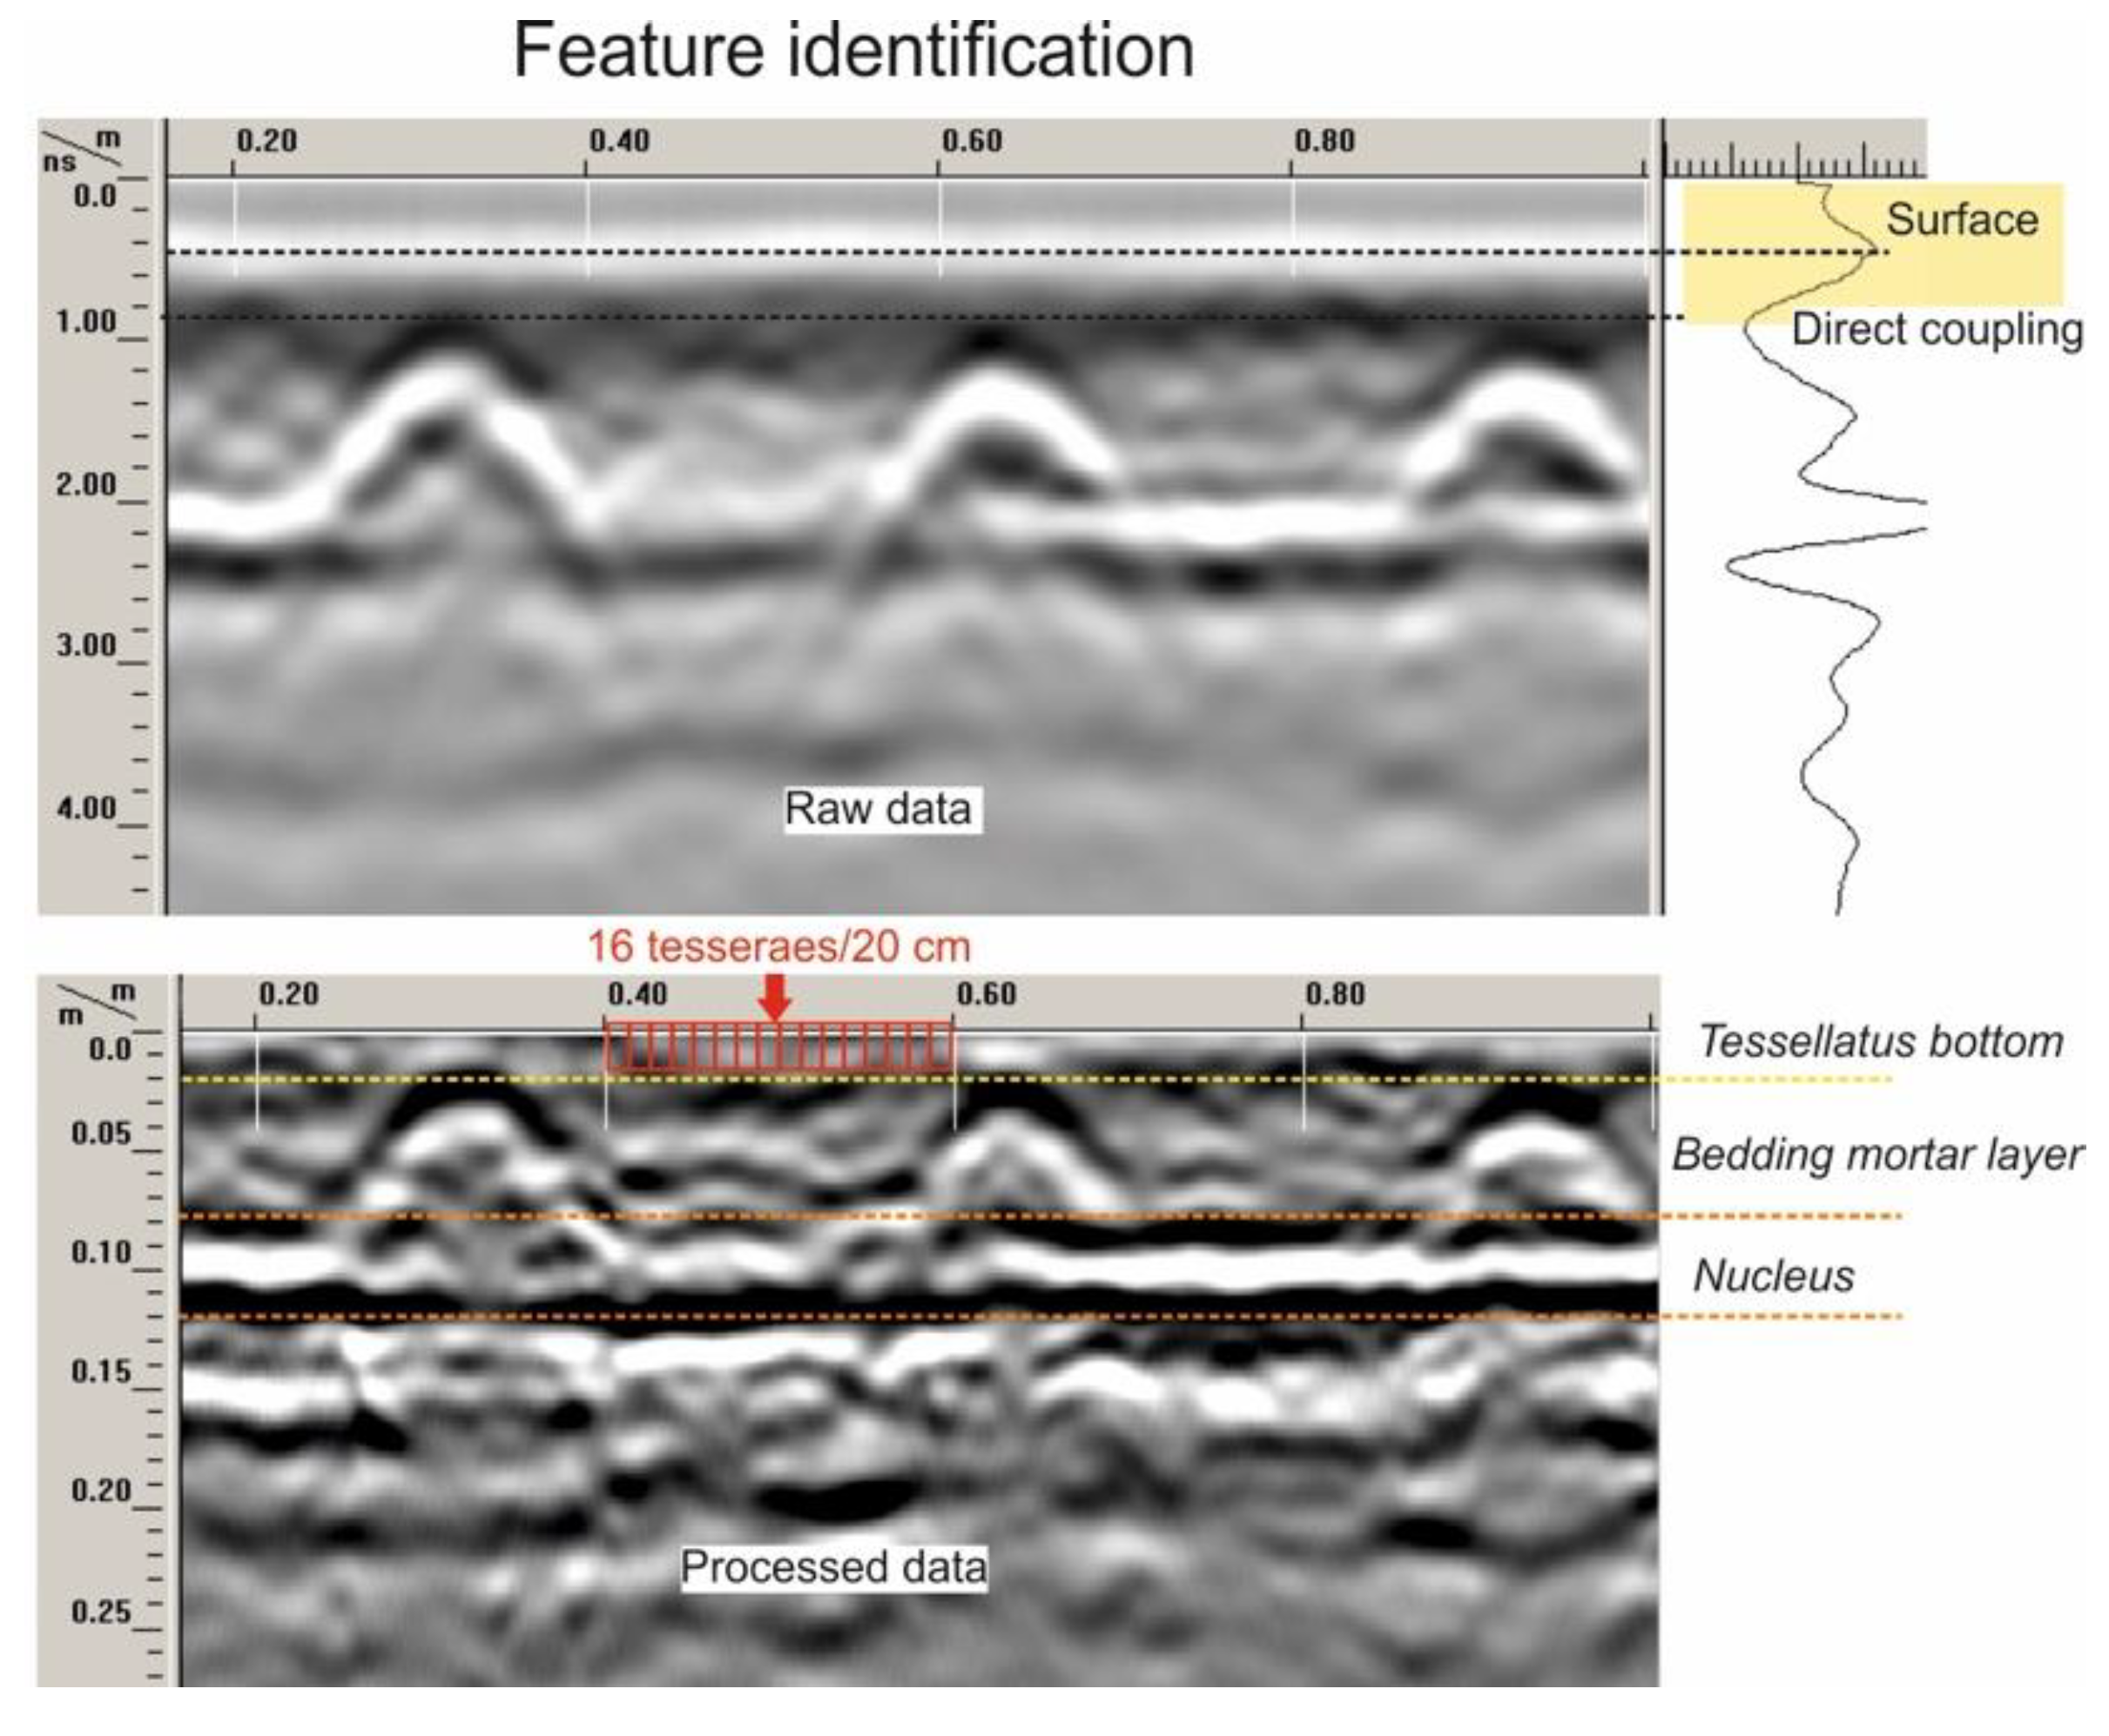
The GPR device parametrization with the 1600 MHz antenna (
Table 1) suggests a very high resolution, capable of inspecting objects with sizes compatible with the teasels (1–2 cm at 4 cm depth,
Table 3). However, the GPR radargrams obtained from the Roman mosaic (
Figure 8) did not allow for the high resolution suggested, although the radargrams clearly reveal the main stratigraphy of the mosaic.
The accuracy with which a specific body can be located depends on several factors. The GPR antenna begins sensing the target upon approach, continues to receive reflections as it passes over the target, and continues to receive reflections for some distance past the target. The distance between the antenna and the target changes as the GPR moves, which explains the hyperbolic shape of the reflection that determines the body detection.
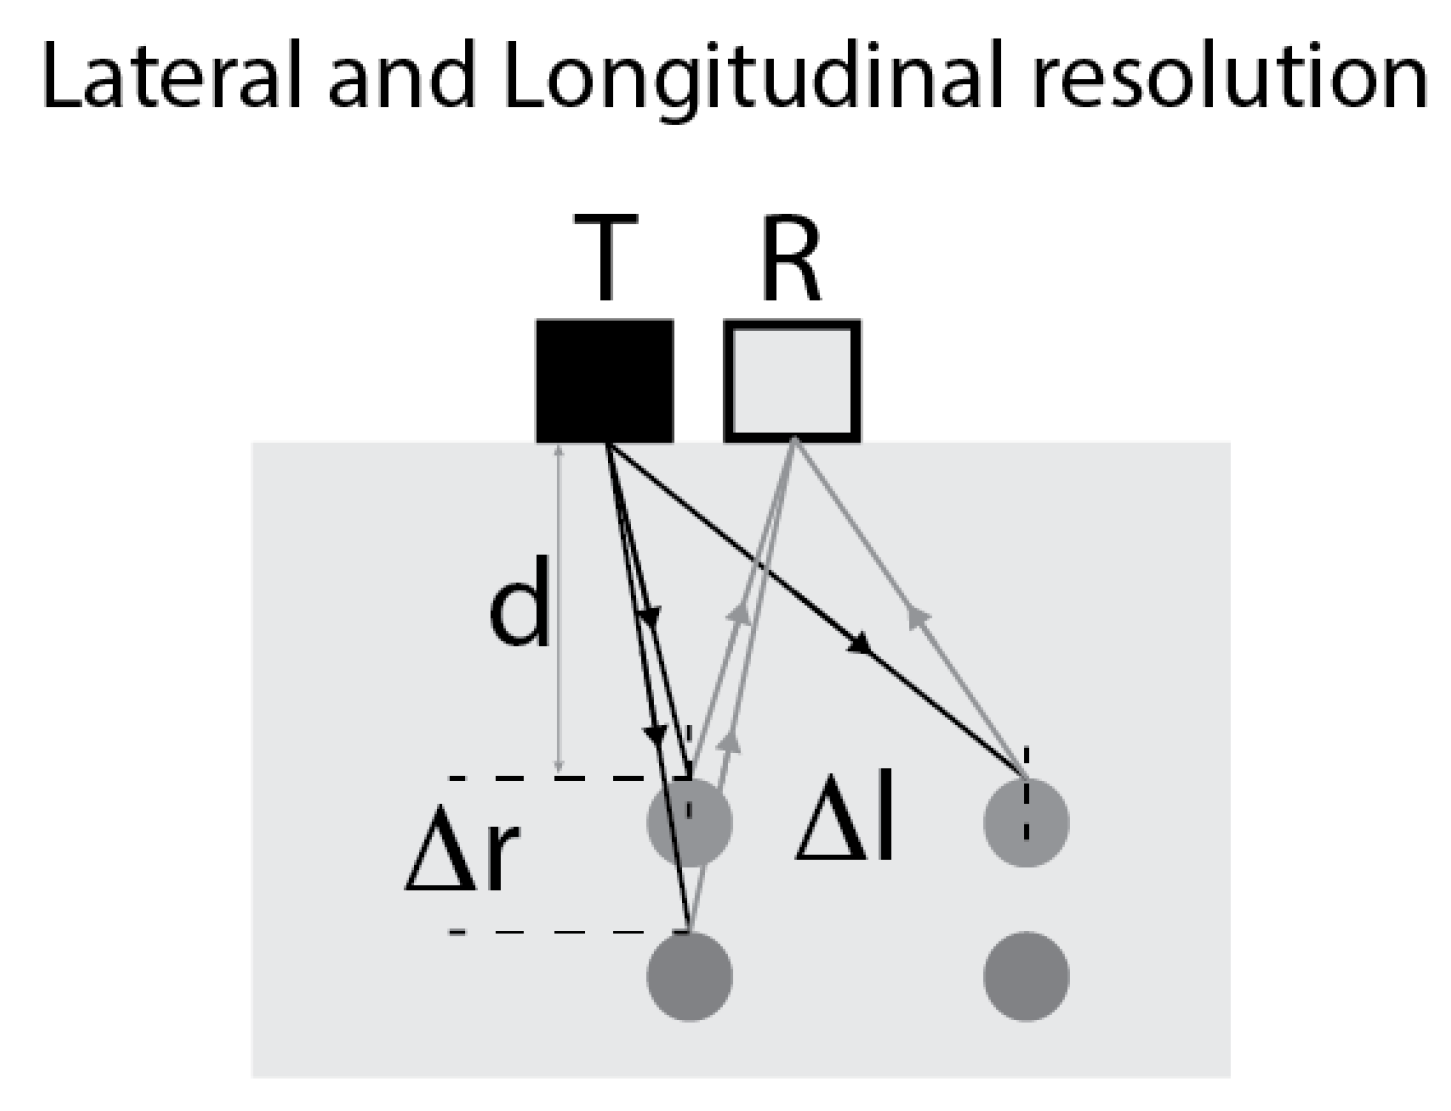
In the first theoretical approximation, the GPR resolution is controlled by i) the bandwidth frequency of the electromagnetic pulses that radiate from the antenna in a cone of approximately 60 degrees amplitude and ii) the wave pulses velocity in the involved material. The two components that dictate the resolution [
28] are the lateral resolution length, Δl, (sideways displacement) and the longitudinal resolution length, Δr, (depth), as depicted in
Figure 9.
The lateral resolution is described by the Fresnel zone equation:
where λ is the central wavelength,
v is the GPR wave velocity in the medium,
fc is the central frequency and
d is the depth.
The longitudinal resolution, based on the Rayleigh principle, can be described by the following equation:
If we assume an average velocity of 0.128 m/ns for the mosaic and 1600 MHz of central frequency, we have a limit of 2 cm for longitudinal resolution and 2–4 cm for lateral resolution at depths between 1 cm and 4 cm, respectively. This explains why the tesserae cannot be detected from data acquired with the 1600 MHz antenna, as shown in
Figure 8.
There are other factors that also contribute to the final absolute accuracy:
- (1)
The positioning accuracy also depends on the sampling rates of the GPR signals, both spatially and temporally. In this study, we used a scan sampling of 800 scans/m and a time sampling of 0.04 ns between samples along each trace (
Table 2); thus, we determined Nyquist values of 1.25 mm (1/2Δx) and 12.5 GHz (1/2Δt), respectively. Although these 800 scans/m were averaged in 4 traces (stack), the effective Nyquist number became 2.5 mm. These two sampling values were in accordance with the required resolution ranges, indicating that the acquisition parameters were appropriate in this study.
- (2)
The distance between the transmitter and receiver (T-R offset), which is often ignored in deep surveys, is comparable to the target depth in this study. For the 1600 MHz antenna, the T-R offset was 5.8 cm (GSSI, Inc.). This value defines a “fuzzy” top level in the raw data that can be made finer during the processing flow if we consider some signal features (
Figure 8). The very first signal in a scan is called the “direct coupling” between the transmitter and receiver. This signal is used to identify the surface position in a scan. With the 1600 MHz antenna, the surface is located at the first positive (white) peak within the direct coupling. In our raw radargram, direct coupling looked like straight horizontal bands on top of the data window. The signal arrives at the receiver before penetrating the material, which in this case, was after 0.4 ns or 4–5.25 cm if we consider the air-tesserae velocities. This signal was a combination of the transmit pulse in the air and surface reflection from the top of the material (top of mosaic), so the direct coupling carries little information about the top of the mosaic. However, the amplitude depends on the dielectric constant of the material, and variations in amplitude may indicate changes in properties (e.g., increased moisture). Direct coupling disguises the first part of the scan, and thus, making this signal as short as possible is a major configuration goal. For a 1600 MHz antenna, direct coupling allows for the detection of targets from 1.8 cm (5.8–4 cm) below the surface and the accurate measurement of their depths. Considering the negative peak (a straight horizontal black line in the radargram) immediately below the surface is part of the direct coupling. The first positive peak does not show any visible variations, although its amplitude may vary along the profile. Some variations may be observed within the negative peak, and they usually indicate changes in the layer properties within the top inch of the material, although their accurate interpretation is difficult.
- (3)
Increasing the resolution with a spike deconvolution. When the target size is a fraction of the wavelength, the shape of the detection hyperbola does not change significantly. This means that any targets that are dimensionally less than 2 cm in length and 2–4 cm laterally will produce hyperbolas of the same size and shape. Relative sizing is possible for targets with a diameter greater than 2 cm, as long as these targets are located at the same depth, crossed at the same orientation, and surrounded by the same material.
These resolution limits can be reduced slightly in the data processing by applying a spike deconvolution [
29]. In
Figure 8, we compared the raw radargram with the processed radargram, observing a significant increase in resolution.
All of these previous considerations have been established for the 2D-GPR profiles (X, Z), but in our 3D survey, the (X, Z, Y) profile spacing was also considered. The orientation and number of profiles depends on the structure type and size, and other factors, such as distance control and wheel accuracy. The general rules are as follows: (a) The planned profiles could cross perpendicular to the features intended for detection. (b) A line spacing of 5–7.5 cm is required for complete coverage. This is the maximum practicable survey density that may be used for detailed 3D mapping because the 1600 MHz antenna width is 15 cm. (c) Linear targets that cross the survey lines at an angle of 45° to 90° will be resolved with good accuracy. (c) Complete exploration of the structure requires a survey in two directions, which are perpendicular to each other.
In this study, we planned a grid layout with the profiles spaced only 5 cm apart in the parallel direction to the corridor. By considering all the theoretical and experimental aspects that affect the GPR resolution, we could establish the absolute final accuracy, shown in
Table 3. This means that the surface layer of the tesserae was unknown, and up to the nucleus level, only those elements that exceed the dimensions listed in
Table 3 could be detected.
4. Conclusions
Through this work we have presented a methodology to approach the study of mosaics from the point of view of their construction. Our objective was to demonstrate how the photogrammetry (UAV) allows us to document, with a submillimeter pixel resolution, the decorative image of a Roman mosaic; which is far below the tesserae dimensions (1 × 1 × 2 cm). In addition, the photogrammetry also allowed for obtaining a digital surface model of the Roman mosaic, also with a submillimeter sensibility in height, sufficient to detect the main units of the sinopia (base blocks), the superficial cracks, and the differential settlements of the subsoil.
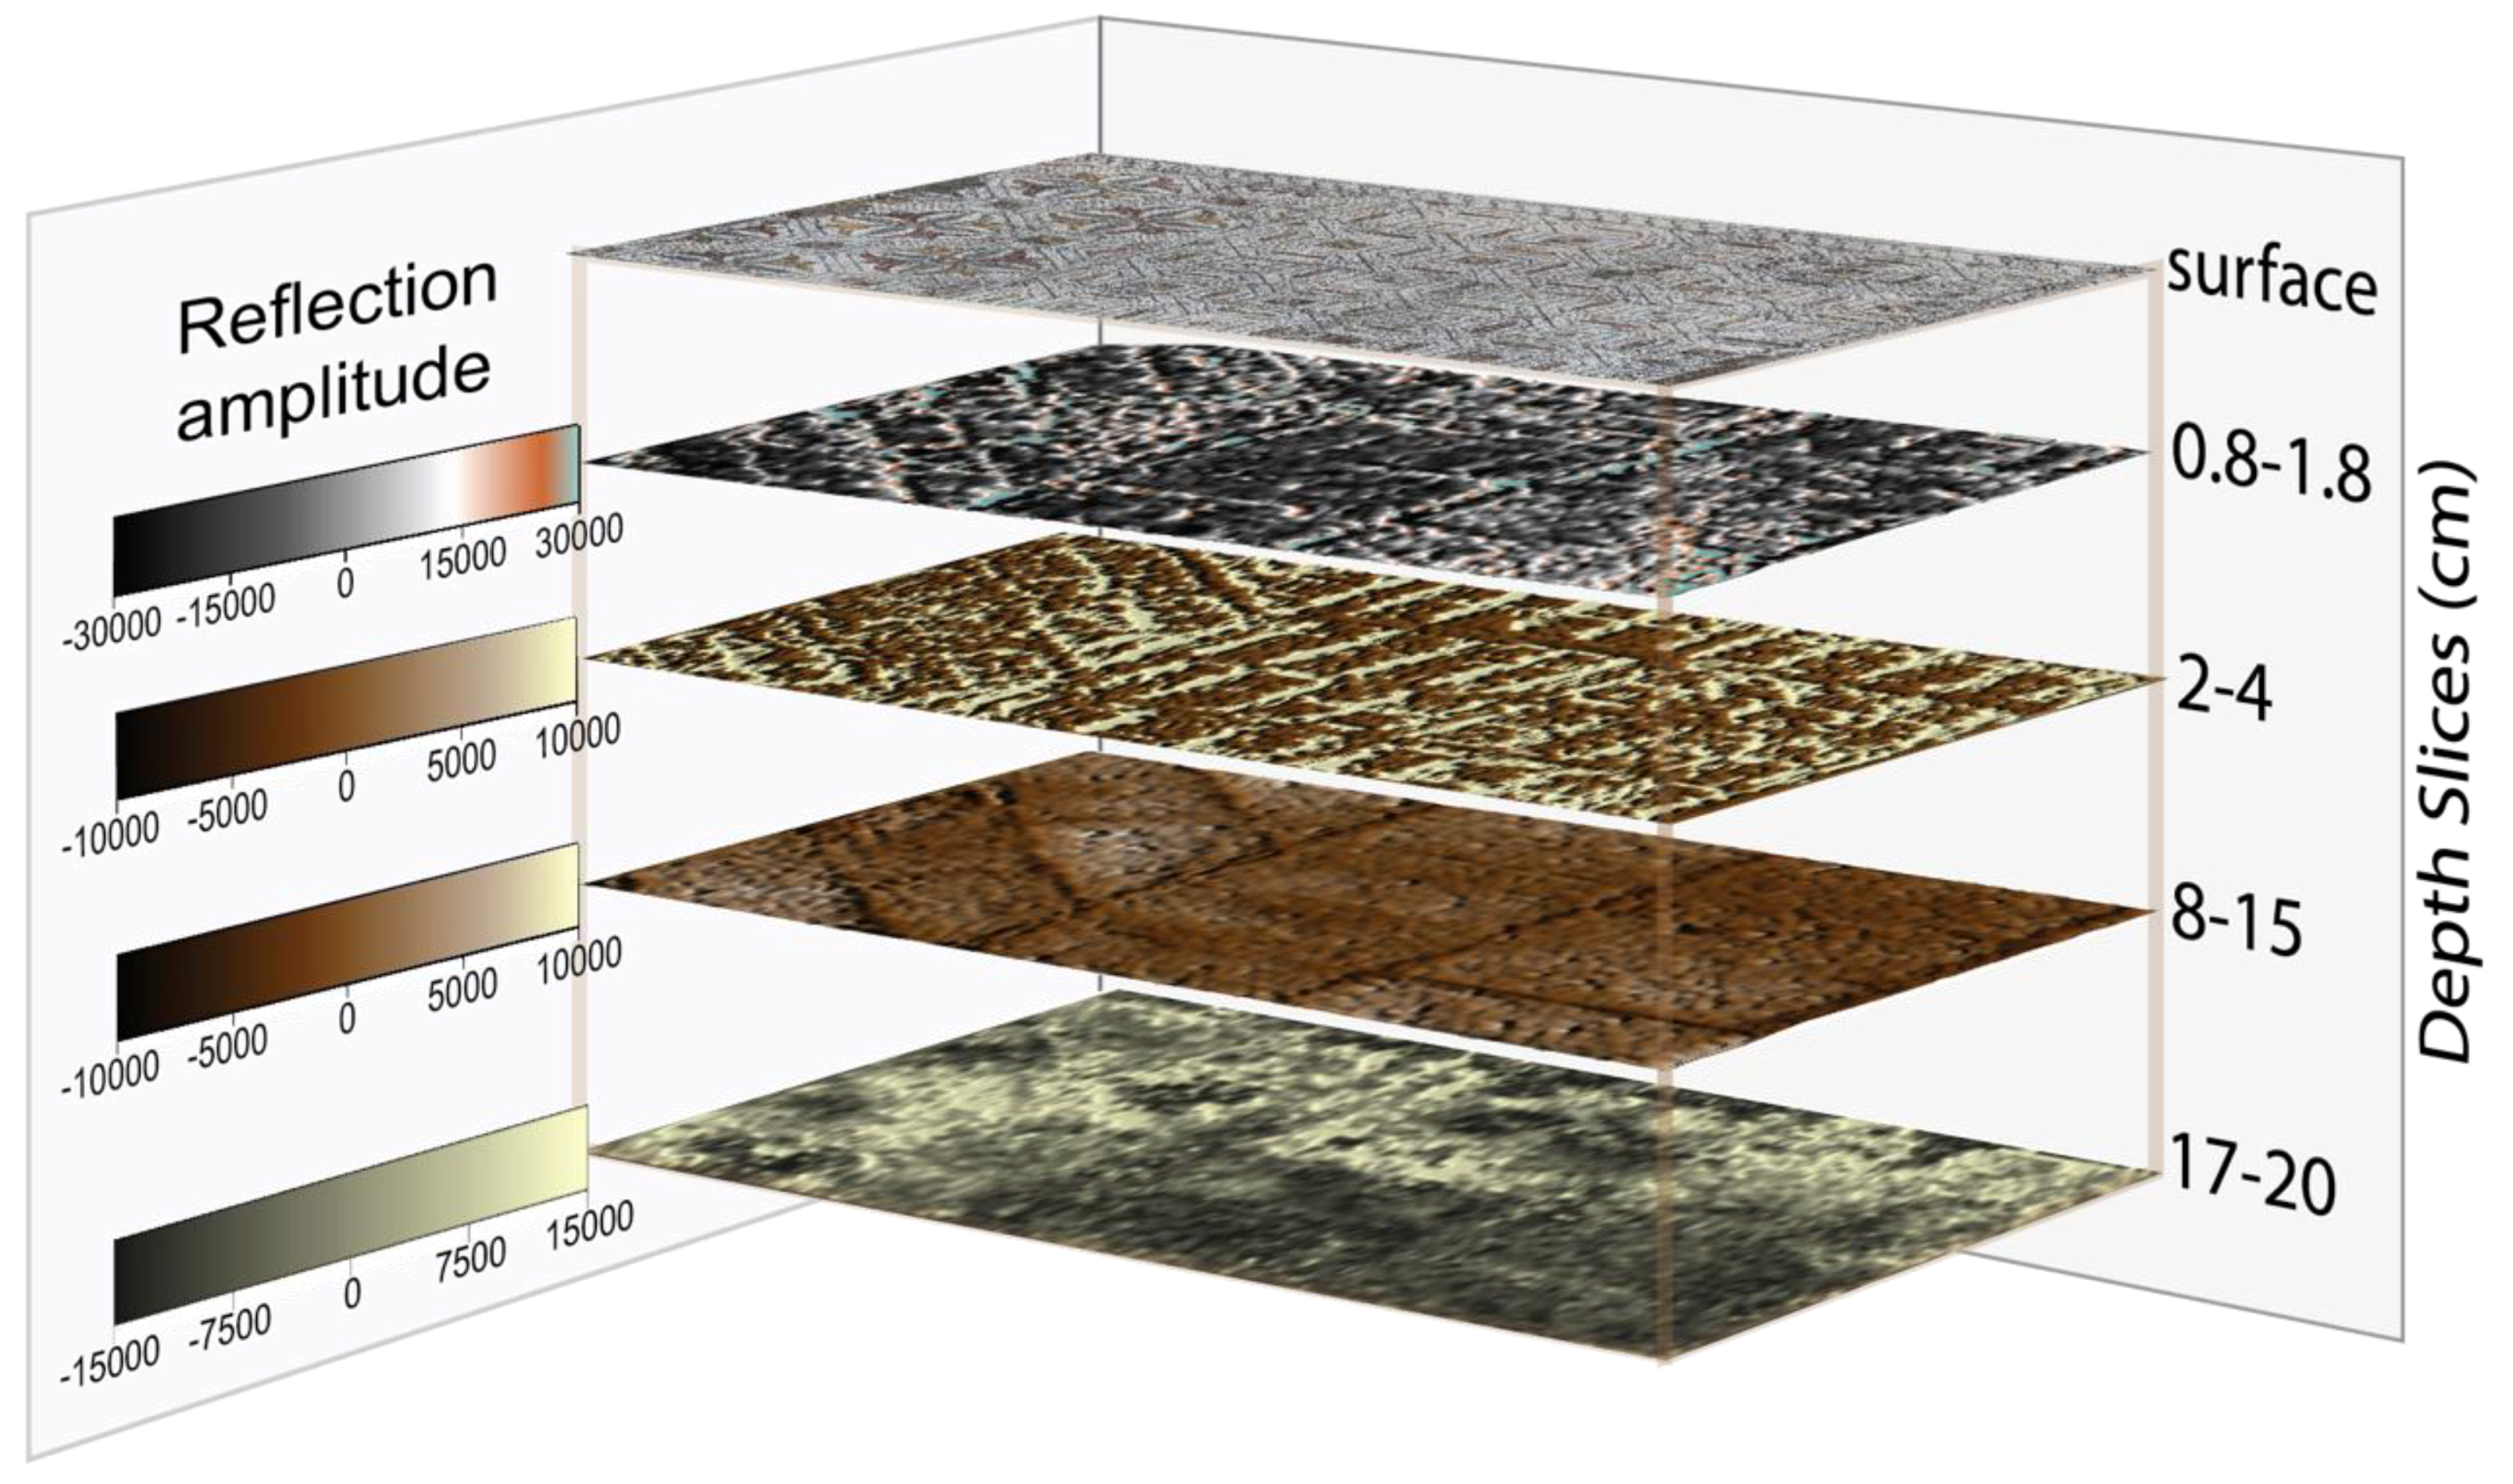
On the other hand, the 3D-GPR survey with a 1.6 GHz antenna provided a tridimensional model of the mosaic interior with a resolution that made it possible to establish the main guidelines of the sinopia, the base blocks, and distinguish all constructive layers of the Roman mosaic (statumen, rudus, nucleus, and bedding); except the first undetectable tesserae surface layer.
For this reason, we propose that the best way to know a Roman mosaic is to cross both nondestructive techniques: The UAV photogrammetry to cover the most superficial information of the mosaic, and the 3D-GPR to access its internal parts, between the surface and approximately 30–40 cm depth. In addition to the structural aspects, it was also possible uncover the main grooves that define the sinopia design. Curiously, the study revealed that even in areas where the tessellatum failure had been changed to a regularizing mortar, the GPR pattern of the lower layers remains. The grooves in the sinopia continued to be visible on the radargrams, which proves that the mortar coating covers only the surface of the tesserae and did not interfere with the remainder of the mosaic structure or its preservation state.
The results of this study, which involved obtaining the internal structure of the mosaic, suggest that the model quality was achieved, particularly for the pathology diagnostics such as deformations, fracture zones, and humidity. The results of the present work did not clarify the humidity content because the studied mosaic is very stable and not affected by humidity, since the data acquisition was completed in July, which is an extremely dry season in Portugal. In any case, the methodology followed in this study allows for extensive diagnosis prior to preservation and restoration works, even in the lower layers of the mosaic structure, to prevent the increase of the pathological agents that promote its degradation.
In the future, we intend to carry out another study through multi-array GPR frequencies and recollect the data in two perpendicular directions to better resolve the accuracy reach ratios.
Finally, through this work, we showed that a Roman mosaic, in addition to the beautiful superficial drawings defined by the tesserae, is a complex archaeological structure. It is precisely the quality of this structure that allowed the mosaic to be preserved in all of its splendor to the present, nearly two thousand years after construction.

 ,
, 


