Assessment of Water Storage Change in China’s Lakes and Reservoirs over the Last Three Decades
by
 , ,
, ,
Yu Fang
1,†, 
Huan Li
2,†,
Wei Wan
2,
Siyu Zhu
1,
Zhongjing Wang
1,
Yang Hong
2,3 and
Hao Wang
4,* 
1
State Key Laboratory of Hydroscience and Engineering, Department of Hydraulic Engineering, Tsinghua University, Beijing 100084, China
2
Institute of Remote Sensing and Geographic Information System, Peking University, Beijing 100871, China
3
Department of Civil Engineering and Environmental Science, University of Oklahoma, Norman, OK 73019, USA
4
State Key Laboratory of Simulation and Regulation of Water Cycle in River Basin, China Institute of Water Resources and Hydropower Research, Beijing 100038, China
*
Author to whom correspondence should be addressed.
†
Y.F. and H.L. contributed equally to this work.
Remote Sens. 2019, 11(12), 1467; https://doi.org/10.3390/rs11121467
Submission received: 28 May 2019
/
Revised: 17 June 2019
/
Accepted: 18 June 2019
/
Published: 20 June 2019
Abstract
:Lakes and reservoirs are essential elements of the hydrological and biochemical cycles, considered sentinels of global climate change. However, comprehensive quantifications of their water storage changes (∆V) at a large spatiotemporal scale are still rare. Here, we integrated a global surface water dataset and SRTM digital elevation models, both available from Google Earth Engine platform at a spatial resolution of 30 m, to evaluate ∆V for a total of 760 lakes and reservoirs across China at an annual timescale since 1984. The results indicated that (1) the aggregated water storage went through a slight increase of 41.5 Gt (1.7 Gt/yr) during 1985–2005, a significant decrease of 100 Gt (−20.6 Gt/yr) during 2005–2009, and then increased by 136.3 Gt (21.3 Gt/yr) during 2009–2015. (2) The increasing trend was largely attributed to lakes and reservoirs in the Tibetan Plateau Lake Zone, and the decreasing trend was mainly due to the North and Northwest Lake Zone, with little variations observed for the Northeast and Southwest Lake Zones. (3) Qinghai lake was associated with the largest increase (18.3 Gt) and Poyang lake presented the largest decline (−9.2 Gt). The results can help advance our understanding of the impact of climate change and improve future projection.
1. Introduction
1.1. Importance of Water Storage Change Assessment
Lakes and reservoirs are essential elements of the hydrological and biochemical cycles and are a vital resource for industrial, agricultural, domestic, and hydropower water use [1]. Lakes and reservoirs are also considered sentinels of global climate change due to their sensitivity to environmental changes [2]. Climate change and human activities, including dam construction, water diversion, and land-use land cover change, have led to significant changes in the number, water level, surface area, and volume of lakes and reservoirs, especially during the past several decades [3]. Considering the variation on bathymetry, water storage change can be used to better diagnose the extent of environmental change, compared to water level and area [4]. Lake and reservoir water storage is a critical term in surface water balance and an important variable integrating the effect from hydroclimatic condition and human control. Water storage changes in lakes and reservoirs present significant spatial and temporal variability, reflecting heterogeneity of local conditions in terms of climate, hydrology, topography, land cover and human disturbance. Monitoring water storage change can help to understand the dynamics of the global hydrological cycle and predict the impact of global changes on water resources [5]. Assessing water storage changes in lakes and reservoirs is consequently becoming increasingly important for the sustainable management of water resources.
1.2. Limitation of Current Assessments
However, until now, the spatio-temporal characteristics of water storage change have remained inadequately assessed. Comprehensive quantifications of water storage change in lakes and reservoirs are still lacking at the large spatial and temporal scales [6,7]. Spatially, the existing assessments are mainly concentrated on: (1) large lakes such as Qinghai Lake [8,9], Poyang Lake [10], and Lake Victoria [5]; (2) a small number of lakes and reservoirs, for example, 11 large lakes in South Tibet [4], 27 reservoirs in South Asia [11], 30 lakes in Tibetan Plateau [12], and 114 lakes larger than 50 km2 in Tibetan Plateau [13]; (3) specific regions such as the Tibetan Plateau, due to its unique climatic and topographic condition, significant ecological effects, and sensitive responses to climate change [14,15], accumulating a series of important research findings [7,12,14,15,16,17,18]. Long-term analyses can enrich our knowledge about the history and current situation of lakes and reservoirs and advance our understanding of the mechanism of water storage change [5]. Yet, current assessments have been limited to a short time period, including analyses at several time points [12] and analyses over the last decade, as in the 2002–2015 period [7].
1.3. Major Assessment Approach
Water storage change in lakes and reservoirs has been mainly assessed by combining water level and water area. The identification of water storage change at large scales has been challenging largely due to the scarce and discontinuous in-situ measurements on water levels. The on-site measurement is time-consuming and labor-intensive, and the situation of sparse observation is unlikely to get improved soon, especially for developing countries [19]. The development of remote sensing technology has provided a fast and effective alternative for evaluating water storage change in lakes and reservoirs with increasing products on water area and water level [4]. Landsat satellite images have been widely used in mapping lakes and reservoirs due to their high spatial resolution, long period of data availability and open access, and radar and laser altimeter satellites (e.g. TOPEX/POSEIDON, ENVISAT, JASON-1, ICESat/GLAS) have been applied to monitor changes in the water elevation of the lake and reservoir considering the high accuracy [14]. Most existing assessments on water storage change estimated volumetric changes by combining water area identified by the spectral sensors with water level measured by the altimeter satellites. For instance, for the purpose of evaluating water storage change in the Tibetan Plateau, Song et al. used water level data provided by ICESat/GLAS (2003–2009) and identified water area based on MSS/TM/ETM+ data (1970–2011) [12], and Zhang et al. employed the ICESat (2003–2009) and Landsat image data (1970s and 1989–2015) [17]. Nevertheless, the limitations of remote sensing data have constrained their application in water storage change assessment. Water storage analyses based on remote sensing data are confined in both time and space. The data provided by lidar altimeter satellites are particularly applicable to large lakes, and the monitoring period was usually limited. For example, ICESat data were only available between 2003 and 2009. Therefore, as mentioned above, the existing water storage change studies have been primarily focused on a small number of lakes/reservoirs and limited to a relatively short time period [7].
Recently, DEM data has been applied to estimate water storage change since it includes bathymetric information. A geo-statistical approach refers to developing a statistical model based on topographic variables. To estimate water storage change, the general idea of DEM-based Geo-statistical methods is extracting water area and level from DEM to develop hypsometric relationships and calculating the corresponding water level and area based on hypsometric functions. Utilizing DEM information to assess water storage changes is becoming a hot topic in current research. For example, Bonnema and Hossain evaluated water storage change for 20 reservoirs in the Mekong River Basin [20], Pan et al. estimated water level for Lake Champlain [21], Gao and Zhang analyzed water storage for a total of 27 reservoirs in South Asia based on MODIS and DEM [11], and Yang et al. applied DEM-based method to 114 lakes on the Tibetan Plateau [13]. The DEM-based approach has provided an opportunity to assess water storage change even in ungagged regions with finite data availability.
1.4. The Objective and Research Content of This Study
The overarching goal of this study is to develop advanced methodology that can further extend the spatial and temporal scales of water storage change assessment and reveal the spatio-temporal patterns of water storage change in China’s lakes and reservoirs. Google Earth Engine (GEE), as a cloud-based platform, provides parallel computation for large amounts of freely available geospatial data and novel and robust computation algorithms for planetary-scale analyses [22]. The revolution in geospatial data availability and computational power can greatly facilitate the assessment of water storage change at large spatiotemporal scales [23,24]. Based on the GEE platform, combining geo-statistical models, our study integrated global surface water (GSW) dataset and SRTM digital elevation models (SRTM-DEM), both available from GEE platform at a spatial resolution of 30 m, in order to determine the spatiotemporal patterns of water storage changes across China at an annual timescale. This study spans more than 30 years on a time scale (1984–2015) and evaluates 760 lakes and reservoirs in mainland China, each with an area greater than 10 km2, with a total area accounting for about 80% of the total water surface area. Therefore, their water storage changes can well represent the temporal and spatial variation characteristics of all waterbodies in China. Our study uncovered the spatiotemporal characteristics of water storage change in China’s lakes and reservoirs and also demonstrated the advantage of combining Landsat derived products, DEM, and GEE to support water resources assessment, which is especially needed in ungagged regions.
2. Materials and Methods
2.1. Materials
The Global Surface Water (GSW) [25] and Shuttle Radar Topography Mission digital elevation (SRTM-DEM) are the two major supporting data of this study. GSW were generated using 3,066,102 scenes from Landsat 5, 7, and 8 acquired between 16 March 1984 and 10 October 2015 and contain information on the spatial location and temporal distribution of surface water, serving as a good basis for dynamic analysis on water coverage [25]. Here, we mainly used three data types from GSW, including (1) GSW monthly water coverage; (2) GSW max-extent; and (3) GSW water occurrence. GSW monthly water coverage data provide global monthly water coverage data, with each pixel individually classified into water, non-water, and no data. Note that GSW classified as no data the contaminated pixels (due to snow, ice, cloud, terrain shadow, and sensor-related issues including the scan line corrector failure) and did not distinguish lakes and reservoirs from other open water bodies including rivers, wetlands, and inundated floodplains. Derived based on the statistics of these monthly water coverage images, GSW max-extent data are available as binary images containing a value of 1 anywhere water has ever been detected, and GSW water occurrence data indicate the frequency that water was present in the pixel (ranging between 0 and 100), during the 32-year period. SRTM-DEM data (Version 3.0) was provided by NASA Jet Propulsion Laboratory (JPL) and offers digital elevation models collected during February 2000 on a near-global scale, which has undergone a void-filling process using open-source data (ASTER GDEM2, GMTED2010, and NED).
HydroLAKES data [26] provides the shoreline polygons of all global lakes and reservoirs with a surface area of at least 0.1 km2 and was developed by compiling multiple datasets including SRTM Water Body Data (SWBD), Global Lakes and Wetlands Database (GLWD), and Global Reservoir and Dam database (GRanD), which was used here to select lakes and reservoirs of analysis and to determine their geographical extent. The Remote sensing monitoring data of land use in China were obtained from Resource and Environment Data Cloud Platform in the Data Center for Resources and Environmental Sciences, which included land use information at the resolution of 1 km and was applied here to aid the selection of lakes and reservoirs. River shapefile was obtained from China’s ecosystem assessment and ecological security pattern database and was used here to identify the connectivity of lakes and reservoirs to rivers and to determine the buffer distance of lakes and reservoirs. The China Lake dataset provides the boundary shapefile of lakes (1:250,000) based on the first lake investigation in China during the 1960s and was from the Lake-Watershed Science Data Center of National Earth System Science Data Sharing Infrastructure. Water level data from the Hydroweb dataset was created by LEGOS (Laboratoire d’Etude en Ge´ophysique et Oce´anographie Spatiale) in 2003 and was derived based on satellite altimetry [4], which was used for the verification. The relevant information of the dataset used in this study are listed in Table 1.
2.2. Methods
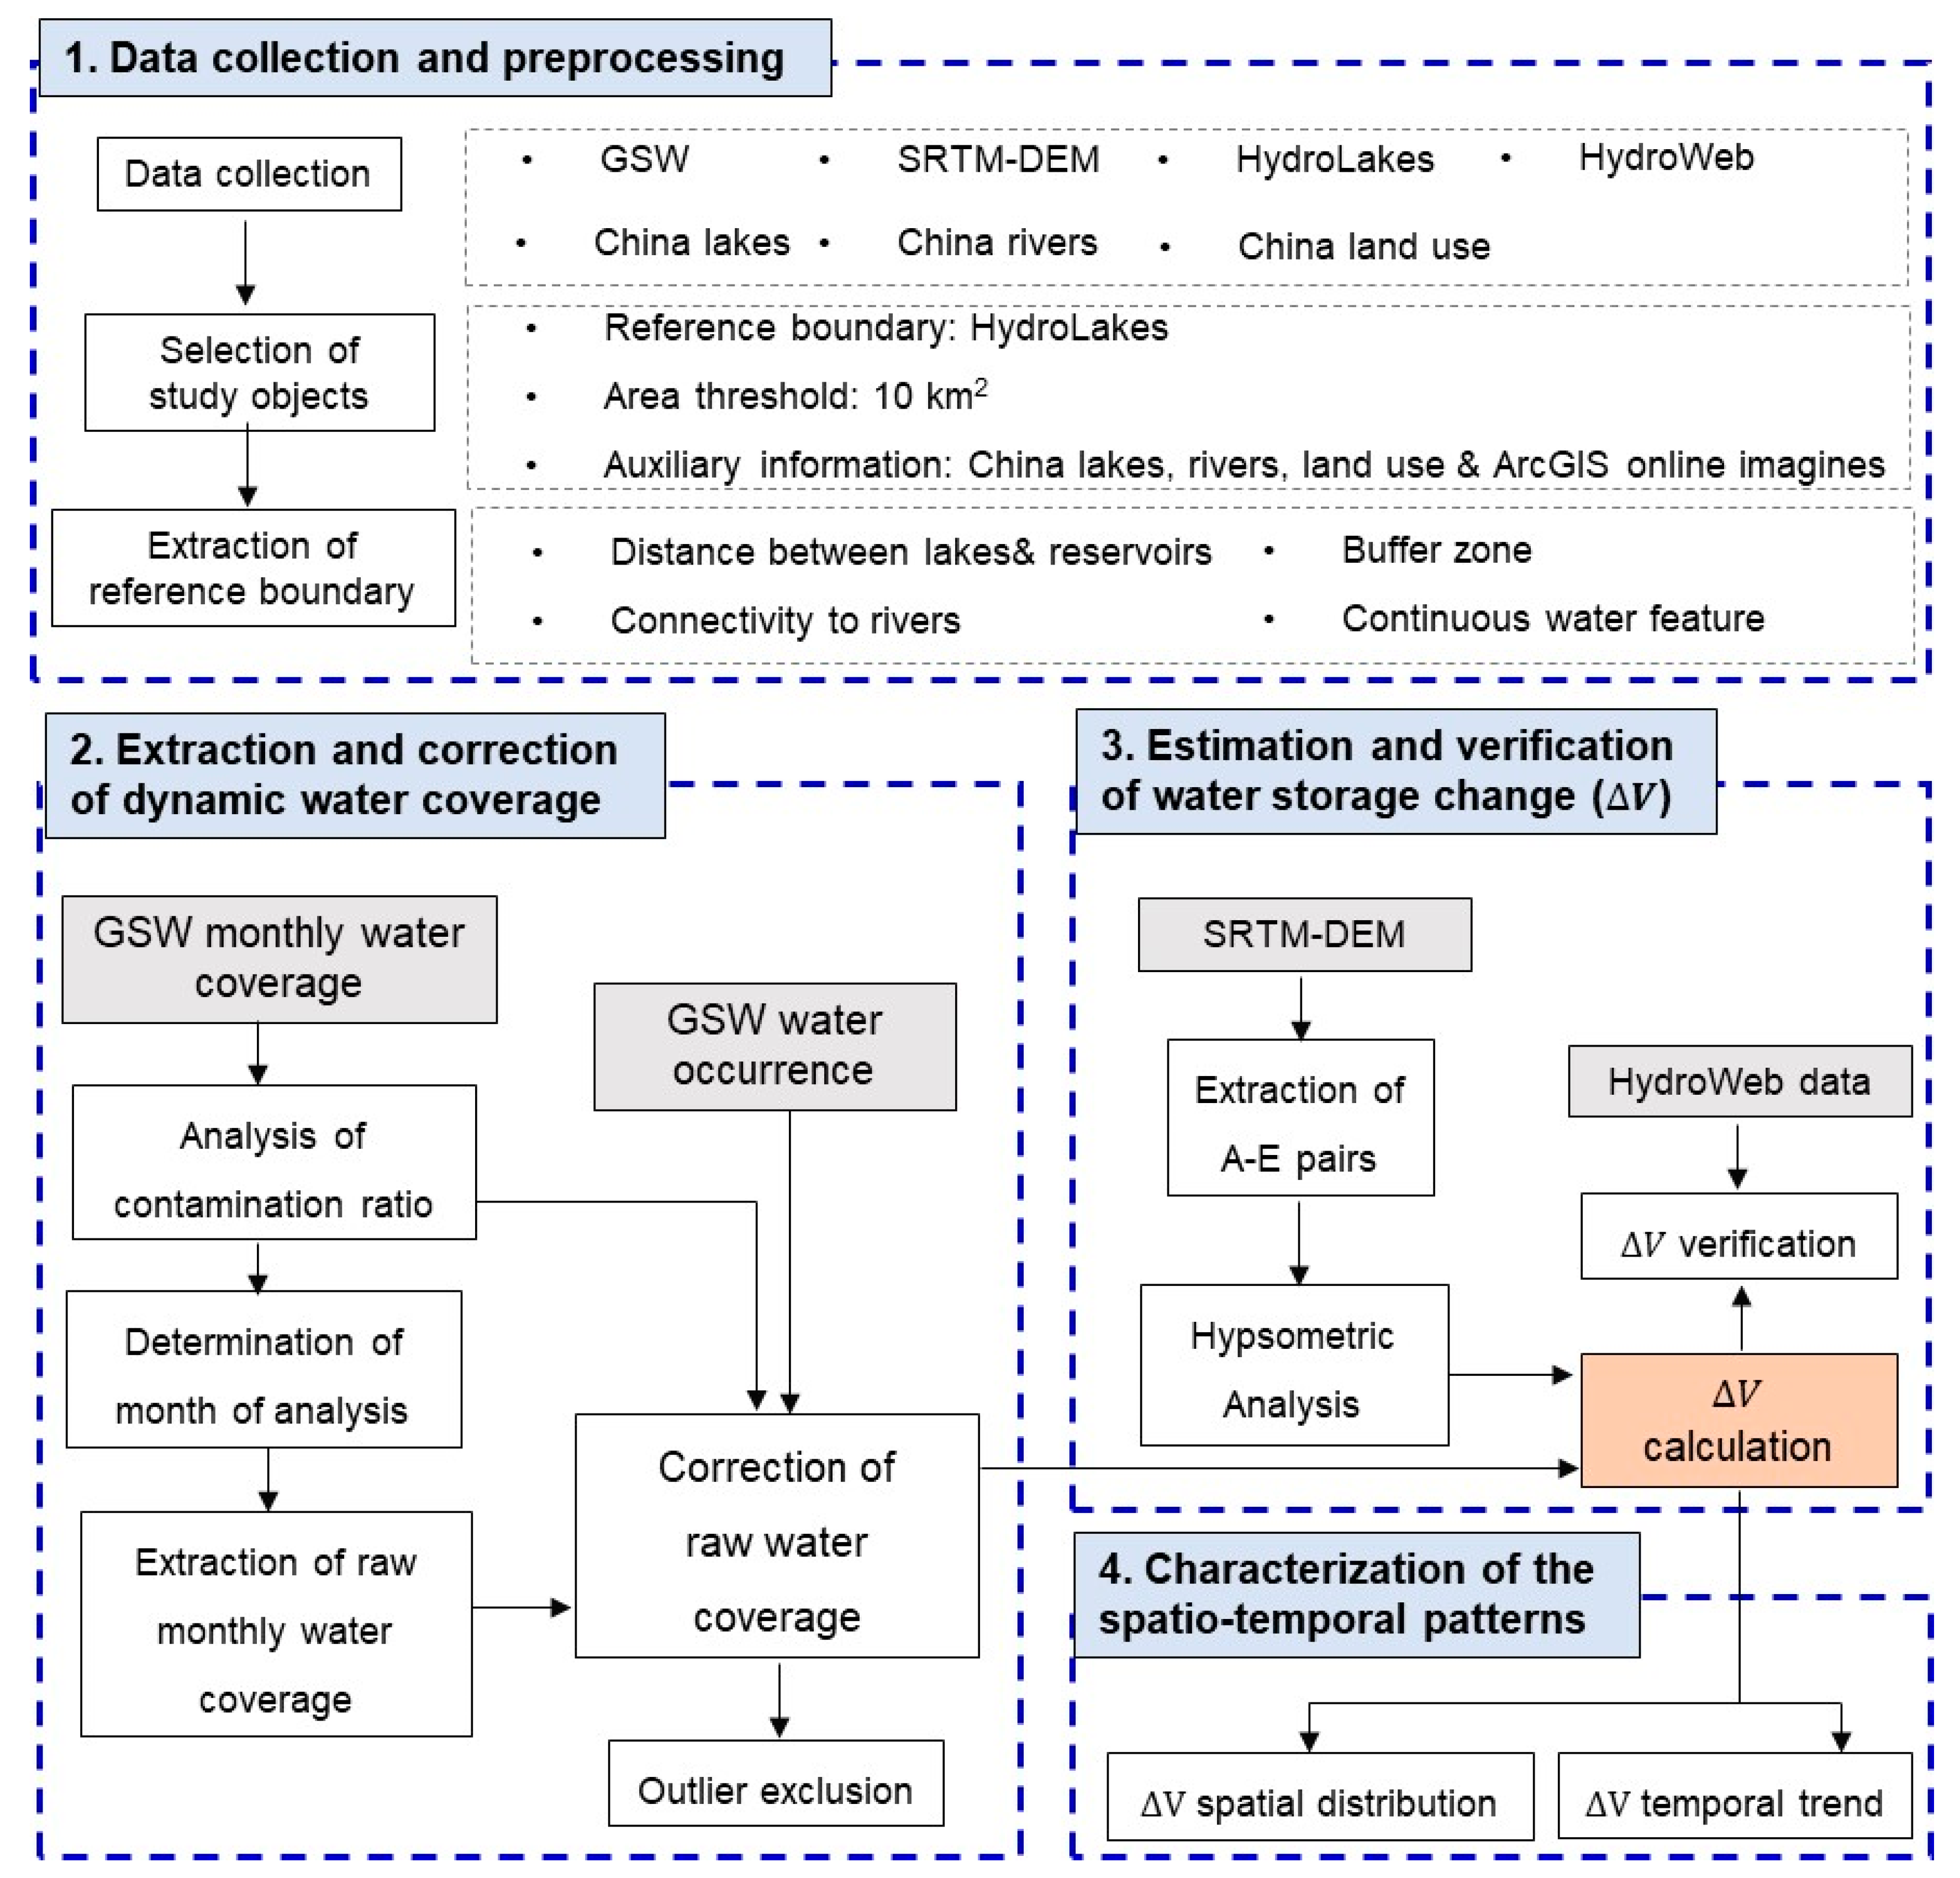
Based on the GEE platform, combined with multi-source remote sensing data and geo-statistical models, this study evaluated water storage change for China’s lakes and reservoirs during the last 30 years. The flowchart of the methodology is illustrated in Figure 1. Our data processing was implemented using ArcGIS (for data preprocessing), GEE (for extraction and correction of water coverage, and also extraction of – pairs), and R software (for statistical analysis on contamination ratios, hypsometric analysis, identification of spatio-temporal patterns, and plots- making). The explicit methods are introduced below.
2.2.1. Selection of Study Objects and Extraction of Reference Boundary
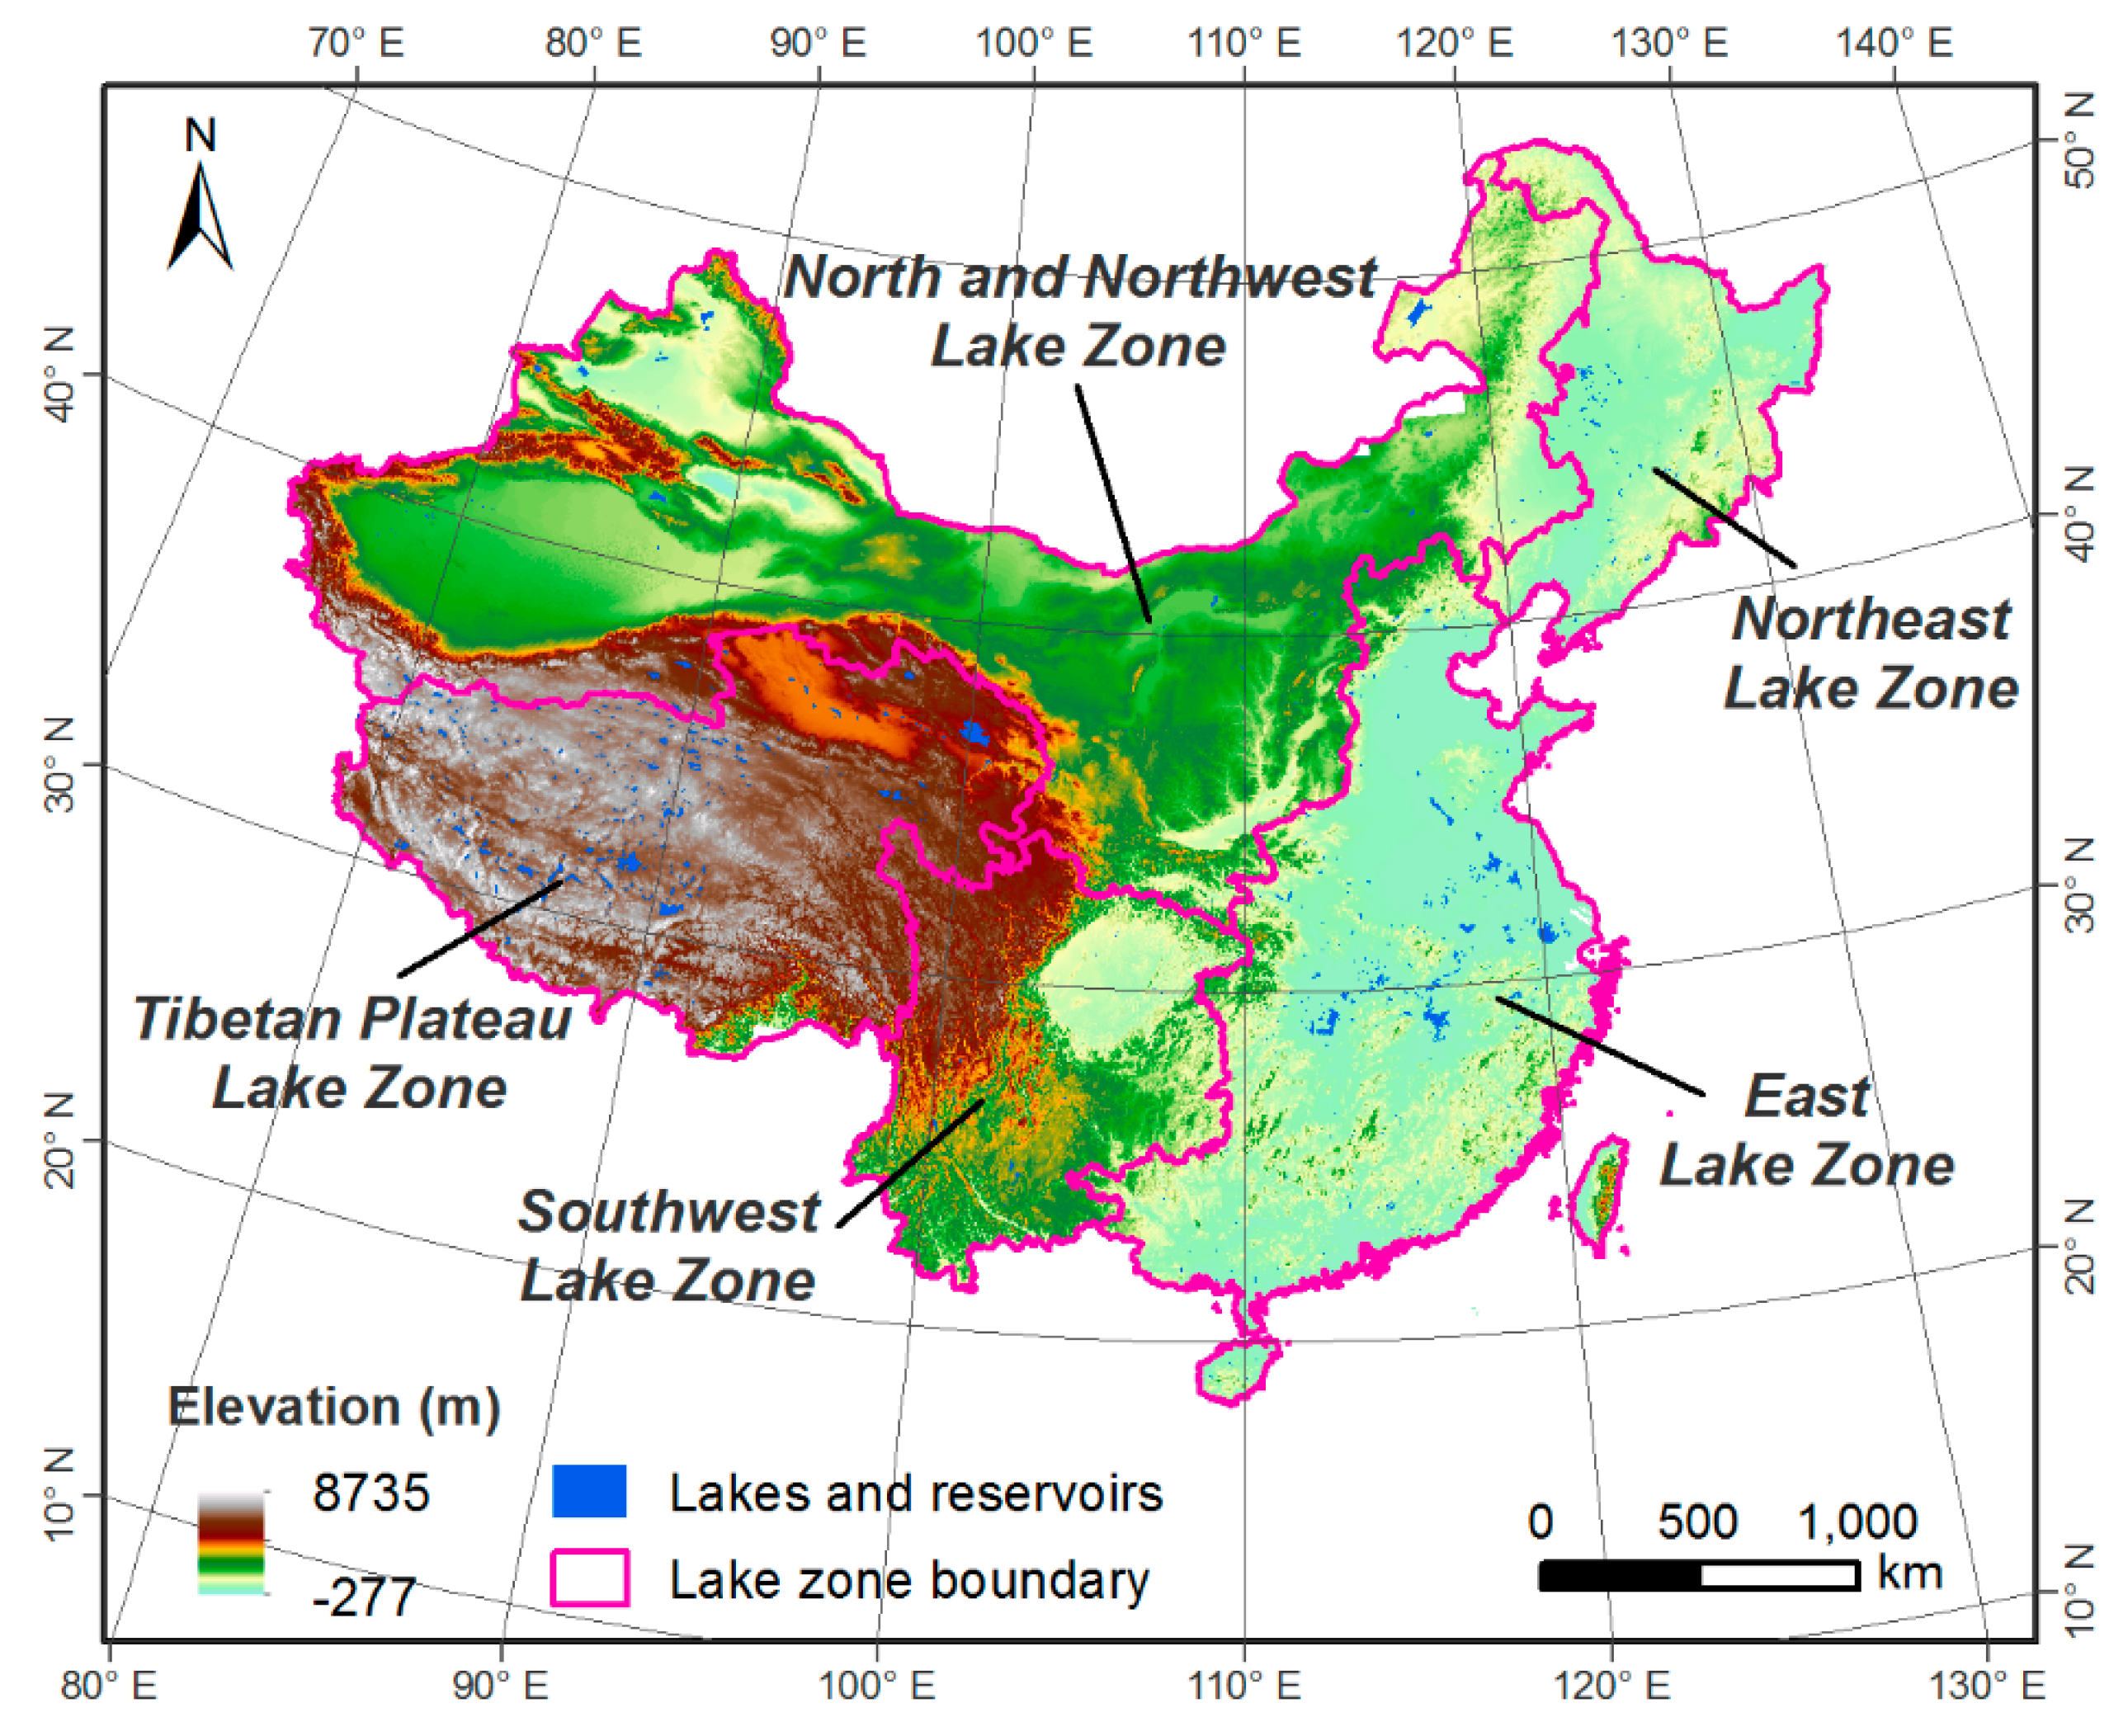
HydroLAKES data was adopted as the reference boundary for lakes and reservoirs in our study, considering its comprehensiveness [26]. A total of 829 large lakes and reservoirs in mainland China were selected from HydroLAKES based on the water surface area threshold of 10 km2 (Figure 2). However, some existing issues of the HydroLAKES data identified from our pilot study could inevitably affect the dynamic analysis and thus require further modification. Due to the misclassification of paddy fields into water bodies in HydroLAKES data, we applied 1-km land use raster data (for the years of 1990 and 2015) and counted the numbers of pixels within each lake/reservoir classified as a water feature. Lakes and reservoirs containing zero water pixels for either of the two time points were removed from our selection. Considering the geographical displacement of some lakes and reservoirs, we compared lakes/reservoirs from the HydroLAKES dataset with ArcGIS online images and the China Lake dataset (1960s). Some manual modification was required to correct the displacement of water bodies.
In addition, HydroLAKES data provides snapshots of shoreline polygons of lakes and reservoirs during observation and thus lacks dynamic information. The boundaries of lakes and reservoirs advance and retreat in response to hydroclimatic conditions. Directly using HydroLAKES as a reference boundary can result in underestimation of water area in wet seasons when analyzing dynamics of water bodies, especially when the lakes/reservoirs were originally observed during dry seasons. Therefore, we constructed outward buffer zones around individual lakes and reservoirs, with the buffer distances determined according to both the nearest distance from them to their closest lakes or reservoirs and their connectivity to rivers. The goal was to develop appropriate buffer zones large enough to include the potential expansions of water area in the study period, but also not too large to mix with the water area in river courses. For each lake/reservoir, we extracted the continuous water feature with the largest area from the GSW max-extent data within the buffer zone and considered it the reference boundary for dynamic analysis. The continuous water feature was formed from the water pixels with four-connected neighbors. The extracted reference boundaries were considered as the maximum shoreline boundaries for lakes and reservoirs and the dynamic patterns of lakes and reservoirs were thus included within the reference boundaries.
2.2.2. Extraction and Correction of Dynamic Water Coverage
As mentioned above, GSW data included some unrecognized no data grids due to contamination from clouds, snow, ice, and terrain shadows. These contaminations could lead to significant underestimation of water area if left without any treatment, especially for regions with frequent cloud cover. Both the water surface area and the effect of such contaminations change with climatic conditions, presenting monthly variation. Within the reference boundaries of individual lakes and reservoirs, we extracted the raw GSW monthly water coverage (1985–2015) and calculated the ratio of no data pixel count to the total pixel count (defined here as contamination ratio) for each month in each year. We determined the months of analysis by selecting the months with the lowest contamination ratio, in order to minimize the effect of contaminated pixels on the long-term dynamic assessment.
Additionally, we combined GSW water occurrence data with the raw GSW monthly water coverage data and applied recently developed algorithm to automatically repair the contaminated no data pixels [28]. The correction of the raw monthly water coverage assumed that the contaminated pixels should be covered by water if the uncontaminated ones with the same water occurrence values as the contaminated pixels were classified as water. We adopted the same empirical weighting factor as Zhao and Gao [28] but applied the algorithm to all pixels in the water bodies with contamination ratio smaller than or equal to 0.95 to guarantee a consistent correction effect. The images for lakes and reservoirs with a contamination ratio larger than 0.95 were discarded from analysis. The enhanced monthly water coverage data can therefore provide a more accurate and continuous estimation on water level and water storage change for China’s lakes and reservoirs. Note, for enhanced monthly water coverage data, data points more than 1.5 interquartile ranges below the first quartile or above the third quartile were considered outliers and excluded from analyses.
2.2.3. Estimation and Verification of Water Storage Change
SRTM-DEM data at the resolution of 30 m provides valuable bathymetric information for inferring water storage changes. Our DEM-based Geo-statistical method used elevation as the major predictor variable and applied regression equations of four different types to construct hypsometric relationships. Specifically, we employed SRTM-DEM data to extract the values of elevation () within the reference boundary and the corresponding area () when water reaches the elevation for each lake and reservoir. Four different curves, including linear, power law, segmented linear, and quadratic polynomial relationships, were applied to fit the – pairs and the relationship with the highest R2 among the four was selected as the hypsometric function between water area and elevation. Our geo-statistic approach constructed a unique hypsometric function, and derived specific regression coefficients, for each lake and reservoir, which thus can better represent the bathymetry.
Based on the enhanced monthly water coverage during the study period, the corresponding elevation values were calculated according to the derived hypsometric function for each lake and reservoir. The relative water storage change compared to the first year were estimated by integrating the hypsometric relationships (Equation (1)).
where, indicates the first year of analysis, t indicates the specific year of analysis, refers to elevation, and denote the elevation values for the corresponding years, and ∆V represents the relative water storage change from to . Note are varied for different lakes and reservoirs based on the availability and contamination condition of images.
The dynamic water level data from Hydroweb were available for a total of 30 lakes in mainland China. We compared the water level data from Hydroweb with our estimated elevation values for the 30 lakes, and also compared the temporal trends of the two data, indicated by the slopes of the linear regressions, considering the varied base levels of elevation.
2.2.4. Characterization of the Spatio-Temporal Patterns of Water Storage Change
The annual water storage change was estimated for all lakes and reservoirs with a surface area larger than 10 km2 during the period of 1984–2015. Temporally, the Mann-Kendall non-parametric trend test (M–K test) was employed here to analyze the temporal trend of ∆V. For lakes and reservoirs with significant temporal trend at the level of 0.1, linear curve was fitted to the annual ∆V and slope (m) was calculated to represent the changing rate of ∆V. While for lakes and reservoirs without significant trends, quadratic polynomial curve was fitted and the coefficient of the 2nd degree term (a) was used to identify the temporal trend.
Spatially, considering the climatic and topographic variation across China, we analyzed the spatial distribution characteristics of ∆V in the lakes and reservoirs by region. Previous regionalization of lake zones by Ma [27] was adopted, which divided China into five lake zones, including (1) the Northeast Lake Zone (NELZ), (2) the North and Northwest Lake Zone (NNWLZ), (3) the East Lake Zone (ELZ), (4) the Southwest Lake Zone (SWLZ), and (5) the Tibetan Plateau Lake Zone (TPLZ).
3. Results
3.1. Extraction and Correction of Dynamic Water Coverage
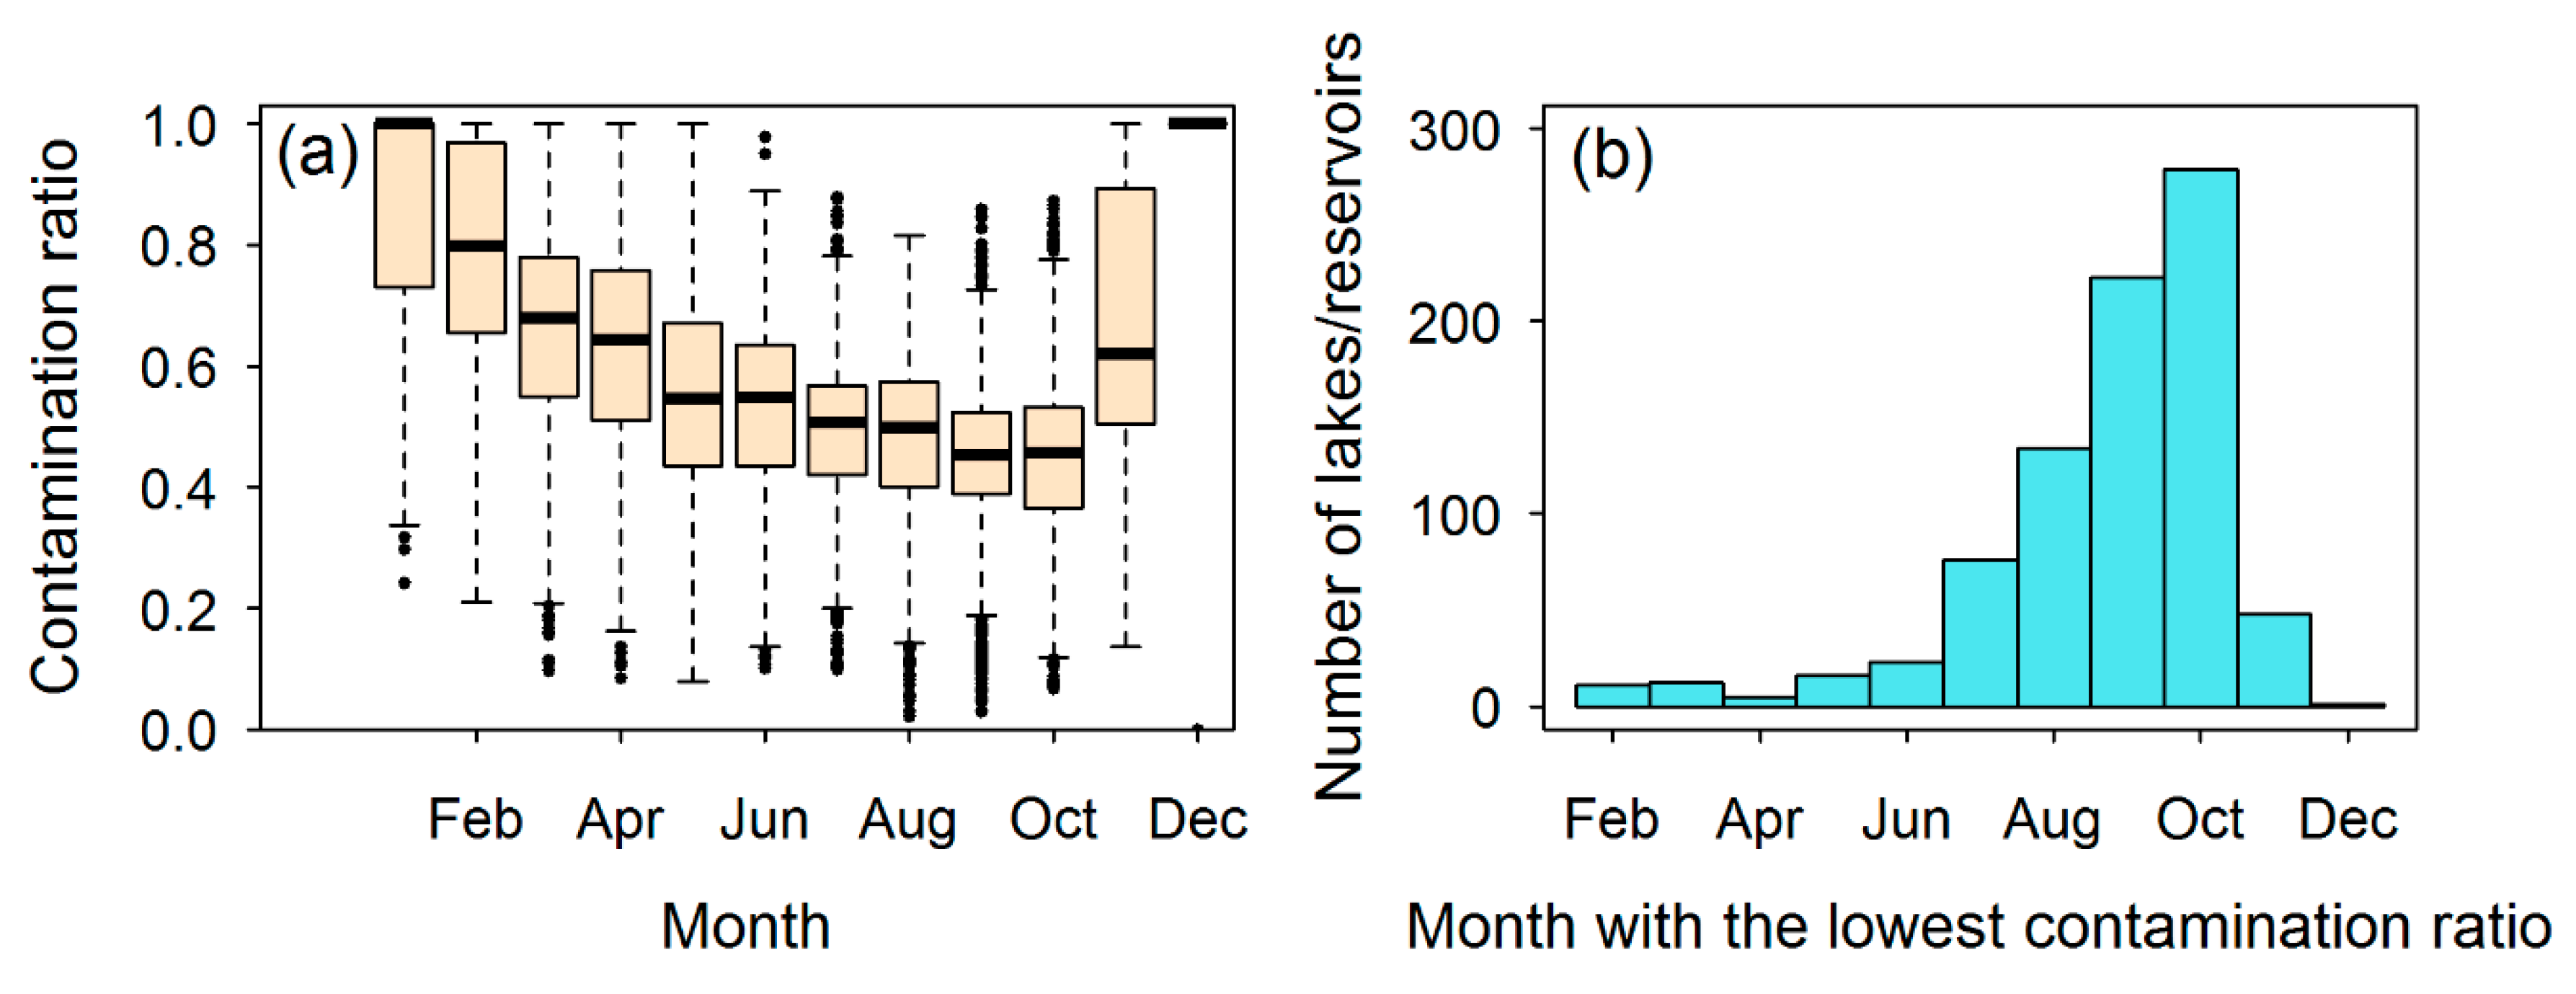
Due to multiple-source contaminations, raw water coverage data can result in significant underestimation of water area and lead to inaccurate dynamic trends. The extraction of raw water coverage was therefore conducted during the months with low contamination ratio. Based on the boxplots (Figure 3a) of the contamination ratio of 829 lakes and reservoirs by month (1984–2015), September was found to have the lowest mean contamination ratio (0.44), closely followed by October (0.45) and then August (0.47). Also, these three months were found to present the lowest contamination ratio for the majority of lakes and reservoirs (134, 223, and 279 for August, September, and October, Figure 3b). Therefore, the months of analysis here were determined as August-October, and the average water area for the three months (after excluding the month with contamination ratio larger than 0.4) was used to represent the yearly water area.
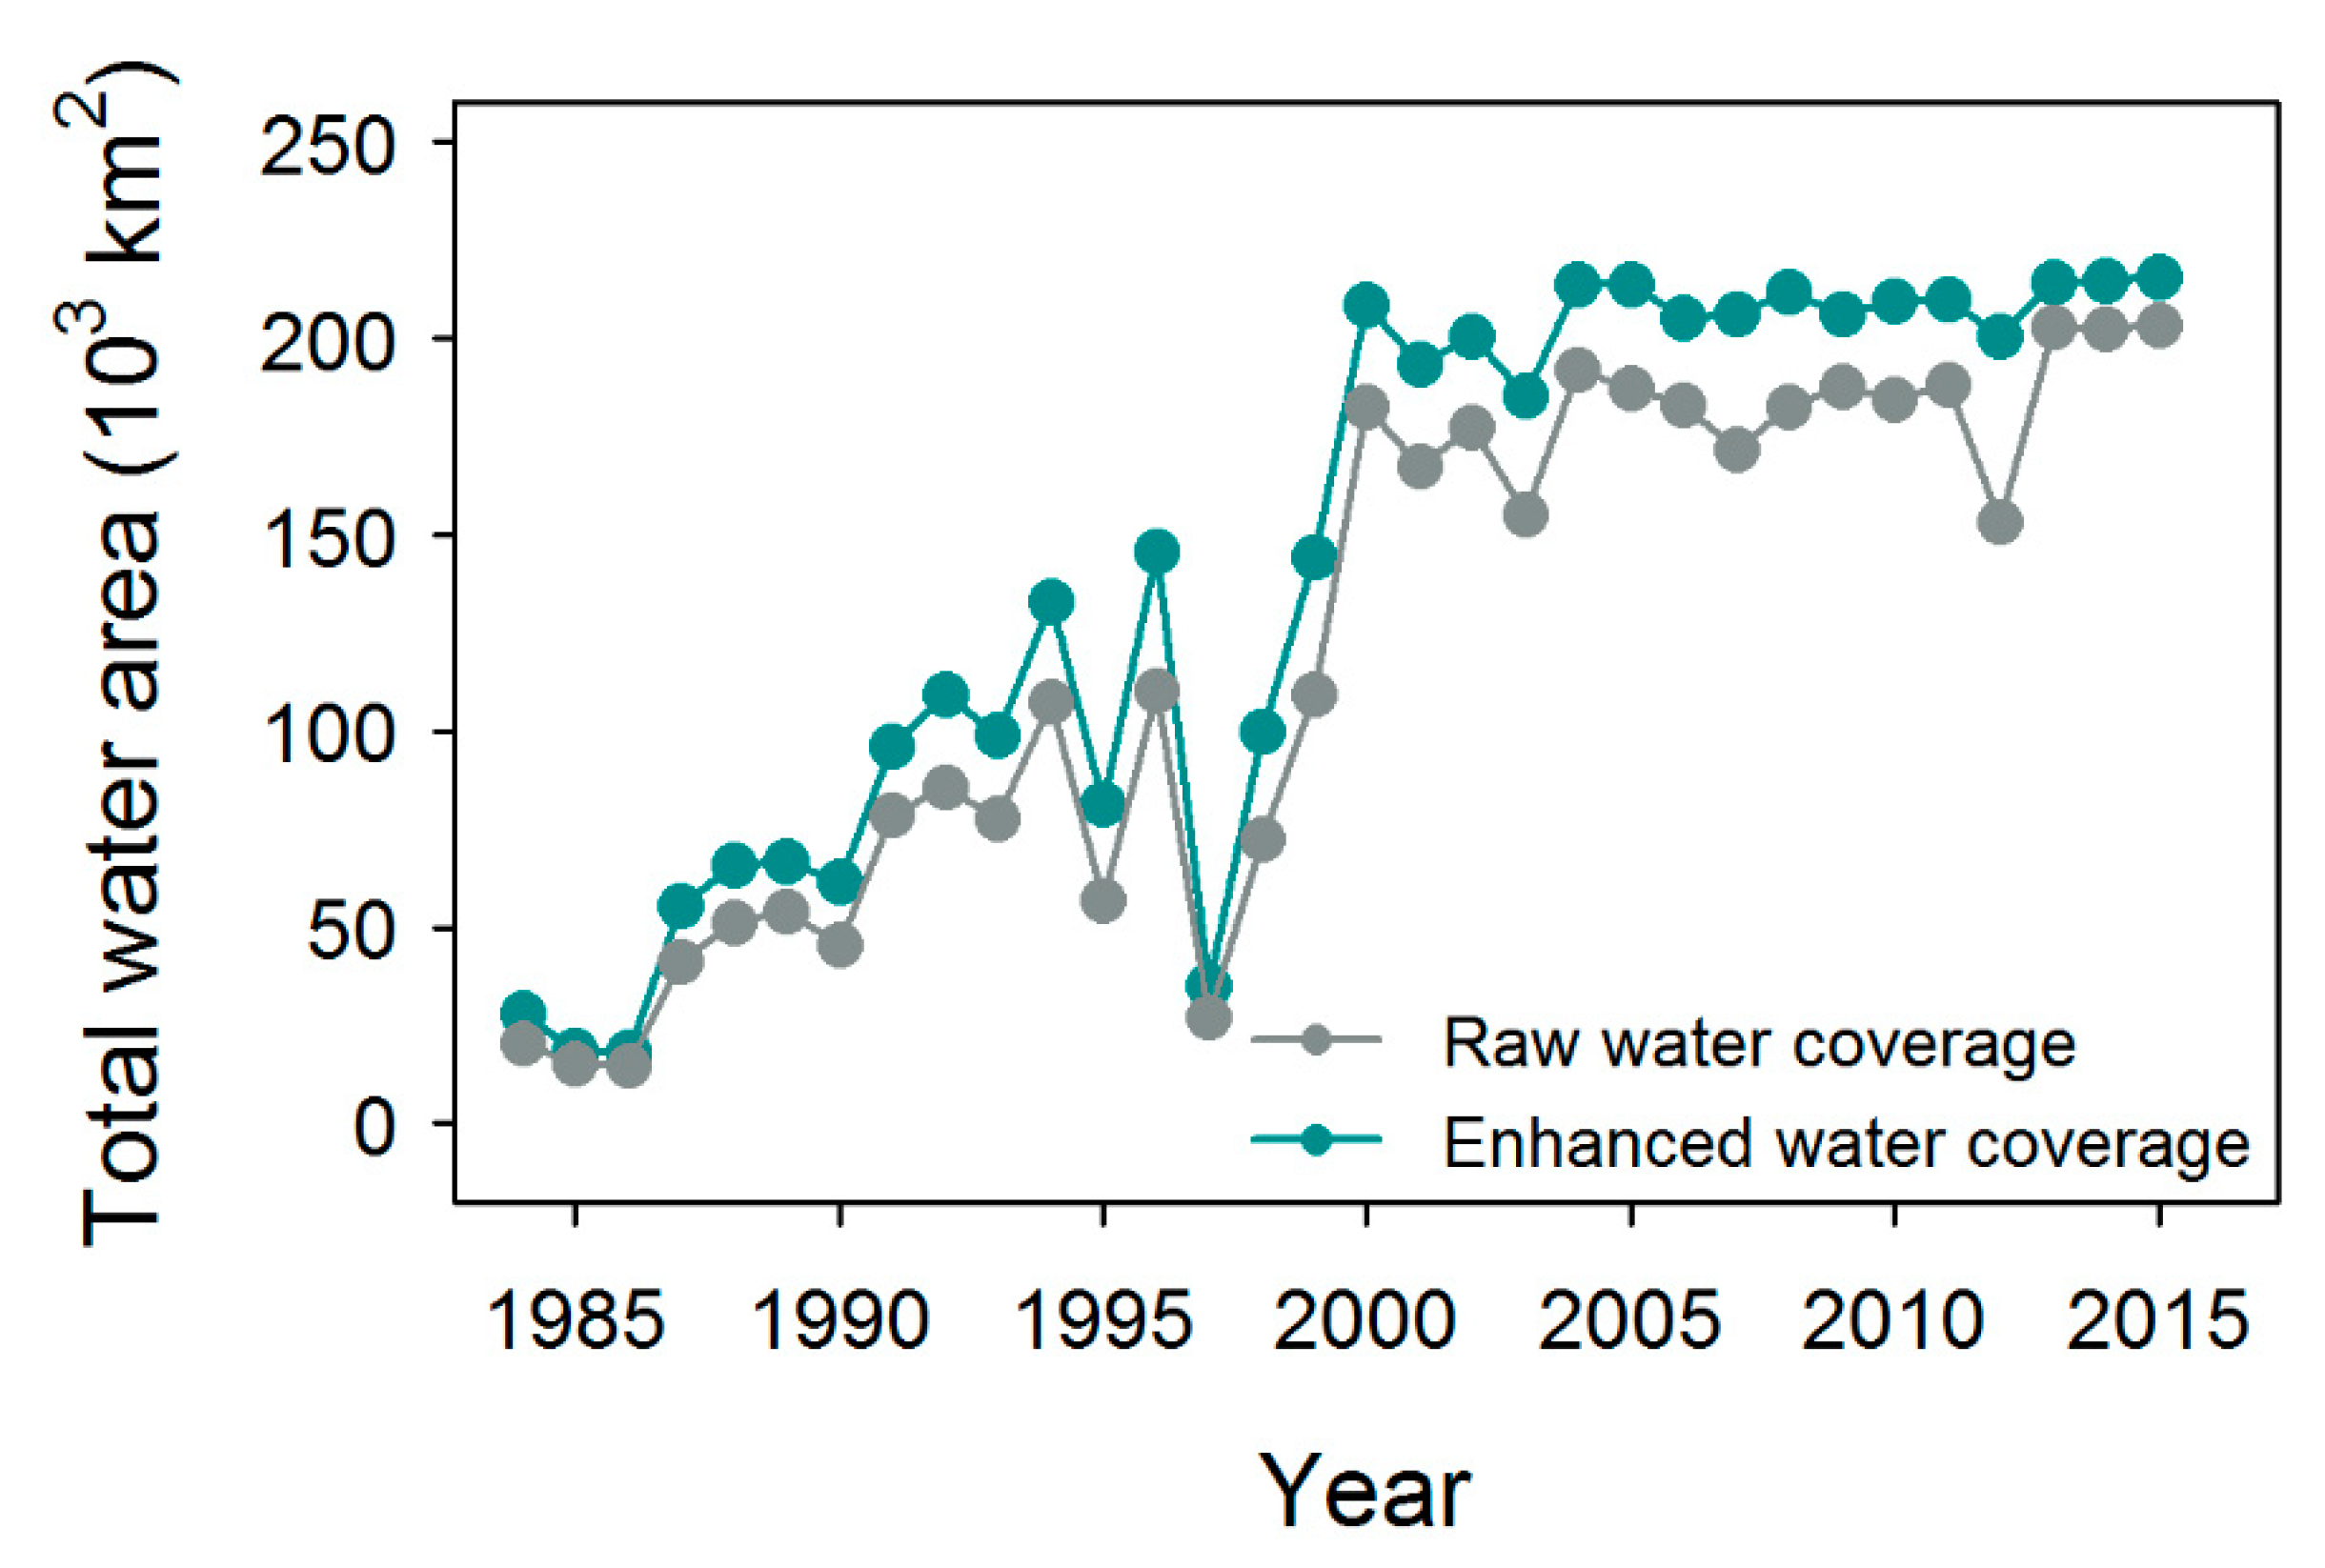
The application of the automatic correction on the raw water coverage greatly improved the estimation of water area as seen from Figure 4. By comparing the total water area from August to October over time between the raw and the enhanced water coverage for the 829 lakes and reservoirs, it was demonstrated that obvious underestimation of total water area existed from the raw water coverage. The increase on water area from the raw water coverage to the enhanced water coverage was found to be averaged at 21.18 × 10³ km2, ranging between 3.0 × 10³ km2 in 1986 to 47.0 × 10³ km2 in 2012. Also, similar to the increasing trend found on the total surface area of global reservoirs in the previous study [28], the total water area for lakes and reservoirs in China also presented an increasing trend, which was mainly contributed to the improved data coverage over time, especially with the launch of Landsat 7 in 1999 [25] (More details could be found from ref 25).
3.2. Hypsometric Analysis and Validation of Estimated Elevation
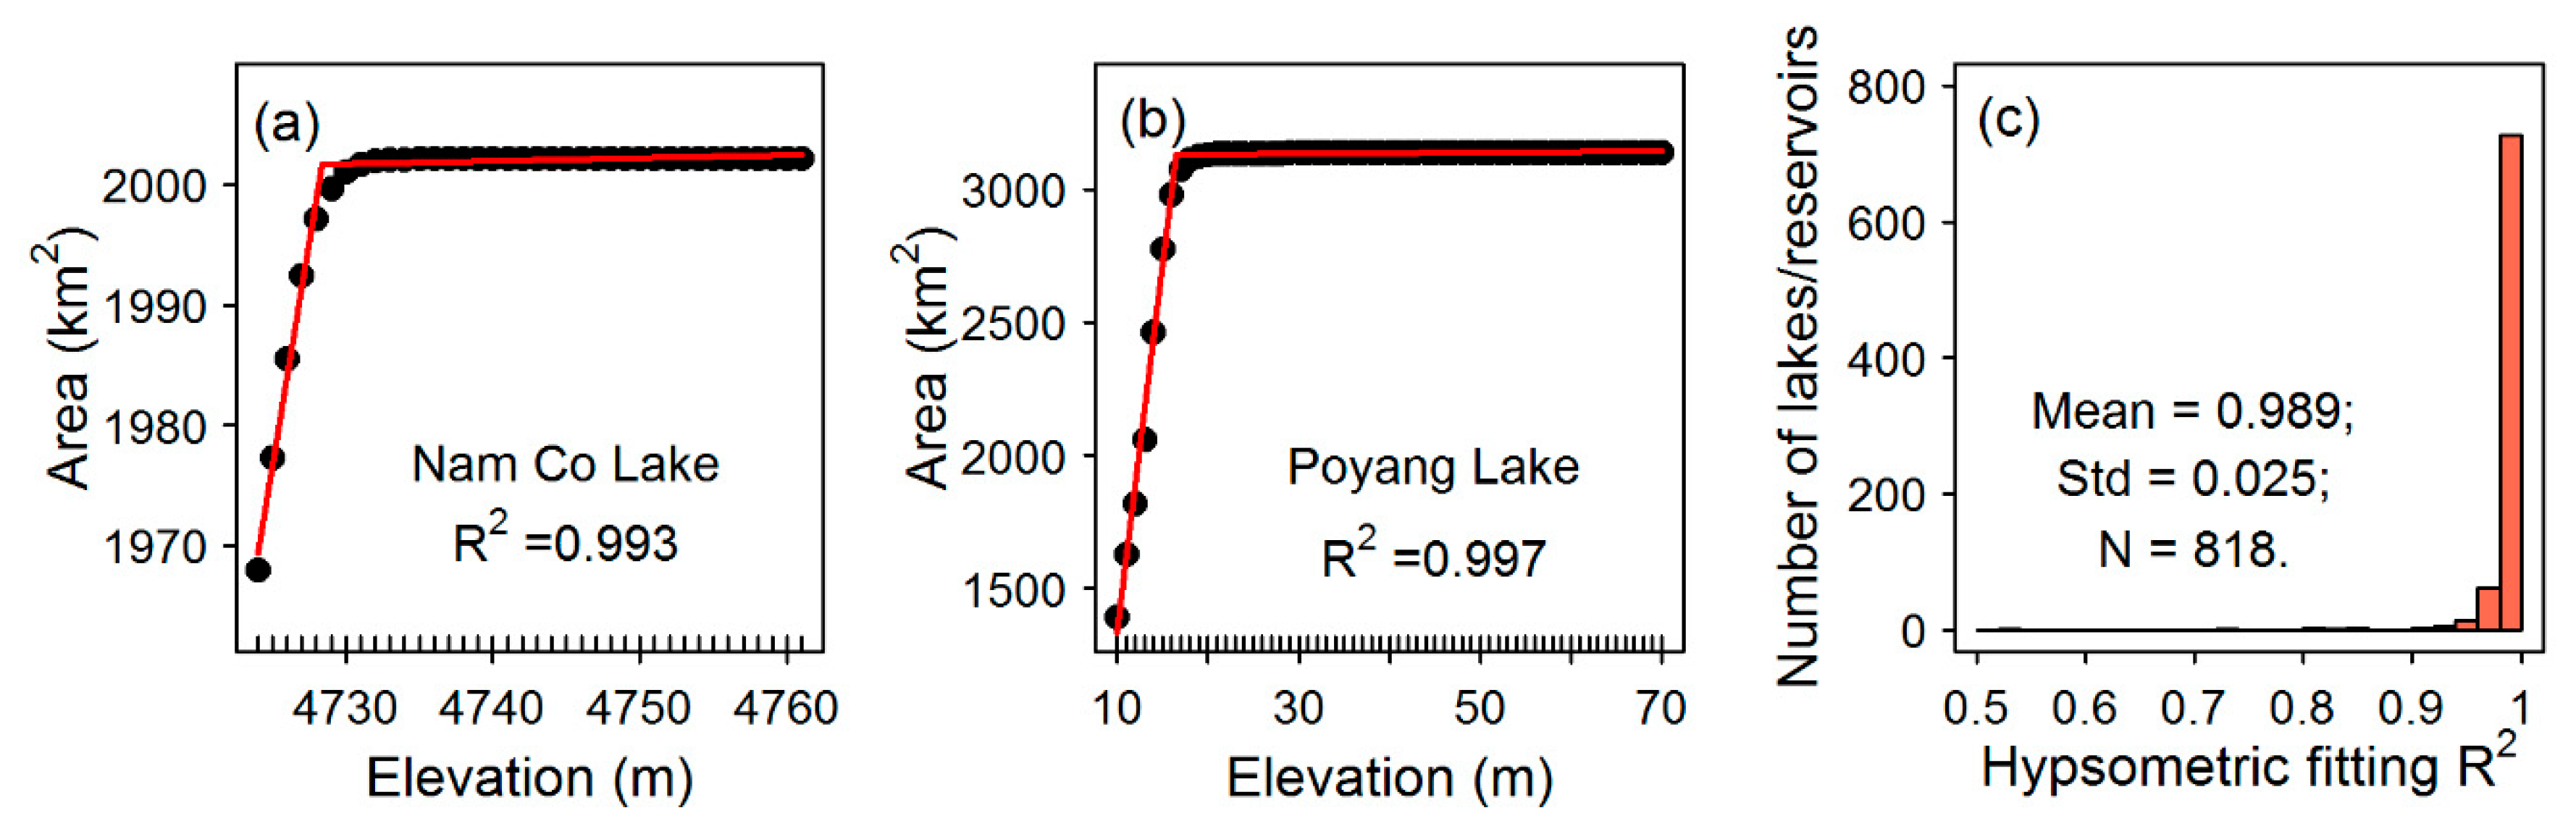
Four different function forms were used to fit the – pairs derived based on SRTM-DEM data. For each lake/reservoir, the relationship with the highest R2 among the four was selected as the hypsometric function. Two large lakes, the Poyang lake (with an area of 3197.9 km2) in ELZ and Nam Co lake (2004.0 km2) in TPLZ, were used here as examples to show the developed hypsometric functions (Figure 5a,b). Both of the two hypsometric functions were fitted using segmented linear relationships, and their fitting R2 were both larger than 0.990. Furthermore, nine other lakes and reservoirs across China with different sizes, ranging from 11.1 km2 to 1575.4 km2, were also included to demonstrate the good fitting of hypsometric relationships (R2 > 0.980) regardless of their diverse sizes (Figures S1 and S2). For the 818 lakes and reservoirs in China of hypsometric analysis, 770 waterbodies were found to hold segmented linear relationships, 47 in quadratic polynomial relationship, and 1 in power law function. Histogram of the R2 for hypsometric functions demonstrated good fitting, with a mean value of 0.989 and standard deviation of 0.025 (Figure 5c).
Water storage change was estimated using the information on the changes of water area and elevation. Dynamic water area values were extracted from GSW data, while elevation values were estimated according to the derived hypsometric functions. Note that extrapolation of hypsometric function was necessary when water surface is below the minimum water surface at the time of the SRTM-DEM observation, February 2000. For example, elevation values were calculated based on the extrapolated hypsometric function for three years (1988, 1991, and 1994) among the 25 years of analysis for Nam Co Lake. However, such extrapolation caused limited effect on our estimation, since 65% of data points in our analysis were associated with elevation values larger than the minimum elevation of the water when collecting SRTM-DEM data in February 2000, and the average extrapolation ratio for all lakes was 34% (e.g. 12% for Nam Co and 0% for Poyang lake).
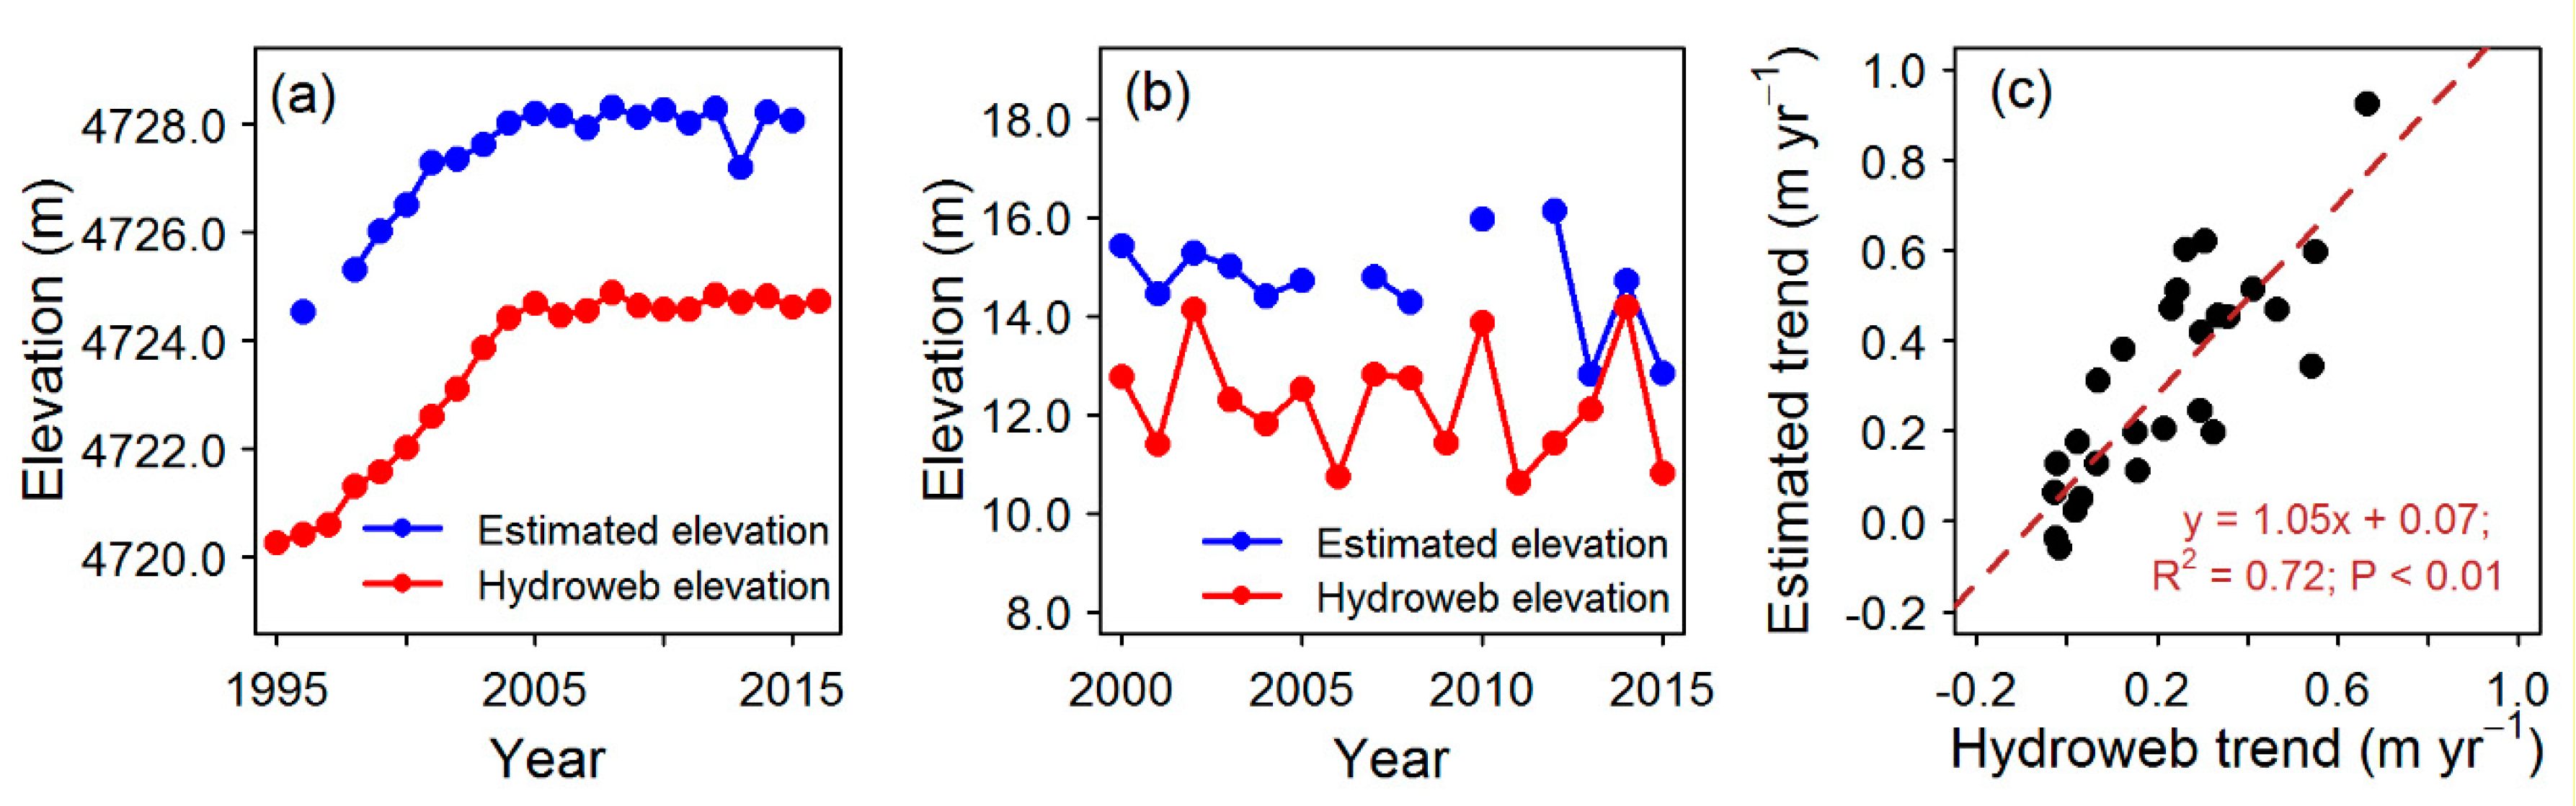
The validation of our results was focused on elevation. Water level data for a total of 30 lakes across China from Hydroweb were used for validation. Nam Co and Poyang lakes were again used to show the comparison of the temporal trends between estimated elevation and Hydroweb water level (Figure 6a,b). Due to the varied base levels of elevation, a deviation of elevation of about 4.0 m was observed for both lakes; however, the general trends were found to be similar, especially for Nam Co Lake, the Root Mean Square Error of which was calculated as 0.6 m after removing an elevation deviation of 4.0 m. Furthermore, the temporal trend for our estimated elevation values were compared to the trend for Hydroweb water level data during August-October, which indicated generally good consistency (slope = 1.05) and fitting (R2 = 0.72, Figure 6c).
3.3. Spatio-Temporal Patterns of Water Storage Change
Water storage change was estimated for 760 lakes and reservoirs with water area record of more than 10 years after removing outliers. Among the five lake zones, TPLZ included the largest number of lakes and reservoirs (311), followed by ELZ (233), NNWLZ (103), NELZ (80), and SWLZ (30). The remaining three lakes/reservoirs were interacted with multiple lake zones (Table 2.).
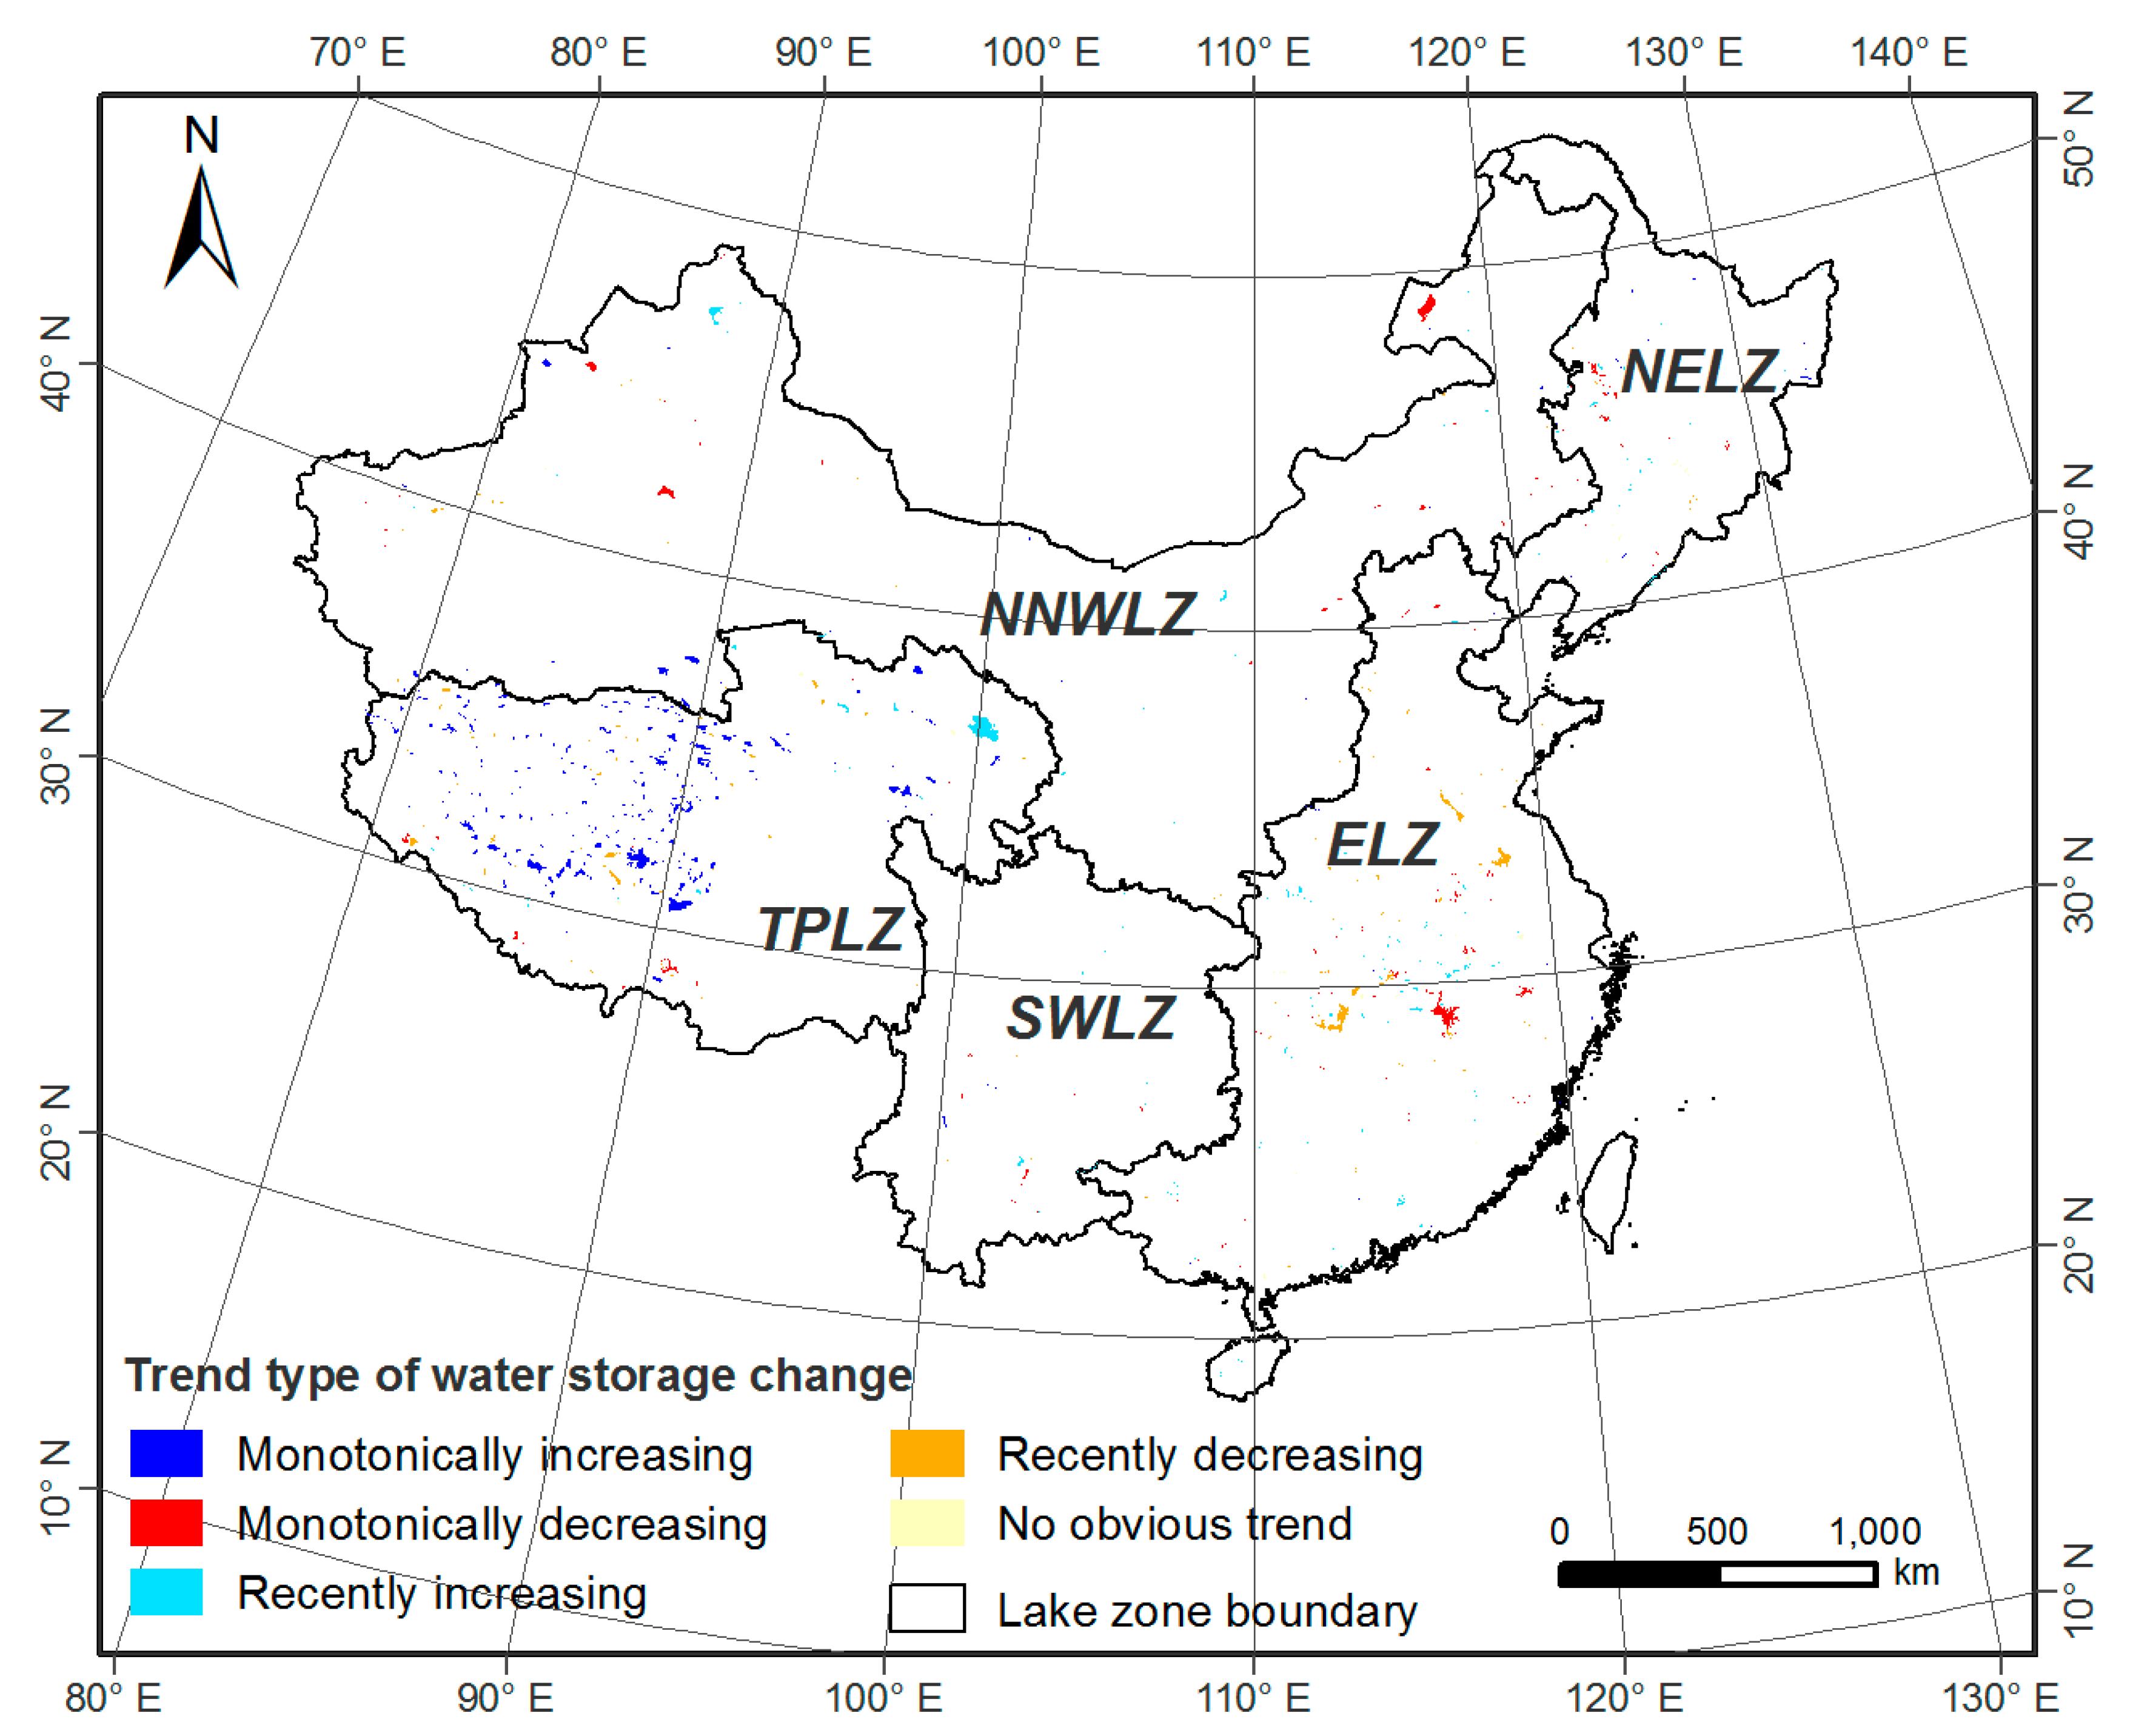
Based on the results of the M-K test and the linear/polynomial regressions on the temporal changes of , we identified five trend types of : (1) Monotonically increasing (MI), (2) Monotonically decreasing (MD), (3) Recently increasing (RI), (4) Recently decreasing (RD), and (5) No obvious trend (NT). Among them, the first two types were both associated with significant results on M-K test (p < 0.1) but with varied signs on the slope of linear regression (m > 0 for type MI and m < 0 for type MD). M–K tests were not significant for the last three types. When the extreme point identified from the polynomial regression was within the range of study period, we classified it as RI if the coefficient of the 2nd degree term a > 0 and regarded it as RD if a < 0. When the extreme point was outside of the study period, we classified it as NT. By trend type, lakes and reservoirs of MI type were mostly found in TPLZ, which accounted for 80.9% of all water bodies of MI type, while the majority of lakes and reservoirs of the other four types were all found in ELZ, 45.9% for MD, 46.2% for RI, 41.9% for RD, and 56.8% for NT.
By lake zone, the dominant trend type for TPLZ was found to be MI, with 224 of the 311 lakes and reservoirs classified as MI (67.7 %). No obvious dominant trend type was found for the remaining four lake zones. In NNWLZ, water storage was found to have decreased for most lakes and reservoirs, with MD and RD accounting for 29.1% and 26.2%. In NELZ and SWLZ, the major trend types were RI and MD. And in ELZ, the major three trend types, RI, RD, and MD, were identified for 30.9%, 27.9%, and 26.6% of all lakes and reservoirs (Table 2 and Figure 7).
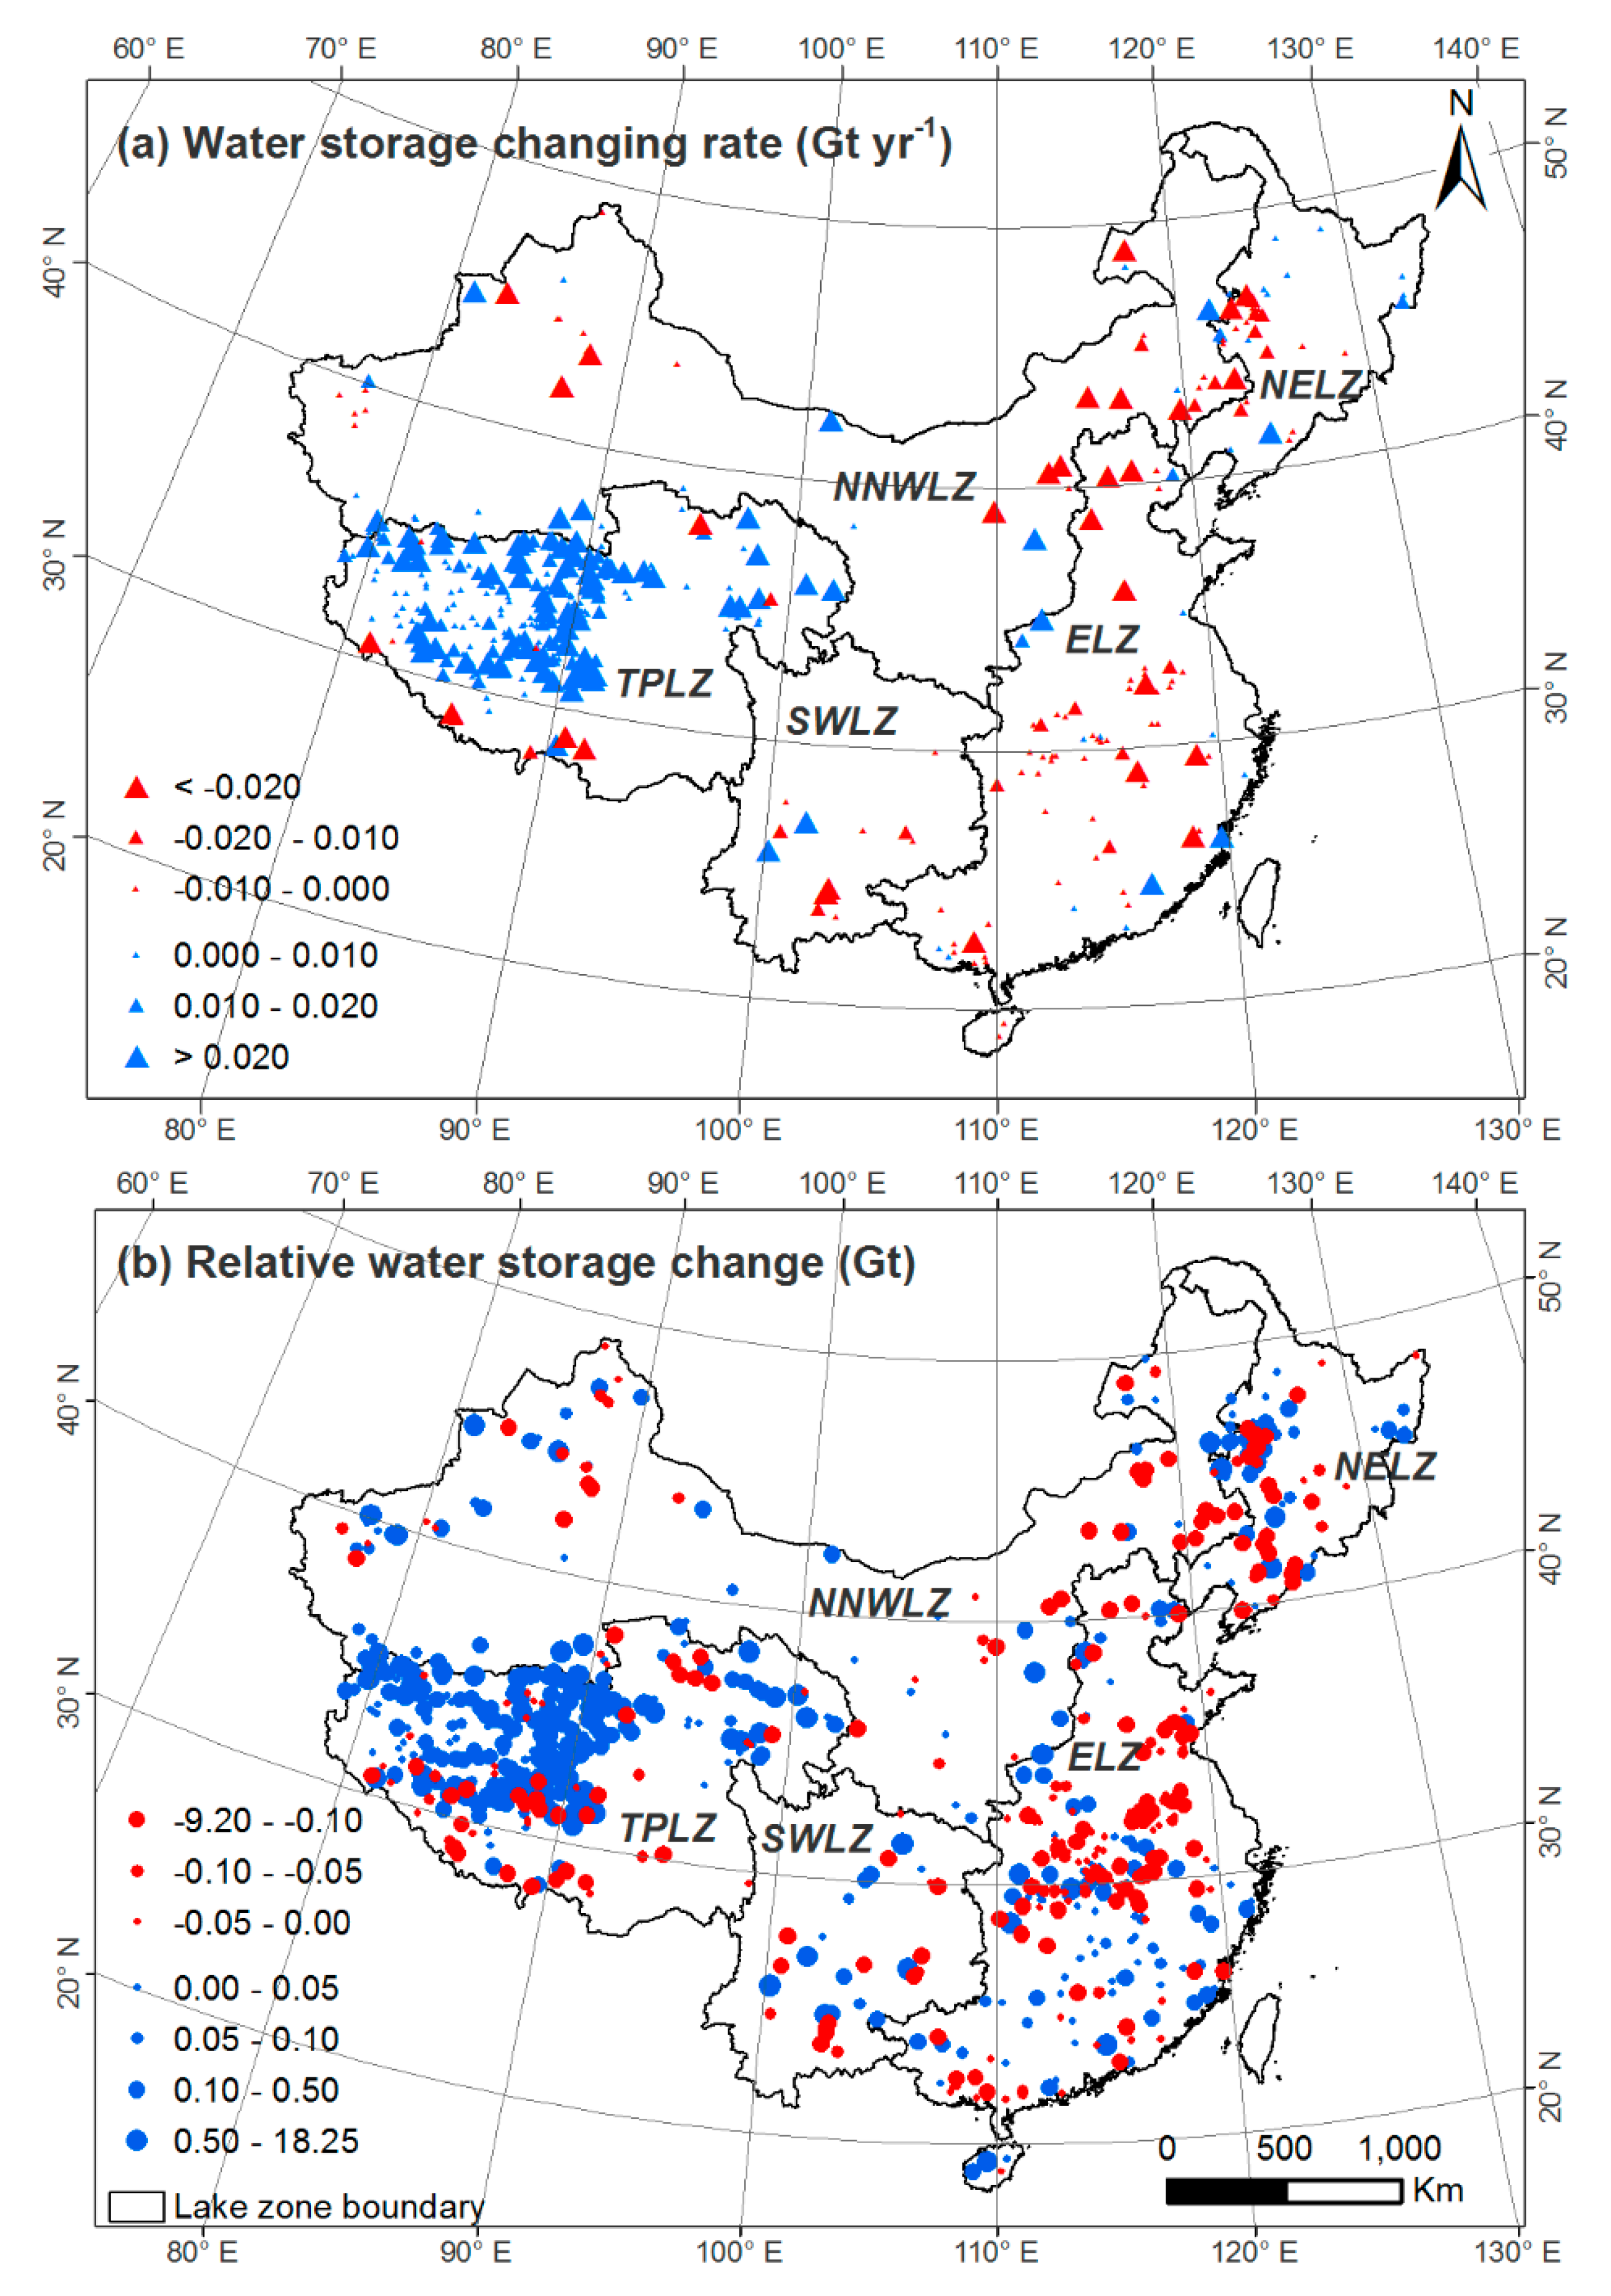
Based on the water storage change trend (Figure 8a), lakes and reservoirs with large decreasing rate (<−0.020 Gt/yr) were mainly distributed along the 400 mm precipitation line in northeastern China (40–45°N), while those with a large increasing rate were found in TPLZ. Figure 8b showed overall water storage changes for the entire study period, with the positive values indicating an increase in water storage and the negative values indicating a decrease in water storage. The largest increase in water storage was found for Qinghai lake, which increased by 18.3 Gt from 1995 to 2015, followed by Selin Co (15.0 Gt, 1995–2015) and Nam Co (0.5 Gt, 1994–2015). These three lakes were the three largest salt lakes in China and were all located in TPLZ, where MI was identified as the dominant trend type. The lakes presenting the largest declines on water storage included Poyang lake, the largest freshwater lake, (−9.2 Gt), Bei Hulsan lake in TPLZ (−8.1 Gt), Hulun lake in NNWLZ (−7.8 Gt), Yamdrok lake (−6.3 Gt) and Dongting, the 2nd largest freshwater lake (−6.3 Gt), during the period 1995–2015 (Figure 8b).
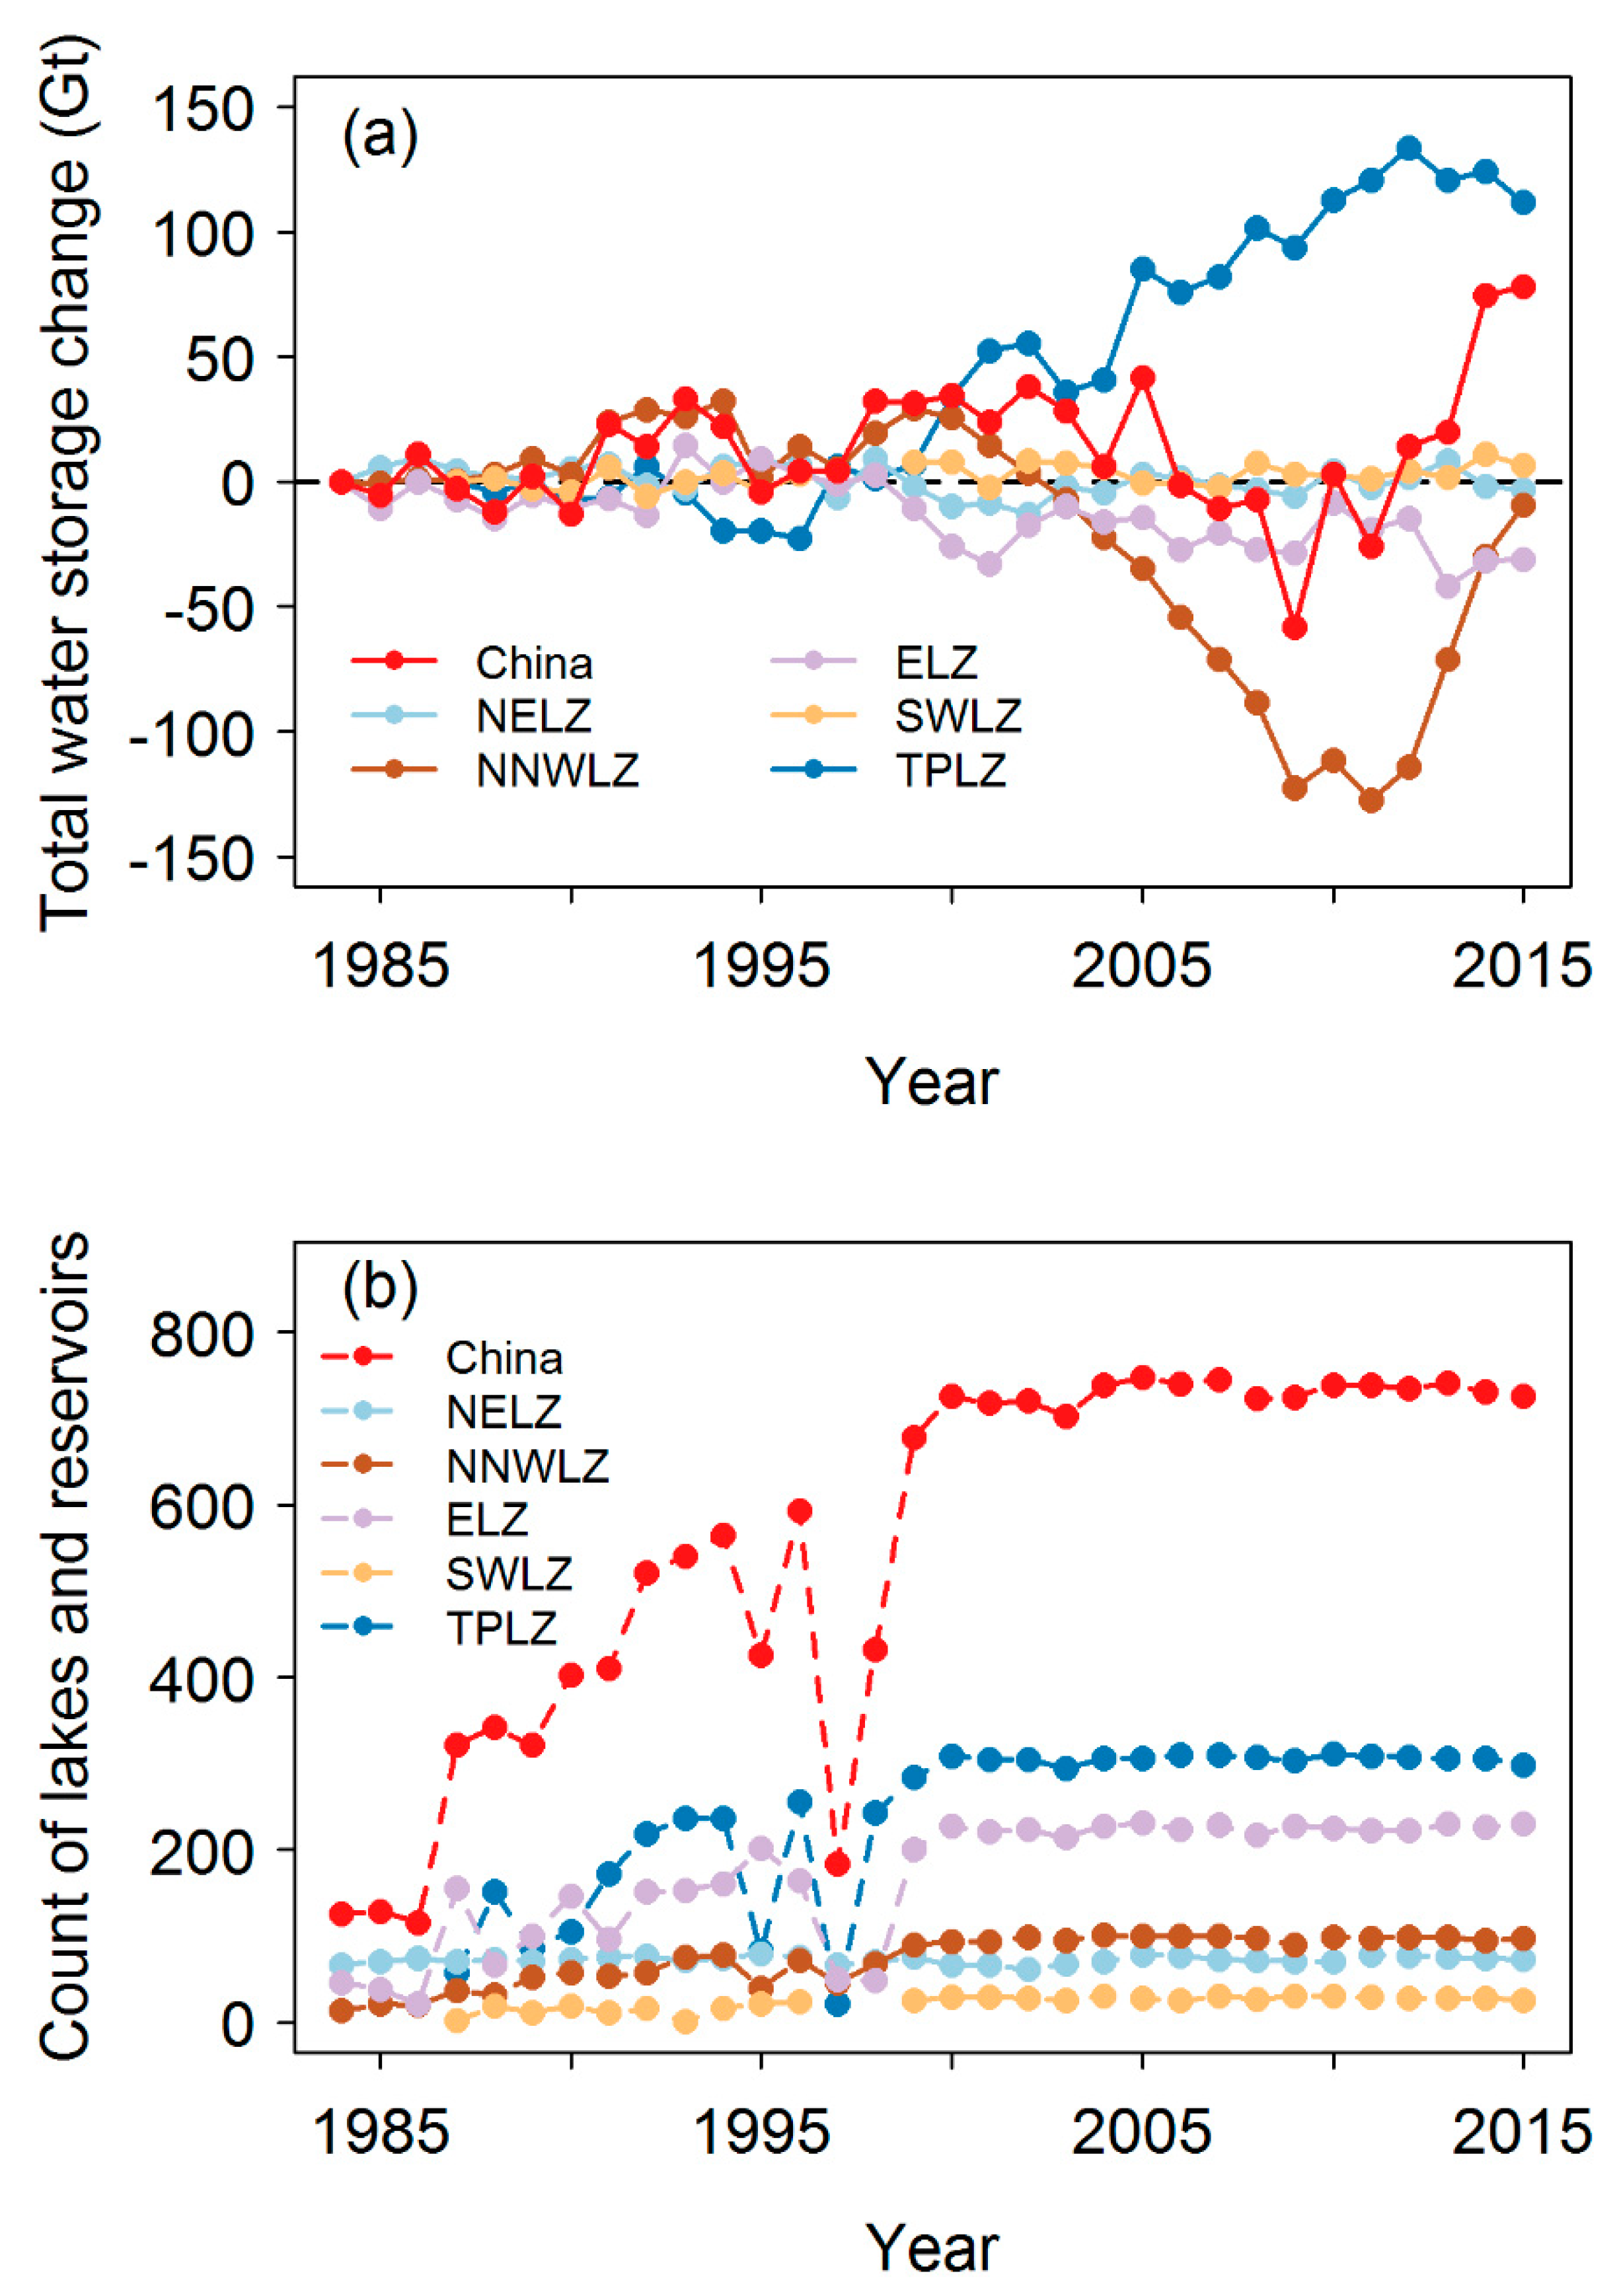
In addition, aggregated water storage change for the whole of mainland China (Figure 9a) generally presented three periods: (1) a minor increasing trend during 1985–2005, (2) a large decrease during 2005–2009, and (3) a fast increase during 2009–2015. The count of lakes and reservoirs (Figure 9b) changed over time, with the water storage change of the new lakes/reservoirs got accounted when they first emerged and the disappearing ones presented zero water storage at the corresponding years. During the first period of 1985–2005, water storage change increased slightly by 41.5 Gt at the rate of 1.7 Gt/yr (R2 = 0.44, p < 0.01), despite the total number of lakes and reservoirs showing a dramatic increase from 126 to 747 (Figure 9b). Water storage change presented a significant decrease (−100 Gt) at a large rate of 20.6 Gt/yr (R2 = 0.84, p < 0.05) from 2005 to 2009, and then increased by 136.3 Gt at the rate of 21.3 Gt/yr (R2 = 0.87, p < 0.01) during the period of 2009–2015. Note that the number of lakes and reservoirs during the last two periods were almost stable at around 730 (Figure 9b) and thus caused limited effect on the observed water storage trend. The increasing water storage in recent years (after 2009) was dominated by the lakes and reservoirs in TPLZ, which presented an obvious increase at the rate of 5.8 Gt/yr (R2 = 0.86, p < 0.01). Conversely, NNWLZ showed a generally decreasing trend in water storage from 1984 to 2015 (−3.6 Gt/yr, R2 = 0.47, p < 0.01), but with a significant decrease (−156.7 Gt) during 1999-2011 and a large increase (117.8 Gt) afterwards. The overall decreasing water storage in China was largely due to the NNWLZ. Water storage in ELZ also presented a small decrease at the rate of 0.9 Gt/yr (R2 = 0.42, p < 0.01), while little variations were observed on water storage changes for regions NELZ and SWLZ over time.
4. Discussion
4.1. Methodological Improvement
4.1.1. Extension of the Spatio-Temporal Scale of ∆V Assessment
Our study provides an advanced and feasible approach to further extend the spatio-temporal scale of water storage change assessment. We analyzed a total of 829 lakes and reservoirs (>10 km2) in China based on the GSW dataset and calculated dynamic water storage change for 760 of them annually from 1984 to 2015 at 30-m spatial resolution. Our assessment was based on GSW and SRTM-DEM data, and we evaluated water storage change by developing geo-statistical models. Such a DEM-based assessment was previously applied and approved with acceptable accuracy [11,13,20,21]; however, adoption of the GEE platform here greatly increased the number of water bodies of analysis and extended the temporal scale of assessment. Compared to previous studies [7,12,13,29], our assessment is more comprehensive regarding the spatial and temporal scales. To the best of our knowledge, this study conducted an assessment on the largest number of lakes and reservoirs (760) with the longest time period (1984–2015) at high spatial (30 m) and temporal (annually) resolutions.
4.1.2. Consideration of the Spatio-Temporal Details
Despite focused on a national-scale assessment, our analysis emphasized the spatial and temporal details. Spatially, we developed relationships between water area and elevation for each of the 829 lakes and reservoirs and selected the one with the highest R2 as the hypsometric function. The large R2 values reflected the overall good fitting and demonstrated that the hypsometric functions can well represent the bathymetry of lakes and reservoirs (Figure 5). Temporally, we delineated the maximum shoreline boundaries for each lake and reservoir based on the GSW max-extent data, which guaranteed the inclusion of water pixels within the reference boundaries as shorelines advance and retreat in response to the dynamic hydroclimatic condition over time. The high resolution of 30 m ensures high-precision extraction of dynamic water area and robust construction of hypsometric relationships. Furthermore, we selected the month of analysis by comparing the contamination ratios for each month (Figure 3) and corrected the original GSW water coverage data by combining GSW water occurrence data with the raw GSW monthly water coverage data according to a recently developed approach [28]. These decreased the effect of the contaminated pixels due to clouds, snow, ice, and terrain shadows, and thus improved the accuracy of our dynamic assessment (Figure 4).
4.2. Implications
Methodologically, leveraging the GEE platform and geo-statistical model, this study has successfully extended the spatial and temporal scales of assessments on water storage change, which provides strong technical support for establishing a systematic and quantitative method on water storage change assessment. Our study demonstrates the effectiveness of combining Landsat images, DEM and GEE on water resource assessment and contributes to the application of remote sensing and geo-statistical methods in the field of hydrology. This approach can be further applied to monitor surface water and to evaluate the effect of climate change.
Scientifically, the long-term trend on water storage change identified from our study has important scientific significance, which are valuable for effective promotion of climate adaptation and water resource management. The increasing ∆V trend in TPLZ (5.8 Gt/yr) was consistent with the previous study on water storage for the endorheic Tibetan Plateau, which was found to have increased at an average rate of 7.34 ± 0.62 Gt/yr during 2002-2015 [7]. Also, the significant ∆V decrease in NNWLZ also agreed with disappearing lakes and drastic shrinkage of lake areas found for Mongolian Plateau [30]. Our national assessment could serve as the basis for identifying the mechanism and evaluating the major driving forces of water storage change by region [7,31,32]. This result can also help tackle a series of fundamental scientific questions involving climate change, hydrologic modelling, water resource sustainability, and ecosystem services.
Dataset-wise, our study has the potential to greatly enrich the current dataset on lakes and reservoirs. With the improvement of remote sensing technology and the enrichment of remote sensing products, a series of lake and reservoir dataset have been generated and updated [26,33,34,35,36], including the Global Lakes and Wetlands Database (GLWD) [37], GLObal WAter BOdies database (GLOWABO) [35], and Global Reservoir and Dam (GRanD) [34]. These global lake and reservoir datasets provided basic attributes including geographical location, extent, area, perimeter, and temperature [36]; however, few of them included water storage estimation, let alone dynamic record over a long time period. The only exception was the HydroLAKES dataset, which estimated the total water storage for lakes with a surface area of 0.1 km2 or above but still lack the dynamic information [26]. The assessment approach we adopted in this study could be widely applied, including the ungauged areas, to evaluate water storage change and develop regional and even global dataset on dynamic water storage change for lakes and reservoirs.
4.3. Limitations
Still, some limitations existed in our study. First, on using DEM to derive bathymetry, we developed hypsometric relationship for individual lake and reservoir and assumed it constant over time and steady above and below the water surface when collecting SRTM-DEM data, which could inevitably lead to errors if the surrounding topography changes or the variation by elevation varies significantly. Second, on the correction of water coverage, we adopted the same empirical weighting factor (0.17) as a previous study [28] and assumed it worked well for our purpose considering its good performance for global-scale coverage. Third, due to the lack of field measurements, our validation was confined to 30 lakes across China with dynamic data on water level. However, the comparison on the temporal trend between our estimated elevation and Hydroweb water level data indicated good consistency (Figure 6). Future work could improve this with more available data.
5. Conclusions
In this study, we extended the spatial and temporal scales of water storage change assessment and revealed the spatial and temporal patterns of water storage change for China’s lakes and reservoirs during the last three decades:
(1) The aggregated water storage in China went through a slight increase of 41.5 Gt (at the rate of 1.7 Gt/yr) during 1985–2005, a significant decrease of 100 Gt (20.6 Gt/yr) during 2005–2009, and then increased by 136.3 Gt (21.3 Gt/yr) during 2009–2015 (Figure 9).
(2) The trend on water storage change varied across the five lake zones. Water storage in TPLZ increased at the rate of 5.8 Gt/yr, with MI as the dominant trend type (Table 2), which contributed to the overall increasing trend during 2009–2015. In contrast, NNWLZ experienced a significant decrease (-156.7 Gt) during 1999–2011 and a large increase (117.8 Gt) afterwards, which contributed to the overall decreasing water storage (2005–2009). Water storage in ELZ presented a small decrease (0.9 Gt/yr), while few variations were observed on water storage changes for regions NELZ and SWLZ.
(3) For individual lake and reservoir (Figure 8), Qinghai lake was associated with the largest increase in water storage (18.3 Gt) and Poyang lake presented the largest decline (−9.2 Gt).
Our developed assessment approach and our identified patterns of water storage changes in lakes and reservoirs is of great significance for advancing the sustainable management of water resources and predicting the impact of climate change, especially in the ungagged regions.
Supplementary Materials
The following are available online at https://www.mdpi.com/2072-4292/11/12/1467/s1, Figure S1: Hypsometric analysis for diverse sized lakes and reservoirs, Figure S2: Locations of the 11 examplinary lakes and reservoirs on hypsometric analysis. GEE codes can be shared upon request from [email protected].
Author Contributions
Conceptualization, Y.F., Y.H. and H.W.; Data curation, Y.F. and H.L. Formal analysis, Y.F. and H.L.; Funding acquisition, Y.F., Y.H. and H.W.; Investigation, Y.F., H.L., W.W., S.Z., Z.W., Y.H. and H.W.; Methodology, Y.F. and H.L.; Project administration, Y.F., Y.H. and H.W.; Resources, Y.F., H.L., W.W. and S.Z.; Software, Y.F. and H.L.; Supervision, Y.F., Z.W., Y.H. and H.W.; Validation, Y.F., H.L., W.W. and S.Z.; Visualization, Y.F.; Writing—original draft, Y.F.; Writing—review & editing, Y.F., H.L., W.W., S.Z., Z.W., Y.H. and H.W.
Funding
This research was supported by the Open Research Fund of State Key Laboratory of Simulation and Regulation of Water Cycle in River Basin (China Institute of Water Resources and Hydropower Research) [Grant No: IWHR-SKL-201801] and the National Natural Science Foundation of China [Grant No. 71461010701].
Conflicts of Interest
The authors declare no conflict of interest.
References
- Prigent, C.; Papa, F.; Aires, F.; Jimenez, C.; Rossow, W.B.; Matthews, E. Changes in land surface water dynamics since the 1990s and relation to population pressure. Geophys. Res. Lett. 2012, 39, L08403. [Google Scholar] [CrossRef]
- Adrian, R.; O’Reilly, C.M.; Zagarese, H.; Baines, S.B.; Hessen, D.O.; Keller, W.; Livingstone, D.M.; Sommaruga, R.; Straile, D.; Donk, E.V.; et al. Lakes as sentinels of climate change. Limnol. Oceanogr. 2009, 54, 2283–2297. [Google Scholar] [CrossRef] [PubMed]
- Lee, H.; Durand, M.; Jung, H.C.; Alsdorf, D.; Shum, C.K.; Sheng, Y. Characterization of surface water storage changes in Arctic lakes using simulated SWOT measurements. Int. J. Remote Sens. 2010, 31, 3931–3953. [Google Scholar] [CrossRef]
- Crétaux, J.-F.; Abarca-del-Río, R.; Bergé-Nguyen, M.; Arsen, A.; Drolon, V.; Clos, G.; Maisongrande, P. Lake Volume Monitoring from Space. Surv. Geophys. 2016, 37, 269–305. [Google Scholar] [CrossRef] [Green Version]
- Tong, X.; Pan, H.; Xie, H.; Xu, X.; Li, F.; Chen, L.; Luo, X.; Liu, S.; Chen, P.; Jin, Y. Estimating water volume variations in Lake Victoria over the past 22years using multi-mission altimetry and remotely sensed images. Remote Sens. Environ. 2016, 187, 400–413. [Google Scholar] [CrossRef]
- Alsdorf, D.; Lettenmaier, D.; Vörösmarty, C. The need for global, satellite-based observations of terrestrial surface waters. Eos Trans. Am. Geophys. Union 2003, 84, 269–276. [Google Scholar] [CrossRef]
- Yao, F.; Wang, J.; Yang, K.; Wang, C.; Walter, B.; Cretaux, J.-F. Lake storage variation on the endorheic Tibetan Plateau and its attribution to climate change since the new millennium. Environ. Res. Lett. 2018, 13, 11. [Google Scholar] [CrossRef]
- Zhu, W.; Jia, S.; Lv, A. Monitoring the Fluctuation of Lake Qinghai Using Multi-Source Remote Sensing Data. Remote Sens. 2014, 6, 10457–10482. [Google Scholar] [CrossRef] [Green Version]
- Wang, L.; Chen, C.; Thomas, M.; Kaban, M.K.; Guentner, A.; Du, J. Increased water storage of Lake Qinghai during 2004–2012 from GRACE data, hydrological models, radar altimetry and in situ measurements. Geophys. J. Int. 2018, 212, 679–693. [Google Scholar] [CrossRef]
- Hui, F.; Xu, B.; Huang, H.; Yu, Q.; Gong, P. Modelling spatial-temporal change of Poyang Lake using multitemporal Landsat imagery. Int. J. Remote Sens. 2008, 29, 5767–5784. [Google Scholar] [CrossRef]
- Gao, H.; Zhang, S. A reservoir storage estimation algorithm using digital elevation data and image classifications. In Proceedings of the 2017 IEEE International Geoscience and Remote Sensing Symposium (IGARSS), Fort Worth, TX, USA, 23–28 July 2017; pp. 5613–5616. [Google Scholar]
- Song, C.; Huang, B.; Ke, L. Modeling and analysis of lake water storage changes on the Tibetan Plateau using multi-mission satellite data. Remote Sens. Environ. 2013, 135, 25–35. [Google Scholar] [CrossRef]
- Yang, R.; Zhu, L.; Wang, J.; Ju, J.; Ma, Q.; Turner, F.; Guo, Y. Spatiotemporal variations in volume of closed lakes on the Tibetan Plateau and their climatic responses from 1976 to 2013. Clim. Chang. 2017, 140, 621–633. [Google Scholar] [CrossRef]
- Zhang, G. Changes in lakes on the Tibetan Plateau observed from satellite data and their responses to climate variations. Prog. Geogr. 2018, 37, 214–223. [Google Scholar]
- Zhang, G.; Yao, T.; Xie, H.; Zhang, K.; Zhu, F. Lakes’ state and abundance across the Tibetan Plateau. Chin. Sci. Bull. 2014, 59, 3010–3021. [Google Scholar] [CrossRef]
- Wan, W.; Long, D.; Hong, Y.; Ma, Y.; Yuan, Y.; Xiao, P.; Duan, H.; Han, Z.; Gu, X. A lake data set for the Tibetan Plateau from the 1960s, 2005, and 2014. Sci. Data 2016, 3, 160039. [Google Scholar] [CrossRef] [PubMed] [Green Version]
- Zhang, G.; Yao, T.; Shum, C.; Yi, S.; Yang, K.; Xie, H.; Feng, W.; Bolch, T.; Wang, L.; Behrangi, A. Lake volume and groundwater storage variations in Tibetan Plateau’s endorheic basin. Geophys. Res. Lett. 2017, 44, 5550–5560. [Google Scholar] [CrossRef]
- Dong, S.; Peng, F.; You, Q.; Guo, J.; Xue, X. Lake dynamics and its relationship to climate change on the Tibetan Plateau over the last four decades. Reg. Environ. Chang. 2018, 18, 477–487. [Google Scholar] [CrossRef]
- Gao, H. Satellite remote sensing of large lakes and reservoirs: from elevation and area to storage. Wiley Interdiscip. Rev. Water 2015, 2, 147–157. [Google Scholar] [CrossRef]
- Bonnema, M.; Hossain, F. Inferring reservoir operating patterns across the Mekong Basin using only space observations. Water Resour. Res. 2017, 53, 3791–3810. [Google Scholar] [CrossRef]
- Pan, F.; Liao, J.; Li, X.; Guo, H. Application of the inundation area—lake level rating curves constructed from the SRTM DEM to retrieving lake levels from satellite measured inundation areas. Comput. Geosci. 2013, 52, 168–176. [Google Scholar] [CrossRef]
- Mutanga, O.; Kumar, L. Google Earth Engine Applications. Remote Sens. 2019, 11, 591. [Google Scholar] [CrossRef]
- Donchyts, G.; Baart, F.; Winsemius, H.; Gorelick, N.; Kwadijk, J.; van de Giesen, N. Earth’s surface water change over the past 30 years. Nat. Clim. Chang. 2016, 6, 810. [Google Scholar] [CrossRef]
- Gorelick, N.; Hancher, M.; Dixon, M.; Ilyushchenko, S.; Thau, D.; Moore, R. Google Earth Engine: Planetary-scale geospatial analysis for everyone. Remote Sens. Environ. 2017, 202, 18–27. [Google Scholar] [CrossRef]
- Pekel, J.-F.; Cottam, A.; Gorelick, N.; Belward, A.S. High-resolution mapping of global surface water and its long-term changes. Nature 2016, 540, 418. [Google Scholar] [CrossRef] [PubMed]
- Messager, M.L.; Lehner, B.; Grill, G.; Nedeva, I.; Schmitt, O. Estimating the volume and age of water stored in global lakes using a geo-statistical approach. Nat. Commun. 2016, 7, 13603. [Google Scholar] [CrossRef] [PubMed]
- Ma, R.; Yang, G.; Duan, H.; Jiang, J.; Wang, S.; Feng, X.; Li, A.; Kong, F.; Xue, B.; Wu, J.; et al. China’s lakes at present: Number, area and spatial distribution. Sci. China Earth Sci. 2011, 54, 283–289. [Google Scholar] [CrossRef]
- Zhao, G.; Gao, H. Automatic correction of contaminated images for assessment of reservoir surface area dynamics. Geophys. Res. Lett. 2018, 45, 6092–6099. [Google Scholar] [CrossRef]
- Qiao, B.; Zhu, L.; Wang, J.; Ju, J.; Ma, Q.; Liu, C. Estimation of lakes water storage and their changes on the northwestern Tibetan Plateau based on bathymetric and Landsat data and driving force analyses. Quat. Int. 2017, 454, 56–67. [Google Scholar] [CrossRef]
- Zhang, G.; Yao, T.; Piao, S.; Bolch, T.; Xie, H.; Chen, D.; Gao, Y.; O’Reilly, C.M.; Shum, C.K.; Yang, K.; et al. Extensive and drastically different alpine lake changes on Asia’s high plateaus during the past four decades. Geophys. Res. Lett. 2017, 44, 252–260. [Google Scholar] [CrossRef]
- Wang, J.D.; Song, C.Q.; Reager, J.T.; Yao, F.F.; Famiglietti, J.S.; Sheng, Y.W.; MacDonald, G.M.; Brun, F.; Schmied, H.M.; Marston, R.A.; et al. Recent global decline in endorheic basin water storages. Nat. Geosci. 2018, 11, 926–932. [Google Scholar] [CrossRef] [Green Version]
- Zhang, G.; Yao, T.; Chen, W.; Zheng, G.; Shum, C.K.; Yang, K.; Piao, S.; Sheng, Y.; Yi, S.; Li, J.; et al. Regional differences of lake evolution across China during 1960s–2015 and its natural and anthropogenic causes. Remote Sens. Environ. 2019, 221, 386–404. [Google Scholar] [CrossRef]
- Prigent, C.; Matthews, E.; Aires, F.; Rossow, W.B. Remote sensing of global wetland dynamics with multiple satellite data sets. Geophys. Res. Lett. 2001, 28, 4631–4634. [Google Scholar] [CrossRef] [Green Version]
- Lehner, B.; Liermann, C.R.; Revenga, C.; Vörösmarty, C.; Fekete, B.; Crouzet, P.; Döll, P.; Endejan, M.; Frenken, K.; Magome, J.; et al. High-resolution mapping of the world’s reservoirs and dams for sustainable river-flow management. Front. Ecol. Environ. 2011, 9, 494–502. [Google Scholar] [CrossRef]
- Verpoorter, C.; Kutser, T.; Seekell, D.A.; Tranvik, L.J. A global inventory of lakes based on high-resolution satellite imagery. Geophys. Res. Lett. 2014, 41, 6396–6402. [Google Scholar] [CrossRef]
- Sharma, S.; Gray, D.K.; Read, J.S.; O’Reilly, C.M.; Schneider, P.; Qudrat, A.; Gries, C.; Stefanoff, S.; Hampton, S.E.; Hook, S.; et al. A global database of lake surface temperatures collected by in situ and satellite methods from 1985–2009. Sci. Data 2015, 2, 150008. [Google Scholar] [CrossRef] [PubMed]
- Lehner, B.; Döll, P. Development and validation of a global database of lakes, reservoirs and wetlands. J. Hydrol. 2004, 296, 1–22. [Google Scholar] [CrossRef]
Figure 1.
Flowchart of the methodology adopted to evaluate water storage change.

Figure 2.
The reference boundaries for 829 lakes and reservoirs and 5 lake zones in mainland China. The division of the lakes zones was based on Ma [27] and renamed here, including (1) the Northeast Lake Zone (NELZ), (2) the North and Northwest Lake Zone (NNWLZ), (3) the East Lake Zone (ELZ), (4) the Southwest Lake Zone (SWLZ), and (5) the Tibetan Plateau Lake Zone (TPLZ).

Figure 3.
Determination of month of analysis. (a) Boxplots of contamination ratio of 829 lakes and reservoirs by month, 1984–2015. (b) Histogram on the month with the lowest contamination ratio for 829 lakes and reservoirs.
Figure 3.
Determination of month of analysis. (a) Boxplots of contamination ratio of 829 lakes and reservoirs by month, 1984–2015. (b) Histogram on the month with the lowest contamination ratio for 829 lakes and reservoirs.

Figure 4.
Time series of total water area from August to October, 1984–2015, for 829 lakes and reservoirs. Raw water coverage and enhance water coverage are represented in grey and green, respectively.
Figure 4.
Time series of total water area from August to October, 1984–2015, for 829 lakes and reservoirs. Raw water coverage and enhance water coverage are represented in grey and green, respectively.

Figure 5.
Hypsometric analysis based on the SRTM-DEM data. Derived hypsometric relationships for (a) Nam Co Lake and (b) Poyang Lake. Both of the two hypsometric functions were fitted with segmented linear relationships. (c) Histogram of the fitting R2 for hypsometric functions for 818 lakes and reservoirs, with mean value of 0.989 and standard deviation of 0.025.

Figure 6.
Accuracy assessment of elevation estimation. (a) Comparison of the temporal trends between estimated elevation and Hydroweb water level for Nam Co lake, 1995–2015. (b) Comparison of the temporal trends between estimated elevation and Hydroweb water level for Poyang lake, 1995–2015. (c) Comparison of the changing rate of our estimated elevation with the trend from Hydroweb water level data (N = 30). The brown dashed line represents the linear regression line.

Figure 7.
Spatial distribution of the five temporal trend types of water storage change () in lakes and reservoirs across China, 1984–2015 (N = 760).
Figure 7.
Spatial distribution of the five temporal trend types of water storage change () in lakes and reservoirs across China, 1984–2015 (N = 760).

Figure 8.
Spatial distribution of water storage change () in lakes and reservoirs across China, 1984–2015. (a) The temporal changing rate of for the two monotonically changing types (N = 412). (b) The total amount of for all the 760 lakes and reservoirs relative to the first year of analysis.
Figure 8.
Spatial distribution of water storage change () in lakes and reservoirs across China, 1984–2015. (a) The temporal changing rate of for the two monotonically changing types (N = 412). (b) The total amount of for all the 760 lakes and reservoirs relative to the first year of analysis.

Figure 9.
Temporal trend on the water storage change and the number of lakes and reservoirs of analysis. (a) Aggregated amount of ∆V in the lakes and reservoirs of mainland China and the five different lake zone, 1984-2015. (b) The temporal trend of the number of lakes and reservoirs over time.
Figure 9.
Temporal trend on the water storage change and the number of lakes and reservoirs of analysis. (a) Aggregated amount of ∆V in the lakes and reservoirs of mainland China and the five different lake zone, 1984-2015. (b) The temporal trend of the number of lakes and reservoirs over time.


Table 1.
List of the dataset used in this study.
| Item | Dataset | Source | Spatial Resolution | Temporal Scale | Use in This Study |
|---|---|---|---|---|---|
| 1 | Global Surface Water (GSW) | Provided by EC Joint Research Center and accessed at the GEE platform | 30 m | Monthly, from March 1984 to October 2015 | To provide dynamic information on water coverage |
| 2 | SRTM-DEM | Provided by NASA JPL and accessed at the GEE platform | 30 m | February 2000 | To develop hypsometric relationships |
| 3 | HydroLAKES data | Developed by the Global HydroLAB and downloaded from HydroSHEDS website (https://www.hydrosheds.org) | Lakes/reservoirs with a surface area of at least 0.1 km2 | 2000s | To help select lakes/reservoirs of analysis and determine their geographical extent |
| 4 | Remote sensing monitoring data of land use in China | Data Center for Resources and Environmental Sciences (http://www.resdc.cn/) | 1 km | 1990 and 2015 | To aid the selection of lakes and reservoirs |
| 5 | River shapefile | China’s ecosystem assessment and ecological security pattern database (http://www.ecosystem.csdb.cn) | / | 2000s | To identify the connectivity of lakes/reservoirs to rivers and determine the buffer distance |
| 6 | China Lake dataset | Lake-Watershed Science Data Center of National Earth System Science Data Sharing Infrastructure (http://lake.geodata.cn) | 1:250,000 | 1960s | To provide boundary information for lakes |
| 7 | Hydroweb | Developed by LEGOS and downloaded from Hydroweb (http://hydroweb.theia-land.fr/) | Large lakes and reservoirs | Around 1992–2015 | To validate the trend of water surface elevation |
Table 2.
Count of lakes and reservoirs based on the trend types of water storage change for the different lake zones and whole mainland China.
Table 2.
Count of lakes and reservoirs based on the trend types of water storage change for the different lake zones and whole mainland China.
| Lake Zone | Count of Lakes and Reservoirs | |||||
|---|---|---|---|---|---|---|
| Mono-Tonically Increasing | Mono-Tonically Decreasing | Recently Increasing | Recently Decreasing | No Obvious Trend | Total | |
| NELZ | 15 | 21 | 30 | 6 | 8 | 80 |
| NNWLZ | 22 | 30 | 20 | 27 | 4 | 103 |
| ELZ | 13 | 62 | 72 | 65 | 21 | 233 |
| SWLZ | 2 | 11 | 12 | 5 | 0 | 30 |
| TPLZ | 224 | 11 | 20 | 52 | 4 | 311 |
| others | 1 | 0 | 2 | 0 | 0 | 3 |
| China | 277 | 135 | 156 | 155 | 37 | 760 |
© 2019 by the authors. Licensee MDPI, Basel, Switzerland. This article is an open access article distributed under the terms and conditions of the Creative Commons Attribution (CC BY) license (http://creativecommons.org/licenses/by/4.0/).
Share and Cite
MDPI and ACS Style
Fang, Y.; Li, H.; Wan, W.; Zhu, S.; Wang, Z.; Hong, Y.; Wang, H. Assessment of Water Storage Change in China’s Lakes and Reservoirs over the Last Three Decades. Remote Sens. 2019, 11, 1467. https://doi.org/10.3390/rs11121467
AMA Style
Fang Y, Li H, Wan W, Zhu S, Wang Z, Hong Y, Wang H. Assessment of Water Storage Change in China’s Lakes and Reservoirs over the Last Three Decades. Remote Sensing. 2019; 11(12):1467. https://doi.org/10.3390/rs11121467
Chicago/Turabian StyleFang, Yu, Huan Li, Wei Wan, Siyu Zhu, Zhongjing Wang, Yang Hong, and Hao Wang. 2019. "Assessment of Water Storage Change in China’s Lakes and Reservoirs over the Last Three Decades" Remote Sensing 11, no. 12: 1467. https://doi.org/10.3390/rs11121467
Note that from the first issue of 2016, this journal uses article numbers instead of page numbers. See further details here.