Article

Systematical Evaluation of GPM IMERG and TRMM 3B42V7 Precipitation Products in the Huang-Huai-Hai Plain, China

1
College of Geomatics, Shandong University of Science and Technology, Qingdao 266590, China
2
College of Electronics, Shandong University of Science and Technology, Qingdao 266590, China
3
National Meteorological Information Center, China Meteorological Administration, Beijing 100081, China
4
Tianjin Key Laboratory of Water Resources and Environment, Tianjin Normal University, Tianjin 300387, China
*
Author to whom correspondence should be addressed.
These authors contributed equally to this work.
Remote Sens. 2019, 11(6), 697; https://doi.org/10.3390/rs11060697
Submission received: 7 February 2019 / Revised: 12 March 2019 / Accepted: 17 March 2019 / Published: 22 March 2019
(This article belongs to the Section Environmental Remote Sensing)

Abstract

:
Accurate estimation of high-resolution satellite precipitation products like Global Precipitation Measurement (GPM) and Tropical Rainfall Measuring Mission (TRMM) is critical for hydrological and meteorological research, providing a benchmark for the continued development and future improvement of these products. This study aims to comprehensively evaluate the Integrated Multi-Satellite Retrievals for GPM (IMERG) and TRMM 3B42V7 products at multiple temporal scales from 1 January 2015 to 31 December 2017 over the Huang-Huai-Hai Plain in China, using daily precipitation data from 59 meteorological stations. Three commonly used statistical metrics (CC, RB, and RMSE) are adopted to quantitatively verify the accuracy of two satellite precipitation products. The assessment also takes into account the precipitation detection capability (POD, FAR, CSI, and ACC) and frequency of different precipitation intensities. The results show that the IMERG and 3B42V7 present strong correlation with meteorological stations observations at annual and monthly scales (CC > 0.90), whereas moderate at the daily scale (CC = 0.76 and 0.69 for IMERG and 3B42V7, respectively). The spatial variability of the annual and seasonal precipitation is well captured by these two satellite products. And spatial patterns of precipitation gradually decrease from south to north over the Huang-Huai-Hai Plain. Both IMERG and 3B42V7 products overestimate precipitation compared with the station observations, of which 3B42V7 has a lower degree of overestimation. Relative to the IMERG, annual precipitation estimates from 3B42V7 show lower RMSE (118.96 mm and 142.67 mm, respectively), but opposite at the daily, monthly, and seasonal scales. IMERG has a better precipitation detection capability than 3B42V7 (POD = 0.83 and 0.67, respectively), especially when detecting trace and solid precipitation. The two precipitation products tend to overestimate moderate (2–10 mm/d) and heavy (10–50 mm/d) precipitation events, but underestimate violent (>50 mm/d) precipitation events. The IMERG is not found capable to detecting precipitation events of different frequencies more precisely. In general, the accuracy of IMERG is better than 3B42V7 product in the Huang-Huai-Hai Plain. The IMERG satellite precipitation product with higher temporal and spatial resolutions can be regarded a reliable data sources in studying hydrological and climatic research.

1. Introduction

As a significant meteorological and hydrological phenomenon in nature, precipitation has complex characteristics of spatiotemporal variations. It is one of the important components of the global exchange of surface material and the hydrological cycle [1,2]. Simultaneously, precipitation is the key input parameter of hydro-meteorological models and climate studies, and it plays a vital role in understanding the mechanism and interaction of global water and energy balance [3,4]. Therefore, acquisition of accurate and reliable precipitation information is of great significance to social and economic development and related scientific researches.
Generally, approaches for precipitation measurements mainly include rain gauges, weather radars, and satellite-based sensors [5]. Rain gauges can directly obtain precipitation information at specific sites, which are regarded as the reliable means for observing precipitation. Nevertheless, rain gauge stations are often scarce and uneven distributed in developing countries and mountainous regions with complex terrain, leading to difficulty in capturing spatial variability of precipitation [6,7,8]. In regard to weather radars, they can provide real-time and high-resolution precipitation for large areas [9]. However, weather radars also suffer from several limitations, such as high cost, errors in electronic signals and limited coverage in complex terrains [10,11,12]. In contrast, satellite-based precipitation products have recently been accepted due to wide coverage and high spatiotemporal resolution [13,14,15,16,17]. At present, satellite precipitation products have been extensively applied in the fields of regional and global precipitation patterns [18], hydrological simulation [19], and drought monitoring [20].
Currently, various satellite precipitation products have been developed through different techniques, such as the Precipitation Estimation from Remotely Sensed Information using Artificial Neural Network (PERSIANN) [21], the Climate Precipitation Center morphing method (CMORPH) [22], the Tropical Rainfall Measuring Mission (TRMM) Multi-satellite Precipitation Analysis (TMPA) [23], and Integrated Multi-Satellite Retrievals for Global Precipitation Measurement (GPM) mission (IMERG) [24]. Among these satellite precipitation products, the TMPA precipitation estimate is considered as one of the most reliable and widely utilized products [9,15,16,17,25]. TRMM was launched on 27 November 1997 by the National Aeronautics and Space Administration (NASA) with collaboration of the Japanese Aerospace Exploration Agency (JXAX). TMPA products were intended to provide the best multi-satellite precipitation estimates in TRMM-era [26]. After over 17 years of productive data gathering, TRMM was retired on 8 April 2015. Nevertheless, the TMPA products will continue to be produced until IMERG is considered satisfactory [27]. Given the notable successes of the TRMM, the GPM Core Observatory satellite was launched by NASA and JXAX as a successor of TRMM in February 2014 and the IMERG algorithm was released in early 2015 [27,28]. In addition, IMERG combines intermittent precipitation estimates from all constellation microwave sensors, IR-based observations from geosynchronous satellites and monthly gauge precipitation data [24]. Compared to TMPA products, IMERG can provide better spatial (0.1°) and temporal (0.5 h) resolutions, wider coverage range (60°S–60°N) and snowfall observations [25].
Since the release of IMERG products, a number of studies have been conducted to evaluate and compare the performance of TMPA and IMERG products with reference to rain gauges observations in various regions of the world, e.g., China [29,30,31,32,33,34], Singapore [25], Malaysia [15,16,17], Pakistan [13,14], South America [35], and Cyprus [36]. For instance, Tan and Duan evaluated IMERG and 3B42 precipitation products on daily, monthly, seasonal, and annual scales over Singapore. They found that IMERG had better performance in the characterization of precipitation variability and precipitation detection capability, with only slight improvement compared to TMPA products [25]. According to Anjum et al., IMERG detected moderate to heavy precipitation events more precisely compared with 3B42 (RT/V7) [13]. Xu et al. evaluated IMERG and 3B42V7 in the Southern Tibetan Plateau region focusing on the effects of topography and precipitation intensity. The results indicated that the accuracy of IMERG products was superior to 3B42V7 at high altitudes and vice versa at low altitudes [31]. Tang et al. evaluated Day-1 IMERG and 3B42V7 products over Mainland China and found that Day-1 IMERG presented better performance than TRMM 3B42V7 at both sub-daily and daily timescales [9]. Previous studies demonstrated that the accuracy and performance of satellite precipitation estimates varied greatly due to diverse altitudes and geographic locations. However, most such studies were conducted in mountainous areas [2,13,31,37,38] and low-latitude areas [15,17,25,39]. Moreover, to the best of our knowledge, a comprehensive evaluation of the performances of satellite precipitation products is relatively scarce in mid-latitude and flat terrain regions such as the Huang-Huai-Hai Plain in China. Therefore, the new generation of satellite precipitation product IMERG and the most widely applied 3B42V7 product are selected in this present study. Taking the Huang-Huai-Hai Plain as an example, the applicability of two satellite precipitation products is studied in this region.
The Huang-Huai-Hai Plain is located in the mid-latitude of China. Due to factors such as land and sea location and monsoon climate, climate change in the region is sensitive. In recent years, climate warming has led to an increase in the degree of precipitation variability, and the frequent occurrence of droughts and floods has severely constrained the sustainable development of this region. Partial studies have been conducted to evaluate the reliability of IMERG and 3B42 (RT/V7) in this region, but only when the Huang-Huai-Hai Plain is a sub-district of Mainland China [9,30,34]. Specialized and comprehensive quantitative assessment of IMERG and 3B42V7 products is scarce in this region. Therefore, for one thing, the study period (January 2015-Decmber 2017) is extended compared to the previous studies. For another thing, a number of continuous statistical metrics and categorical statistical metrics are used to systematically evaluate and compare the accuracy of GPM IMERG and TRMM 3B42V7 satellite precipitation products. This study will provide a useful reference for precipitation monitoring and regional climate prediction in the mid-latitude regions.

2. Materials and Methods
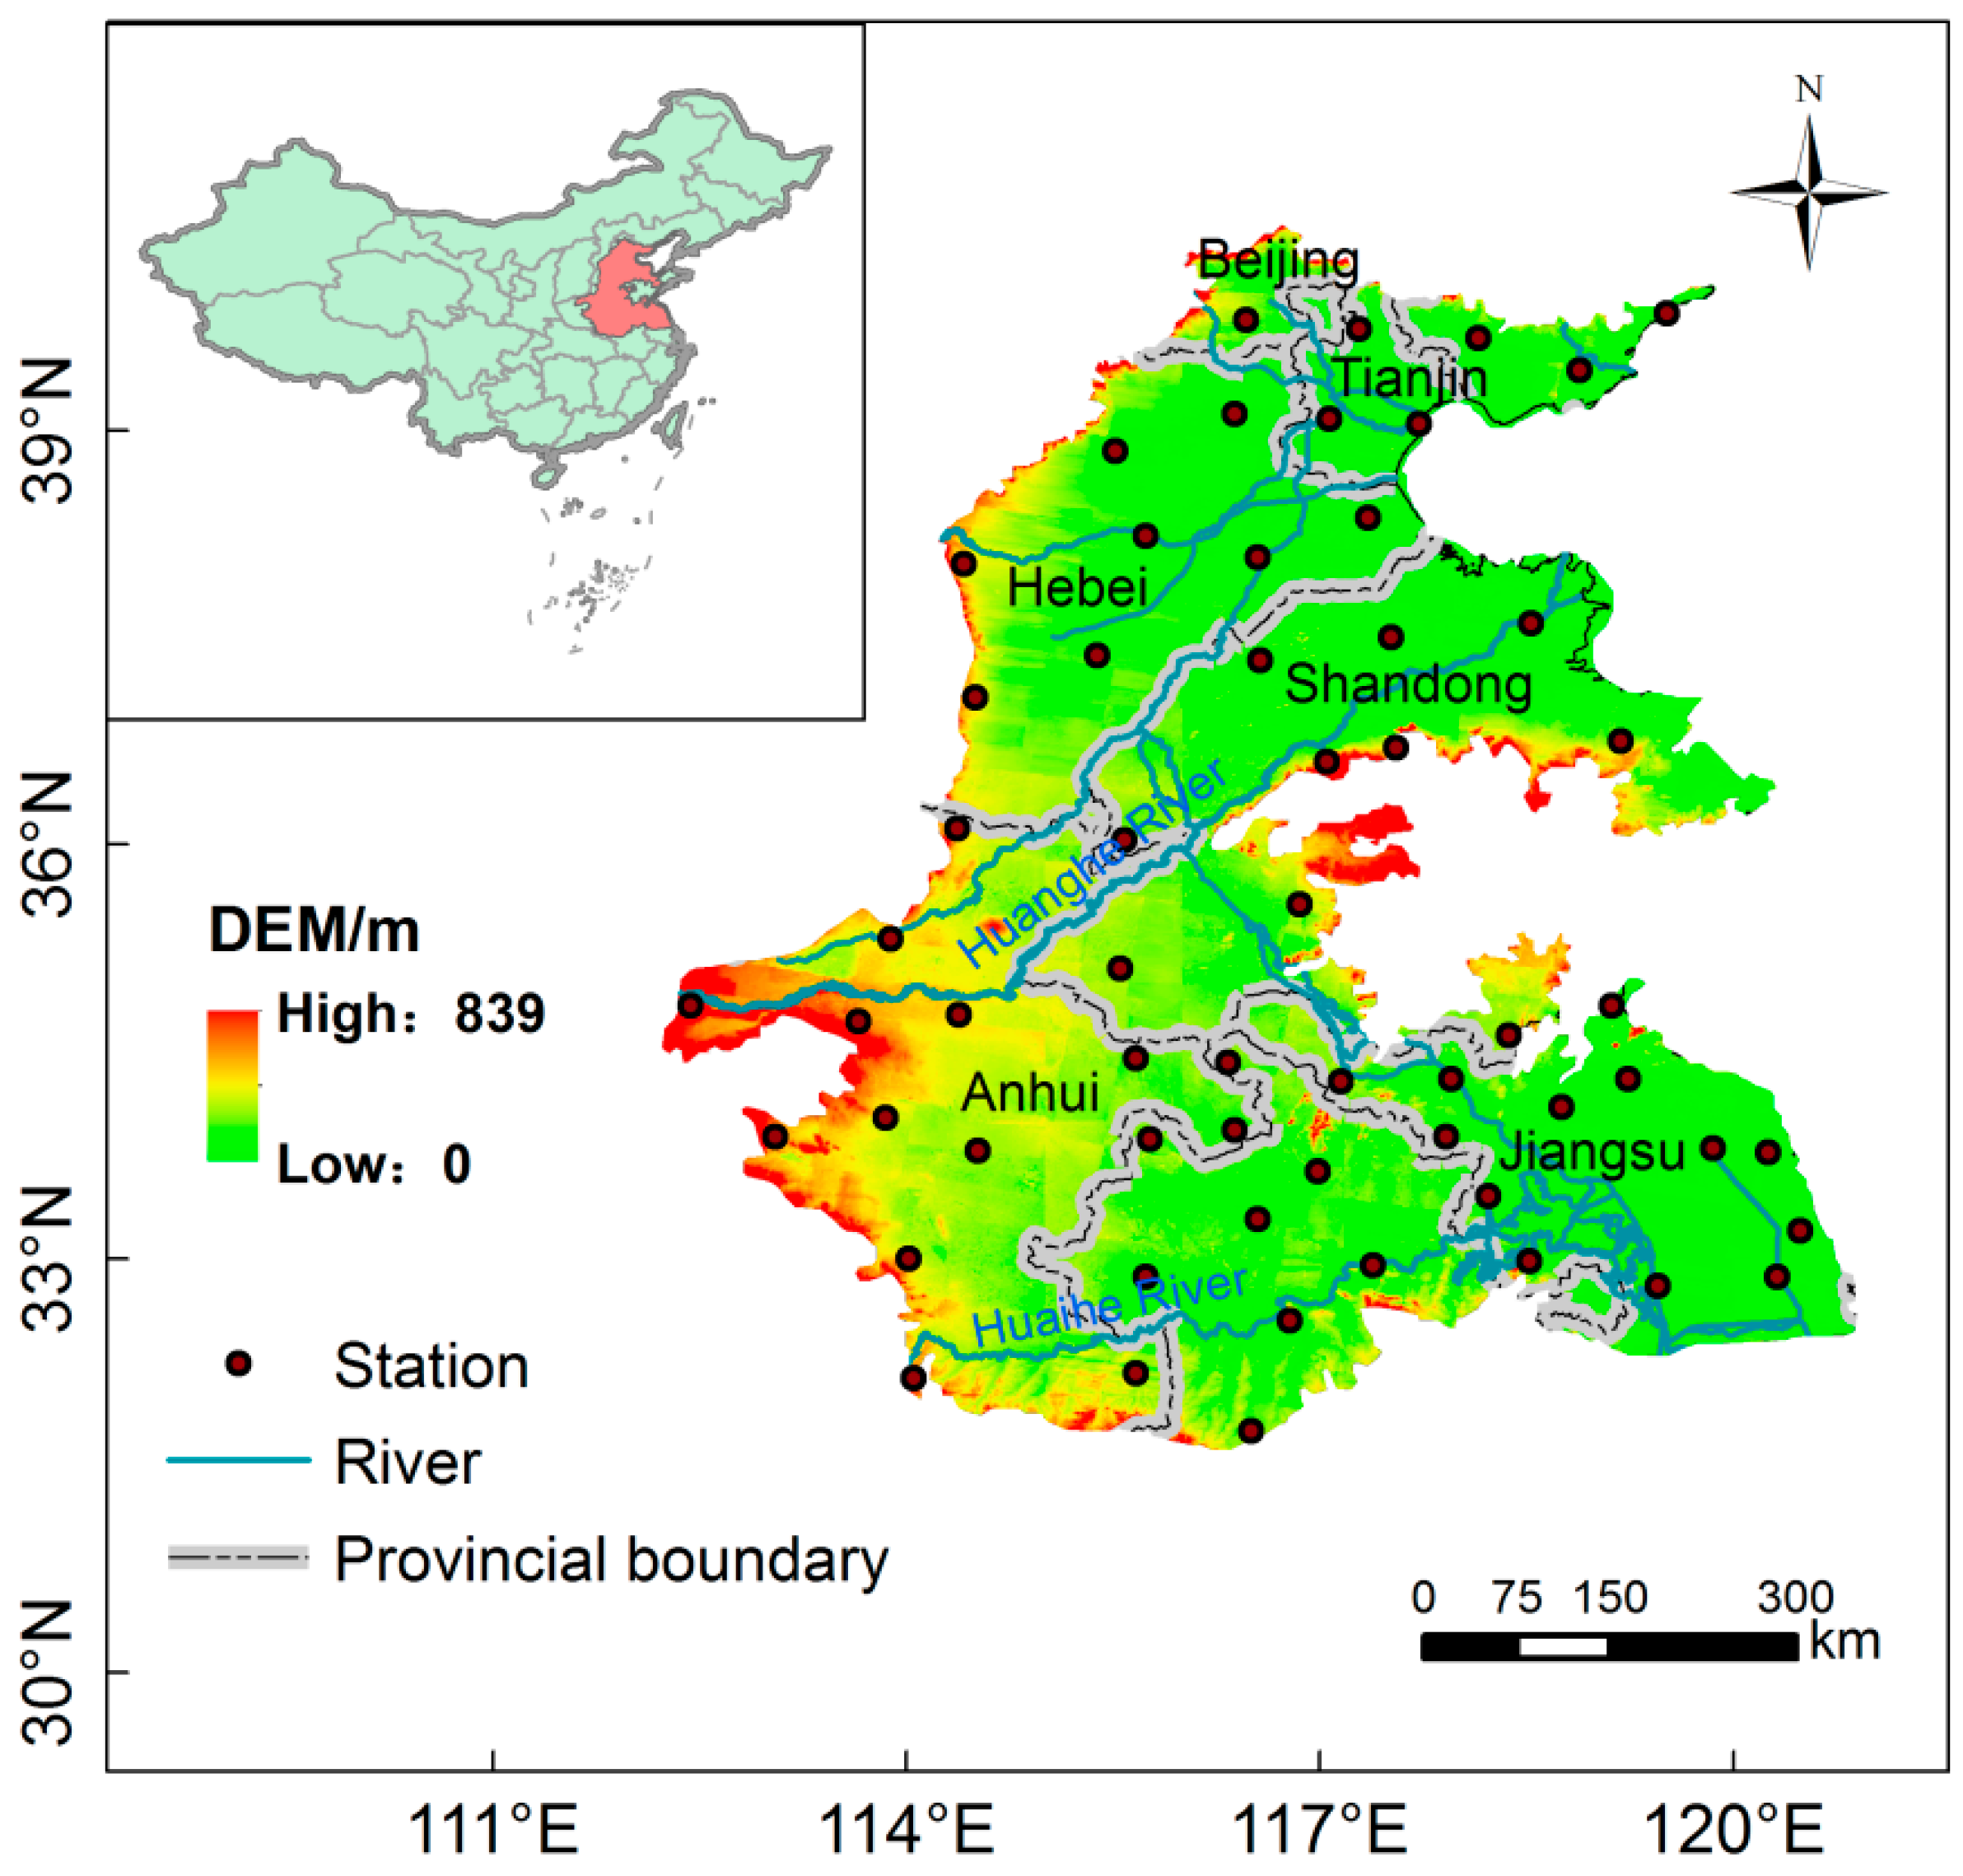
2.1. Study Area

The Huang-Huai-Hai Plain, with a total area of 3 × 10⁵ km2, is the second largest plain in China. It is located in the eastern coastal region of China (112°–121°E and 32°–40°N), covering five provinces (Hebei, Shandong, Henan, Anhui, and Jiangsu) and two administrative cities (Beijing and Tianjin) (Figure 1). The altitude is reduced from the west to the east. In addition, most regions in the study area are less than 50 m above mean sea level in altitude. It is a typical alluvial plain, which is mainly formed by sediments of the Yellow River, Haihe River, and Huaihe River. Climate in the Huang-Huai-Hai Plain is influenced by a continental monsoon. The average annual temperature is between 8–15 °C and average annual precipitation ranges from 500 to 900 mm. Most of the precipitation occurs in the summer months (June–September). Regional differences in annual precipitation are also considerable. The maximum average annual precipitation usually occurs in the south part of the Huaihe River Basin, while the minimum average annual precipitation is located in the Northwestern Haihe River Basin. Hence, the noticeable seasonal and regional variations in precipitation, with frequent droughts and floods, make the Huang-Huai-Hai Plain a good test-bed for evaluating the performance of satellite-based precipitation products. According to the climate conditions of the Huang-Huai-Hai Plain, a year is divided into four seasons, spring (March–May), summer (June–August), autumn (September–November), and winter (December–February) in this study.

2.2. Satellite Precipitation Products

The 3B42V7 and IMERG products are derived from NASA. The spatiotemporal resolution, coverage period, and range are shown in Table 1. TRMM is the first meteorological satellite dedicated to observe tropical and subtropical precipitation. The satellite was equipped with Precipitation Radar (PR), TRMM Microwave Imager (TMI), Lightening Imager Sensor (LIS), Clouds and the Earth’s Radiant Energy System (CERES) as well as Visible and Infrared Sensor (VIRS) [40,41]. The TMPA includes a real-time product (3B42RT) covering the global latitude belt from 60°N to 60°S and a gauge-adjusted post-real-time product (3B42V7) with the coverage of the latitude belt from 50°N to 50°S [42,43]. The TMPA 3B42V7 (hereinafter, 3B42V7) is one of the precipitation products obtained from TRMM merged with other satellite estimates and gauge analysis whenever available, which has been widely applied in hydro-meteorological studies [9,16,39,42]. In this study, the 3B42V7 three-hourly precipitation product from 1 January 2015 to 31 December 2017 was obtained from the Precipitation Measurement Mission (PMM) website [44]. The 3B42V7 three-hourly precipitation files are centered on the hour in the file name. For example, a “12z”-hour file represents data from 1030 to 1330 UTC (Coordinated Universal Time). To calculate the 3B42V7 daily precipitation in accord with the time span of daily precipitation collection at the local meteorological stations (1200-1200 UTC), we assigned a half weight (0.5) to the “12z” files for the current and next days, and defined a full weight (1.0) to the other seven three-hourly files [45]. Subsequently, the precipitation measurements from eight three-hourly precipitation files of a specific day are accumulated and multiplied by a factor of 3 to obtain daily precipitation of 3B42V7 [17]. Thus, the accumulation of daily 3B42V7 precipitation at 1200 UTC contains two half weight of “12z” files and seven full weight of other period files.
As a successor of TRMM, the GPM mission was launched in February 2014 [46]. The GPM Core Observatory carries two major sensors: the GPM Microwave Imager (GMI) and the Dual-frequency Precipitation Radar (DPR) [33]. DPR combined with active radar observation technology provides physical information of cloud precipitation particles from angles, improving the ability to capture light-intensity precipitation (<0.5 mm/h) and solid precipitation [47]. GPM can provide global microwave-based data within three hours and half-hourly rain and snow data product based on the integrated Multi-satellite retrievals for GPM (IMERG).
IMERG provides three types of products, including the near real-time “Early Run” and “Late Run” product, and the post real-time “Final Run” product. The first product is available 6 h after the data retrieval period, while the second product is only released after 18 h. The “Final Run” product also includes the Global Precipitation Climatology Centre (GPCC) product for bias correction, and is available to the public about four months later [25]. In this study, we evaluate the latest IMERG half-hourly final run version 5 product because of its wide applications. The GPM IMERG “Final Run” (hereinafter, IMERG) products are obtained from the PMM website [48]. The IMERG daily product is generated by accumulating precipitation amounts from 48 half-hourly IMERG products. Then, the accumulated precipitation amounts are multiplied by a factor of 0.5 as the unit of the half-hourly products is in mm/h.

2.3. Gauge Precipitation Observations

To evaluate the performance of IMERG and 3B42V7 products, daily precipitation data of 59 meteorological stations covering a period of 2015–2017 are collected from the National Meteorological Information Center of China Meteorological Administration [49]. Locations of these meteorological stations are shown in Figure 1. All observations provided by these stations are subject to strict quality control such as climate limit value inspection, station extreme value inspection, and spatiotemporal consistency inspection [50]. In addition, the annual, seasonal and monthly precipitation values are accumulated from daily observations. To evaluate the capability of IMERG and 3B42V7 products to capture the regional precipitation patterns, the mean annual and seasonal spatial precipitation maps are generated from stations data using Kriging interpolation approach, which can give the Best Linear Unbiased Prediction (BLUP) [51].

3. Methodology

IMERG and 3B42V7 products are compared with the observed precipitation data of stations at annual, seasonal, monthly and daily time scales. However, satellite-based products stand for the grid-scale precipitation estimates (0.1° for IMERG and 0.25° for 3B42V7, respectively), while observations from meteorological stations represent point-scale precipitation. In addition, some researchers have emphasized that interpolation might bring to some uncertainties due to systematic error and gauge’s density [52]. Therefore, a more direct comparison is used in this study, i.e., the stations within a grid box are extracted and matched to the box. As for a grid with more than one station, the average value of those stations is compared with the satellite data of the corresponding grid [9]. We consider only grids covering at least one station, and other grids that don’t contain stations are excluded from the assessment [53,54].
The evaluation and comparison of IMERG and 3B42V7 products are conducted based on general assessment (continuous statistical metrics) and precipitation detection capability (categorical statistical metrics) (Table 2). The continuous statistical metrics including correlation coefficient (CC), relative error (RB) and root mean square error (RMSE) are used to quantitatively compare the performance of satellite products versus rain gauged precipitation observations [54,55]. CC is used to evaluate the degree of linear correlation between the satellite precipitation estimates and stations data, with values ranging from −1 to 1 [56]. RB describes the systematic bias between the satellite precipitation estimates and the stations data. Positive values of RB represent overestimations of satellite precipitation, whereas negative values imply underestimations. RMSE is applied to assess the overall level of error and accuracy of satellite precipitation products, with values ranging from 0 to +∞. To evaluate the precipitation detection capability of IMERG and 3B42V7 products, four widely used categorical statistical metrics such as probability of detection (POD), false alarm ratio (FAR), critical success index (CSI), and accuracy (ACC) are used in this study. The values of all categorical statistical metrics are between 0 and 1. POD is used to describe the ratio of precipitation occurrences correctly detected by the satellite precipitation products among all the actual precipitation events. FAR represents the fraction of precipitation occurrences falsely detected (false alarm) to the total number of detected precipitation events. CSI, being the function of POD and FAR, denotes the overall fraction of precipitation events correctly detected by the satellite products [45]. ACC indicates the fraction of precipitation and no-precipitation events correctly detected by the satellite products among all the events. Perfect scores of POD, CSI, ACC, and FAR are 1, 1, 1, and 0, respectively. A commonly used value of 1 mm/day is set for the precipitation and no-precipitation threshold [28,57].
According to the standards of the World Meteorological Organization (WMO) with minor adjustments, precipitation intensity was divided into eight classes (mm/d): (1) 0–0.1 (trace precipitation); (2) 0.1–1 (tiny precipitation); (3) 1–2 (light precipitation); (4) 2–5 (low moderate precipitation); (5) 5–10 (high moderate precipitation); (6) 10–20 (low heavy precipitation); (7) 20–50 (high heavy precipitation); (8) >50 (violent precipitation) [15,25]. Additionally, the detection capabilities of different precipitation intensities are also studied based on the various divisions of precipitation intensity.

4. Results

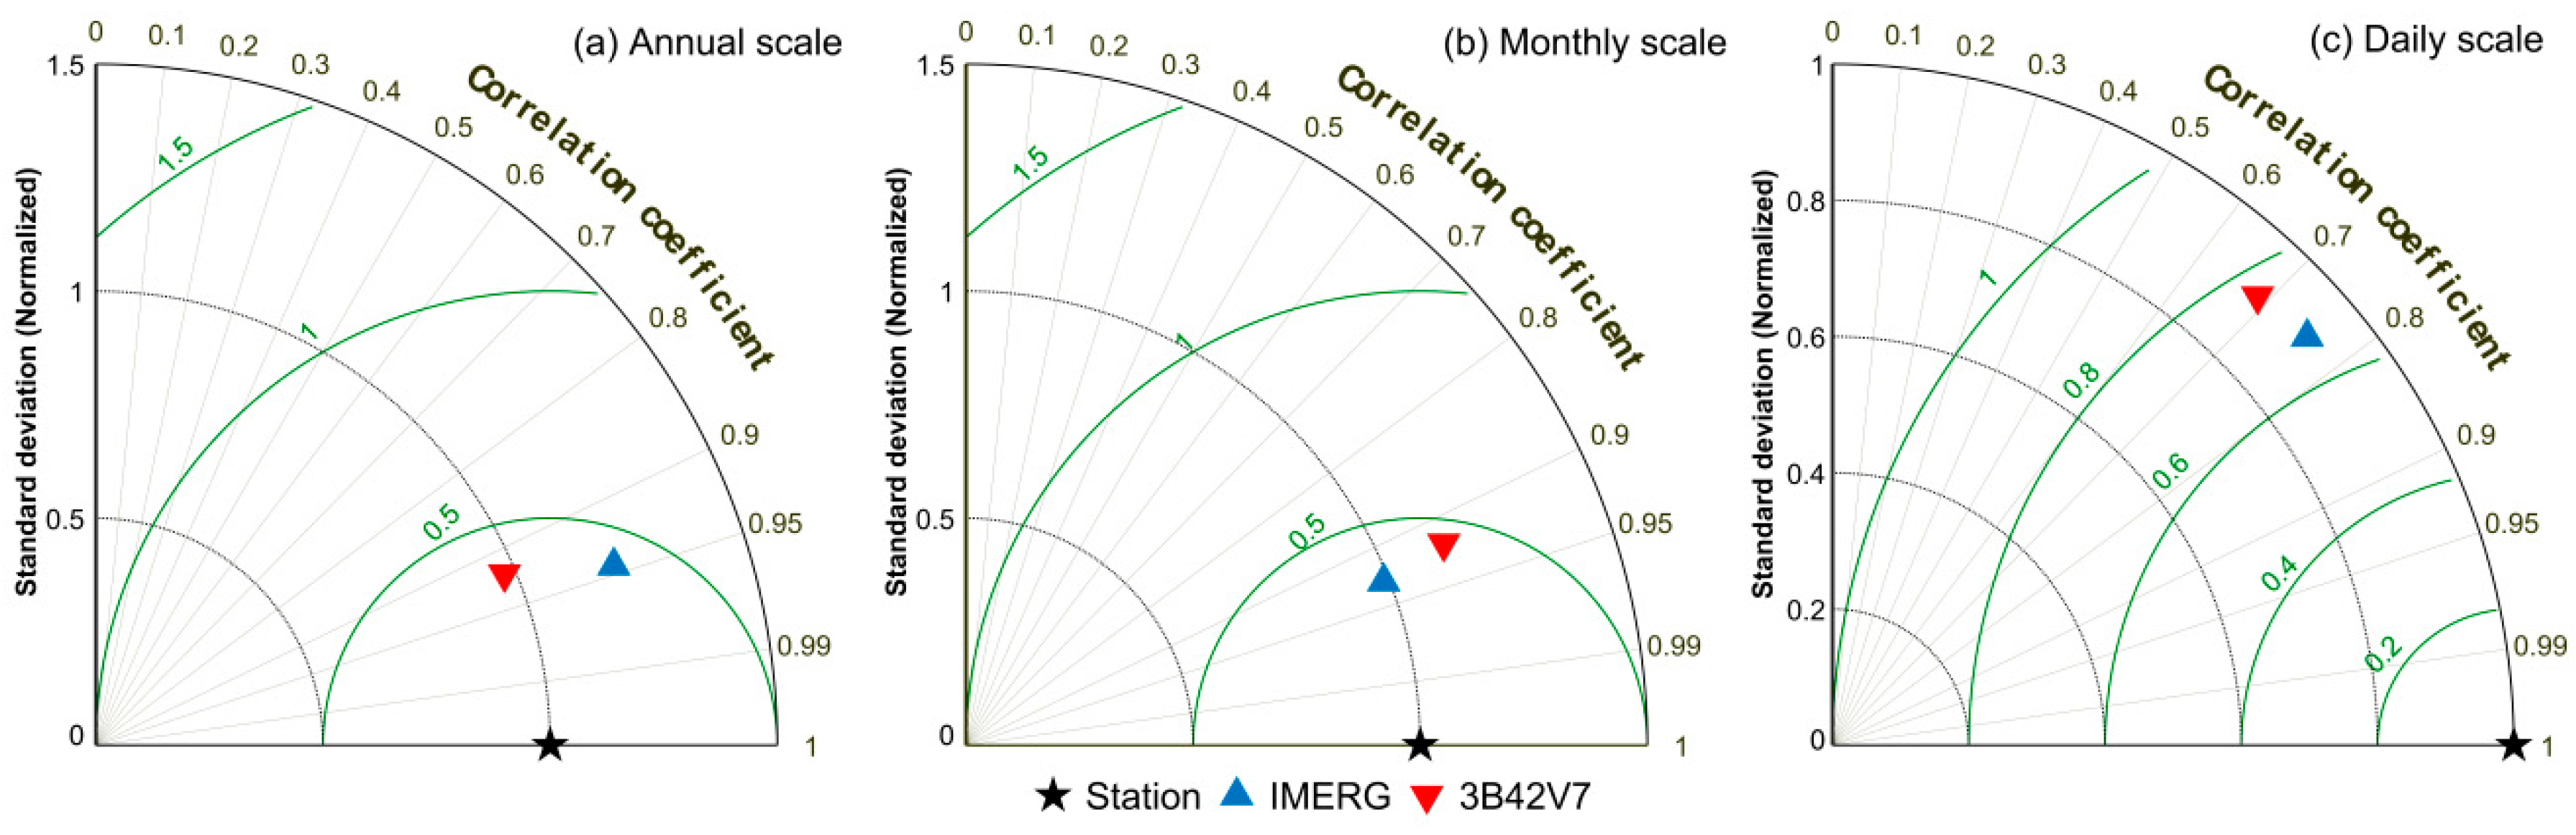
4.1. IMERG and 3B42V7 Multi-Scales Validation
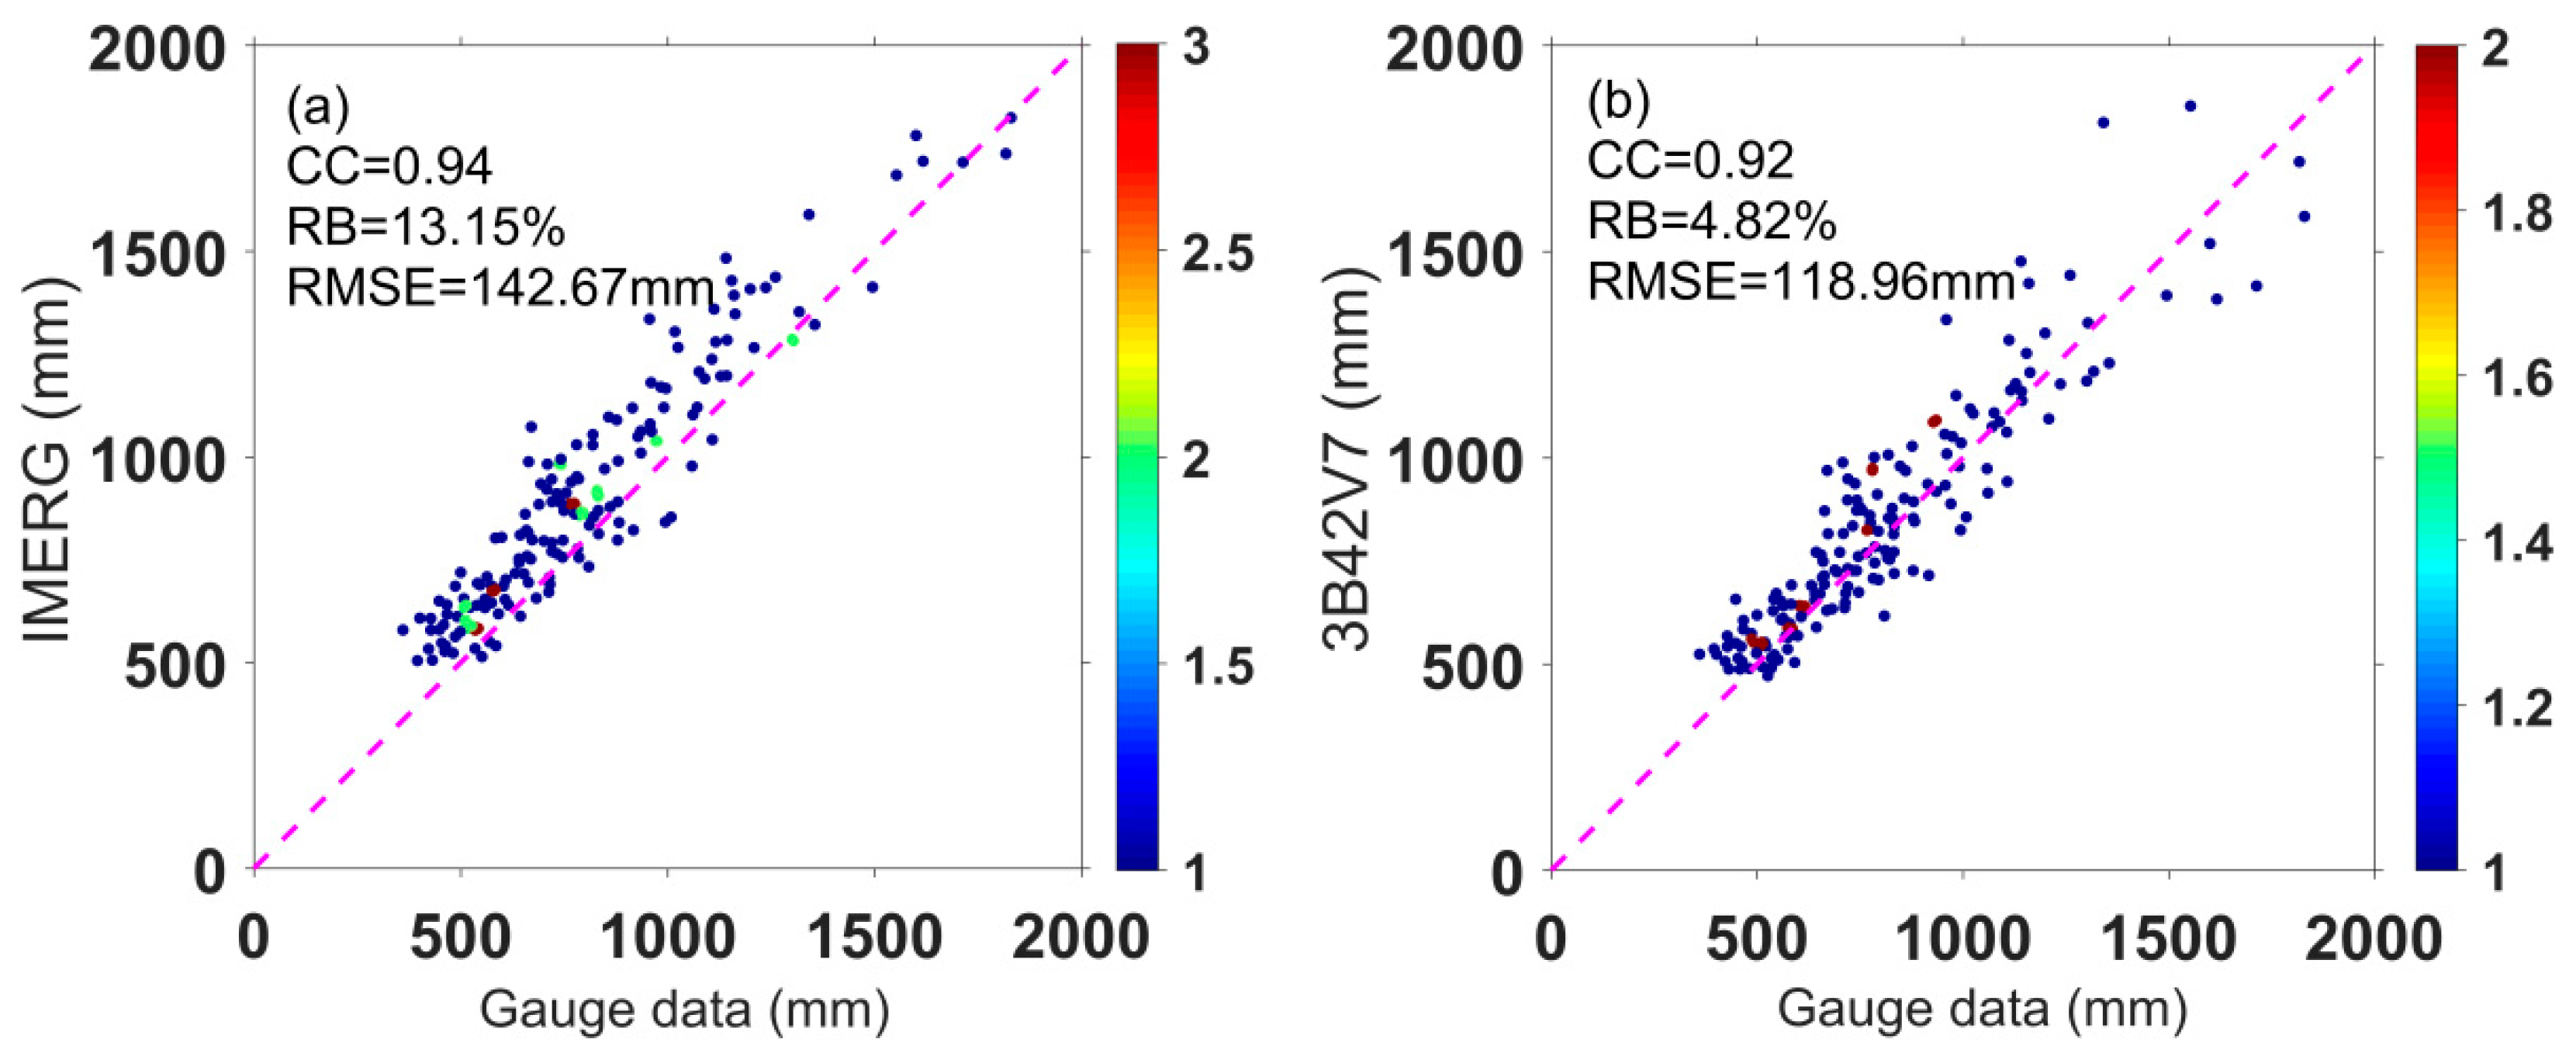
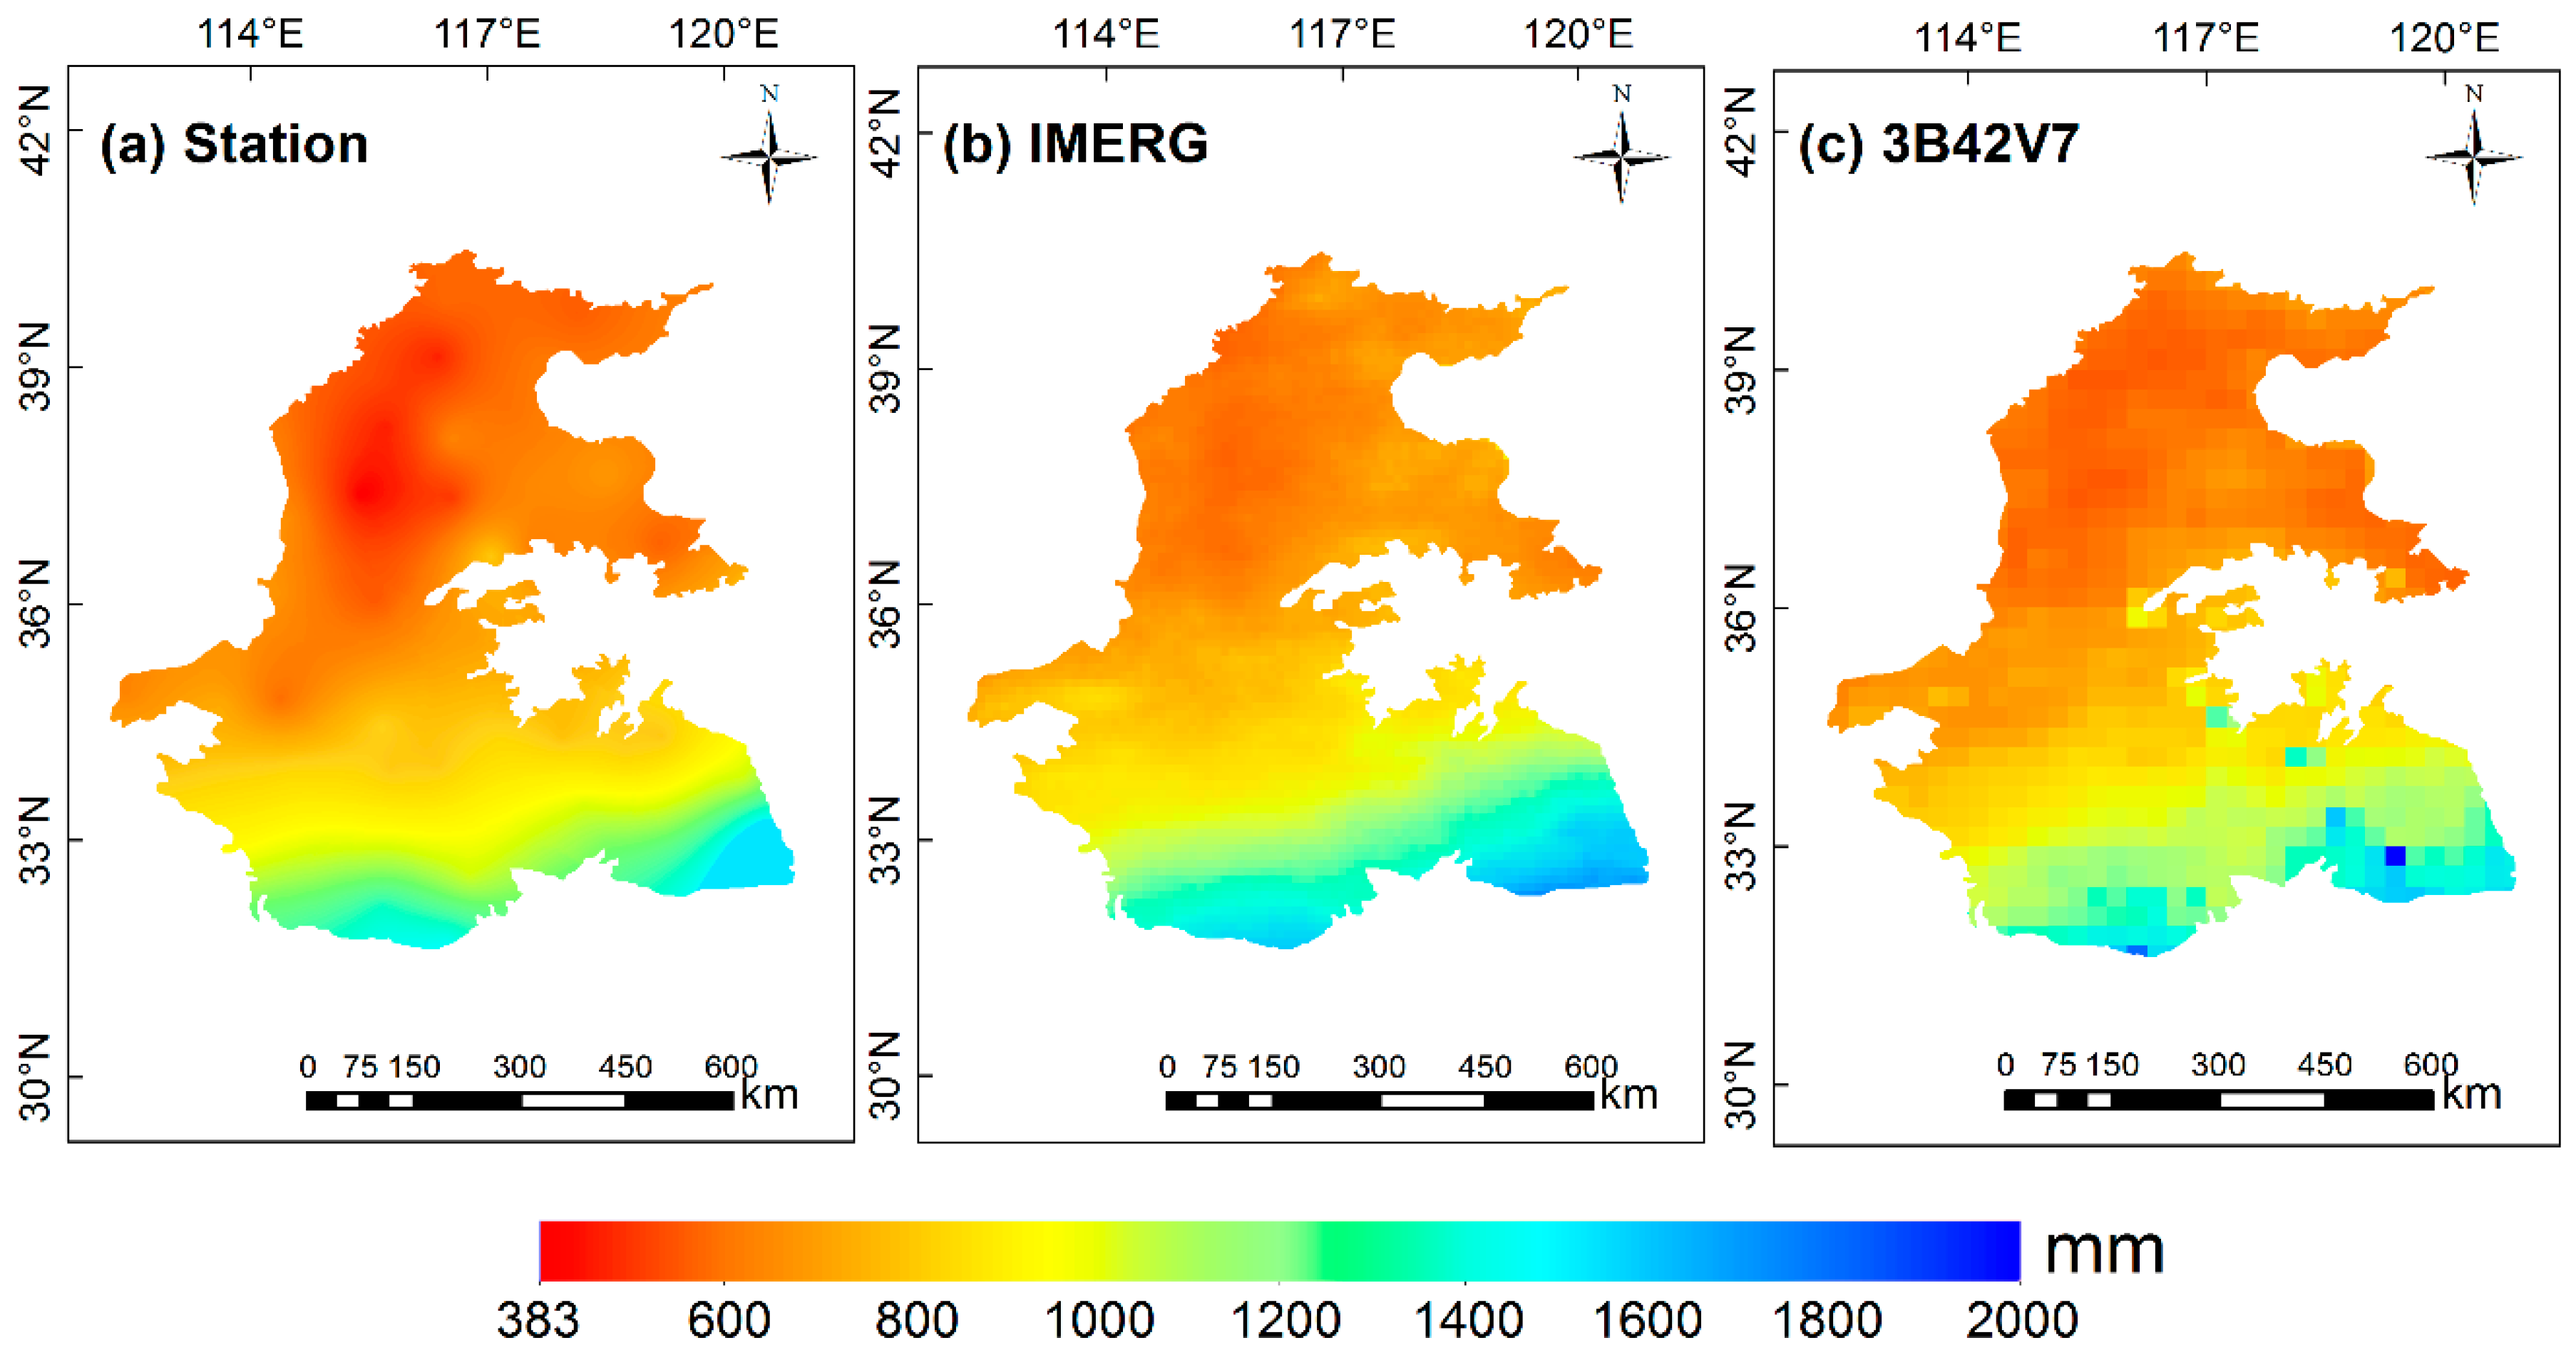
4.1.1. Annual Scale

Figure 2 shows density-colored scatterplots and statistical metrics for the IMERG and 3B42V7 products versus stations observations for the quantitative comparison of mean annual precipitation over the Huang-Huai-Hai Plain. Obviously, the scatterplots of IMERG and 3B42V7 products against stations observations exhibit a concentration of the points near the 1:1 line. Both IMERG and 3B42V7 products present a strong correlation with the stations data at the annual scale, with high CC values of 0.94 and 0.92, respectively. Additionally, IMERG overestimates 13.15% of the precipitation amount, while 3B42V7 overestimates 4.82% of the precipitation amount. With respect to the annual RMSE, 3B42V7 has a smaller error (118.96 mm) than IMERG (142.67 mm), indicating 3B42V7 estimates are closer to stations observations. In addition, Taylor diagrams are plotted to compare how well IMERG and 3B42V7 products match the stations data in the Huang-Huai-Hai Plain, in terms of CC, normalized standard deviation (NSD) and centered RMSE, on different time scales [58]. In Taylor diagram, the smaller the distance between the point of the satellite product and station, indicates a closer agreement. However, IMERG does not exhibit expected improvements compared with 3B42V7 at the annual scale (Figure 3a).
The spatial distribution of average annual precipitation from stations and satellite precipitation products is shown in Figure 4, presenting the similar spatial pattern with the precipitation gradually decreasing from the south to north. Generally, both IMERG and 3B42V7 products exhibit good capacity in capturing the spatial characteristics of average annual precipitation compared to the stations observations. However, IMERG seems to overestimate precipitation in the northeast part of the Huang-Huai-Hai Plain. In addition, IMERG is able to represent more detailed spatial features of annual precipitation than 3B42V7 due to a finer resolution.

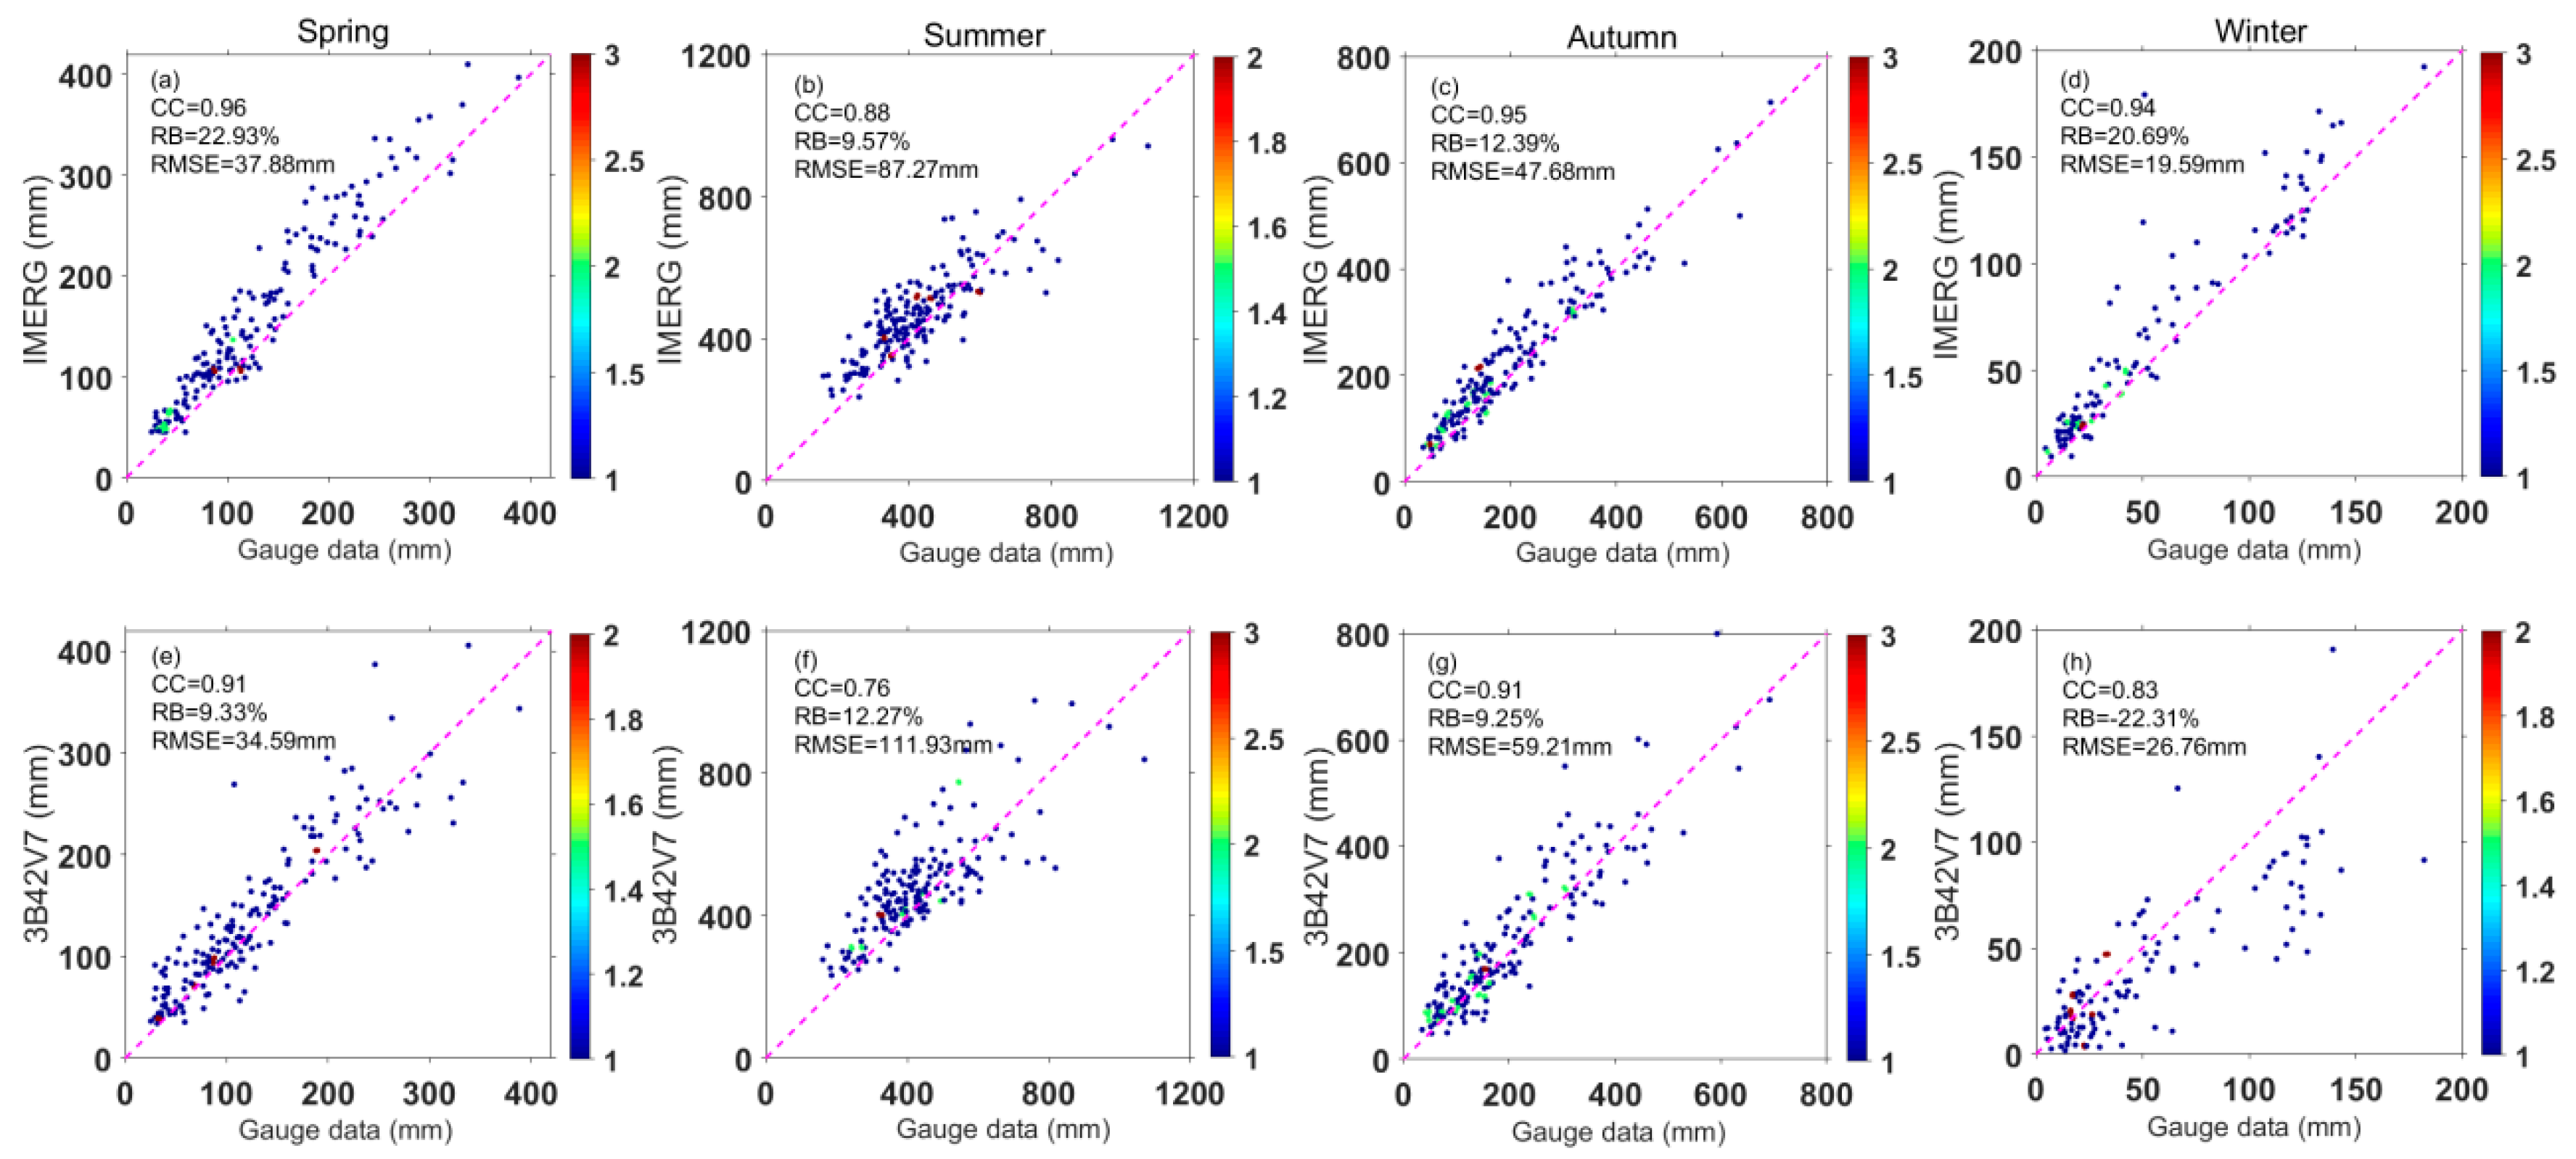
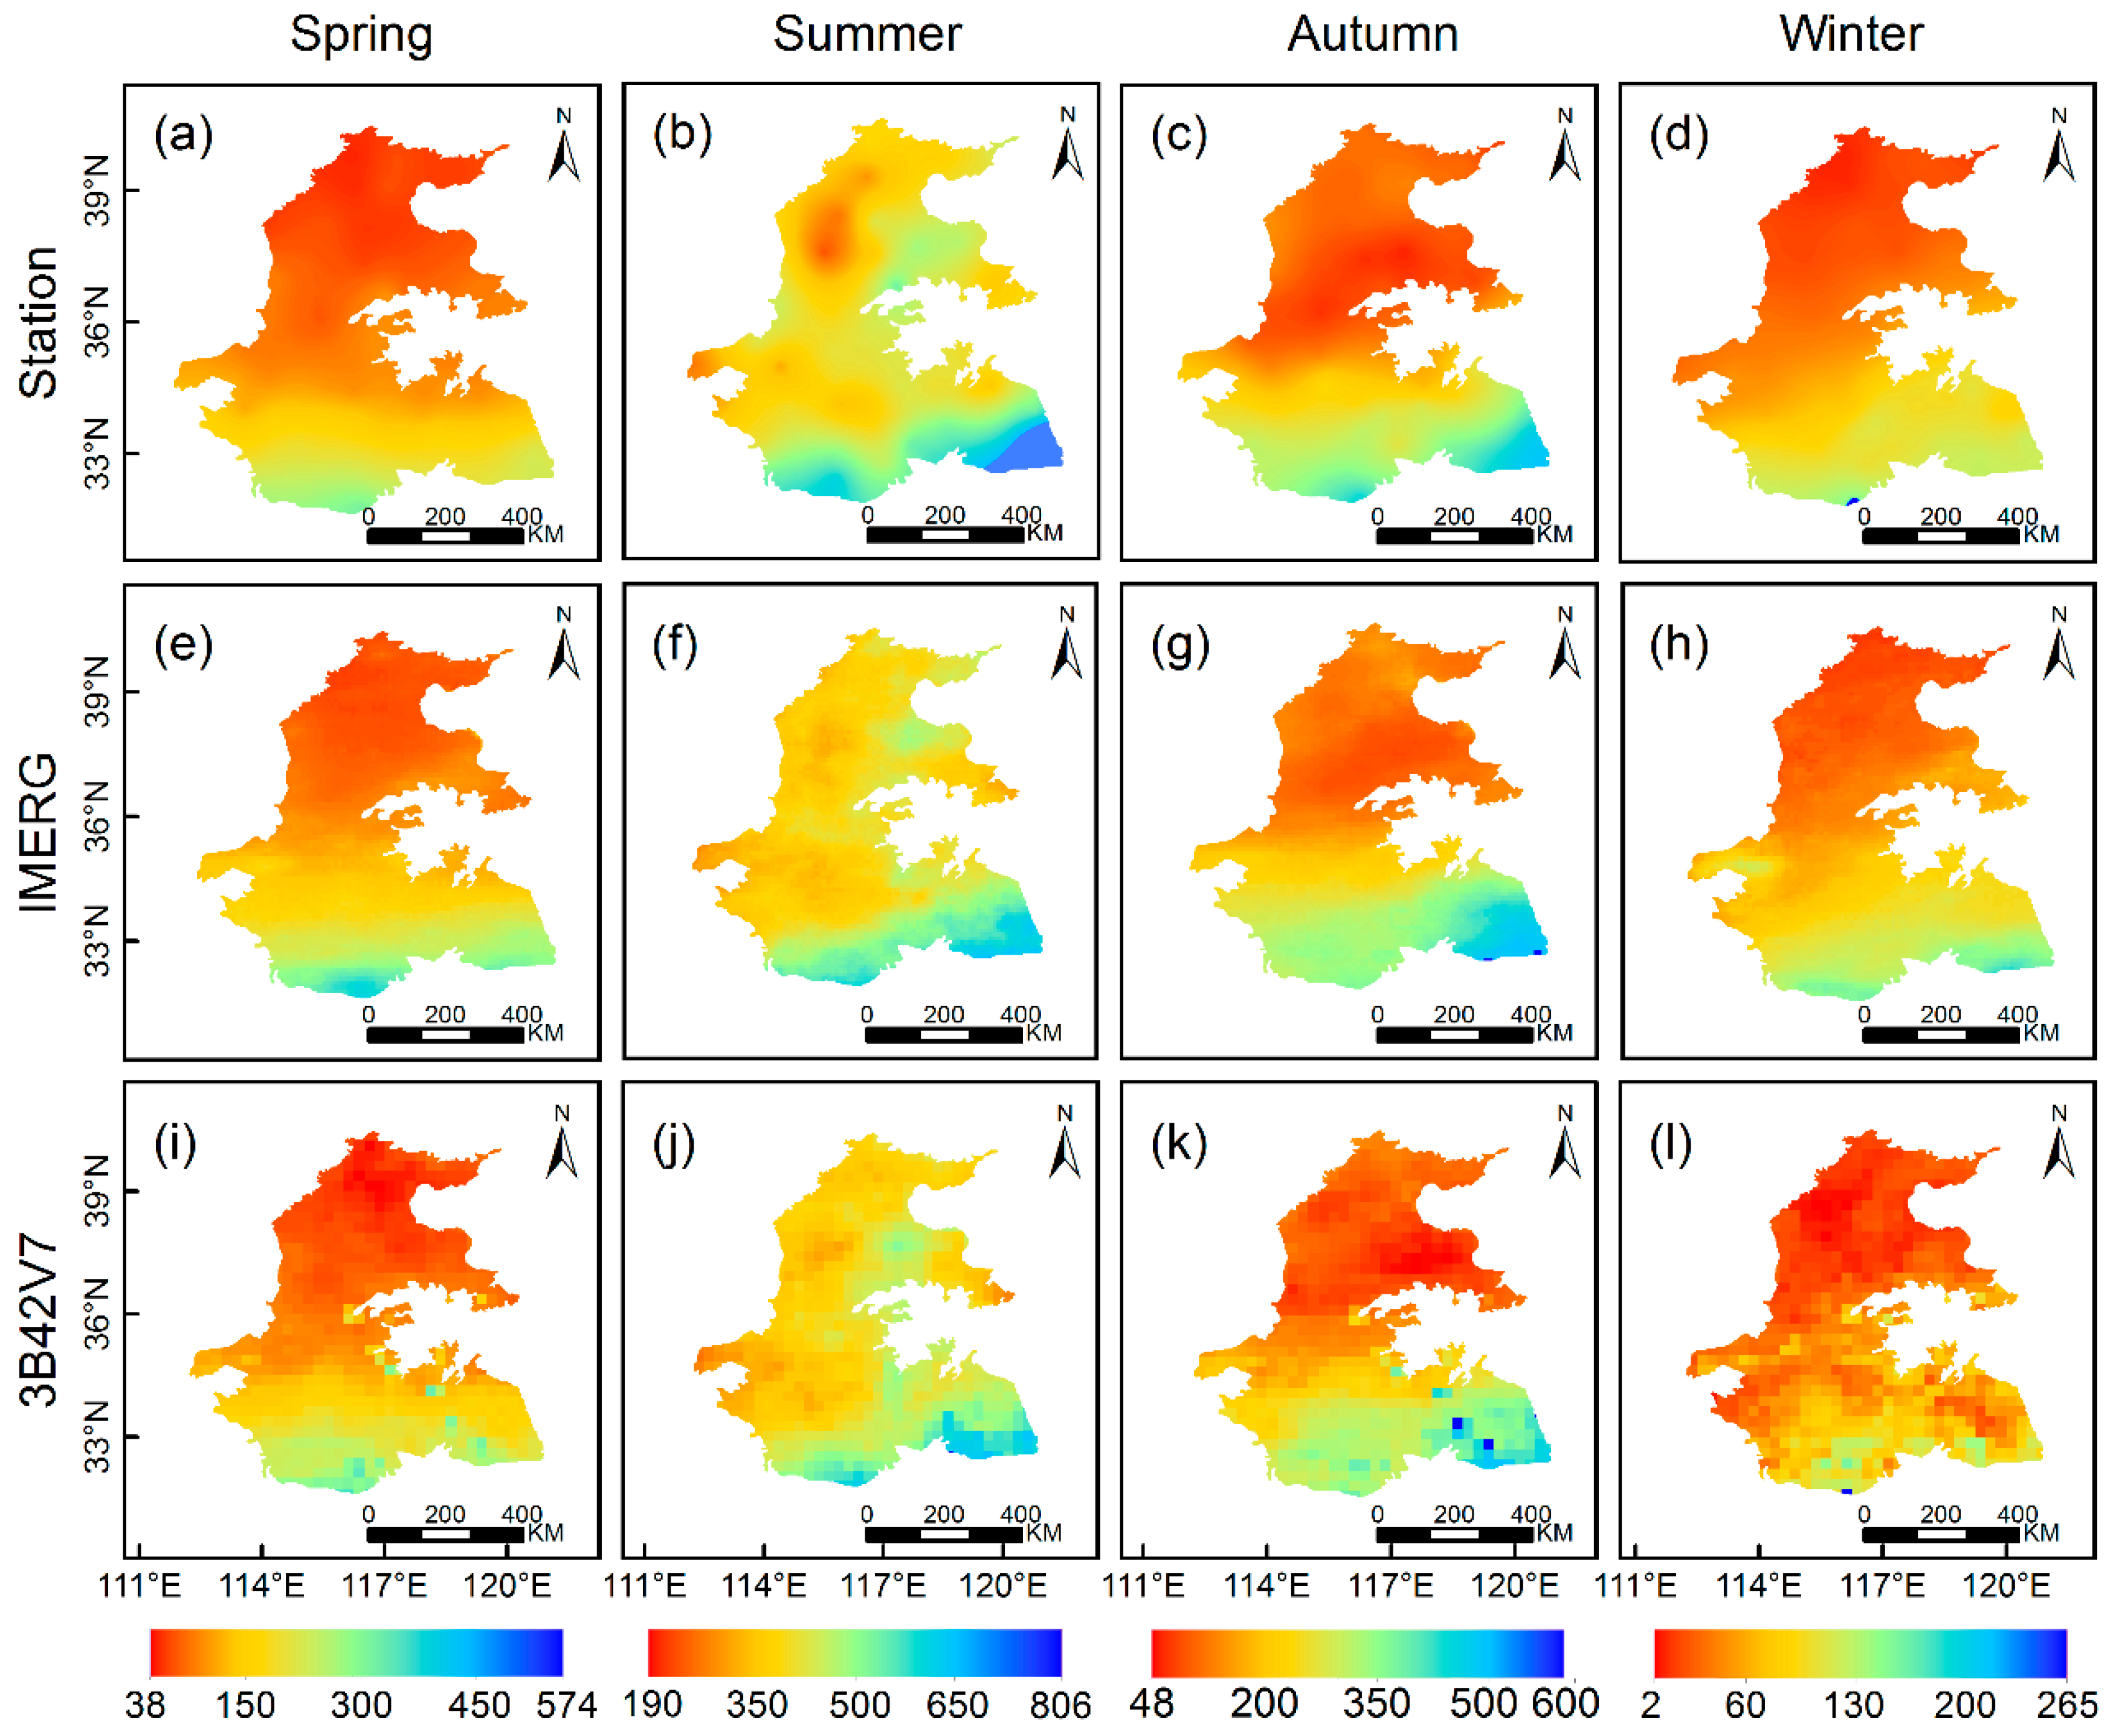
4.1.2. Seasonal Scale

The assessment of seasonal precipitation from IMERG and 3B42V7 products is also conducted in this study. The density-colored scatterplots of the satellite precipitation products versus stations observations are shown in Figure 5. In general, IMERG shows better agreement with stations data than 3B42V7 in all seasons as indicated by higher CC. However, both IMERG and 3B42V7 products have the lowest CC (0.88 and 0.76, respectively) in summer, which may be due to high precipitation, large spatial variation, and various precipitation types (such as convective, frontal and terrain) in this season. Moreover, the IMERG product overestimates precipitation in every season in terms of RB values (22.93% in spring, 9.57% in summer, 12.39% in autumn, and 20.69% in winter). In contrast, 3B42V7 underestimates precipitation in winter based on the RB value of −22.31%. As for seasonal RMSE, IMERG has lower values than 3B42V7 in summer, autumn, and winter, indicating IMERG estimation shows better agreements with stations observations. Overall, IMERG shows improvements in observation of seasonal precipitation compared to 3B42V7 product.
The seasonal distribution of precipitation over the Huang-Huai-Hai Plain drastically varies due to the influences of the temperate monsoon and air pressure belt. Figure 6 displays the spatial distribution of average precipitation for each season from stations and satellite precipitation products over the Huang-Huai-Hai Plain. Obviously, IMERG and 3B42V7 generally capture the spatial distribution of precipitation for each season in most regions of the Huang-Huai-Hai Plain. However, IMERG and 3B42V7 overestimate the precipitation in the north part of the Huang-Huai-Hai Plain and underestimate the precipitation in the south part of the study area in summer and autumn. In contrast, abnormal underestimation patterns in 3B42V7 can be seen over the south of the Huang-Huai-Hai Plain in winter, which may be attributed to the snowfall. Overall, IMERG product is spatially more similar to the stations data compared with 3B42V7 for the four seasons.

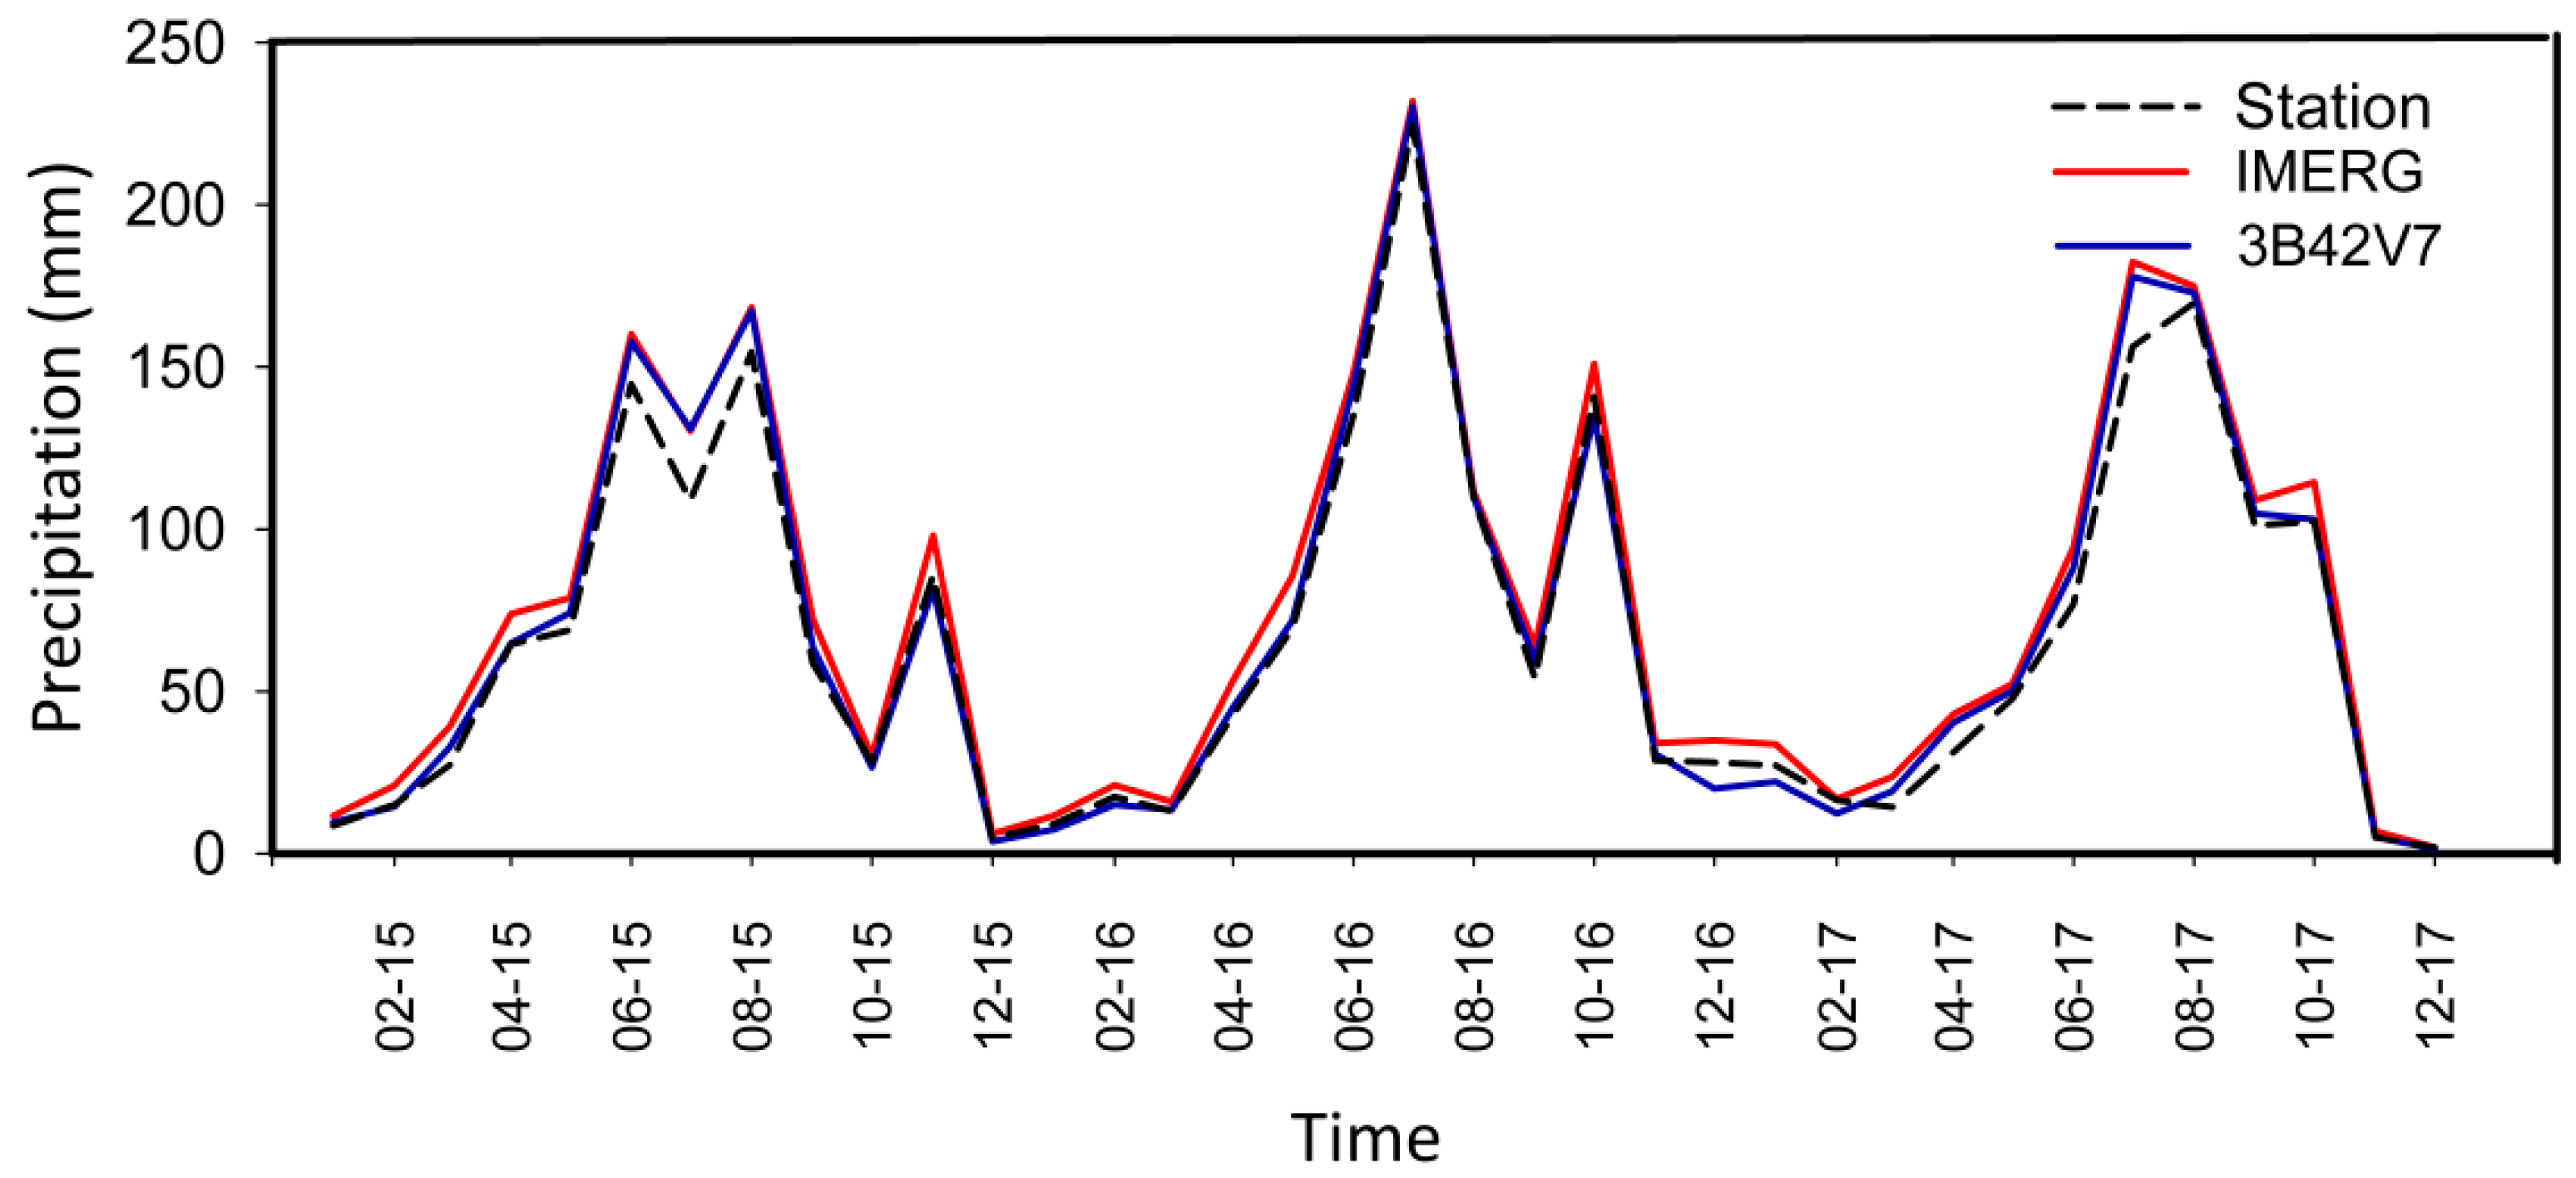
4.1.3. Monthly Scale
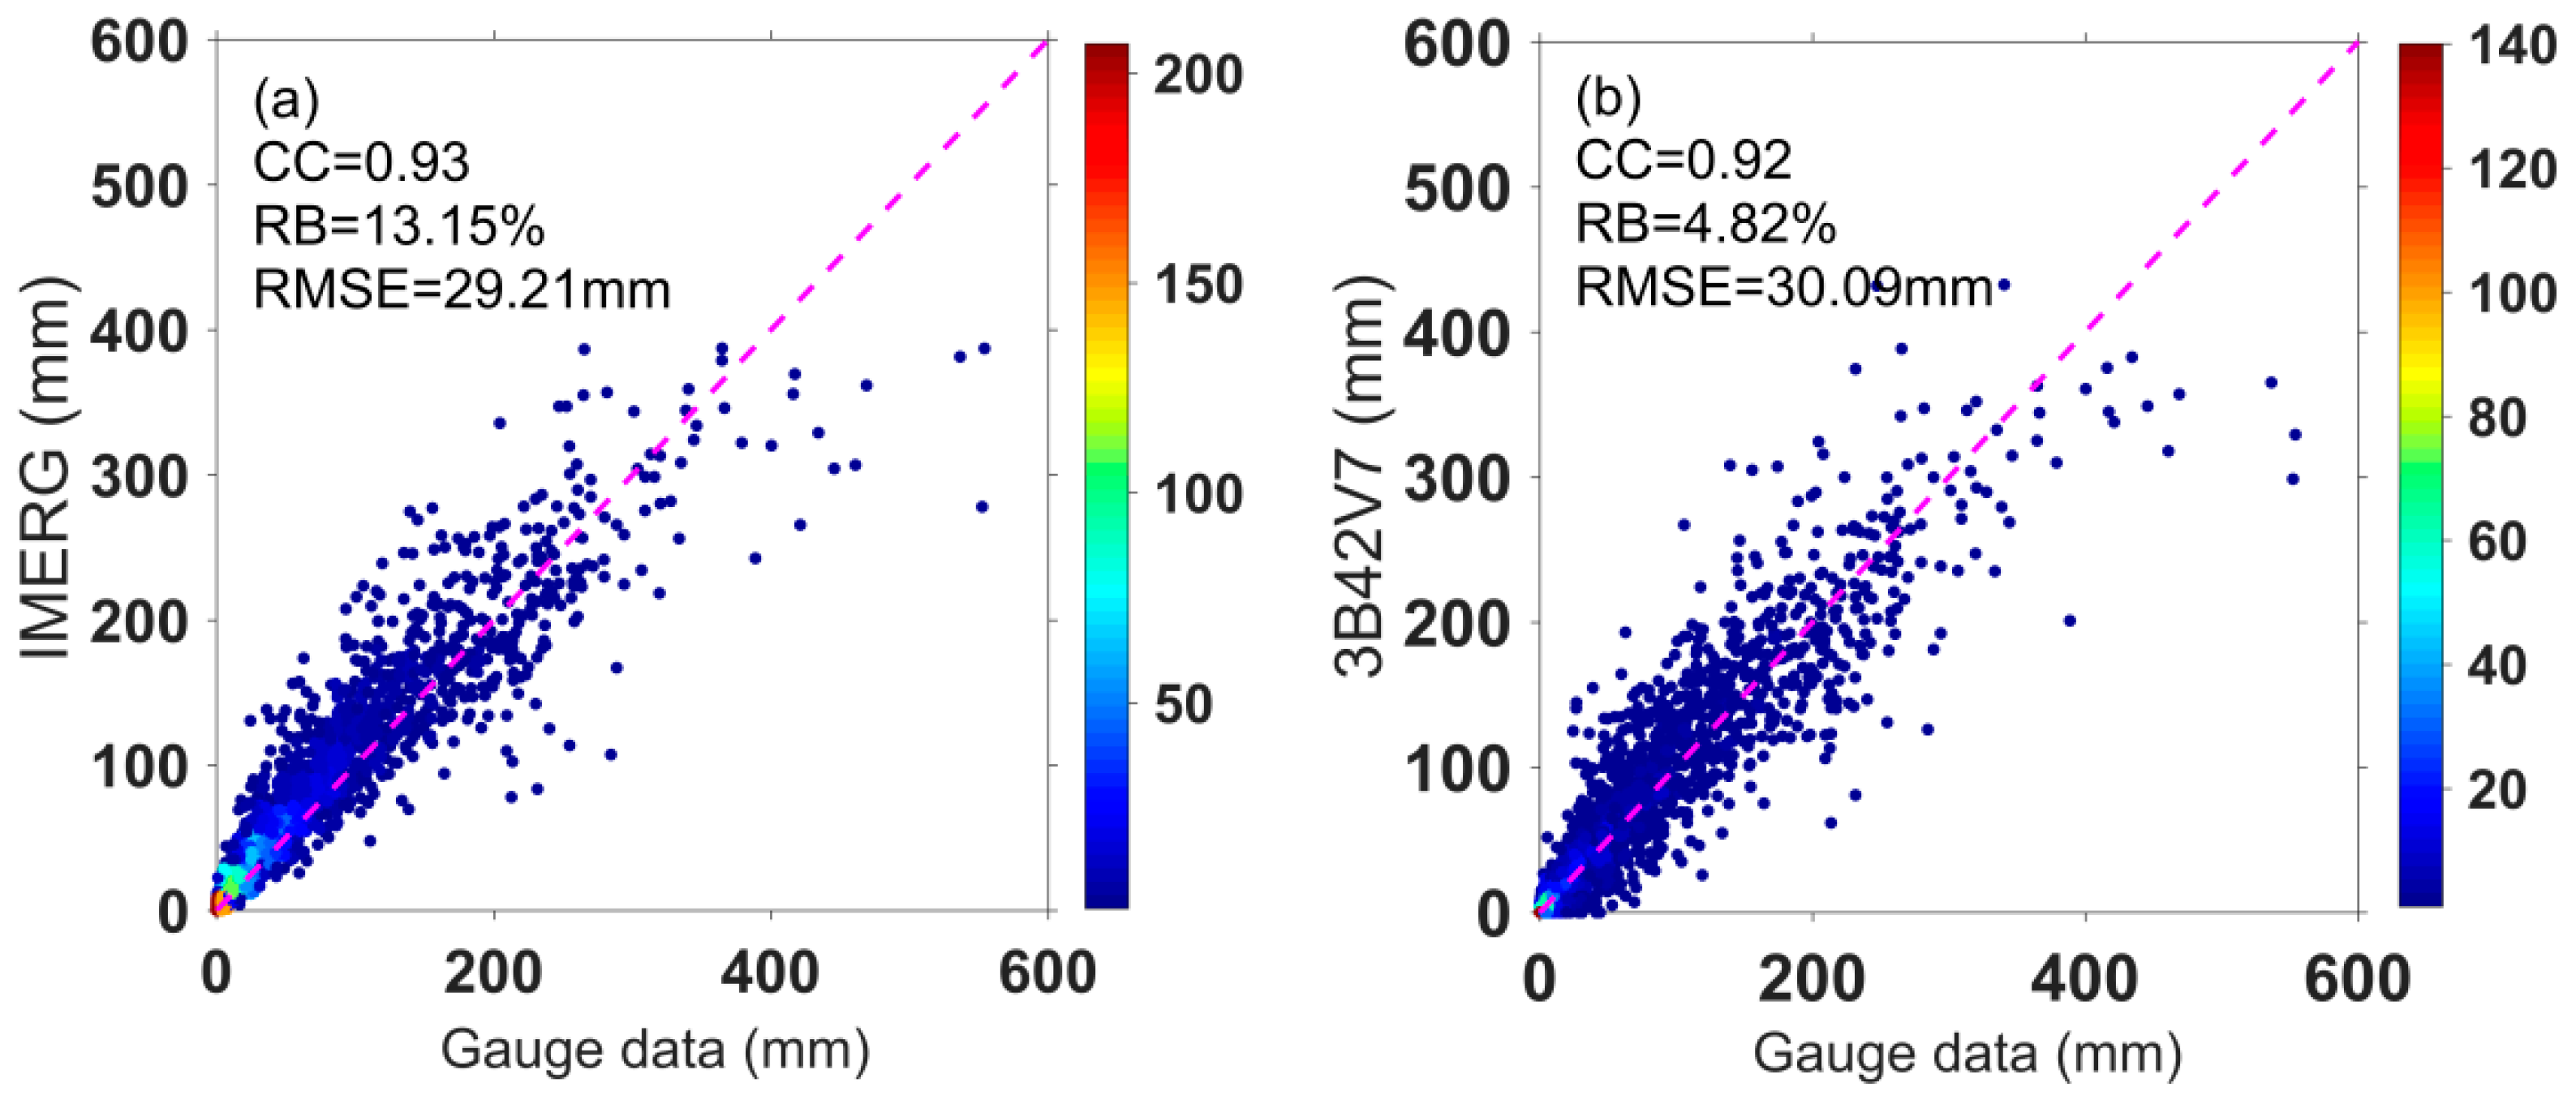
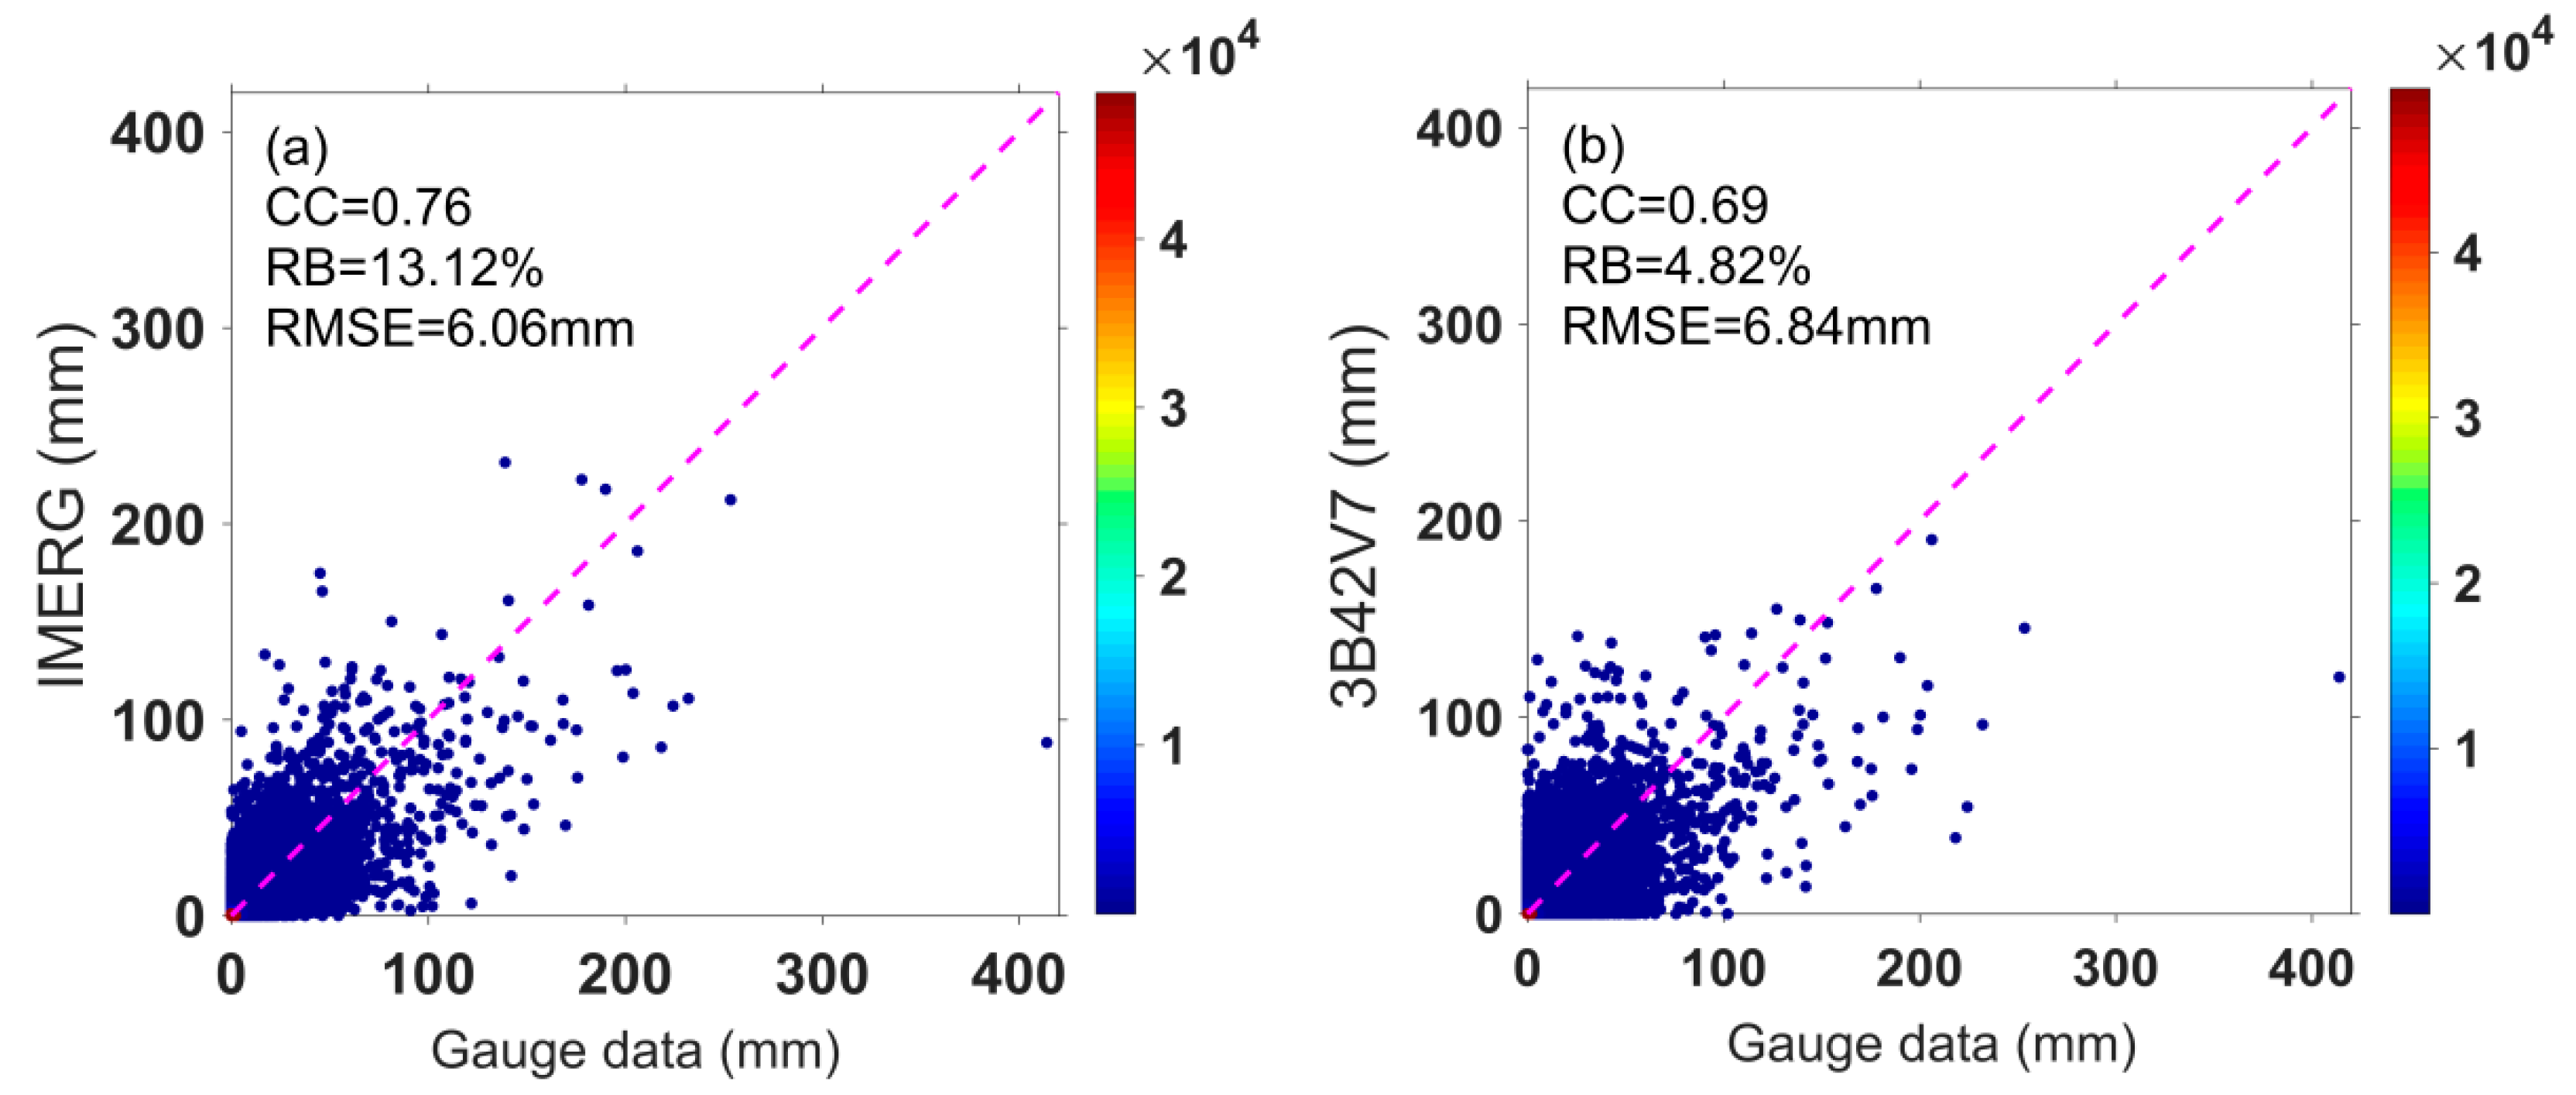
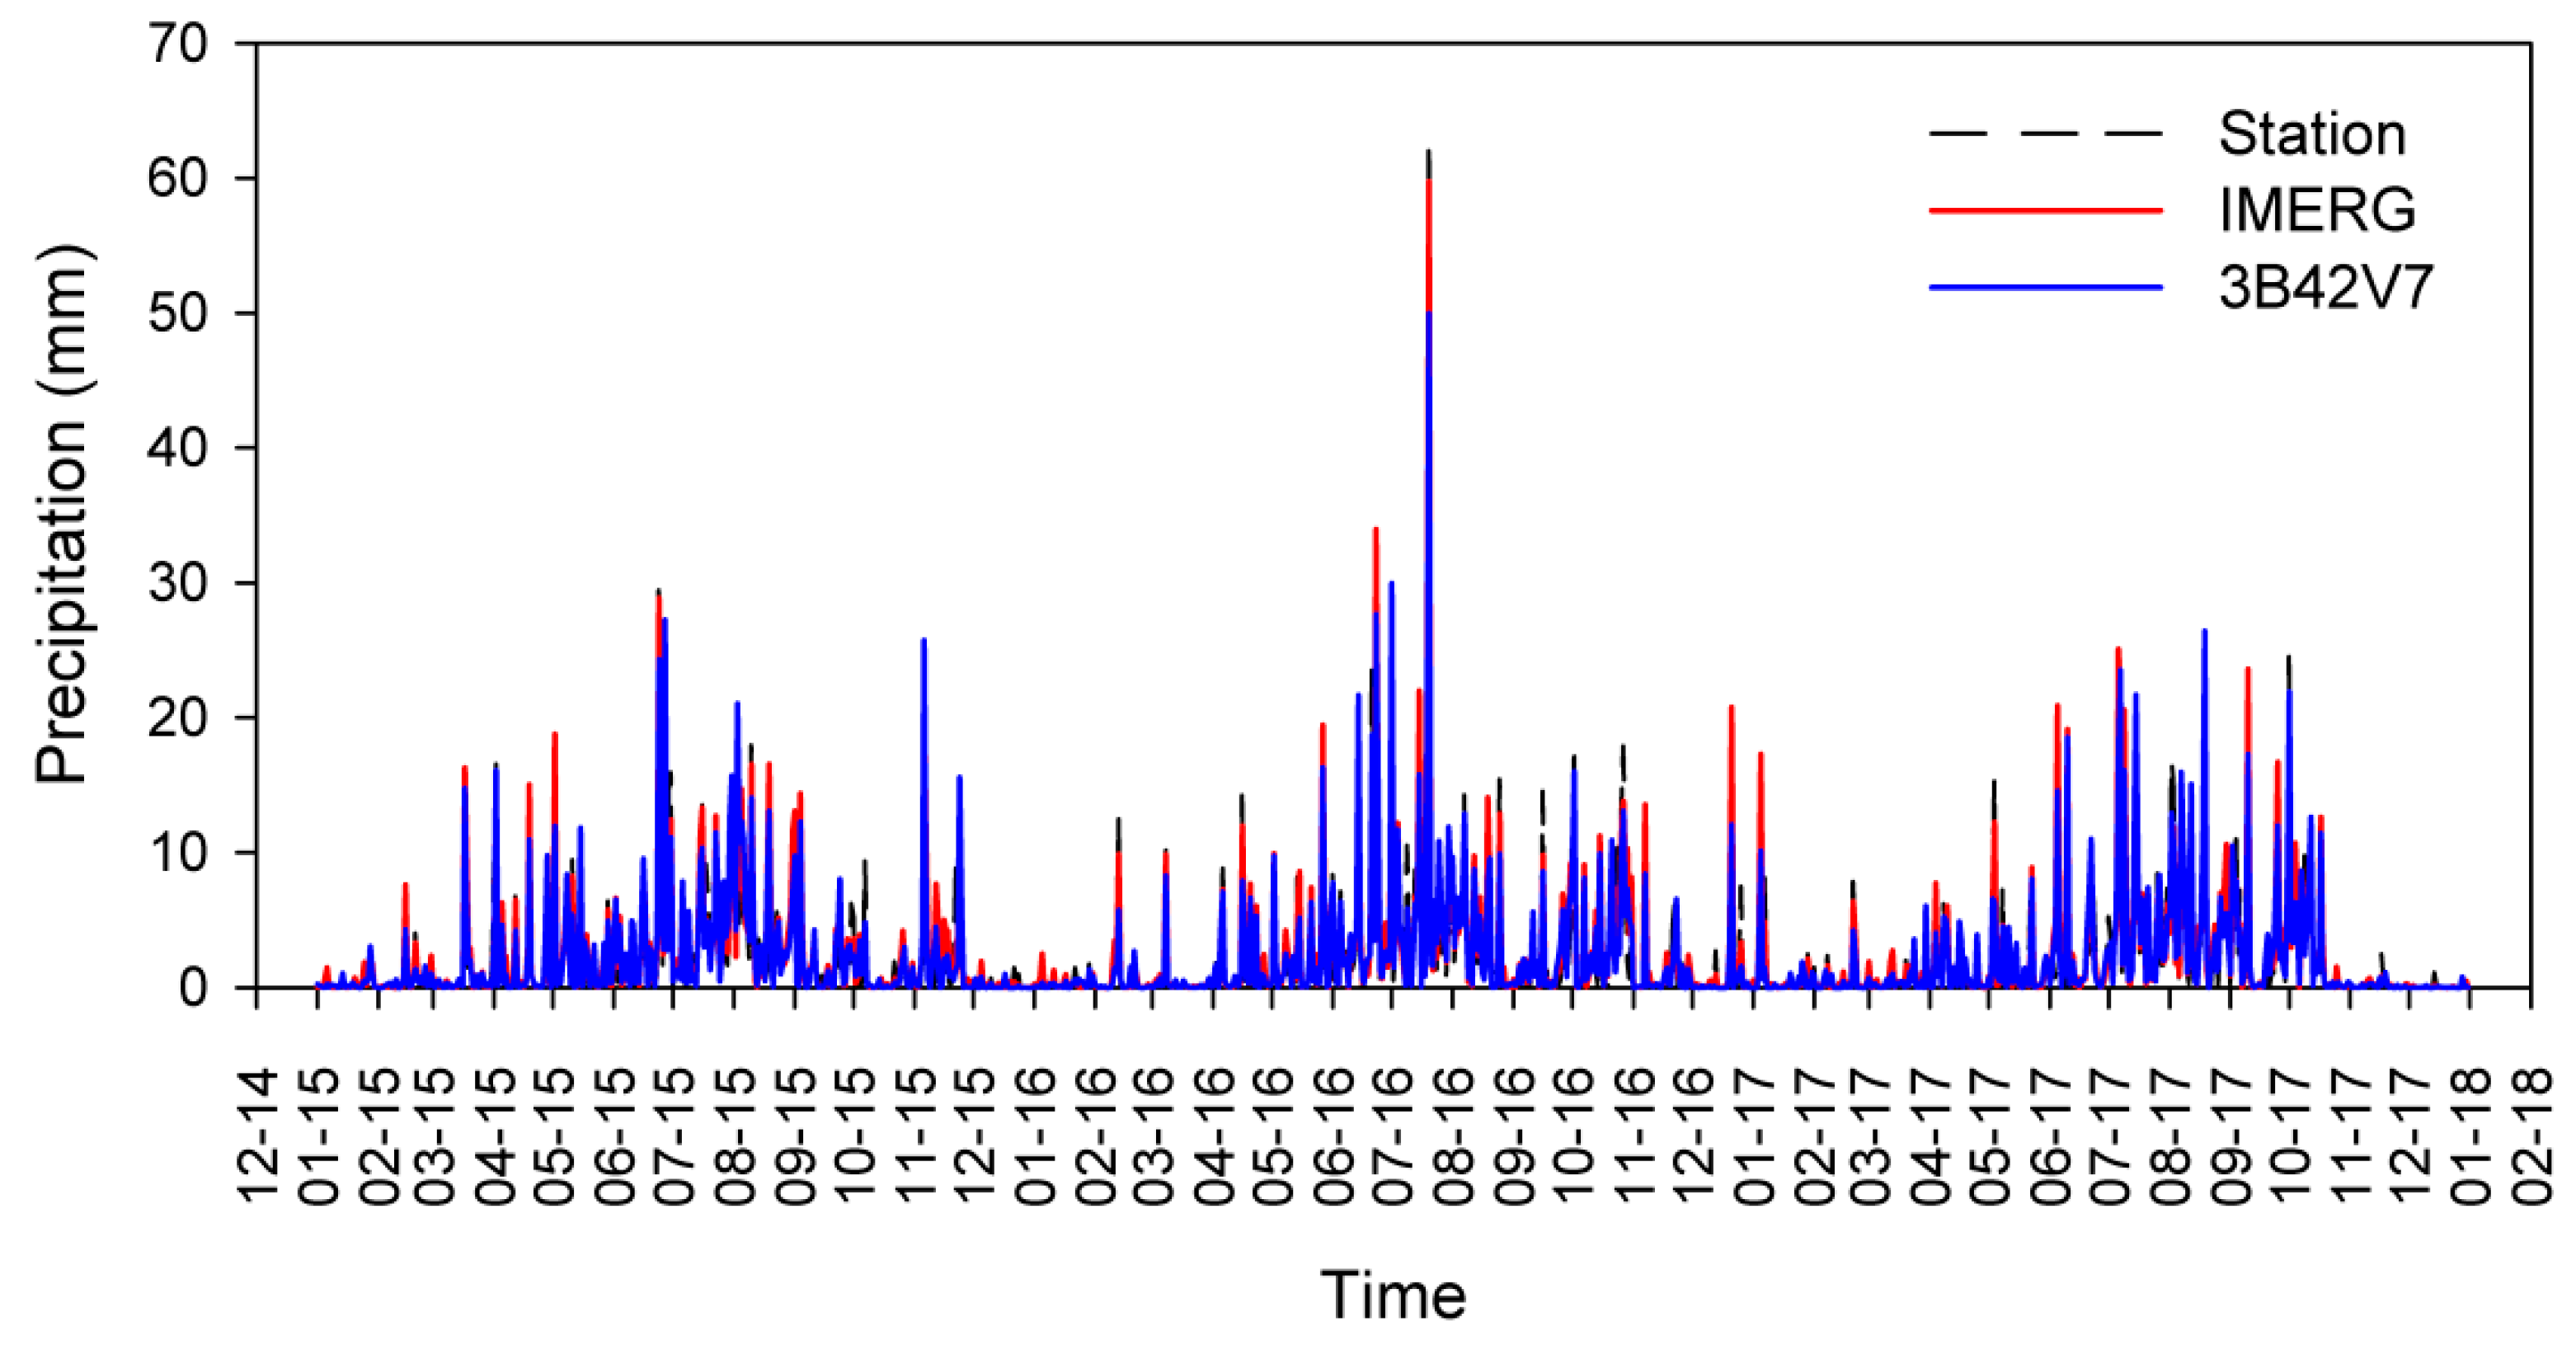
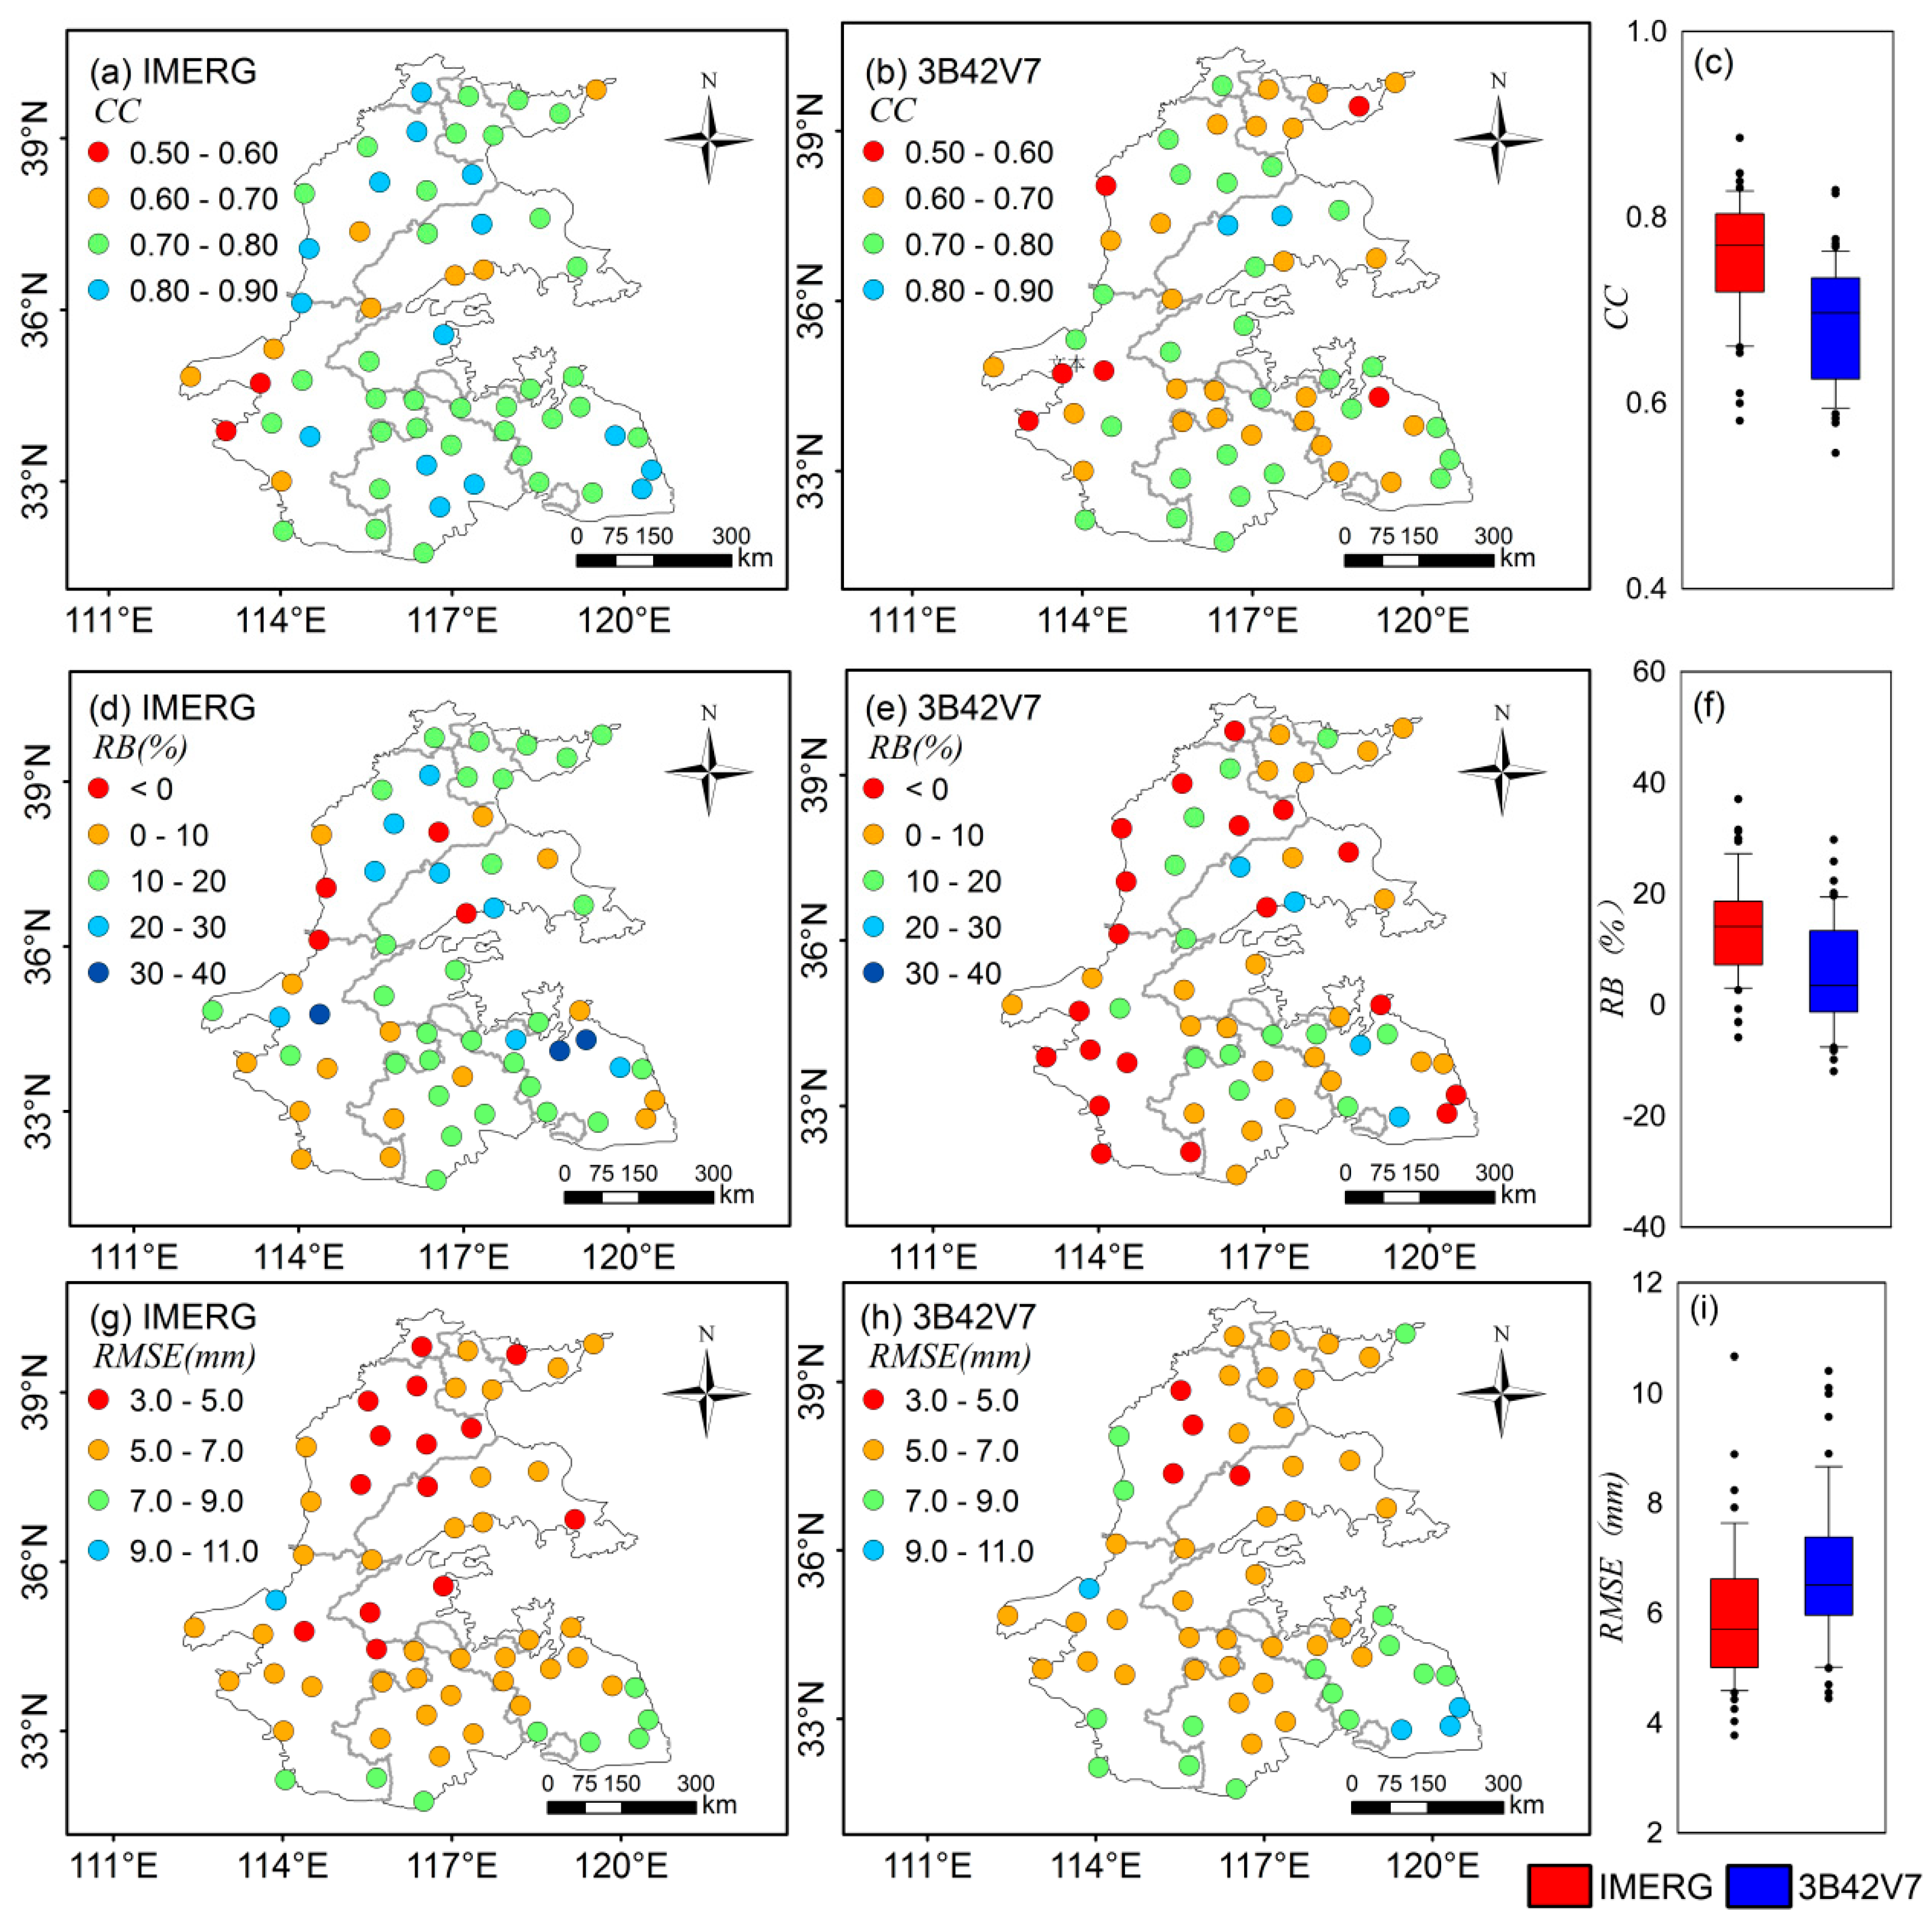
Monthly performances of IMERG and 3B42V7 products were quantified in Figure 7 and Figure 3b. It is evident that IMERG and 3B42V7 products have strong correlation with the station data with CC values of 0.93 and 0.92 respectively. However, the IMERG and 3B42V7 products overestimate the monthly precipitation by 13.15% and 4.82%, respectively. As for monthly RMSE, the value of IMERG is a little bit smaller than that of 3B42V7. Figure 8 shows the monthly comparison of regional average precipitation from stations and satellite estimates over the Huang-Huai-Hai Plain from January 2015 to December 2017. Both IMERG and 3B42V7 products could generally capture the temporal variation patterns of monthly precipitation, with the highest monthly amount occurred in July 2016 and the lowest amount observed in December 2017. However, IMERG and 3B42V7 products tend to overestimate precipitation during June–August 2015 and July–August 2017. It could be caused by frequent and abnormal precipitation during these periods. It is noteworthy that 3B42V7 underestimates the monthly precipitation amounts during December 2015 to March 2016 and November 2016 to February 2017. Generally, IMERG shows a slight overestimation than 3B42V7 in term of monthly precipitation, which is consistent with the results of accuracy verification in Figure 7.

4.1.4. Daily Scale

Figure 9 and Figure 3c demonstrate the performance of IMERG and 3B42V7 daily precipitation estimates during the entire study period, which show that IMERG has higher CC (0.76 and 0.69, respectively) and lower RMSE (6.06 mm and 6.84 mm, respectively) than 3B42V7. In addition, IMERG and 3B42V7 overestimate the daily precipitation to 13.15% and 4.82% respectively in the Huang-Huai-Hai Plain. By synthesizing all the statistical metrics of these two kinds of satellite precipitation products, it can be found that IMERG has higher accuracy, while 3B42V7 product exhibits a lower degree of overestimation.
Figure 10 shows daily comparison of regional average precipitation from stations and satellite estimates over the Huang-Huai-Hai Plain from January 2015 to December 2017. It is evident that both IMERG and 3B42V7 products can generally capture the temporal variation patterns of the daily precipitation during the study period.
Figure 11 shows the spatial maps and box plots of CC, RB, and RMSE between satellite precipitation products and stations observations over the Huang-Huai-Hai Plain at daily scale. Spatially, the correlation of IMERG product with stations data is significantly better than that of 3B42V7 (Figure 11a,b). The CC of IMERG is greater than 0.70 for 83% of the stations, while that of 3B42V7 is above 0.70 only for 47% of the stations. In addition, the average CC of IMERG is larger than that of 3B42V7 across the whole Huang-Huai-Hai Plain (Figure 11c). As for RB, the value is less than 0 at 7% stations for IMERG and at 31% sites for 3B42V7 (Figure 11d,e). Figure 11f indicates that the degree of overestimation of IMERG is greater than that of 3B42V7 across the whole region. In terms of the RMSE, both IMERG and 3B42V7 products show similar patterns geographically over the Huang-Huai-Hai Plain, decreasing gradually from the south to north (Figure 11g,h). Additionally, Figure 11i shows that the average RMSE of IMERG is less than 3B42V7, indicating the precipitation estimated by IMERG is more accurate than 3B42V7.

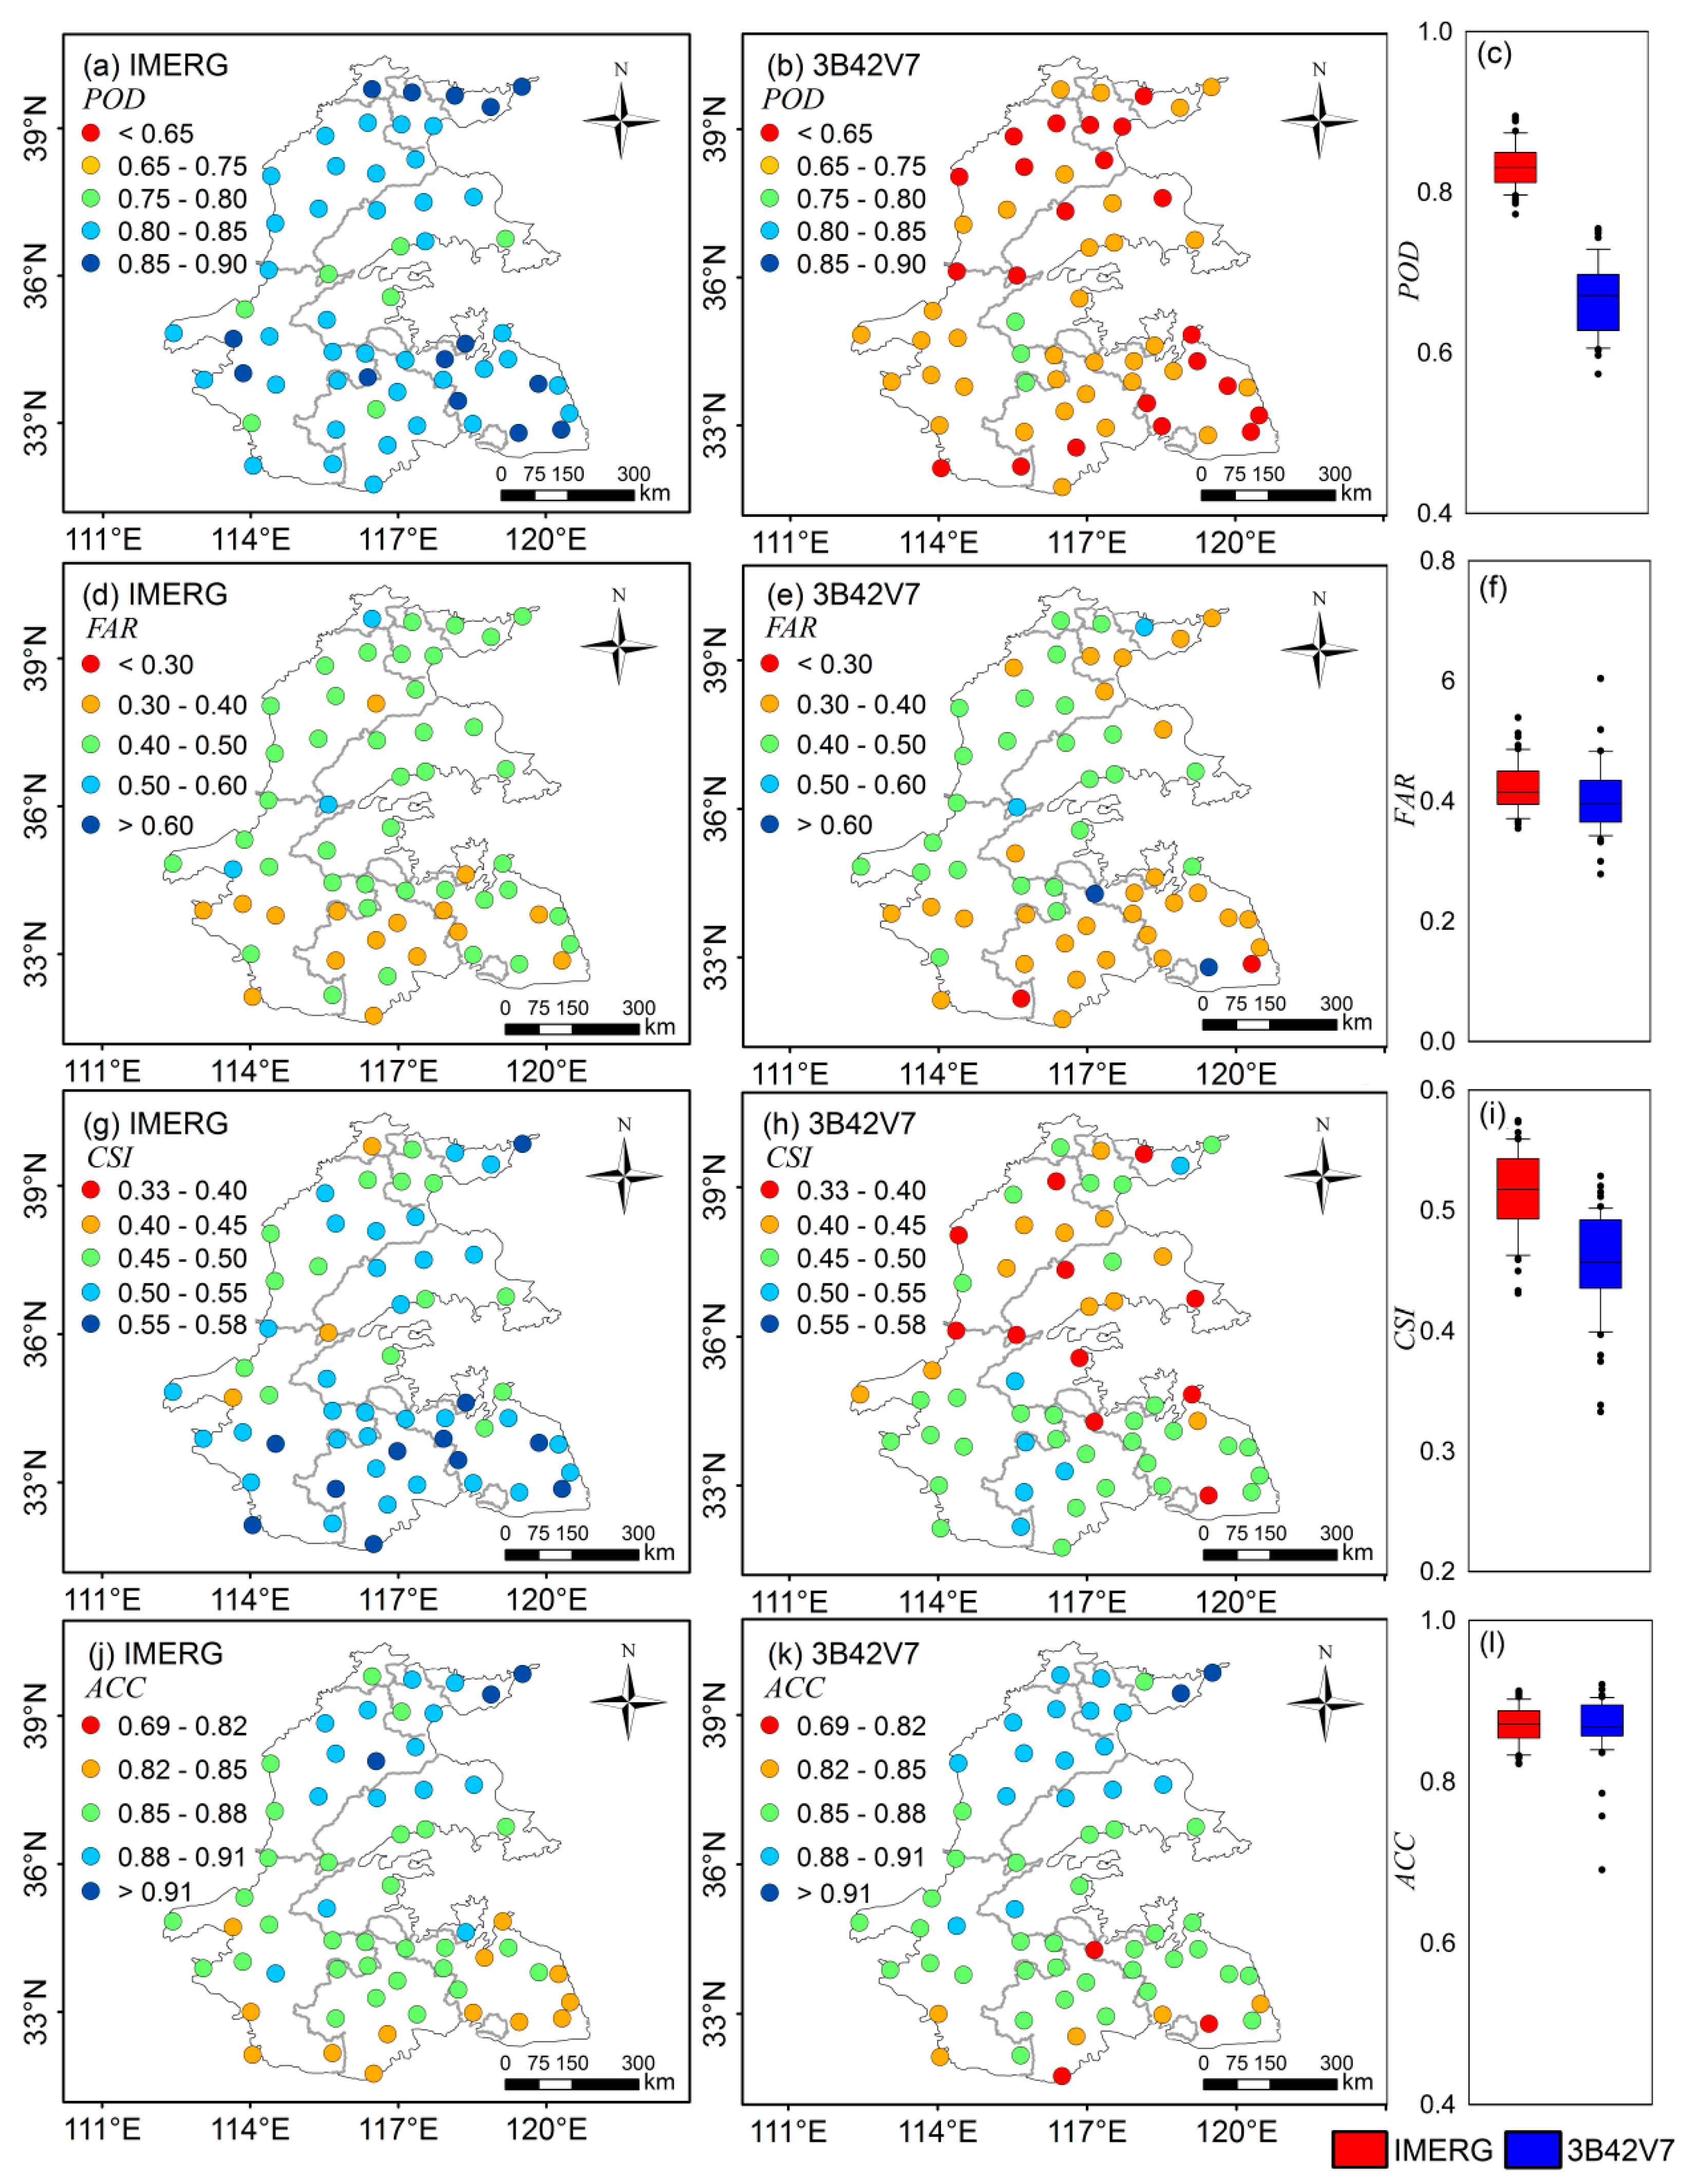
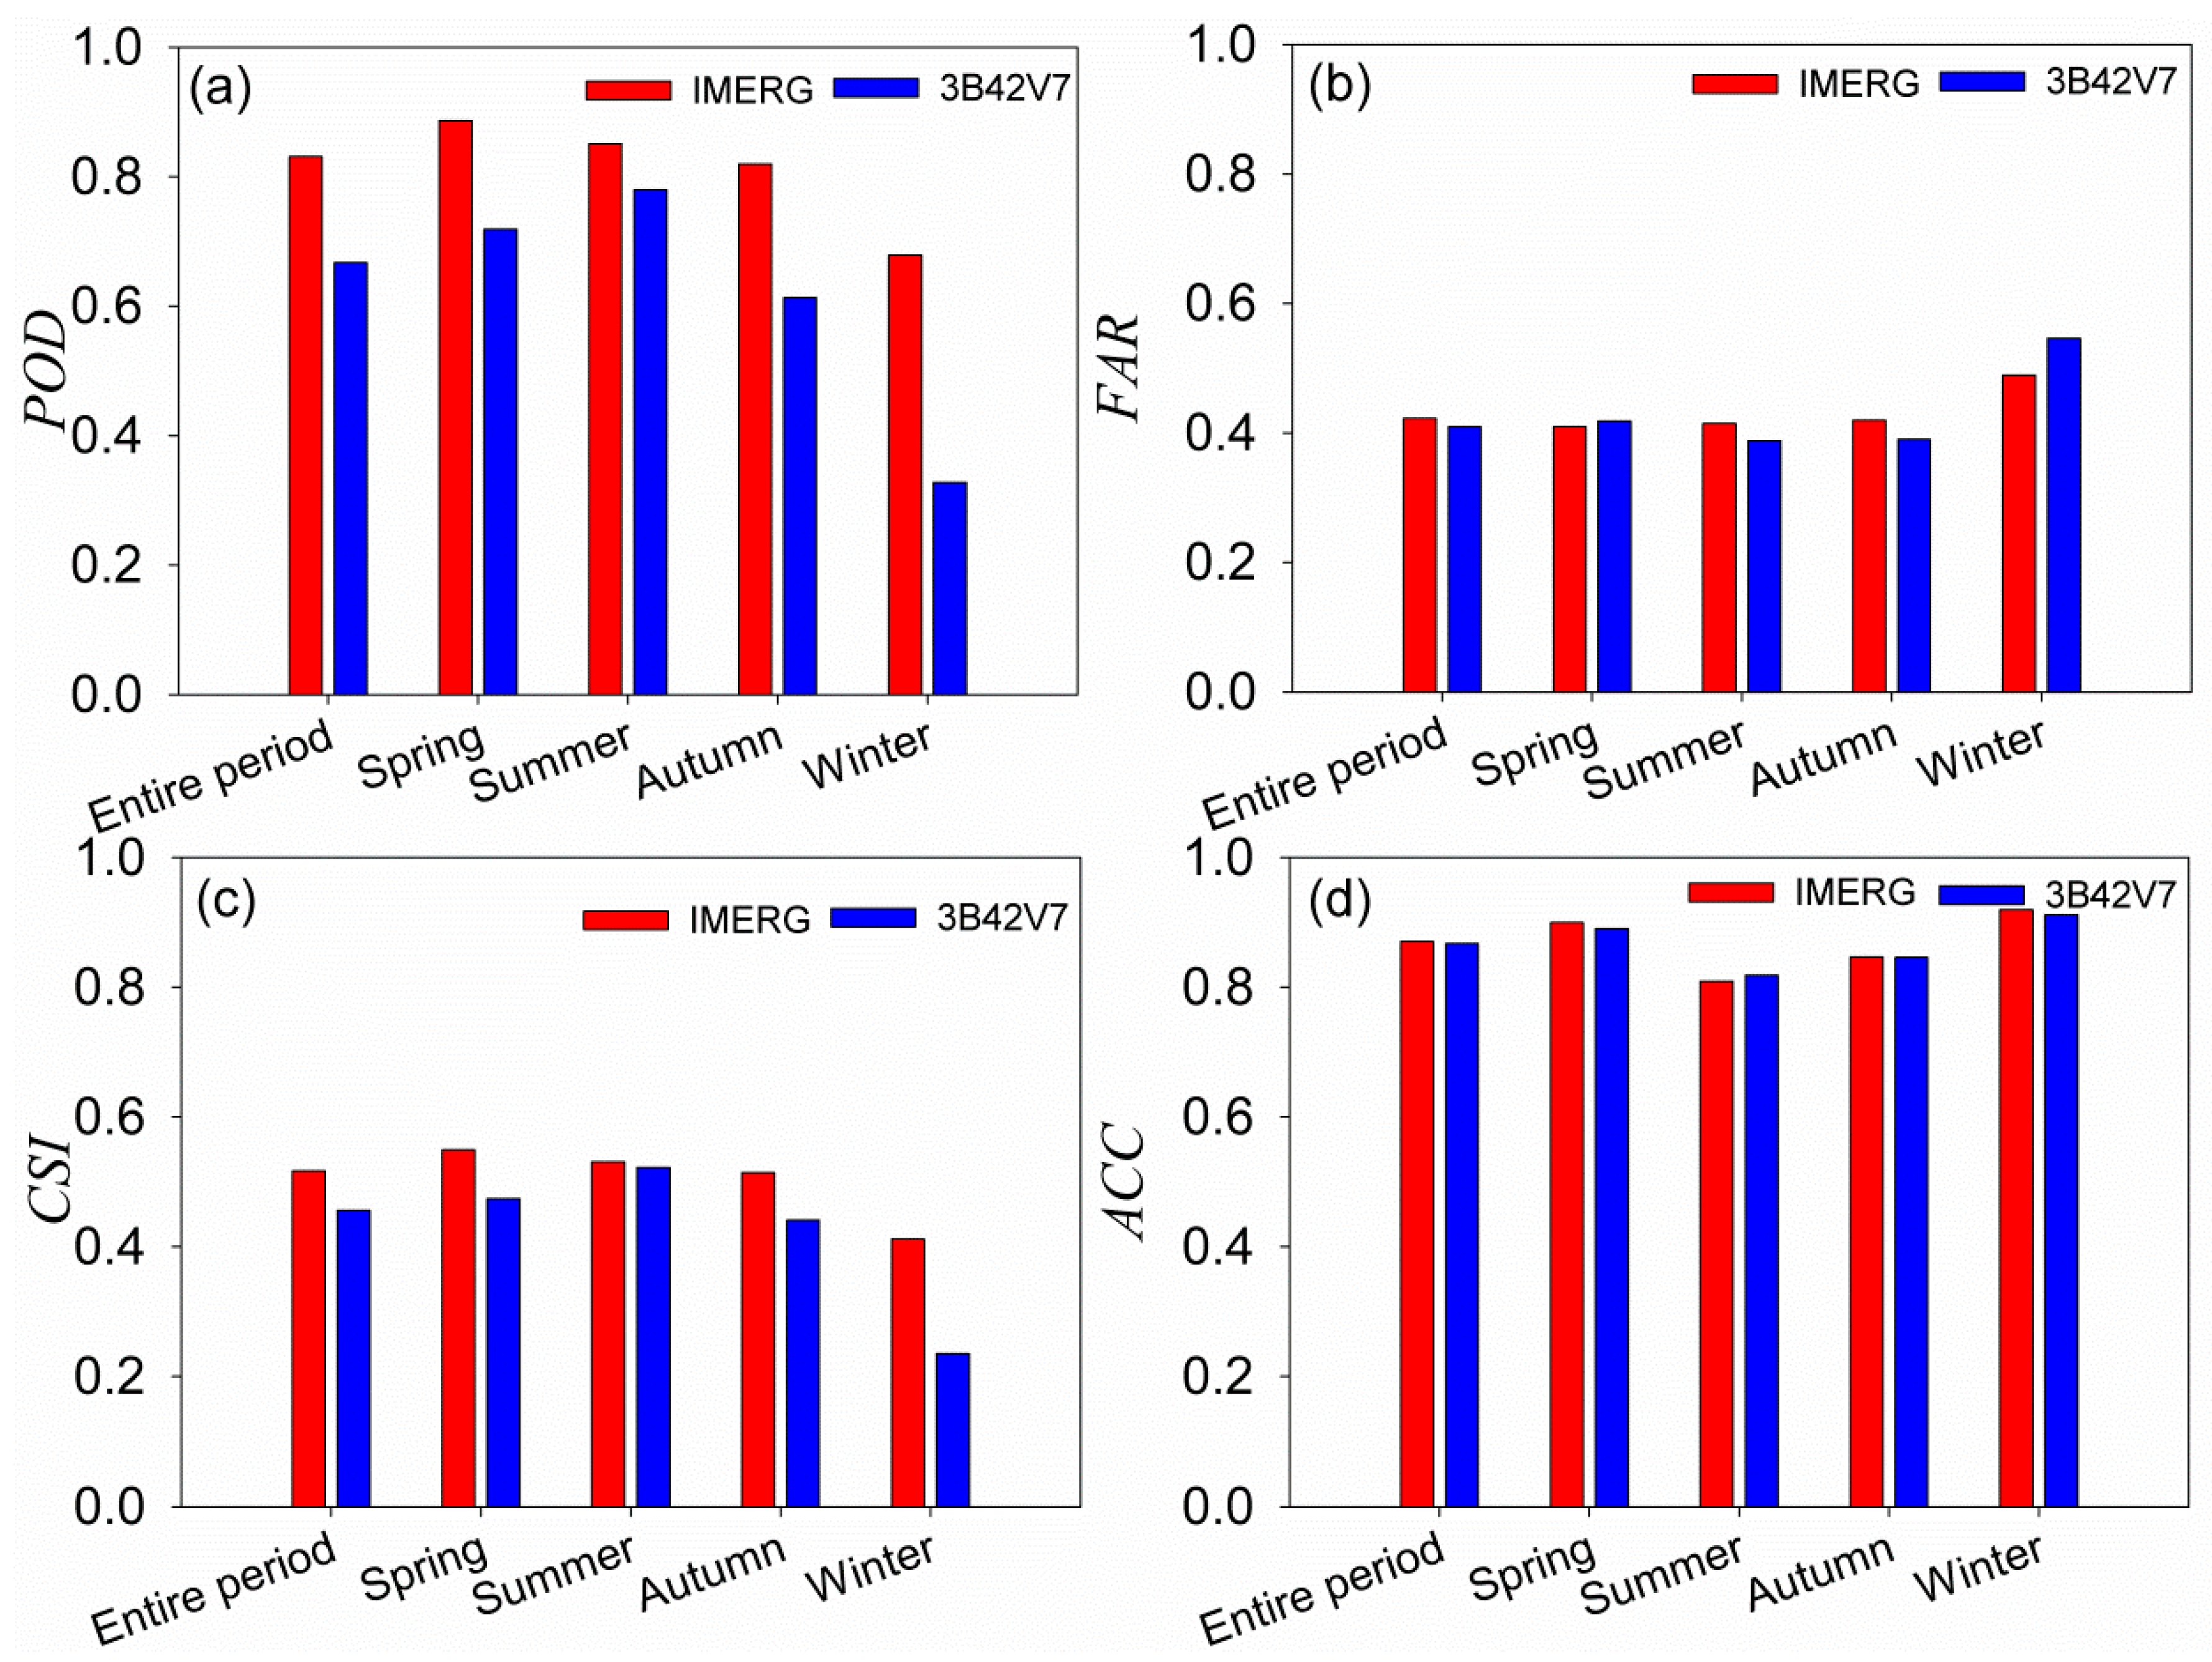
4.2. Precipitation Detection Capability

The spatial distributions and box plots of POD, FAR, CSI and ACC in the Huang-Huai-Hai Plain are shown in Figure 12. As can be seen from Figure 12a and b, the POD of IMERG ranges from 0.75 to 0.90, while that of 3B42V7 is less than 0.75 at most stations. Figure 12c also shows IMERG has a higher average POD value than 3B42V7, indicating that IMERG has obvious advantages in detecting precipitation events. The FAR of IMERG and 3B42V7 products presents similar spatial distribution pattern of gradually rising from south to north, which indicates that it is more likely to appear false alarm in areas with lower precipitation (Figure 12d,e). Figure 12f also shows IMERG has a higher FAR value than 3B42V7 over the study area. Compared with IMERG, 3B42V7 has more complex spatial non-uniformity, and it is slightly inadequate in error detection of precipitation events. According to Figure 12g-i, IMERG is superior to 3B42V7 in correctly detecting precipitation events. Moreover, the capability of these two satellite products to correctly estimate overall precipitation and no-precipitation events is quite high (Figure 12j-l). In general, each value of categorical statistical metrics of IMERG is significantly better than that of 3B42V7 at most stations.
The performance of four categorical statistical metrics for the entire period and each season is shown in Figure 13. IMERG has better performance in detecting precipitation events during the entire period, with POD and CSI of 0.83 and 0.52, respectively (Figure 13a,c). In regard of seasonal performance, the results show that the POD of IMERG is higher than that of 3B42V7 in each season (Figure 13a), especially in winter. This indicates that IMERG performs better in detecting precipitation events, especially in capturing trace precipitation and solid precipitation. In addition, both IMERG and 3B42V7 products have large FAR (above 0.35) for the entire period and each season (Figure 13b). The performance of CSI is consistent with that of POD and a maximum difference appears in winter, indicating IMERG has more advantages in correctly detecting precipitation events (Figure 13c). Both IMERG and 3B42V7 products perform well in detecting precipitation and no-precipitation events with the ACC of above 0.80, while IMERG is slightly better than 3B42V7 (Figure 13d). Generally, IMERG inherits the higher precision of 3B42V7 in detecting heavy rainfall and also improves the ability in observing trace precipitation and solid precipitation, which makes IMERG showing a strong ability to capture precipitation events.

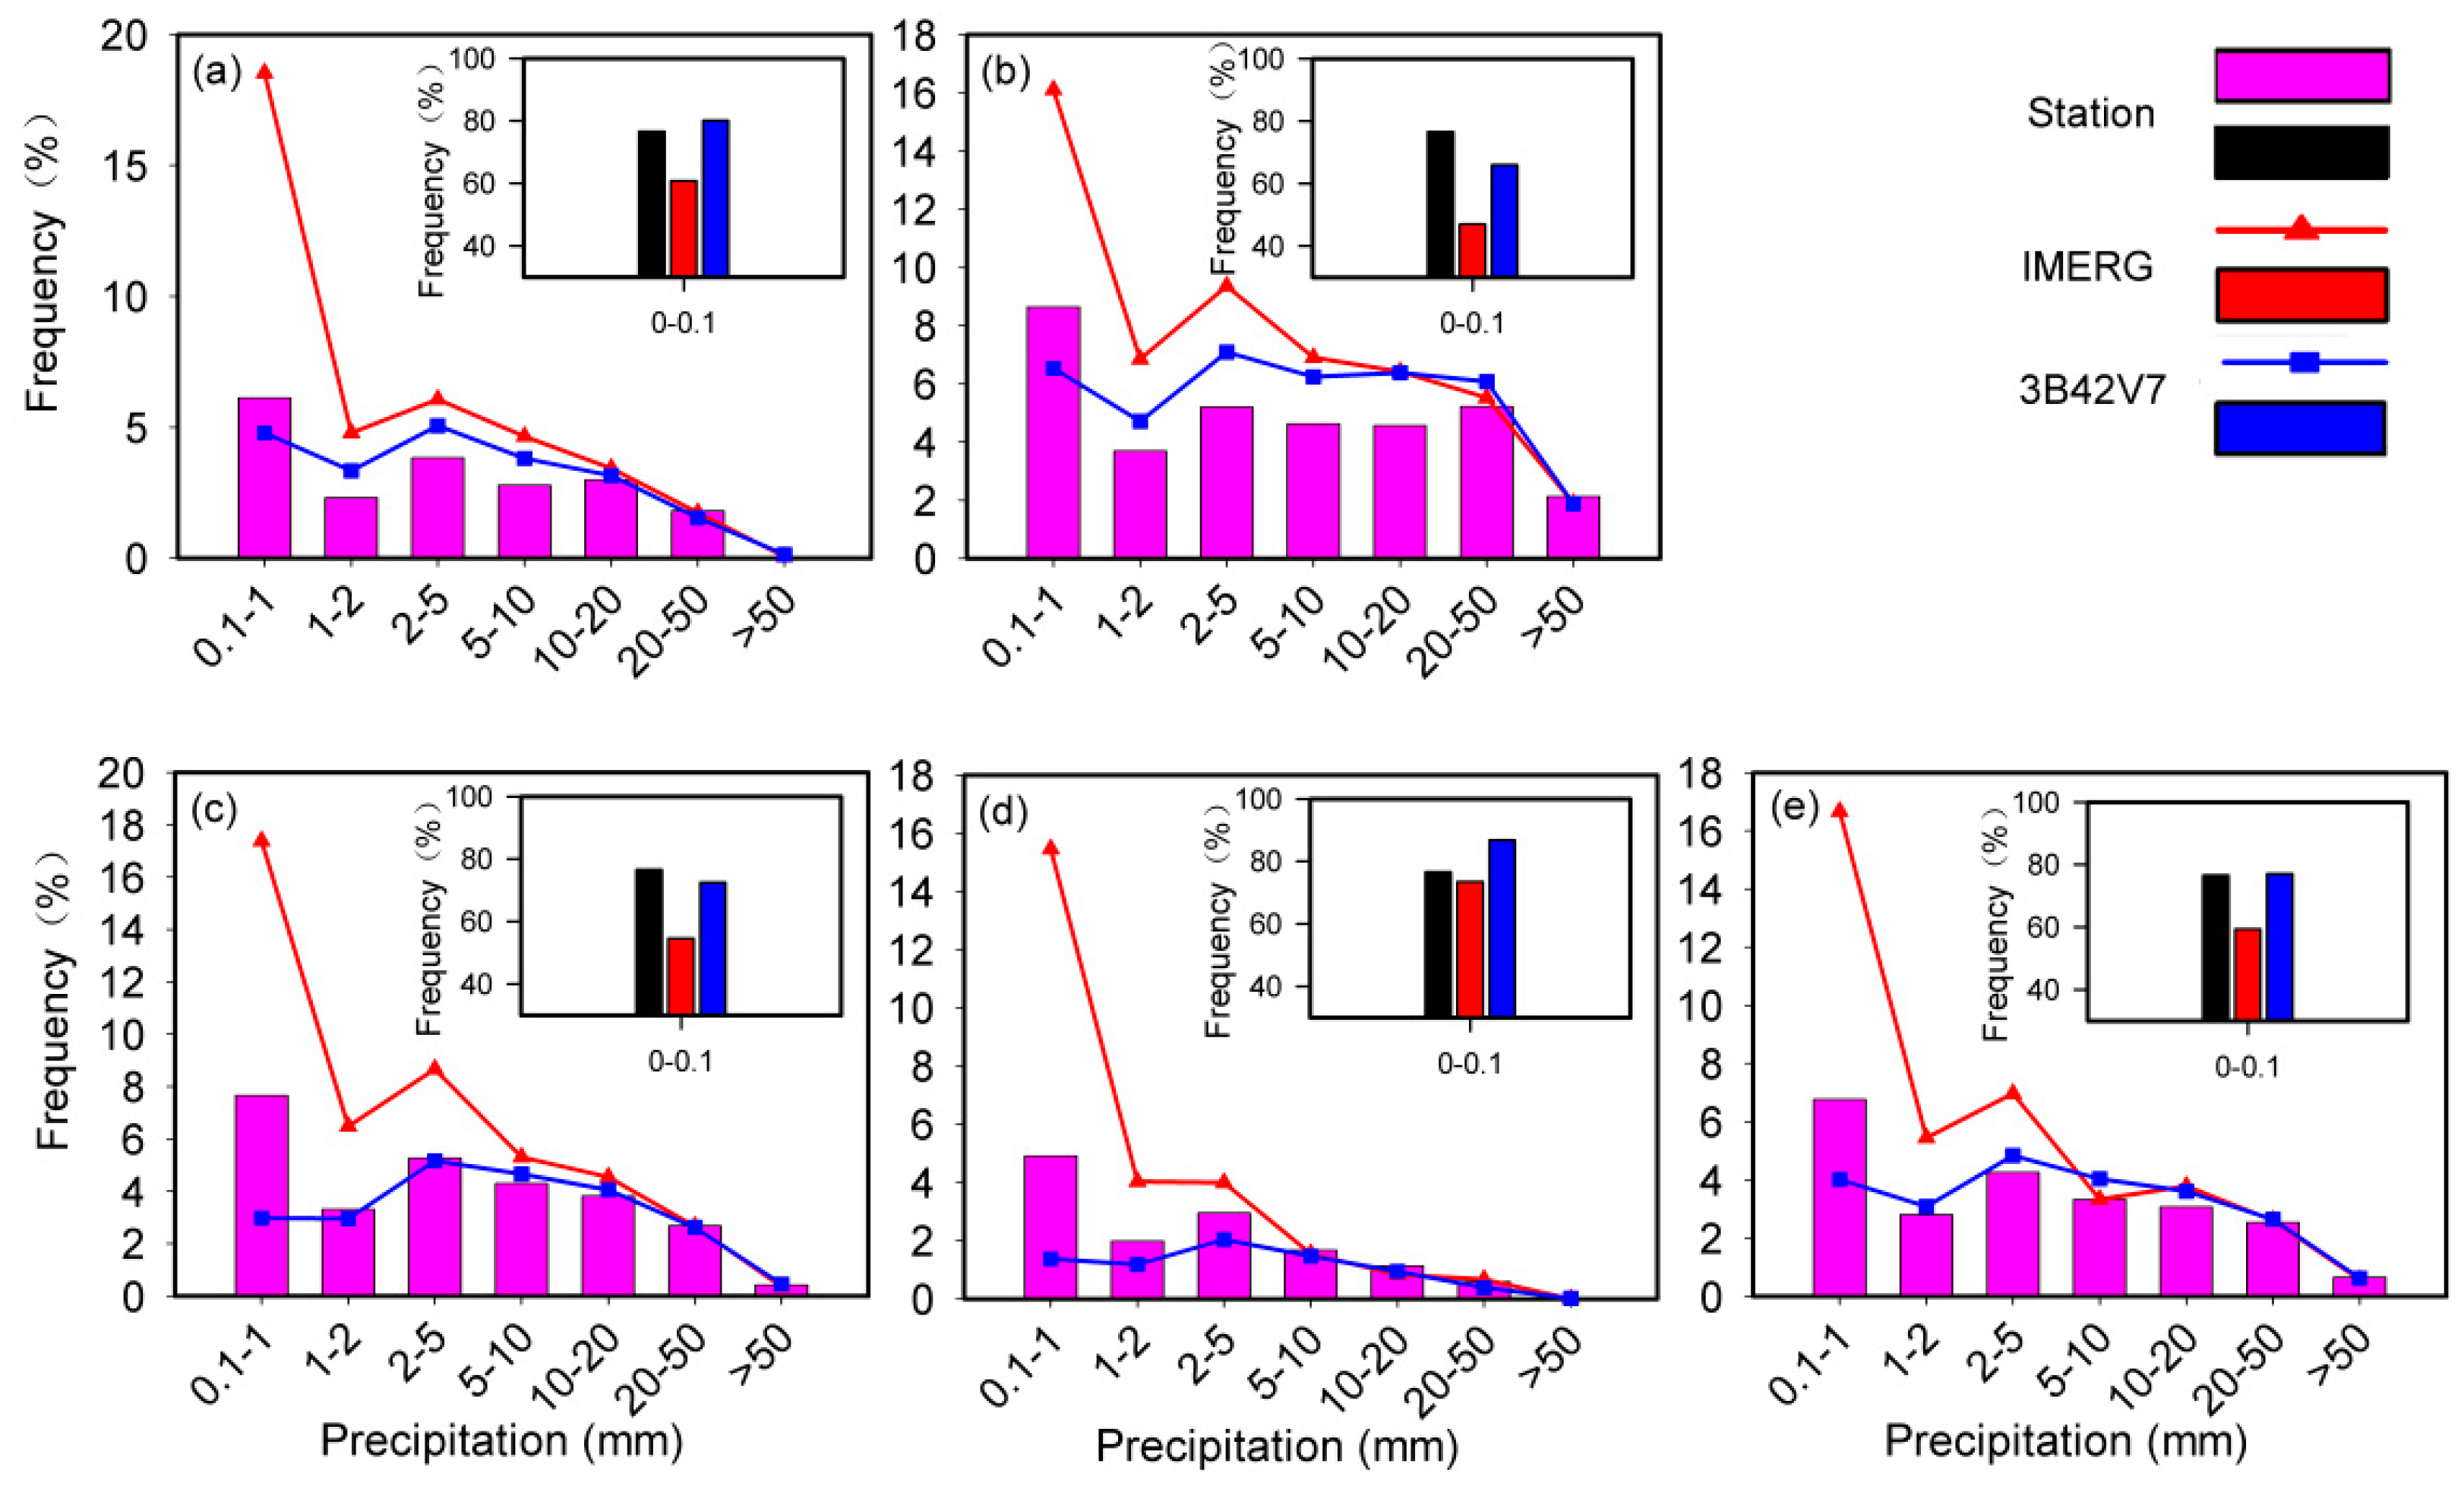
4.3. Frequency Distribution of Different Precipitation Intensities

The frequency distribution of daily precipitation from stations and satellite precipitation products for each season and the entire period in the Huang-Huai-Hai Plain is shown in Figure 14. Both stations observations and satellite precipitation products show that the highest precipitation frequency occurs in the range of 0–0.1 mm/d, and the lowest precipitation frequency appears in the precipitation intensity more than 50 mm/d. IMERG and 3B42V7 products tend to overestimate moderate (2–10 mm/d) and heavy (10–50 mm/d) precipitation events and underestimate violent (>50 mm/d) precipitation events, which is similar to Tan’s results in Malaysia [17]. IMERG product tends to underestimate trace precipitation events (<0.1 mm/d), where the opposite is true for 3B42V7 product. For each season, IMERG tends to underestimate trace precipitation events and violent precipitation events, and overestimate 0.1–50 mm/d precipitation events. However, 3B42V7 tends to overestimate tiny (0.1–1 mm/d) and violent precipitation events, while overestimate 1–50 mm/d precipitation events. It is noteworthy that 3B42V7 detects violent precipitation in winter without violent precipitation occurring (Figure 14d), which indicates that 3B42V7 is not suitable for detecting precipitation during the period of less precipitation.

5. Discussion

According to our results of accuracy analyses in the Huang-Huai-Hai Plain, the performance of the “Final Run” precipitation product (IMERG) is better than that of its predecessors TRMM 3B42V7 on the whole. Compared with 3B42V7, the IMERG shows better correlation with rain gauge observations at all temporal scales (Figure 2, Figure 5, Figure 7 and Figure 9). It is worth noting that the two satellite precipitation products have lowest correlation at the daily scale, which is consistent with Mantas et al. [57] and Tan et al. [15]. The IMERG has smaller RMSE values than 3B42V7 except at the annual scales, indicating that IMERG estimate is closer to the rain gauge data. The method we verified is that the stations precipitation is compared with the satellite grid precipitation of the stations, so the better accuracy of IMERG may be due to the increase of the spatial resolution. The small-scale estimation of IMERG (0.1°) is more accurate than that of 3B42V7 (0.25°). Furthermore, with its higher spatial and temporal resolutions, IMERG is more suitable for monitoring short-term and small-scale regional precipitation, especially for real-time monitoring of flood disasters. However, although the spatial resolution of IMERG is improved compared to 3B42V7, it is still coarse for driving hydrological and meteorological models at basin scale. Therefore, downscaling strategy based on satellite precipitation estimation may be an effective approach to obtain precipitation on a finer spatial scale [59,60]. Both IMERG and 3B42V7 products present slight overestimations during most of the study period except for winter. The overestimation may be attributed to the precious precipitation have been partially evaporated before they are observed by the rain gauge. Moreover, precipitation within a region may occur in smaller scales than the pixel size of satellites, which may also result in overestimation by satellite products [61]. Simultaneously, Bollasina et al. indicated that the concentration of atmospheric aerosols was increasing in Asia [1]. Higher concentration of atmospheric aerosols can intercept the precipitation and consequently reduce the precipitation amount observed by ground-based observatories [62]. In contrast, a higher concentration of aerosols can cause an increase in the cloud drop size which eventually leads to the overestimations by satellite sensors [63]. In addition, IMERG presents a greater degree of overestimation. Noticeably, IMERG product tends to overestimate precipitation in winter (20.64%), where the opposite is true for 3B42V7 product (−22.31%). This phenomenon can be explained by the fact that the form of precipitation is mostly snowfall in winter. The GPM carries the latest dual-frequency precipitation radar (DPR). Compared with the precipitation radar (PR) of TRMM, the Ka-band radar is added, which is more sensitive and can observe ice particles, thus increasing the GPM’s ability to detect solid precipitation [27]. Additionally, fewer favorable land surface conditions covered by snow and ice in winter are also responsible for this underestimation because the accuracy of TRMM PMW-based precipitation is influenced and degraded by snow and ice cover [64,65].
As for the precipitation detection capability evaluation, the IMERG slightly improves the daily POD value by 0.15 as compared to the 3B42V7 product, which is mainly due to the fact that the GPM Microwave Imager (GMI) sensor can capture light precipitation better than the TRMM combined Instrument (TMI) [66,67]. Compared to the nine channels (10–85.5 GHz) on the TMI, four channels (10–183 GHz) were added on the sensors on the GMI [24]. In addition, the highest precipitation frequency occurs in trace (<0.1 mm/d) precipitation events. Thus, the accurate detection of trace precipitation events is more important. The satellite precipitation products are capable to detect low-intensity precipitation events (<1 mm/d) through high-frequency sensors [68]. However, based on the true values of the stations, IMERG unexpectedly underestimates trace precipitation events (Figure 14). The situation may be the fact that precipitation amounts of some trace precipitation events are overestimated, consistent with the above quantitative evaluation results.
Thus far, the performance evaluation of IMERG satellite precipitation product has been conducted in multiple regions. The strong correlation between IMERG products and ground-based reference data was found in China [9,33,34,55], which was also consistent with our results. The better performance of the IMERG product in China might be due to the fact that the number of rain gauging stations used for the development of the GPCC product was more compared to the other regions [25]. However, the performance of IMERG products in China was not completely similar due to various climates and elevation bands. For instance, the IMERG product only showed a moderate correlation with ground-based data in Guangdong Province [46], Tianshan Mountain Area [38], and Tibetan Plateau [31,69]. In contrast, IMERG did not show good consistency in Pakistan [13], Malaysia [17], Singapore [25], Northwestern South America [35], Korea, and Japan [68]. This phenomenon may be attributed to the fact that precipitation estimation from IMERG is influenced by topographic conditions, sea and land locations and monsoon climates. Moreover, it could also because the number of gauges used in the GPCC product is less in these regions than China.
Some limitations of this study cannot be ignored. Due to the restriction of ground reference resolution (12 h) data in this study, it fails to verify the advantages of the two satellite precipitation products in terms of finer temporal resolutions (e.g., hourly-scale). Therefore, the precision of satellite precipitation products at the hourly scale should be evaluated based on hourly ground-based data in the future. In addition, reasonable mathematical models could be adopted to correct satellite precipitation products in order to reduce errors. Finally, the capability of satellite precipitation products in hydrological simulation and flood and drought disaster monitoring still have many uncertainties, which should be evaluated.

6. Conclusions

This study conducts a comprehensive assessment of GPM IMERG and TRMM 3B42V7 for a period from 1 January 2015 to 31 December 2017, with 59 station data taken as the reference. In order to evaluate the accuracy of IMERG and 3B42V7 satellite precipitation products, three continuous statistical metrics (R, RB and RMSE) are used to quantitatively analyze the accuracy of satellite precipitation products. Four categorical statistical metrics (POD, FAR, CSI, and ACC) are used to evaluate precipitation detection capability of satellite precipitation products in this study. Then the frequency distribution of precipitation events at different intensities is evaluated. The conclusions are as follows:
(1) Compared with 3B42V7, the precipitation estimated by IMERG has a better correlation with stations data at all scales (annual, seasonal, monthly, and daily). However, the CC of IMERG and 3B42V7 on the daily scale is significantly lower than that of other scales. Both IMERG and 3B42V7 products are able to capture the spatial patterns of precipitation gradually decreasing from south to north over the Huang-Huai-Hai Plain.
(2) Both IMERG and 3B42V7 products overestimate precipitation compared with the stations observations, of which 3B42V7 has a lower degree of overestimation. It should be noted that 3B42V7 underestimates precipitation only in winter (−22.31%).
(3) There is less error for 3B42V7 in estimating annual precipitation, while IMERG is more accurate in estimating seasonal, monthly, and daily precipitation.
(4) IMERG shows better precipitation detection capability than 3B42V7, especially in detecting trace precipitation and solid precipitation. In the aspect of false detection of precipitation events, the performances of two satellite precipitation products perform well (FAR = 0.42 and 0.41 for IMERG and 3B42V7, respectively). In addition, both of them can accurately detect the precipitation conditions in the Huang-Huai-Hai Plain (both ACC = 0.87) in the entire study period.
(5) IMERG and 3B42V7 products tend to overestimate moderate (2–10 mm/d) and heavy (10–50 mm/d) precipitation events and underestimate violent (>50 mm/d) precipitation events during the entire period. In addition, IMERG tends to underestimate trace (<0.1 mm/d) precipitation events and overestimate tiny (0.1–1 mm/d) precipitation events, while 3B42V7 tends to underestimate tiny precipitation events.
Generally, the accuracy of IMERG is superior to that of 3B42V7 in estimating precipitation, but its advantages are not prominent. IMERG has obvious advantages in detecting precipitation events. Moreover, IMERG is more suitable for studying hydrometeorology in the Huang-Huai-Hai Plain due to more precise temporal-spatial resolution and less error compared with 3B42V7. As a result of the lowest correlation of daily scale, it is necessary to adopt reasonable methods to correct data when daily precipitation of satellite precipitation products is used in the study of hydrological forecasting, flood predicting and drought monitoring. The corresponding researches will be conducted in our future work. However, it should be noted that several uncertainties remain in this current study, which may be rooted in the inadequate number and locations of gauges. The uncertainties may cause slight errors when studying the temporal and spatial variation characteristics of precipitation in large areas. The assessment results presented herein provide valuable references for other similar regions, especially for areas with a sparse rain gauge network.

Author Contributions

F.X., B.G., B.Y. and Q.Y. carried out the calculation, result analysis and drafted the manuscript, which was revised by all authors. All authors gave their approval of the version submitted for publication.

Funding

This work was supported by National Natural Science Foundation of China (No. 41807170, No. 31371574), Natural Science Foundation of Shandong Province (No. ZR2017BD021), SDUST Research Fund (No. 2014TDJH101) and Opening Fund of Tianjin Key Laboratory of Water Resources and Environment.

Acknowledgments

We appreciate the editors and the reviewers for their constructive suggestions and insightful comments, which helped us greatly to improve this manuscript.

Conflicts of Interest

The authors declare no conflict of interest.

References

  1. Bollasina, M.A.; Ming, Y.; Ramaswamy, V. Anthropogenic aerosols and the weakening of the South Asian summer monsoon. Science 2011, 334, 502–505. [Google Scholar] [CrossRef]
  2. Zhu, G.; He, Y.; Pu, T.; Wang, X.; Jia, W.; Li, Z.; Xin, H. Spatial distribution and temporal trends in potential evapotranspiration over Hengduan Mountains region from 1960 to 2009. J. Geogr. Sci. 2012, 22, 71–85. [Google Scholar] [CrossRef]
  3. Hong, Y.; Gochis, D.; Cheng, J.T.; Hsu, K.L.; Sorooshian, S. Evaluation of PERSIANN-CCS Rainfall Measurement Using the NAME Event Rain Gauge Network. J. Hydrometeorol. 2007, 8, 469–482. [Google Scholar] [CrossRef]
  4. Kidd, C.; Huffman, G. Global precipitation measurement. Meteorol. Appl. 2011, 18, 334–353. [Google Scholar] [CrossRef]
  5. Tapiador, F.J.; Turk, F.J.; Petersen, W.; Hou, A.Y.; García-Ortega, E.; Machado, L.A.T.; Angelis, C.F.; Salio, P.; Kidd, C.; Huffman, G.J. Global precipitation measurement: Methods, datasets and applications. Atmos. Res. 2012, 104-105, 70–97. [Google Scholar] [CrossRef]
  6. Haile, A.T.; Yan, F.; Habib, E. Accuracy of the CMORPH satellite-rainfall product over Lake Tana Basin in Eastern Africa. Atmos. Res. 2015, 163, 177–187. [Google Scholar] [CrossRef]
  7. Mei, Y.; Anagnostou, E.N.; Nikolopoulos, E.I.; Borga, M. Error Analysis of Satellite Rainfall Products in Mountainous Basins. J. Hydrometeorol. 2014, 15, 1778–1793. [Google Scholar] [CrossRef]
  8. Porcù, F.; Milani, L.; Petracca, M. On the uncertainties in validating satellite instantaneous rainfall estimates with raingauge operational network. Atmos. Res. 2014, 144, 73–81. [Google Scholar] [CrossRef]
  9. Tang, G.Q.; Ma, Y.Z.; Long, D.; Zhong, L.Z.; Hong, Y. Evaluation of GPM Day-1 IMERG and TMPA Version-7 legacy products over Mainland China at multiple spatiotemporal scales. J. Hydrol. 2016, 533, 152–167. [Google Scholar] [CrossRef]
  10. Einfalt, T.; Arnbjerg-Nielsen, K.; Golz, C.; Jensen, N.E.; Quirmbach, M.; Vaes, G.; Vieux, B. Towards a roadmap for use of radar rainfall data in urban drainage. J. Hydrol. 2004, 299, 186–202. [Google Scholar] [CrossRef]
  11. Nastos, P.T.; Kapsomenakis, J.; Philandras, K.M. Evaluation of the TRMM 3B43 gridded precipitation estimates over Greece. Atmos. Res. 2016, 169, 497–514. [Google Scholar] [CrossRef]
  12. Schneebeli, M.; Dawes, N.; Lehning, M.; Berne, A. high-resolution vertical profiles of X-band polarimetric radar observables during snowfall in the Swiss Alps. J. Appl. Meteorol. Clim. 2013, 52, 378–394. [Google Scholar] [CrossRef]
  13. Anjum, M.N.; Ding, Y.J.; Shangguan, D.H.; Ahmad, I.; Ijaz, M.W.; Farid, H.U.; Yagoub, Y.E.; Zaman, M.; Adnan, M. Performance evaluation of latest integrated multi-satellite retrievals for Global Precipitation Measurement (IMERG) over the northern highlands of Pakistan. Atmos. Res. 2018, 205, 134–146. [Google Scholar] [CrossRef]
  14. Hussain, Y.; Satgé, F.; Hussain, M.B.; Martinez-Carvajal, H.; Bonnet, M.-P.; Cárdenas-Soto, M.; Roig, H.L.; Akhter, G. Performance of CMORPH, TMPA, and PERSIANN rainfall datasets over plain, mountainous, and glacial regions of Pakistan. Theor. Appl. Climatol. 2018, 131, 1119–1132. [Google Scholar] [CrossRef]
  15. Tan, M.L.; Ibrahim, A.; Duan, Z.; Cracknell, A.; Chaplot, V. Evaluation of Six High-Resolution Satellite and Ground-Based Precipitation Products over Malaysia. Remote Sens. 2015, 7, 1504. [Google Scholar] [CrossRef]
  16. Tan, M.L.; Tan, K.; Chua, V.; Chan, N. Evaluation of TRMM Product for Monitoring Drought in the Kelantan River Basin, Malaysia. Water 2017, 9, 57. [Google Scholar] [CrossRef]
  17. Tan, M.L.; Santo, H. Comparison of GPM IMERG, TMPA 3B42 and PERSIANN-CDR satellite precipitation products over Malaysia. Atmos. Res. 2018, 202, 63–76. [Google Scholar] [CrossRef]
  18. Varikoden, H.; Preethi, B.; Samah, A.A.; Babu, C.A. Seasonal variation of rainfall characteristics in different intensity classes over Peninsular Malaysia. J. Hydrol. 2011, 404, 99–108. [Google Scholar] [CrossRef]
  19. Qian, Z.; Xuan, W.; Li, L.; Xu, Y.P. Evaluation and hydrological application of precipitation estimates derived from PERSIANN-CDR, TRMM 3B42V7 and NCEP-CFSR over humid regions in China. Hydrol. Process. 2016, 30, 3061–3083. [Google Scholar]
  20. Tao, H.; Fischer, T.; Zeng, Y.; Fraedrich, K. Evaluation of TRMM 3B43 precipitation data for drought monitoring in Jiangsu Province, China. Water 2016, 8, 221. [Google Scholar] [CrossRef]
  21. Hsu, K.L.; Gao, X.; Sorooshian, S.; Gupta, H.V. Precipitation estimation from remotely sensed information using artificial neural networks. J. Appl. Meteorol. 1997, 36, 1176–1190. [Google Scholar] [CrossRef]
  22. Joyce, R.J.; Janowiak, J.E.; Arkin, P.A.; Xie, P. CMORPH: A method that produces global precipitation estimates from passive microwave and infrared data at high spatial and temporal resolution. J. Hydrometeorol. 2004, 5, 487–503. [Google Scholar] [CrossRef]
  23. Huffman, G.J.; Bolvin, D.T.; Nelkin, E.J.; Wolff, D.B.; Adler, R.F.; Gu, G.; Hong, Y.; Bowman, K.P.; Stocker, E.F. The TRMM multisatellite precipitation analysis (TMPA): Quasi-global, multiyear, combined-sensor precipitation estimates at fine scales. J. Hydrometeorol. 2007, 8, 38–55. [Google Scholar] [CrossRef]
  24. Hou, A.Y.; Kakar, R.K.; Neeck, S.; Azarbarzin, A.A.; Kummerow, C.D.; Kojima, M.; Oki, R.; Nakamura, K.; Iguchi, T. The global precipitation measurement mission. Bull. Am. Meteorol. Soc. 2014, 95, 701–722. [Google Scholar] [CrossRef]
  25. Tan, M.L.; Duan, Z. Assessment of GPM and TRMM precipitation products over Singapore. Remote Sens. 2017, 9, 720. [Google Scholar] [CrossRef]
  26. Yong, B.; Liu, D.; Gourley, J.J.; Tian, Y.; Huffman, G.J.; Ren, L.; Hong, Y. Global view of real-time TRMM multisatellite precipitation analysis: Implications for its successor global precipitation measurement mission. Bull. Am. Meteorol. Soc. 2015, 96, 283–296. [Google Scholar] [CrossRef]
  27. Huffman, G.J.; Bolvin, D.T.; Nelkin, E.J. Integrated Multi-satellitE Retrievals for GPM (IMERG) technical documentation. NASA/GSFC Code 2015, 612, 47. [Google Scholar]
  28. Yong, B.; Ren, L.L.; Hong, Y.; Wang, J.H.; Gourley, J.J.; Jiang, S.H.; Chen, X.; Wang, W. Hydrologic evaluation of Multisatellite Precipitation Analysis standard precipitation products in basins beyond its inclined latitude band: A case study in Laohahe basin, China. Water Resour. Res. 2010, 46, W07542. [Google Scholar] [CrossRef]
  29. Cao, Y.; Zhang, W.; Wang, W. Evaluation of TRMM 3B43 data over the Yangtze River Delta of China. Sci. Rep. 2018, 8, 5290. [Google Scholar] [CrossRef] [PubMed]
  30. Wu, L.; Xu, Y.P.; Wang, S.Y. Comparison of TMPA-3B42RT legacy product and the equivalent IMERG products over Mainland China. Remote Sens. 2018, 10, 1778. [Google Scholar] [CrossRef]
  31. Xu, R.; Tian, F.Q.; Yang, L.; Hu, H.C.; Lu, H.; Hou, A.Z. Ground validation of GPM IMERG and TRMM 3B42V7 rainfall products over southern Tibetan Plateau based on a high-density rain gauge network. J. Geophys. Res. Atmos. 2017, 122, 910–924. [Google Scholar] [CrossRef]
  32. Zhang, A.S.; Xiao, L.S.; Min, C.; Chen, S.; Kulie, M.; Huang, C.Y.; Liang, Z.Q. Evaluation of latest GPM-Era high-resolution satellite precipitation products during the May 2017 Guangdong extreme rainfall event. Atmos. Res. 2019, 216, 76–85. [Google Scholar] [CrossRef]
  33. Zhao, H.; Yang, B.; Yang, S.; Huang, Y.; Dong, G.; Bai, J.; Wang, Z. Systematical estimation of GPM-based global satellite mapping of precipitation products over China. Atmos. Res. 2018, 201, 206–217. [Google Scholar] [CrossRef]
  34. Zhong, R.; Chen, X.; Lai, C.; Wang, Z.; Lian, Y.; Yu, H.; Wu, X. Drought monitoring utility of satellite-based precipitation products across mainland China. J. Hydrol. 2019, 568, 343–359. [Google Scholar] [CrossRef]
  35. Palomino-Ángel, S.; Anaya-Acevedo, J.A.; Botero, B.A. Evaluation of 3B42V7 and IMERG daily-precipitation products for a very high-precipitation region in northwestern South America. Atmos. Res. 2019, 217, 37–48. [Google Scholar] [CrossRef]
  36. Retalis, A.; Katsanos, D.; Tymvios, F.; Michaelides, S. Validation of the First Years of GPM Operation over Cyprus. Remote Sens. 2018, 10, 1520. [Google Scholar] [CrossRef]
  37. Iqbal, M.F.; Athar, H. Validation of satellite based precipitation over diverse topography of Pakistan. Atmos. Res. 2018, 201, 247–260. [Google Scholar] [CrossRef]
  38. Zhang, C.; Chen, X.; Shao, H.; Chen, S.; Liu, T.; Chen, C.; Ding, Q.; Du, H. Evaluation and intercomparison of high-resolution satellite precipitation estimates—GPM, TRMM, and CMORPH in the Tianshan Mountain Area. Remote Sens. 2018, 10, 1543. [Google Scholar] [CrossRef]
  39. Melo, D.C.D.; Xavier, A.C.; Bianchi, T.; Oliveira, P.T.S.; Scanlon, B.R.; Lucas, M.C.; Wendland, E. Performance evaluation of rainfall estimates by TRMM Multi-satellite Precipitation Analysis 3B42V6 and V7 over Brazil. J. Geophys. Res. Atmos. 2015, 120, 9426–9436. [Google Scholar] [CrossRef]
  40. Kummerow, C.; Barnes, W.; Kozu, T.; Shiue, J.; Simpson, J. The tropical rainfall measuring mission (TRMM) sensor package. J. Atmos. Ocean. Tech. 1998, 15, 809–817. [Google Scholar] [CrossRef]
  41. Kummerow, C.; Simpson, J.; Thiele, O.; Barnes, W.; Chang, A.; Stocker, E.; Adler, R.; Hou, A.; Kakar, R.; Wentz, F. The status of the Tropical Rainfall Measuring Mission (TRMM) after two years in orbit. J. Appl. Meteorol. 2000, 39, 1965–1982. [Google Scholar] [CrossRef]
  42. Huang, Y.; Chen, S.; Cao, Q.; Hong, Y.; Wu, B.; Huang, M.; Qiao, L.; Zhang, Z.; Li, Z.; Li, W.; et al. Evaluation of version-7 TRMM multi-satellite precipitation analysis product during the Beijing extreme heavy rainfall event of 21 July 2012. Water 2014, 6, 32. [Google Scholar] [CrossRef]
  43. Jiang, S.; Ren, L.; Xu, C.Y.; Yong, B.; Yuan, F.; Liu, Y.; Yang, X.; Zeng, X. Statistical and hydrological evaluation of the latest Integrated Multi-satellitE Retrievals for GPM (IMERG) over a midlatitude humid basin in South China. Atmos. Res. 2018, 214, 418–429. [Google Scholar] [CrossRef]
  44. Precipitation Measurement Mission. Available online: https://pmm.nasa.gov/data-access/downloads/trmm (accessed on 12 March 2019).
  45. Yuan, F.; Wang, B.; Shi, C.; Cui, W.; Zhao, C.; Liu, Y.; Ren, L.; Zhang, L.; Zhu, Y.; Chen, T.; et al. Evaluation of hydrological utility of IMERG Final run V05 and TMPA 3B42V7 satellite precipitation products in the Yellow River source region, China. J. Hydrol. 2018, 567, 696–711. [Google Scholar] [CrossRef]
  46. Wang, D.; Wang, X.; Liu, L.; Wang, D.; Huang, H.; Pan, C. Evaluation of TMPA 3B42V7, GPM IMERG and CMPA precipitation estimates in Guangdong Province, China. Int. J. Climatol. 2019, 39, 738–755. [Google Scholar] [CrossRef]
  47. Huang, W.R.; Chang, Y.H.; Liu, P.Y. Assessment of IMERG precipitation over Taiwan at multiple timescales. Atmos. Res. 2018, 214, 239–249. [Google Scholar] [CrossRef]
  48. Precipitation Measurement Mission. Available online: https://pmm.nasa.gov/data-access/downloads/gpm (accessed on 12 March 2019).
  49. National Meteorological Information Center of China Meteorological Administration. Available online: https://data.cma.cn/ (accessed on 12 March 2019).
  50. Shen, Y.; Xiong, A.; Wang, Y.; Xie, P. Performance of high-resolution satellite precipitation products over China. J. Geophys. Res. Atmos. 2010, 115, D02114. [Google Scholar] [CrossRef]
  51. Cressie, N. The origins of kriging. Math. Geol. 1990, 22, 239–252. [Google Scholar] [CrossRef]
  52. Duan, Z.; Liu, J.; Tuo, Y.; Chiogna, G.; Disse, M. Evaluation of eight high spatial resolution gridded precipitation products in Adige Basin (Italy) at multiple temporal and spatial scales. Sci. Total Environ. 2016, 573, 1536–1553. [Google Scholar] [CrossRef] [PubMed]
  53. Mashingia, F.; Mtalo, F.; Bruen, M. Validation of remotely sensed rainfall over major climatic regions in Northeast Tanzania. Phys. Chem. Earth 2014, 67-69, 55–63. [Google Scholar] [CrossRef]
  54. Yang, X.; Yong, B.; Hong, Y.; Chen, S.; Zhang, X. Error analysis of multi-satellite precipitation estimates with an independent raingauge observation network over a medium-sized humid basin. Hydrol. Sci. J. 2016, 61, 1813–1830. [Google Scholar] [CrossRef]
  55. Guo, H.; Chen, S.; Bao, A.; Behrangi, A.; Hong, Y.; Ndayisaba, F.; Hu, J.; Stepanian, P.M. Early assessment of Integrated Multi-satellite Retrievals for Global Precipitation Measurement over China. Atmos. Res. 2016, 176–177, 121–133. [Google Scholar] [CrossRef]
  56. Chen, F.; Li, X. Evaluation of IMERG and TRMM 3B43 monthly precipitation products over mainland China. Remote Sens. 2016, 8, 472. [Google Scholar] [CrossRef]
  57. Mantas, V.M.; Liu, Z.; Caro, C.; Pereira, A.J.S.C. Validation of TRMM multi-satellite precipitation analysis (TMPA) products in the Peruvian Andes. Atmos. Res. 2015, 163, 132–145. [Google Scholar] [CrossRef]
  58. Taylor, K.E. Summarizing multiple aspects of model performance in a single diagram. J. Geophys. Res. Atmos. 2001, 106, 7183–7192. [Google Scholar] [CrossRef]
  59. Sharifi, E.; Saghafian, B.; Steinacker, R. Downscaling satellite precipitation estimates with multiple linear regression, artificial neural networks, and spline interpolation techniques. J. Geophys. Res. Atmos. 2019, 124, 789–805. [Google Scholar] [CrossRef]
  60. Ma, Z.Q.; Tan, X.; Yang, Y.; Chen, X.; Kan, G.Y.; Ji, X.; Lu, H.Y.; Long, J.; Cui, Y.K.; Hong, Y. The First Comparisons of IMERG and the Downscaled Results Based on IMERG in Hydrological Utility over the Ganjiang River Basin. Water 2018, 10, 1392. [Google Scholar] [CrossRef]
  61. Sharifi, E.; Steinacker, R.; Saghafian, B. Assessment of GPM-IMERG and Other Precipitation Products against Gauge Data under Different Topographic and Climatic Conditions in Iran: Preliminary Results. Remote Sens. 2016, 8, 135. [Google Scholar] [CrossRef]
  62. Kaufman, Y.J.; Tanré, D.; Boucher, O. A satellite view of aerosols in the climate system. Nature 2002, 419, 215. [Google Scholar] [CrossRef] [PubMed]
  63. Dipu, S.; Prabha, T.V.; Pandithurai, G.; Dudhia, J.; Pfister, G.; Rajesh, K.; Goswami, B. Impact of elevated aerosol layer on the cloud macrophysical properties prior to monsoon onset. Atmos. Environ. 2013, 70, 454–467. [Google Scholar] [CrossRef]
  64. Ferraro, R.R.; Smith, E.A.; Berg, W.; Huffman, G.J. A screening methodology for passive microwave precipitation retrieval algorithms. J. Atmos. Sci. 1998, 55, 1583–1600. [Google Scholar] [CrossRef]
  65. Tian, Y.; Peters-Lidard, C.D.; Choudhury, B.J.; Garcia, M. Multitemporal analysis of TRMM-based satellite precipitation products for land data assimilation applications. J. Hydrometeorol. 2007, 8, 1165–1183. [Google Scholar] [CrossRef]
  66. Ma, Y.Z.; Tang, G.Q.; Long, D.; Yong, B.; Zhong, L.Z.; Wan, W.; Hong, Y. Similarity and error intercomparison of the GPM and its predecessor-TRMM multisatellite precipitation analysis using the best available hourly gauge network over the Tibetan Plateau. Remote Sens. 2016, 8, 569. [Google Scholar] [CrossRef]
  67. Wei, W.; Hui, L.; Zhao, T.; Jiang, L.; Shi, J. Evaluation and comparison of daily rainfall from latest GPM and TRMM products over the Mekong River Basin. IEEE J. Sel. Top. Appl. Earth Obs. Remote Sens. 2017, 10, 2540–2549. [Google Scholar]
  68. Kim, K.; Park, J.; Baik, J.; Choi, M. Evaluation of topographical and seasonal feature using GPM IMERG and TRMM 3B42 over Far-East Asia. Atmos. Res. 2017, 187, 95–105. [Google Scholar] [CrossRef]
  69. Zhang, S.J.; Wang, D.H.; Qin, Z.K.; Zheng, Y.Y.; Guo, J.P. Assessment of the GPM and TRMM precipitation products using the rain gauge network over the Tibetan Plateau. J. Meteorol. Res. 2018, 32, 324–336. [Google Scholar] [CrossRef]
Figure 1. Digital Elevation Model (DEM) and locations of meteorological stations in the Huang-Huai-Hai Plain.
Remotesensing 11 00697 g001
Figure 2. Density-colored scatterplots of annual precipitation from (a) IMERG and (b) 3B42V7 products versus meteorological stations data.
Remotesensing 11 00697 g002
Figure 3. Taylor diagram of the IMERG and 3B42V7 products versus stations data at (a) annual, (b) monthly and (c) daily scales.
Remotesensing 11 00697 g003
Figure 4. Spatial distribution of annual average precipitation from (a) meteorological stations, (b) IMERG and (c) 3B42V7.
Remotesensing 11 00697 g004
Figure 5. Density-colored scatterplots of seasonal precipitation from (ad) IMERG and (eh) 3B42V7 products versus meteorological stations data.
Remotesensing 11 00697 g005
Figure 6. Spatial distribution of seasonal average precipitation from (ad) meteorological stations, (eh) IMERG and (il) 3B42V7.
Remotesensing 11 00697 g006
Figure 7. Density-colored scatterplots of monthly precipitation from (a) IMERG and (b) 3B42V7 products versus meteorological stations data.
Remotesensing 11 00697 g007
Figure 8. Monthly comparison of regional average precipitation from stations and satellite estimates from January 2015 to December 2017.
Remotesensing 11 00697 g008
Figure 9. Density-colored scatterplots of daily precipitation from (a) IMERG and (b) 3B42V7 products versus meteorological stations data.
Remotesensing 11 00697 g009
Figure 10. Daily comparison of regional average precipitation from stations and satellite estimates from January 2015 to December 2017.
Remotesensing 11 00697 g010
Figure 11. Spatial distributions and box plots of (ac) CC, (df) RB, and (gi) RMSE at daily scale in the Huang-Huai-Hai Plain.
Remotesensing 11 00697 g011
Figure 12. Spatial distributions and box plots of (ac) POD, (df) FAR, (gi) CSI, and (jl) ACC in the Huang-Huai-Hai Plain.
Remotesensing 11 00697 g012
Figure 13. (a) POD, (b) FAR, (c) CSI, and (d) ACC of IMERG and 3B42V7 products for the entire period and each season.
Remotesensing 11 00697 g013
Figure 14. The frequency of daily precipitation from stations and satellite precipitation products for (a) spring, (b) summer, (c) autumn, (d) winter, and (e) the entire period.
Remotesensing 11 00697 g014
Table 1. Main parameters of Integrated Multi-Satellite Retrievals for Global Precipitation Measurement (GPM) mission (IMERG) and 3B42V7 products.
Satellite Precipitation ProductsIMERG3B42V7
Temporal/Spatial Resolutions0.5 h/0.1°3 h/0.25°
Coverage PeriodMarch 2014–presentDecember 1997–present
Coverage RangeGlobal (60°N–60°S)Global (50°N–50°S)
Table 2. Statistical metrics for evaluating IMERG and 3B42V7 products.
Statistical MetricsFormulaOptimal Value
Correlation Coefficient (CC) C C = i = 1 n ( x i x ¯ ) ( y i y ¯ ) i = 1 n ( x i x ¯ ) 2 i = 1 n ( y i y ¯ ) 2 1
Relative Bias (RB) R B = i = 1 n ( x i y i ) i = 1 n y i × 100 0
Root Mean Square Error (RMSE) R M S E = 1 n i = 1 n ( x i y i ) 2 0
Probability of Detection (POD) P O D   =   H H   +   M 1
False Alarm Ratio (FAR) F A R   =   F H   +   F 0
Critical Success Index (CSI) C S I   =   H H   + M   + F 1
Accuracy (ACC) A C C   =   H   + C H   + M   + F   + C 1
Note: n denotes number of samples; x denotes satellite precipitation; y denotes station precipitation; x ¯ and y ¯ denote mean values of x and y, respectively; H denotes the number of rainfall events that observed and detected; M is the number of rainfall that observed but not detected; F denotes the number of rainfall events that not detected but observed; C, the satellite product does not detect precipitation and precipitation is not observed in rain gauge.

