Assessment of Satellite-Based Precipitation Measurement Products over the Hot Desert Climate of Egypt


1
Department of Construction and Building Engineering, College of Engineering and Technology, Arab Academy for Science, Technology and Maritime Transport (AASTMT), Cairo, 2033 Elhorria, Egypt
2
Department of Hydraulics and Hydrology, School of Civil Engineering, Faculty of Engineering, Universiti Teknologi Malaysia (UTM), Johor, 81310 Skudai, Malaysia
3
State Key Laboratory of Hydrology-Water Resources and Hydraulic Engineering, Nanjing Hydraulic Research Institute, Nanjing 210029, China
4
Research Center for Climate Change, Ministry of Water Resources, Nanjing 210029, China
*
Author to whom correspondence should be addressed.
Remote Sens. 2019, 11(5), 555; https://doi.org/10.3390/rs11050555
Submission received: 10 January 2019
/
Revised: 20 February 2019
/
Accepted: 27 February 2019
/
Published: 7 March 2019
(This article belongs to the Special Issue Weather Forecasting and Modeling Using Satellite Data)
Abstract
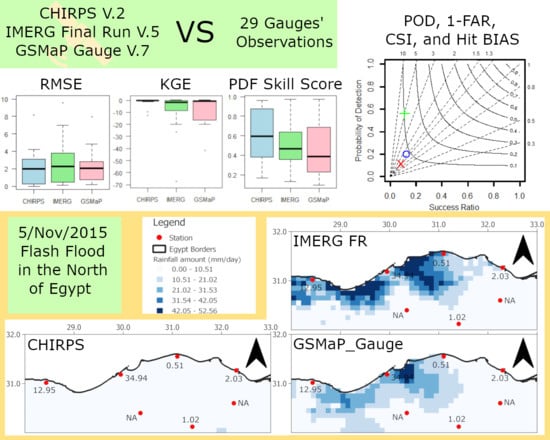
:The performance of three satellite-based high-resolution gridded rainfall datasets, namely the gauge corrected Global Satellite Mapping of Precipitation (GSMaP), Integrated Multi-Satellite Retrievals for Global Precipitation Measurement (IMERG), and the Climate Hazards Group InfraRed Precipitation with Stations (CHIRPS) in the hot desert climate of Egypt were assessed. Seven statistical indices including four categorical indices were used to assess the capability of the products in estimating the daily rainfall amounts and detecting the occurrences of rainfall under different intensity classes from March 2014 to May 2018. Although the products were gauge-corrected, none of them showed a consistent performance, and thus could not be titled as the best or worst performing product over Egypt. The CHIRPS was found to be the best product in estimating rainfall amounts when all rainfall events were considered and IMERG was found as the worst. However, IMERG was better at detecting the occurrence of rainfall than CHIRPS. For heavy rainfall events, IMERG was better at the majority of the stations in terms of the Kling–Gupta efficiency index (−0.34) and skill-score (0.33). The IMERG was able to show the spatial variability of rainfall during the recent big flash flood event that hit Northern Egypt. The study indicates that accurate estimation of rainfall in the hot desert climate using satellite sensors remains a challenge.
1. Introduction
Arid regions are facing numerous challenges in managing limited water resources [1,2]. Although rainfall is considered one of the most crucial elements for a wide range of socio-economic activities in this harsh environment [3], extreme precipitation often leads to devastating flash floods [2,4]. Costa [5] reported that arid and semi-arid regions are susceptible to greater rainfall intensity leading to severe floods more than humid regions. To mitigate flash floods, reduce casualties and economic losses, while ensuring the efficient reuse of flood water, accurate measurement of the spatial and temporal distribution of rainfall is needed [6,7]. Although conventional rain gauges are considered the most reliable and accurate means of measuring rainfall [8,9], their spatial distribution is sparse in most parts of the world, and therefore, they represent unevenly distributed point data, which cannot be used to present the spatial variability of rainfall [10,11,12,13]. In the last three decades, a number of satellite sensors have been developed to provide precipitation estimations across the globe. These data are widely used in various hydro-climatological studies [2,4,14,15], particularly in data-scarce regions where observation stations are limited.
Currently, many satellite rainfall products are freely available at various temporal and spatial resolutions. In 2002, Japan Science and Technology Agency and the Japanese Aerospace Exploration Agency (JAXA) initiated the Global Satellite Mapping of Precipitation (GSMaP) project to provide a high resolution (0.1° × 0.1°) hourly estimate of global precipitation using passive microwave radiometers using three products (i.e., the real time, the post real time, and the gauge adjusted) [16]. Later in 2014, NASA and JAXA launched the Global Precipitation Measurement (GPM) core observatory satellite which provides high-resolution integrated multi-satellite retrievals for GPM (IMERG) by integrating sensor data from the core observatory and a constellation of other radiometers and infrared (IR) imagers [17]. Integrated multi-satellite retrievals have three half-hourly products that provide rainfall from March 2014 to the present. Unlike its predecessor, the Tropical Rainfall Measuring Mission (TRMM), GPM can better detect light rainfall and snow as a result of the new dual-frequency precipitation radar, and a conical-scanning higher frequency multichannel GPM microwave imager [18]. In 2015, the Climate Hazard Group released the 0.05° × 0.05° resolution Climate Hazard Group’s InfraRed Precipitation with Stations (CHIRPS) dataset, which provides quasi-global daily rainfall data [19]. The daily variability of CHIRPS rainfall is estimated solely based on geostationary thermal infrared satellite observation and reanalysis data, while the monthly variability was bias-corrected based on stations’ observations [19,20].
Egypt, having a hot desert arid climate, has a long history of flash floods [5,21,22,23,24]. Recently, Egypt faced several deadly flash floods such as the flood of May 2014 (150 million USD of damage) [4], October 2015 (6 killed) [25], November 2015 (25 killed) [26], October 2016 (26 killed) [27,28], and the New Cairo city flood in April 2018 [29] which caused numerous people to be evacuated, destruction of assets, and huge economic losses. Reliable measurement of rainfall is very important for forecasting rainfall-driven flash floods and planning necessary mitigation measures.
The Nile is the major source of fresh water in Egypt [10,14]. It is anticipated that Egypt will suffer from a serious shortage of fresh water due to the construction of the Ethiopian Grand Renaissance dam which will affect the river flow and Egypt’s share of water [10,30,31]. Many agricultural communities located at the Mediterranean Sea shores, Western Desert, and Sinai Peninsula are already depending on rainfall as their major water source. Therefore, rainfall has gained increasing attention not only for the better mitigation of flash floods but also as an important source of freshwater for the forthcoming years.
Many studies attempt to evaluate the accuracy of GSMaP, IMERG, and CHIRPS globally or over a specific region [32]; however, none of the studies have evaluated their performance in Egypt. Table 1 summarizes the main findings of the previous evaluation studies of the three products in nearby countries. This paper evaluates the performance of the gauge corrected GSMaP_Gauge 7, the gauge corrected IMERG Final Run (FR) 5, and CHIRPS 2 dataset in estimating observed rainfall in Egypt. A set of robust statistical indices were used for the evaluation of the performance of satellite precipitation datasets based on their ability to estimate the amount and detecting the occurrences of rainfall. The rainfall intensities were classified into different categories to assess the ability of the products for accurate estimation of rainfall amounts and detection of rainfall events with different intensity classes. Furthermore, the spatial variability of rainfall during a recent flash flood in Egypt was used to assess the capability of the products in monitoring rainfall-driven flash floods. As intense localized rainfall is the cause of flash flood in arid regions [5], high-resolution satellite-based rainfall data can be used to monitor such rainfall phenomena to anticipate possible flash floods. Assessment of the performance of the products in estimating such flash flood triggering rainfall events will provide advanced knowledge on the applicability of the products. The methodology presented in this paper can be useful for better assessment of the performance of satellite-based rainfall products and the selection of an appropriate product for flood prediction and monitoring for other regions. The results obtained in this study can encourage more studies on the application of the products in different hydrologic applications such as water resources management, flood forecasting, and hydrological modelling. Furthermore, the findings of this study can be useful for feedback to the developer for the improvement of the remote-sensing precipitation measurement products.
2. Case Study
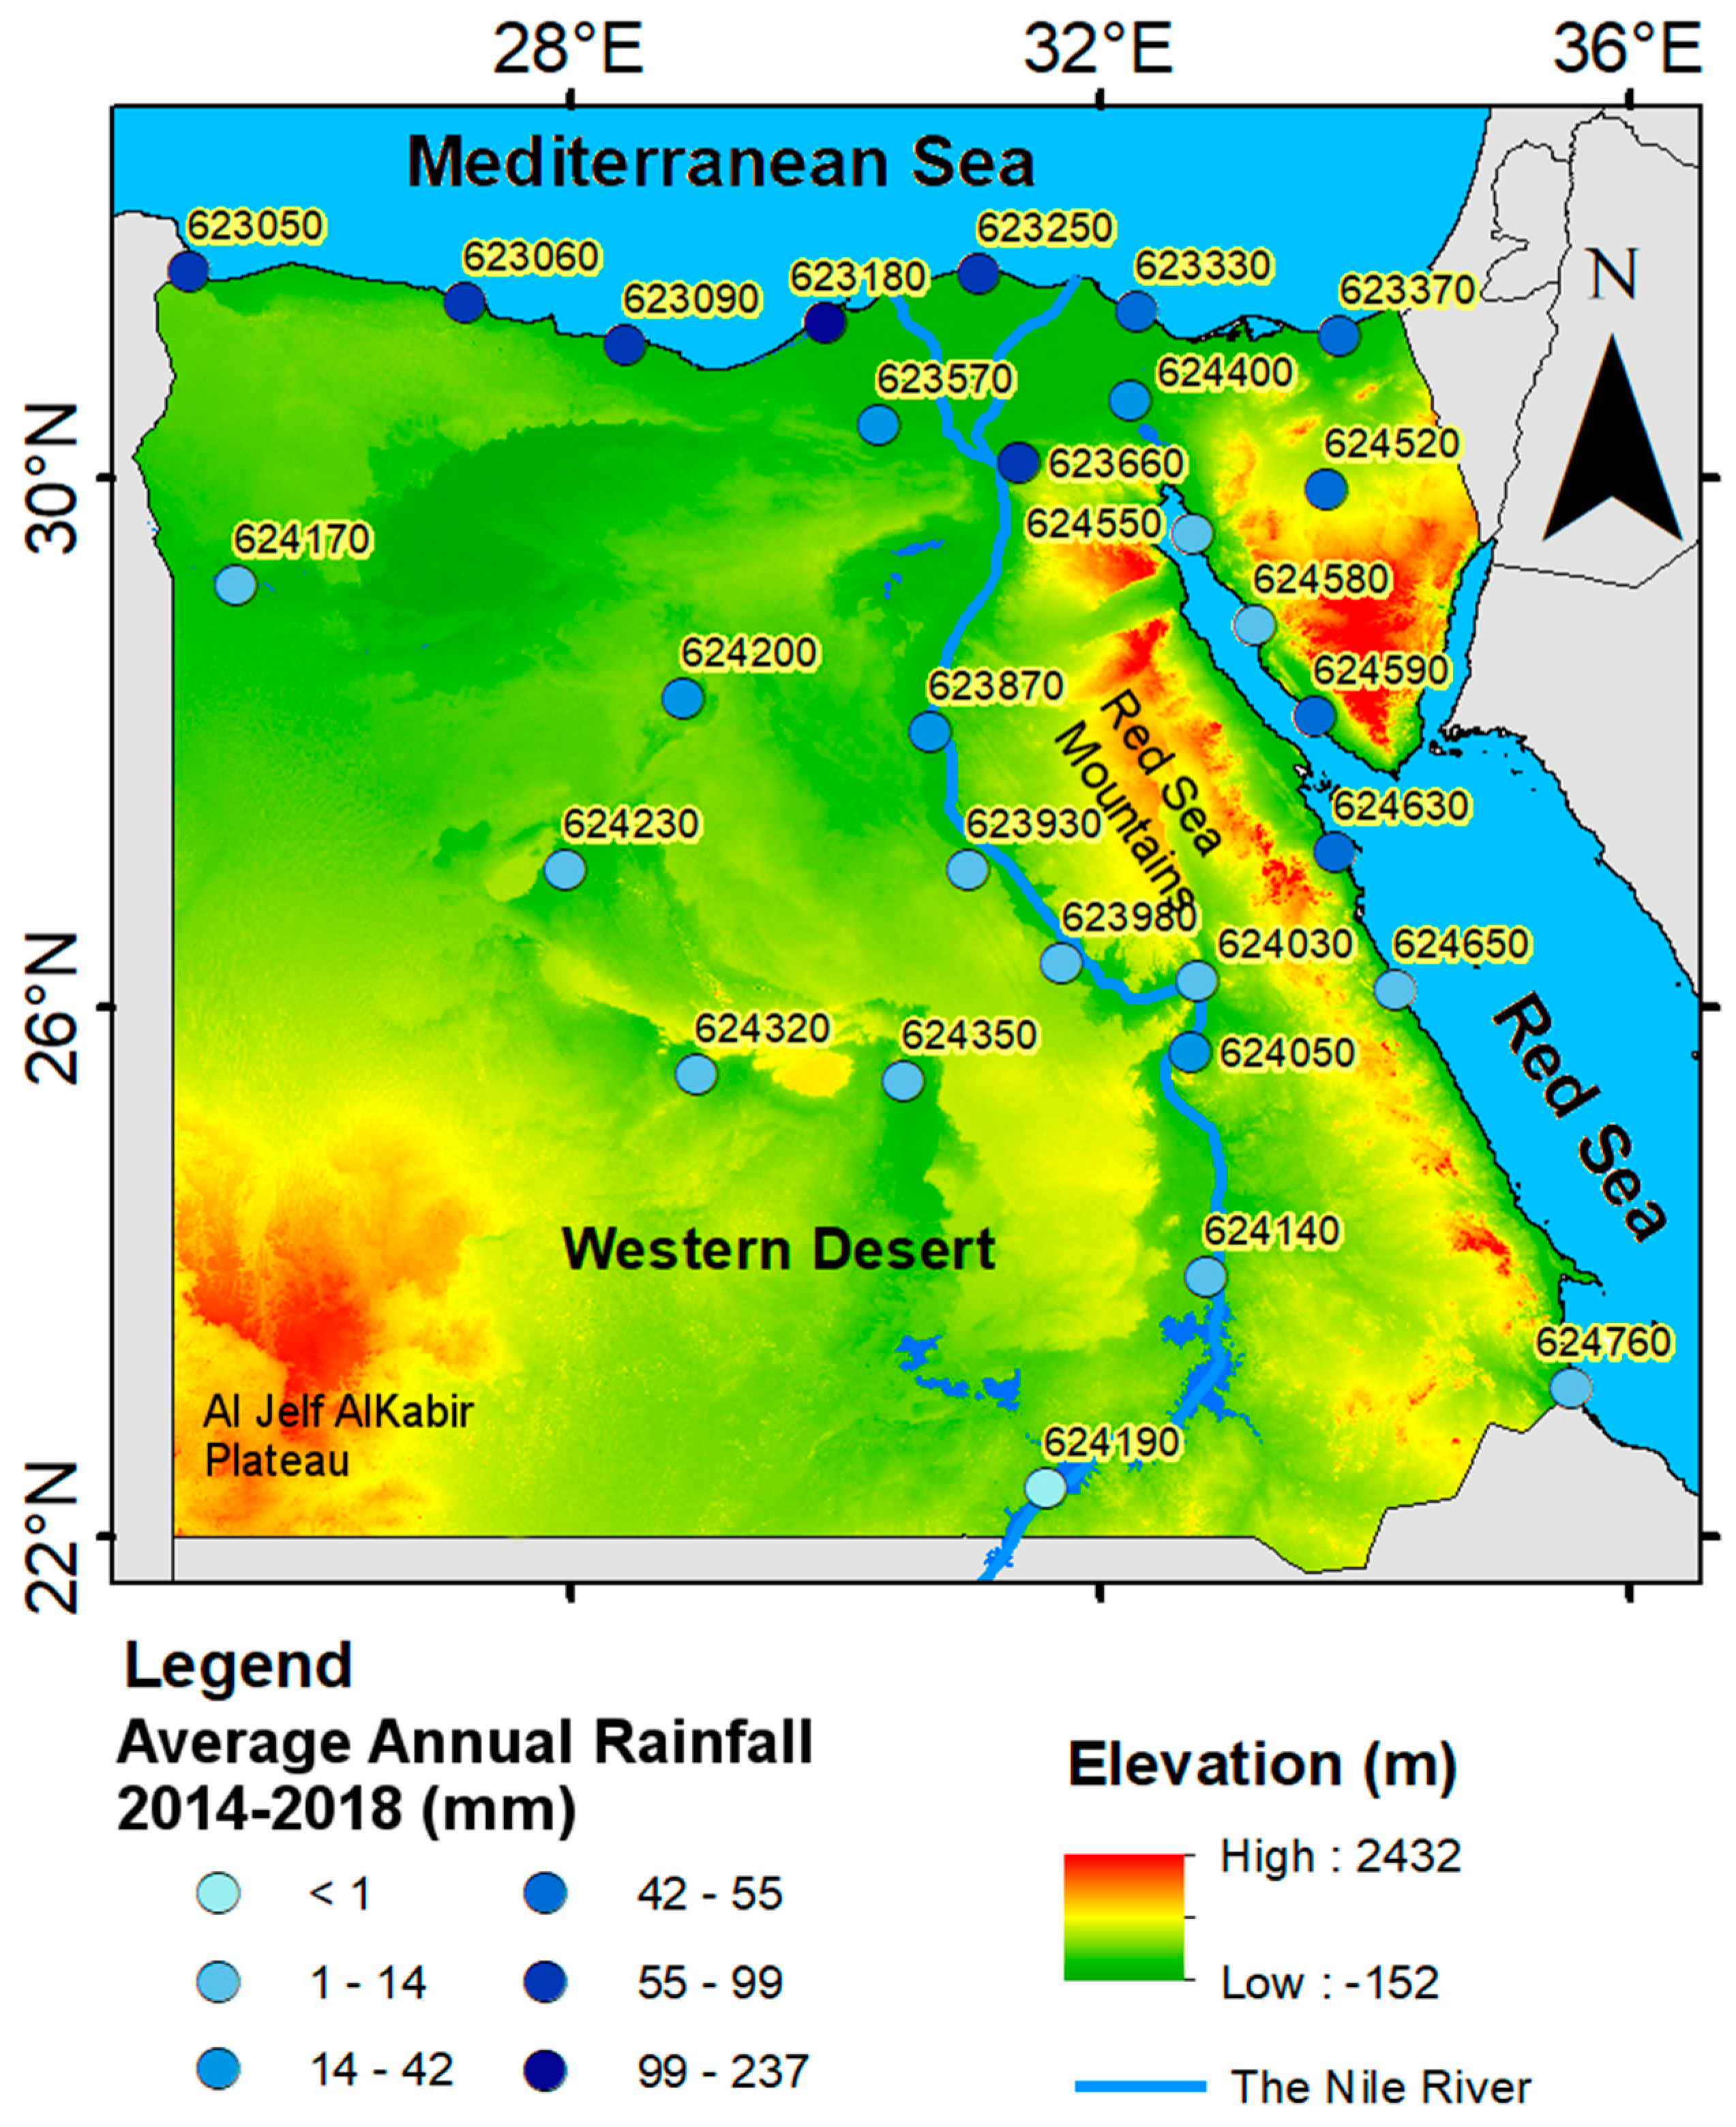
Egypt, located in the Northeast of Africa between latitude, 22° to 31°36′N; and longitude, 25° to 35°E, has an area of about one million km2 (Figure 1). Most of the country lies below 300 m above the mean sea level, except Mount Catherine in the Saini Peninsular, the Red Sea Mountains, and Al Jelf Alkabir Plateau in the far southwest. The country is mostly covered by desert which is penetrated by the Nile River from the south to the north. The Nile River is the major freshwater source of the country [10], and therefore, most of the population lives on the Nile’s banks.
The climate of Egypt is classified as a hot desert climate, having four seasons. Most of the rainfall occurs only in winter (November to February). As shown in Figure 1, the shores of the Mediterranean and the north of the Red Sea are the wettest zones of Egypt (average precipitation of 200 mm/year during 1961–1990), while the south and the western desert, which is one of the driest parts of the Sahara [40], has an annual average rainfall near to zero.
3. Data
In this study, four datasets were used namely, ground observations, GPM IMERG, GSMaP, and CHIRPS. A brief description of each of the datasets is given below.
3.1. Ground Observations
Daily observations of rainfall at 29 meteorological stations were used as a reference ground data for evaluating the performance of the three gridded rainfall data. The stations were well spread over Egypt (Figure 1). Data was collected from the US National Climate Data Center Global Summary of Days (GSOD) database for the period of March 2014–May 2018. Percentage of missing data within the study period, count of wet days, and the maximum amount of recorded daily rainfall (mm) at each gauge are presented in Table 2.
3.2. Satellite-Based Gridded Daily Precipitation Datasets
The GSMaP integrates the global (within 60°N–60°S) precipitation rates retrieved from passive microwave radiometers with the cloud moving vectors obtained from the infra-red images to develop the GSMaP Near Real Time (GSMaP_NRT) dataset [41]. Kalman filter and two-way morphing technique were used to reduce the retrieval errors and to produce the wet area from microwave radiometers of the GSMaP_NRT to generate GSMaP Moving Vector with Kalman filter (GSMaP_MVK) [42]. The GSMaP_MVK was corrected using the National Oceanic and Atmospheric Administration Climate Prediction Center (CPC) global rain gauge dataset to generate GSMaP_Gauge [43]. GSMaP_Gauge hourly 0.1° × 0.1° precipitation data was obtained from their website and temporally aggregated to daily scale. The GSMaP data was found suitable for the simulation of flash floods of 2010, 2013, and 2014 in the south of Egypt [4].
The GPM IMERG, an assemblage of several satellite precipitation products, provides a half-hourly 0.1° resolution estimate of precipitation in three modes (early, late, and FR). The FR is the complete final gauge calibrated product which showed better accuracy than the products of other modes [6,44]. It integrates all available microwave, infrared, and gauges rainfall retrievals from the GPM constellation after inter-calibration and interpolation [9]. The FR half-hourly version 5 product was aggregated into daily and used in this study.
CHIRPS was developed by the Climate Hazard Group (CHG) using a three-stage procedure [19,20]. First, by using satellite data of cold cloud durations, the pentad (5-days) infrared precipitation estimate was generated and calibrated with TRMM multi-satellite precipitation analysis (TMPA) 3B42-based pentads. Second, the climate hazards precipitation climatology (CHPclim) pentad was multiplied by the infrared precipitation estimates after dividing them by its long-term mean to generate the CHG IR Precipitation (CHIRP). Finally, reanalysis data was used to provide day-to-day variability while the adjustment of monthly climatology was done using gauge observations to produce the final product—CHIRPS [45]. The CHIRPS provides daily gridded rainfall data for the period 1981–present.
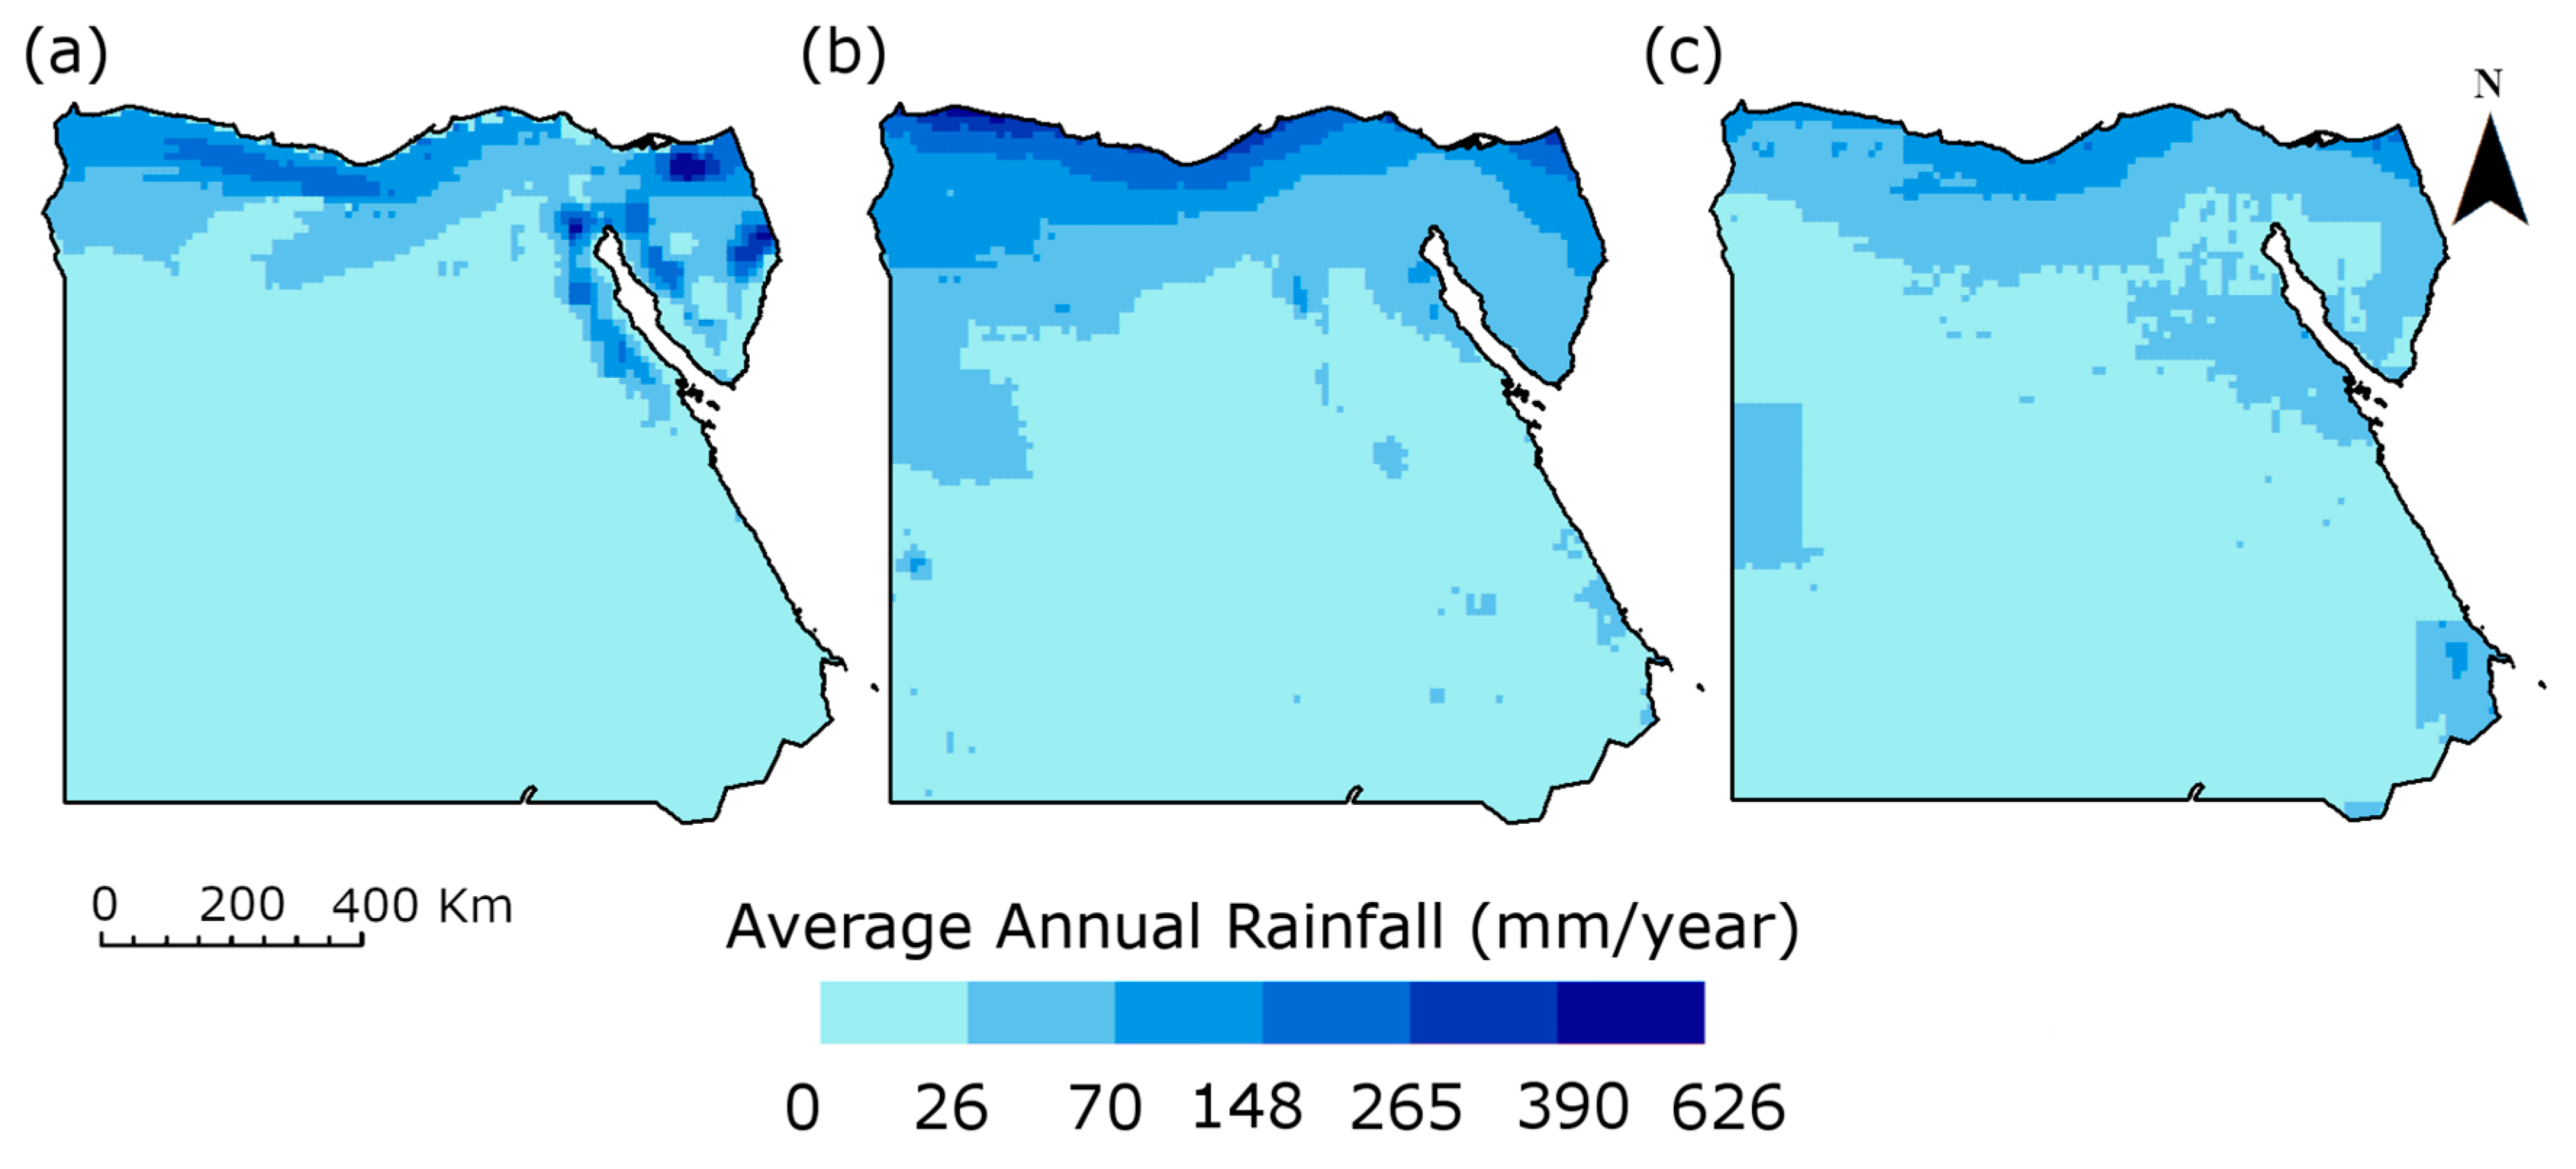
Figure 2 shows the spatial distribution of average annual rainfall over Egypt for the period March 2014–May 2018 estimated using three gridded datasets. Overall, all three precipitation products showed the same spatial annual rainfall pattern: high amounts along the Mediterranean shores which gradually decreases toward inland. However, the CHIRPS also showed a high amount of rainfall concentrated along the Red Sea and Sinai mountains. Besides, GSMaP was found to underestimate rainfall compared to other products.
4. Methodology
In order to evaluate the performance of CHIRPS, IMERG FR, and GSMaP_Gauge, the observed rainfall data at each station were compared against the nearest grid point data of the satellite-based precipitation products. This method is commonly used when evaluating remote sensing products to ensure the use of the original retrievals of each product [46]. After preparing the corresponding rainfall data of different satellite products at each observed location, 7 statistical indices which also include 4 categorical indices were used to evaluate the performance of each product in terms of precipitation amount and occurrence. Three statistical indices (Table 3) were used to measure the performance of satellite products in estimating rainfall amount namely, root mean square error (RMSE), Kling–Gupta efficiency (KGE) index, and probability distribution function (PDF) skill score (SS). The RMSE represents the standard deviation of the residuals, while KGE integrates the correlation, bias, and variability of the ground and remote sensing observations into one index [47]. Compared to the Nash–Sutcliffe Efficiency (NSE) index, KGE is less sensitive to extreme rainfall, and therefore, can better describe and measure the overall fitness of rainfall having different intensities [48]. The SS quantifies the overlap between the gauge and satellite-based retrievals’ PDFs [49]. The categorical indices, listed in Table 4. were calculated based on a 2 × 2 contingency matrix shown in Table 5. The categorical indices include the probability of detection (POD), the false alarm ratio (FAR), the critical success index (CSI), and hit BIAS. The POD estimates the ratio of the rainfall events estimated by the satellite-based products to the total number of gauge-observed rainfall events [46]. While the FAR estimates the reliability of satellite-based products as the ratio of falsely detected rainfall events by the satellite-based products, i.e., rainfall events detected by satellites but which did not actually occur, to the total number of observed rainfall events [46]. The success ratio is the opposite of FAR (1-FAR). The CSI is the number of correctly detected wet days divided by the total number of wet occasions. The hit BIAS is the ratio of the number of wet days estimated by the satellite-based products to the observed number of wet days. The evaluation methodology was carried out following several rainfall classes (Table 6) presented by Tan et al. [50]. This includes the “all-events” class which was not constrained by a threshold value, and thus represent the whole time series. The other classes were used to compare rainfall events within a daily rainfall intensity threshold range as given in Table 6. The aim of classifying rainfall events is to demonstrate the performance of each product in estimating rainfall occurrences within the specified rainfall ranges for the period from March 2014 to May 2018. The KGE and SS could not be calculated for the stations where rainfall events under a certain class never occurred or occurred only one time. Therefore, these stations were not shown in the maps of the corresponding rainfall class in the results section.
5. Results
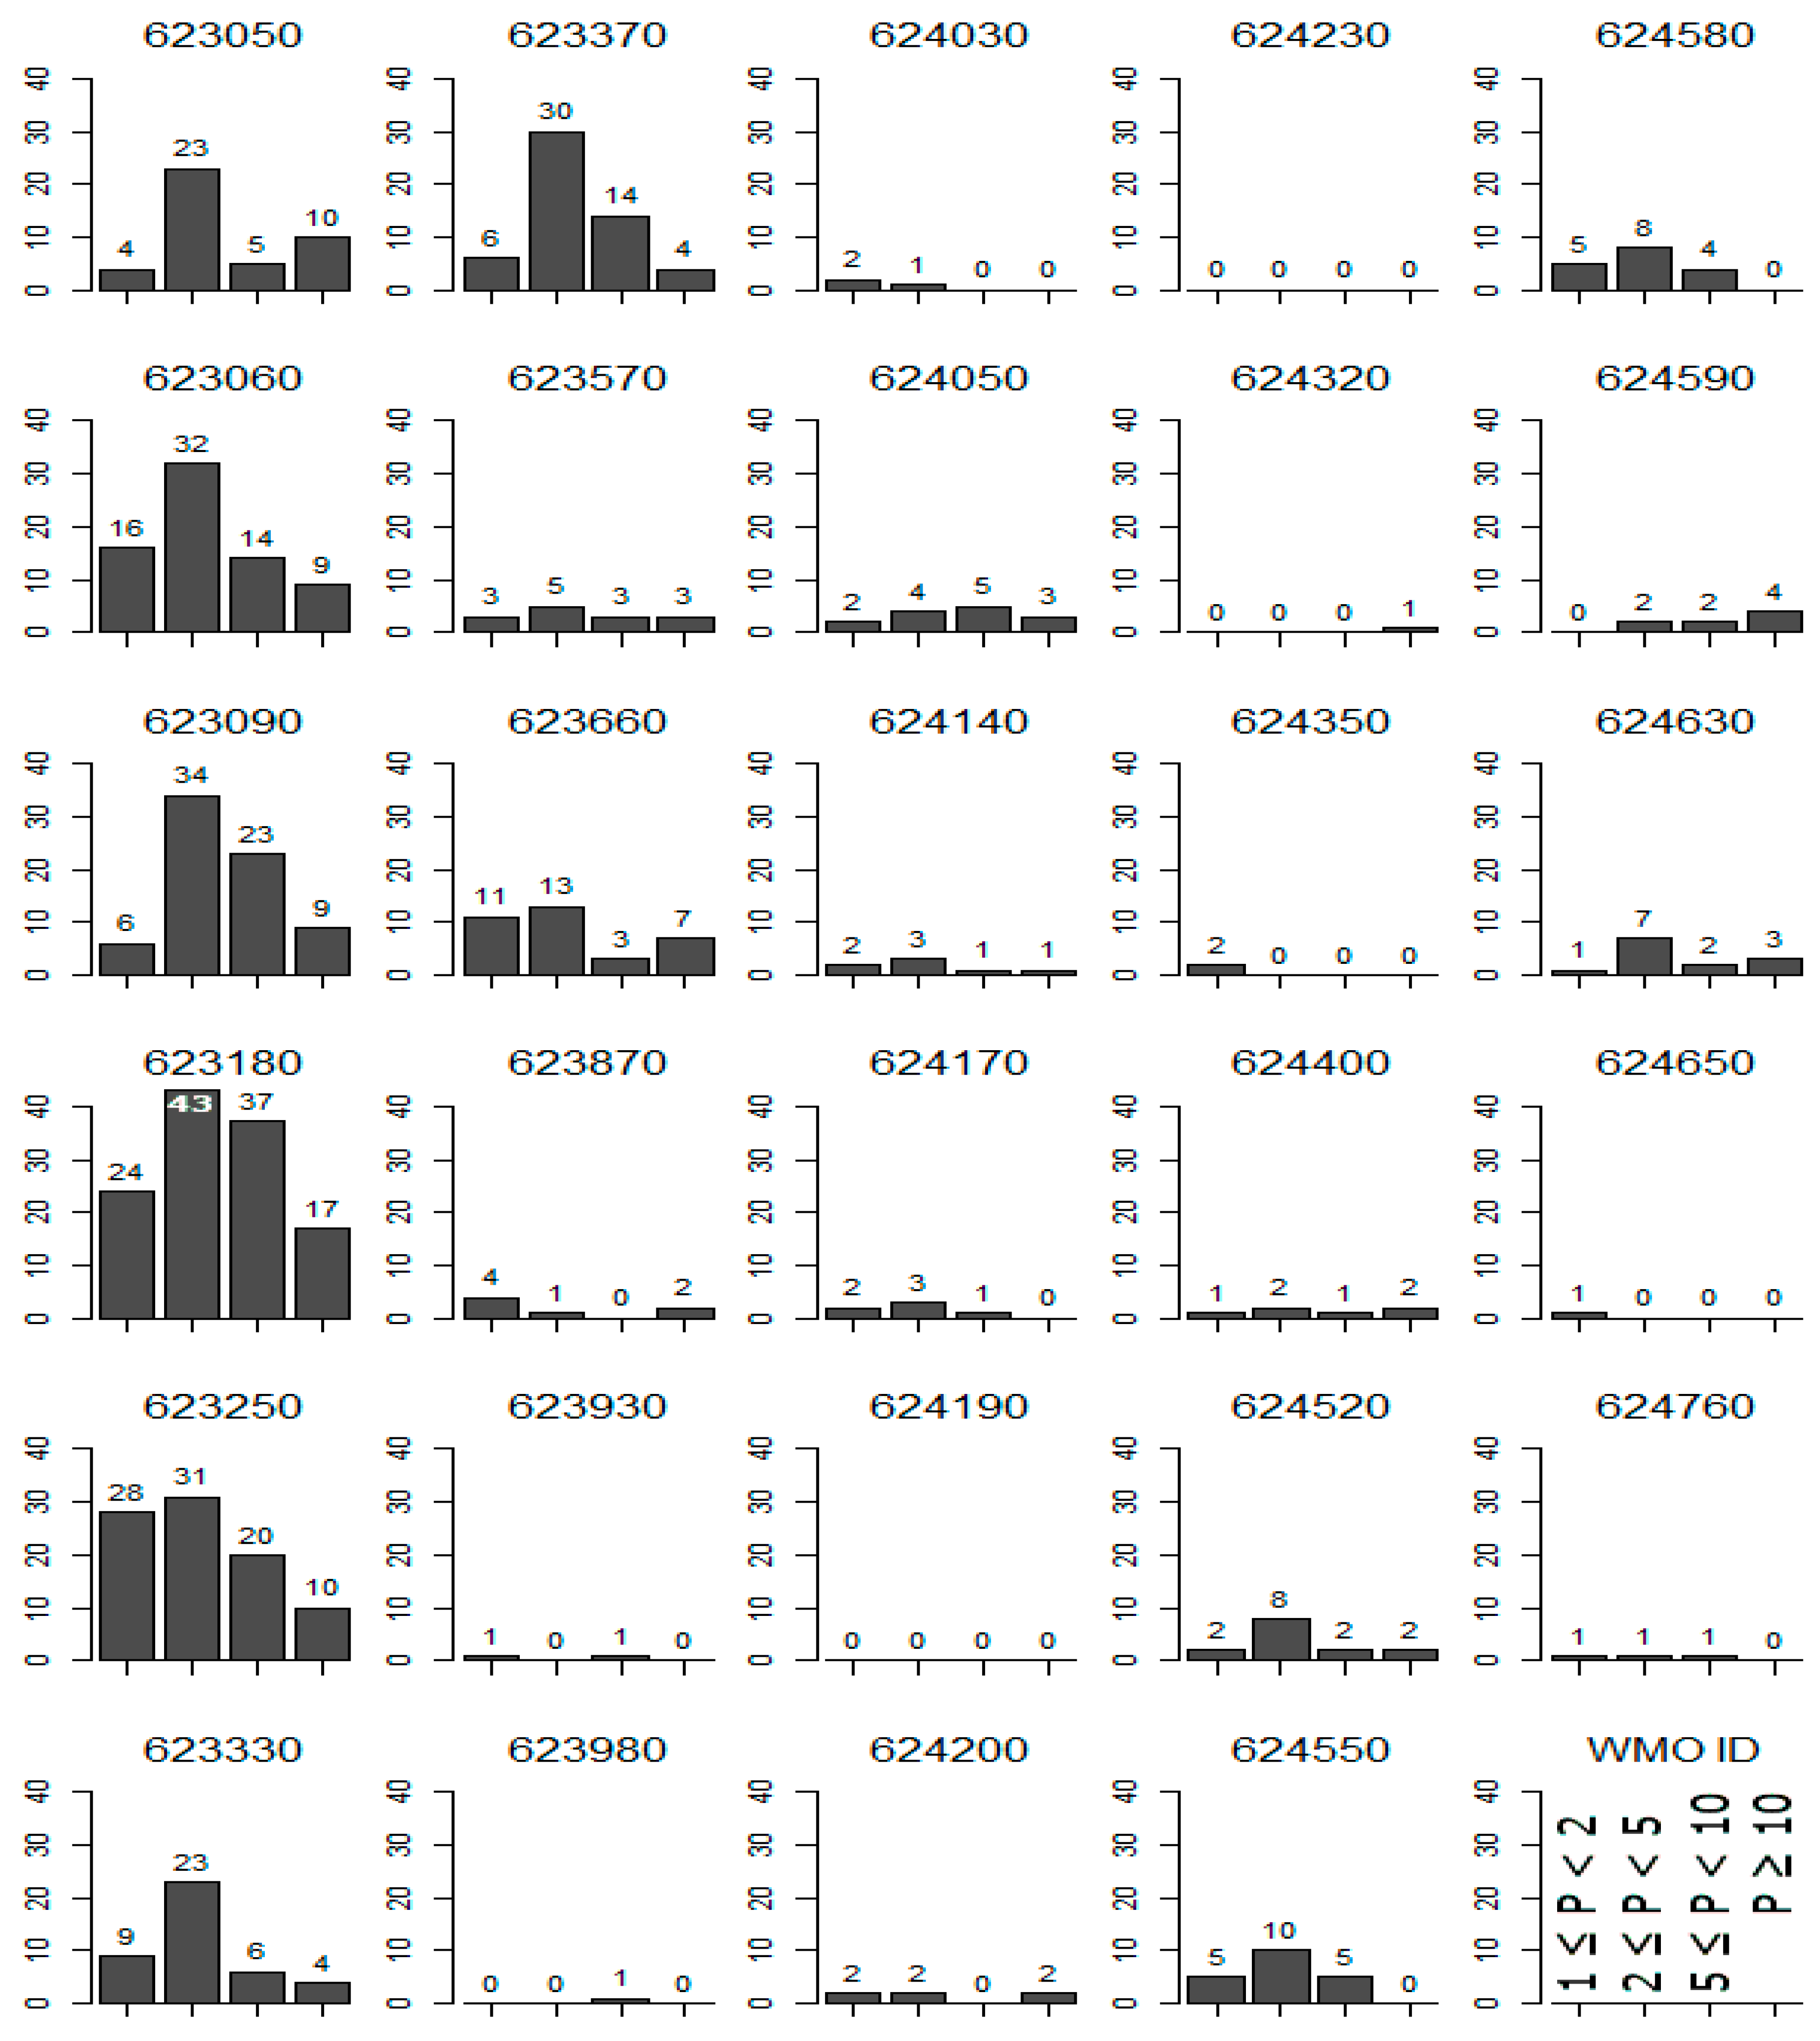
Figure 3 shows bar graphs of the count of rainfall events of the light, low–moderate, high–moderate, and heavy rainfall classes at each station. As shown in Table 2, wet days were rare in most of the stations. The count of “no/tiny rainfall class” event was omitted from the bar graphs as the number of this event was very high compared to other events. This was done in order to show the count of the remaining rainfall intensity classes clearly. At stations 624190 and 624230, only one rainfall event occurred at each station during the study period. Those rainfall events were less than 1 mm (categorized as no/tiny rainfall class), and therefore did not appear in the graphs presented in Figure 3. Table 7 shows the total number of events captured by ground rainfall station for each rainfall intensity class.
5.1. Validation Based on Rainfall Amount
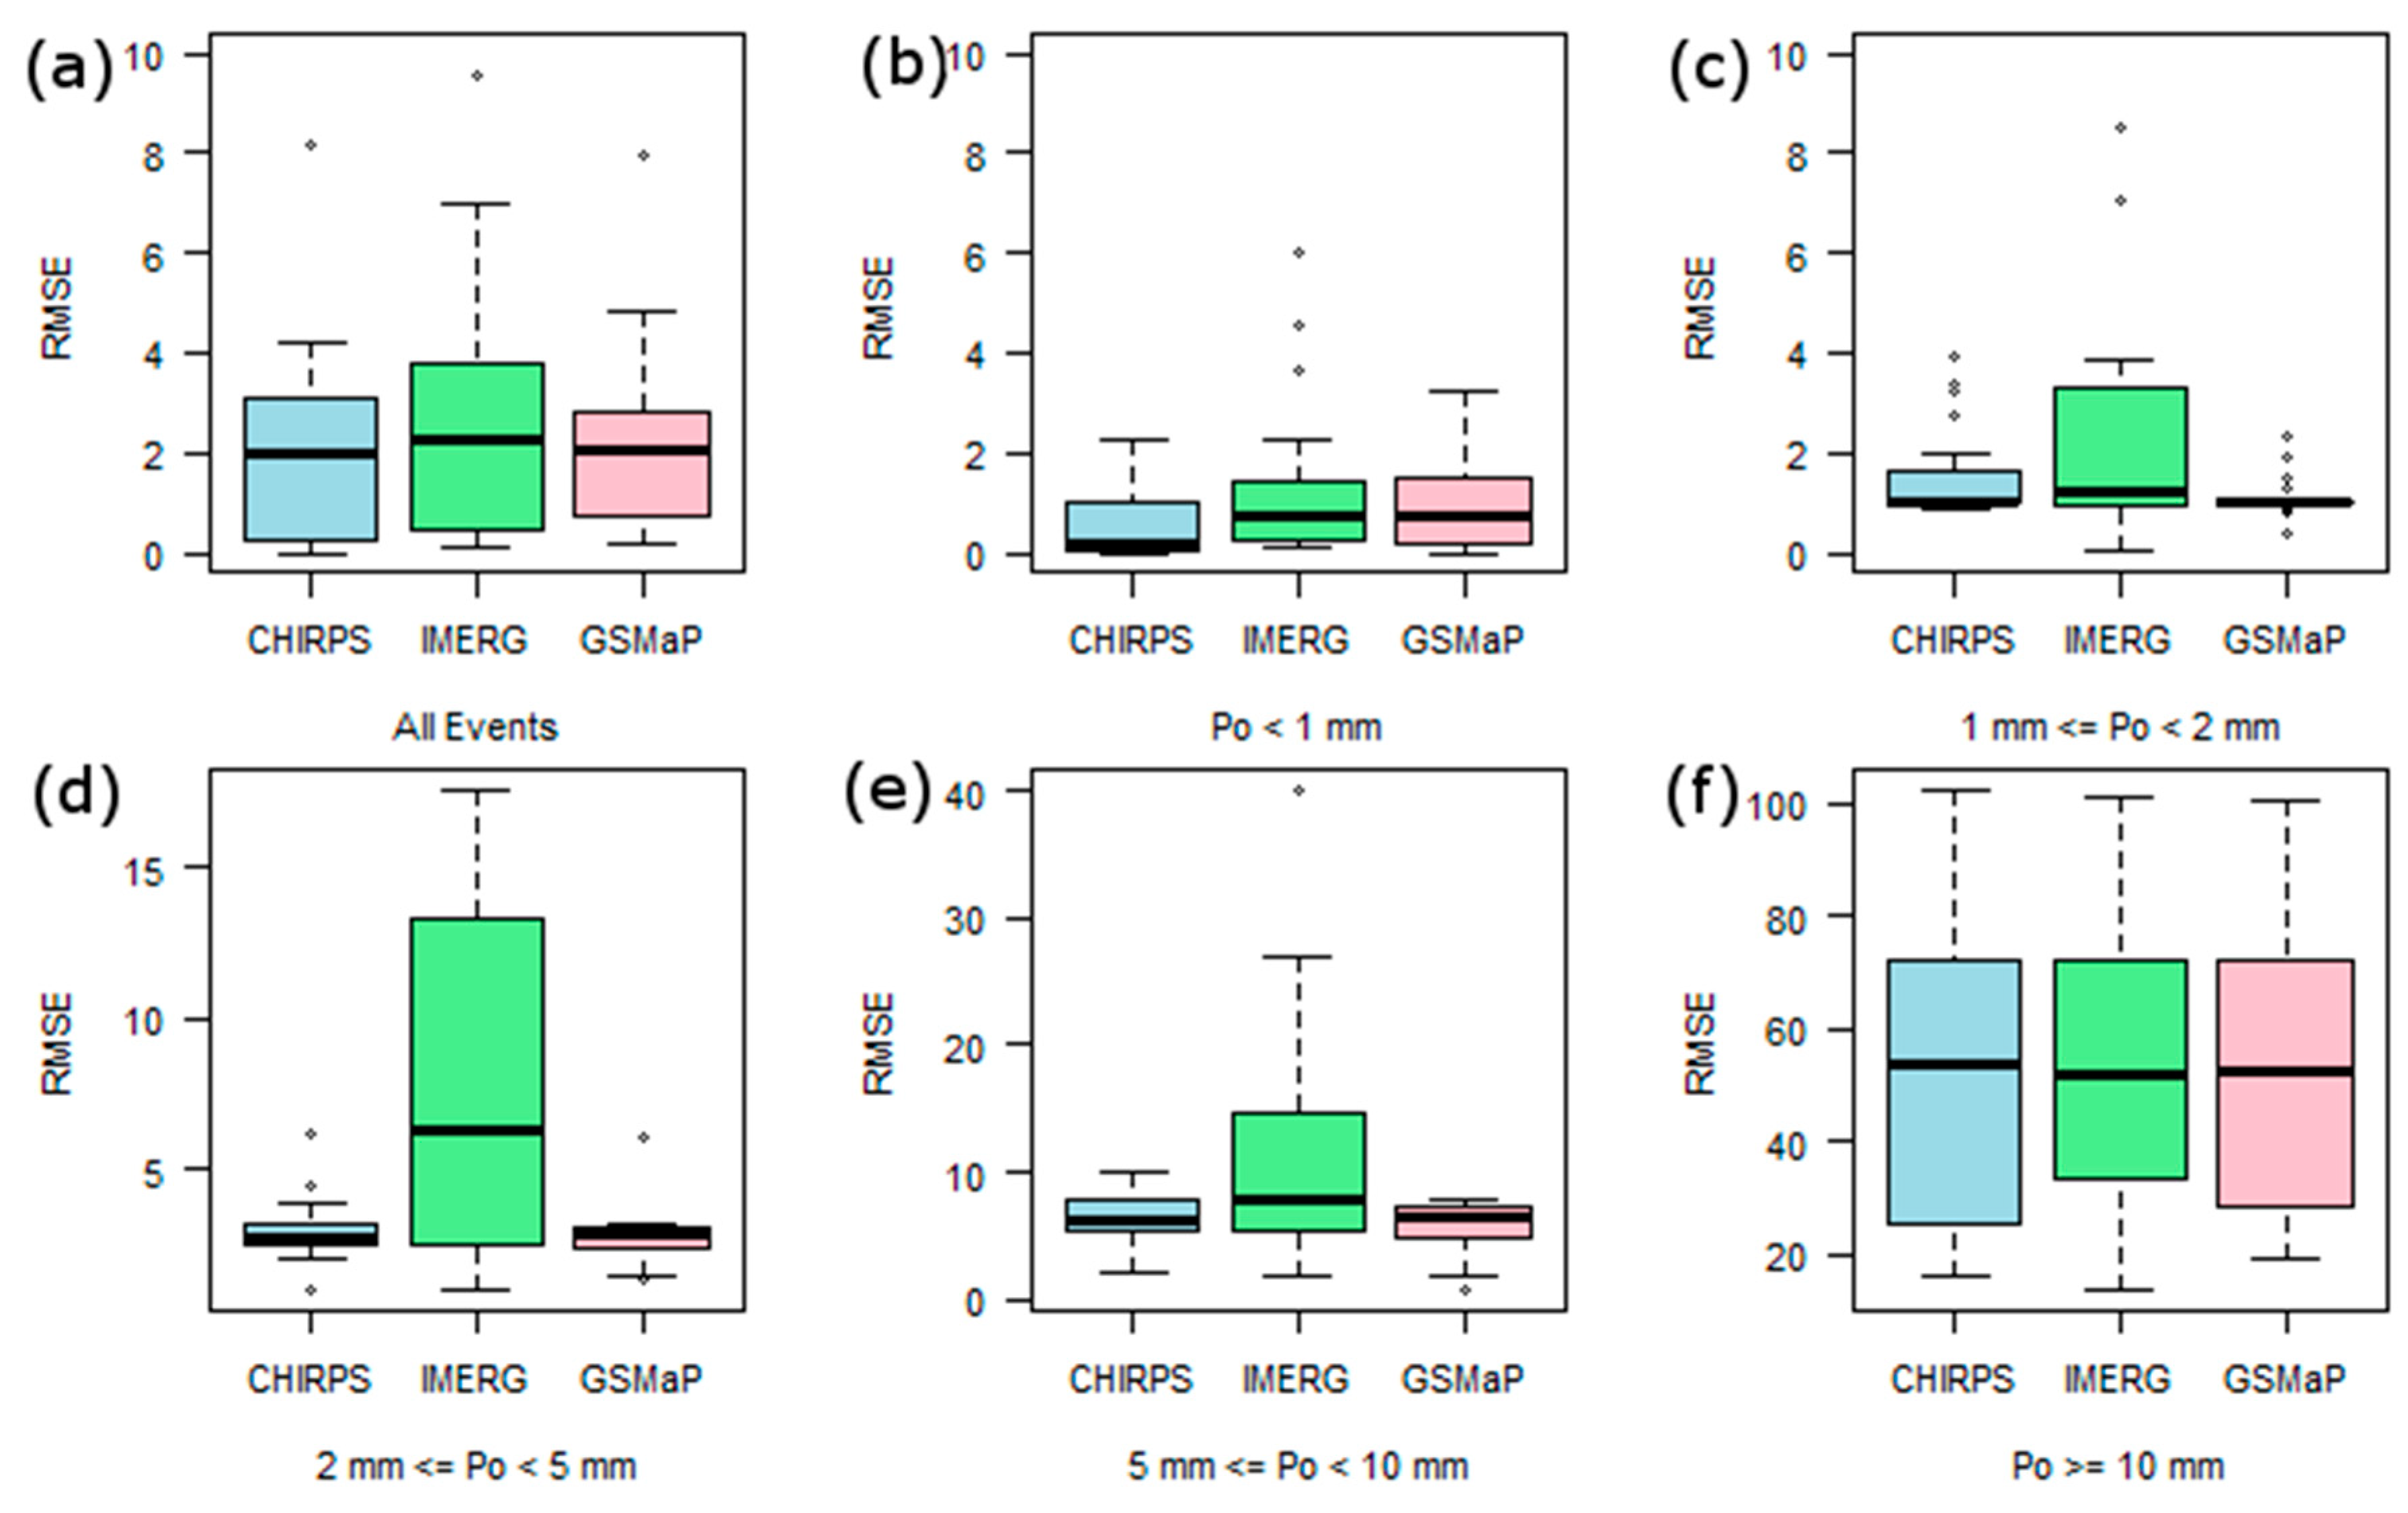
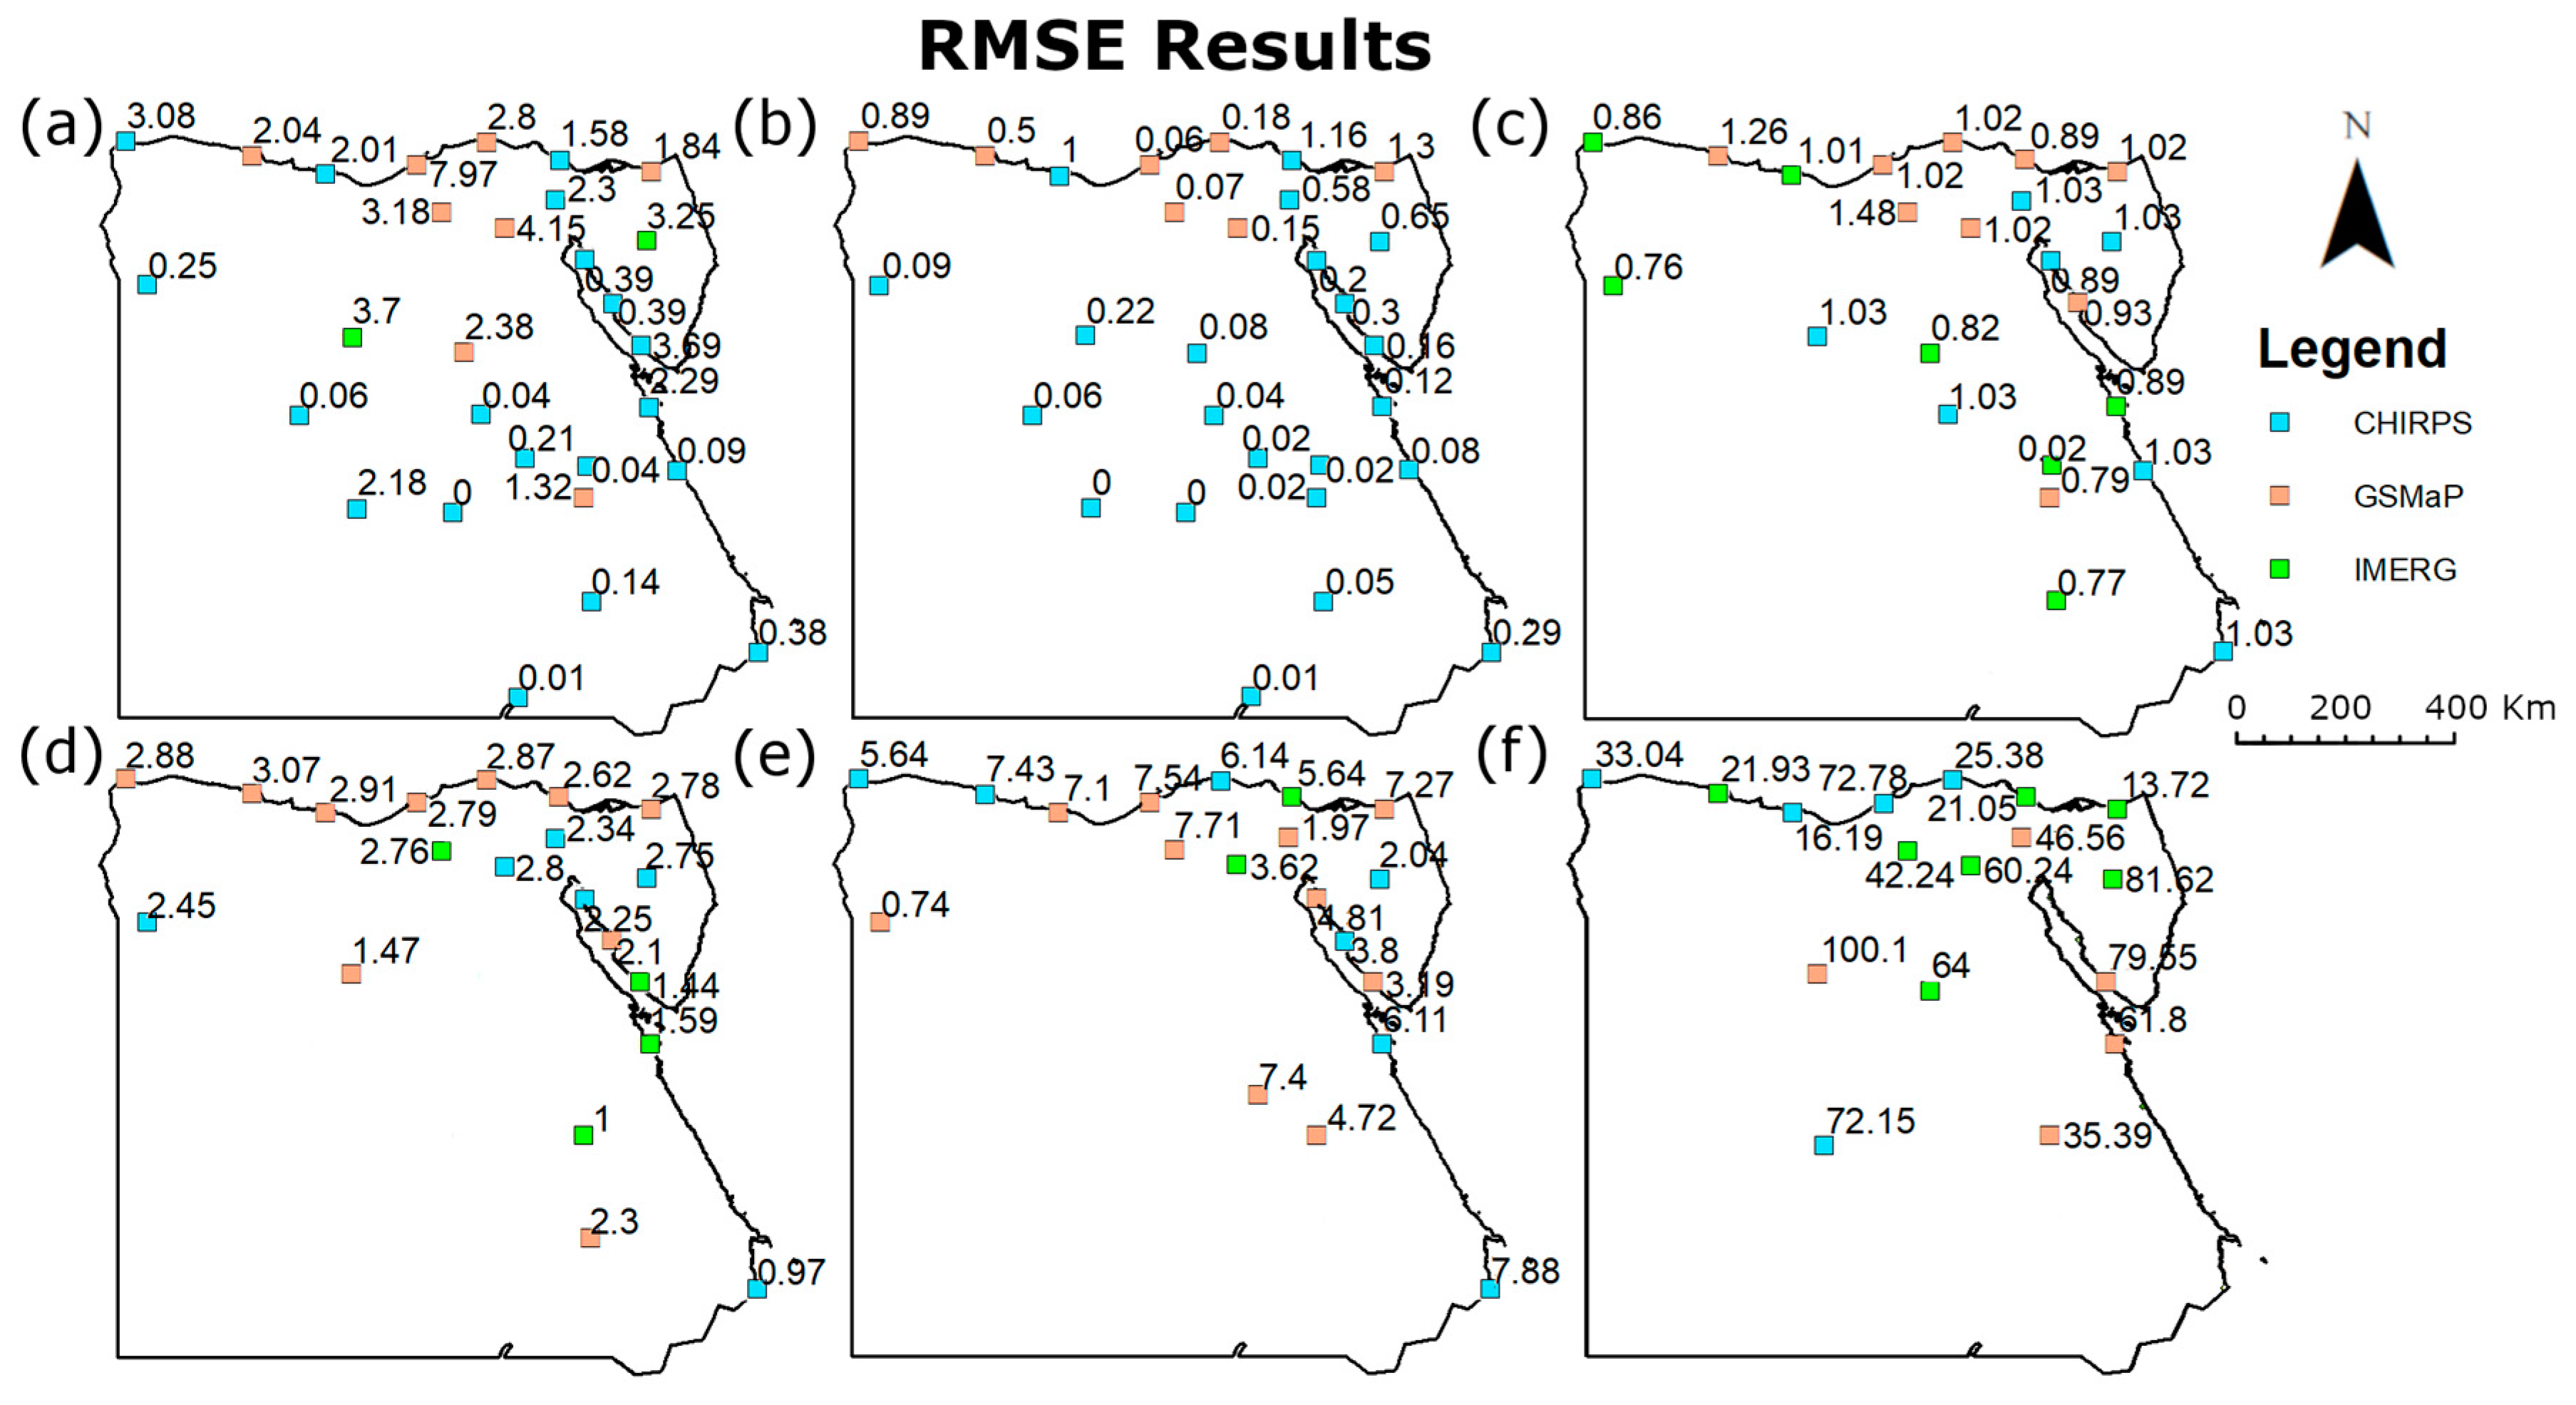
Figure 4 presents box plots of RMSE of the three products for all-events class and different rainfall intensity ranges listed in Table 6. The maps in Figure 5 show the best performing dataset at each station along with its RMSE value. The results showed CHIRPS was the best performing dataset at the majority of stations for all-event classes, with the lowest median of RMSE (2 mm/day). Although the medians of RMSE of GSMaP and IMERG were found very near to that of CHIRPS (as shown in Figure 4a), they showed a wider variability of RMSE and were found best only at eight and two stations, respectively, out of 29 stations (shown in Figure 5a). For the no/tiny rainfall class, CHIRPS was also found to be the best performing product in most of the stations with a median RMSE of 0.19 mm/day. It is worth noting that IMERG was not selected as the best product at any of the stations for this class. As shown in Figure 4c, GSMaP and CHIRPS shared the same median of RMSE (1.03 mm/day) for the light rain class, but the maximum and minimum RMSE of GSMaP were found less than CHIRPS. The GSMaP was selected as the best performing product at nine stations in estimating the amount of light rainfall, while CHIRPS and IMERG were found best at seven stations. For the low–moderate rain class, the median RMSE of CHIRPS (2.75 mm/day) was found a bit less than GSMaP (2.82 mm/day); however, GSMaP was found to be the best performing dataset in the majority of stations, particularly in the stations located along the Mediterranean shores. The IMERG had a relatively larger range of RMSE reaching up to 17.5 mm/day at the 623090 station. The GSMaP showed better performance than the others at ten stations (out of 19 stations having rainfall events in the range 5 mm ≤ P < 10 mm). The IMERG showed a large range of RMSE in estimating rainfall amounts of high–moderate rainfall class like the other rainfall classes. All three products showed a relatively bad performance in terms of RMSE (Figure 4f) for the heavy rainfall class with a median of around 51 mm/day. Nevertheless, IMERG outperformed CHIRPS and GSMaP at 7 out of 17 stations with a lower RMSE. All in all, CHIRPS was found as the best satellite-based rainfall product in estimating rainfall amounts when the whole series was compared together (i.e., all-events class). The IMERG was found as the best in estimating rainfall amount for the heavy rain class and GSMaP as the best for the remaining rainfall intensity classes.
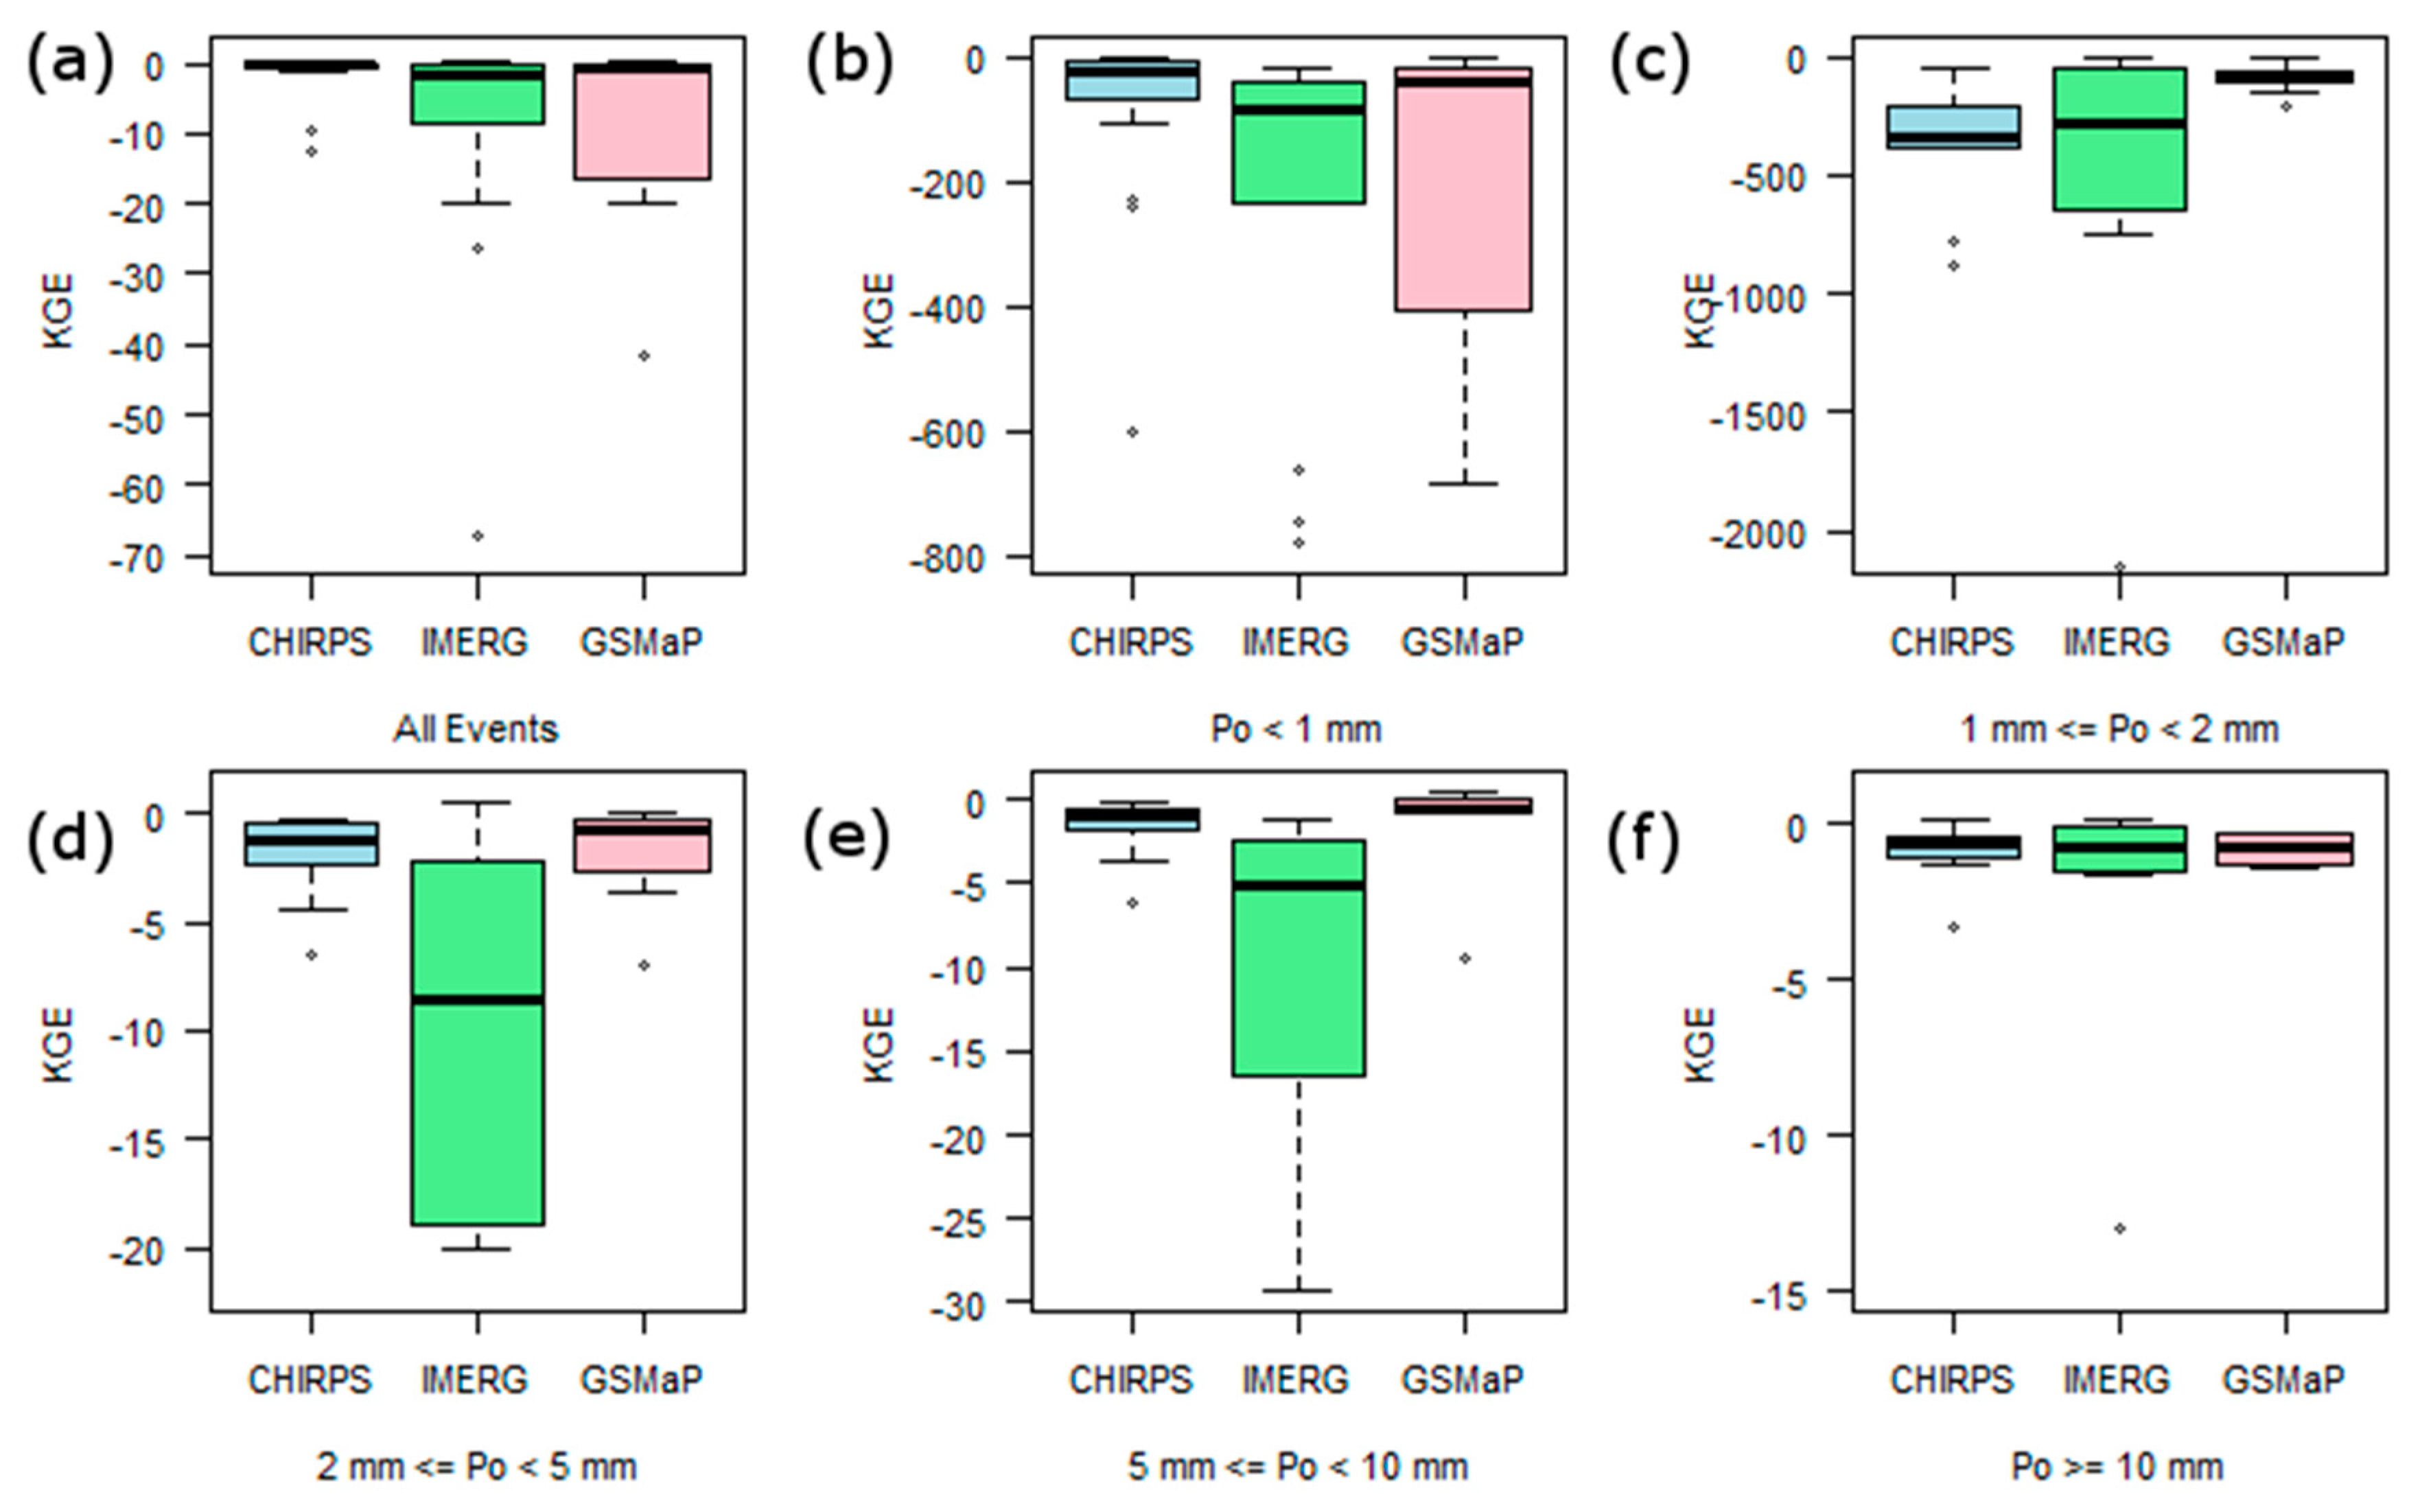
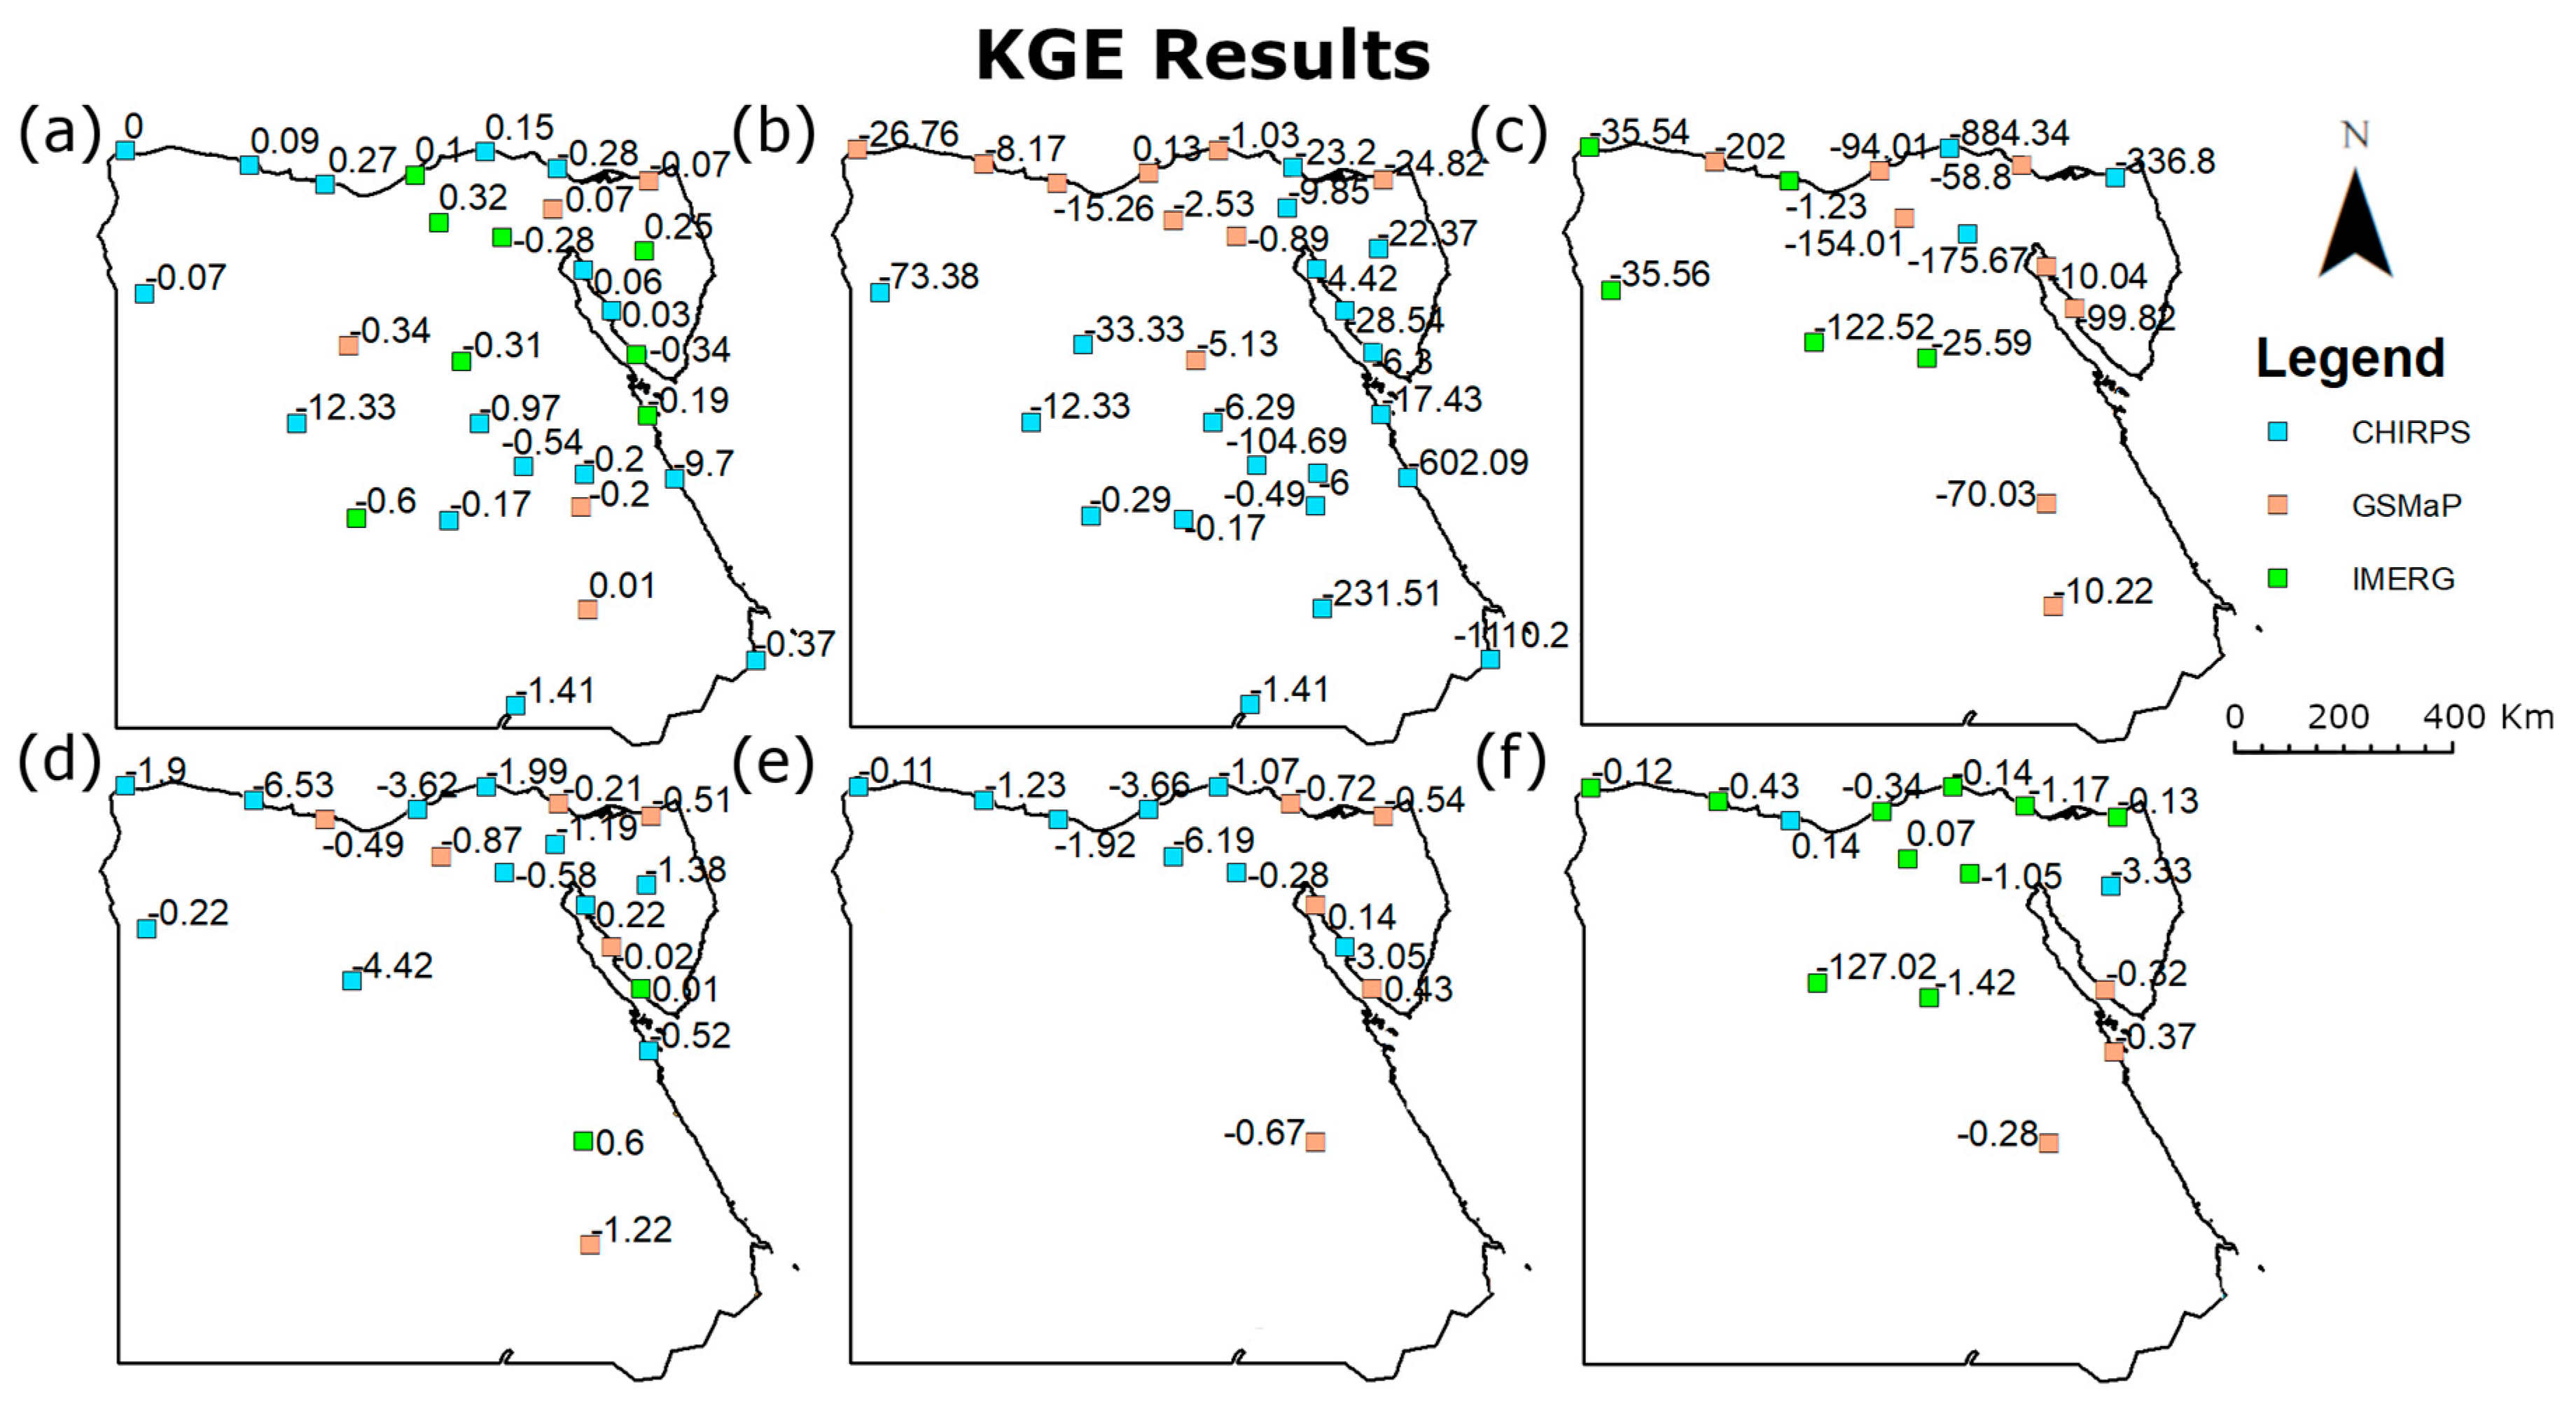
The KGE is a robust index that integrates variability, correlation, and bias into a single index. Figure 6 shows the box plots of KGE of the three satellite rainfall products in estimating rainfall amounts for the all-events class and different rainfall intensity classes. The estimated KGEs for the best performing rainfall products at each station are shown in the maps (Figure 7). For the all-events class, the CHIRPS was found as the best performing satellite-based rainfall product at 16 stations distributed over Egypt with a median KGE equal to 0.59. Although the KGE for GSMaP showed the highest upper range compared to other products, with a median of 0.4, it was found as the best product at 5 stations out of 29. For the no/tiny rain class, CHIRPS and GSMaP shared the same KGE median (0.2), but GSMaP showed a higher spread of KGE in the upper range. Consequently, CHIRPS was found best at 20 out of 29 stations and GSMaP at nine stations. The IMERG was found as the worst for this class. The CHIRPS and IMERG performed badly for the light rain class with a high median of KGE (−336 and −283, respectively). On the other hand, GSMaP showed less KGE, and therefore, was found as the best product at 8 stations out of 16. Similar results were found for the low– and high–moderate rainfall classes, where GSMaP performed better compared to others in most of the stations, with a median KGE of around −0.65. Although the three datasets shared nearly the same median KGE for the heavy rainfall class, IMERG outperformed others at two-thirds of the stations. Overall, according to KGE, GSMaP was found best for rainfall intensity between 1 mm/day to 10 mm/day while IMERG for rainfall intensity more than or equal to 10 mm/day and CHIRPS in all-events class.
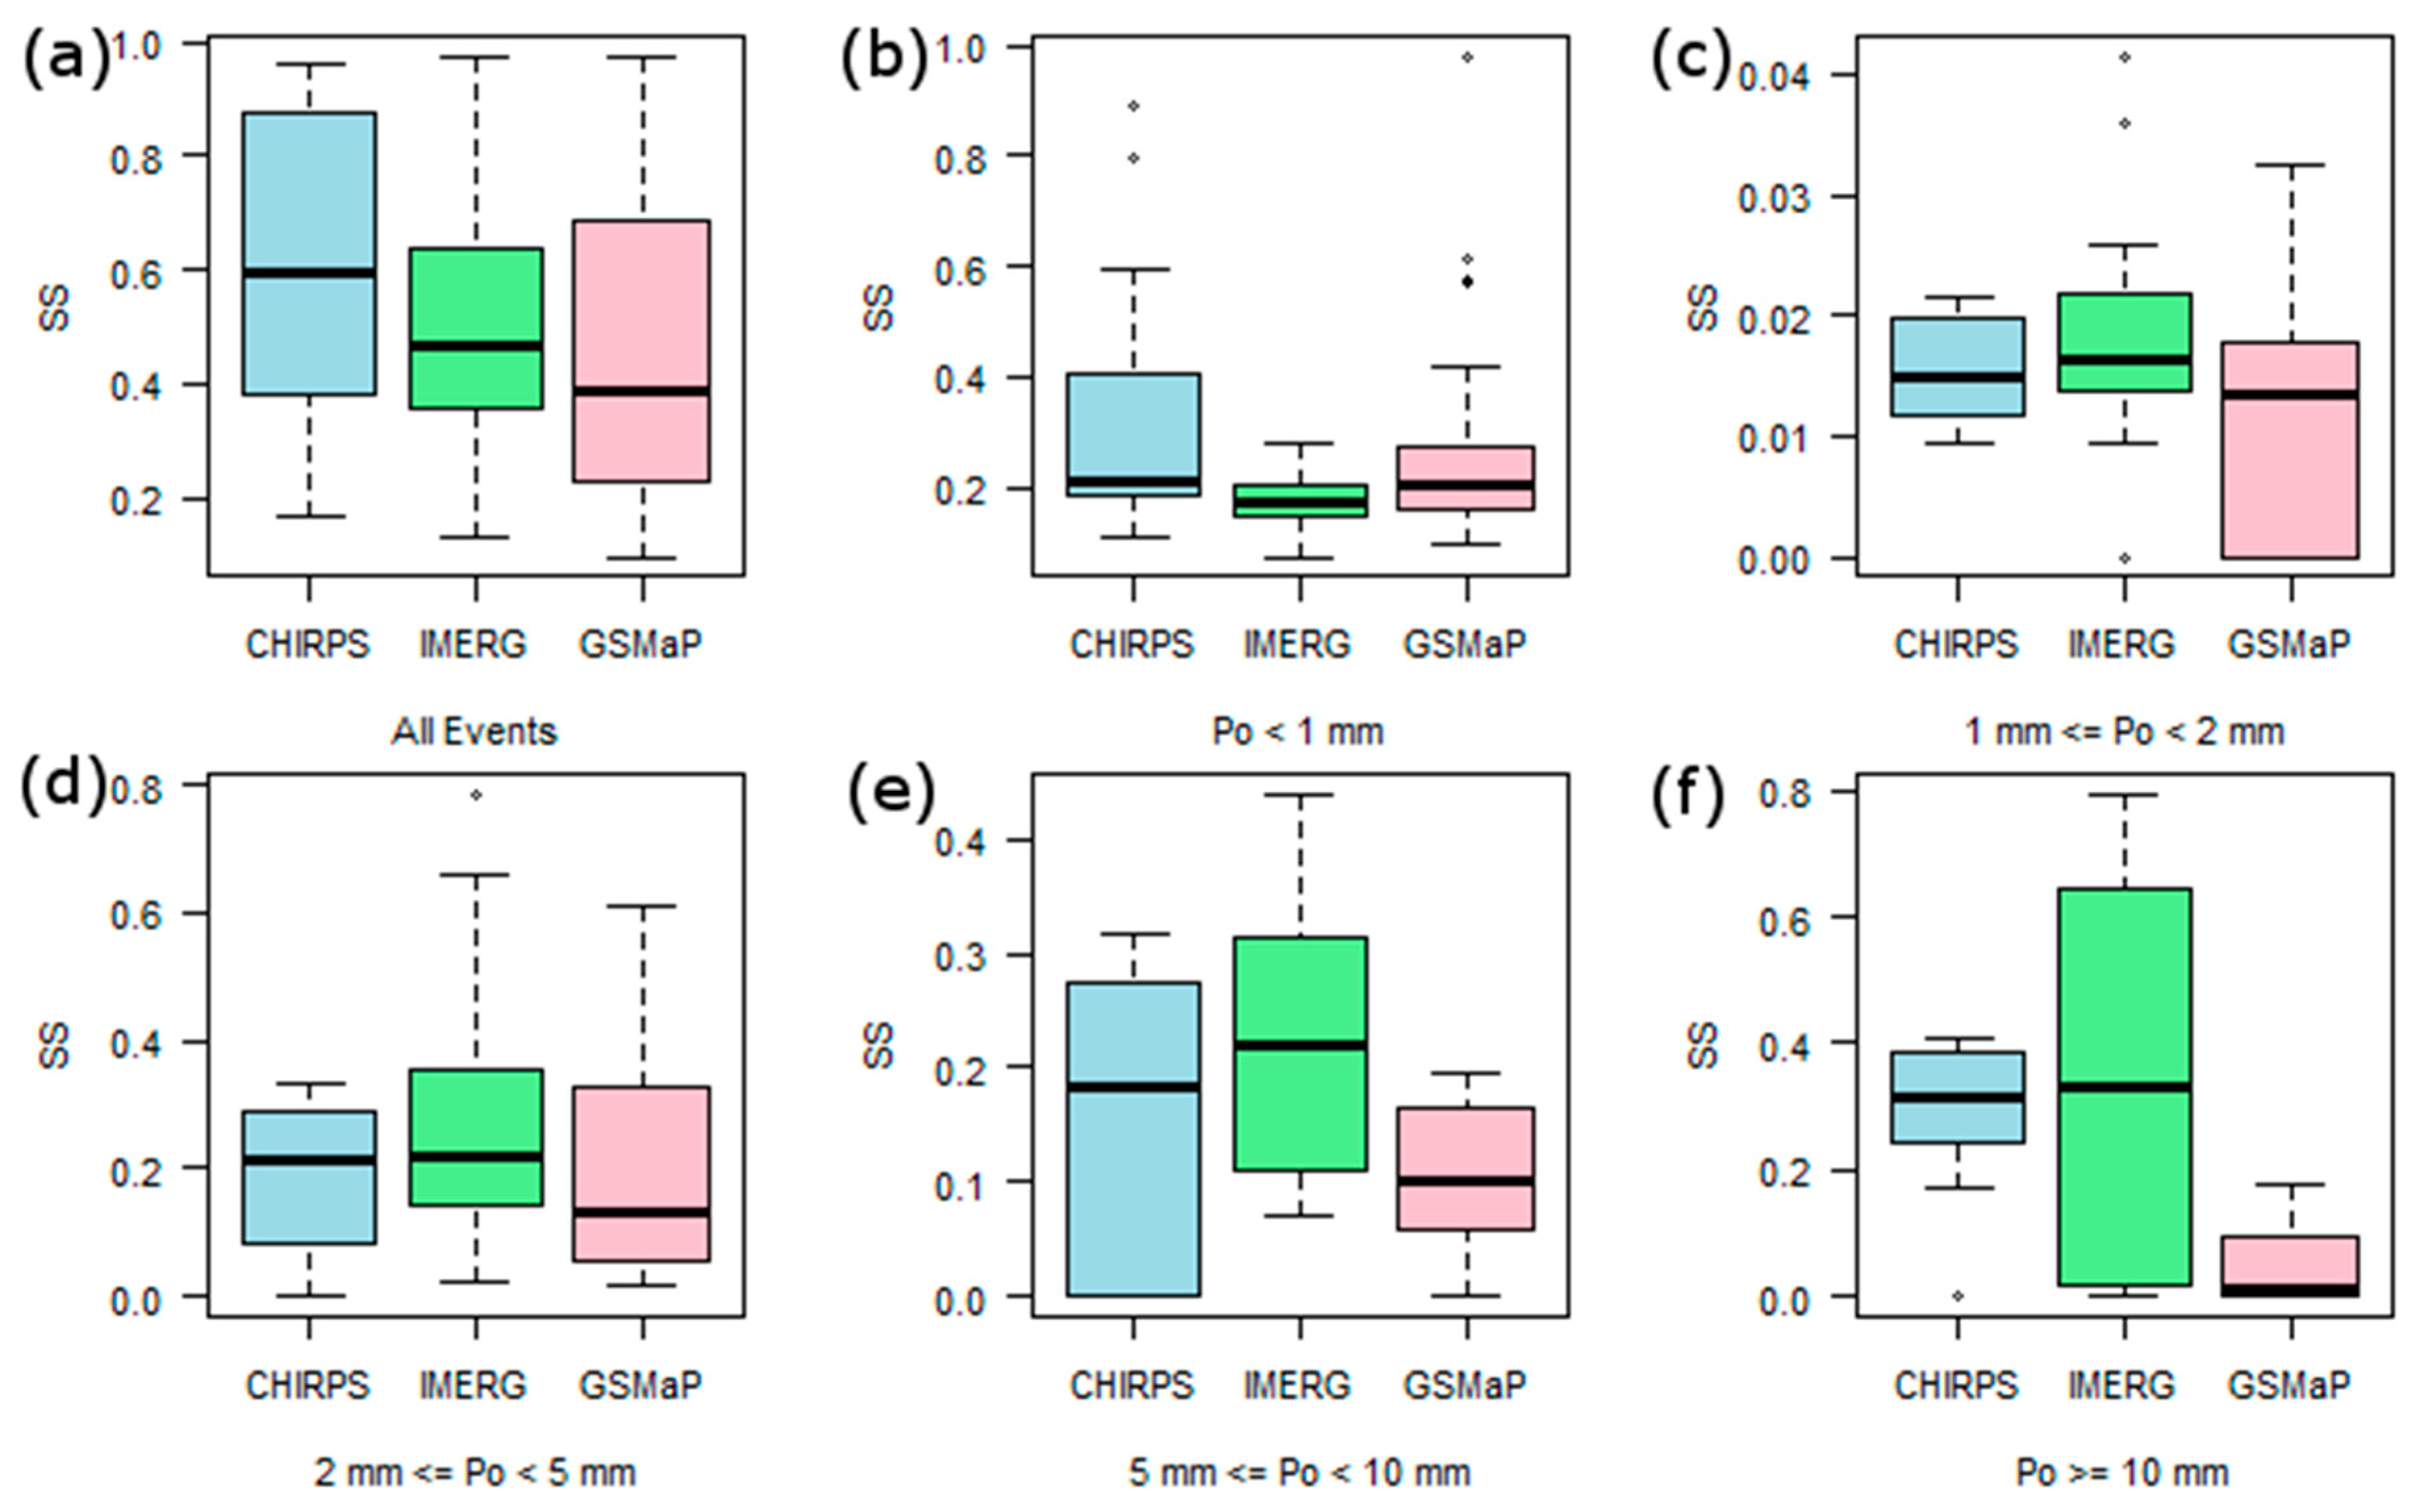
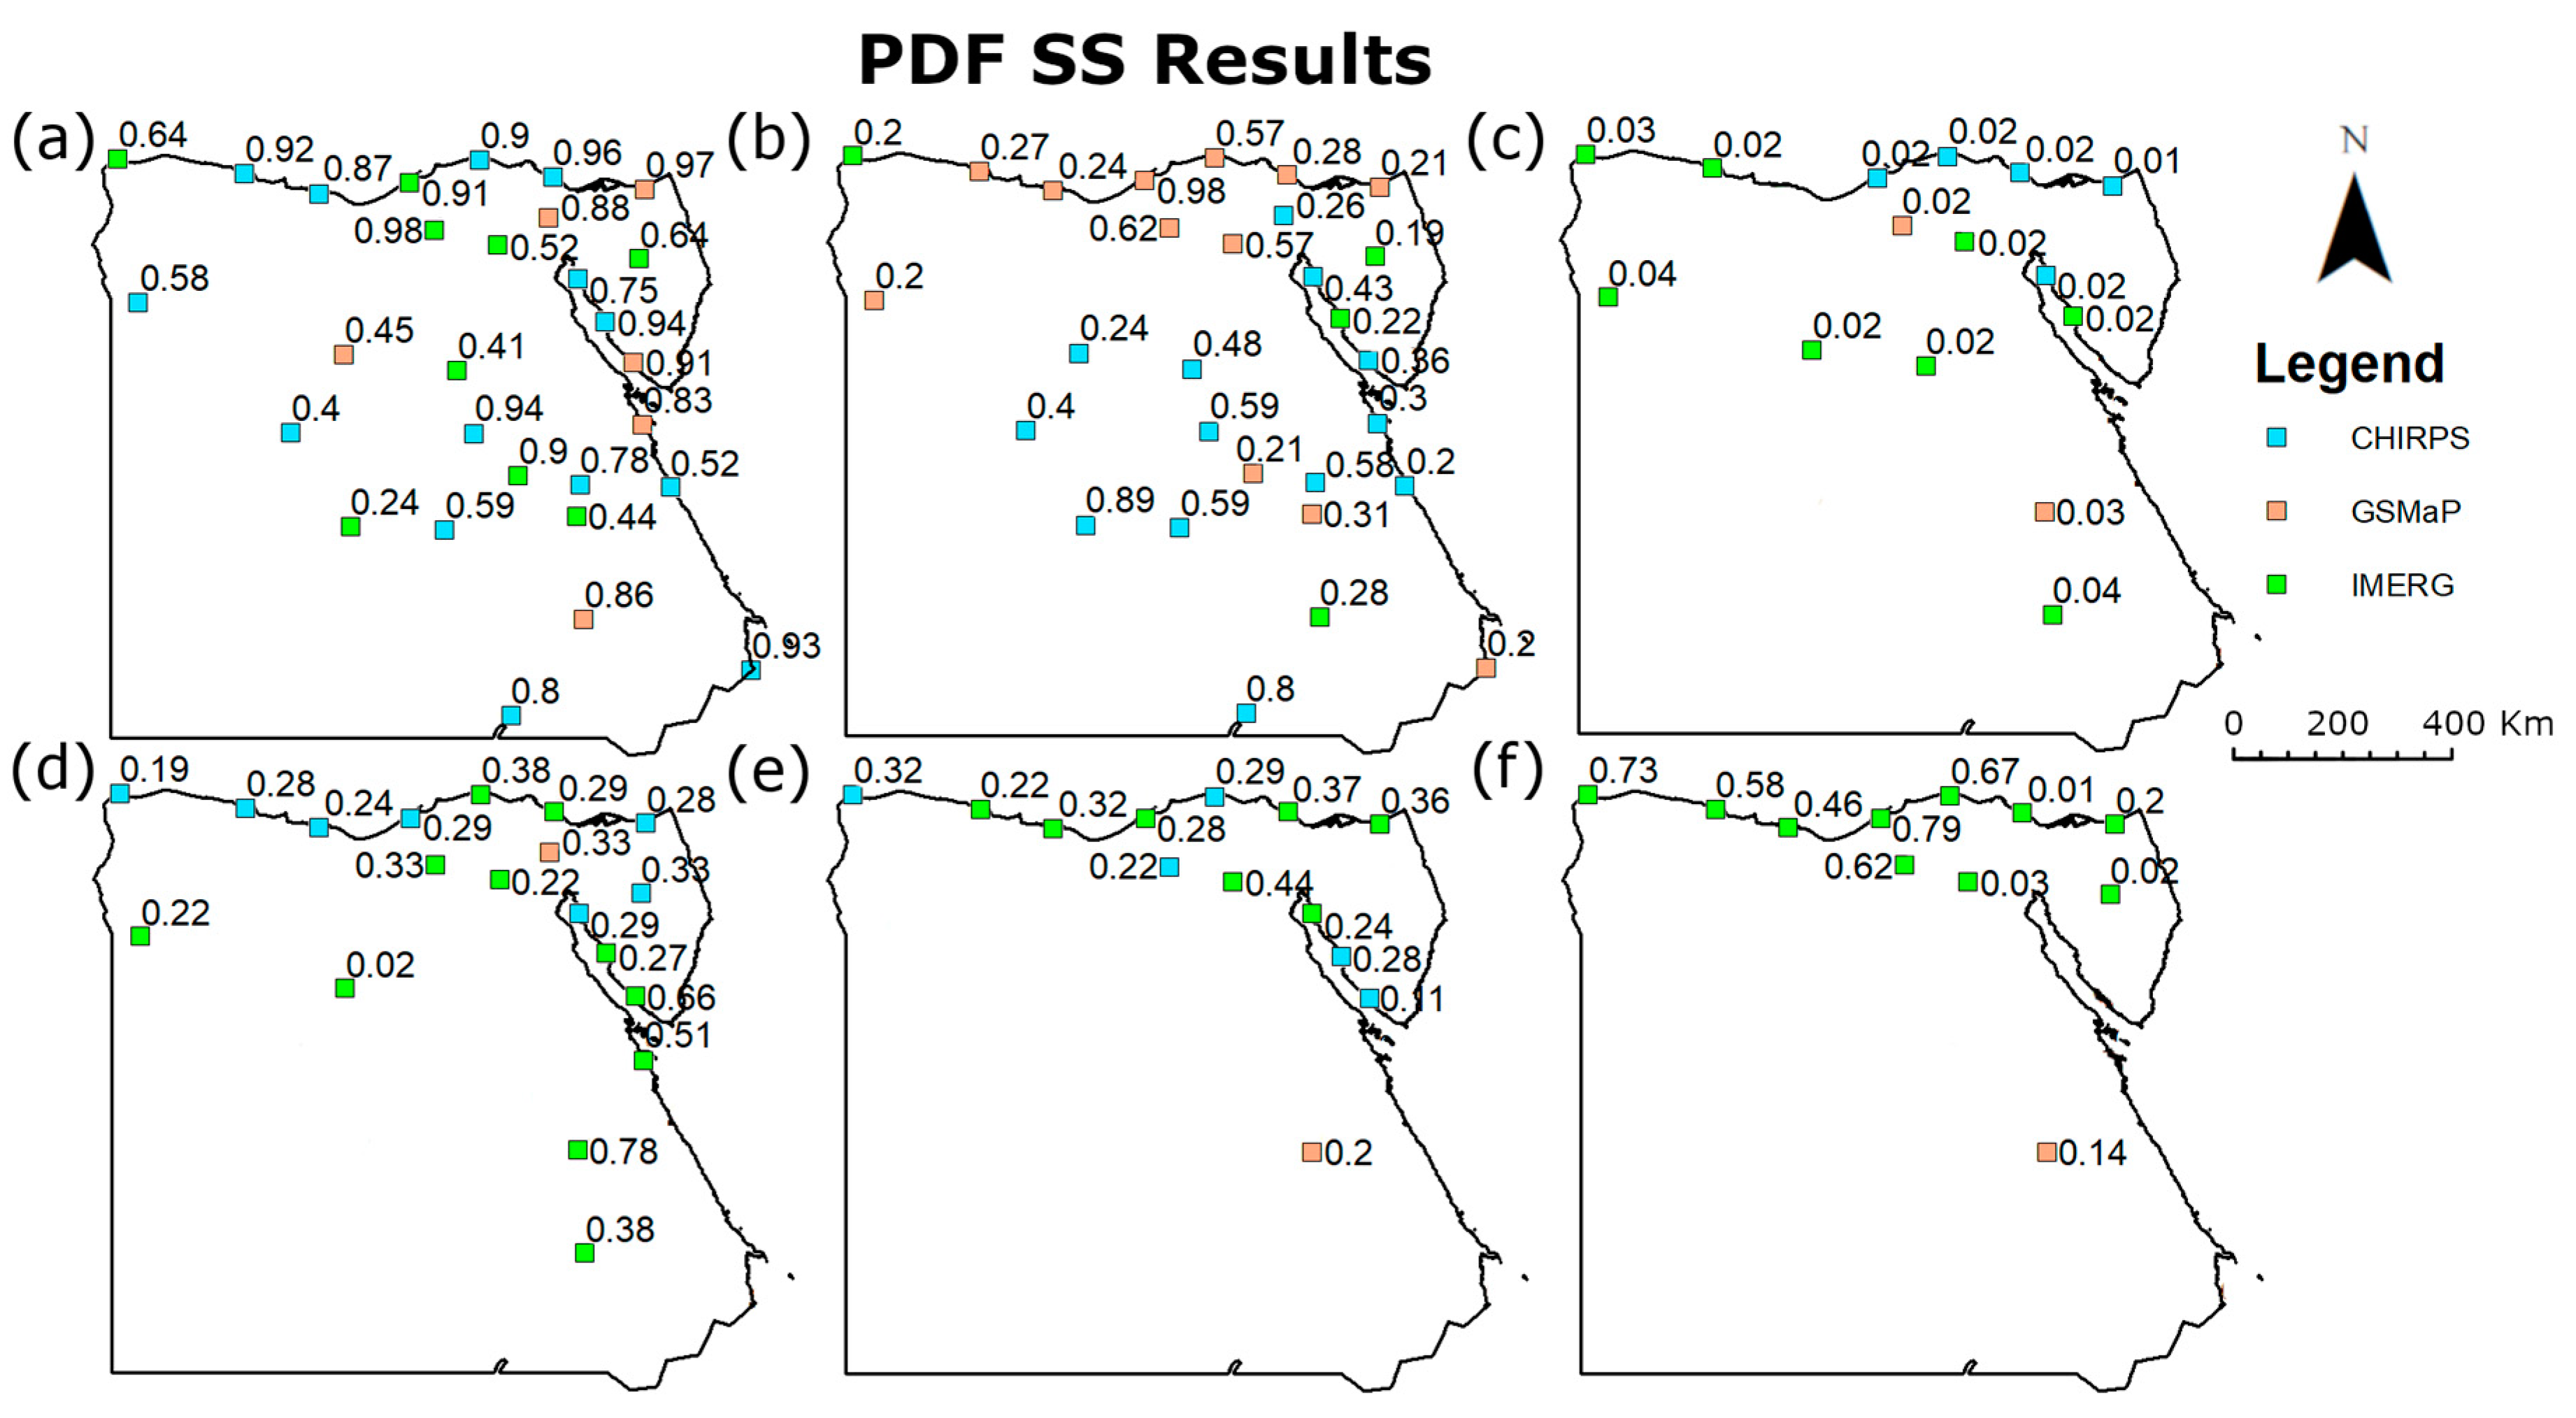
Figure 8 shows box plots of the PDF SS of the three products for different rainfall intensity classes and Figure 9 presents the spatial distribution of the best performing product in terms of SS. For all-events class, CHIRPS was found as the best product at 14 stations with a median SS of 0.6. For no/tiny rainfall class, CHIRPS and GSMaP were found best at 13 and 12 stations, respectively. The GSMaP was found to dominate in the wetter north and the CHIRPS in the drier south. For the light rainfall class, IMERG outperformed others even though all the three products performed unsatisfactorily with a median SS of around 0.015. For the moderate and heavy rainfall classes, IMERG performed better than the others at the majority of the stations with a median SS of 0.22, 0.22, and 0.33 for the low–moderate, high–moderate, and heavy rainfall class, respectively.
5.2. Validation Based on Occurrences of Rainfall
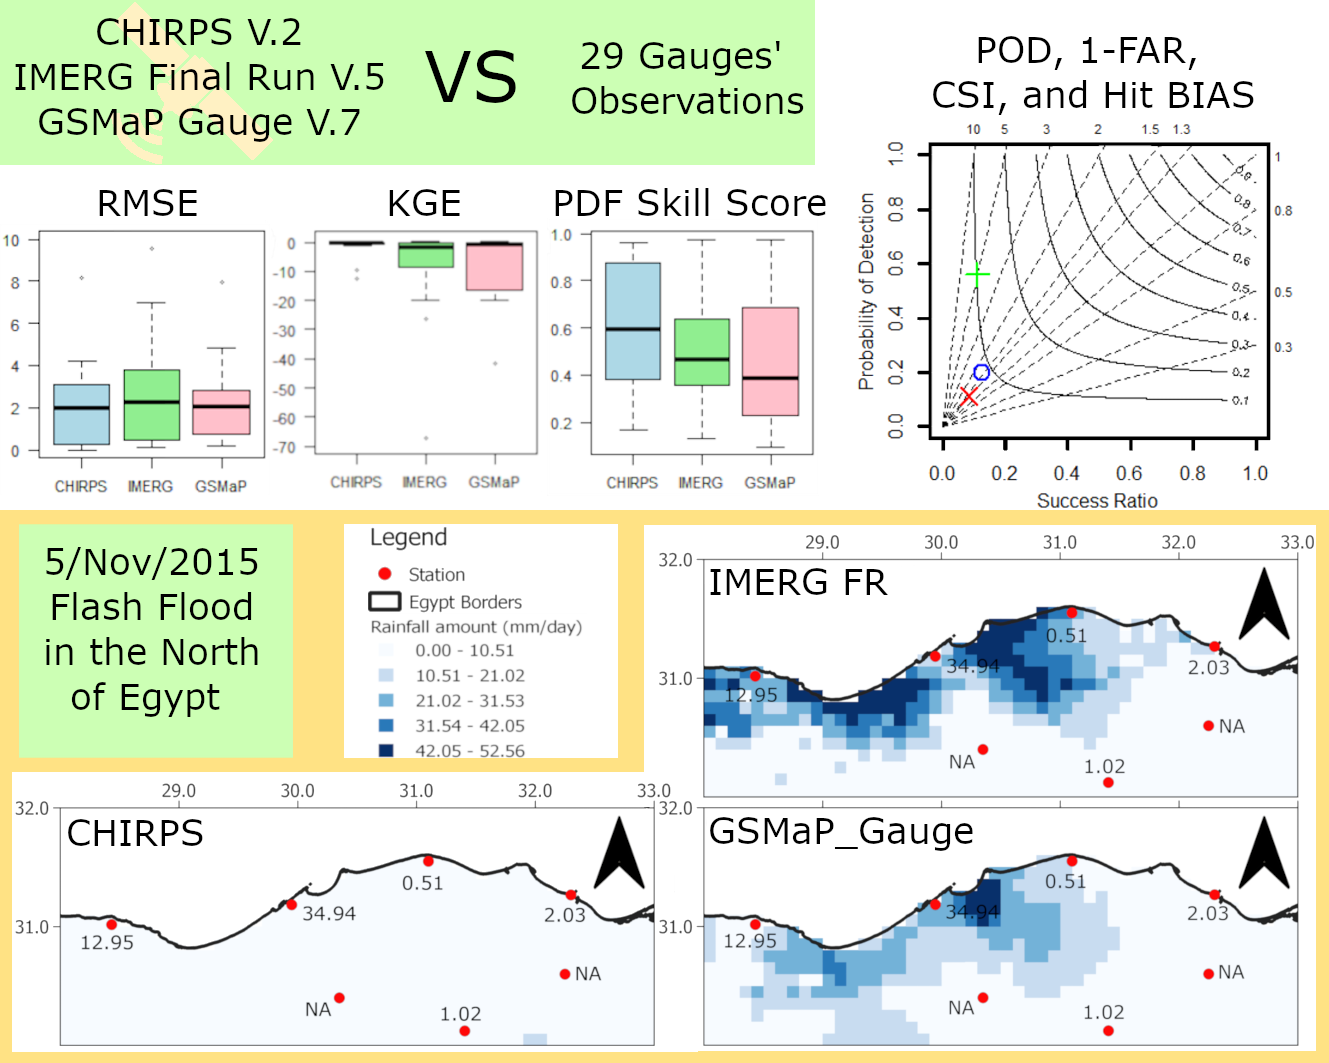
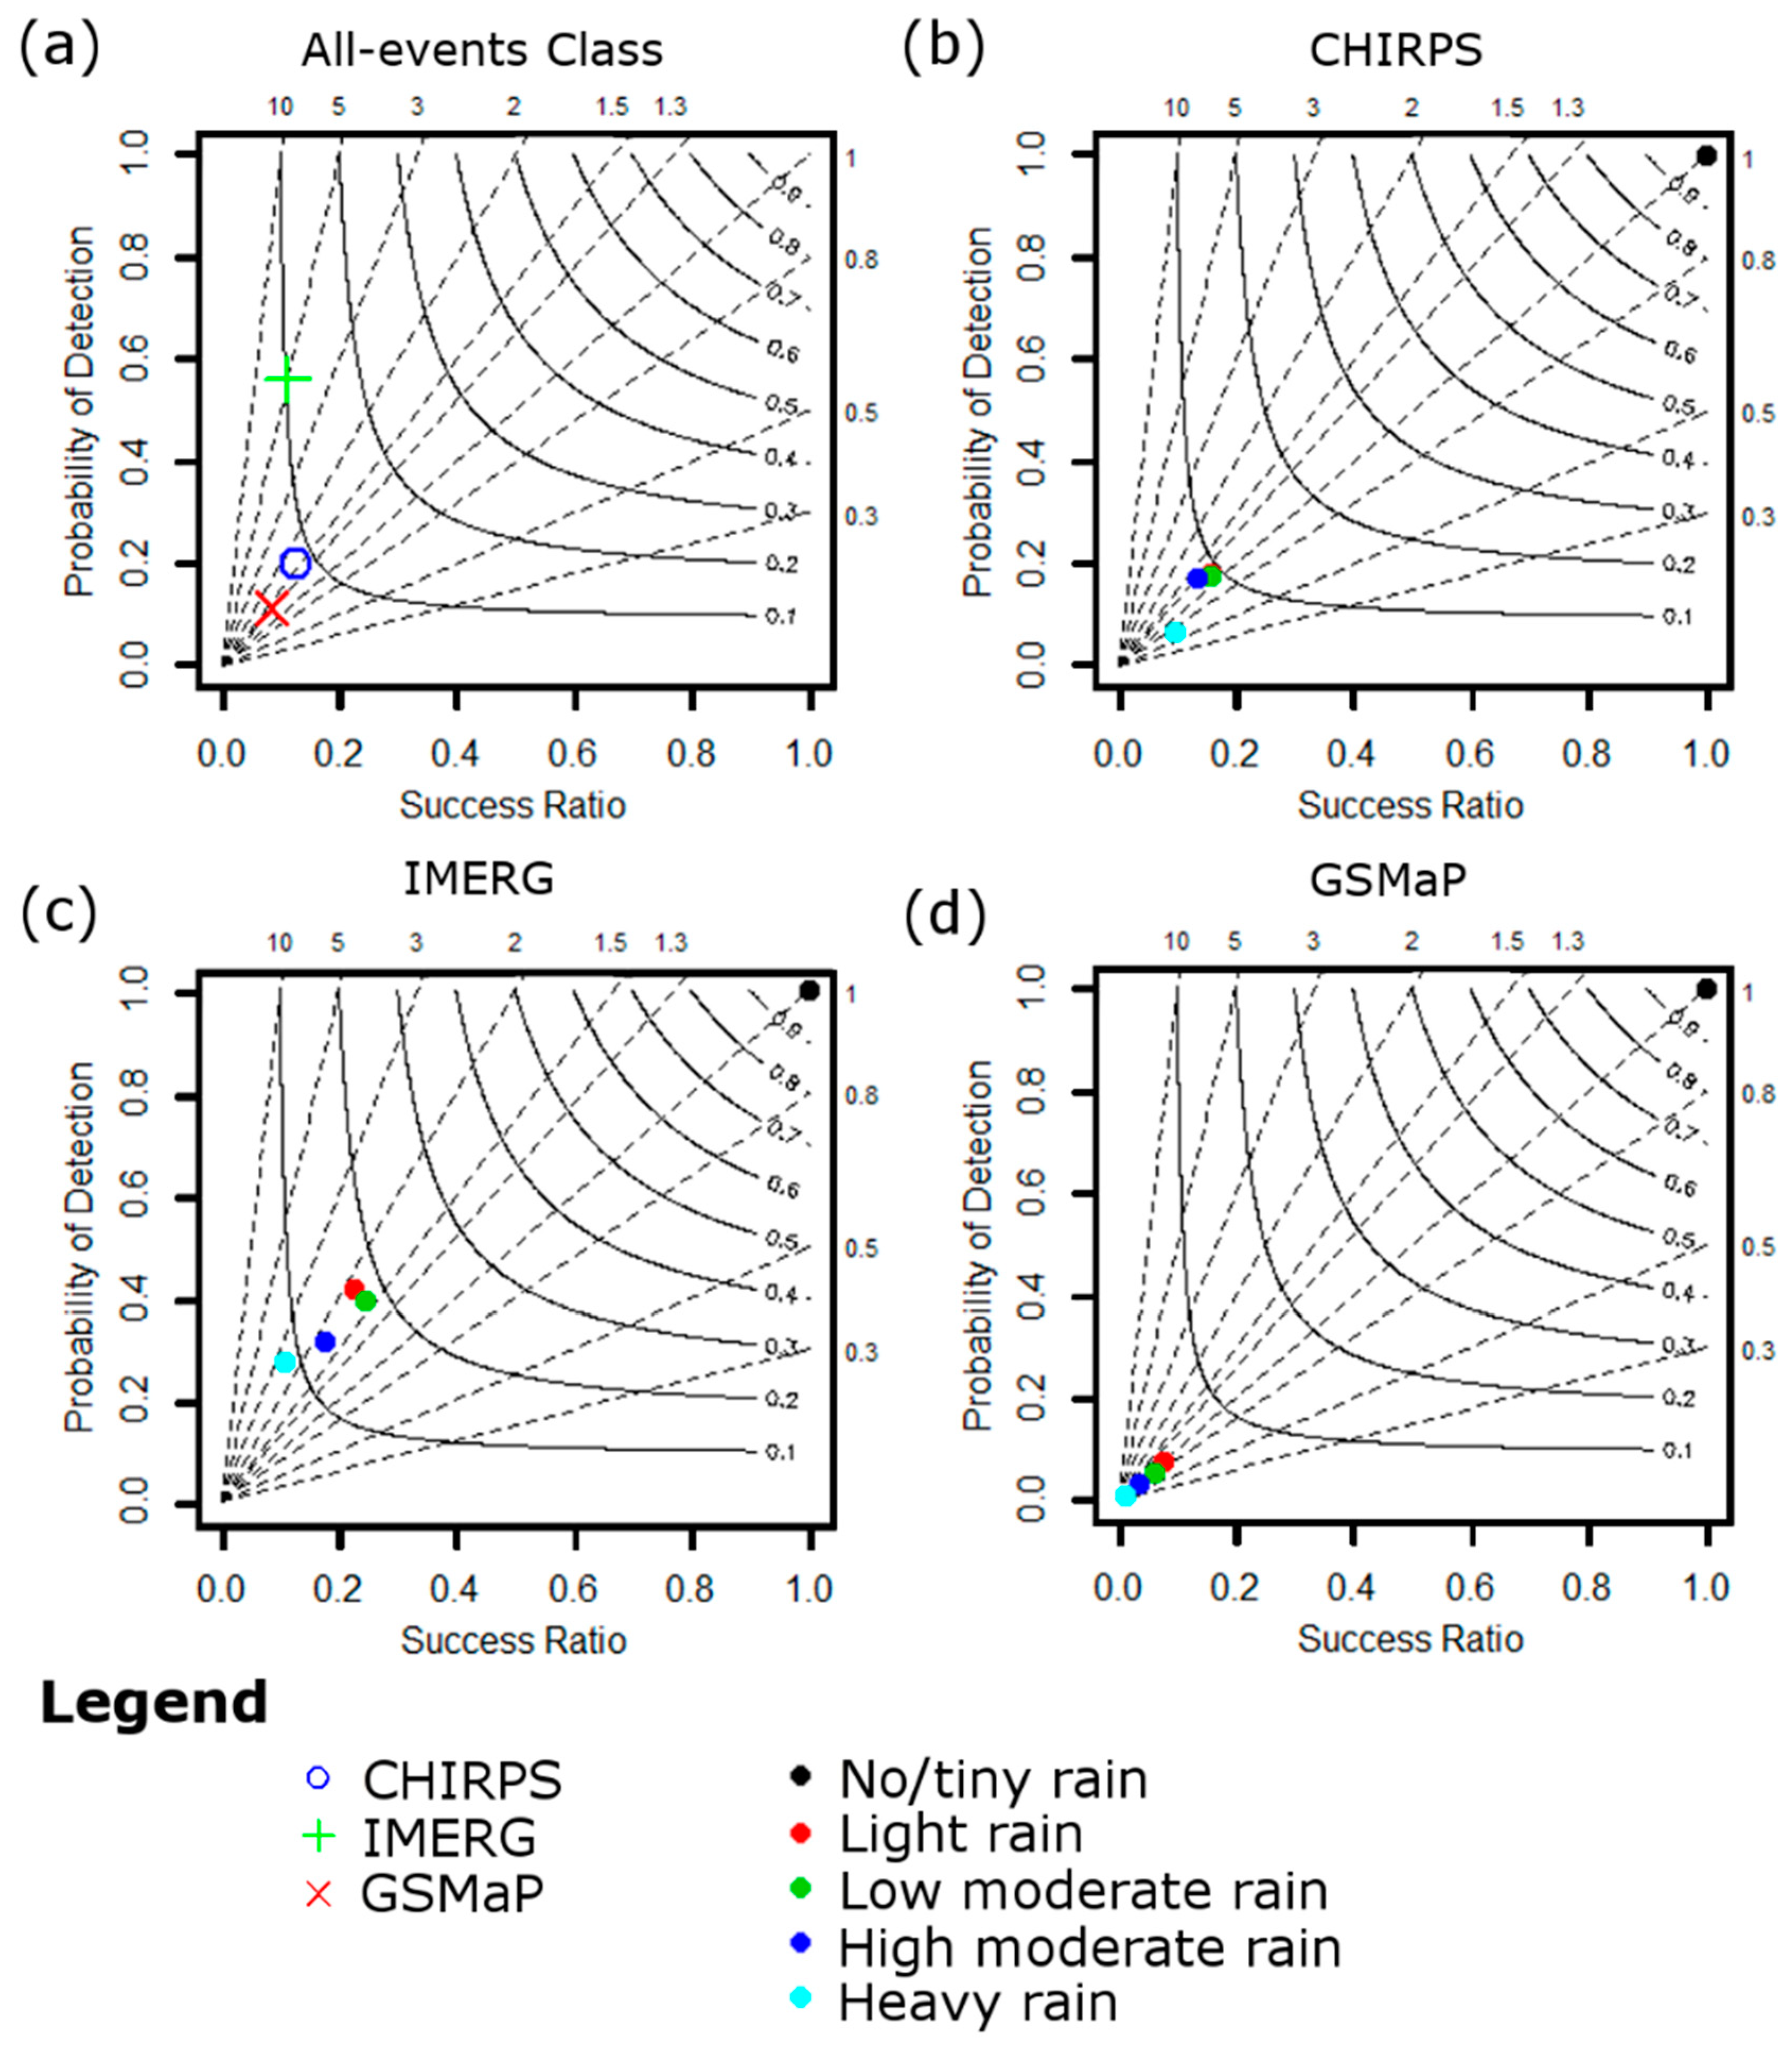
Figure 10 shows a performance chart which integrates the results of the four categorical indices in a compact and efficient representation. The x-axis of the performance chart represents the success ratio (1-FAR), the y-axis represents the POD, the diagonal dashed lines represent the BIAS, and the curved lines represent the CSI. The optimal values are located in the top-right corner of the chart, while the worst values are in the bottom-left. As shown in Figure 10a, IMERG showed the highest POD (0.6), CSI (0.1), and BIAS (5) for all-events class, while GSMaP showed the lowest values of the statistics. The CHIRPS and IMERG showed the same FAR of 0.88 while GSMaP showed the highest FAR and the lowest SS (0.08) compared to others. The performance of CHIRPS, IMERG, and GSMaP for different rainfall intensity ranges is shown in Figure 10b–d. All the products showed near-optimal results in detecting no/tiny rainfall. However, the IMERG rainfall retrievals were found better than the others in term of all the four categorical indices for all the rainfall intensity ranges. The GSMaP was found to be the worst in detecting rainfall events for different intensity ranges.
6. Discussion
Accurate estimation of rainfall is crucial for various hydrological and climate change studies in a poorly gauged country like Egypt. The performance of three remote sensing-based rainfall products having high spatial and temporal resolutions namely CHIRPS, IMERG FR, and GSMaP_Gauge were assessed in this study. Although all of them are gauge-corrected, no single product showed a consistent performance, and thus cannot be entitled as the best/worst performing product in Egypt. The CHIRPS showed the lowest RMSE and the highest KGE and SS, but a high FAR and a low POD and CSI when the whole rainfall series was compared (all-events class). The GSMaP showed a better RMSE and KGE than the others for rainfall having an intensity range between 1 and 10 mm/day, but it showed a poor performance in term of SS and all the four categorical indices. The IMERG was found as the best product in most of the stations in term of SS and KGE for P ≥ 10 mm/day, but it showed a very high RMSE and overestimation of the occurrence of rainfall (low success ratio). It could not detect 72% of heavy rainfall events.
One of the major drawbacks of satellite-based rainfall products over the hot desert climate, as in Egypt, is the overestimation of rainfall occurrence which was also observed in the present study. Many possible factors such as sub-cloud evaporation could be the reason for this poor performance. As the lower layers of the atmosphere are hotter and drier compared to the upper layer atmosphere over Egypt [34], the raindrops may evaporate while passing a thick, hot, dry layer before it could be captured by a rain gauge, although it was detected as a rainfall by satellites [51]. This results in a false alarm of rainfall due to sub-cloud evaporation. Furthermore, satellites may fail to differentiate the desert surface and rainfall footprint leading to a surface misclassification as reported by Wang et al. [52] and Seto et al. [53] in the Sahara Desert, which covers most of Egypt’s west and south. This surface misclassification also leads to high FAR. On the other hand, as the satellite pixels are an average of what is captured by the sensor, the averaging may lead to misdetection of rainfall (low POD) when some parts of the pixel are hot surfaces and the others are rainfall surface [34]. This is also a problem in the cold regions where surfaces are covered by snow [6]. The usage of the multi-rainfall intensity thresholds with the contingency table diagnosed that the three satellite rainfall products were not able to detect rainfall in their exact intensity class, but they detected the rainfall amount either with overestimation or underestimation.
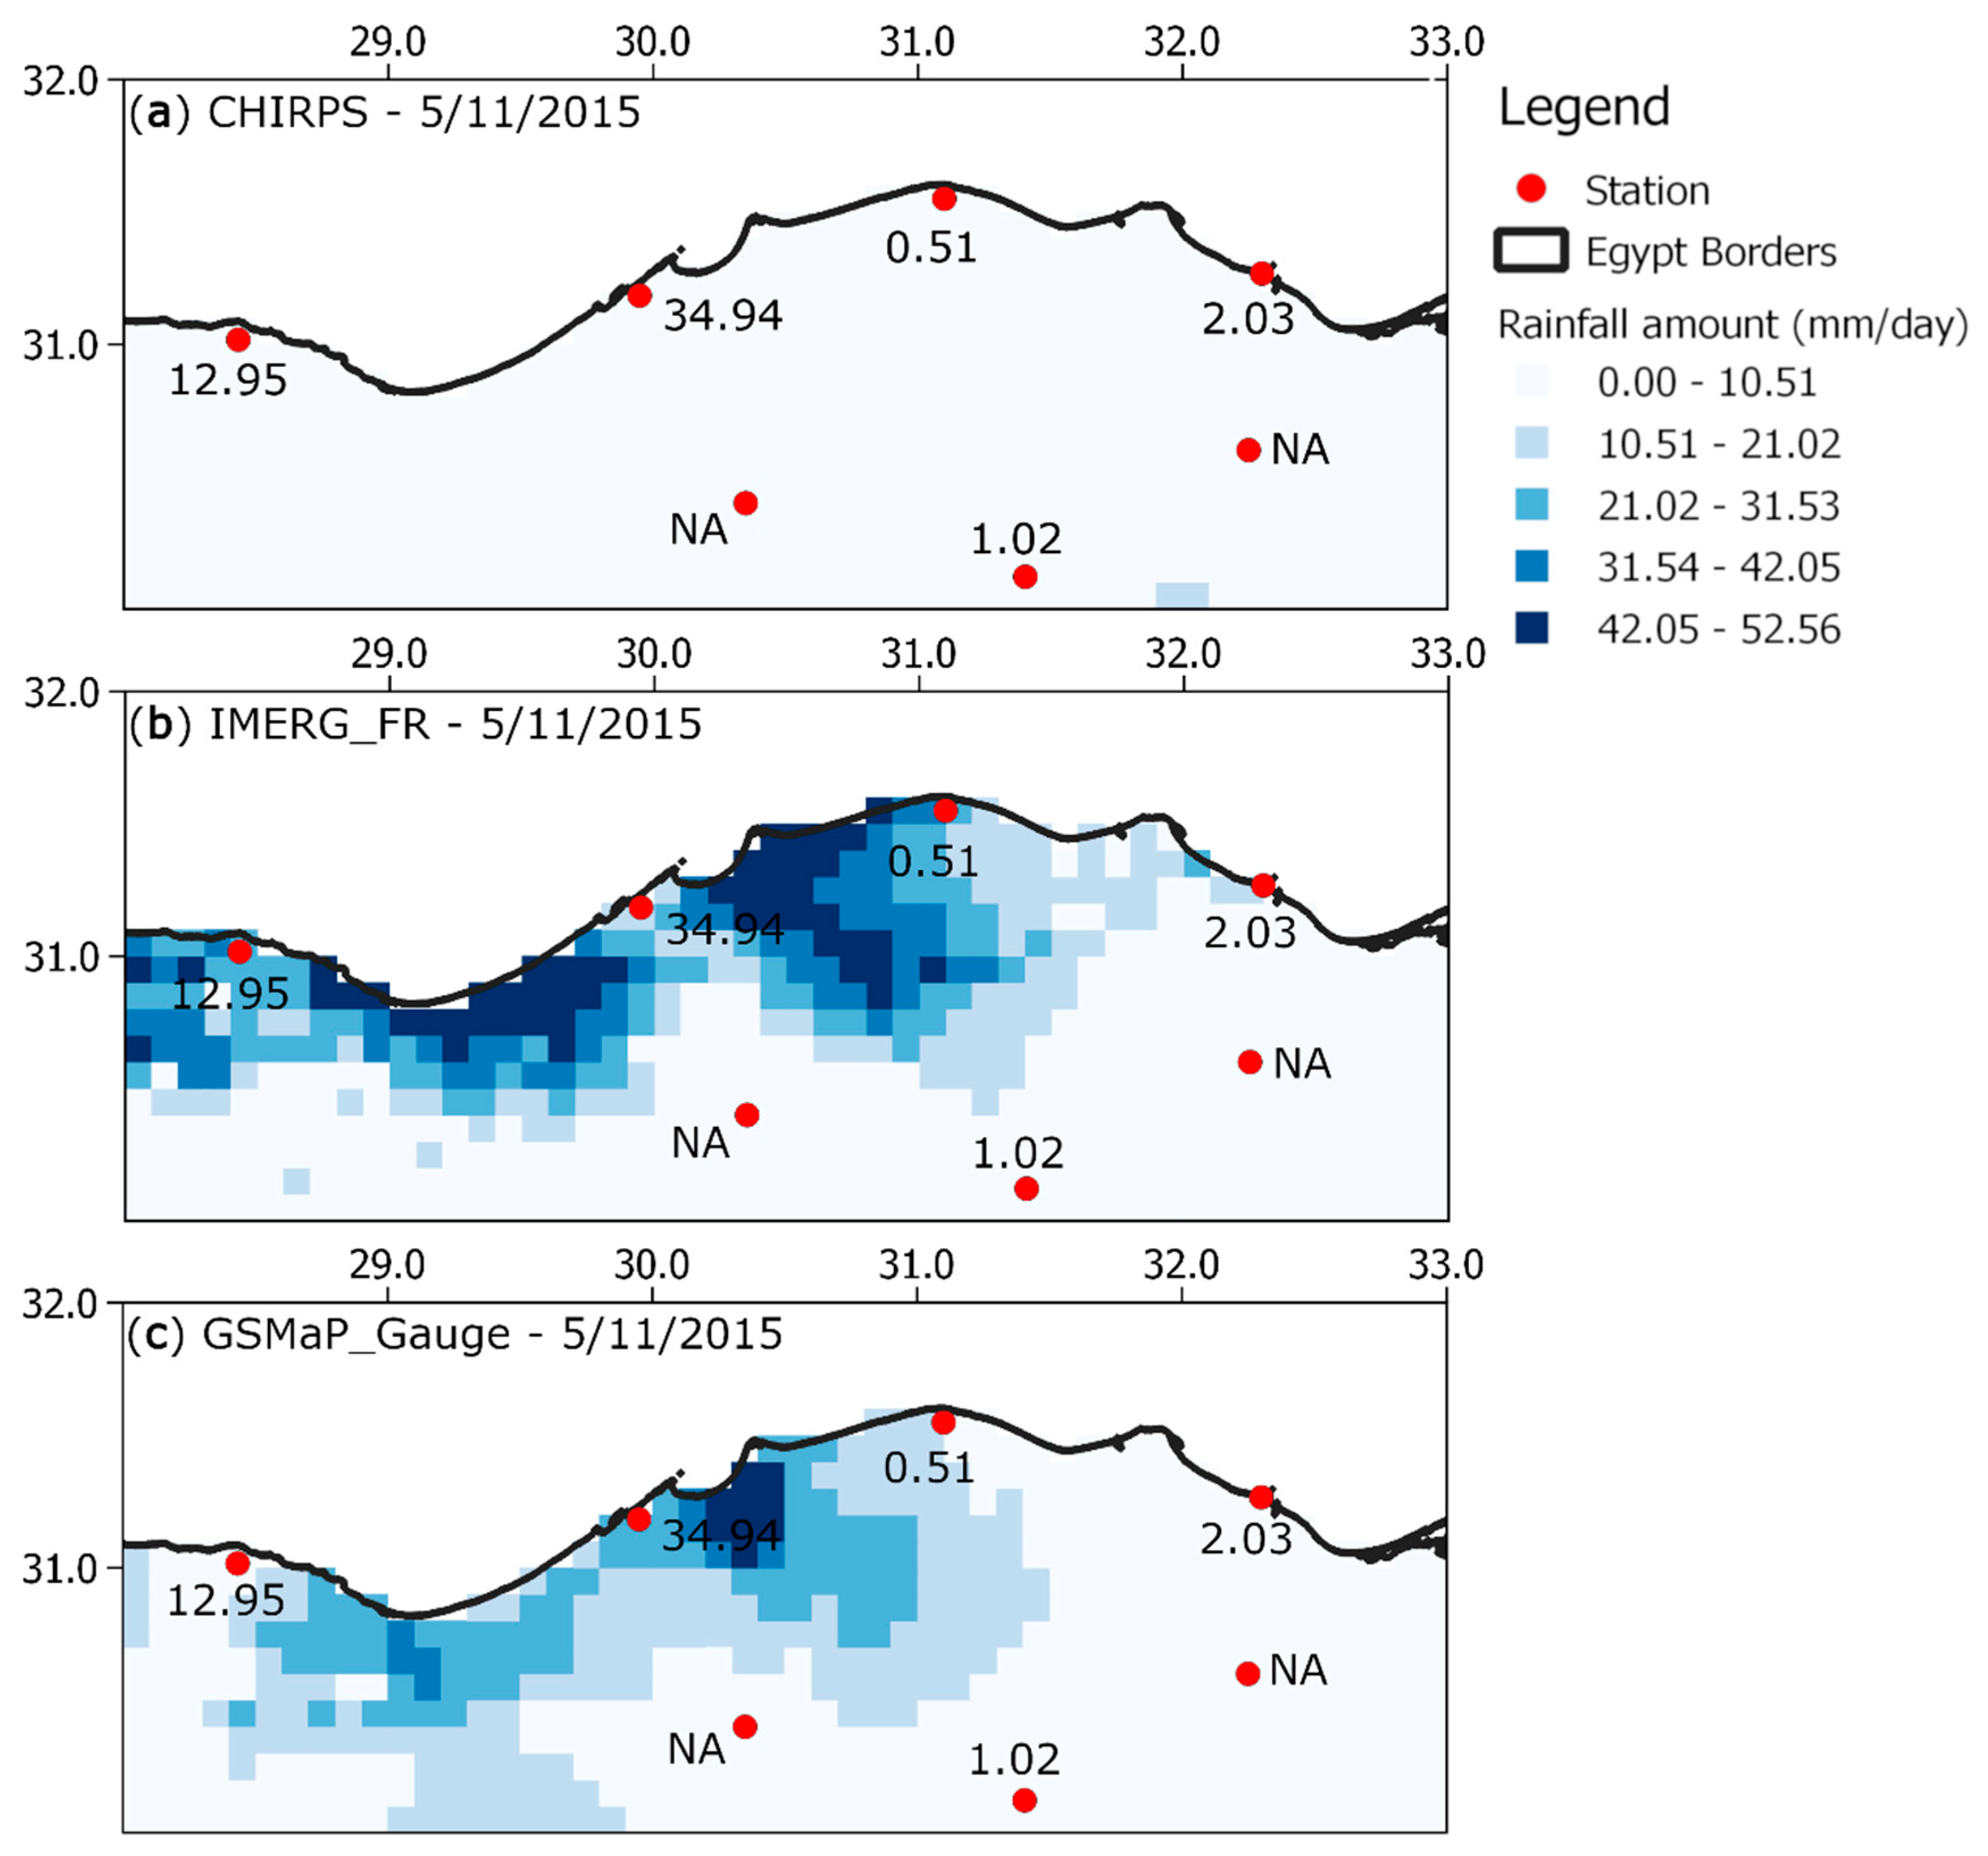
As there is no high-resolution (e.g., 0.1°) gridded gauge-based rainfall dataset available covering Egypt or a dense gauge network that can be used as a reference, it was not possible to assess the spatial variability of rainfall retrievals by each satellite-based product. We tried to compare the spatial variability of rainfall showed by the satellite rainfall products during the highest flash flood (in terms of casualties and damage) that hit the north of Egypt on 5 November 2015. Heavy rainfall on that day was the cause of that flash food. Therefore, our intention was to examine whether the products were able to show this intense rainfall event that caused that flash flood. Figure 11 shows the spatial distribution of rainfall by the products on the same day along with the available gauge observations. Surprisingly, CHIRPS completely missed this flash flood. The IMERG and GSMaP captured the spatial distribution in a similar way, while GSMaP showed rainfall estimates more accurately than IMERG when compared to observations. This indicates that satellite-based rainfall estimates should be compared and checked before addressing rainfall-driven flash flood events.
As this study is the first attempt to assess the performance of IMERG_FR 5, GSMaP_Gauge 7, and CHIRPS 2 rainfall over Egypt, it is not possible to compare the finding of this study with previous ones. However, the results of this study are found to be consistent with that obtained in the surrounding countries of Egypt. To the north and northwest of Egypt, IMERG could not estimate accurate rainfall amounts and occurrence which was reported in the coast of Mediterranean in Sardinia and Sicily (Italy) [18], Greece [36], and Cyprus [37]. To the south of Egypt, CHIRPS showed a high RMSE (up to 50 mm/day) which was also reported in South Sudan [35]. The IMERG had a high bias in the dry northeast like that which was found in the middle of Saudi Arabia [33]. To the west of Egypt, GSMaP showed a low POD which was supported by the results obtained in the Sahara Desert [34]. Furthermore, the findings of this study matched with corresponding studies in other arid regions globally. Along the arid coastal Peruvian coastline, IMERG was found to overestimate rainfall amounts with high FAR [32]. The IMERG had a poor performance in the Weihe River Basin in China [54] and Pakistan [4]. The GSMaP was found to be better than IMERG in estimating daily rainfall in Xinjiang, China [55]. The GSMaP_Gauge showed a high bias in arid/semi-arid Central Asia [56].
7. Conclusions
This study is the first attempt to assess the performance of satellite-based IMERG_FR 5, GSMaP_Gauge 7, and CHIRPS 2 rainfall products over the hot desert climate of Egypt. Seven statistical indices including four categorical indices were used to evaluate the performance of the three satellite-based rainfall products in detecting the occurrences of daily rainfall and estimating rainfall amounts for multiple rainfall intensity ranges at 29 gauges. Although all of them are gauge-corrected, none of the three products showed a consistent performance and can be entitled as the best/worst performing product for Egypt. As the performance of the satellite-based rainfall retrievals was unsatisfactory, the challenges in accurate estimation and detection of rainfall in the hot desert climate are still an open case task that needs to be resolved. The availability of such high spatial and temporal resolution data is vital for data-scare countries.
This study was limited by the lack of freely available dense ground observations. More gauge observations in sub-daily level would be beneficial for evaluation of diurnal cycles of rainfall of the IMERG and GSMaP sub-daily products. Furthermore, a similar study could be performed for other satellite rainfall products such as the CPC morphing technique (CMORPH) satellite-based rainfall dataset. Further studies are needed to assess the performance of satellite-based rainfall products over Egypt in simulating hydro-meteorological phenomena such as floods and droughts.
Author Contributions
Conceptualization and analysis, M.S.N., S.S. and X.W.; original draft preparation, M.S.N., S.S. and X.W.; review and writing the final draft M.S.N., S.S. and X.W.
Funding
This research was funded by the Young Top-Notch Talent Support Program of National High-level Talents Special Support Plan.
Conflicts of Interest
The authors declare no conflict of interest.
References
- Shen, Y.; Chen, Y. Global perspective on hydrology, water balance, and water resources management in arid basins. Hydrol. Process. 2010, 24, 129–135. [Google Scholar] [CrossRef]
- Mashaly, J.; Ghoneim, E. Flash flood hazard using optical, radar, and stereo-pair derived dem: Eastern desert, Egypt. Remote Sens. 2018, 10, 1204. [Google Scholar] [CrossRef]
- Demnati, F.; Allache, F.; Ernoul, L.; Samraoui, B. Socio-economic stakes and perceptions of wetland management in an arid region: A case study from chott merouane, algeria. AMBIO 2012, 41, 504–512. [Google Scholar] [CrossRef] [PubMed]
- Abdel-Fattah, M.; Saber, M.; Kantoush, S.A.; Khalil, M.F.; Sumi, T.; Sefelnasr, A.M. A hydrological and geomorphometric approach to understanding the generation of wadi flash floods. Water 2017, 9, 553. [Google Scholar] [CrossRef]
- Costa, J.E. Hydraulics and basin morphometry of the largest flash floods in the conterminous United States. J. Hydrol. 1987, 93, 313–338. [Google Scholar] [CrossRef]
- Sharifi, E.; Steinacker, R.; Saghafian, B. Multi time-scale evaluation of high-resolution satellite-based precipitation products over northeast of austria. Atmos. Res. 2018, 206, 46–63. [Google Scholar] [CrossRef]
- Nashwan, M.S.; Ismail, T.; Ahmed, K. Flood susceptibility assessment in kelantan river basin using copula. Int. J. Eng. Technol. 2018, 7, 584–590. [Google Scholar]
- Petersen, W.A.; Christian, H.J.; Rutledge, S.A. Trmm observations of the global relationship between ice water content and lightning. Geophys. Res. Lett. 2005, 32. [Google Scholar] [CrossRef]
- Huffman, G.J.; Adler, R.F.; Morrissey, M.M.; Bolvin, D.T.; Curtis, S.; Joyce, R.; McGavock, B.; Susskind, J. Global precipitation at one-degree daily resolution from multisatellite observations. J. Hydrometeorol. 2001, 2, 36–50. [Google Scholar] [CrossRef]
- Nashwan, M.S.; Shahid, S. Spatial distribution of unidirectional trends in climate and weather extremes in nile river basin. Theor. Appl. Climatol. 2018, 1–19. [Google Scholar] [CrossRef]
- Li, H.; Haugen, J.E.; Xu, C.-Y. Precipitation pattern in the western himalayas revealed by four datasets. Hydrol. Earth Syst. Sci. 2018, 22, 5097–5110. [Google Scholar] [CrossRef]
- Nashwan, M.S.; Shahid, S.; Chung, E.-S.; Ahmed, K.; Song, Y.H. Development of climate-based index for hydrologic hazard susceptibility. Sustainability 2018, 10, 2182. [Google Scholar] [CrossRef]
- Nashwan, M.S.; Shamsuddin, S.; Wang, X.-J. Uncertainty in estimated trends using gridded rainfall data: A case study of bangladesh. Water 2019, 11, 349. [Google Scholar] [CrossRef]
- Nashwan, M.S.; Shahid, S.; Abd Rahim, N. Unidirectional trends in annual and seasonal climate and extremes in egypt. Theor. Appl. Climatol. 2018, 1–17. [Google Scholar] [CrossRef]
- Retalis, A.; Katsanos, D.; Michaelides, S. Precipitation climatology over the mediterranean basin—Validation over Cyprus. Atmos. Res. 2016, 169, 449–458. [Google Scholar] [CrossRef]
- Okamoto, K.i.; Ushio, T.; Iguchi, T.; Takahashi, N.; Iwanami, K. The global satellite mapping of precipitation (GSMaP) project. In Proceedings of the 2005 IEEE International Geoscience and Remote Sensing Symposium, Seoul, Korea, 29 July 2005; Volume 5, pp. 3414–3416. [Google Scholar]
- Hou, A.Y.; Kakar, R.K.; Neeck, S.; Azarbarzin, A.A.; Kummerow, C.D.; Kojima, M.; Oki, R.; Nakamura, K.; Iguchi, T. The global precipitation measurement mission. Bull. Am. Meteorol. Soc. 2014, 95, 701–722. [Google Scholar] [CrossRef]
- Caracciolo, D.; Francipane, A.; Viola, F.; Noto, L.V.; Deidda, R. Performances of gpm satellite precipitation over the two major mediterranean islands. Atmos. Res. 2018, 213, 309–322. [Google Scholar] [CrossRef]
- Funk, C.; Peterson, P.; Landsfeld, M.; Pedreros, D.; Verdin, J.; Shukla, S.; Husak, G.; Rowland, J.; Harrison, L.; Hoell, A.; et al. The climate hazards infrared precipitation with stations—A new environmental record for monitoring extremes. Sci. Data 2015, 2, 150066. [Google Scholar] [CrossRef] [PubMed]
- Funk, C.; Verdin, A.; Michaelsen, J.; Peterson, P.; Pedreros, D.; Husak, G. A global satellite-assisted precipitation climatology. Earth Syst. Sci. Data 2015, 7, 275. [Google Scholar] [CrossRef]
- Cools, J.; Vanderkimpen, P.; El Afandi, G.; Abdelkhalek, A.; Fockedey, S.; El Sammany, M.; Abdallah, G.; El Bihery, M.; Bauwens, W.; Huygens, M. An early warning system for flash floods in hyper-arid egypt. Nat. Hazards Earth Syst. Sci. 2012, 12, 443–457. [Google Scholar] [CrossRef]
- Abuzied, S.; Yuan, M.; Ibrahim, S.; Kaiser, M.; Saleem, T. Geospatial risk assessment of flash floods in nuweiba area, egypt. J. Arid Environ. 2016, 133, 54–72. [Google Scholar] [CrossRef]
- Vries, A.J.; Tyrlis, E.; Edry, D.; Krichak, S.O.; Steil, B.; Lelieveld, J. Extreme precipitation events in the middle east: Dynamics of the active red sea trough. J. Geophys. Res. Atmos. 2013, 118, 7087–7108. [Google Scholar] [CrossRef]
- Krichak, S.O.; Tsidulko, M.; Alpert, P. November 2, 1994, severe storms in the southeastern mediterranean. Atmos. Res. 2000, 53, 45–62. [Google Scholar] [CrossRef]
- FloodList. Egypt—Floods in Alexandria Leave at Least 6 Dead. Available online: http://www.webcitation.org/76IuxIySz (accessed on 23 September 2018).
- FloodList. Updated: Egypt—Floods Strike Again—25 Killed in Beheira and Alexandria. Available online: http://www.webcitation.org/76Iuk4xH7 (accessed on 23 September 2018).
- Elnazer, A.A.; Salman, S.A.; Asmoay, A.S. Flash flood hazard affected ras gharib city, red sea, Egypt: A proposed flash flood channel. Nat. Hazards 2017, 89, 1389–1400. [Google Scholar] [CrossRef]
- IFRC. Emergency Plan of Action Final Report, Egypt: Floods. Available online: https://reliefweb.int/sites/reliefweb.int/files/resources/MDREG013dfr.pdf (accessed on 26 April 2018).
- FloodList. Eastern Mediterranean—Deadly Flash Floods after Heavy Rain. Available online: http://www.webcitation.org/76Iv1Fxmq (accessed on 23 September 2018).
- Hamed, K.H. Stochastic investigation of the gerd-ahd interaction through first impoundment and beyond. In Grand Ethiopian Renaissance Dam Versus Aswan High Dam: A View from Egypt; Negm, A.M., Abdel-Fattah, S., Eds.; Springer: Cham, Switzerland, 2019; pp. 95–117. [Google Scholar]
- Sharaky, A.M.; Hamed, K.H.; Mohamed, A.B. Model-based optimization for operating the Ethiopian renaissance dam on the Blue Nile river. In Grand Ethiopian renaissance dam versus Aswan high dam: A view from Egypt; Negm, A.M., Abdel-Fattah, S., Eds.; Springer International Publishing: Cham, Switzerland, 2019; pp. 119–148. [Google Scholar]
- Derin, Y.; Anagnostou, E.; Berne, A.; Borga, M.; Boudevillain, B.; Buytaert, W.; Chang, C.-H.; Delrieu, G.; Hong, Y.; Hsu, Y.C.; et al. Multiregional satellite precipitation products evaluation over complex terrain. J. Hydrometeorol. 2016, 17, 1817–1836. [Google Scholar] [CrossRef]
- Mahmoud, M.T.; Al-Zahrani, M.A.; Sharif, H.O. Assessment of global precipitation measurement satellite products over saudi arabia. J. Hydrol. 2018, 559, 1–12. [Google Scholar] [CrossRef]
- Dinku, T.; Ceccato, P.; Cressman, K.; Connor, S.J. Evaluating detection skills of satellite rainfall estimates over desert locust recession regions. J. Appl. Meteorol. Climatol. 2010, 49, 1322–1332. [Google Scholar] [CrossRef]
- Basheer, M.; Elagib, N.A. Performance of satellite-based and gpcc 7.0 rainfall products in an extremely data-scarce country in the nile basin. Atmos. Res. 2019, 215, 128–140. [Google Scholar] [CrossRef]
- Kazamias, A.P.; Sapountzis, M.; Lagouvardos, K. Evaluation and intercomparison of gpm-imerg and trmm 3b42 daily precipitation products over Greece. In Proceedings of the Fifth International Conference on Remote Sensing and Geoinformation of the Environment (RSCy2017), Paphos, Cyprus, 20–23 March 2017; p. 8. [Google Scholar]
- Retalis, A.; Katsanos, D.; Tymvios, F.; Michaelides, S. Validation of the first years of gpm operation over cyprus. Remote Sens. 2018, 10, 1520. [Google Scholar] [CrossRef]
- Katsanos, D.; Retalis, A.; Michaelides, S. Validation of a high-resolution precipitation database (chirps) over cyprus for a 30-year period. Atmos. Res. 2016, 169, 459–464. [Google Scholar] [CrossRef]
- Tuo, Y.; Duan, Z.; Disse, M.; Chiogna, G. Evaluation of precipitation input for swat modeling in alpine catchment: A case study in the adige river basin (Italy). Sci. Total Environ. 2016, 573, 66–82. [Google Scholar] [CrossRef] [PubMed]
- Abd El-Ghani, M.M.; Huerta-Martínez, F.M.; Hongyan, L.; Qureshi, R. The desert of egypt. In Plant Responses to Hyperarid Desert Environments; Springer: Cham, Switzerland, 2017; pp. 11–20. [Google Scholar]
- Aonashi, K.; Awaka, J.; Hirose, M.; Kozu, T.; Kubota, T.; Liu, G.; Shige, S.; Kida, S.; Seto, S.; Takahashi, N. Gsmap passive microwave precipitation retrieval algorithm: Algorithm description and validation. J. Meteorol. Soc. Jpn. Ser. II 2009, 87, 119–136. [Google Scholar] [CrossRef]
- Ushio, T.; Sasashige, K.; Kubota, T.; Shige, S.; Okamoto, K.i.; Aonashi, K.; Inoue, T.; Takahashi, N.; Iguchi, T.; Kachi, M. A kalman filter approach to the global satellite mapping of precipitation (gsmap) from combined passive microwave and infrared radiometric data. J. Meteorol. Soc. Jpn. Ser. II 2009, 87, 137–151. [Google Scholar] [CrossRef]
- Mega, T.; Ushio, T.; Kubota, T.; Kachi, M.; Aonashi, K.; Shige, S. Gauge adjusted global satellite mapping of precipitation (gsmap_gauge). In Proceedings of the 2014 XXXIth URSI General Assembly and Scientific Symposium (URSI GASS), Beijing, China, 16–23 August 2014; pp. 1–4. [Google Scholar]
- Guo, H.; Chen, S.; Bao, A.; Behrangi, A.; Hong, Y.; Ndayisaba, F.; Hu, J.; Stepanian, P.M. Early assessment of integrated multi-satellite retrievals for global precipitation measurement over china. Atmos. Res. 2016, 176–177, 121–133. [Google Scholar] [CrossRef]
- Beck, H.E.; Pan, M.; Roy, T.; Weedon, G.P.; Pappenberger, F.; van Dijk, A.I.J.M.; Huffman, G.J.; Adler, R.F.; Wood, E.F. Daily evaluation of 26 precipitation datasets using stage-iv gauge-radar data for the conus. Hydrol. Earth Syst. Sci. Discuss. 2018, 2018, 1–23. [Google Scholar] [CrossRef]
- Rozante, J.; Vila, D.; Barboza Chiquetto, J.; Fernandes, A.; Souza Alvim, D. Evaluation of trmm/gpm blended daily products over brazil. Remote Sens. 2018, 10, 882. [Google Scholar] [CrossRef]
- Gupta, H.V.; Kling, H.; Yilmaz, K.K.; Martinez, G.F. Decomposition of the mean squared error and nse performance criteria: Implications for improving hydrological modelling. J. Hydrol. 2009, 377, 80–91. [Google Scholar] [CrossRef]
- Radcliffe, D.E.; Mukundan, R. Prism vs. Cfsr precipitation data effects on calibration and validation of swat models. JAWRA J. Am. Water Resour. Assoc. 2017, 53, 89–100. [Google Scholar] [CrossRef]
- Perkins, S.E.; Pitman, A.J.; Holbrook, N.J.; McAneney, J. Evaluation of the ar4 climate models’ simulated daily maximum temperature, minimum temperature, and precipitation over australia using probability density functions. J. Clim. 2007, 20, 4356–4376. [Google Scholar] [CrossRef]
- Tan, M.; Ibrahim, A.; Duan, Z.; Cracknell, A.; Chaplot, V. Evaluation of six high-resolution satellite and ground-based precipitation products over malaysia. Remote Sens. 2015, 7, 1504. [Google Scholar] [CrossRef]
- McCollum, J.R.; Gruber, A.; Ba, M.B. Discrepancy between gauges and satellite estimates of rainfall in equatorial africa. J. Appl. Meteorol. 2000, 39, 666–679. [Google Scholar] [CrossRef]
- Wang, N.-Y.; Liu, C.; Ferraro, R.; Wolff, D.; Zipser, E.; Kummerow, C. Trmm 2a12 land precipitation product-status and future plans. J. Meteorol. Soc. Jpn. Ser. II 2009, 87A, 237–253. [Google Scholar] [CrossRef]
- Seto, S.; Kubota, T.; Iguchi, T.; Takahashi, N.; Oki, T. An evaluation of over-land rain rate estimates by the gsmap and gprof algorithms: The role of lower-frequency channels. J. Meteorol. Soc. Jpn. Ser. II 2009, 87A, 183–202. [Google Scholar] [CrossRef]
- Wei, G.; Lü, H.; Crow, W.; Zhu, Y.; Wang, J.; Su, J. Evaluation of satellite-based precipitation products from imerg v04a and v03d, cmorph and tmpa with gauged rainfall in three climatologic zones in China. Remote Sens. 2018, 10, 30. [Google Scholar] [CrossRef]
- Lu, X.; Tang, G.; Wei, M.; Yang, L.; Zhang, Y. Evaluation of multi-satellite precipitation products in xinjiang, China. Int. J. Remote Sens. 2018, 39, 7437–7462. [Google Scholar] [CrossRef]
- Guo, H.; Chen, S.; Bao, A.; Hu, J.; Gebregiorgis, A.; Xue, X.; Zhang, X. Inter-comparison of high-resolution satellite precipitation products over central asia. Remote Sens. 2015, 7, 7181. [Google Scholar] [CrossRef]
Figure 1.
Egypt topography and the location of rainfall gauges. The average annual rainfall at 29 stations for the period 2014–2018 is used to show the rainfall distribution.
Figure 1.
Egypt topography and the location of rainfall gauges. The average annual rainfall at 29 stations for the period 2014–2018 is used to show the rainfall distribution.

Figure 2.
Spatial distribution of average annual rainfall (in mm/year) over Egypt estimated by (a) CHIRPS, (b) IMERG, and (c) GSMaP for the period March 2014–May 2018.
Figure 2.
Spatial distribution of average annual rainfall (in mm/year) over Egypt estimated by (a) CHIRPS, (b) IMERG, and (c) GSMaP for the period March 2014–May 2018.

Figure 3.
Bar graphs representing the count of rainfall events of the light, low–moderate, high–moderate, and heavy rainfall intensity classes at each rainfall station.
Figure 3.
Bar graphs representing the count of rainfall events of the light, low–moderate, high–moderate, and heavy rainfall intensity classes at each rainfall station.

Figure 4.
Box plots of Root Mean Square Error (RMSE) of the three satellite-based datasets in the estimation of rainfall amounts for (a) all events, and (b–f) different intensity ranges as shown in the corresponding plot.
Figure 4.
Box plots of Root Mean Square Error (RMSE) of the three satellite-based datasets in the estimation of rainfall amounts for (a) all events, and (b–f) different intensity ranges as shown in the corresponding plot.

Figure 5.
Maps showing the best performing datasets according to RMSE at each station along with the estimated RMSE for the best performing satellite rainfall product for (a) all rainfall events, (b) no/tiny rain, (c) light rain, (d) low–moderate rain, (e) heavy–moderate rain, and (f) heavy rain.
Figure 5.
Maps showing the best performing datasets according to RMSE at each station along with the estimated RMSE for the best performing satellite rainfall product for (a) all rainfall events, (b) no/tiny rain, (c) light rain, (d) low–moderate rain, (e) heavy–moderate rain, and (f) heavy rain.

Figure 6.
Box plots of Kling–Gupta efficiency (KGE) of the three satellite-based datasets in the estimation of rainfall amount for (a) all events, and (b–f) different intensity ranges as shown in the corresponding plot.
Figure 6.
Box plots of Kling–Gupta efficiency (KGE) of the three satellite-based datasets in the estimation of rainfall amount for (a) all events, and (b–f) different intensity ranges as shown in the corresponding plot.

Figure 7.
Maps showing the best performing datasets according to KGE at each station along with the estimated KGE for best performing satellite rainfall product for (a) all rainfall events, (b) no/tiny rain, (c) light rain, (d) low–moderate rain, (e) heavy–moderate rain, and (f) heavy rain.
Figure 7.
Maps showing the best performing datasets according to KGE at each station along with the estimated KGE for best performing satellite rainfall product for (a) all rainfall events, (b) no/tiny rain, (c) light rain, (d) low–moderate rain, (e) heavy–moderate rain, and (f) heavy rain.

Figure 8.
Box plots of Skill Score (SS) of the three satellite-based datasets in the estimation of rainfall amount for (a) all events, and (b–f) different intensity ranges as shown in the corresponding plot.
Figure 8.
Box plots of Skill Score (SS) of the three satellite-based datasets in the estimation of rainfall amount for (a) all events, and (b–f) different intensity ranges as shown in the corresponding plot.

Figure 9.
Maps showing the best performing datasets according to PDF SS at each station along with the estimated SS for best performing satellite rainfall product for (a) all rainfall events, (b) no/tiny rain, (c) light rain, (d) low–moderate rain, (e) heavy–moderate rain, and (f) heavy rain.
Figure 9.
Maps showing the best performing datasets according to PDF SS at each station along with the estimated SS for best performing satellite rainfall product for (a) all rainfall events, (b) no/tiny rain, (c) light rain, (d) low–moderate rain, (e) heavy–moderate rain, and (f) heavy rain.

Figure 10.
The performance chart of CHIRPS, IMERG, and GSMaP in detecting (a) all-events class, and (b) CHIRPS, (c) IMERG, and (d) GSMaP in detecting rainfall events having different intensity ranges.
Figure 10.
The performance chart of CHIRPS, IMERG, and GSMaP in detecting (a) all-events class, and (b) CHIRPS, (c) IMERG, and (d) GSMaP in detecting rainfall events having different intensity ranges.

Figure 11.
Spatial distribution of rainfall during the 5 November 2015 flash flood in the north of Egypt as captured by (a) CHIRPS, (b) IMERG, and (c) GSMaP along with observations at 7 nearby stations.
Figure 11.
Spatial distribution of rainfall during the 5 November 2015 flash flood in the north of Egypt as captured by (a) CHIRPS, (b) IMERG, and (c) GSMaP along with observations at 7 nearby stations.


Table 1.
Summary of the main findings of the previous studies on the evaluation of satellite-based rainfall products in neighboring countries of Egypt.
Table 1.
Summary of the main findings of the previous studies on the evaluation of satellite-based rainfall products in neighboring countries of Egypt.
| Study | Study Area | Climate Type | Product | Main Findings |
|---|---|---|---|---|
| Mahmoud, et al. [33] | Saudi Arabia | Hot desert | IMERG early, late and FR | FR performed better than earlier runs, with high bias in some regions |
| Dinku, et al. [34] | North Africa | Arid and Semi-arid | GSMaP and 6 other products | The probability of detection was ≤20% and false alarm ratio ≥84% |
| Basheer and Elagib [35] | South Sudan | Semi-arid and sub-humid | CHIRPS v2.0 and 5 other products | On a monthly and annual scale, CHIRPS was ranked as the 2nd best with high RMSE. |
| Kazamias et al. [36] | Greece | Mediterranean | IMERG FR and TRMM 3B42 | IMERG showed a strong bias in the west and a good overall correlation (0.60) |
| Retalis et al. [37] | Cyprus | Mediterranean | IMERG | IMERG underestimates rainfall |
| Katsanos et al. [38] | Cyprus | Mediterranean | CHIRPS | CHIRPS had good correlation but overestimated rainfall |
| Caracciolo et al. [18] | Sardinia and Sicily (Italy) | Mediterranean | IMERG early and FR | IMERG showed a high correlation (0.8) on a daily level with a systematic bias as rainfall amount increased |
| Tuo et al. [39] | Adige River basin (Italy) | Humid subtropical, and continental | CHIRPS and TRMM | CHIRPS rainfall produced satisfactory streamflow estimation |
IMERG: Integrated Multi-satellitE Retrievals for the Global precipitation measurement; FR: Final Run; GSMaP: Global Satellite Mapping of Precipitation; CHIRPS: Climate Hazard Group’s InfraRed Precipitation with Stations; TRMM: Tropical Rainfall Measuring Mission; RMSE: Root Mean Square Error.
Table 2.
The percentage of missing data during March 2014–May 2018, count of wet days, and the maximum amount of recorded daily rainfall at each gauge location.
Table 2.
The percentage of missing data during March 2014–May 2018, count of wet days, and the maximum amount of recorded daily rainfall at each gauge location.
| WMO ID | % Missing Data | Count of Wet Days | Max Rainfall (mm/Day) | WMO ID | % Missing Data | Count of Wet Days | Max Rainfall (mm/Day) |
|---|---|---|---|---|---|---|---|
| 623050 | 15% | 53 | 70.1 | 624170 | 5% | 7 | 8.89 |
| 623060 | 2% | 103 | 50.04 | 624190 | 24% | 1 | 0.25 |
| 623090 | 11% | 100 | 39.12 | 624200 | 3% | 8 | 102.11 |
| 623180 | 3% | 141 | 252.22 | 624230 | 9% | 1 | 0.51 |
| 623250 | 4% | 113 | 71.88 | 624320 | 31% | 1 | 72.14 |
| 623330 | 3% | 81 | 90.93 | 624350 | 3% | 2 | 1.02 |
| 623370 | 7% | 77 | 23.11 | 624400 | 6% | 16 | 101.09 |
| 623570 | 13% | 15 | 70.1 | 624520 | 10% | 27 | 102.11 |
| 623660 | 2% | 61 | 99.06 | 624550 | 3% | 38 | 7.11 |
| 623870 | 3% | 9 | 76.2 | 624580 | 3% | 24 | 6.1 |
| 623930 | 2% | 4 | 8.89 | 624590 | 6% | 17 | 99.06 |
| 623980 | 14% | 1 | 7.87 | 624630 | 2% | 16 | 102.11 |
| 624030 | 7% | 4 | 3.05 | 624650 | 5% | 2 | 1.02 |
| 624050 | 2% | 15 | 50.04 | 624760 | 31% | 3 | 7.87 |
| 624140 | 4% | 7 | 14.99 | - | - | - | - |
WMO: World Meteorological Organization.
Table 3.
Statistical indices used for the measurement of the performance of satellite precipitation products in estimating rainfall amount.
Table 3.
Statistical indices used for the measurement of the performance of satellite precipitation products in estimating rainfall amount.
| Index | Range | Optimal Value | |
|---|---|---|---|
| (1) | 0 to +∞ | 0 | |
| (2) | −∞ to 1 | 1 | |
| (3) | 0 to 1 | 1 |
and are the satellite-based (s) and observed (o) rainfall, respectively; is Pearson’s correlation; and represent the mean and standard deviation of data, respectively; and and are the frequency of a specific rainfall amount of the observed and satellite-based data.
Table 4.
The categorical indices used for the measurement of the performance of satellite precipitation products in detecting the occurrence of different intensities of rainfall events.
Table 4.
The categorical indices used for the measurement of the performance of satellite precipitation products in detecting the occurrence of different intensities of rainfall events.
| Index | Optimal Value | |
|---|---|---|
| (4) | 1 | |
| (5) | 0 | |
| (6) | 1 | |
| (7) | 1 |
Table 5.
The contingency table presents the agreement between observed records (Po) and satellite-based retrievals (Ps) of rainfall for different rainfall intensity ranges.
Table 5.
The contingency table presents the agreement between observed records (Po) and satellite-based retrievals (Ps) of rainfall for different rainfall intensity ranges.
| Po ≥ Threshold | Po < Threshold | |
|---|---|---|
| Ps ≥ Threshold | Hits | False Alarms |
| Ps < Threshold | Misses | Correct Negatives |
Table 6.
The thresholds used for the classification of rainfall events based on the intensity.
| Rainfall Intensity Class | Daily Rainfall Threshold |
|---|---|
| All-events | No threshold |
| No/tiny rainfall | P < 1 mm |
| Light rainfall | 1 mm ≤ P < 2 mm |
| Low moderate rainfall | 2 mm ≤ P < 5 mm |
| High moderate rainfall | 5 mm ≤ P < 10 mm |
| Heavy rainfall | P ≥ 10 mm |
Table 7.
The total count of events detected at observed rainfall stations for each rainfall intensity class.
Table 7.
The total count of events detected at observed rainfall stations for each rainfall intensity class.
| Rainfall Intensity Class | Count of Events |
|---|---|
| All-events | 45,473 |
| No/tiny rainfall | 44,803 |
| Light rainfall | 140 |
| Low–moderate rainfall | 286 |
| High–moderate rainfall | 151 |
| Heavy rainfall | 93 |
© 2019 by the authors. Licensee MDPI, Basel, Switzerland. This article is an open access article distributed under the terms and conditions of the Creative Commons Attribution (CC BY) license (http://creativecommons.org/licenses/by/4.0/).
Share and Cite
MDPI and ACS Style
Nashwan, M.S.; Shahid, S.; Wang, X. Assessment of Satellite-Based Precipitation Measurement Products over the Hot Desert Climate of Egypt. Remote Sens. 2019, 11, 555. https://doi.org/10.3390/rs11050555
AMA Style
Nashwan MS, Shahid S, Wang X. Assessment of Satellite-Based Precipitation Measurement Products over the Hot Desert Climate of Egypt. Remote Sensing. 2019; 11(5):555. https://doi.org/10.3390/rs11050555
Chicago/Turabian StyleNashwan, Mohamed Salem, Shamsuddin Shahid, and Xiaojun Wang. 2019. "Assessment of Satellite-Based Precipitation Measurement Products over the Hot Desert Climate of Egypt" Remote Sensing 11, no. 5: 555. https://doi.org/10.3390/rs11050555
Note that from the first issue of 2016, this journal uses article numbers instead of page numbers. See further details here.