Estimating the Generation of Garden Waste in England and the Differences between Rural and Urban Areas


Water and Environmental Engineering Group, University of Southampton, Southampton SO16 7QF, UK
*
Authors to whom correspondence should be addressed.
Resources 2020, 9(1), 8; https://doi.org/10.3390/resources9010008
Submission received: 29 November 2019
/
Revised: 7 January 2020
/
Accepted: 13 January 2020
/
Published: 16 January 2020
(This article belongs to the Special Issue Underutilised Resources in Urban Environments)
Abstract
:Garden waste arising from private households represents a major component of the biodegradable municipal waste stream. To design effective waste valorisation schemes, detailed information about garden waste is a prerequisite. While the biochemical composition of this material is well documented, there is a lack of knowledge regarding both the quantities arising, and quantities entering the services operated by waste management authorities. This work studied the quantities of garden waste arisings at urban and rural households along with the disposal methods used. A door-to-door interview survey, an analysis of kerbside collections of garden waste, and an assessment of materials brought by citizens to a waste recycling site were carried out in Hampshire, UK. If extrapolated nationally, the results indicate that households in England produce an average of 0.79 kg of garden waste per day, or 288 kg per year. On a per capita basis, this corresponds to an annual arising of 120 kg per person, out of which around 70% enters the collection schemes of the waste management authorities. The quantity generated by rural and urban households differed substantially, with rural households producing 1.96 ± 1.35 kg per day and urban households 0.64 ± 0.46 kg per day. Rural households adopted self-sufficient methods of garden waste management such as home composting or backyard burning to a much greater extent compared with urban households. Less than half of the generated rural garden waste entered services operated by the waste collection authorities, while urban households strongly relied on these services. A detailed breakdown of the disposal routes chosen by urban and rural householders can support authorities in tailoring more effective waste management schemes.
1. Introduction
The collection and recovery of organic wastes can assist local authorities in implementing more sustainable resource practices and meeting their targets for material recovery [1,2]. Green waste is a high-volume resource flow. Shi et al. [3] and MacFarlane [4] highlighted that green waste from urban areas represents a potentially large, underutilised resource. The biodegradable fractions (i.e., excluding soil and stones) of garden waste (also called yard waste) and park waste which together make up green waste are classified in the European waste catalogue with the waste code 200201. While park waste mainly arises under the direct management of public authorities in public spaces, garden waste occurs on private properties and its generation and handling are subject to decisions of the individual households. Sound garden waste management is an essential element in sustainable waste management practices and a shift towards more circular economies [1,2,5]. Collection is possible directly from the property as either a segregated green waste or a mixed biowaste stream [6,7]; or by bringing the waste to a centralised reception facility. Collection is, however, not the only management route as householders can recycle garden waste to their own gardens through composting, and less sustainably by burning [8].
Green waste from gardens typically consists of grass cuttings, hedge prunings, leaves and bark, flowers, branches, twigs and other woody material, whole plants, or plant parts removed. There is a considerable literature on the biochemical characteristics of garden waste [9,10,11] and potential valorisation pathways such as composting [12,13] or bioenergy production [14,15,16]. Environmental implications of garden waste disposal routes were also studied [17,18,19].
Despite our considerable knowledge on composition and potential valorisation methods, there is far less certainty on the quantities of garden and park waste that are generated in our municipalities. Yet, green waste is potentially the dominant component of the biodegradable municipal waste stream in some countries, although this is not always appreciated due to the variety of pathways that exist for recycling and disposal at both a household level and through centralised services. The fragmented way in which the potentially valuable green waste resource is handled means little information is available on primary generation rates [20]. Such information is usually limited to data on the actual quantities that pass through services operated by the local waste management authorities. For EU countries, statistics on the collection of organic waste are available via Eurostat; however, in many European countries garden waste is collected mixed with food waste and statistics for these two waste fractions are therefore usually aggregated [21].
In England and Wales around 90% of households have access to a private garden [22,23], and garden waste on average represents 21% of the household waste (on weight basis), which is higher than the average kitchen waste arising (17% of total household waste) [24]. This makes garden waste quantitatively the dominant component of the biodegradable municipal waste stream in the UK. The estimates for kitchen waste is based on household waste generation rates and compositions, but for green waste they were estimated based on the number of compost units distributed by a local authority, the volume collected at kerbside in dedicated schemes and quantities deposited by householders at recycling centres [25,26]. This approach has led to an estimated average garden waste generation rate of 0.68 kg per household per day [26].
Assessment of garden waste arisings is also complicated by the fact that generation may be subject to strong seasonal and short-term variation [21]. This makes it unsuitable to base estimations on short-term analyses or limited random sampling. Different gardening practices may also influence generation rates: for example, in some locations fallen leaves or other organic material might not necessarily be gathered and instead decompose in place. Such quantities left to decompose in place are by default not included when estimating garden waste arisings; by definition, garden waste exists only when gathered [21]. This may also be a consideration when estimating garden waste arisings in urban and rural areas, but such differences have not previously been studied in detail. An alternative approach to estimating the green waste generation rates was presented by Shi et al. [3] who looked at arising in selected urban areas in China based on the presence of different green space types in each city, but no differentiation was made between park waste and garden waste.
More reliable and detailed estimates of the actual quantity of garden waste generated and disposed of through different routes are required to support a more holistic resource management framework in which local authorities can develop effective decision-making tools. Such tools are used to optimise collection schemes [27], and to develop adequate processing facilities for garden waste at a local level [7]. This includes the planning, design location, and operational implications of centralised processing plants and routes to market of compost products. It also includes estimating the self-sufficient methods of garden waste management that householders might employ, some more sustainable than others, and any requirements for the provision of home composting bins. In addition, tools need to be sufficiently robust to assess likely changes to existing practices from the introduction of fees or charges for green waste management. In England, 97% of local authorities offer kerbside garden waste collection (either separate or in mixture with food waste and other organics); out of these, 52% of authorities in 2017 charged a separate fee for this service, up from 42% in 2016 [28].
The aim of the current work was to develop an alternative, but complementary, method to assess gross tonnages of garden waste generated in both urban and rural areas and to assess whether generation rates are related to garden size. This involved gathering data to determine the actual quantities going via the different disposal/recovery routes from individual households, and relating this to their garden size. The survey gathered data over a 12 month period in the Test Valley district of Hampshire. The rural survey area comprised 341 properties and the urban one 798 properties. Kerbside collection of garden waste and drop-off at the recycling centre were monitored over the 12 month period, while a door-to-door interview campaign was used to clarify what kind of garden waste disposal methods the households used, and to further estimate the quantities of materials that were subject to home composting and backyard burning and thus did not enter the collection services of the waste management authority.
2. Materials and Methods
2.1. Methodology and Data Analysis
Urban and rural households in the selected study area (see Section 2.2 for details) were assessed to determine the quantities of garden waste arising and the selected disposal routes in each case. The quantities entering the official garden waste disposal services operated by the waste management authorities, namely kerbside collection and private delivery to a waste recycling centre, were quantified through weight measurement campaigns with data collected over a 12 month period (see Section 2.3 for details). Door-to-door interviews were carried out at individual households to identify which garden waste disposal methods were used, including kerbside collection, private delivery to a waste recycling centre, home composting, backyard burning, fly tipping into the environment or disposal into the residual waste bin (see Section 2.4 and Appendix A (Figure A1) for details). The door-to-door interviews also provided the basis for determining the quantities of garden waste which were subjected to home composting and backyard burning at each household.
The total garden waste generation for each household was calculated as sum of garden waste home composted, burned on the property and going via the garden waste collection schemes operated by the waste collection authority (kerbside collection, waste recycling centre). Quantities subjected to fly tipping into the environment or disposal into the residual waste bin could not be quantified by the methodology used, but the frequency of such practices is reported, and key observations are included in the discussion.
For the sets of rural and urban households, means and standard deviations for garden waste quantities are reported, along with the minimum, maximum and median values. The quantities generated as well as the quantities going via the different disposal routes are reported and discussed for both rural and urban households. By considering the total garden waste generated, the average shares of garden waste entering the official waste collection schemes operated by the waste management authorities were calculated for both rural and urban households.
To estimate the average garden waste arising per households in England, values determined for rural and urban households were used, and the weighted average based on the proportion of rural and urban households in the country was calculated (see Section 2.5 for details).
2.2. Study Area
The work was carried out in the Test Valley Borough Council district of Hampshire, UK (51.1274° N, 1.5518° W, https://testvalley.gov.uk). Test Valley (named after the River Test) covers 62,758 hectares and its population (116,398 in 2011 Census) represents around 8.8% of the total Hampshire population [29]. The average household size in Test Valley was 2.4 people in 2011 (unchanged since 2001) [29]; this is equivalent to the average household size in England [30]. The district’s population density is 1.9 per hectare, which is lower than the population densities of Hampshire and the South East of England at 3.6 and 4.5 [29]. This can be explained by the fact that 35.1% of Test Valley’s population is rural while 64.9% is urban, which represents a higher share of rural population compared to Hampshire’s average of 21.8% rural citizens (2016 data) [31]. In England, the rural population accounts for around 17.0% (2014 data) of the total population [32]. Test Valley therefore is not fully representative of Hampshire or England in terms of shares of rural and urban populations, but selection of this district ensured availability of significant garden spaces in both rural and urban areas, which was essential for the purpose of this study.
To study urban and rural patterns of garden waste occurrence and its handling, both an urban and a rural area of Test Valley were selected. Each of these areas represented one kerbside collection round served by the waste management authority, i.e., all properties of the urban survey area were served by one collection round, and all properties of the rural survey area were served by another. The rural survey area thus served consisted of 341 properties and the urban survey area of 798 properties. Out of these, 178 rural households (52.2%) and 354 urban households (44.4%) were individually reached during the door-to-door survey, and therefore these households were studied in detail at the individual household level.
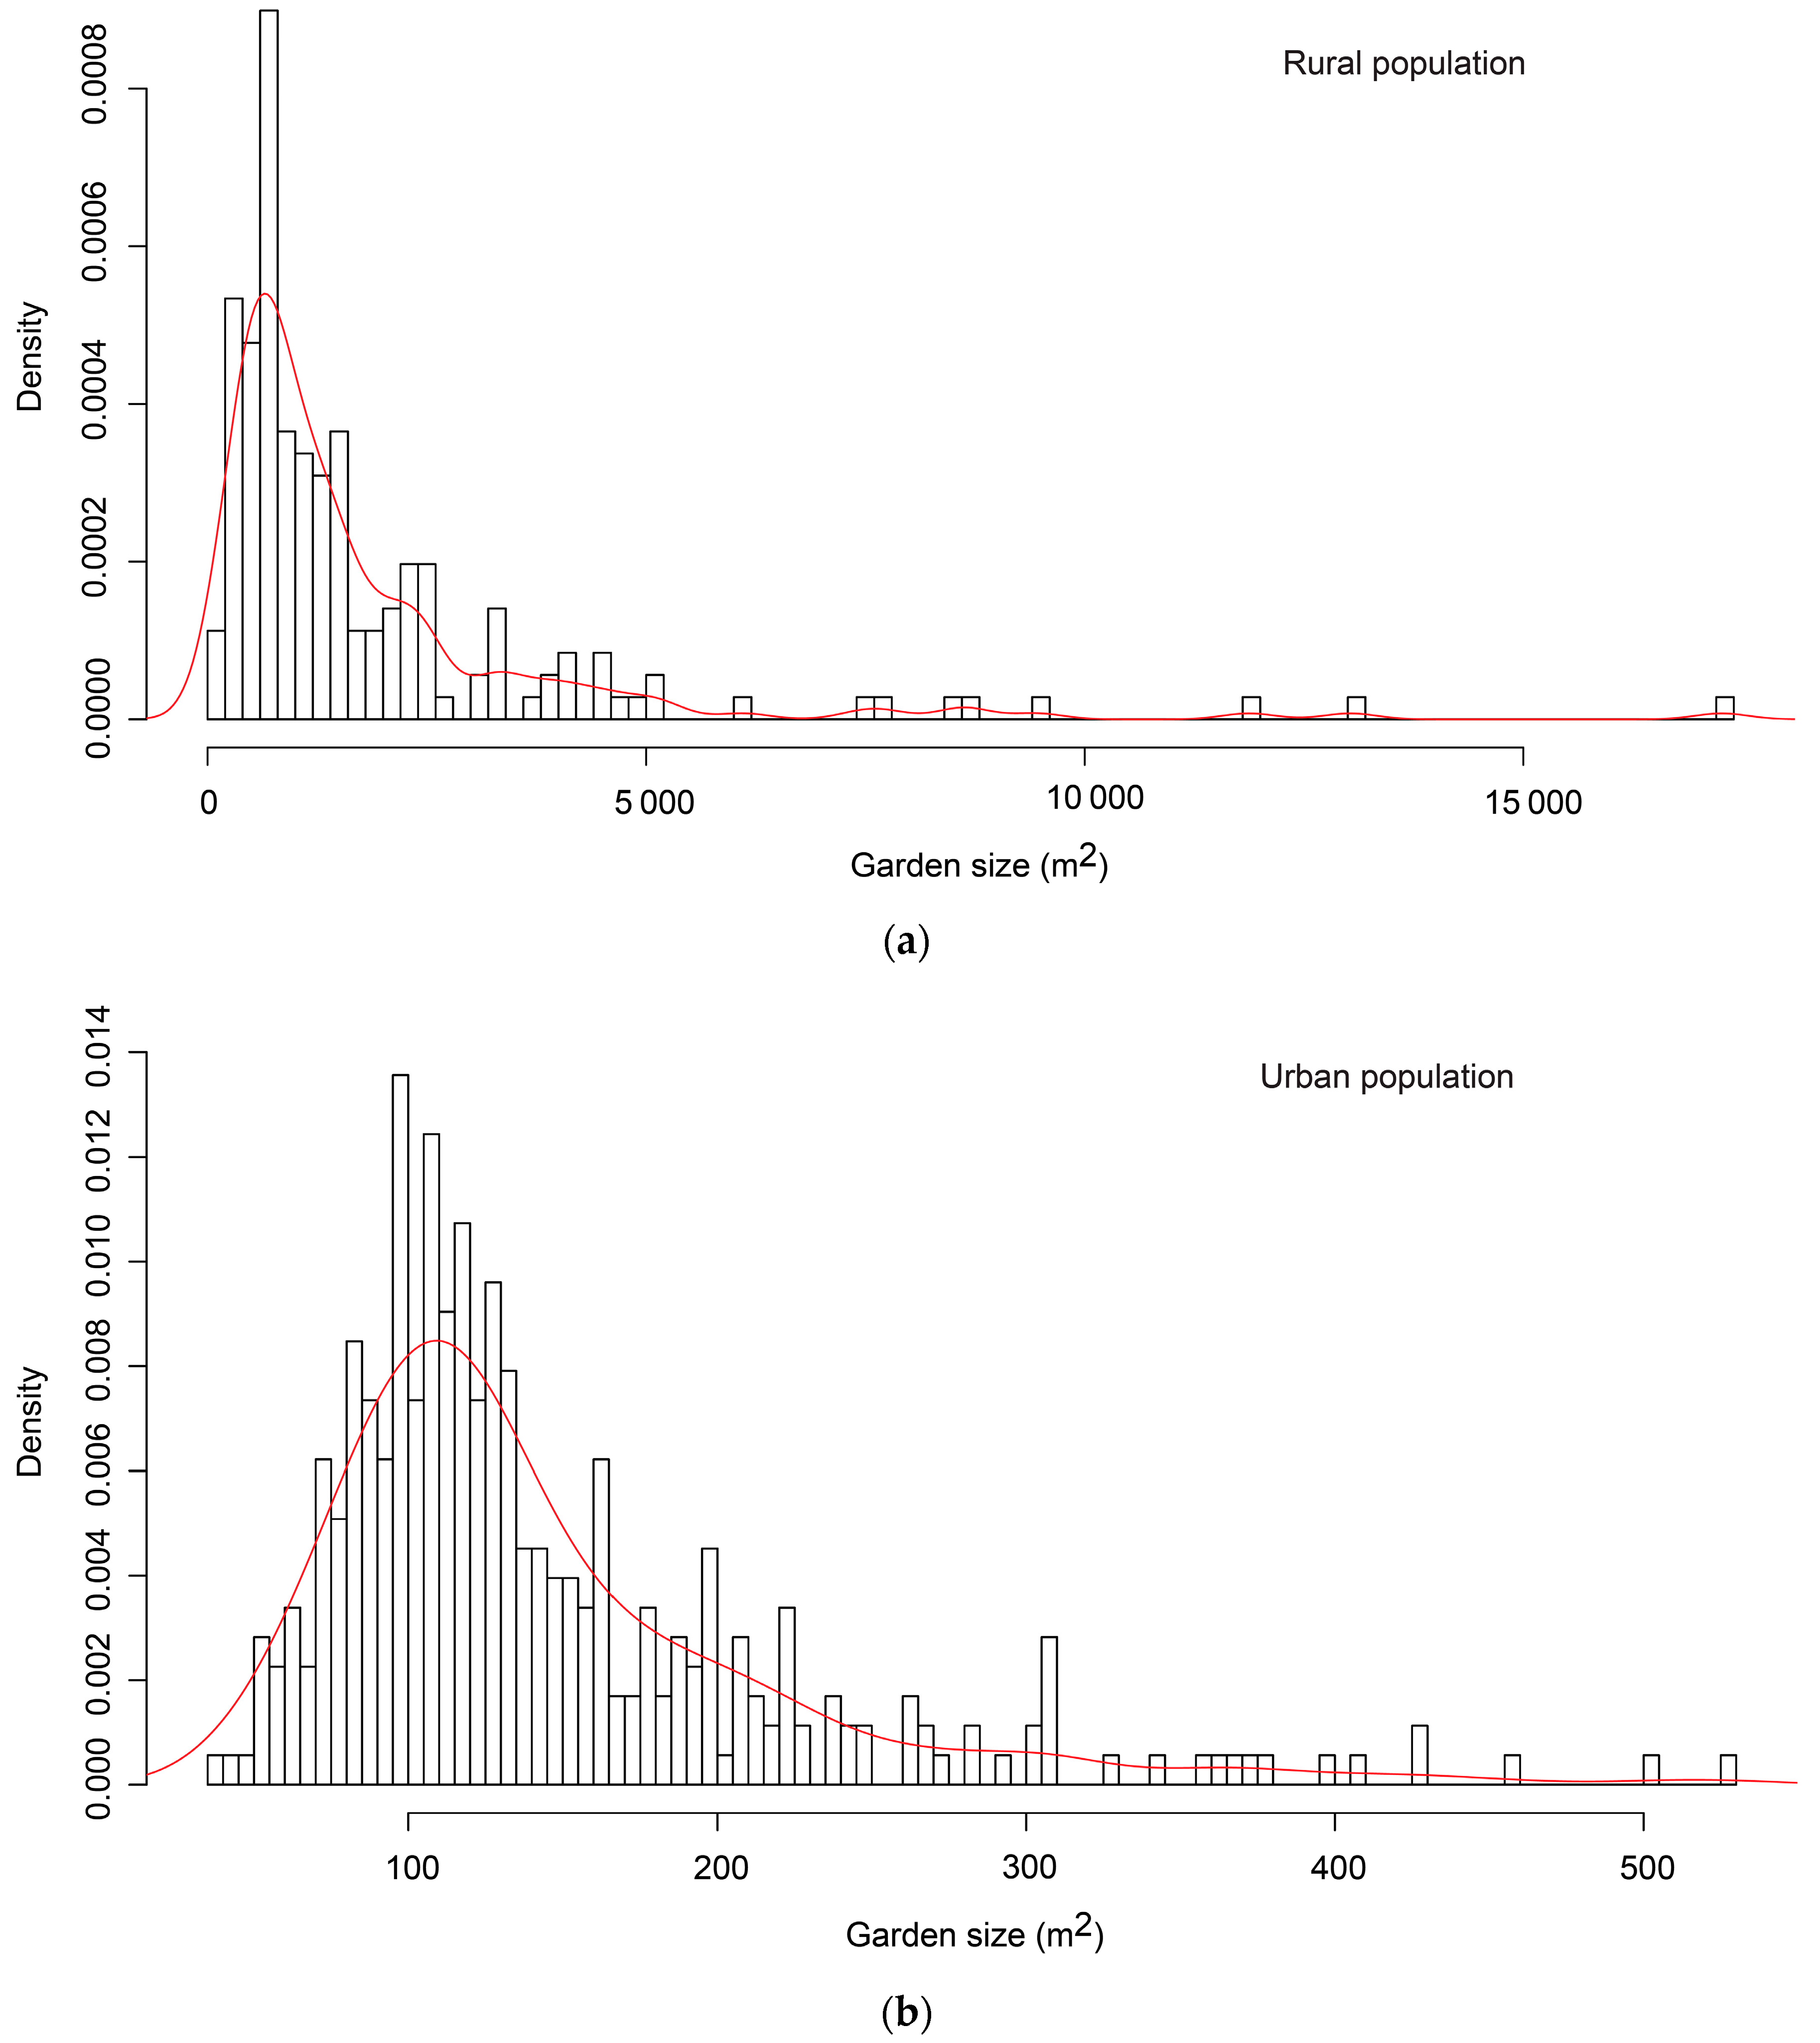
The area of the garden for each individually surveyed property (Table 1) was determined from digitised maps at a scale of 1:1000 using digital image analysing software (Image-Pro Plus 6.1, Media Cybernetics Inc., Rockville, MD, USA) to measure the area enclosed by the boundary of the property minus any area covered by the main house and outbuildings. The surveyed rural properties had a mean garden size of 1836 m² and a median of 1055 m2, with a range from 141 to 17,121 m2. Urban properties had a mean of 144 m² and median of 121 m2, within a range from 38 to 529 m2. The medians are included because the means were skewed dramatically by a small number of households that each occupied very large plots of land, particularly in rural locations. In the descriptive statistics, the presence of skewing in the data set is shown by the high standard deviation, where for the rural dataset the standard deviation is even higher than the mean. The distribution of garden sizes among the rural and urban households is shown in Figure A2 (Appendix B).
At the time of the study, residual waste from properties in the study area was collected through kerbside collection on a weekly basis, while dry recyclables and garden waste were collected on alternate weeks in separate 140 L wheeled bins. Householders in the survey area also had provision for garden waste disposal (and disposal of other recyclables) at a local Household Waste Recycling Centre (HWRC). No separate charge was levied for any of these garden waste disposal services in the study area of Test Valley at the time of the survey.
2.3. Estimation of Garden Waste Entering Services Operated by the Waste Collection Authority (Kerbside Collection and Private Delivery to Household Waste Recycling Centre)
Garden waste arising from private households enters the valorisation and management services operated by the waste collection authority in the survey district via two pathways, namely kerbside collection at the private property (collect system offered fortnightly, i.e., every 14 days) and individual drop-off by citizens at the HWRC (bring system available seven days per week at the time of the survey).
The survey gathered fortnightly data over a 12 month period from the two selected kerbside collection rounds in the Test Valley. Weighbridge tickets documenting the quantity of waste collected each fortnight over the 12 month period from the two collection rounds were used to determine the weight of garden waste collected. It was not possible to determine the weight of garden waste collected from individual properties, as the refuse collection vehicles were not fitted with on-board weighing equipment; therefore, average garden waste quantities for the urban residents and the rural residents were calculated.
To estimate garden waste quantities delivered by citizens to the HWRC, interviews with site-users and weight measurements were carried out on site. Estimates of the average daily garden waste load per site-user and frequency of use of the HWRC were made. Interviews and weight measurements were carried out over 2 h periods on Thursday afternoons and Saturday mornings every two weeks over a 12 month period. The times chosen corresponded to the periods of minimum and maximum use of the facility, based on information provided by the site operator. Site users were asked about the frequency with which they used the site and any seasonal variation in their routine. Weights of representative bagged samples of garden waste were measured using a torsion scale, and used to estimate the weight of the full quantity being unloaded. These data were used to estimate the average weight of garden waste per user, the average daily equivalent load per site-user, and the annual variability in these parameters. No distinction was made between site users from rural or urban areas. However, the door-to-door interviews (see next section) provided information on whether this method of garden waste disposal is common practice among rural and urban citizens.
2.4. Door-to-Door Interviews
Door-to-door interviews were used to identify the methods used by each household to manage their garden waste, and to estimate the quantities of waste composted and burned within the site boundaries. Householders in both the rural and urban case-study areas were leafleted in advance of the survey to raise awareness and encourage a maximum participation rate. A structured interview was used in which response cards guided householders through a series of questions, allowing them to pick the answer which most closely fitted their circumstances. The survey questions are provided in Appendix A. The responses were recorded by the interviewer along with the respondent’s address; this made it possible to link specific information on garden waste disposal method to the garden surface at this property. The survey was initially piloted on 20 of the households and minor modifications were made before the main survey was undertaken. Each single household in the urban and rural survey area was approached. 178 and 354 rural and urban households on the two collection rounds were interviewed, giving a response rate of 52.2% and 44.4% respectively. All interviews were conducted by the same researcher (author P.E. of this publication).
The results allowed the methods used for garden waste disposal/recovery by each household to be established and also allowed estimates to be made of the amount of material composted or burned, based on frequency and volumes of addition to the composter or burn pile (see Appendix A for details). These volume estimates were subsequently converted to weights using a volume to weight ratio of 0.21 [33].
2.5. Estimation of Average Garden Waste Arisings per Household for England
To estimate the average garden waste generation in England, the mean garden waste arisings found for rural and urban households in this study were used to calculate the weighted average based on the proportion of rural and urban households; according to national statistics [32], 17% of households in England are rural and 83% are urban (Section 2.2). Additionally, account was taken of the fact that not all households in England, which includes large urban areas such as Greater London and Greater Manchester, have access to a private garden. In the survey area of Test Valley (Section 2.2), Hampshire, all households had a private garden. Even in large cities such as London or Edinburgh many British households have a garden [22,34,35], but of those living in a flat, less than 50% have one [23]. A research project which elaborated a national scale inventory of gardens across the UK found that 87% of all households have access to a private garden [22]. Citing government data from an unpublished internal study from 2009, Hope [23] indicated that 91.8% of UK households in 1995 had a private garden, while the estimated figure for 2010 was 90%. It was further reported that between 37% and 44% of flats have private gardens, 86% of terraced houses, and 99% of semi-detached houses [23]. Among rural households, where detached and semi-detached houses predominate, up to 99% can be assumed to have a private garden. It was therefore estimated, based on the limited data available, that the population of England consists of 16.5% rural households with a garden, 0.5% rural households without gardens, 10% urban households without gardens and 73% urban households with a garden. According to these data, around 18.5% of all private gardens in England are at rural households while 81.5% are at urban households. These values were then used to calculate the average garden waste generation per household for England.
The figure was not extrapolated to the whole of the UK including Scotland and Wales, as there are differences in waste policy and regulation between the devolved administrations of the individual countries in UK.
3. Results and Discussion
3.1. What Rural and Urban Households Do with Their Garden Waste
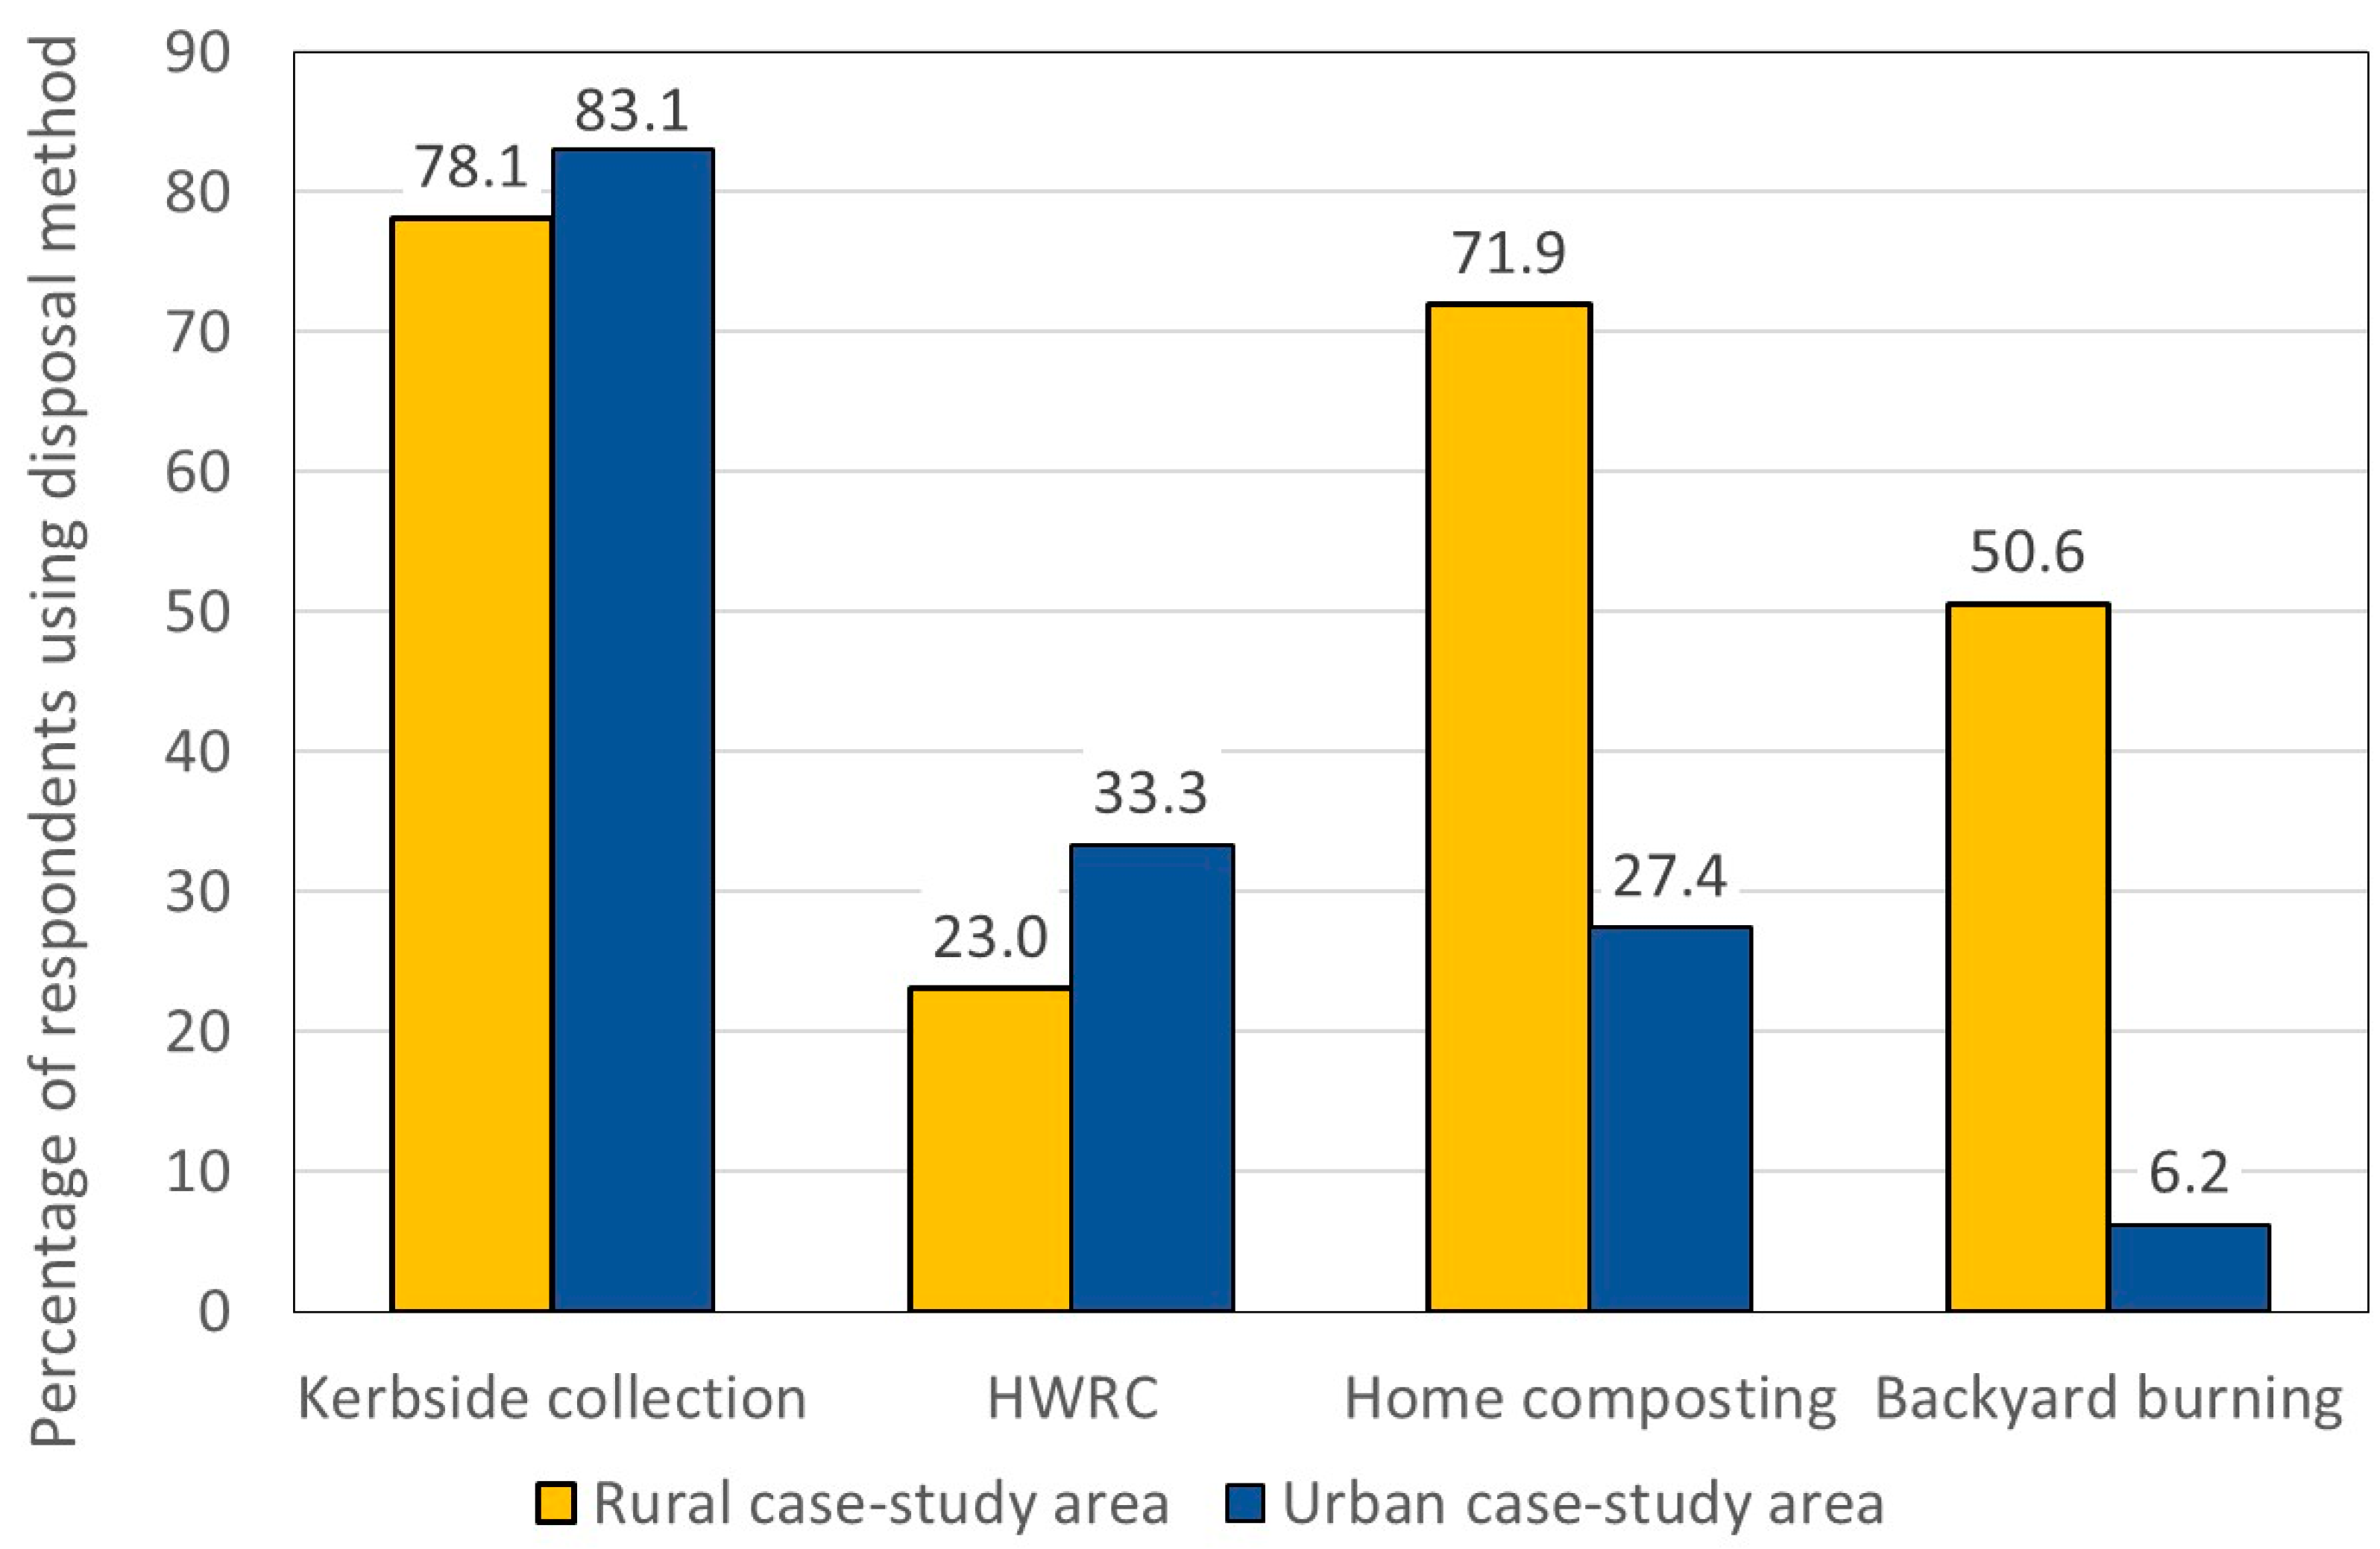
Results of the door-to-door interviews provide evidence that most households use more than one garden waste disposal method, and that there are significant differences between urban and rural households. As shown in Figure 1, kerbside collection was the most frequent choice in both the rural and urban area; this method was used by around 80% of households irrespective of their location (78.1% of rural households and 83.1% of urban households). Usage of HWRC facilities was slightly higher for the urban population; one third of the urban households and nearly one quarter of the rural households made use of this method. Composting and burning were far more common among the rural population. Overall, urban households largely relied on the services operated by the waste collection authority (kerbside collection and HWRC), while rural households used these services as well but also used methods of self-sufficiency to a significant extent.
It has also been reported in the literature that in the UK just over 1 in 3 households with access to a garden make use of home composting [36]. The results of this study are in agreement with this figure: when considering that 18.5% of the private gardens in England are rural while 81.5% are urban (see Section 2.5), the weighted average of the present data suggests that 35.6% of households in England with access to a private garden practice home composting. Among those households practicing home composting, 37% are rural, and 63% are urban.
These results show that especially for rural populations there is a significant difference between garden waste generated and garden waste entering the services operated by the waste collection authority.
Although all households surveyed received a free garden waste collection service, a small number of householders still used the residual waste bin on occasions (ca. 11% of urban households and ca. 4% of rural households indicated they occasionally put some garden waste into the residual waste bin) (data not shown). This is not unusual; while the extent to which this is practiced strongly depends on the waste management schemes offered by the authorities [6], it is still common that some garden waste is found in the residual waste stream even where extensive separate waste collection schemes are in place [2]. Around 1%–2% of the population also admitted to fly tipping garden waste into the local environment (illegal practice) despite the availability of free collection services and a nearby bring site. While there are known issues with the accuracy and reliability of self-reported waste management behaviours in surveys of this type [37,38], it is interesting that participants felt able to acknowledge this choice. This suggests a proportion of material is disposed of by these routes; however, actual quantities could not be determined in this work.
Out of the 178 interviewed rural households, two households (=1.1%) indicated no relevant garden waste generation and not making use of any of the four disposal routes included in Figure 1, but both admitted to occasional fly tipping some garden waste into the local environment. Out of the 354 interviewed urban households, 16 (=4.5%) indicated no relevant generation of garden waste and not making use of any of the four disposal routes included in Figure 1; of these, 14 indicated they occasionally put some green waste into the residual waste bin, one admitted to occasional fly tipping, and one indicated discarding some green waste on an allotment. These garden waste quantities were not quantified in this work; the two rural and 16 urban households which did not use any of the four disposal routes shown in Figure 1 are methodologically included in the following analysis with zero garden waste arising.
3.2. Quantities of Garden Waste Subjected to Home Composting
The weight of garden waste home composted by those using this method was on average 0.86 kg hh−1 day−1 (standard deviation (SD): 0.99) and 0.32 kg hh−1 day−1 (SD: 0.32) for rural and urban locations respectively (Table 2). The high standard deviations are again because the means are skewed by a small number of households with significantly higher quantities than most others (Figure 2). In the present study, the medians for composted garden waste were 0.50 and 0.19 kg hh−1 day−1 for rural and urban households respectively, i.e., 50% of rural households using this practice composted at least 0.50 kg hh−1 day−1 and 50% of urban households using this practice composted at least 0.19 kg hh−1 day−1.
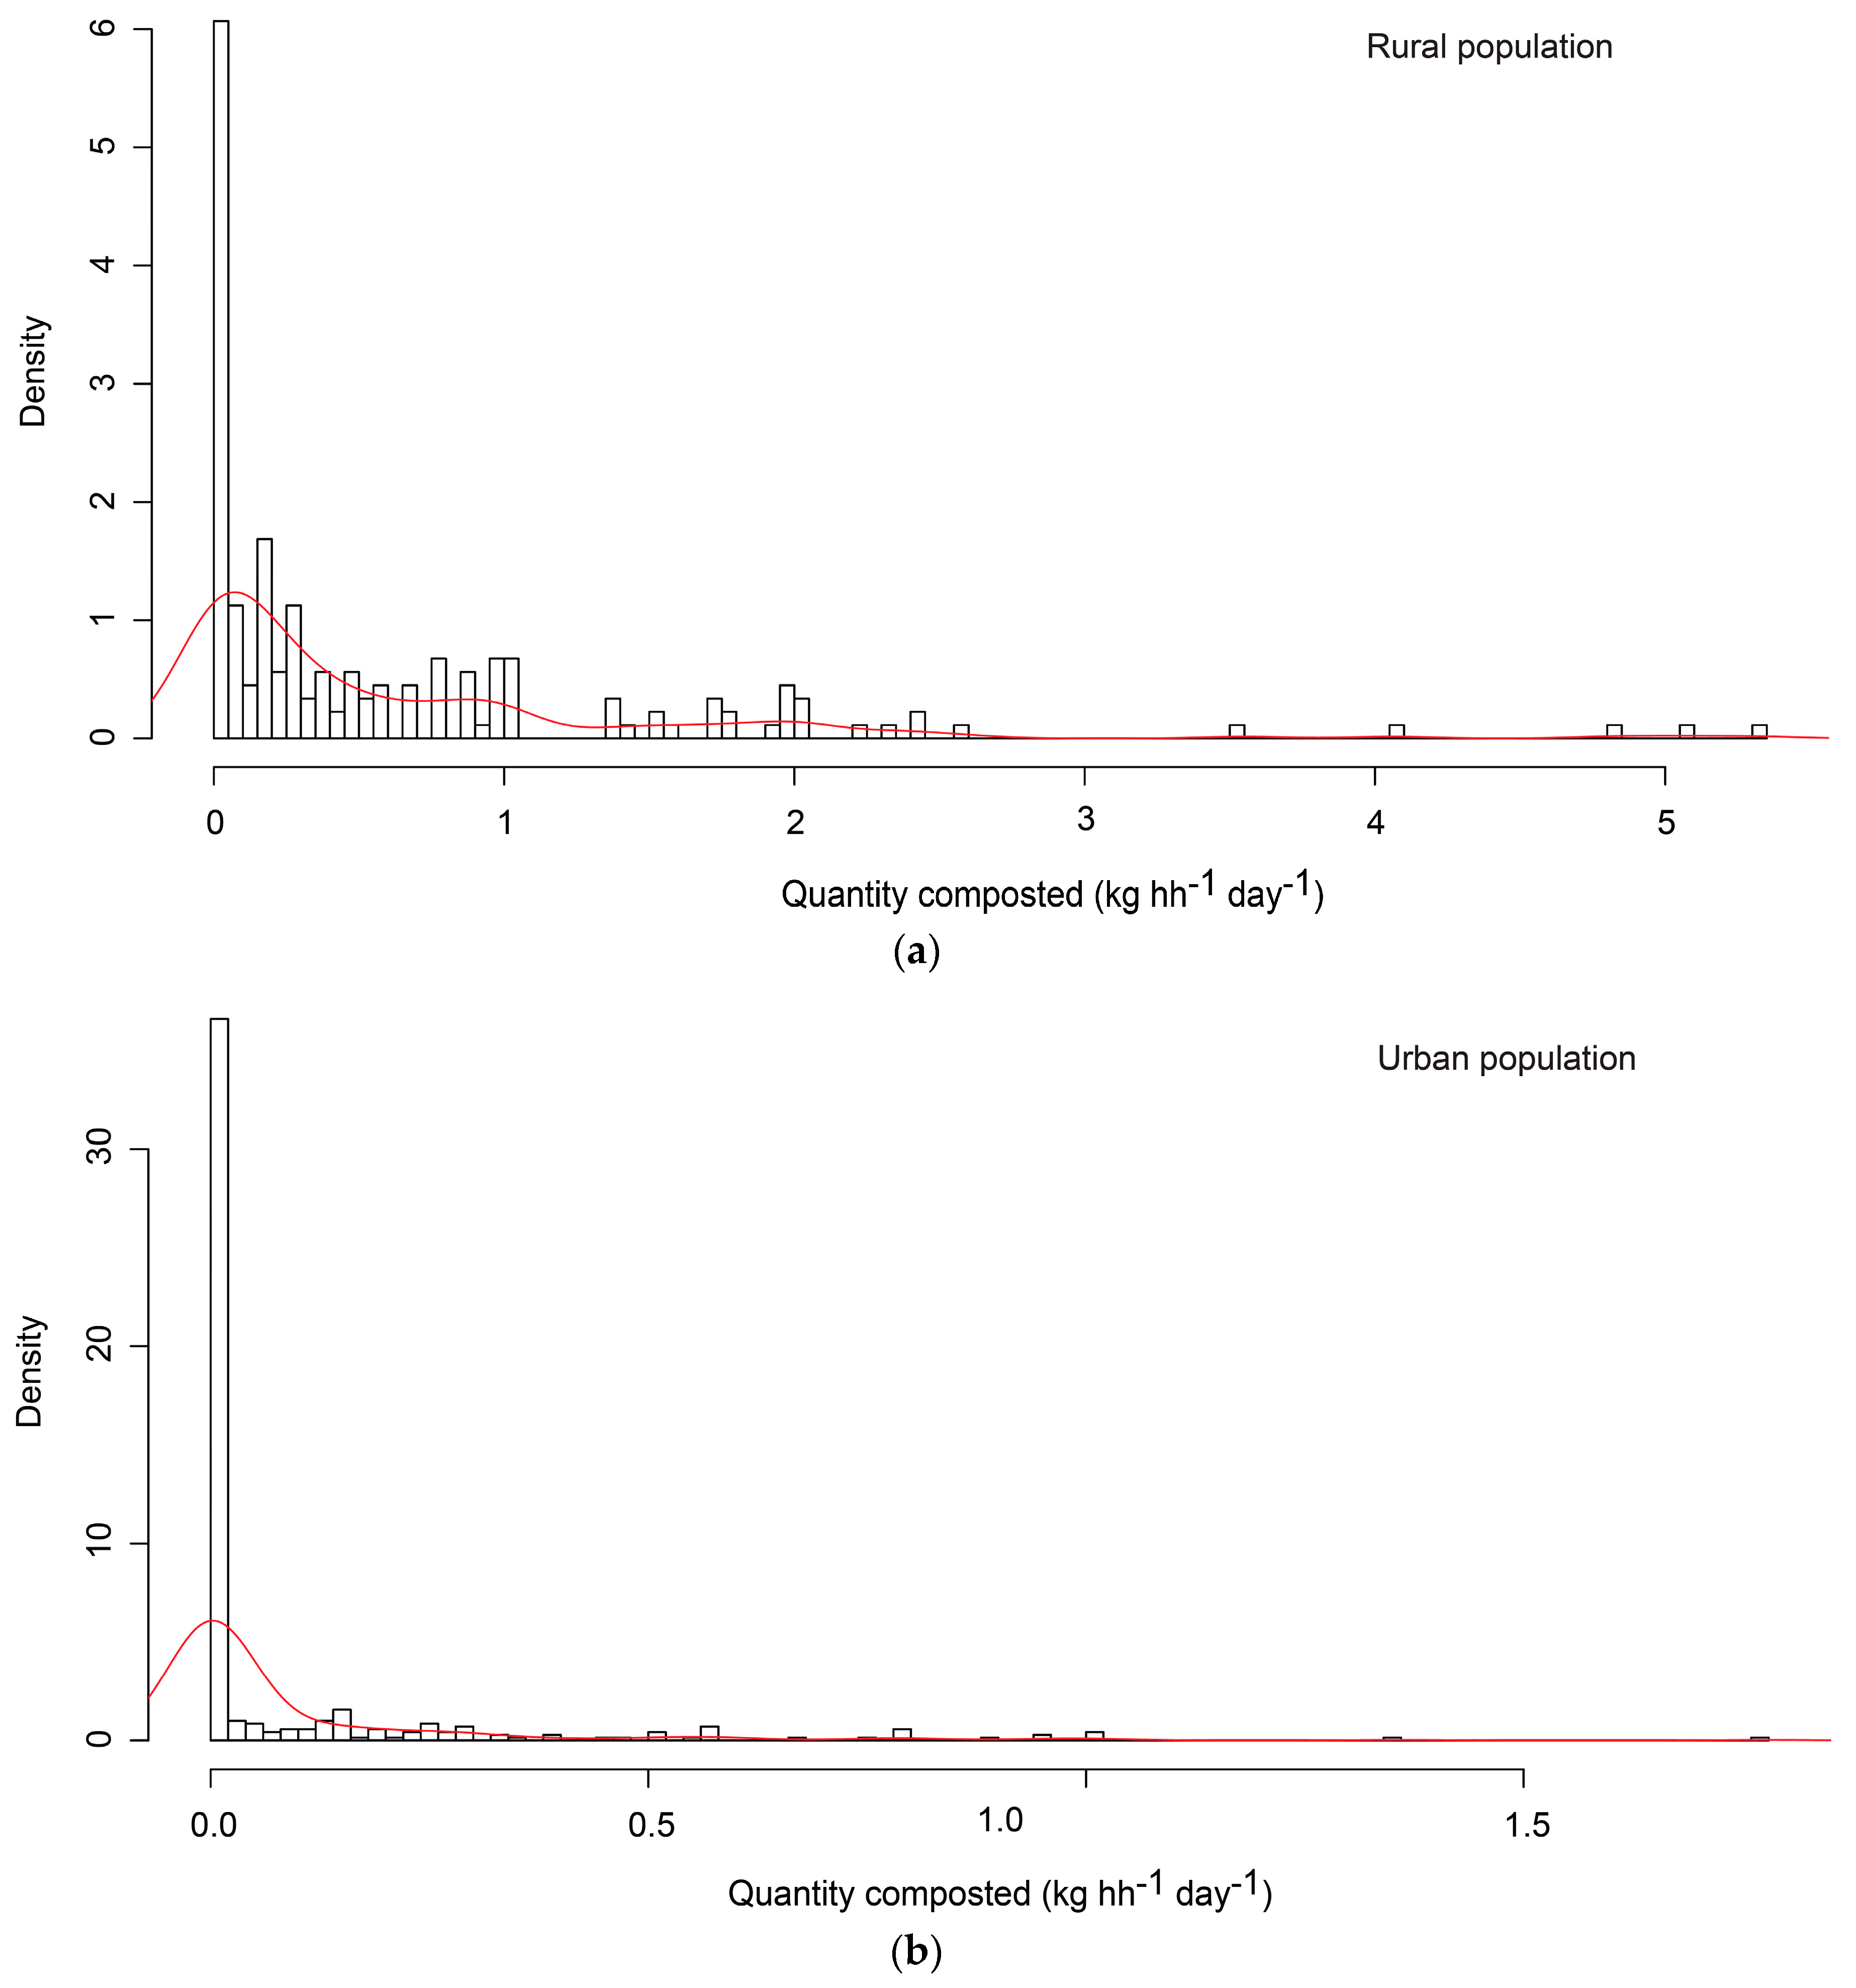
According to the data presented above in Section 3.1, 71.9% of rural households made use of home composting, but only 27.4% of the urban households used this method. When non-composting households are included, the average for the surveyed rural and urban populations was reduced to 0.63 kg hh−1 day−1 (SD: 0.93; median: 0.26) and 0.09 kg hh−1 day−1 (SD: 0.22; median: 0 because <50% of urban households composted at all).
When looking at the distribution of quantities among the set of rural and urban households, shown in Figure A3 (Appendix B), it is evident that no distinct pattern of distribution was present. High variations of data at a household level are also reported elsewhere in literature [6]. Interestingly, the level of experience was not found to be a significant factor to explain the different quantities of garden waste composted: Davey et al. [39] confirmed that households new to home composting can achieve levels of performance comparable to experienced home composters within just few months.
By analysing waste management statistical data, Parfitt [6] determined that those households which make use of home composting in the UK on average divert away 160 kg garden waste hh−1 year−1 from the collection schemes of the waste management authorities. This is lower than the results of this study: taking into account that in England 37% of the households practicing home composting are rural while 63% are urban (see Section 3.1), the weighted average of the present data suggests that those households which practice home composting on average compost 0.52 kg hh−1 day−1, or 190 kg hh−1 year−1. Interestingly, Davey et al. [39] after analysing data over several years identified that the amounts of garden waste home composted remained largely unaffected by changes in the garden waste collection schemes offered by the authorities, including the introduction of separate kerbside garden waste collection; they concluded that garden waste collections tend to complement rather than compete with home composting.
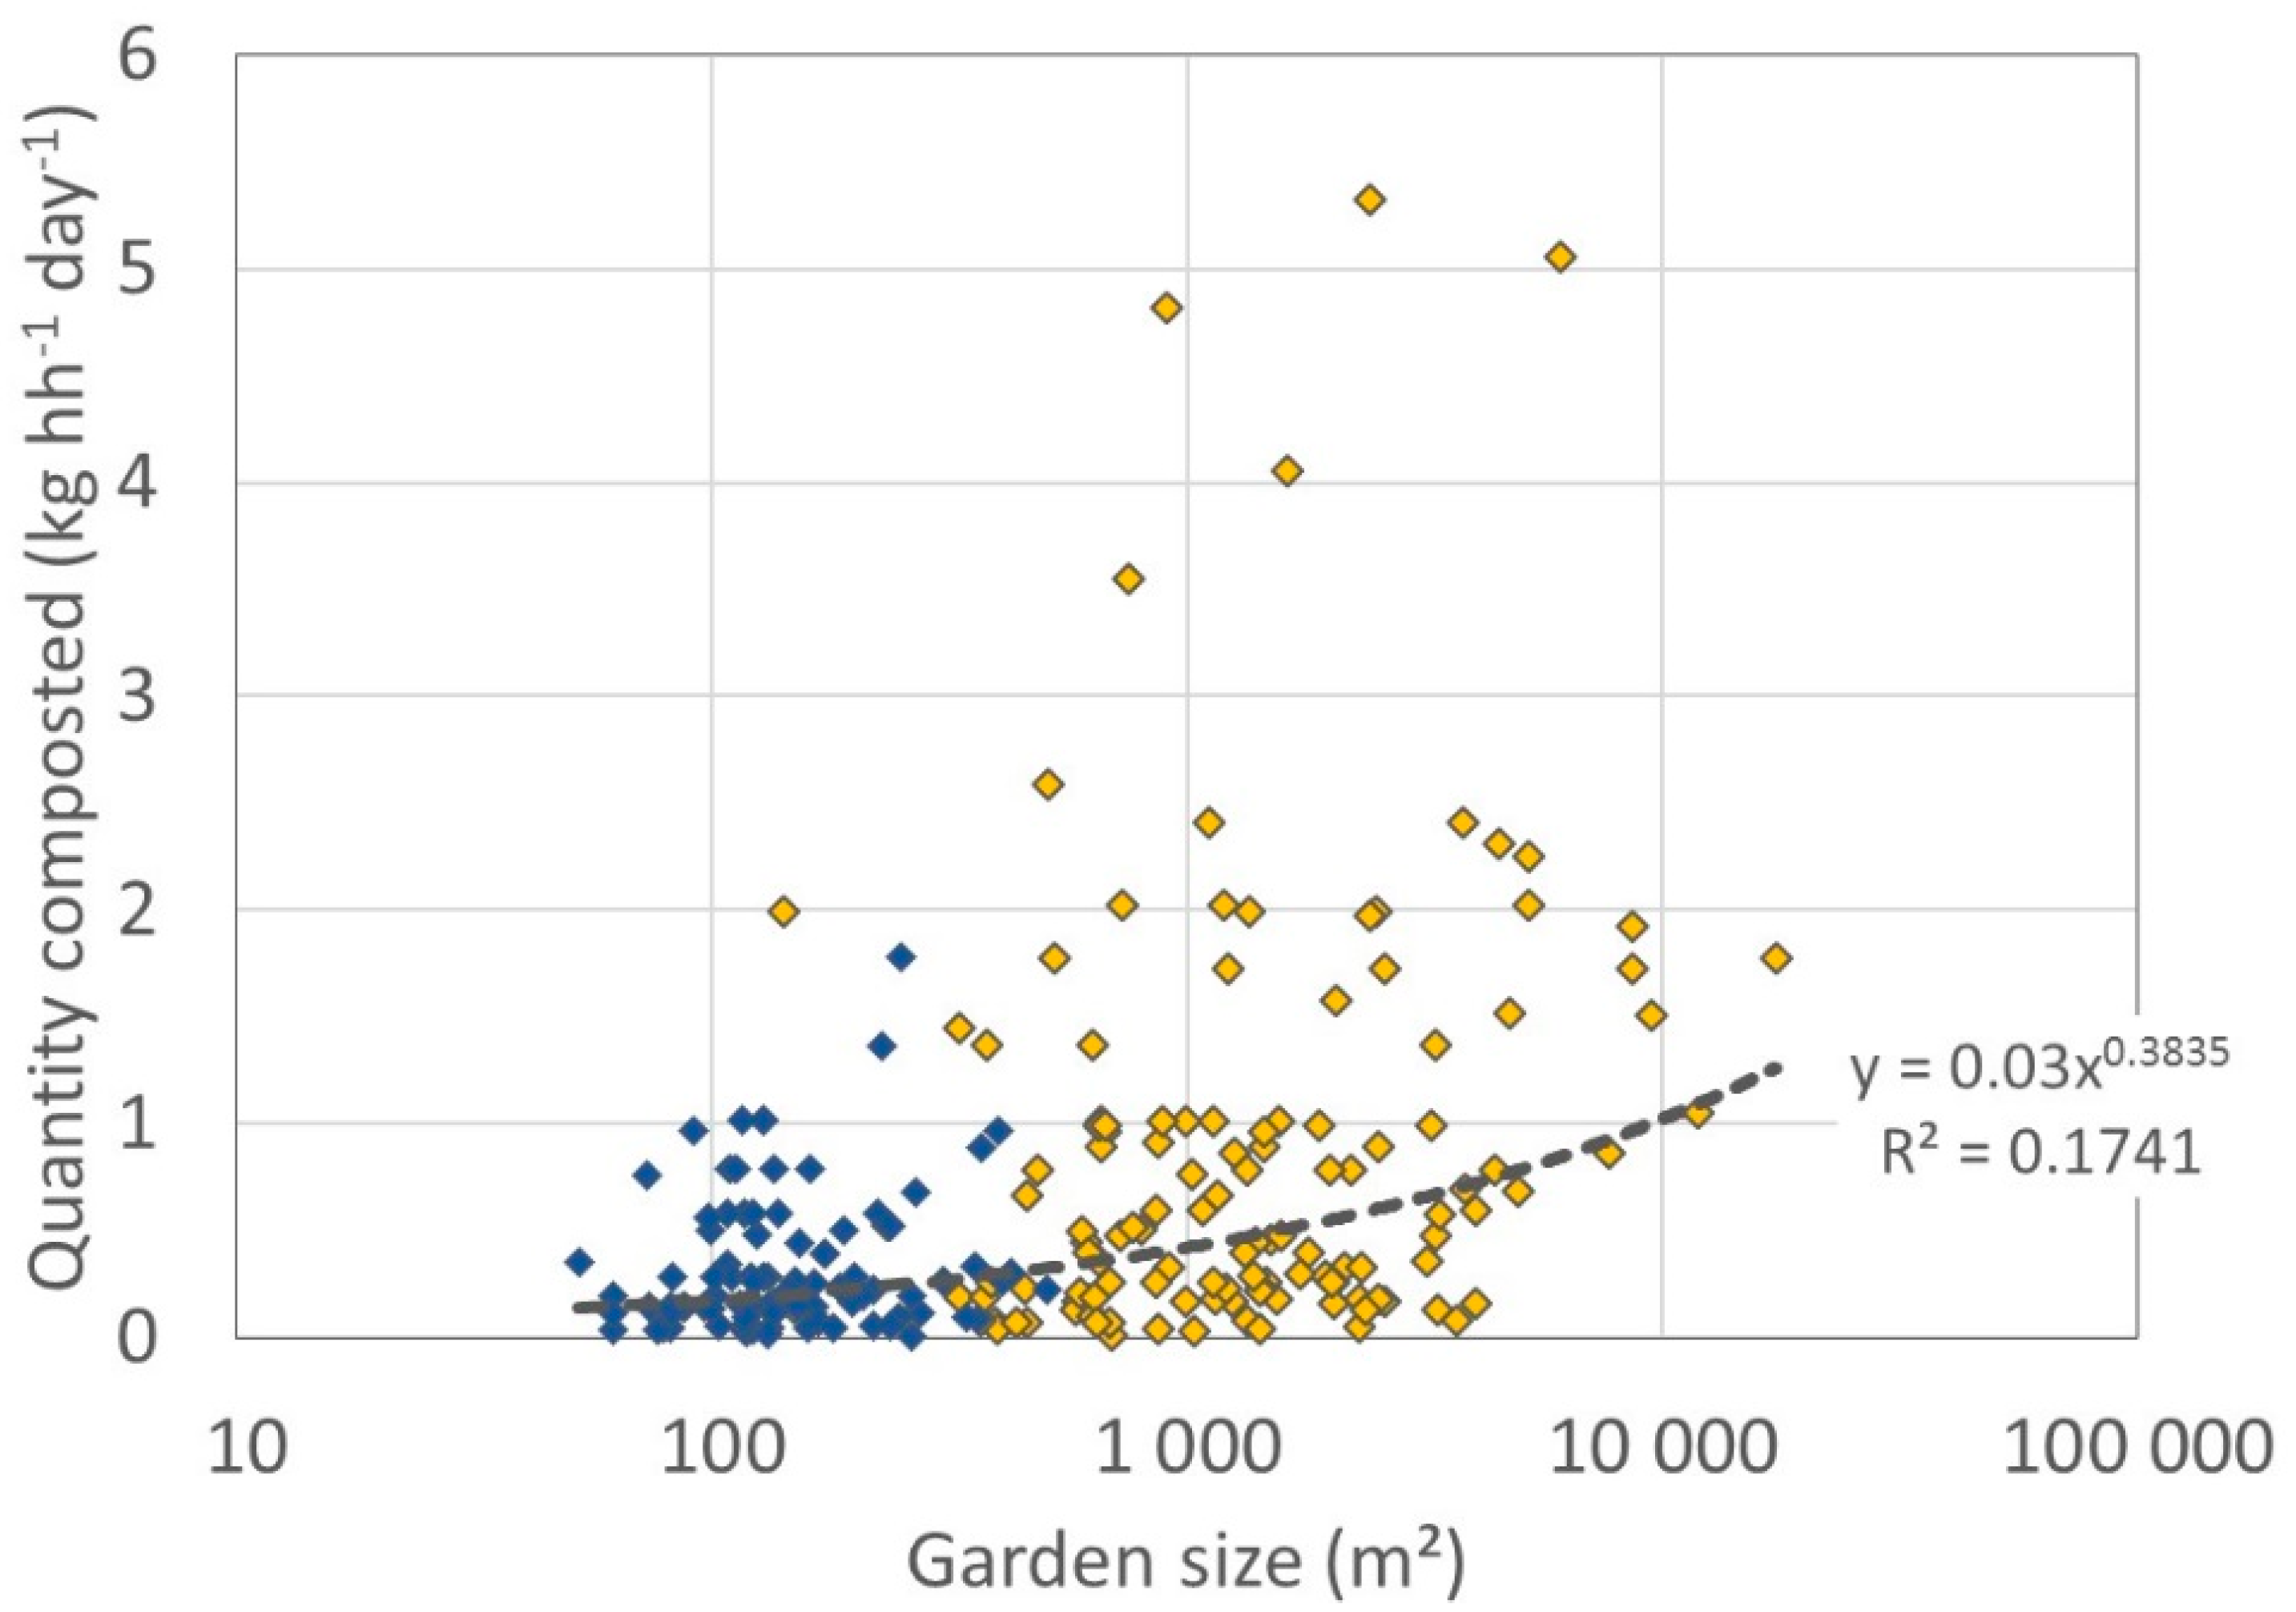
It has been reported that composters tend to be affluent, older, with large gardens and a higher interest in gardening [36]. Parfitt [40] identified that the garden size of experienced home composting households was on average 100 m2 larger than other householders. Figure 2 shows a scatter-plot of garden size against the quantity of garden waste home composted by individual households. Garden waste home composting tended to be more common with increasing garden size, which is in agreement with the literature, but there was wide variation in individual quantities composted. The coefficient of determination (R²) of the regression was low (<0.2). Therefore, according to these results, knowledge of the garden size does not allow making a reliable estimation of the quantities of garden waste subjected to home composting by private households. Possible reasons for this phenomenon are discussed in Section 3.8.
Another interesting observation can however be made in Figure 2: The variation of the data for composted quantities increased among the properties with larger garden sizes, and in particular among properties with garden sizes >1000 m² for the rural data set and >100 m² for the urban data set. This suggests that garden waste practices strongly differed especially among properties with larger garden surfaces. Thus, the variations among the properties with large garden surfaces are identified as a factor to explain the high standard deviations and the significant difference between mean and median values mentioned above.
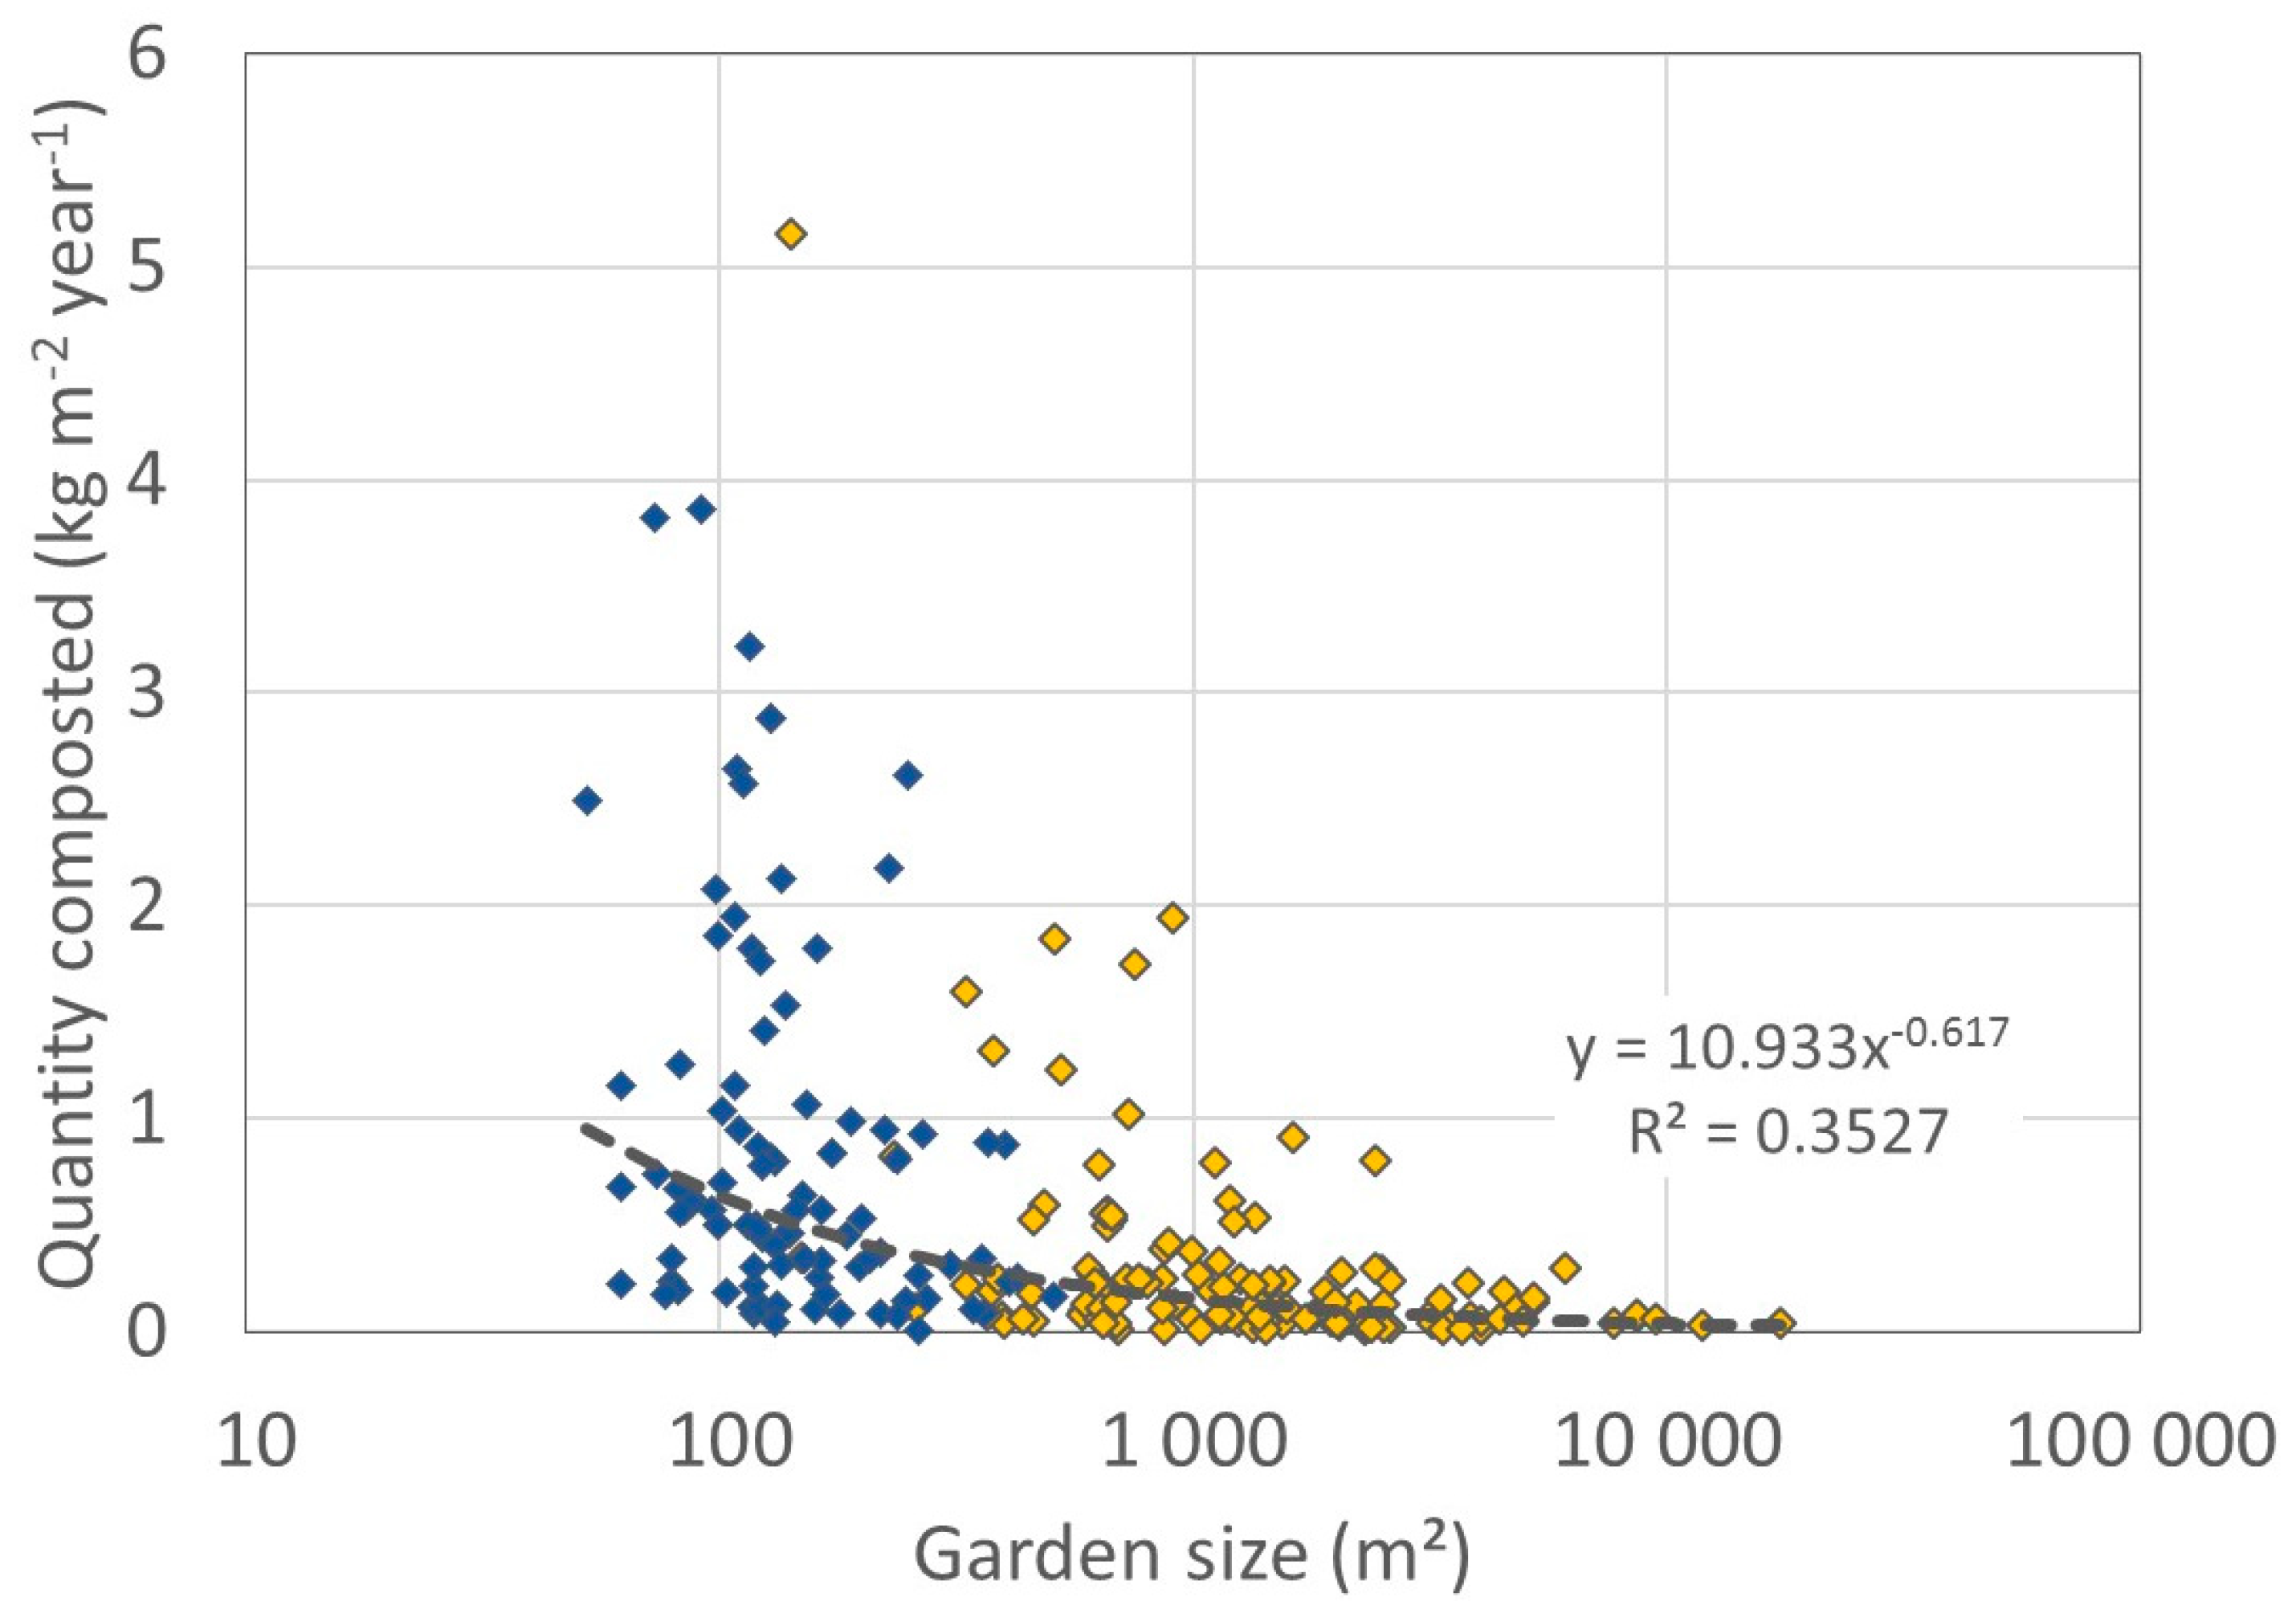
Per unit of garden size (kg m−2 year−1), the composted quantities also showed significant variations (Figure 3). As a tendency, it was observed that large properties composted less quantity per unit of garden surface available to them, but the coefficient of determination (R² = 0.35) is still quite low. On average, among the households using this disposal method, rural properties composted 0.30 kg m−2 year−1 (SD: 0.56; median: 0.12) and urban properties 0.85 kg m−2 year−1 (SD: 0.87; median: 0.56). In an experimental study using three model gardens and typical gardening practices in Portugal, Machado et al. [20] obtained values for garden waste production of 0.95 kg m−2 year−1 (for a garden area of 379 m²) and 1.03 kg m−2 year−1 (garden area of 200 m2). Home composting was the only garden waste disposal method considered in their study; but these results are reasonably close to the value for urban properties (mean garden size 144 m2) obtained in this work. Machado et al. [20] also noted that the quantity produced for composting per unit area of garden increased for a smaller garden size: the smallest garden of 45 m2 produced 3.24 kg m−2 year−1, similar to the highest values obtained for small gardens in this study (Figure 3). In a household-level analysis of UK home composting Davey et al. [39] looked at the effect of garden size, but did not provide detailed data or results for compost production per unit area. The general lack of information on this topic and the support provided by these results for the findings of Machado et al. [20] confirm the value of the data from the current study.
3.3. Burning of Garden Waste in the Backyards
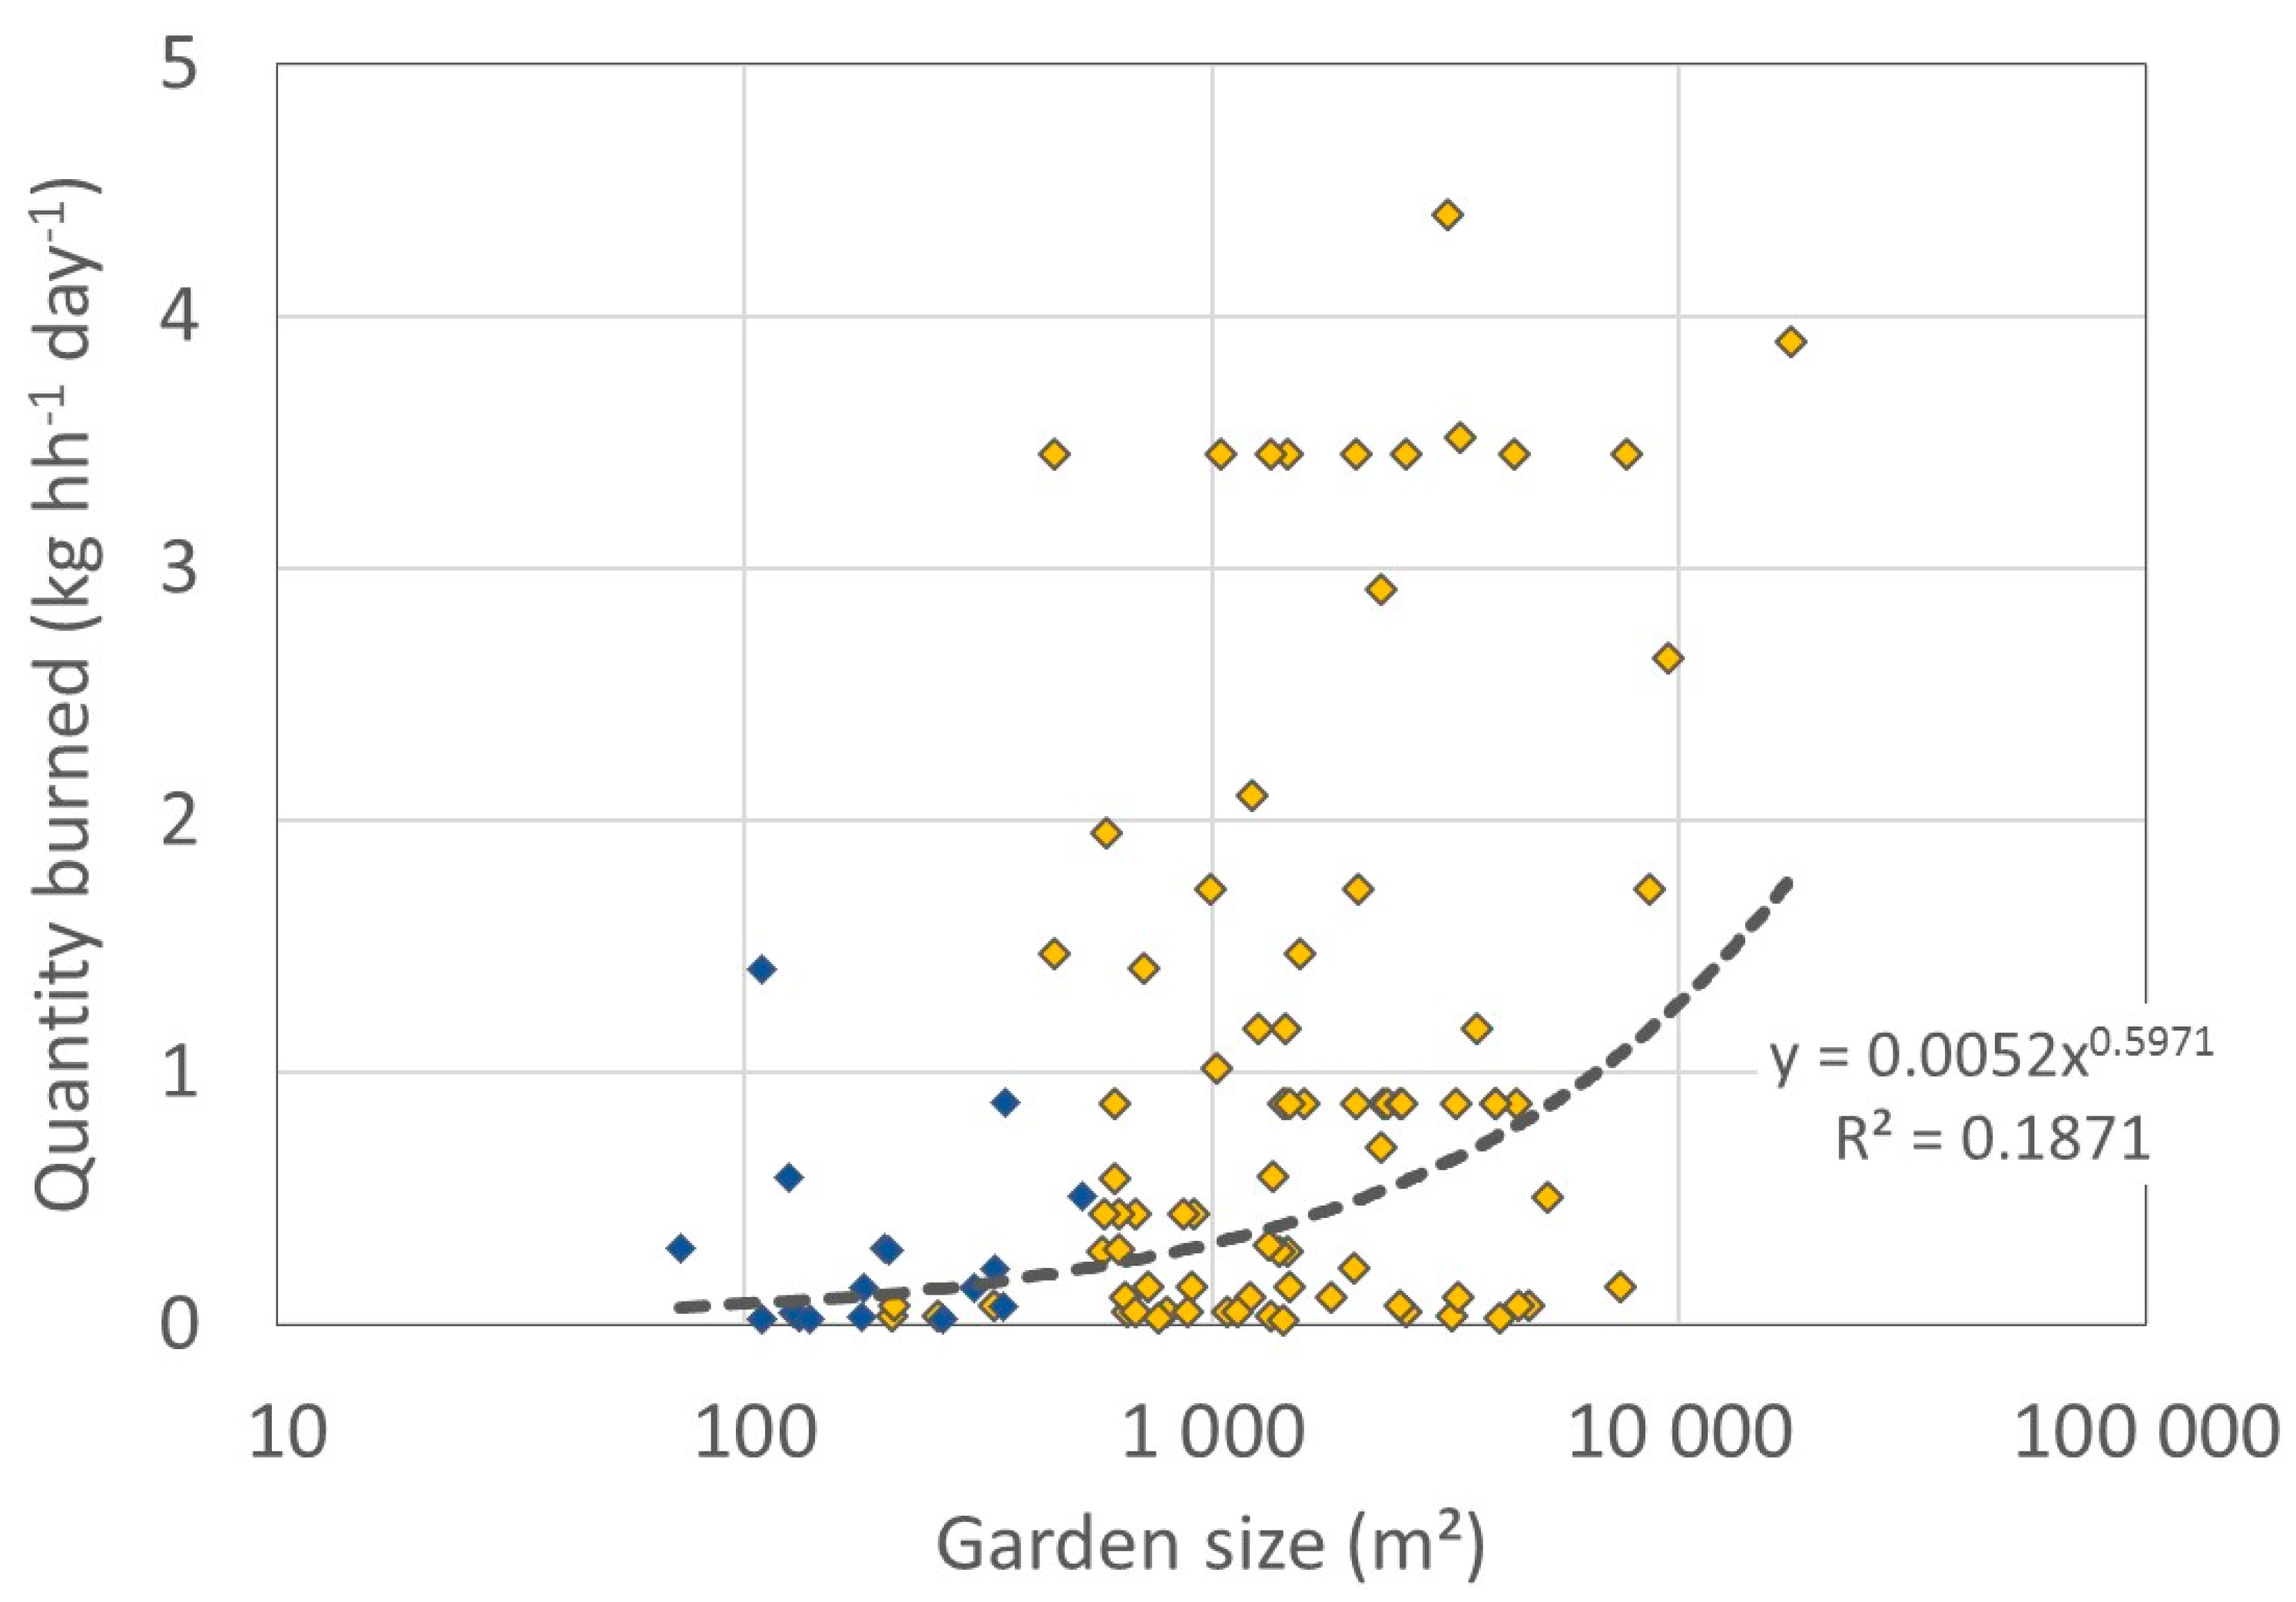
A similar trend was observed in the quantity of garden waste burned by householders using this method (Table 3, Figure 4), with average values of 1.03 kg hh−1 day−1 (SD: 1.19) and 0.27 kg hh−1 day−1 (SD: 0.36) for rural and urban populations using this method respectively. Again, the high standard deviations show that the means are skewed due to some households with quantities significantly higher than the average. The medians were 0.59 and 0.15 kg hh−1 day−1 for rural and urban households using this method respectively, i.e., 50% of rural households using this practice burned at least 0.59 kg hh−1 day−1 and 50% of urban households using this practice burned at least 0.15 kg hh−1 day−1.
Only 6% of urban households burned some of their garden waste, but slightly more than 50% of rural households followed this practice (see Section 3.1). When households which do not burn their garden waste are included in the analysis, the quantity disposed of by this route on average is 0.47 and 0.01 kg hh−1 day−1 for rural and urban households respectively.
Again, from Figure 4 it can be concluded that there is no distinct correlation between garden size and the quantity of garden waste subjected to this treatment method. Therefore, no reliable prediction of the garden waste quantities diverted to backyard burning is possible based on the garden size. The variation is again particularly high among properties with large gardens. Backyard burning of garden waste is legal, however, it is worth pointing out that the quantities burned are significant in some households; here, significant potential for environmentally sound valorisation of organic waste remains untapped.
3.4. Kerbside Collection Data Analysis
A total of 75.5 and 72.3 tonnes of garden waste were collected annually in kerbside collections from the rural and urban study areas respectively (equivalent to an average of 3280 kg and 3143 kg per fortnightly collection). The quantity discarded per household was expressed as the average daily load based on the fortnightly collections data (Table 4). This equated to 0.88 and 0.34 kg hh−1 day−1 for those households in the rural and urban collection areas which used this service. Incorporating all households including those not using the kerbside collection scheme, an average of 0.69 kg hh−1 day−1 was discarded through this route in the rural survey area and of 0.28 kg hh−1 day−1 in the urban survey area.
3.5. Garden Waste Quantity Delivered to the Recycling Centre
During the 12 month survey period each site user who used the HWRC for garden waste disposal contributed an estimated average load of 37.1 kg per visit (Table 5). The average frequency of visits was every 48.4 days, with visits being most frequent in December and March, and least frequent in January and April. For each month, the average daily load equivalent deposited per site-user was estimated; this was averaged over the whole year and gave an average load of 0.77 kg hh−1 day−1 (assuming that one user represents one household). No strong seasonal pattern was observed, which is in agreement with Boldrin and Christensen [21].
The householder survey indicated that 23.0% and 33.3% of rural and urban households respectively used HWRCs regularly for garden waste disposal. It can therefore be estimated that when including those households which do not make use of this service, the rural population disposes of around 0.17 kg hh−1 day−1 whereas the weight for the urban population is 0.26 kg hh−1 day−1.
3.6. Aggregated Results: Garden Waste Arising of 715 kg per Year for Rural and 233 kg for Urban Households
The total quantity of garden waste produced was estimated by aggregating the information collected in the door-to-door interview survey, analysis of kerbside collections, and the HWRC analysis (quantities put in the residual waste bin or disposed of through fly tipping could not be quantified). Table 6 shows the weight (kg) per household, disaggregated for the rural and urban population, and Table 7 amends the statistical data. The average generation rates were 1.96 ± 1.35 kg hh−1 day−1 for rural and 0.64 ± 0.46 kg hh−1 day−1 for urban households respectively. This corresponds to an average annual arising of 715 ± 492 and 233 ± 167 kg per household at rural and urban properties.
It is interesting to note that, based on this method of estimation, 84% of the garden waste generated in the urban environment entered the services operated by the waste management authorities (kerbside collection, drop-off at recycling centre), but only 44% of the quantities generated in the rural area (Table 6). More than half of all rural garden waste was subjected to self-sufficient methods (home composting and backyard burning). This result shows that especially in rural regions there exists a significant difference between garden waste generated and garden waste entering the official disposal routes.
Several factors might explain the more common use of home composting and backyard burning among rural households. The larger garden size (median of 1055 m² for rural compared to 121 m² for urban properties), with in consequence longer distances between properties means less risk of causing nuisance due to odour or burning fumes to the neighbours. Furthermore, it is likely that this is due in part to the greater volume of garden waste generated by rural households, combined with the limited capacity of wheeled bins and the frequency of the collection service. The average volume generated by rural households over a fortnightly period could total 130 L, based on an average generation rate of 1.96 kg hh−1 day−1 and a volume-to-weight conversion of 0.21 [33]; but seasonal or week-to-week variations mean that the available 140 L wheeled bin will not always have sufficient capacity.
When the means of 1.96 kg hh−1 day−1 for rural and 0.64 kg hh−1 day−1 for urban households are weighted to represent Test Valley’s population distribution of 35.1% rural and 64.9% urban citizens, the overall average garden waste generation rate is 1.10 ± 0.88 kg hh−1 day−1. For Hampshire with a share of 21.8% rural population, the average garden waste generation rate can be estimated at 0.92 ± 0.75 kg hh−1 day−1. When considering only the quantities going to services operated by the waste management authorities, the average garden waste arisings would be 0.65 kg hh−1 day−1 in Test Valley and 0.60 kg hh−1 day−1 in Hampshire.
In the survey area, no properties on the chosen collection routes had no garden. Therefore, the values estimated for rural and urban areas refer to properties which have access to a private garden. These values are correct for the studied Test Valley area, and are probably reasonably representative for Hampshire; but care is needed in extrapolating the data to other parts of UK where garden provision may be less widespread, especially in different types of cities [34]. Where local data for a specific city about the share of households which have a private garden are available, the data can be used accordingly. For England, an estimation is made in the following section.
3.7. Estimations for England: Average Annual Arising of 288 kg Garden Waste per Household (120 kg per Person)
In England, the population consists of an estimated 16.5% rural households with garden, 73% urban households with garden and 10.5% households without garden (mainly urban) (see Section 2.5). Using the average garden waste generation rates of 1.96 ± 1.35 kg hh−1 day−1 for rural and 0.64 ± 0.46 kg hh−1 day−1 for urban households, the calculated average garden waste arising in England amounts to 0.79 ± 0.67 kg hh−1 day−1. This corresponds to an annual arising of 288 ± 244 kg garden waste per household. When considering only the quantities going to services operated by the waste management authorities, the average garden waste quantity can be estimated at 0.54 kg hh−1 day−1.
The garden waste generation rate of 0.79 kg hh−1 day−1 found in the current study for England is somewhat higher than the estimates of 0.68 kg hh−1 day−1 based on the studies by Parfitt [25] and Defra [26], which used a different methodology. The difference may be accounted for by the fact that the earlier studies did not take account of the burning of garden waste, while home composting estimates were based on the number of compost units distributed by a local authority. Based on the results of this study, the fraction of garden waste burned at home corresponds to 0.09 kg hh−1 day−1 or 12% of the total garden waste stream in England; this may be significant if changes in collection service provision or charges lead to changes in household practice. The methodologies developed in the current work are therefore potentially useful in providing a more detailed breakdown of the categories and routes chosen by householders to dispose of their garden waste.
Considering the average household size (2.4 persons) in England, the average garden waste generation of 0.79 kg hh−1 day−1 determined in this study corresponds to a per capita arising of 0.33 kg person−1 day−1, or 120 kg person−1 year−1. The estimated quantity of 0.54 kg hh−1 day−1 entering the collection schemes operated by the authorities corresponds to 0.23 kg person−1 day−1, or 84 kg person−1 year−1. For households in Denmark, Boldrin and Christensen [21] determined a per capita garden waste quantity of around 110 kg person−1 year−1 at private households, but this included only those quantities which entered the official waste collection schemes operated by the authorities. The results of this study for England are comparable to the quantity determined for Denmark, but the results also highlight the need to consider those quantities which do not enter the official collection schemes.
3.8. Garden Size Is Not a Reliable Parameter to Predict Garden Waste Generation
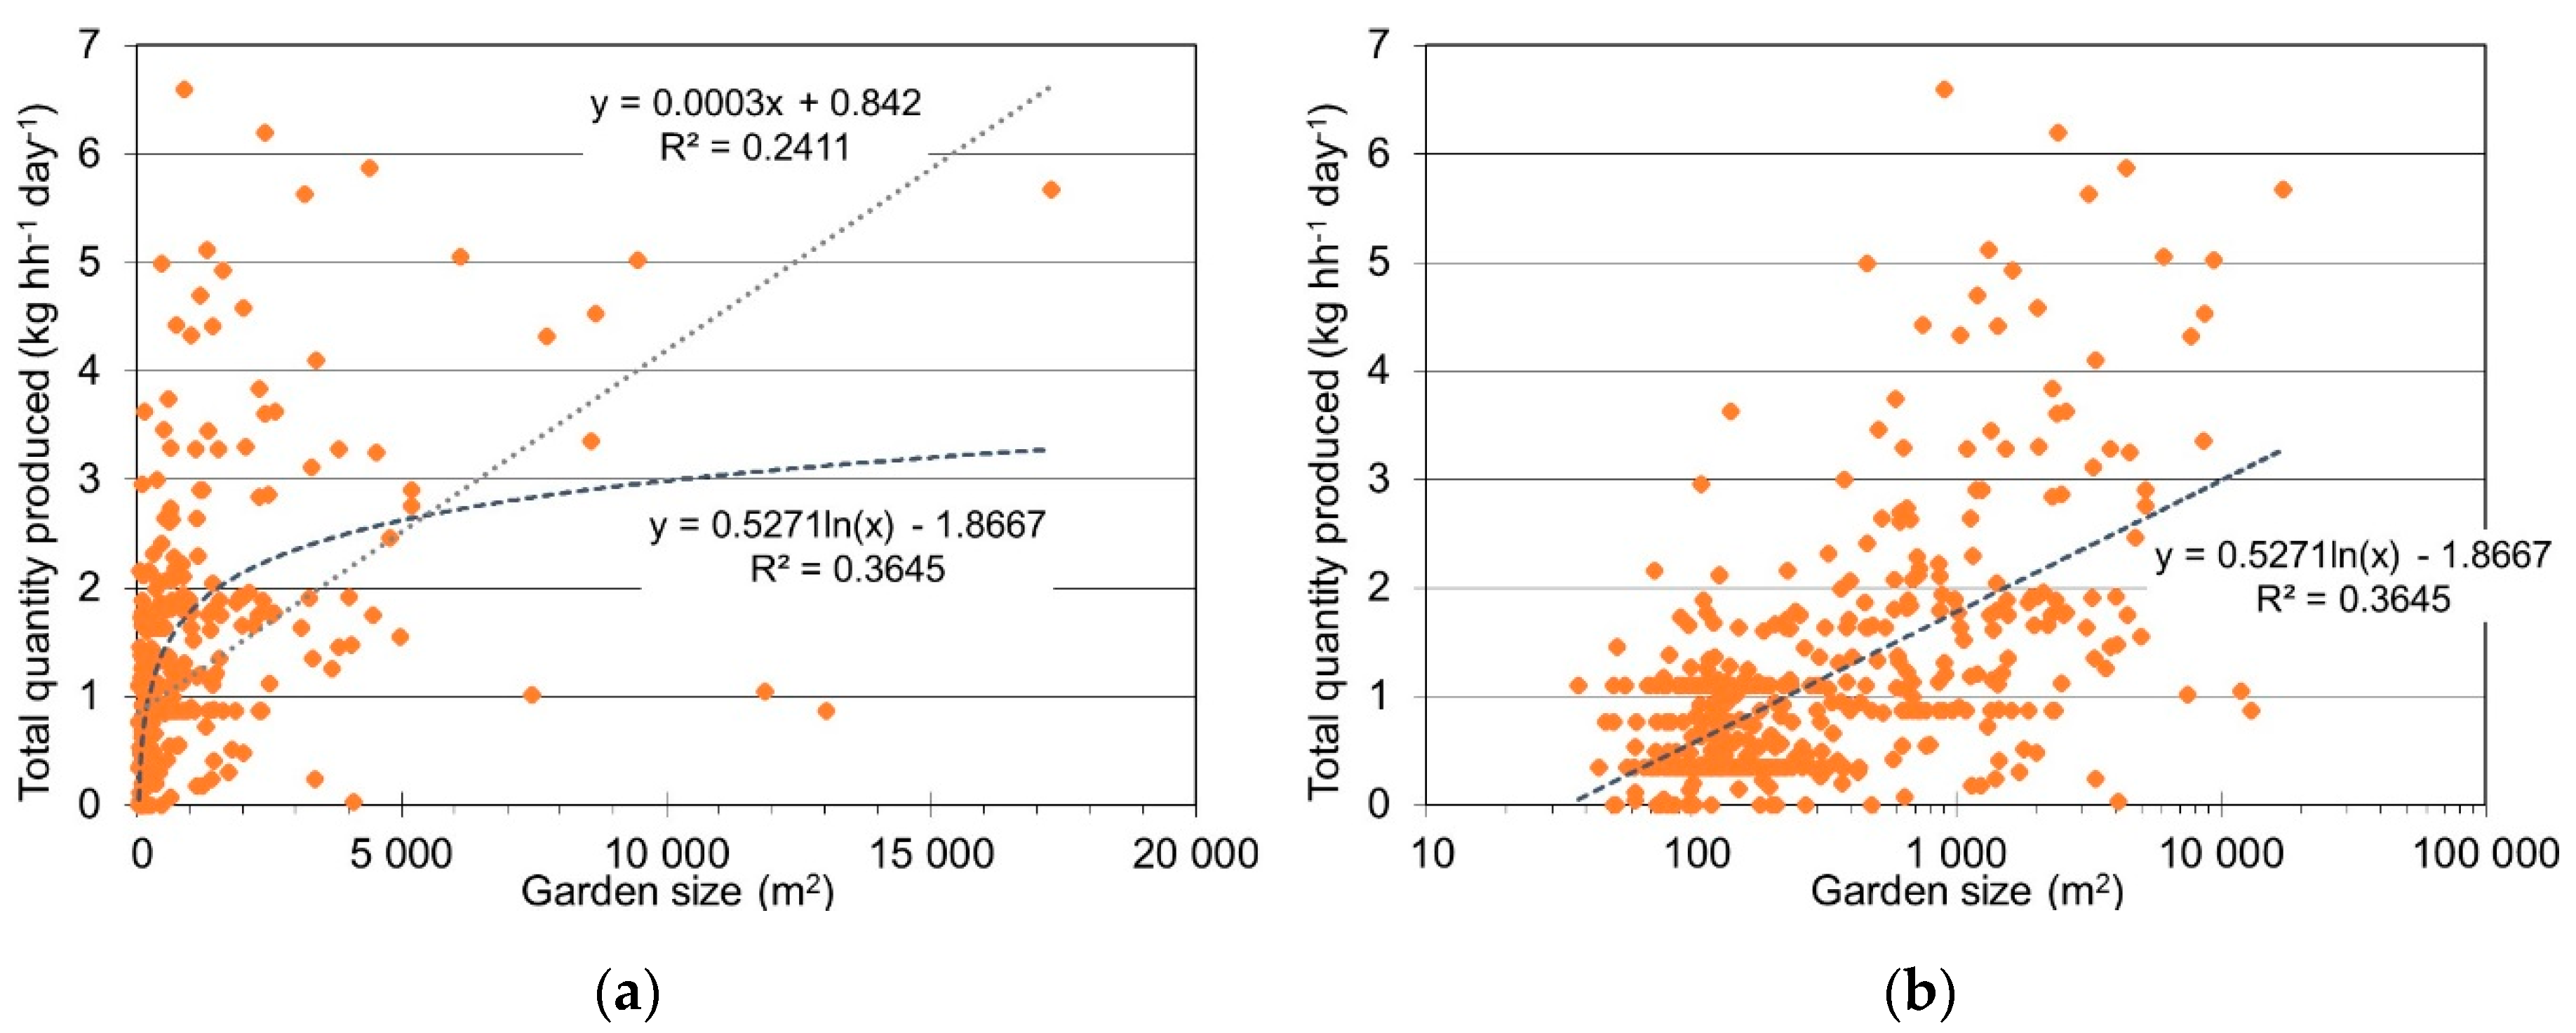
For the households surveyed in this study, the generation of garden waste was also expressed as a function of garden area using data on quantities generated per household and the respective garden size (Figure 5). As expected, there was in tendency a positive relationship between these parameters, but the degree of variability (low coefficient of determination) makes garden size unsuitable as a predictor for estimating the quantity of garden waste produced at a household or small-scale level. The variability was particularly high among properties with large gardens.
Per unit of land available to them, rural properties in the surveyed area generated on average 0.81 ± 0.99 kg m−2 year−1, while urban properties generated 1.89 ± 1.65 kg m−2 year−1 (the median values were 0.48 kg m−2 year−1 for rural and 1.32 kg m−2 year−1 for urban properties). These differences may be explained by the fact that in large gardens there are often areas that are less cultivated, or where residues such as grass cuttings or fallen leaves are left to decompose in place rather than being gathered. Conversely, urban householders with relatively small gardens tend to gather the majority of residues and dispose of them in order to maintain a tidy garden. It must be noted when making these comparisons, however, that the outdoor areas associated with each property are not always cultivated but may include drives, hard standing patio areas, decks, and other amenity features. In this research based on the use of digitised maps these could not be distinguished, but the methodology could be adapted to make use of the detailed aerial images which are increasingly available. While this might show the existence of a closer relationship to individual garden size than was found in the present work, it is likely that the variation in generation rates (shown by the high standard deviations) also simply reflects differences in practice by the individual householder.
Machado et al. [20] also concluded that per unit of garden area available to them, smaller gardens generated significantly larger quantities of garden waste. For Portugal, they suggested an expected arising of 3 kg m−2 year−1 for gardens of <45 m2, 1 kg m−2 year−1 for 45–200 m², 0.95 kg m−2 year−1 for 200–1000 m², and 0.6 kg m−2 year−1 for garden sizes of >1000 m². The values obtained in the current study (1.89 kg m−2 year−1 for urban properties with an average garden size of 144 m² and 0.81 kg m−2 year−1 for rural properties with on average 1836 m²) are slightly higher than those proposed by Machado et al. [20]; however their research was based on a very small number of examples (three properties), all practicing the philosophy of sustainable gardening, and the authors note that under such practices the waste arising might be lower than for standard gardening practice. Machado et al. [20] also highlight the lack of available data on garden waste arisings and the challenges of quantifying quantify this material stream; but argue in favour of estimating garden waste quantities based on the garden surface area, even though in their work the possible correlation was clearly shown not to be linear.
In contrast, Davey et al. [39] used multiple regression methods to verify and extend household-level models for garden waste diversion, with data sets from up to 875 households. Variables considered included garden area in total and broken down into areas occupied by flowerbeds, lawn, vegetable patches, hedges/shrubs, built structures and hard standing, on the basis of visual observations. It was reported that the quantity of compostable garden waste presented for collection and the amount present in the residual waste bin both showed some positive correlation with the area of lawn and flowerbeds, and negative correlations with the area of hard standing. The results also indicated that, as expected, households with gardens of <200 m2 diverted less than those with gardens >200 m2; but no further analysis of production per unit area was reported, and the findings do not appear to offer clear support for the concept of using garden area as a predictor of the quantity of compostable garden waste.
The results of the current study, in particular the high standard deviations found (high data variability), strongly support the view that garden surface area alone does not represent a reliable parameter for prediction of garden waste arisings. More reliable estimations may be possible when gardening practices and the characteristics of properties and amenities are taken into account, although there will be a correspondingly sharp rise in the requirement for supporting data. Caution is due when interpreting data from a few households, as extrapolation from such findings carries a high risk of error. With 1139 surveyed households, the present study had a relatively large data set; nevertheless, the results reveal that more details are required to decide whether the hypothesis of a correlation between garden size and garden waste generation merits further attention under a more complex approach or has to be rejected as falsified.
3.9. Relevance of Findings and Recommendations
Based on analysing garden waste management practices at more than 1100 households, this work quantified garden waste arisings and elaborated a detailed breakdown of the quantities disposed of via the different waste management routes. The data contribute towards filling an important knowledge gap and can be used to support local authorities in the design of more effective waste valorisation strategies, along with more precise monitoring and calculation of waste indicators.
The results show that there is a considerable difference between the quantity of garden waste collected by waste management authorities and the total quantity of garden waste generated. This difference is particularly high in rural areas, where households frequently adopt self-sufficient methods of garden waste management. Home composting and backyard burning are both very common practices; among the surveyed rural households, 57% of garden waste managed by self-sufficient means was composted by the households while 43% was burned on the property. Home composting is considered a sustainable practice to valorise organic material at a local scale and at the same time decrease the waste quantities to be managed by the authorities [41,42]. Home composting has the potential to reduce the quantity of municipal organic waste in Europe by up to 50% [42]. In the studied area, no separate charge was levied for any of the garden waste disposal services, and the households made their disposal choice without being incentivised through waste fee schemes. Self-sufficient waste management practices can be fostered by charging separate fees for services such as kerbside collection of garden waste. The results of this study suggest, however, that the effect of such a fee-based incentive might not necessarily be the more frequent adoption of home composting. Especially in rural areas, households are almost equally likely to adopt backyard burning practices. While this is legal, it is not a favoured choice under environmental sustainability and public health criteria [43]. Home composting valorises garden waste into a useful soil conditioner, but this is not the case when burning the material. The generated smoke also creates air pollution and nuisance [43]. Backyard burning requires no investment, however, while the capital cost for composting is an important reason for drop-out for some citizens [44]. This suggests that waste management fees alone are not likely to be effective in encouraging sustainable forms of self-sufficient waste management practices.
Considerable differences were found between rural and urban households. Less than one third of urban households with a garden practiced home composting. This suggests that there exists a high potential to increase home composting by encouraging such practice among urban citizens.
By combining measurement campaigns with door-to-door interviews, the methodology applied in this study enabled a high level of detail and the consideration of materials that usually remain unquantified, such as garden waste burned in in the backyard. Despite the value of this data, it should be noted that the approach and the work done have some limitations. One shortcoming was that the kerbside collection data could not be disaggregated to the single household level, because the refuse collection vehicles were not fitted with on-board weighing equipment; these garden waste quantities were therefore calculated as mean values using the weighbridge tickets of each collection round. Future research or application of the developed methodology in practice should use refuse collection vehicles equipped with on-board weighing and should record the individual weight of each emptied bin. Furthermore, the study revealed that some households put garden waste into the residual waste bin or practice illegal fly tipping into the local environment despite the availability of services such as separate kerbside collection, but the scale of these practices could not be assessed quantitatively. Future research should explore this context with priority.
4. Conclusions
Using data obtained from rural and urban households in the Test Valley district, the generation of garden waste arising from domestic properties within Hampshire was estimated to be 0.92 kg hh−1 day−1, and within England 0.79 kg hh−1 day−1. For England, this corresponds to an annual arising of 288 kg per household or 120 kg per person.
It was evident from the results that rural households produced more garden waste per household (1.96 kg hh−1 day−1 compared to 0.64 kg hh−1 day−1), but less per unit of garden land available to them. However, garden size was not a useful predictor in respect of garden waste generation at an individual or local scale. Particularly high variations in the quantities of garden waste generated per household, but also the quantities self-composted or burned, were observed among properties with larger garden sizes (>1000 m² in the rural and >100 m² in the urban area).
A similar proportion of householders in both the rural and urban case-study areas used the kerbside and HWRC services to dispose their garden waste. Rural householders, however, used home composting and burning to a much greater extent than urban householders. In the rural area, only 44% by weight of the generated garden waste quantity went to the services of the waste management authorities (kerbside collection, HWRC), while in the urban area this was the case for 84% of the generated garden waste quantity.
When designing waste management policies which encourage self-sufficient garden waste management, it must be considered that the citizen will not necessarily decide in favour of a sustainable home composting option. Backyard burning was nearly as frequent as home composting among rural households. Fly tipping into the local environment and disposal into the residual waste bin also occur. A significant untapped potential for home composting exists in urban areas, but accessing it will require the design of programmes tailored to the needs of urban households.
Author Contributions
Conceptualization, C.J.B. and S.H.; methodology, P.E., C.J.B., and S.H.; formal analysis, P.E., S.K.-B., and S.H.; investigation, P.E.; resources, C.J.B. and S.H.; data curation, P.E. and S.H.; writing—original draft preparation, P.E., C.J.B., and S.K.-B.; writing—review and editing, P.E., S.K.-B., S.H., and C.J.B.; visualization, P.E. and S.K.-B.; supervision, S.H. and C.J.B.; project administration, C.J.B. and S.H.; funding acquisition, C.J.B. and S.H. All authors have read and agreed to the published version of the manuscript.
Funding
This work was carried out as part of the Waste Consortium project funded by the Engineering and Physical Sciences Research Council (EPSRC) under the Sustainable Urban Environment (SUE) Programme.
Acknowledgments
The authors thank Stephanie Gauthier, University of Southampton, for guidance in the analysis of density distribution of data.
Conflicts of Interest
The authors declare no conflict of interest. The funders had no role in the design of the study; in the collection, analyses, or interpretation of data; in the writing of the manuscript, or in the decision to publish the results.
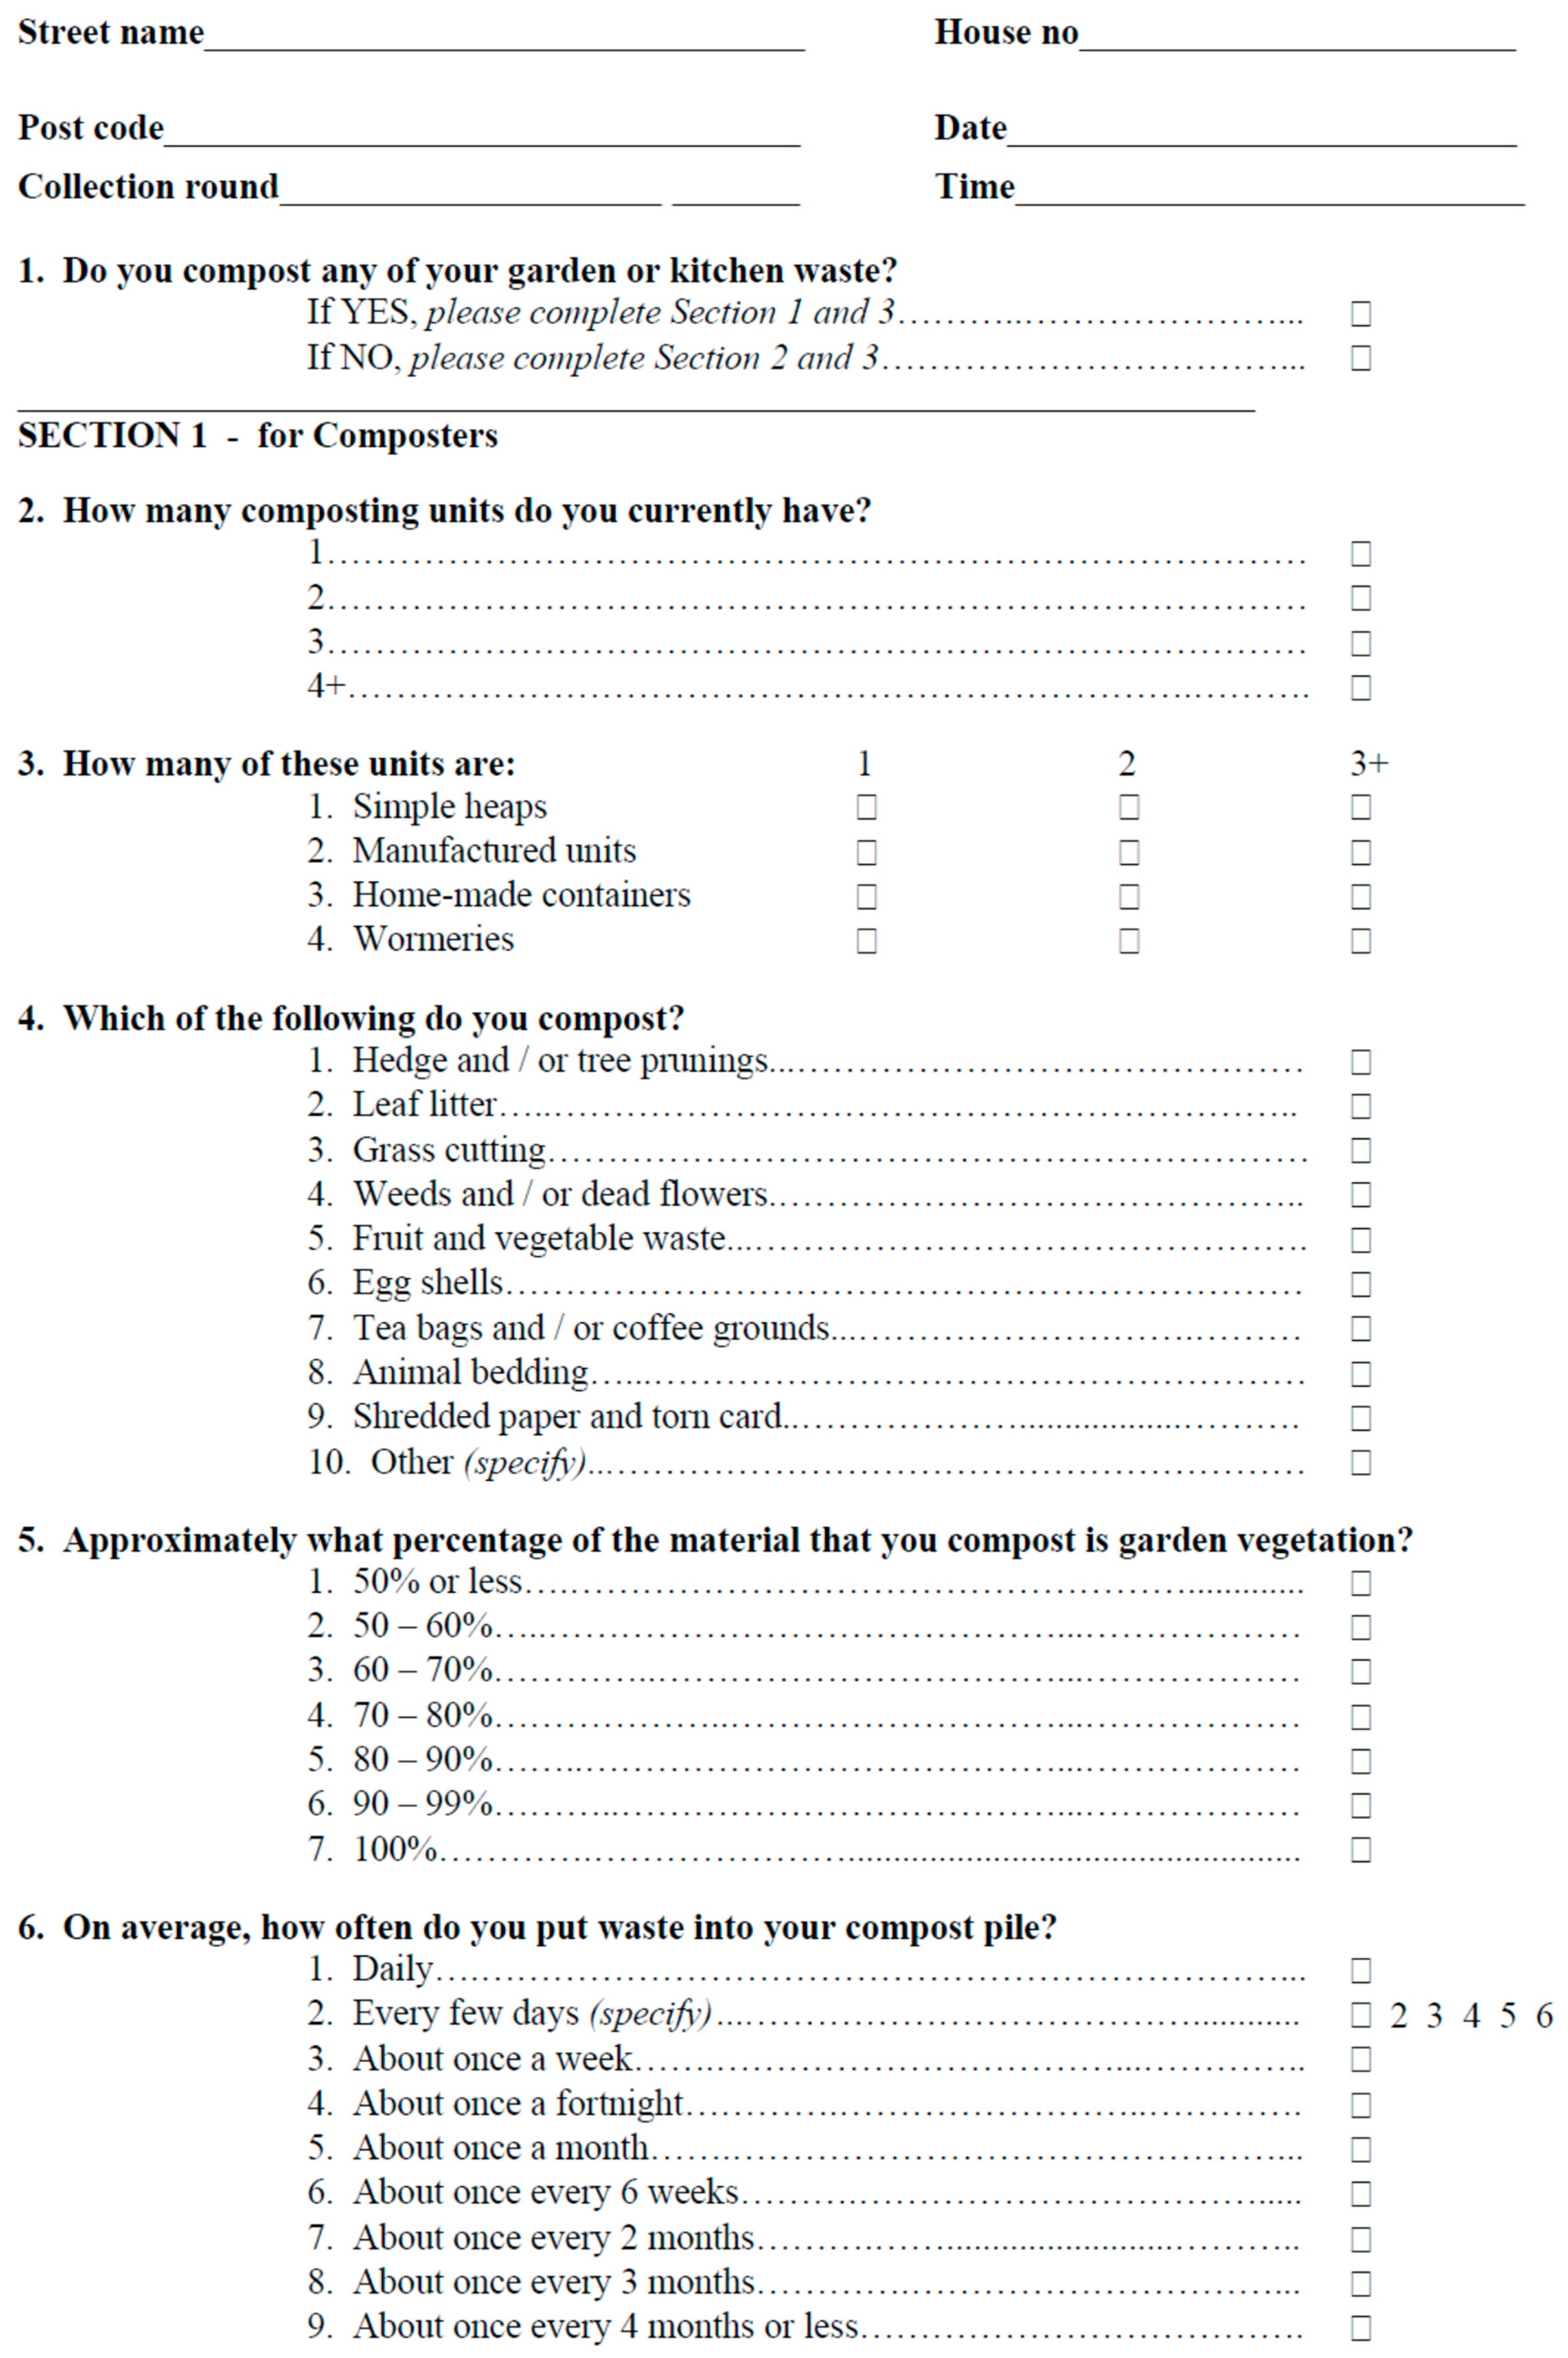
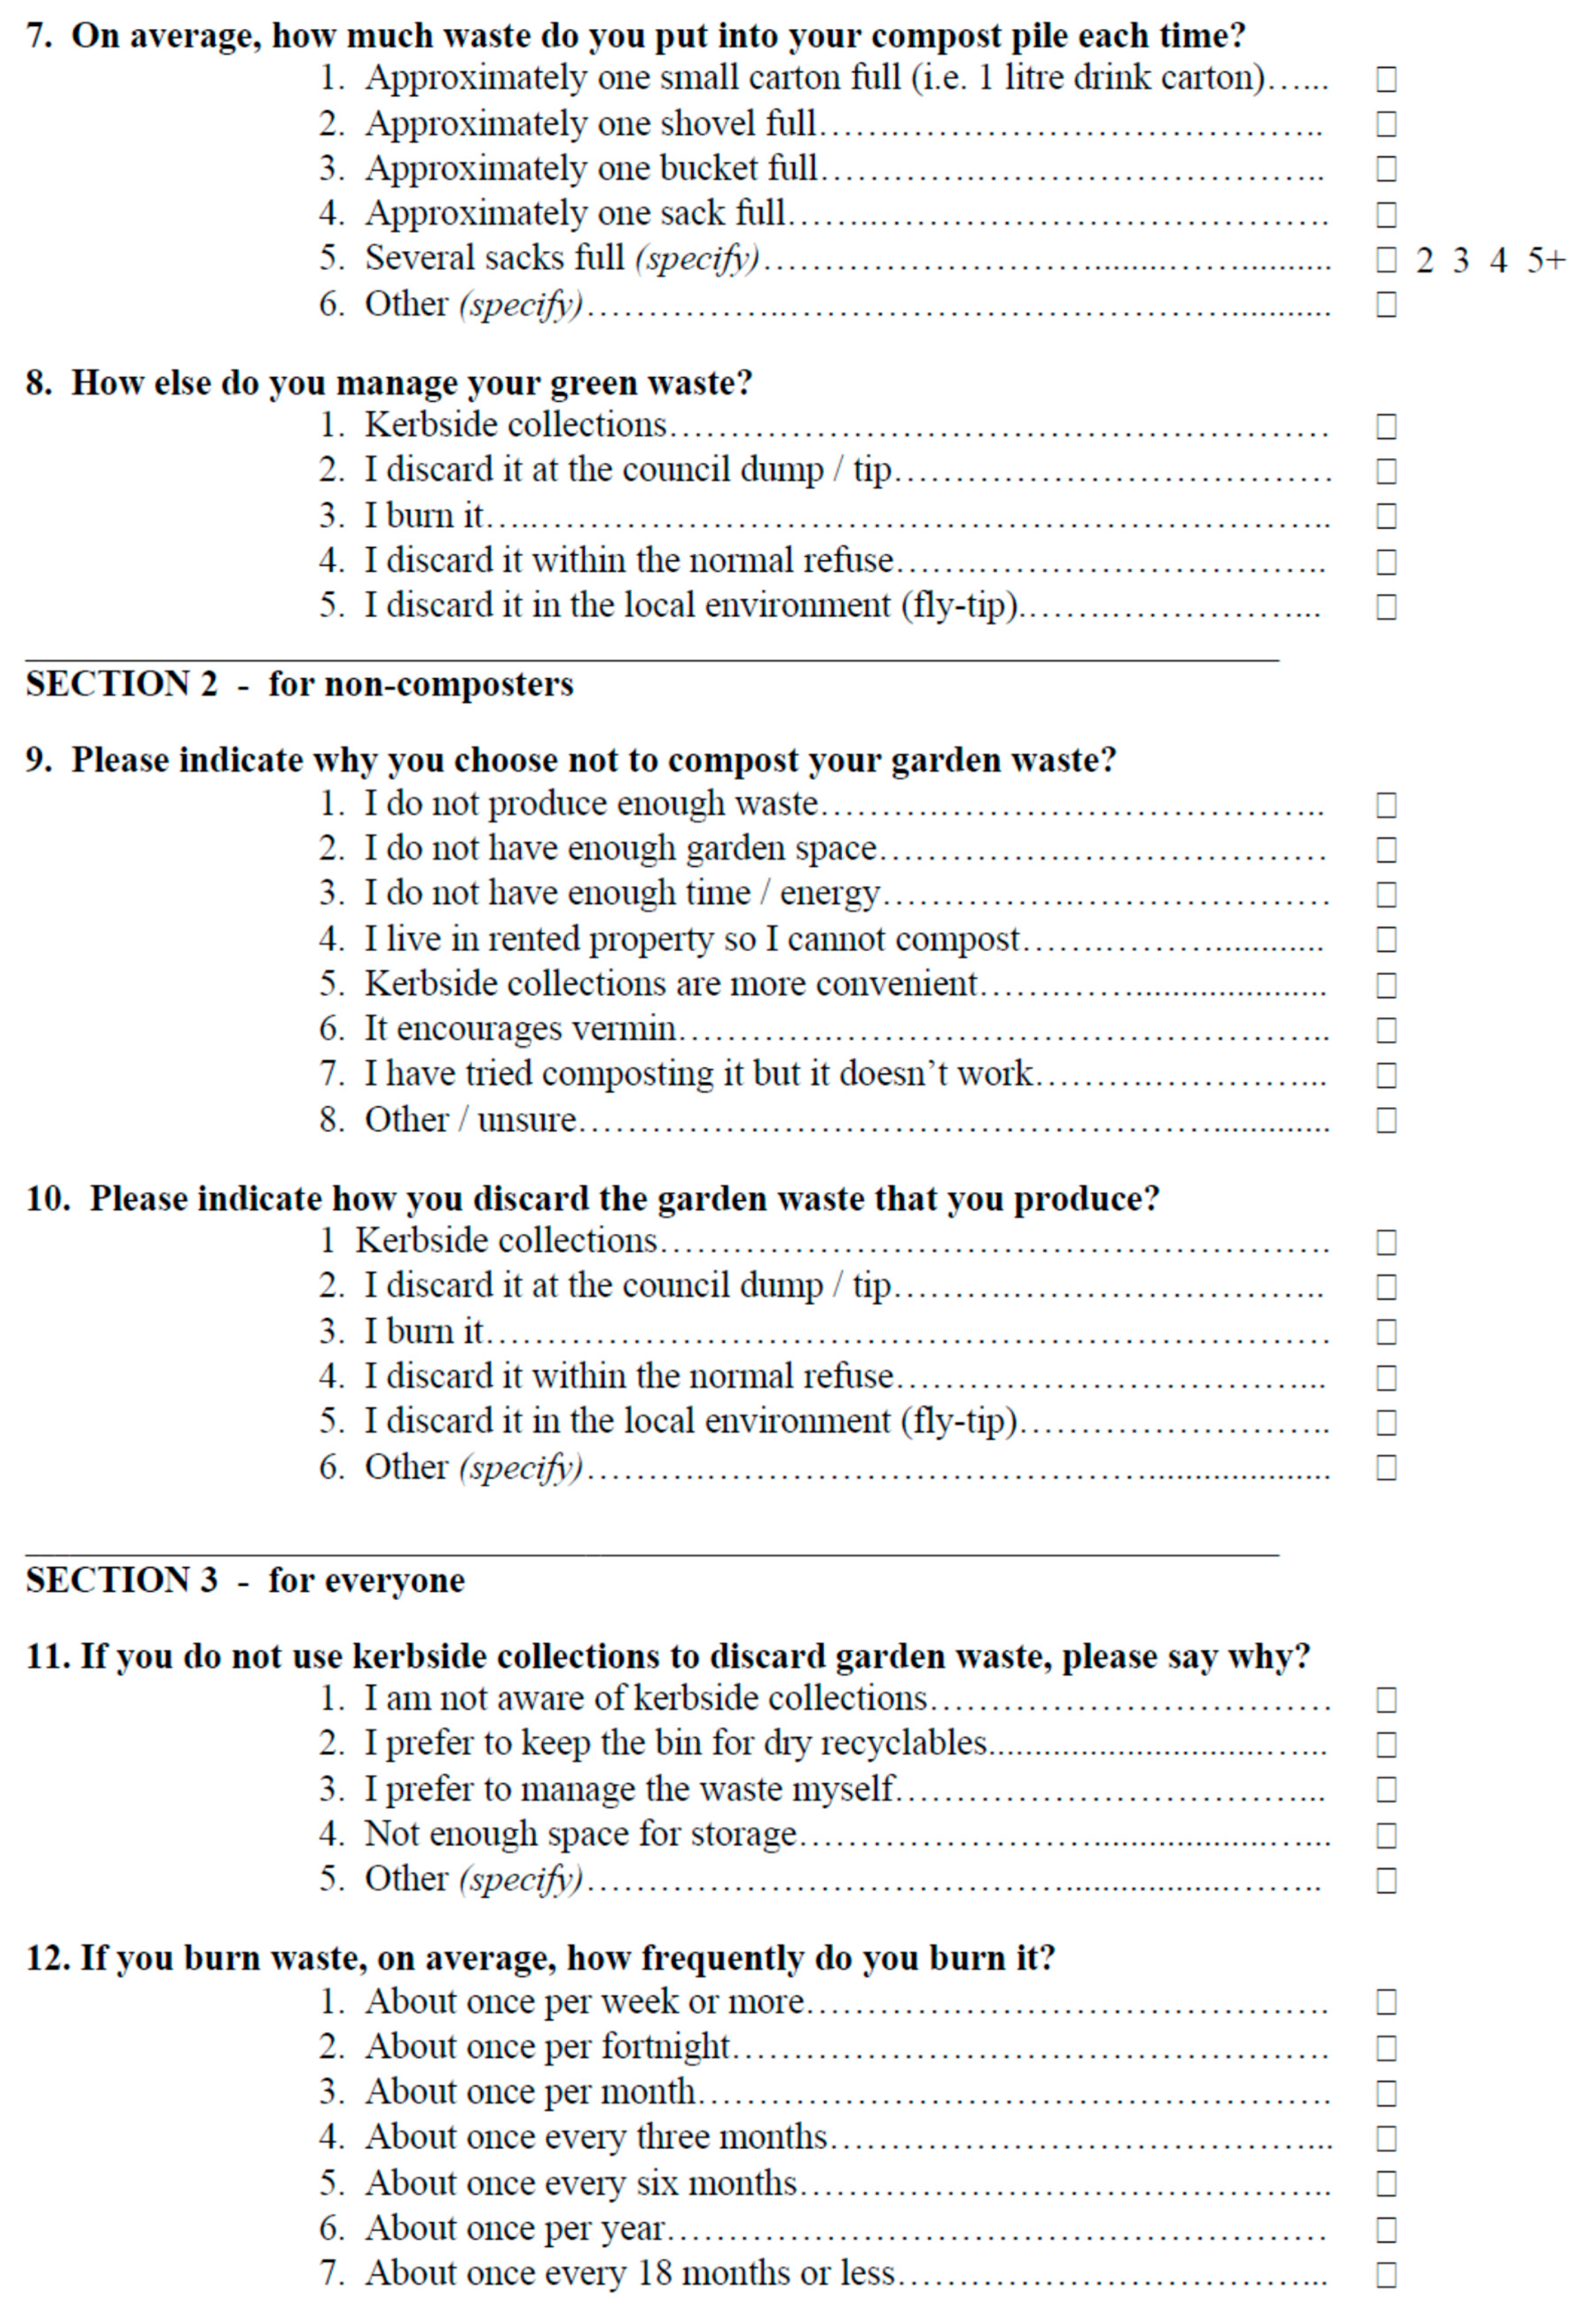
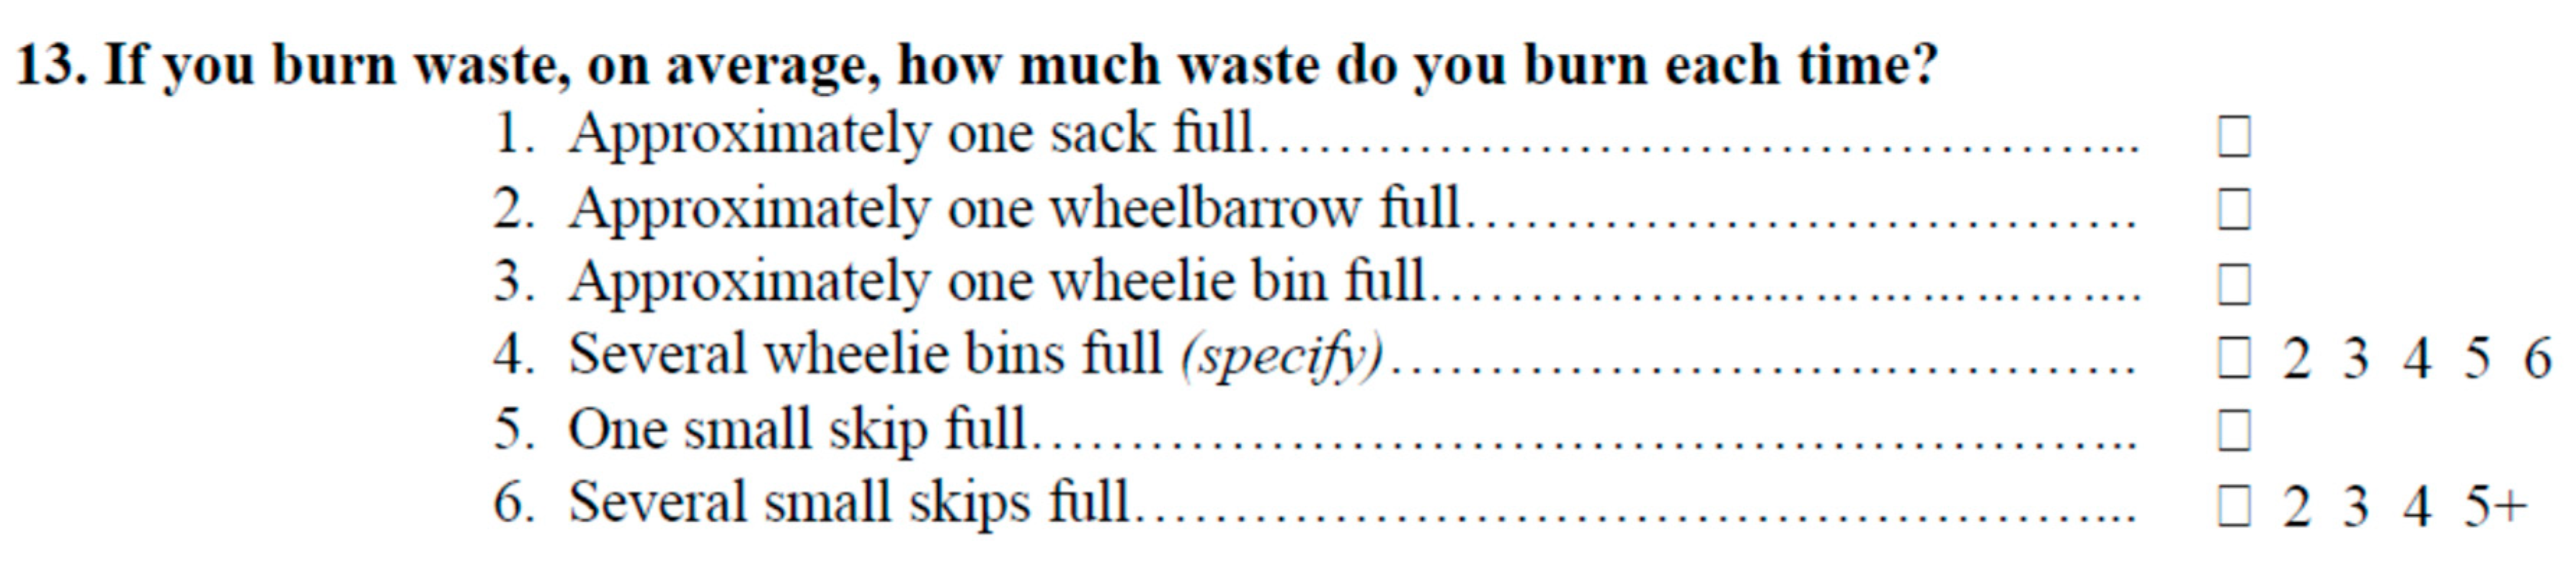
Appendix A. Questionnaire Used during the Door-to-Door Surveys
Note: Respondents were asked to quantify the volumes of garden waste they regularly put on the compost pile using the following units of estimation: 1-L cartons, shovels, 10-L buckets, sacks. They were asked to quantify the volumes of garden waste they regularly burned using the following units of estimation: sacks, wheelbarrows (standard equipment with 47 L), 140-L wheelie bins (this is the standard wheelie bin type used for collection of recyclables in survey area), small skips (standard 2 cubic yards skip, equivalent to 1530 L). Explanations were provided where required. The volumes of garden waste contained in a shovel or a sack were determined through experiments as described in Eades [33] and were assumed as follows: one shovel corresponds to 5 L and one sack corresponds to 33.8 L of green waste.
Figure A1.
Questionnaire used during the door-to-door interviews.


Appendix B. Density Distribution of Data
Figure A2.
Distribution of garden sizes in set of studied households: (a) Rural properties; (b) Urban properties.
Figure A2.
Distribution of garden sizes in set of studied households: (a) Rural properties; (b) Urban properties.

Figure A3.
Density distribution of compost quantities in set of studied households (all households considered, i.e., including those not using home composting at all): (a) Rural properties; (b) Urban properties.
Figure A3.
Density distribution of compost quantities in set of studied households (all households considered, i.e., including those not using home composting at all): (a) Rural properties; (b) Urban properties.

References
- Department for Environment, Food and Rural Affairs (Defra). Our Waste, Our Resources: A Strategy for England; Defra: London, UK, 2018. Available online: www.gov.uk/government/publications (accessed on 20 November 2019).
- Federal Ministry for the Environment, Nature Conservation and Nuclear Safety Germany (BMU); Federal Environment Agency Germany. Ecologically Sustainable Recovery of Bio-Waste; Federal Ministry for the Environment, Nature Conservation and Nuclear Safety Germany: Berlin, Germany, 2012; Available online: https://www.umweltbundesamt.de/sites/default/files/medien/378/publikationen/ecologically_sustainable_recovery_of_bio-waste_bf.pdf (accessed on 20 November 2019).
- Shi, Y.; Ge, Y.; Chang, J.; Shao, H.; Tang, Y. Garden waste biomass for renewable and sustainable energy production in China: Potential, challenges and development. Renew. Sustain. Energy Rev. 2013, 22, 432–437. [Google Scholar] [CrossRef]
- MacFarlane, D.W. Potential availability of urban wood biomass in Michigan: Implications for energy production, carbon sequestration and sustainable forest management in the U.S.A. Biomass Bioenergy 2009, 33, 628–634. [Google Scholar] [CrossRef]
- Oldfield, T.L.; White, E.; Holden, N.M. The implications of stakeholder perspective for LCA of wasted food and green waste. J. Clean. Prod. 2018, 170, 1554–1564. [Google Scholar] [CrossRef]
- Parfitt, J. Home Composting Diversion: District Level Analysis; Waste and Resource Action Programme (WRAP): Banbury, UK, 2009. [Google Scholar]
- Evans, G. Biowaste and Biological Waste Treatment; Routledge: London, UK, 2014. [Google Scholar]
- Schüch, A.; Morscheck, G.; Lemke, A.; Nelles, M. Bio-waste recycling in Germany–further challenges. Procedia Environ. Sci. 2016, 35, 308–318. [Google Scholar] [CrossRef]
- Roberts, D. Characterisation of chemical composition and energy content of green waste and municipal solid waste from Greater Brisbane, Australia. Waste Manag. 2015, 41, 12–19. [Google Scholar]
- Hanc, A.; Novak, P.; Dvorak, M.; Habart, J.; Svehla, P. Composition and parameters of household bio-waste in four seasons. Waste Manag. 2011, 31, 1450–1460. [Google Scholar] [CrossRef]
- Bary, A.I.; Cogger, C.G.; Sullivan, D.M.; Myhre, E.A. Characterization of fresh yard trimmings for agricultural use. Bioresour. Technol. 2005, 96, 1499–1504. [Google Scholar] [CrossRef]
- Reyes-Torres, M.; Oviedo-Ocaña, E.R.; Dominguez, I.; Komilis, D.; Sánchez, A. A systematic review on the composting of green waste: Feedstock quality and optimization strategies. Waste Manag. 2018, 77, 486–499. [Google Scholar] [CrossRef]
- Vandecasteele, B.; Boogaerts, C.; Vandaele, E. Combining woody biomass for combustion with green waste composting: Effect of removal of woody biomass on compost quality. Waste Manag. 2016, 58, 169–180. [Google Scholar] [CrossRef]
- Safarian, S.; Unnthorsson, R. An assessment of the sustainability of lignocellulosic bioethanol production from wastes in Iceland. Energies 2018, 11, 1493. [Google Scholar] [CrossRef] [Green Version]
- Kabir, M.J.; Chowdhury, A.A.; Rasul, M.G. Pyrolysis of municipal green waste: A modelling, simulation and experimental analysis. Energies 2015, 8, 7522–7541. [Google Scholar] [CrossRef] [Green Version]
- Pick, D.; Dieterich, M.; Heintschel, S. Biogas production potential from economically usable green waste. Sustainability 2012, 4, 682–702. [Google Scholar] [CrossRef] [Green Version]
- Inghels, D.; Dullaert, W.; Aghezzaf, E.-H.; Heijungs, R. Towards optimal trade-offs between material and energy recovery for green waste. Waste Manag. 2019, 93, 100–111. [Google Scholar] [CrossRef] [PubMed]
- ten Hoeve, M.; Bruun, S.; Jensen, L.S.; Christensen, T.H.; Scheutz, C. Life cycle assessment of garden waste management options including long-term emissions after land application. Waste Manag. 2019, 86, 54–66. [Google Scholar] [CrossRef]
- Andersen, J.K.; Boldrin, A.; Christensen, T.H.; Scheutz, C. Mass balances and life cycle inventory of home composting of organic waste. Waste Manag. 2011, 31, 1934–1942. [Google Scholar] [CrossRef] [Green Version]
- Machado, T.; Chaves, B.; Campos, L.; Bessa, D. Garden waste quantification using home composting on a model garden. In WASTES—Solutions, Treatments and Opportunities II; CRC Press: London, UK, 2017; pp. 283–286. [Google Scholar]
- Boldrin, A.; Christensen, T.H. Seasonal generation and composition of garden waste in Aarhus (Denmark). Waste Manag. 2010, 30, 551–557. [Google Scholar] [CrossRef] [PubMed] [Green Version]
- Davies, Z.G.; Fuller, R.A.; Loram, A.; Irvine, K.N.; Sims, V.; Gaston, K.J. A national scale inventory of resource provision for biodiversity within domestic gardens. Biol. Conserv. 2009, 142, 761–771. [Google Scholar] [CrossRef] [Green Version]
- Hope, C. More than Two Million British Homes without a Garden. The Telegraph. 12 July 2009. Available online: https://www.telegraph.co.uk/news/uknews/5811433/More-than-two-million-British-homes-without-a-garden.html (accessed on 24 November 2019).
- Department for Environment, Food and Rural Affairs (Defra). Introductory Guide to Options for the Diversion of Biodegradable Waste from Landfill; Defra: London, UK, 2007. Available online: https://rds.eppingforestdc.gov.uk/mgConvert2PDF.aspx?ID=11420&ku=ku (accessed on 20 November 2019).
- Parfitt, J. Analysis of Household Waste Composition and Factors Driving Waste Increases; Waste and Resources Action Programme: Banbury, UK, 2002. [Google Scholar]
- Department for Environment, Food and Rural Affairs (Defra). Municipal Waste Management Survey of 2001/2002; Defra: London, UK, 2003.
- Chu, T.W.; Heaven, S.; Gredmaier, L. Modelling fuel consumption in kerbside source segregated food waste collection: Separate collection and co-collection. Environ. Technol. 2015, 36, 3013–3021. [Google Scholar] [CrossRef] [Green Version]
- Department for Environment, Food and Rural Affairs (Defra). Digest of Waste and Resource Statistics—2018 Edition; Defra: London, UK, 2018. Available online: https://www.gov.uk/government/statistics/digest-of-waste-and-resource-statistics-2018-edition (accessed on 20 November 2019).
- Test Valley Borough Council. Census 2011, Key Facts and Figures Test Valley; Test Valley Borough Council: Andover, UK, 2011. Available online: https://www.testvalley.gov.uk/assets/attach/1496/TestValleyFacts2011Census.pdf (accessed on 10 November 2019).
- Office for National Statistics. Families and Households in the UK: 2017, Released 8 November 2017. Available online: https://www.ons.gov.uk/peoplepopulationandcommunity/birthsdeathsandmarriages/families/bulletins/familiesandhouseholds/2017 (accessed on 20 November 2019).
- Hampshire County Council. Socio-Economic Profile of Rural Hampshire 2016; Research & Intelligence Group of Hampshire County Council: Winchester, UK, 2016. Available online: https://documents.hants.gov.uk/countryside/2016-Demographyandarea.pdf (accessed on 12 November 2019).
- Department for Environment, Food and Rural Affairs (Defra). Rural Population 2014/15, Updated 26 September 2019. Available online: https://www.gov.uk/government/publications/rural-population-and-migration/rural-population-201415 (accessed on 12 November 2019).
- Eades, P. An Assessment of Environmental Factors Involved in the Management of Garden Waste. Ph.D. Thesis, University of Southampton, Southampton, UK, 2007. [Google Scholar]
- Loram, A.; Tratalos, J.; Warren, P.H.; Gaston, K.J. Urban domestic gardens (X): The extent & structure of the resource in five major cities. Landsc. Ecol. 2007, 22, 601–615. [Google Scholar]
- Gaston, K.J.; Warren, P.H.; Thompson, K.; Smith, R.M. Urban domestic gardens (IV): The extent of the resource and its associated features. Biodivers. Conserv. 2005, 14, 3327–3349. [Google Scholar] [CrossRef]
- Brook Lyndhurst Ltd. WR1204 Household Waste Prevention Evidence Review: Attitudes and Behaviours—Home Composting; A Report for Defra’s Waste and Resources Evidence Programme; Brook Lyndhurst: London, UK, 2009. [Google Scholar]
- Xu, D.Y.; Lin, Z.Y.; Gordon, M.P.R.; Robinson, N.K.L.; Harder, M.K. Perceived key elements of a successful residential food waste sorting program in urban apartments: Stakeholder views. J. Clean. Prod. 2016, 134, 362–370. [Google Scholar] [CrossRef] [Green Version]
- Bernstad, A.; la Cour Jansen, J.; Aspegren, A. Door-stepping as a strategy for improved food waste recycling behaviour—Evaluation of a full-scale experiment. Resour. Conserv. Recycl. 2013, 73, 94–103. [Google Scholar] [CrossRef]
- Davey, A.; Clist, S.; Godley, A. Home Composting Diversion: Household Level Analysis; Waste and Resource Action Programme (WRAP): Banbury, UK, 2009. [Google Scholar]
- Parfitt, J. Home composting versus ‘collect and treat’ options for biodegradable municipal wastes—Towards a more level playing field. In Proceedings of the 5th International Symposium on Waste Treatment Technologies, Paignton, UK, 12–16 June 2016; Chartered Institution of Wastes Management: Northampton, UK, 2006. [Google Scholar]
- Oliveira, L.S.B.L.; Stolte Bezerra, B.; Silva Pereira, B.; Gomes Battistelle, R.A. Environmental analysis of organic waste treatment focusing on composting scenarios. J. Clean. Prod. 2017, 155, 229–237. [Google Scholar] [CrossRef] [Green Version]
- Vasquez, M.A.; Soto, M. The efficiency of home composting programmes and compost quality. Waste Manag. 2017, 64, 39–50. [Google Scholar] [CrossRef]
- Sivertsen, B. Air pollution impacts from open air burning. WIT Trans. Ecol. Environ. 2006, 92, 449–457. [Google Scholar]
- Tucker, P.; Speirs, D.; Fletcher, S.I.; Edgerton, E.; Mckechnie, J. Factors affecting take-up of and drop-out from home composting schemes. Local Environ. 2003, 8, 245–259. [Google Scholar] [CrossRef]
Figure 1.
Percentage of survey participants using different disposal options.

Figure 2.
Relationship between quantity of garden waste home composted and garden size for households using this route (rural properties shown in yellow and urban properties in blue; regression line considers both rural and urban data).
Figure 2.
Relationship between quantity of garden waste home composted and garden size for households using this route (rural properties shown in yellow and urban properties in blue; regression line considers both rural and urban data).

Figure 3.
Relationship between quantity of garden waste home composted per unit of garden size and garden size for households using this route (rural properties shown in yellow and urban properties in blue; the regression includes both rural and urban properties).
Figure 3.
Relationship between quantity of garden waste home composted per unit of garden size and garden size for households using this route (rural properties shown in yellow and urban properties in blue; the regression includes both rural and urban properties).

Figure 4.
Relationship between quantity of garden waste burned in the backyard and garden size for households using this route (rural properties shown in yellow and urban properties in blue).
Figure 4.
Relationship between quantity of garden waste burned in the backyard and garden size for households using this route (rural properties shown in yellow and urban properties in blue).

Figure 5.
Relationship between total quantity of garden waste produced (kg hh−1 day−1) and garden space occupied by the householder: (a) Shown with x-axis in linear scale and with both a logarithmic regression and a linear regression of the parameters; (b) shown with x-axis in logarithmic scale and with a logarithmic regression of the parameters.


Table 1.
Descriptive statistics for garden sizes within the study area of Test Valley, Hampshire.
| Collection Area | Number of Surveyed Properties | Garden Size (m²) | ||||
|---|---|---|---|---|---|---|
| Minimum | Maximum | Mean | Median | Std Dev | ||
| Rural | 178 | 141 | 17,262 | 1836 | 1055 | 2326 |
| Urban | 354 | 37.5 | 528.6 | 144.3 | 121.3 | 77 |
Table 2.
Quantities of garden waste home composted.
| Collection Area | Quantity Composted (kg hh−1 day−1) | ||||
|---|---|---|---|---|---|
| Minimum | Maximum | Mean | Median | Std Dev | |
| Rural | |||||
| Only household using this practice | 0.01 | 5.32 | 0.86 | 0.50 | 0.99 |
| All rural households | 0.00 | 5.32 | 0.63 | 0.26 | 0.93 |
| Urban | |||||
| Only household using this practice | 0.01 | 1.79 | 0.32 | 0.19 | 0.32 |
| All urban households | 0.00 | 1.79 | 0.09 | 0.00 | 0.22 |
Table 3.
Quantities of garden waste burned in the backyard.
| Collection Area | Quantity Burned (kg hh−1 day−1) | ||||
|---|---|---|---|---|---|
| Minimum | Maximum | Mean | Median | Std Dev | |
| Rural | |||||
| Only household using this practice | 0.02 | 4.40 | 1.03 | 0.59 | 1.19 |
| All rural households | 0.00 | 4.40 | 0.47 | 0.00 | 0.95 |
| Urban | |||||
| Only household using this practice | 0.02 | 1.41 | 0.27 | 0.15 | 0.36 |
| All urban households | 0.00 | 1.41 | 0.01 | 0.00 | 0.10 |
Table 4.
Quantity of waste collected through kerbside collections.
| Collection Period | Total Garden Waste Recovered per Fortnightly Collection (kg) | Total Attributable to Households Responding to the Door-to-Door Survey (kg) 1 | Daily Load per Household Utilising Kerbside Collections (kg hh−1 day−1) 2 | Daily Load per All Households in Survey Area (kg hh−1 day−1) | |||||
|---|---|---|---|---|---|---|---|---|---|
| Month | Fortnight | Rural | Urban | Rural | Urban | Rural | Urban | Rural | Urban |
| April | 1 | 3881.0 | 3145.0 | 2025.9 | 1396.4 | 1.04 | 0.34 | 0.81 | 0.28 |
| 2 | 3700.0 | 3221.0 | 1931.4 | 1430.1 | 0.99 | 0.35 | 0.78 | 0.29 | |
| May | 3 | 4260.0 | 3331.0 | 2223.7 | 1479.0 | 1.14 | 0.36 | 0.89 | 0.30 |
| 4 | 4180.0 | 2992.0 | 2182.0 | 1328.4 | 1.12 | 0.32 | 0.88 | 0.27 | |
| June | 5 | 5773.0 | 5060.0 | 3013.5 | 2246.6 | 1.55 | 0.55 | 1.21 | 0.45 |
| 6 | 3520.0 | 5239.0 | 1837.4 | 2326.1 | 0.94 | 0.57 | 0.74 | 0.47 | |
| July | 7 | 3640.0 | 4116.0 | 1900.1 | 1827.5 | 0.98 | 0.44 | 0.76 | 0.37 |
| 8 | 3400.0 | 4670.0 | 1774.8 | 2073.5 | 0.91 | 0.50 | 0.71 | 0.42 | |
| August | 9 | 3560.0 | 3098.0 | 1858.3 | 1375.5 | 0.95 | 0.33 | 0.75 | 0.28 |
| 10 | 3689.0 | 3308.0 | 1925.7 | 1468.8 | 0.99 | 0.36 | 0.77 | 0.30 | |
| September | 11 | 3572.0 | 3488.0 | 1864.6 | 1548.7 | 0.96 | 0.38 | 0.75 | 0.31 |
| 12 | 2660.0 | 3309.0 | 1388.5 | 1469.2 | 0.71 | 0.36 | 0.56 | 0.30 | |
| October | 13 | 3074.0 | 3039.0 | 1604.6 | 1349.3 | 0.82 | 0.33 | 0.64 | 0.27 |
| 14 | 3000.0 | 3616.0 | 1566.0 | 1605.5 | 0.80 | 0.39 | 0.63 | 0.32 | |
| November | 15 | 2360.0 | 3640.0 | 1231.9 | 1616.2 | 0.63 | 0.39 | 0.49 | 0.33 |
| 16 | 3060.0 | 3720.0 | 1597.3 | 1651.7 | 0.82 | 0.40 | 0.64 | 0.33 | |
| December | 17 | 2900.0 | 3540.0 | 1513.8 | 1571.8 | 0.78 | 0.38 | 0.61 | 0.32 |
| 18 | 3020.0 | 1780.0 | 1576.4 | 790.3 | 0.81 | 0.19 | 0.63 | 0.16 | |
| January | 19 | 2720.0 | 2540.0 | 1419.8 | 1127.8 | 0.73 | 0.27 | 0.57 | 0.23 |
| 20 | 1960.0 | 1460.0 | 1023.1 | 648.2 | 0.53 | 0.16 | 0.41 | 0.13 | |
| February | 21 | 2640.0 | 1240.0 | 1378.1 | 550.6 | 0.71 | 0.13 | 0.55 | 0.11 |
| 22 | 2320.0 | 1300.0 | 1211.0 | 577.2 | 0.62 | 0.14 | 0.49 | 0.12 | |
| March | 23 | 2560.0 | 1440.0 | 1336.3 | 639.4 | 0.69 | 0.16 | 0.54 | 0.13 |
| AVERAGE | 3280.4 | 3143.1 | 1712.4 | 1395.6 | 0.88 | 0.34 | 0.69 | 0.28 | |
1 52.2% of rural and 44.4% of urban households (response rate to interview survey). 2 78.1% of rural households and 83.1% of urban households utilised this service (see earlier).
Table 5.
Quantity of garden waste discarded at the Household Waste Recycling Centre (HWRC) per month.
Table 5.
Quantity of garden waste discarded at the Household Waste Recycling Centre (HWRC) per month.
| Month | Number Surveyed | Frequency (Days) | Garden Waste Discarded per Visit (kg) | Equivalent Daily Load (kg User−1 day−1) |
|---|---|---|---|---|
| May | 107 | 38 | 43.7 | 1.15 |
| June | 83 | 40 | 38.0 | 0.95 |
| July | 75 | 39 | 44.6 | 1.14 |
| August | 78 | 52 | 34.8 | 0.67 |
| September | 75 | 39 | 39.7 | 1.02 |
| October | 65 | 54 | 40.5 | 0.75 |
| November | 87 | 62 | 44.6 | 0.72 |
| December | 8 | 19 | 22.7 | 1.19 |
| January | 16 | 81 | 51.8 | 0.64 |
| February | 15 | 49 | 26.7 | 0.54 |
| March | 9 | 22 | 30.0 | 1.36 |
| April | 58 | 86 | 27.5 | 0.32 |
| AVERAGE | 56.3 | 48.4 | 37.1 | 0.77 |
Table 6.
Quantities of garden waste discarded by various routes (summary of findings).
| Rural Population (kg hh−1 day−1) | Urban Population (kg hh−1 day−1) | |
|---|---|---|
| Kerbside collection | 0.69 | 0.28 |
| HWRC (recycling centre) | 0.17 | 0.26 |
| Home composting | 0.63 | 0.09 |
| Backyard burning | 0.47 | 0.01 |
| TOTAL | 1.96 | 0.64 |
| Total of this disposed of via services operated by waste collection authorities (kerbside collection, HWRC) | 0.86 (= 44% of total) | 0.54 (= 84% of total) |
| Disposed of via self-sufficiency methods (home composting, backyard burning) | 1.1 (= 56% of total) | 0.10 (= 16% of total) |
Table 7.
Descriptive statistics for total garden waste generated in the study area.
| Collection Area | Quantity Generated (kg hh−1 day−1) | ||||
|---|---|---|---|---|---|
| Minimum | Maximum | Mean | Median | Std Dev | |
| Rural | 0.00 | 6.59 | 1.96 | 1.66 | 1.35 |
| Urban | 0.00 | 2.96 | 0.64 | 0.34 | 0.46 |
© 2020 by the authors. Licensee MDPI, Basel, Switzerland. This article is an open access article distributed under the terms and conditions of the Creative Commons Attribution (CC BY) license (http://creativecommons.org/licenses/by/4.0/).
Share and Cite
MDPI and ACS Style
Eades, P.; Kusch-Brandt, S.; Heaven, S.; Banks, C.J. Estimating the Generation of Garden Waste in England and the Differences between Rural and Urban Areas. Resources 2020, 9, 8. https://doi.org/10.3390/resources9010008
AMA Style
Eades P, Kusch-Brandt S, Heaven S, Banks CJ. Estimating the Generation of Garden Waste in England and the Differences between Rural and Urban Areas. Resources. 2020; 9(1):8. https://doi.org/10.3390/resources9010008
Chicago/Turabian StyleEades, Paul, Sigrid Kusch-Brandt, Sonia Heaven, and Charles J. Banks. 2020. "Estimating the Generation of Garden Waste in England and the Differences between Rural and Urban Areas" Resources 9, no. 1: 8. https://doi.org/10.3390/resources9010008
Note that from the first issue of 2016, this journal uses article numbers instead of page numbers. See further details here.