Article

The Water Footprint of European Agricultural Imports: Hotspots in the Context of Water Scarcity

by
Iulia Dolganova
1,
Natalia Mikosch
1,
Markus Berger
1,*,
Montserrat Núñez
1,
Andrea Müller-Frank
2 and
Matthias Finkbeiner
1
1
Chair of Sustainable Engineering, Technische Universität Berlin, Straße des 17. Juni 135, 10623 Berlin, Germany
2
Evangelisches Werk für Diakonie und Entwicklung e.V., Brot für die Welt—Evangelischer Entwicklungsdienst, Caroline-Michaelis-Straße 1, 10115 Berlin, Germany
*
Author to whom correspondence should be addressed.
Resources 2019, 8(3), 141; https://doi.org/10.3390/resources8030141
Submission received: 27 June 2019 / Revised: 1 August 2019 / Accepted: 5 August 2019 / Published: 7 August 2019
(This article belongs to the Special Issue Coping with Water Scarcity in Agriculture)

Abstract

:
This study investigates the Water Footprint (WF) resulting from the agricultural imports of the European Union (EU-28). Import trade statistics were compiled and linked with crop- and country-specific water consumption data and water scarcity factors. Within the study, the virtual water imports of 104 agricultural commodities for the baseline year 2015 were assessed and product and country hotspots were evaluated. It was shown that (a) Europe imported 100 million tons of agricultural goods and 11 km3 of associated virtual irrigation water; (b) the highest impacts of water consumption do not necessarily result from high import amounts, but from water-intensive goods produced in water scarce countries; (c) the largest external EU-28 water footprint occurred due to the product categories cotton, nuts and rice; and (d) the highest share of the EU external water footprint took place in the United States (US), Pakistan, Turkey, Egypt and India.

Graphical Abstract

1. Introduction

The increasing temporal and local variability of water resources result in ecosystem damage and human health losses. Since 1700, more than two-thirds of the global wetland area has been degraded due to water deprivation, e.g., because of the agricultural water use [1]. Water scarcity aggravation and climate change lead to extreme weather events, which may have significant impacts on humans [2]. According to latest data from United Nations, nearly half of the world’s population live in regions that are potentially water-scarce at least one month per year, and this share is projected to further increase by 2050 [1].
Water is essential for agriculture, which accounts for roughly 70% of freshwater withdrawal worldwide and 90% of freshwater consumption, i.e., the fraction of withdrawal which is locally lost due to evapotranspiration or product integration [3]. Shortages in water availability due to climate change may endanger the food supply worldwide [2], increasing the need for irrigation. It has been estimated that in 2025 over one-third of the global population will be dependent on irrigated agriculture [4] and that by 2050 the agricultural production will need to expand by 50% [5].
The water demand of a specific crop varies between regions of different climatic conditions. If the rainfall stored in the soil profile as soil moisture (also called green water) is not sufficient to meet the crop’s water demand, water from ground- and surface-water sources (blue water) is often used for irrigation [6]. Since crops are traded around the globe, the green and blue water required during production are also virtually exported from producing to importing countries. This so-called virtual water trade can affect the local water cycle and aggravate or help relieve local water scarcity [7].
Several studies have investigated the virtual water flows traded between countries and regions: some examples are France [8], the Netherlands [9], Belgium [10], Germany [11] and the UK [12]. However, the consideration of virtual water trade in volumetric terms only is not enough to support robust political decisions, as a relatively high amount of green water imports from a water-rich country might not be problematic, while a relatively low amount of blue water imports from a water-scarce country can cause severe local problems. Therefore, it is now state of the art that the potential impacts of water consumption in a specific region should be analyzed considering local water scarcity [13]. This can be done by means of the Water Footprint (WF) method, formalized by the ISO 14046:2014 standard and applied to agricultural trade as demonstrated in the studies of Scherer and Pfister [14] for Switzerland and of Finogenova et al. [15] for Germany.
According to ISO 14046, water scarcity is defined as the “extent to which demand for water compares to the replenishment of water in an area, e.g., a drainage basin, without taking into account the water quality” [16]. A water footprint that focuses on impacts of consumed water only (i.e., water quality aspects are disregarded) is termed water scarcity footprint (WSF). A WSF is determined by multiplying local blue water consumption (e.g., caused by irrigating crops) with a local water scarcity factor. In this way, the WSF approach can identify virtual water flows that may pose problems in the producing country.
The European Union (EU-28) is a net virtual water importer, meaning that for domestic consumption more virtual water is imported than exported. Further, agriculture is the major contributor for the EU’s external water footprint [17]. Starting from these premises, the present work analyzes the WSF associated with the EU’s agricultural imports and evaluates their contribution to local water scarcity in the most relevant producing countries.
ISO 14046 does not suggest a specific method for the calculation of the WSF and several approaches co-exist. UN Environment and the European Commission’s Product Environmental Footprint (PEF) initiative recommend using the indicator called AWARE [18]. AWARE assesses the relative “Available Water Remaining” in a given area (watershed or country) and time (month or year), after the demand of humans and aquatic ecosystems has been met. The indicator estimates the potential to deprive another user (human or ecosystem) when consuming water in the analyzed area [18]. In this study, the imported products with the highest overall WSF are identified based on the AWARE method, as well as the countries where the highest external WSF from EU takes place.

2. Materials and Methods

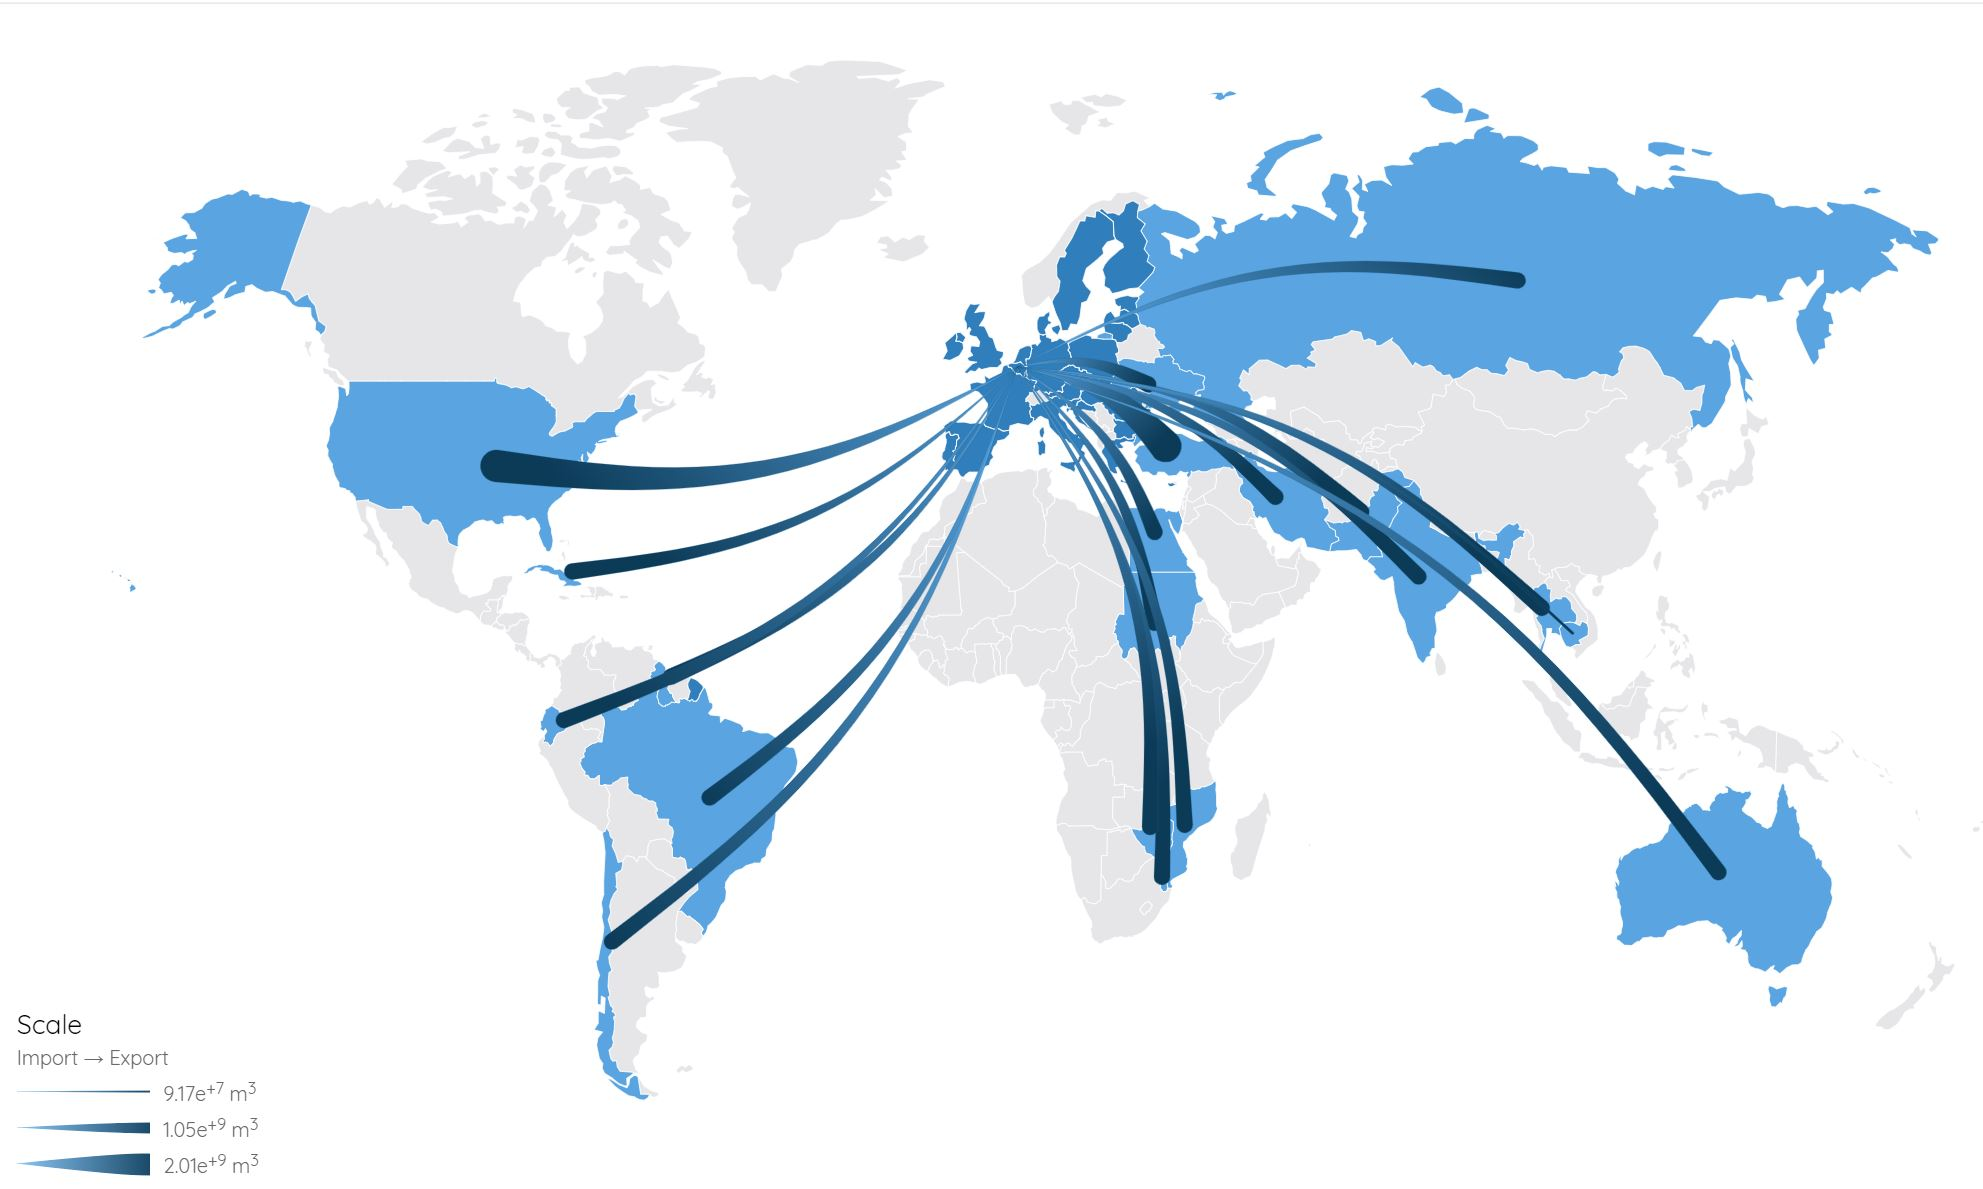
2.1. Compiling the Statistics for Agricultural Imports in the European Union

Import statistics were analyzed based on the data provided by the platform Resourcetrade.earth for the reference year 2015 [19]. The primary data source for Resourcetrade.earth is the International Merchandise Trade Statistics (IMTS), which is compiled and reviewed by the United Nations [19]. This dataset provides a high level of granularity, including commodities groups, product categories and products (see Supplemental Materials). Each product is identified based on a Harmonized System (HS) code.
The database Resourcetrade.earth provides data for fourteen commodities. The analysis was limited to the commodities that make up at least more than 2% of the total import volume of agricultural products (Figure 1). Categories such as Fish and Aquatic Resources, Roots and Tubers, Live Animals and Water (as a commodity) were not included due to the lack of data for the required water consumption. The commodities meat, dairy, eggs and honey, and “other agricultural products” (which includes cotton and yarn imports) were included in the calculation even though their total import volume was less than 2%. These products are particularly water-intensive in production and, yet with low import volumes, can cause significant effects in the producing countries. Altogether, nine from the existing fourteen commodities were analyzed.
Within the commodities, the import quantities for the product categories were determined. The latter represent the product groups within a commodity, e.g., the commodity oilseeds contains the product categories soybeans, olive oil, peanuts, other oilseeds and palm. The product categories that encompassed more than 0.1% of the total import volume of agricultural products were considered by further calculations (Figure 1). The product category nuts was included regardless of the import volume in the evaluation, because nuts are very water intensive and mostly grown in arid regions, which may result in a high WSF. Based on the established criteria, the analysis included 29 product categories.
On its turn, each product category encompasses several products, for instance, the category soybeans includes five products: soybeans, refined soya-bean oil, soya bean flour or meal, soybean bean oil-cake and soya-bean oil crude. The products that made up more than 10% of the import within a product category were selected. As a result, 104 products were considered in the present evaluation.
The 28 countries of the European Union were assessed as a whole block (EU-block) and only the external import flows to the block were considered. This is done due to the fact that there are large amounts of re-exports and transit goods within the EU. For instance, the Netherlands import a large amount of agricultural goods (e.g., soybeans, meat) (via the port in Rotterdam), which are then distributed to other countries within the European Union. From this point on, it is very difficult to assess which products are grown domestically and which are re-exports, since the official statistics are not always transparent. As a result, some data may show that the Netherlands exports large amount of soybeans to Germany, even though soybeans are not cultivated in that country.
For the purpose of this study, it was most important to know where exactly the crops were grown, given that the water consumption occurs locally in the producing country. Thus, the decision was to consider only the import flows from outside the EU. Even though it is not excluded that an exporter outside the EU also sells crops that are produced in neighbour countries, most of the countries do not declare the share of the re-exports. In this sense, due to the lack of appropriate data, it was not feasible to identify the re-exports in the framework of this study.

2.2. Compiling the Blue Water Consumption

The data for the blue water consumption of the evaluated products was taken from Mekonnen and Hoekstra [20]. These authors deliver blue water consumption of primary crops and animal products for the period 1996–2005, which was calculated considering average climate data for 30 years, average crop yield for 10 years (1996–2005) and average irrigation coverage between 1996 and 2005. Within this study, country averages were used for the calculation.
The total blue water consumption per product i in a country j (CWUi,j, in m3) was calculated by multiplying the mass-specific cwui,j (m3/kg) by the total mass of the imports Ii,j (kg) from this country to the EU, as shown in Equation (1):
C W U i , j = I i , j × c w u i , j

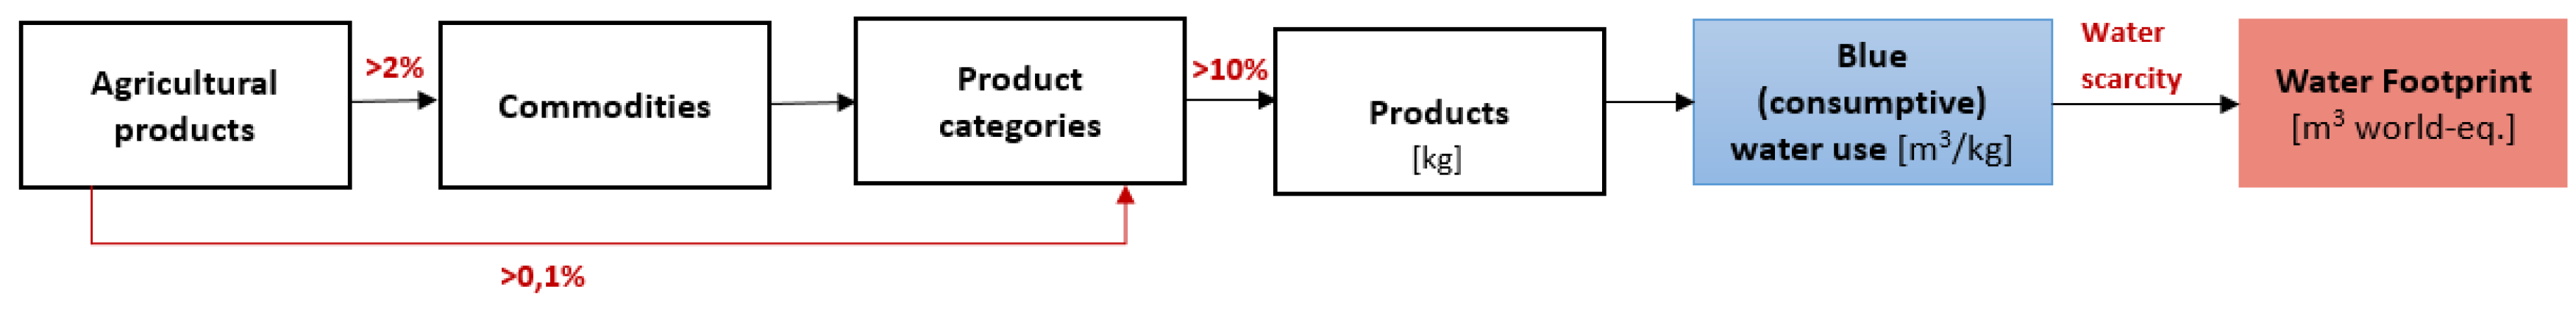
2.3. Calculation of the Water Scarcity Footprint (WSF)

The indicator AWARE, which denotes local impacts of the water consumption, was used to quantify the WSF of EU-28 agricultural imports. AWARE measures the remaining water available per unit surface in a watershed available after human and ecosystem demand have been met relative to world average [18]. AWARE is based on the indicator “water availability minus demand” (AMDj), which is calculated by subtracting the human water consumption (HWC) and the environmental water requirements (EWR) from total water availability in a region per time unit and dividing by its area, as defined in Equation (2):
A M D j = A v a i l a b i l i t y H W C E W R A r e a
The impact factor (IF) AWARE for a watershed j is derived in Equation (3) by calculating the reciprocal of AMD (low volumes per area and time lead to high impact factors). In order to obtain a reference unit, the 1/AMD ratio of the watershed j is normalized to the world average 1/AMD ratio resulting in the unit “m3 world equivalents per m3 watershed” (in short, m3 world-eq./m3, eq.—equivalents).
I F A W A R E , j = 1 A M D j 1 A M D w o r l d   a v g
AWARE impact factors are calculated at the watershed level and monthly time step and aggregated to the country level and/or annual time step. In this study, the impact factor on a country level with the monthly resolution are used. AWARE ranges from 0.1 (minimum water scarcity) to 100 (maximum water scarcity) [18].
The WSF of an agricultural import is calculated by multiplying total blue water consumption of a product i (CWUi,j) with the country-specific water scarcity factor IFAWARE as shown in Equation (4). The calculated WSF has the dimension m3 world-eq.:
W S F i , j = C W U i , j × I F A W A R E , j
The total WSF is quantified for a particular product i, the WSF of each of the supplier countries j was summed up as in Equation (5):
W S F i = j n C W U i , j × I F A W A R E , j

3. Results

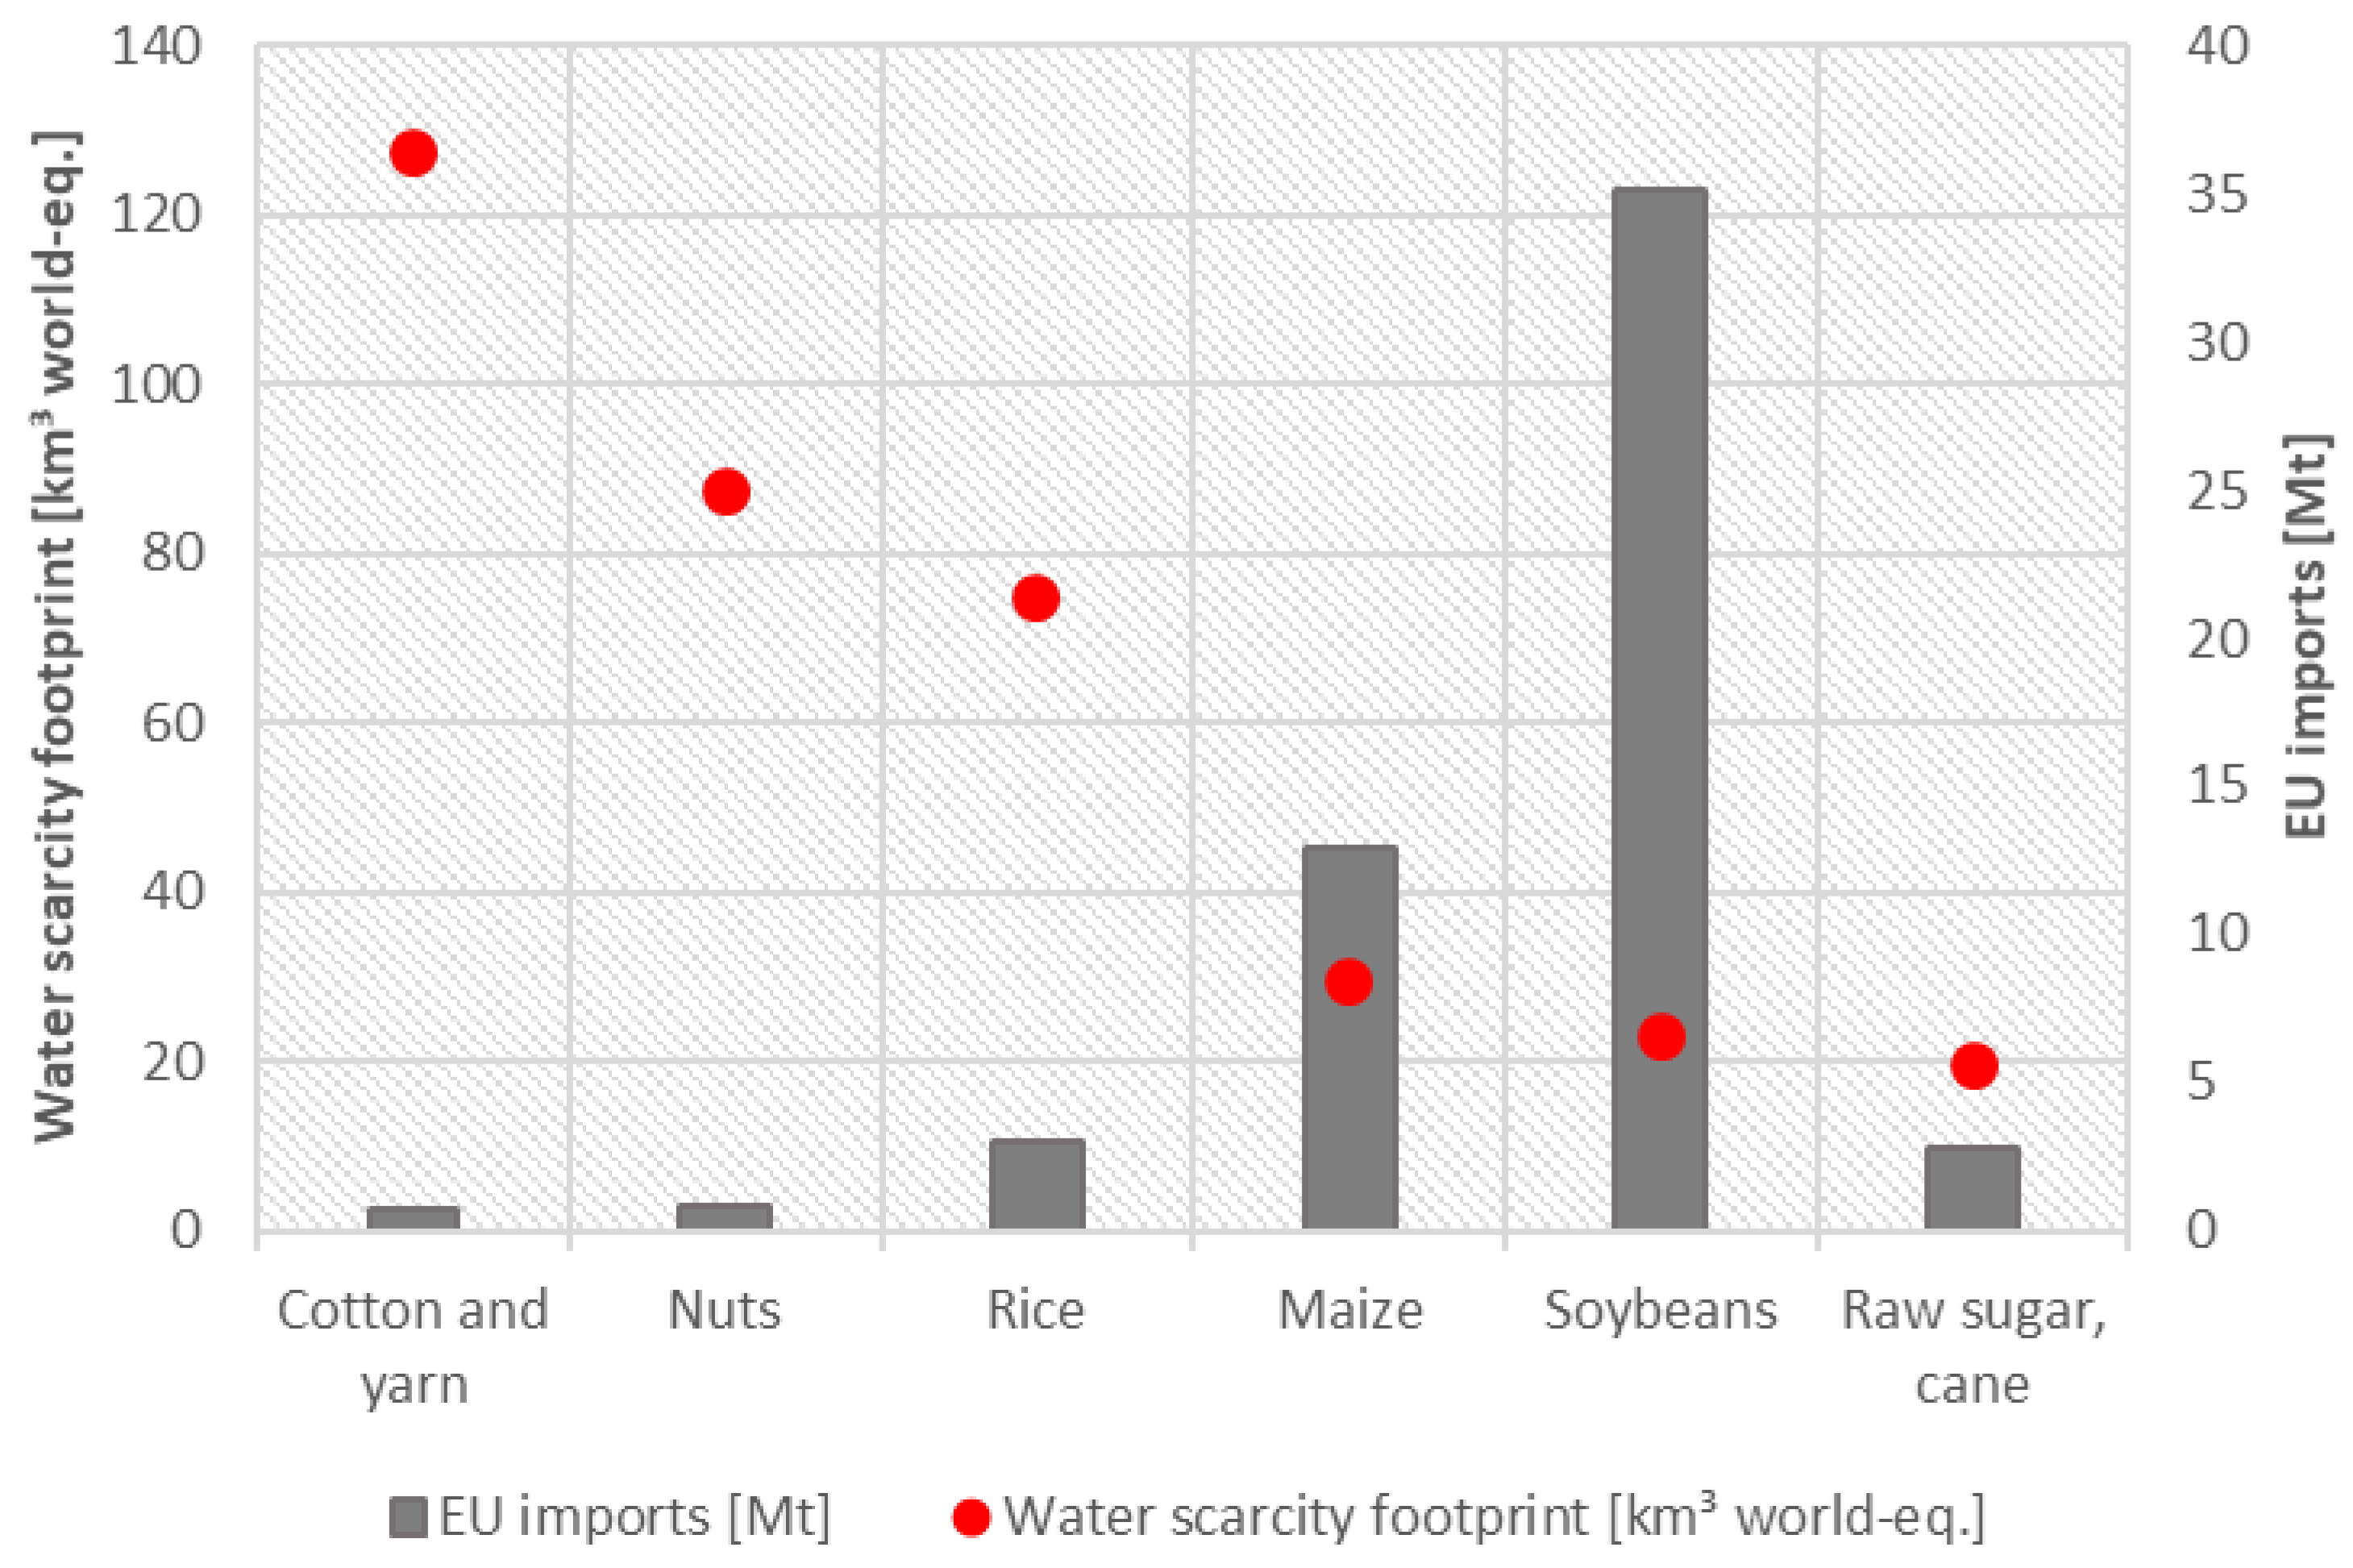
3.1. Water Scarcity Footprint Hotspots on a Product Level

The EU-28 imported almost 100 million (metric) tons of the evaluated 104 agricultural products, which amounts to 76% of total agricultural imports to the EU-28 for the year 2015 [19]. The most imported agricultural products were soybeans, maize and raw sugar cane (Figure 2), whose total quantity is responsible for over 60% of the imports.
The total volume of blue water virtually imported to the EU via agricultural products in 2015 summed up to 11 km3. When this value is translated to WSF units, the figure is much higher, amounting to 409 km3 world-eq. This is indicative that the agri-food products imported to the EU originate mainly from countries with higher water scarcity than the world average. The product categories cotton and nuts cause more than half of the total blue water imports and WSF (Figure 2), even though the imported quantity by weight amounts to only 2% of the total imports.
This can be explained by the fact, that these products are water intensive and grown in water-scarce countries, which leads to high irrigation requirements. Cotton comes to the EU mainly from Turkey, Egypt, India and Pakistan, which are countries with high regional water scarcity [18]. Nuts for EU consumption are produced primarily in the US, Turkey and Vietnam, which have areas of moderate to high water scarcity and where blue water availability varies seasonally [18].
Among nuts, almonds have the highest WSF. Pistachios rank second, coming mainly from the US and Iran. It is to be observed that the water demand for pistachios in Iran is six times larger than in the US [7].
Further, rice is a crop that is mainly cultivated using flood irrigation, which requires high amounts of water. Thus, it is considered as one of the largest water consumers among all crops [21]. According to the Food and Agriculture Organization of the United Nations (FAO) [22], rice covers almost half of the irrigated cereal area. It is estimated that 24–30% of the total world’s freshwater withdrawals are directed to rice production [23]. The highest WSF from European rice imports is caused in Pakistan (62%), Egypt (17%) and India (11%). These countries are subject to blue water availability fluctuations throughout the year. Typically, the demand for irrigation is high when water availability is low. Both high irrigation requirements and regional blue water scarcity contribute to the considerable WSF of this crop, which amounts to 18% of the total WSF caused by European agricultural imports.
The largest WSF of maize imports to the EU occurs in Ukraine (72%) and in the Russian Federation (23%). In Ukraine, the main production regions for maize are located in the eastern and southern parts of the country, where precipitation rates are too low for supporting the growth of the crop causing the need. Therefore, irrigation is needed to guarantee sufficient yields. Between 2007 and 2012, the area for maize irrigation in Ukraine rose by 73% [24]. Russia has been expanding its maize production especially in the southern part of the country, namely in the Volgograd area, which is considered a semi-arid region where irrigation requirements are relatively high [25].
For soybeans, the crop-specific WSF is not higher than the WSF of other categories, however, due to the large import quantity of this product, it has a significant impact (see Figure 2). Its production takes place mainly in the US (98%). Other soybeans exporters, such as Argentina and China, are much less important from the perspective of water scarcity (<1% of the WSF due to soybeans). Around 10% of the US soy is produced under irrigation with a water consumption more than twice as high as the world average [26] which explains why soy from the US bears the largest WSF. The remaining countries produce soybeans mostly in rain-fed systems.
Sugar cane imported by the EU comes mainly from Brazil, Mozambique and Sudan. Even though Brazil is the main exporter by weight (14%), only 0.2% of the WSF due to sugar cane takes place there. In contrast, only 8% of the imported sugar cane came from Sudan, but the highest WSF occurs there (~80%). Sugar cane is one of the most irrigated crops in Sudan and its production depends almost completely on irrigation water. Sudan has been suffering from water shortages in recent years [27]. Among the African countries, it has by far the largest irrigated area for sugar cane in high water risk regions [28].

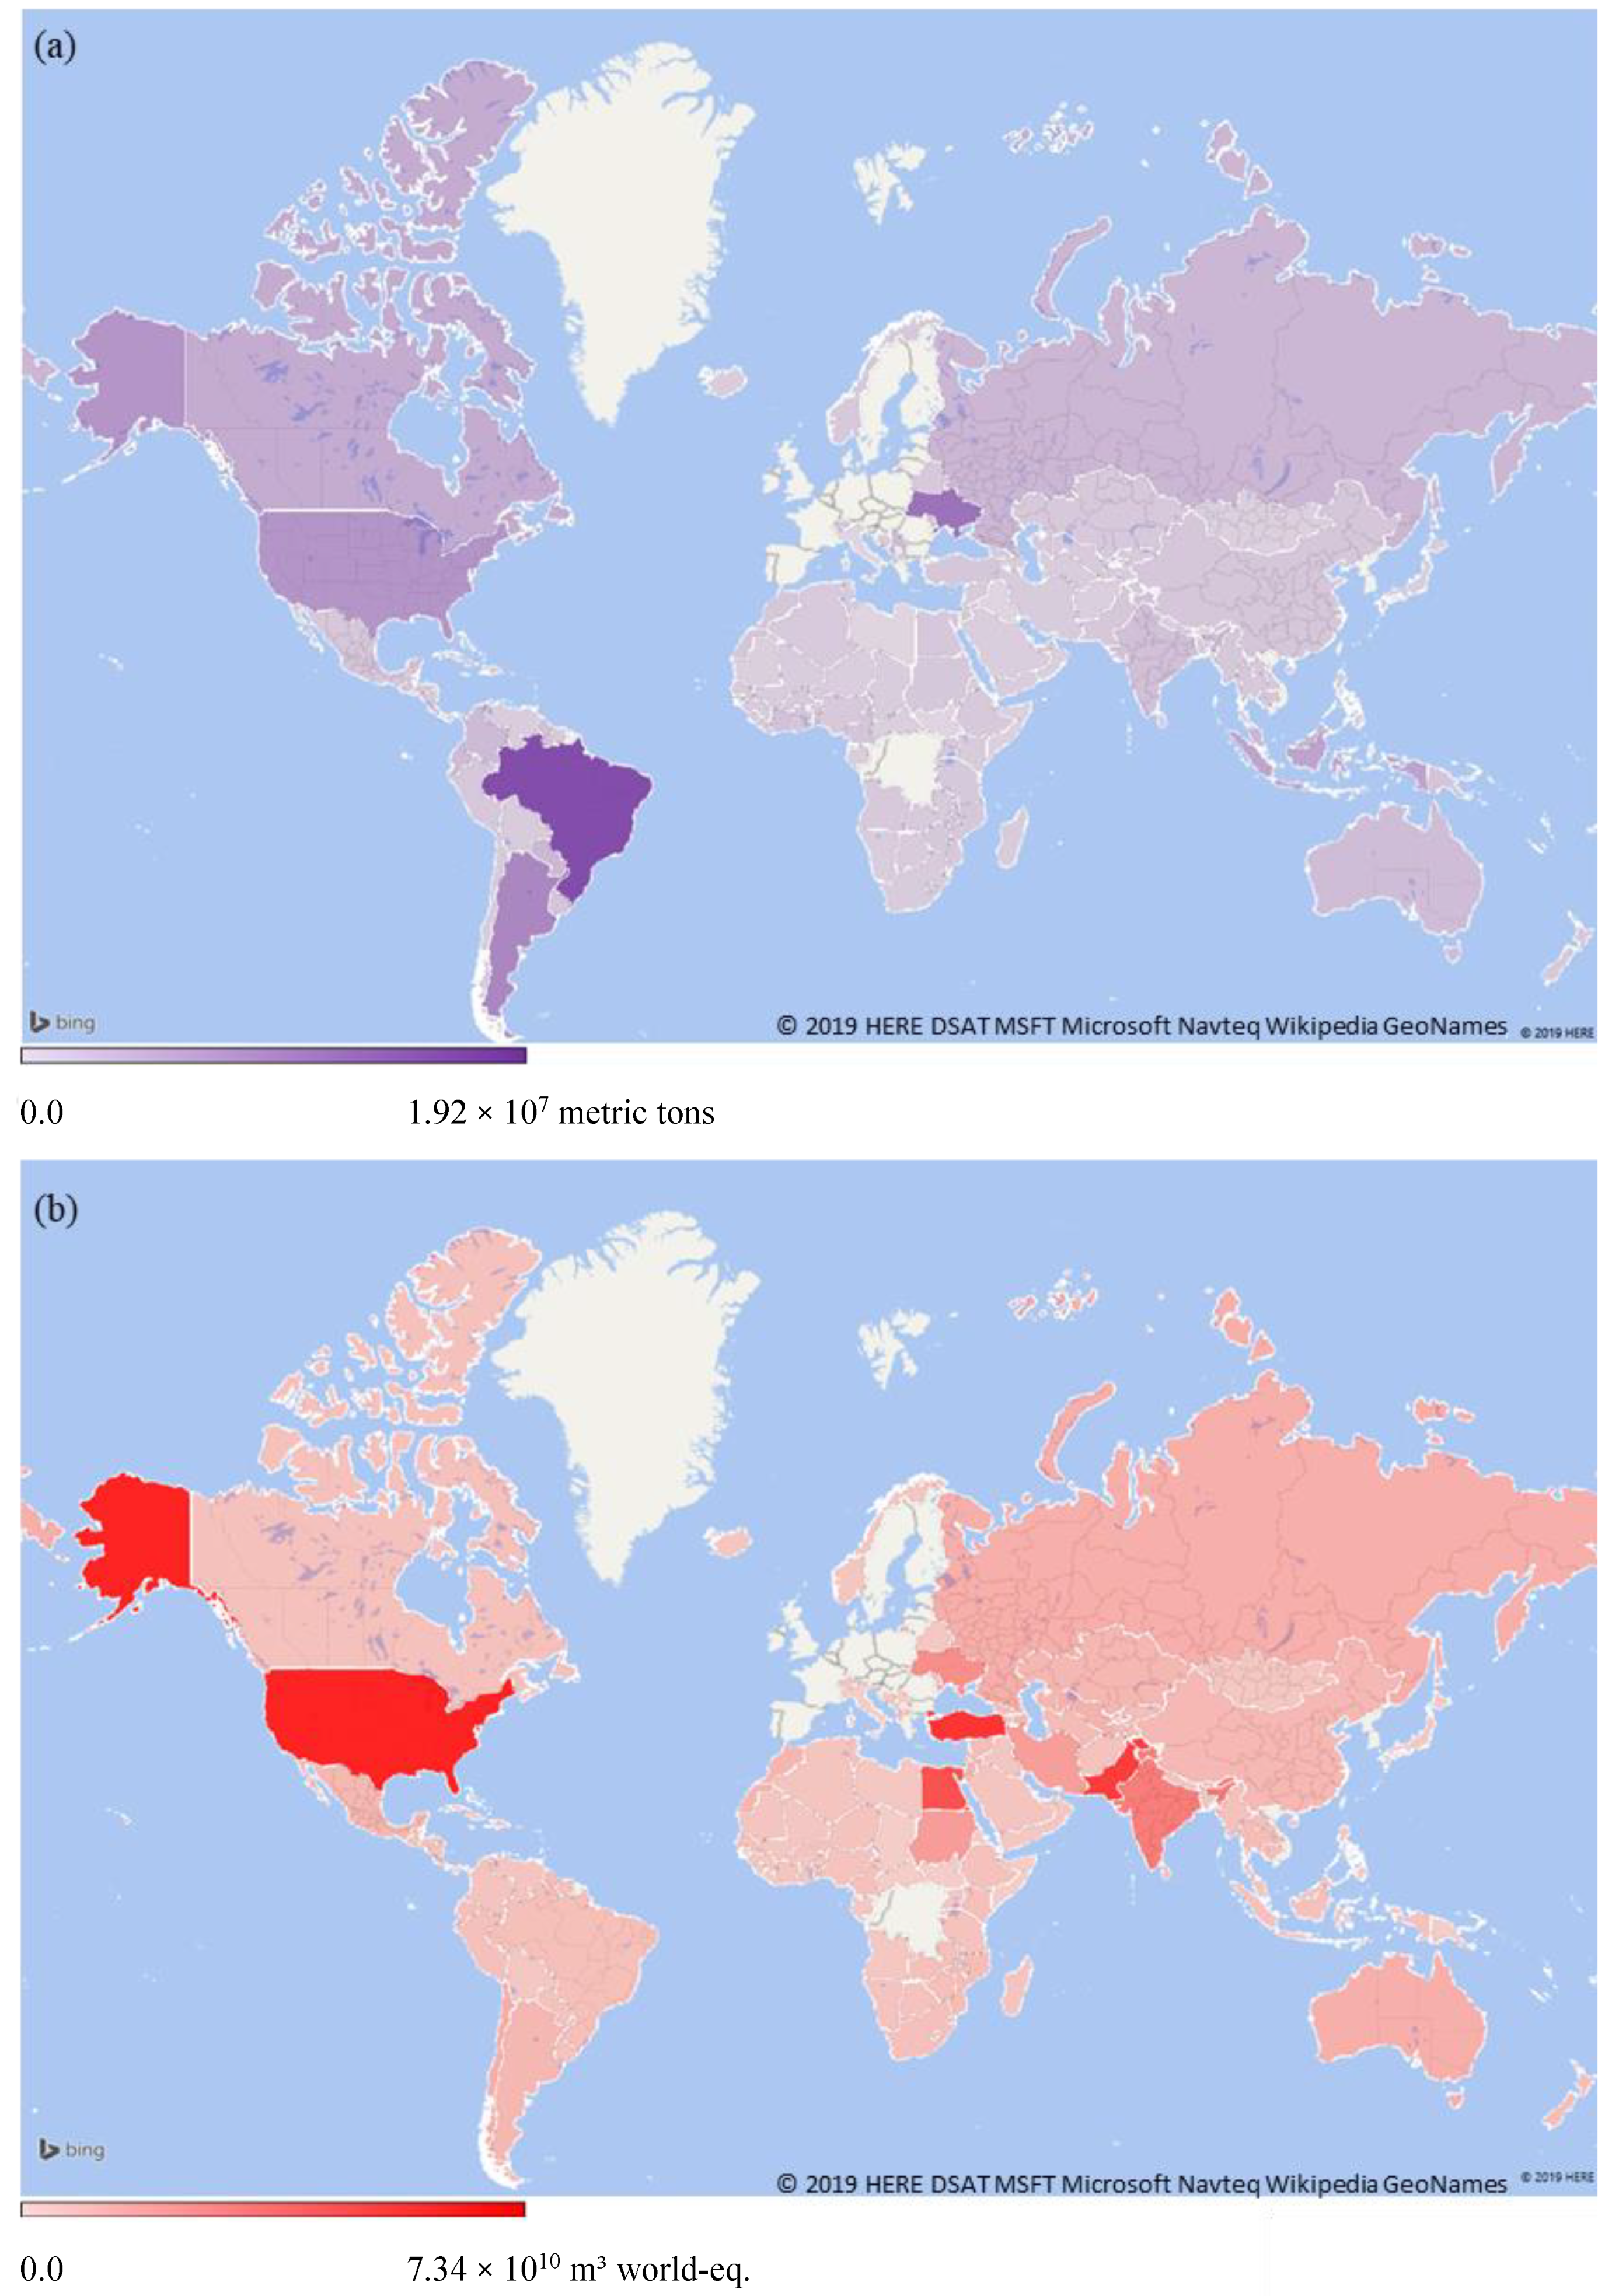
3.2. Water Scarcity Footprint Hotspots on a Country Level

Figure 3 compares the import flows of agricultural products to the EU by mass and by their WSF. A comprehensive interactive online-tool for the visualization of these flows was also created in the framework of this study [29]. Of the 185 countries assessed, the largest imports by product mass originate from Brazil (20%), Ukraine (14%), Argentina (10%), US (8%) and Indonesia (6%). The key role of Brazil in sustaining the European agricultural consumption has been highlighted in a previous work, which has found that Europe imports 41% of the Brazilian virtual water embedded in agricultural products traded globally [30]. Despite the large product amounts, the WSF associated with the imports from Brazil accounts for less than 1% of the total WSF. This result can be explained by relatively low irrigation requirements and water scarcity at country level. For this reason, Brazil is not being identified as a hotspot related to the WSF.
The highest WSF associated with EU imports occurs in the US (17%), Pakistan (17%), Turkey (15%), Egypt (12%) and India (7%). In general, the highest mass flows come from South and North America, while the largest WSF of imports takes place in Asia, Northern Africa and the US. These results are consistent with FAO data (2014) according to which circa 78% of world’s harvested irrigated crops are grown in Asia and the US, the latter having the third world’s largest irrigated area [22]. Overall, a correlation between the imported mass and the WSF can be seen for the US only (8% of the imports by mass and 17% of the WSF). In other countries, high WSF results are caused by high irrigation demands and local water scarcity, which significantly raises the WSF even if imports are low (e.g., the imports from Turkey, Egypt and Pakistan amount to 4.1%, 1.3% and 1.0%, respectively).
In the year 2015, the US was the EU’s fourth largest trading partner considering the volume of agricultural products [19]. Thus, the large trading volume contributes to the high WSF. However, the most decisive factor for this result is that the US are by far the largest exporter of nuts to the European Union, especially of shelled almonds and walnuts [31]. Nuts are responsible for 61% of the total WSF caused by EU imports in 2015. Furthermore, soybeans imported to the EU also have a significant impact on the WSF in the US, but in this case due to the large mass flow. Nuts and soybeans account together for almost 85% of the WSF that EU imports cause in the US.
Pakistan and India export similar agricultural products to the EU, such as cotton, rice and cane molasses. Yet, the local production conditions are very different, since in Pakistan many harvesting regions need to be fully irrigated [32]. Analyzing the cotton exports to the EU in 2015, India exported over four times more than Pakistan. However, the WSF of these imports is only twice as high as in Pakistan. Taking an even more drastic example, the imports of rice from India exceeded those from Pakistan by 188%. In contrast, the WSF from Pakistan for this crop is 538% higher. The higher amount of blue water required in Pakistan and the higher local water scarcity (i.e., higher AWARE value) explain these results.
Cotton and nuts are the largest imported products by weight from Turkey, accounting for approximately 96% of the total WSF that European agricultural imports cause in the country. Turkey is the largest exporter of shelled hazelnuts to the EU [19]. Hazelnut plants are highly dependent on weather conditions, especially high humidity is indispensable for the growth [33]. Due to elevated water demand of the crop and relatively low precipitation rates in Turkey, hazelnut requires supplementary irrigation. As to cotton, even though climatic conditions in Turkey are not adequate for growing this crop, very high yields can be achieved if irrigation is applied. The cotton irrigation water requirement in Turkey is among the largest in the world [32].
In Egypt, cotton and rice are responsible for 80% of the total WSF caused by the EU imports. The weight of imported cotton from Egypt is 2.6 times smaller than rice but the WSF of cotton is 2.3 times larger. Same as in Pakistan, the cotton water requirement in Egypt is among the highest in the world and to cope with this, the whole harvesting area needs to be irrigated.

4. Discussion

4.1. Trends

The European agricultural imports require significant amounts of irrigation water (11 km3 per year) consumed in partly water scarce exporting countries. The effects of climate change such as irregular precipitation and expansion of drylands [1] will further increase the demand for irrigation—while physical and legal availability is often decreasing. For the example of Brazil as largest exporter of agricultural products to EU, lower precipitation rates in several regions have led to a water crisis in recent years, causing considerable restrictions to permits in using irrigation water. In one of the affected regions, the irrigation area decreased by 75% between 2014 and 2017 [34]. In 2016, in the US, also due to severe drought conditions, some regions allotted to nuts’ production witnessed a decrease of 25% of the yield [35].
The identification of WSF hotspots at the product and country level is relevant to track eventual vulnerabilities. This study has shown that the highest share of the EU external WSF takes place in the US, Pakistan, Turkey, Egypt and India mainly due to the production and export of cotton, nuts and rice. Maize imports also contribute to a considerable WSF, especially in Ukraine. It was also shown that the highest impacts on the WSF do not necessarily result from high import amounts, as in the case of nuts.
As for cotton, its imports to EU decreased more than twice between 2000 and 2015 [19]. This could mean on the one hand that the textile industry has been using more artificial fibers, and on the other hand that the production of clothes has been outsourced to other countries. In this study, only raw materials have been analyzed, therefore a comprehensive analysis of ready-made cotton textiles is needed.
Nuts and nut-based milk consumption increased in the last decades, since they are considered as “super foods” and represent an alternative to animal-derived milk [35]. The EU is the largest world market for edible nuts, representing more than 40% of total world imports [36]. For instance, EU’s population grew 4.4% between the years 2000 and 2015. In the same time period, nuts imports increased by 60% [19].
The amount of rice imports to the EU remained constant in recent years [19], but the increase of water scarcity in the exporter countries such as India and Pakistan may pose risks to its supply to Europe and water availability in the exporting countries. It has been reported by several authors that rising water scarcity threatens whole rice fields, which may interfere in the prices and volumes traded worldwide [37].
As to maize, its imports by the EU have increased between the years 2000 and 2015 by over 400% [19]. Maize imports are expected to grow even higher, in order to compensate for harvest diminishment in EU countries due to lower precipitation rates and to cope with the upstream demand as feed for domestic livestock production [38].

4.2. Limitations of the Study

Only blue water (irrigation water) was assessed in this study, while the green water consumption was not considered. It does not mean that green water is deemed as irrelevant. On the contrary, most of the world’s agricultural production relies on green water [39]. However, green water can only be used by local plants (either ecosystems or agriculture) and—if considered—should be quantified in comparison to natural evapotranspiration. Further, a green water use will hardly affect downstream blue water users and, thus, is beyond the scope of a water scarcity footprint. Nevertheless, green water should be used as efficiently as possible—also to reduce the need for irrigation (blue water).
The grey water (i.e., polluted water) was also not evaluated in this study. The reason for this is that grey water calculation is associated with high uncertainty due to several assumptions made, e.g., 10% of nitrogen leaching, and some limitations (consideration of nitrogen as a the only contaminant) [20].
For the calculation of WSF, AWARE impact factors were used, which are aggregated on a country and annual level. However, the water scarcity may vary within a country (especially relevant for large countries such as USA and Brazil) and throughout the year (e.g., countries influenced by monsoon). The procedure of calculating country and annual average AWARE factors based on consumption weighted averages party compensates for this shortcoming. Water scarcity in regions/month in which a high share of the total consumption takes place dominate the country/annual average and it is likely that the crops considered in this study are irrigated in these regions and during these months mainly. Nevertheless, some products may be grown in regions and during periods in which only a small share of total consumption occurs. Especially for those products, a more detailed resolution on a monthly and region (or basin) level may deliver more accurate results [15]. However, even though AWARE factors exist in such a resolution, trade data provided in international databases is only available on a country level and in an annual aggregation [19].

4.3. Possible Mitigation Measures

The dietary patterns worldwide are changing and people tend to consume more proteins than carbohydrates and to eat fresh vegetables and fruits all year long [40]. Further, it has become a matter of course in the EU that an agricultural product is available in the supermarkets all year long. As a consequence, the production of crops during dry seasons requires irrigation. In contrast, the consumption of seasonal and regional food could decrease the pressure on irrigation worldwide.
Food waste is also an issue that can be tackled from the side of the end-consumer to help reducing the WSF associated with the EU imports. According to FAO, more than one third of the food is lost between “field and fork” and with this, a large amount of water required for the production [22]. From the producers’ side, the improvement of the water use efficiency in agriculture should be pursued, along with better soil and water management [1].
Investments in irrigation efficiency deliver an important contribution for lowering unproductive soil evaporation and with this water consumption and the WSF of agricultural products. Techniques such as drip and deficit irrigation and advanced irrigation scheduling may lower water use and support farmers at dealing with water scarcity. As shown in the study of Cetin and Bilgel in a case study in Turkey [41], applying drip irrigation in cotton cultivation raised cotton yield by 21%. Oweis et al. [42] demonstrated that deficit irrigation can be used in cotton cultivation affected by high water stress to sustain the yields. Also, governments should take the lead in facilitating technology transfer to smaller farmers and promoting good agricultural practices [43]. Their role is vital, because some countries experience economic water scarcity as a consequence of limited infrastructure development. Such measures could be subsidized by EU countries, since the existing strategies are mostly domestic, e.g., for water supply and distribution [44] and mitigation measures against water scarcity [45], disregarding the large external water scarcity footprint.

Supplementary Materials

The following are available online at https://www.mdpi.com/2079-9276/8/3/141/s1, excel file containing import weight, blue water consumption and water scarcity footprint of the EU agricultural imports by product category, product and country for 2015.

Author Contributions

Study concept, A.M.-F. and M.B.; methodology, M.B., I.D., N.M. and M.N.; software, N.M. and M.B.; writing—original draft preparation, I.D., N.M. and M.N.; writing—review and editing, M.B. and N.M.; supervision, M.F.; project administration, M.B.; funding acquisition, A.M.-F. and M.B.

Funding

This research was funded by Evangelisches Werk für Diakonie und Entwicklung e.V., Brot für die Welt—Evangelischer Entwicklungsdienst.

Conflicts of Interest

The authors declare no conflict of interest.

References

  1. UN-Water. The United Nations World Water Development Report, Nature-Based Solutions for Water; UNESCO: Paris, France, 2018. [Google Scholar]
  2. IPCC. Summary for policymakers. In Global Warming of 1.5 °C. An IPCC Special Report on the Impacts of Global Warming of 1.5 °C above Pre-Industrial Levels and Related Global Greenhouse Gas Emission Pathways, in the Context of Strengthening the Global Response to; IPCC: Geneva, Switzerland, 2018. [Google Scholar]
  3. FAO. FAO Aquastat. 2018. Available online: http://www.fao.org (accessed on 20 May 2019).
  4. Vörösmarty, C.J.; Green, P.; Salisbury, J.; Lammers, R.B. Global water resources: Vulnerability from climate change and population growth. Science 2000, 289, 284–288. [Google Scholar] [CrossRef] [PubMed]
  5. FAO. The Future of Water and Agriculture—Trends and Challenges; Food and Agriculture Organization of the United Nations: Rome, Italy, 2017. [Google Scholar]
  6. Allan, J.A. Virtual Water: A Long Term Solution for Water short Middle Eastern Economies? Water Issues Group, School of Oriental African Studies, University of London: London, UK, 1997; pp. 24–29. [Google Scholar]
  7. Hoekstra, A.Y.; Mekonnen, M.M. The water footprint of humanity. Proc. Natl. Acad. Sci. USA 2012, 109, 3232–3237. [Google Scholar] [CrossRef] [PubMed] [Green Version]
  8. Ercin, A.E.; Mekonnen, M.M.; Hoekstra, A.Y. Sustainability of national consumption from a water resources perspective: The case study for France. Ecol. Econ. 2013, 88, 133–147. [Google Scholar] [CrossRef]
  9. Van Oel, P.R.; Mekonnen, M.M.; Hoekstra, A.Y. The external water footprint of the Netherlands: Geographically-explicit quantification and impact assessment. Ecol. Econ. 2009, 69, 82–92. [Google Scholar] [CrossRef]
  10. WWF. Belgium and its Water Footprint; WWF: Bruxelles, Belgium, 2011. [Google Scholar]
  11. WWF. Das Importierte Risko—Deutschlands Wasserrisiko in Zeiten der Globalisierung; WWF Deutschland: Berlin, Germany, 2014. [Google Scholar]
  12. Hoekstra, A.Y.; Mekonnen, M.M. Imported water risk: The case of the UK. Environ. Res. Lett. 2016, 11, 055002. [Google Scholar] [CrossRef]
  13. Berger, M.; Finkbeiner, M. Methodological challenges in volumetric and impact oriented water footprints. J. Ind. Ecol. 2013, 17, 79–89. [Google Scholar] [CrossRef]
  14. Scherer, L.; Pfister, S. Global biodiversity loss by freshwater consumption and eutrophication from Swiss food consumption. Environ. Sci. Technol. 2016, 50, 7019–7028. [Google Scholar] [CrossRef]
  15. Finogenova, N.; Dolganova, I.; Berger, M.; Núñez, M.; Blizniukova, D.; Müller-Frank, A.; Finkbeiner, M. Water footprint of German agricultural imports: Local impacts due toglobal tradeflows in a fifteen-year perspective. Sci. Total Environ. 2019, 662, 521–529. [Google Scholar] [CrossRef]
  16. ISO 14046. Water Footprint—Principles, Requirements and Guidance; International Organization for Standardization: Geneva, Switzerland, 2014. [Google Scholar]
  17. Vanham, D.; Bidoglio, G. A review on the indicator water footprint for the EU28. Ecol. Indic. 2013, 26, 61–75. [Google Scholar] [CrossRef]
  18. Boulay, A.M.; Bare, J.; Benini, L.; Berger, M.; Lathuillière, M.J.; Manzardo, A.; Ridoutt, B. The WULCA consensus characterization model for water scarcity footprints: Assessing impacts of water consumption based on available water remaining (AWARE). Int. J. Life Cycle Assess. 2018, 23, 368–378. [Google Scholar] [CrossRef]
  19. Chatham House. Resourcetrade Earth. Available online: https://resourcetrade.earth/ (accessed on 7 February 2018).
  20. Mekonnen, M.M.; Hoekstra, A.Y. The green, blue and grey water footprint of crops and derived crop products. Hydrol. Earth Syst. Sci. 2011, 15, 1577–1600. [Google Scholar] [CrossRef] [Green Version]
  21. Chapagain, A.K.; Hoekstra, A.Y. The Green, Blue and Grey Water Footprint of Rice from Both a Production and Consumption Perspective; Tehnical Report No. 40; UNESCO-IHE Institute for Water Education: Delft, The Netherlands, 2010; pp. 1–62. [Google Scholar]
  22. FAO. Facts and Figures about Irrigation 2014. Available online: http://www.fao.org/nr/water/aquastat/didyouknow/index3.stm (accessed on 14 August 2018).
  23. Bouman, T.P.; Lampayan, B.A.M.; Tuong, R.M. Water Management in Irrigated Rice: Coping with Water Scarcity; International Rice Research Institute: Los Banos, Philippines, 2007. [Google Scholar]
  24. FAO. Water along the Food Chain: Ukraine; FAO: Rome, Italy, 2016. [Google Scholar]
  25. Kuznetsov, P.I.; Novikov, A.E. Energy and resource conservation in the grain corn cultivation on irrigated lands. Russ. Agric. Sci. 2013, 39, 474–478. [Google Scholar] [CrossRef]
  26. Fry, J.P.; Love, D.C.; MacDonald, G.K.; West, P.C.; Engstrom, P.M.; Nachman, K.E.; Lawrence, R.S. Environmental health impacts of feeding crops to farmed fish. Environ. Int. 2016, 91, 201–214. [Google Scholar] [CrossRef] [PubMed] [Green Version]
  27. FAO. Sudan: Irrigation and Drainage. 2015. Available online: http://www.fao.org/nr/water/aquastat/countries_regions/SDN/ (accessed on 9 October 2018).
  28. Hess, T.M.; Lennard, A.T.; Daccache, A. A sweet deal? Sugarcane, water and agricultural transformation in Sub-Saharan Africa. Glob. Environ. Chang. 2016, 39, 181–194. [Google Scholar] [CrossRef] [Green Version]
  29. Finogenova, N. Water Footprint of Agricultural Imports into Germany and the European Union. 2019. Available online: http://wf-tools.see.tu-berlin.de/wf-tools/tradeVisEU/index.html (accessed on 6 August 2019).
  30. Da Silva, V.; de Oliveira, S.; Hoekstra, A.; Dantas Neto, J.; Campos, J.; Braga, C.; de Holanda, R. Water footprint and virtual water trade of Brazil. Water 2016, 8, 517. [Google Scholar] [CrossRef]
  31. USDA. Tree Nuts Annual EU-28, Global Agricultural Information Network. 2016. Available online: https://gain.fas.usda.gov/Recent GAIN Publications/Tree Nuts Annual_Madrid_EU-28_9-18-2017.pdf (accessed on 10 January 2019).
  32. Chapagain, A.K.; Hoekstra, A.Y.; Savenije, H.H.G.; Gautam, R. The water footprint of cotton consumption: An assessment of the impact of worldwide consumption of cotton products on the water resources in the cotton producing countries. Ecol. Econ. 2006, 60, 186–203. [Google Scholar] [CrossRef]
  33. Ozbag, N.; Leonardi, E. Turkey Tree Nuts Annual Report; Tehnical Report No. TR6040; USDA Foreign Agricultural Service: Washington, DC, USA, 2016; pp. 1–15.
  34. ANA. Conjuntura dos Recursos Hídricos: Informe 2015. Available online: http://conjuntura.ana.gov.br/ (accessed on 15 July 2018).
  35. USDA Foreign Agricultural Service. EU-28 Tree Nuts Annual. 2017. Available online: https://gain.fas.usda.gov/Recent GAIN Publications/Tree Nuts Annual_Madrid_EU-28_9-18-2017.pdf (accessed on 15 April 2019).
  36. CBI. Exporting Edible Nuts and Dried Fruits to Europe. 2018. Available online: https://www.cbi.eu/market-information/processed-fruit-vegetables-edible-nuts/edible-nuts-dried-fruits/europe/ (accessed on 4 March 2019).
  37. Tuong, B.A.M.; Bouman, T.P. Water Productivity in Agriculture: Limits and Opportunities for Improvement; CAB International: Wallingford, UK, 2003. [Google Scholar]
  38. USDA. Global Markets: Corn—EU Imports to Rise Even Higher. 2018. Available online: https://agfax.com/2018/09/12/global-markets-corn-eu-imports-to-rise-even-higher/ (accessed on 20 April 2019).
  39. Schyns, J.F.; Hoekstra, A.Y.; Booij, M.J.; Hogeboom, R.J.; Mekonnen, M.M. Limits to the world’s green water resources for food, feed, fiber, timber, and bioenergy. Proc. Natl. Acad. Sci. USA 2019, 116, 4893–4898. [Google Scholar] [CrossRef] [PubMed]
  40. He, P.; Baiocchi, G.; Hubacek, K.; Feng, K.; Yu, Y. The environmental impacts of rapidly changing diets and their nutritional quality in China. Nat. Sustain. 2018, 1, 122–127. [Google Scholar] [CrossRef]
  41. Cetin, O.; Bilgel, L. Effects of different irrigation methods on shedding and yield of cotton. Agric. Water Manag. 2002, 54, 1–15. [Google Scholar] [CrossRef]
  42. Oweis, T.Y.; Farahani, H.J.; Hachum, A.Y. Evapotranspiration and water use of full and deficit irrigated cotton in the Mediterranean environment in northern Syria. Agric. Water Manag. 2011, 98, 1239–1248. [Google Scholar] [CrossRef]
  43. Mancosu, N.; Snyder, R.; Kyriakakis, G.; Spano, D. Water scarcity and future challenges for food production. Water 2015, 7, 975–992. [Google Scholar] [CrossRef]
  44. European Commission. Resource and Economic Efficiency of Water Distribution Networks in the EU Final Report; European Commission: Brussels, Belgium, 2013.
  45. European Commission. Water scarcity and droughts in the European Union; European Commission: Brussels, Belgium, 2011.
Figure 1. Methodology followed for the water scarcity footprint (WSF) calculation. Red numbers indicate the applied cut-offs for the import-mix (adapted from Finogenova et al. [15]).
Resources 08 00141 g001
Figure 2. Comparison between the import amount (Mt) and the WSF (km3 world-eq.) of the most water-intensive product categories.
Resources 08 00141 g002
Figure 3. Import flows of agricultural products to the EU in 2015 (a) by weight; (b) by WSF.
Resources 08 00141 g003

