
Terahertz Spectroscopic Analysis in Protein Dynamics: Current Status
by
 , , , ,
Tiziana Mancini
1 ,
,
Rosanna Mosetti
1,
Augusto Marcelli
2,3,
Massimo Petrarca
4,5,
Stefano Lupi
1,2 and
Annalisa D’Arco
1,2,4,*
1
Physics Department, University of Rome ‘Sapienza’, P.le Aldo Moro 5, 00185 Rome, Italy
2
National Institute for Nuclear Physics—Laboratori Nazionali di Frascati (INFN-LNF), Via E. Fermi 54, 00044 Frascati, Italy
3
Rome International Centre for Materials Science Superstripes, Via dei Sabelli 119A, 00185 Rome, Italy
4
Department of Basic and Applied Sciences for Engineering (SBAI), University of Rome ‘Sapienza’, Via Scarpa 16, 00161 Rome, Italy
5
National Institute for Nuclear Physics–Section of Rome ‘Sapienza’, P.le Aldo Moro 2, 00185 Rome, Italy
*
Author to whom correspondence should be addressed.
Radiation 2022, 2(1), 100-123; https://doi.org/10.3390/radiation2010008
Submission received: 31 December 2021
/
Revised: 27 January 2022
/
Accepted: 1 February 2022
/
Published: 7 February 2022
Abstract
:Simple Summary
Proteins are large biomolecules carrying out several different indispensable activities in all living organisms. As their chemical composition and structure lead to specific functionalities, possible variations alter conformational transition and cause dysfunctions and pathological diseases. An emerging technique for their detection and characterization is THz spectroscopy. In this review, we illustrate its potentialities and drawbacks in protein study. We report the most remarkable experimental works of the last decades, constituting decisive steps for the scientific and technological progress in THz spectroscopy for biomolecules. The importance of information provided by THz spectroscopy is outlined, conforming it as powerful and useful technique for topical open questions, too.
Abstract
Proteins play a key role in living organisms. The study of proteins and their dynamics provides information about their functionality, catalysis and potential alterations towards pathological diseases. Several techniques are used for studying protein dynamics, e.g., magnetic resonance, fluorescence imaging techniques, mid-infrared spectroscopy and biochemical assays. Spectroscopic analysis, based on the use of terahertz (THz) radiation with frequencies between 0.1 and 15 THz (3–500 cm−1), was underestimated by the biochemical community. In recent years, however, the potential of THz spectroscopy in the analysis of both simple structures, such as polypeptide molecules, and complex structures, such as protein complexes, has been demonstrated. The THz absorption spectrum provides some information on proteins: for small molecules the THz spectrum is dominated by individual modes related to the presence of hydrogen bonds. For peptides, the spectral information concerns their secondary structure, while for complex proteins such as globular proteins and viral glycoproteins, spectra also provide information on collective modes. In this short review, we discuss the results obtained by THz spectroscopy in the protein dynamics investigations. In particular, we will illustrate advantages and applications of THz spectroscopy, pointing out the complementary information it may provide.
Keywords:
terahertz; terahertz spectroscopy; amino acids; peptide; proteins; conformation; protein dynamics
1. Introduction
Amino acids/proteins participate in the formation of cells and tissues, and they are responsible for life activities in living organisms, such as enzymes, antibodies, signaling and transporting molecules, cell membrane, metabolic or catalytic functions, etc. [1,2,3,4]. Notably, they have a crucial role in various fields and applications, such as health, medicine and food safety. For example, rapid assessment of the contents and types of proteins in food can improve its quality, and the presence of specific proteins and their dynamics in blood samples can identify a pathological process or a disease at an early state. An important role of proteins is also played in viral pathogenesis, where membrane proteins are generally responsible for infectious processes, anchoring the virus to human receptors, as happens for the SARS-CoV-2 coronavirus [5,6].
Proteins are polypeptide chains formed by the progressive condensation reactions that create the peptide bond between the α-amino group and the α-carboxyl group of two amino acids [7,8]. The amino acid sequence assumes structural hierarchy, allowing the macromolecules to bend and generating typical three-dimensional protein structures: primary, secondary, tertiary and quaternary [7,8]. These structures are correlated to specific protein functionalities. Then, amino acids mutations and alterations of the primary sequence can produce anomalies and transitions to different conformational states linked to functionally relevant phenomena. Small differences in the primary structure imply completely different biological functions; for example, oxytocin and vasopressin are two oligopeptides with similar structure but different biological functionalities. Still, in patients with sickle cell anemia, a residue of glutamic acid in the chain is replaced by a valine residue due to a genetic error.
Therefore, the evaluation of protein kinds and quantities is an important index of protein function analysis, clinical diagnosis, recovery check, quality testing of biological products, etc. [9]. Several methods are used for studying proteins and their dynamics: techniques such as ultraviolet (UV) absorption, Lowry and Bradford assays, bicinchoninic acid and Kjeldahl methods, to mention a few [10,11,12,13,14,15,16,17], are used for the protein quantification; other significant semi-quantitative analyses to evaluate the protein kinds include chromatography methods, electrophoresis and immunoassays [18,19,20,21,22,23,24,25]. Among these, in particular, the protein immunoassay is conventionally used for studying gene expression at the protein level, detection of the activity of antibodies and early diagnosis of diseases. The high specificity and sensitivity are guaranteed by using the specific expression information of the homologous antibody of the protein that determines its presence and its amount. The antibody method involves several sophisticated, time-consuming, tedious and expensive processes. These criticalities emerged especially during the pandemic crisis of 2020, where the demand for immune analysis for early COVID-19 diagnosis has grown exponentially [26,27]. Thus, reliable and label-free protein analysis methods could support the conventional approaches improving detection efficiency in addition to reduction in the screening time and cost. For a three-dimensional visualization of protein conformational structures in cell systems, spectroscopy and microscopy approaches can be employed such as fluorescence spectroscopy and microscopy, atomic spectroscopy, confocal [28] and multi-photon microscopy [29], optical nonlinear imaging [30,31,32,33], super resolution methods, electron microscopy, etc. [34,35].
Spectroscopy and imaging based on THz radiation, ranging from tens of gigahertz (GHz) to several THz, are new methods which only in recent years emerged with their potential for protein detection and characterization (Figure 1). Biological vibrations and rotations, involving intra/inter molecular weak hydrogen bonds, van der Waals forces, conformational changes, non-bonded hydrophobic and hydrophilic interactions [4,36], are associated with vibrational and rotational energy that mostly lie in the THz domain. The optical parameters such as absorption coefficient and refractive index, characterizing the resonances, reflect the conformational changes and other large-scale deformations involving charge movement and relocation inside the biomolecule. Relative to proteins, the capability of THz to qualify and quantify them is recognized [37,38].
Here, we review results obtained by THz spectroscopy and imaging in the study of amino acids and protein dynamics. In the first sections of this review, we discuss the experimental techniques commonly used for protein detection, their limitations and some critical issues. Then, we illustrate the advantages and applications of THz radiation providing complementary information to existing techniques. Finally, we discuss perspectives and other potential THz contributions in the field of biomolecules.
2. Consolidate Technologies for Amino Acid/Protein Detection
There are two well-established methodological approaches to protein characterization: total protein nitrogen measurements and chemical and structural identification of a specific protein, schematically summarized in Figure 2. The determination of total protein nitrogen is a proximity tool for the early and rapid quantification of the protein content. The Kjeldahl [10] and Dumas methods are widely used for nutrition labeling and quality control [15,16,17]. Other techniques are used and preferred for their accuracy, low cost and great applicability in many fields where the identification of proteins is required, such as the bicinchoninic acid, biuret and Lowry methods as well as UV absorption. However, many of these are time-consuming and can only measure the total organic nitrogen present in the sample.
The most common immunoassays are enzyme-linked immunosorbent assays, lateral flow immunoassay and Western blotting, but other analytical technologies [16,18,19,20,21,22,23,24,25] have been adopted in biomedical and clinical studies. Some analytical methods for monitoring and detection are based on the ability to propagate/amplify biomolecules in cell cultures or on the detection of a specific antibody. However, these laboratory diagnostic techniques require time to detect the specific immune response and its quantification. Especially, when used for virus recognition or metabolic evaluation the task is challenging, and some immunoassays may give false positive results. Other techniques, such as microscopy, fluorescence and spectroscopy, are preferred in describing the protein dynamics. Here we briefly recall the most used techniques: X-ray crystallography, nuclear magnetic resolution (NMR), Cryo-electron microscopy (Cryo-EM), fluorescence, circular dichroism (CD) and vibrational spectroscopies, including infrared (IR) and Raman ones.
X-ray crystallography, NMR and Cryo-EM mainly concern investigations of the three-dimensional structure of molecules. X-ray crystallography exploits the diffraction lattice for collecting an electron density map of the crystal. The need for a solid crystalline sample and the ionizing properties of X-rays represent limitations in the study of proteins in the physiological environment [39,40,41,42].
Most studies in organic chemistry involve the probing of hydrogen atoms with NMR [43,44,45]. The process of relaxation of nuclear magnetic spins from higher to lower energy levels after a certain time-span is the principle of NMR to achieve structural atomic information.
Cryo-EM provides a 3D structure of cells and macromolecules visualized with 5–8 nm spatial resolution. Although Cryo-EM allows high spatial resolutions, suitable for studying the cytoskeleton and the complex surface structures of viruses, the need of a frozen sample, although useful since it fixes the protein in a well-defined configuration, is not ideal to the investigate protein dynamics.
Fluorescence spectroscopy is an alternative method that works most accurately at very low concentrations of fluorophores, giving structural information about a single molecule or protein complex interactions. It exploits mainly the intrinsic and extrinsic protein fluorescence. It may contribute to reconstruct structural effects induced by pH and solvent composition, to measure lifetimes and temporal kinetics. Few proteins possess intrinsic fluorophores, such as tryptophan and tyrosine, but most of them are non-fluorescent. In many of these cases, an external fluorophore can be introduced by chemical coupling or non-covalent binding. This labelling technique allows the development of new fluorescent dyes with different excitation and emission properties. This has promoted the emergence of new techniques for the study of protein dynamics: quenching, fluorescence resonance energy transfer (FRET) [46,47], bioluminescence resonance energy transfer (BRET) [48], fluorescence recovery after photobleaching (FRAP) [49], fluorescence polarization and cross-correlation, and on all microscopy.
However, all spectroscopic/microscopic techniques have clear limitations. Indeed, requiring chemical labels, the biological functionalities can interfere with the protein dynamics; additionally, photo-bleaching can introduce artefacts and limit the measurement repeatability in the microscopic approach. Therefore, it may be desirable to implement real-time, three-dimensional imaging with high spatial resolution, high sensitivity and high chemical selectivity for unlabeled living cells.
Circular dichroism (CD) involves the measurements of small differences in the UV–vis absorption values due to the chirality of biomolecules. The left- and right-handed polarized components of the incident light are absorbed differently by the optically active molecules, which yields a difference in the absorption parameters [50,51,52]. CD spectroscopy is largely adopted to verify the natural secondary structure of proteins and their changes induced by chemical–physical conditions.
Vibrational spectroscopy, including Fourier Transform Infrared (FTIR) and Raman spectroscopy, provides selective, non-destructive identification of the molecules, through the interrogation of molecular roto-vibrational and vibrational modes [53,54,55]. Both FTIR and Raman spectroscopy give similar information about a molecule: FTIR is associated with the change of dipole momentum and Raman with a change of the polarizability, respectively, as a consequence of the matter–light interaction. Their use is typically in chemical and biochemical research of small-molecule compounds and in the identification of synthesized compounds due to their intrinsic chemical selectivity. The nine characteristic vibrational bands (named amide A, B, I, II, III,…, VII, where amide I and II, between 1600 and 1700 cm−1 as well as 1500 and 1600 cm−1 respectively, are the major contributors in the IR spectrum) exhibited by the peptide bonds in the infrared region ensure the recognition of the protein backbone conformation and the assessment of the secondary structure of peptides and proteins [53]. Novel instruments combine the FTIR technique and the features of an evanescent field, probing the sample with the Attenuated Total Reflection (ATR) technique. ATR is frequently used for small amounts of solid and liquid samples, avoiding difficult preparation. Instead, time-resolved FTIR enables the observation of protein reaction at the sub-millisecond timescale, such as the study of the light-driven proton pump bacteriorhodopsin [53]. Nevertheless, linear Raman spectroscopy and microscopy are limited to weak signals and very long times for signal collection. Thus, only recently with the accessibility of ultrafast lasers, coherent Raman Scattering (CRS) techniques are going to assert themselves thanks to the sensitivity at the same molecular vibrations probed in spontaneous Raman spectroscopy and to the nonlinear dependence on the incoming light fields [30,31,32,33].
3. THz Technology for Protein Spectroscopy
In the last two decades, many efforts have been made to improve THz technology, e.g., THz sources and detectors [56,57,58,59,60,61,62,63,64,65,66,67,68,69], discovering new materials with strong THz response [70,71,72,73] and new customizable, flexible and compact devices for spectroscopy [74].
These systems have promoted the diffusion of THz radiation for spectroscopy applications. Thus, it was applied with success in various scientific fields e.g., gas sensing [75,76,77,78,79,80], chemical and pharmaceutical analysis [81,82], condensed matter [83,84,85], identification of crystalline polymorphs, microelectronics and security [86,87,88,89], agri-food industry [90] and cultural heritage [91], including the emerging support in the field of biomedicine and bio-imaging [92,93,94,95,96,97,98,99], etc. Thus, THz spectroscopy has become a valuable tool for rapid and non-invasive detection thanks to many advantages that make it particularly appealing for probing the intermolecular structure and dynamics of biomolecules [95,100,101]. In fact, THz radiation lies between microwave and infrared, being characterized by low photon energy (4 meV @ 1 THz), and it provides energy levels related to rotational and vibrational molecular modes and intermolecular vibrations, such as hydrogen bonds [102,103]. For example, external lattice vibrations typically dominate the low-frequency region, and these modes are influenced by the crystalline arrangement of molecules. This occurs for different polymorphs where the unique THz spectral features can be used as identifying fingerprints [104]. THz waves are sensitive to the conformation and structure of proteins [105,106], and they can be used for providing useful information in combination with quantum-mechanical theory [101,107]. Moreover, the low photon energy is too low to heat materials or to induce atoms/molecules ionization. For this reason, it is a non-ionizing radiation, suitable and attractive for noninvasive biological applications and biomedical imaging [97]. At variance, other biochemical/molecular techniques, such as ultraviolet or X-rays using higher-energy photons (from few eV to ~keV), may damage any biological sample [81,101,108,109].
Furthermore, THz radiation strongly interacts with polar molecules [74,110,111], such as water. Especially in THz imaging, the intense absorption, due to water molecules [95], represents a limiting condition for the THz penetrability inside fresh tissues (from tens to hundreds of microns) [94], reducing the diagnostic capability in vivo only to superficial layers. On the contrary, nonpolar materials (such as paper, cloths and plastic) are usually transparent in the THz range [89,112,113].
Many layouts and materials can be used for THz signal collection in THz spectroscopy [114,115,116], exhibiting high performance in terms of the signal-to-noise ratio with coherent detection mode [116]. Because THz spectroscopy is insensitive to the thermal background, it shows a high signal-to-noise Ratio (SNR), and it does not require the use of cooled detectors [116,117]. Concerning the coherent detection mode, the THz electric field is directly assessed. Therefore, both amplitude and phase of the THz pulse electric field can be simultaneously measured, and the optical parameters, including sample absorption coefficient and refractive index, can be extracted without using Kramers–Kronig relations [101,116].
4. Current Status of THz Spectroscopy for Research on Amino Acids and Short-Chain Peptides
Amino acids are the backbones of proteins as well as fundamental elements to assemble cells and tissues. They are involved in all cellular metabolic and repairing processes and are responsible for various pathological genesis. The structural differences between amino acids depend on the side chain R and its polarity. Most THz biomolecule investigations have been focused on amino acids in the low-frequency spectral interval [118,119,120,121,122,123,124,125,126,127,128,129,130,131], see Table 1. All 20 standard α-amino acids under the same conditions revealed a correlation between molecular structures and spectral peaks between 0.2 and 3.0 THz (6.67–100 cm−1) [122]. The amino acids were studied in the solid phase, mixing them with a polyethylene powder in various proportions. For example, high proportions of amino acids to polyethylene (1:1 and 2:1) [123,124], as well as low proportions (1:15 and 1:9) [125,126], are used. From these, it emerged that the proportion of amino acids to THz transparent material in the production of the pellet influences the spectrum, especially in the low-frequency region [123,127]. Taday et al. [127] characterized the temperature-dependent L-glutamic acid spectrum and compared it with the theoretical model proposed by Chiba et al. [132], but poor agreement was achieved. Actually, theoretical simulations are not able to model the complexity of hydrogen bonding and crystalline structure occurring at low frequency in biological molecular systems.
Yi et al. [133] employed THz-TDS and IR spectroscopy to study all 20 amino acids, accurately collecting their spectra over a wide range from 0.2 to 6 THz (6.67 to 200 cm−1). Mixtures in different proportions of amino acids with polyethylene powder, transparent to THz radiation, were made. Their absorbance spectra were characterized to evaluate the optimal proportion for each amino acid. Among the fifteen aliphatic amino acids, L-glycine (L-gly), L-alanine (L-ala), L-valine (L-val), L-isoleucine (L-iso) and L-leucine (L-leu) have a similar structure, the only structural difference being the side chain. Nevertheless, they exhibit differences in the THz absorption spectra: L-val has prominent absorption at 1.11 THz and 4.39 THz; for L-iso, the main absorption peaks were shifted to lower frequencies at 0.85 and 4.27 THz; and finally for L-leu, at 0.66 and 3.68 THz. The authors correlated the differences due to the longer side chains that shift the absorption peaks to lower frequencies [133]. Moreover, the aromatic L-Tyrosine (L-tyr), L-phenylalanine (L-phe) and L-tryptophan (L-try) present a phenyl group on the side chain, and although they have similar structures, the THz spectra are different. A broad absorption band at 3.22 THz is observed in the L-try spectrum, and three absorption bands at 2.02, 2.76 and 4.16 THz appear in the L-phe absorption spectrum. L-tyr includes two symmetric peaks around them, with splitting attributable to the –OH group of L-tyr. For L-ala and L-threonine (L-thr) the main absorption peaks are located at 2.91 THz and 3.33 THz, respectively. The accurate study by Yi et al. is in a good agreement with previous works [118,119,120,121,122,123,124,125,127,128,129,130,131] ranging between 0.1 and 3 THz. Thus, they established an absorption spectral database of protein constituents in the solid phase and demonstrated that THz spectroscopy is able to distinguish different spectral features of amino acids with a very similar structure.
Another interesting aspect regards enantiomers, chiral molecules which are non-superimposable mirror images of each other, isotopologues and polymorphism [134]. In this context, THz spectroscopy is sensitive to crystalline structures. In pharmaceutical and pharmacological science, the use of amino acids and small peptide chains is required; the knowledge of their crystallinity is a topic issue from studies of changes in medicinal aging and to the detection of illegal substances. In particular, drugs bind to the human body thanks to receptors which are protein complexes [135]. In addition, the THz spectra of DL-leu and the two polymorphs of DL-val have been measured, and computer calculations have been implemented to reliably distinguish the nuances of THz spectra similar to solid-state systems [136,137]. Yamaguchi et al. [92] demonstrated THz sensitivity in enantiomers recognition, showing how the THz absorption spectra of L-(D-) and DL-ala are quite different; L- and D-ala show two absorption bands located at 74.4 and 85.7 cm−1 [92], and racemic compound DL-ala exhibits one absorption band at 41.8 cm−1. Therefore, THz spectroscopy is considered an off-line tool for assessing crystallinity, also in co-lyophilized amino acid/gelatin mixtures (L-ala, serine and valine) [128]. The physical/chemical conditions are critical for amino acids, and in particular, amino acid medicine is strongly susceptible to the storage and transportation states. Herein, the induced changes affect several properties of amino acids, e.g., stability, solubility, mechanical and physic-chemical properties, and alter the protein dynamics. Several experimental as well as theoretical studies carried out addressing those issues [138,139,140,141,142,143]. Aqueous solutions of amino acids have been extensively studied through different experimental techniques [144,145,146,147,148,149] and molecular dynamics simulations [150]. On the other side, there have been a few dielectric relaxation (DR) studies, covering MHz-GHz frequency domain, to probe the behavior of hydrated amino acids [151,152,153].
One of the amino acids extremely susceptible to change is Lysine (Lys), which has a key role in human metabolism and various physiological functions, such as promotion of human growth and enhancement of immunity. With the addition of water molecules, the surrounding environment of Lys is changed, affecting its collective molecular vibrations. Exploring the molecular collective modes at low frequency, Bian et al. [154] found that Lys and Lys·H2O have distinct spectral features in the range between 0.3 and 2.5 THz. The interpretation of the results was entrusted by theoretical calculations based on Density Function Theory (DFT) [155,156]; the water molecule is recognized to locate the carboxyl group and the amino group of hydrated Lys molecule, while its vibrational modes are produced by a dihedral torsion or bond angle bend of molecular chains. An equivalent description was also achieved for differences shown in THz spectral features of L-phe and for L-phe·H2O [157], associating them to different crystalline structures and to the presence of hydrogen bond interaction in the case of L-phe·H2O.
The hydration process of amino acids is the basis for a further understanding of the behavior of proteins in the aqueous environment. Samanta et al. [158] studied five amino acids dissolved in phosphate buffers. The optical absorption parameters dependent on the frequency, coefficient and refractive index were distinguished from the contribution of the solute, solvent and water of hydration. The departure of the absorption coefficient from the ideal behavior, ∆α, is associated with the section of the hydrated water molecules around the amino acid molecules, which differ from the absorption of water in mass up to 5–7 Å from a single solute molecule. Interaction with water molecules is mainly due to -COO- and -NH3+. They found a negative value of ∆α for all amino acids, with the exception of Gly, meaning this is a structure breaker. Arg, Ser, Trp, Lys and Asp are instead structure makers, leading to the formation of an ordered water molecule network around single amino acids. Furthermore, the anomalous behavior of Gly was described and explained. Fitting real and imaginary parts of the solution dielectric constant with a multiple Debye model, three time scales were obtained (8.7 ps, 80 and 200 fs). They were associated with cooperative rearrangement of the hydrogen bonded network for 8.7 ps and to competitive quick jump of under-coordinated water and small angular rotation preceding a large angle jump for 200 fs. Finally, the contribution at 80 fs was due to hydrogen-bond bending and the related transverse acoustic phonons, which propagate in a direction normal to the hydrogen bonds in between two neighboring water molecules. The first two are found to depend on both hydrophobic and hydrophilic residues of the considered amino acid, and their trends were analyzed for all molecules.
Low-frequency vibrational modes are strongly influenced by size and long-range order of the molecule. As consequence, small biological molecules, such as amino acids, tend to have distinct, relatively isolated features compared to polymers, such as short chain of peptides, with a larger number of modes. Thus, the THz spectral characteristics of the peptide reflect their amino acid composition, permutation sequence, intermolecular hydrogen bond and crystal structure. For example, the simplest molecule with a peptide bond, crystalline N-methyl acetamide, shows bands at 3.6 THz (120 cm−1) and 6.0 THz (200 cm−1) [159]. Yamamoto et al. used THz-TDS to study the absorption coefficient and refractive index of simple amino acids structures, glycine and L-alanine, compared with their corresponding polypeptides in the 0.21–1.65 THz (7–55 cm−1) domain [160]. Poly-glycine was observed to have peaks at 1.365 THz (45.5 cm−1) induced by the interaction of the chain different from the poly-L-alanine. The differences indicate that poly-glycine has a longer-range, ordered structure of solid-state crystals than poly-L-alanine does.
Kutteruf et al. [107] also demonstrated the great potential of THz spectroscopy for solid-phase short-chain peptide sequences, in the spectral region 1–15 THz. Pure solid samples of low molecular weight protein fragments pressed into polyethylene pellets were studied at 77 K and 298 K. Highly structured THz absorption spectra were typically observed with sharp spectral features determined by molecular symmetries and structure. In the same work, authors proved how quantum mechanical calculations, applied for the isolated diglycine species, can match experimental results if the description includes solid-state hydrogen-bonding and intermolecular interactions.
Likewise, Neu et al. [161] studied six polypeptide chains with very similar primary and secondary structures in the low-frequency region up to 2.5 THz. The result modeled with DFT calculations was used to calculate the dynamic motions of several peptides and to visualize the corresponding displacements of the strongest resonances.
Notably, the difference is clear between amino acids and polypeptides existing in the THz frequency dynamics range. The physical quantities show a different dependence by the length of the peptide chain, indicating that they reflect different interactions.
5. Current Status of THz Spectroscopy for Protein Research
As mentioned above, it is clear that molecular conformation affects the biological activity and functionality of proteins [162], so it is strategic to characterize the native protein conformation. With the advance in THz technologies, research on proteins and their conformation in the THz spectral region has been extensively carried out [163,164,165,166]. All findings demonstrated that the collective vibration mode related to the protein molecular conformation is optically active in the THz range [167,168]. Markelz and co-authors collected the THz spectrum of lyophilized powder bovine serum albumin (BSA) of pressed pellets in the range between 0.06 and 2.00 THz (2–66.6 cm−1). Paciaroni et al. focused the attention on vibrational collective dynamics of a dry perdeuterated maltose-binding protein in the THz domain [169]. Sun et al. used THz spectroscopy to study the binding of hemagglutinin protein and broadly neutralizing monoclonal antibodies in the liquid environment [170].
THz spectroscopy is, among others, a convenient method for probing conformational changes in photoactive proteins [171,172,173]. Castro–Camus and Johnston [171] investigated conformational changes in photoactive yellow protein (PYP) suspended in a physiological buffer solution. The sample was uniformly illuminated by high-intensity blue (450 nm) light emitting diodes to trigger a conformational change from the ground state of the photoactive yellow protein (called pG) to the photo-intermediate (pB). Changes in the protein structure were probed by THz radiation, which is far from triggering any modifications in the protein itself. Absorption differences were observed, such as an increase in the absorption of the pB configuration compared to that in the pG state in the range 0.25–2 THz (8–66.6 cm−1).
An interesting study was conducted by Han et al. using both THz spectroscopy and imaging [174]. These attempted to identify proteins and quantify their content. The frequency-dependent refractive index of six proteins (rn21, rn22, rn28, n42, n43 and n53 with concentration of 2.0 μg/μL and quantity of 8 μg) were initially evaluated with THz-TDS in the spectral region 0.1–3.5 THz (3.33–117 cm−1). In Figure 3, the refractive index of these six proteins is reported in the sub-frequency band.
The refractive index vs. frequencies in the THz range of these six different species of proteins are different and well-separated, allowing to distinguish each protein. Although the error bars overlap, the curve trend points out that the protein with a higher molecular mass has a stronger refraction capacity, namely a greater refractive index at every frequency. Authors have investigated the ability of THz imaging to differentiate and quantify the content of different kinds of specific proteins. The intensity or the level of shade of the image is directly related to the number of proteins participating in the absorption, see Figure 4. For this purpose, a nitrocellulose blotting membrane (NC) was dropped with liquid solutions of the six proteins, formulated inside the five solutions with corresponding concentrations of 2 μg/μL, 1 μg/μL, 0.5 μg/μL, 0.25 μg/μL and 0.125 μg/μL, dissolved in solution of 1 × PBS at pH 7.2. Observing Figure 4b, a variation of the average color-scale of proteins rn21, rn22 and n43 was evident; firstly, it increases at 0.5 μg, and then it decreases at 1 μg, 2 μg, 4 μg and 8 μg as a function of protein quantity (except for the 8 μg of Protein n43). At variance, the average color scales of proteins rn28 and n42 exhibit the opposite trend (see Figure 4b). For the six kinds of proteins with the same amount, the intensity of gray levels behaves similarly to the refractive index absorption. The THz experimental results of Han et al. match exactly the results of the dot blot (see Figure 4a) method. Besides, the application of THz spectroscopy does not merely distinguish the different proteins, it precisely acquires the protein quantity distribution, but it is able to reduce the time procedure compared to conventional immunoassays in the label-free and non-destructive mode.
The structural flexibility of the protein allows to skillfully change its conformation without modifying the function it has to perform [175]. The frequency dependence of the density of the vibrational modes in the biological temperature range can quantify flexibility [163]. One example involves the transfer of cytochrome c (CytC) protein electrons. The CytC constituent amino acids have a covalently linked heme group with two oxidation states, ferri-and ferro-CytC. Ferri-CytC is less thermally stable than ferro-CytC and has also a higher hydrogen exchange and proteolytic digestion rate [169]. The THz spectroscopy was revealed as a powerful investigation tool because the collective vibrational modes fall into the THz domain, ranging from 0.03 to 6 THz (1–200 cm−1) [176]. Chen and co-workers [175] examined the complex THz dielectric response of CytC films in the two oxidation states and found that absorption and refractive indexes tend to increase with the degree of oxidation. A sharp increase in the density of the vibrational modes and/or the dipole coupling in the interval is observed in the range 0.15–2.4 THz (5–80 cm−1).
The influence of various physical and/or chemical factors [177,178,179,180,181,182] can induce protein denaturation with a relative change of the internal structure and properties of protein molecules. The structural change induced in the protein consequently alters its functionality, a delicate aspect in food processing, protein purification, nutrition, biomedicine and the food industry. Several examples underlined the advantage of THz technology in the study of protein denaturation and conformational changes. Studies with native sperm-whale myoglobin indicated that loss of secondary and tertiary structures influences the far-IR spectra as spectral changes in the region between 11.1 and 15.6 THz (370–520 cm−1) along with broader changes around 6.0 THz (200 cm−1) [183]. Firstly, the denaturation of the PsbO protein [184] and two photosynthesis chlorophyll proteins CP43 and CP47 [185,186,187] were examined though THz-TDS. Recently, a consistent, strong increase in the <3 THz (100 cm−1) absorbance was shown in the measurements of non-native hen egg white lysozyme (HEWL) [188] and human serum albumin (HSA) [189]. Yoneyama et al. [162], using THz spectroscopy, measured the thermal denaturation of BSA protein held in a membrane device, observing a higher THz transmittance of the thermal denatured BSA sample compared to that of the native-conformation sample. Temperature-dependent THz analysis was also led by George et al. [190] on frozen-solution-phase samples of hen HEWL and CytC proteins, in order to study temperature-dependent conformation of proteins. The estimation of the imaginary part of the dielectric function as a function of T and fitting with Arrhenius model activation energies explained the behavior of HEWL being free, bonded to 3NAG and denatured; CytC was oxidized, reduced and denatured. The thermal denaturation of HSA in an aqueous buffer solution revealed changes in the absorption coefficient and refractive index as a function of the temperature [189].
Many of these experiments proved the feasibility of both protein and denaturation detection, but on the other hand they drew attention to some problems such as low signal-to-noise ratio and poor sensitivity, especially in the liquid environment because of water absorption. To overcome these limitations, different approaches can be adopted to enhance the THz response of biological samples based on graphene [191], on microfluidic chips [192,193], novel materials such as meta- and nano-materials [109,194,195,196], on gold nanoparticles [197] and on nanoantennas [198].
A promising further step forward in development of THz technology was given recently by Zhang’s group [199]. They utilized the reflective THz time-domain polarization spectroscopy (THz-TDPS) method for protein sensing in the liquid environment in the spectral region 0.1–2.5 THz (3.33–83.3 cm−1). The system, reported in Figure 5a,b, allows to obtain a polarization sensing, measuring the reflective polarization spectra for a liquid-phase sample. To this aim, a traditional transmission THz-TDS [97,98] was modified, adding a reflection module (Figure 5b) to the bottom of the 3D printing sample cell and two rotatable THz polarizers at the emitting end and detection ports of the spectroscopic system (Figure 5a). The advantage is to measure the states of signals without the strong THz water absorption in reflection mode. In addition, authors used a flexible twisted dual-layer metasurface structure with geometric chirality (Figure 5c–e), as a sensor, to enhance the polarization response of three protein samples: BSA, whey protein (WP) and ovalbumin (OVA).
Generally, circular polarization (CP) sensing shows an improvement in the sensitivity and more information sensing, if compared with the traditional linear polarization (LP) spectra. The influence of a double-layer metasurface sensor is proven to enhance also the polarization response of the sample. In fact, nature-conformation proteins are clearly distinguishable, and denaturation induced by temperature treatments can be detected through variations of CP reflection spectra, both right- (RCP) and left-handed (LCP). Compared with the traditional LP spectra, the CP sensing sensitivity is improved. The detection sensitivity achieved with thermal denaturation measurements is established to be Sd = 6.30 dB%, but THz-TDPS reaches a detection sensitivity of Sc = 52.9 dB mL/g for concentration estimations, reported in Figure 6 and Figure 7.
Proteins require an environment as close as possible to the living environment, i.e., an aqueous solution. The role of water in protein dynamics has been, and still is, debated. Although water is a limiting factor in THz spectroscopy due to strong absorption in the spectral region of interest, this does not limit protein hydration studies. Combining THz spectroscopy and molecular simulations, Meister’s group [200] looked at the behavior of long-range protein–water dynamics in hyperactive insect antifreeze proteins. THz measurements are highly dependent on relative humidity, as protein films have a high affinity for adsorbed water [201]. Heyden and Havenith [202] engaged in both experimental and theoretical study of protein-hydration coupling. Xu et al. [203] measured the absorption spectrum of solvated BSA between 0.3 and 3.72 THz (10–124 cm−1) in order to monitor its collective vibrational dynamics and obtain information in the low-frequency region. They successfully estimated the THz molar absorption of solvated BSA from the much stronger attenuation of water. They deduced that the vibrational modes of solvated proteins lead to a dense and overlapping spectrum monotonously increasing with frequency. The lack of a distinct and spectrally structured spectrum suggested the lack of a specific dominant collective vibration foreseen by molecular dynamics simulations and normal mode analysis of a series of small proteins.
Furthermore, the study of the protein–water interaction can be reported at the cellular level, which turns out to be highly fashionable. In fact, membrane proteins are those that in this context are most involved in the interaction with water, with possible changes in the structure and the ability to create a network of hydrogen bonds, which can be explored from 1 to 6 THz. Pal and Chattopadhyay [204] probably provided the first and accurate overview of the potential of THz spectroscopy in this area. They demonstrated how THz-TDS and some optical parameters (e.g., the dielectric constant) can describe specific changes in the membrane microenvironment and lipid concentration. The references listed since up to now only emphasize the potential of THz radiation in the field of protein biochemistry. Specifically, the ability of THz spectroscopy to detect the presence of types of proteins, to quantify their content and to be sensitive to protein conformation paves the way for its use in the biomedical and bioclinical fields. Many pathologies are in fact due to an alteration of the aminoacetic sequences and/or functional protein alterations. Recently, Wang et al. [205] exploited time-resolved THz spectroscopy to analyze serum and cerebrospinal fluid (CSF) extracted from rats at different times after blast-induced head injury (bTBI), from both the hypothalamus and the hippocampus.
THz spectra change as a function of time, with different trends for proteins of the hypothalamus and hippocampus. Specifically, Figure 8a,b shows the results of Wang et al. [205], relating to absorption spectra and refractive index between 0.2 and 2.0 THz (6.66–66.6 cm−1) of the total protein in the hypothalamus. The panels showed a magnified area in the range 1–1.6 THz (33.3–53.3 cm−1). Overall, the absorption coefficient and refractive index of total proteins in the hypothalamus rose and fell monotonously as a function of frequency, respectively. To describe the temporal evolution in a clear way, normalized values of optical parameters were selected at 1.6 THz, in Figure 8c. Differences were observed just at 3 h from blast exposure; the absorption coefficients relative to mild and moderate insults were significantly higher than those in the sham group. Subsequently, increasing the time (6 h and 24 h), these values decreased gradually, returning to the normal level, although differences persist between the two parameters also 24 h after the blast exposure.
In the same way, THz spectra of the total protein in the hippocampus and its temporal changes are evaluated and are shown in Figure 9a,c. Both the THz absorption and refractive index showed no significant changes 3 h after blast exposure, unlike what happens for the hypothalamus. However, after an additional 3 h, the THz absorption coefficient of the total protein in the hippocampus increases accompanied by a decrease in the refractive index THz, with the increase in the traumatic degree. These changes were more noticeable with the increase in traumatic degree. The bTBI caused some changes in both the hypothalamus and hippocampus total proteins of rats, a behavior associated with the decrease or the increase in the number of some biomolecules with effects on the functioning of brain areas and symptoms of neurological damage. THz technology then appears as a powerful tool for early recognition and diagnosis of bTBI.
6. Conclusions
Proteins play a fundamental role in biology and, in particular, in living systems. The study of the dynamics of proteins provides information on their functionality, catalysis and potential alteration towards pathological diseases and, therefore, are of interest for various research fields.
Various techniques are currently used for their quantification, identification and evolutionary study; still, the demand of new techniques to complement the existing ones is growing. Although various techniques for protein investigation are currently used in the industrial, pharmaceutical and diagnostic fields, limitations, complexity and cost represent serious drawbacks. In this framework, emerging spectroscopic analytical methods, based on the use of THz radiation in the range 0.1–15 THz, are now competitive methods in the biochemical community. Thanks to new technology, the potential of THz spectroscopy has been affirmed in the analysis of both simple structures, such as polyamide molecules, and complex structures, such as protein complexes.
This short review highlights the possibility of identifying amino acids and proteins and revealing protein dynamics. In the first part we recalled the most common and used techniques from those for the evaluation of protein concentration, the differentiation of proteins and the study of conformational dynamics and modifications. In the second part we focused on THz radiation opportunities outlining issues and applications in which it offers real advantages.
THz spectroscopy provides a unique perspective on the chemical structure, rotational and vibrational molecule modes and intermolecular vibrations, such as hydrogen bonds [102,103]. Furthermore, it is sensitive to the crystalline structure, therefore able to distinguish enantiomers, isotopologists and polymorphisms [134]. Most amino acids have a chiral shape, and THz spectroscopy supports their detection, being particularly useful in the field of pharmaceuticals, where it is able to clearly differentiate between the amino acids and the polypeptide and to monitor protein–ligand interactions.
Protein dynamics analysis shows great potentialities, although there are many studies on the spectral change associated with spontaneous and physico-chemical-induced conformational changes. Some caution must be considered in interpretation of these results. The use of chemical simulations and theoretical approaches based on DFT calculations have limitations, but learning algorithms, neural models and deep learning approaches are viable future approaches, as showed by Sun et al., 2018 [206], which combine machine learning and THz analysis for quantitative protein analysis of BSA, deposited at different concentrations on thin films. The information content of the THz absorption spectra was analyzed with principal component analysis (PCA), spectrum regression analysis (SVR) and maximal information coefficient (MIC) to discriminate frequencies, and machine learning methods proved efficient for the recognition of spectral features. Although different applications of this technology showed great potential, scientific and technological issues still need to be addressed, such as the methodological approach to the analysis of samples in aqueous solutions and the need to increase the sensitivity of the THz signal in the presence of weakly active THz materials.
Author Contributions
Conceptualization, A.D., T.M., R.M. and S.L.; writing—original draft preparation, A.D., T.M., R.M. and S.L.; writing—review and editing, all authors; supervision, S.L.; project administration, S.L., M.P. and A.M.; funding acquisition, S.L., M.P. and A.M. All authors have read and agreed to the published version of the manuscript.
Funding
This research was supported by the Ph.D. funding in the framework of “Programma Operativo Nazionale (PON)—Ricerca e Innovazione 2014–2020—Azione IV.5—Dottorati su tematiche green. We thank for funding BRIC-INAIL project ID12; NATO Science for Peace and Security Programme under grant No. G5889—“SARS-CoV-2 Multi-Messenger Monitoring for Occupational Health & Safety-SARS 3M”, LazioInnova “Gruppi di Ricerca 2020” of the POR FESR 2014/2020—A0375-2020-36651 project entitled “DEUPAS -DEterminazione Ultrasensibile di agenti PAtogeni mediante Spettroscopia” and finally FISR-2020 Fondo Integrativo Speciale per la Ricerca, with the project “Monitoraggio multi-messaggero e di apprendimento automatico SARS-CoV-2 per la salute e la sicurezza sul lavoro”.
Institutional Review Board Statement
Not applicable.
Informed Consent Statement
Not applicable.
Data Availability Statement
Not applicable.
Conflicts of Interest
The authors declare no conflict of interest.
References
- Moore, M.C. Introduction to Western Blotting; Morphosys Ltd.: Oxfordshire, UK, 2009. [Google Scholar]
- Gilda, J.E.; Gomes, A.V. Stain-Free total protein staining is a superior loading control to β-actin for Western blots. Anal. Biochem. 2013, 440, 186–188. [Google Scholar] [CrossRef] [Green Version]
- Moritz, C.P.; Marz, S.X.; Reiss, R.; Schulenborg, T.; Friauf, E. Epicocconone staining: A powerful loading control for Western blots. Proteomics 2014, 14, 162–168. [Google Scholar] [CrossRef]
- Baughman, W.E.; Yokus, H.; Balci, S.; Wilbert, D.S.; Kung, P.; Kim, S.M. Observation of Hydrofluoric Acid Burns on Osseous Tissues by Means of Terahertz Spectroscopic Imaging. IEEE J. Biomed. Health Inform. 2013, 17, 798–805. [Google Scholar] [CrossRef]
- Belouzard, S.; Millet, J.K.; Licitra, B.N.; Whittaker, G.R. Mechanism of Coronavirus Cell Entry Mediated by the Viral Spike Protein. Viruses 2012, 4, 1011–1033. [Google Scholar] [CrossRef] [Green Version]
- Verma, J.; Subbarao, N. A comparative study of human betacoronavirus spike proteins: Structure, function and therapeutics. Arch. Virol. 2021, 166, 697–714. [Google Scholar] [CrossRef]
- Whitford, D. Proteins: Structure and Function, 1st ed.; Wiley: Chichesetr, UK, 2005. [Google Scholar]
- Lesk, A.M. Introduction to Protein Science: Architecture, Function, and Genomics, 2nd ed.; Oxford University Press: Oxford, UK, 2010. [Google Scholar]
- Fields, P.A. Review: Protein function at thermal extremes: Balancing stability and flexibility. Comp. Biochem. Physiol. A Mol. Integr. Physiol. 2001, 129, 417–431. [Google Scholar] [CrossRef]
- Johan, K. New method for the determination of nitrogen in organic substances. Z. Anal. Chem. 1883, 22, 366–383. [Google Scholar]
- George, W. New decomposition product of urea. J. Prakt. Chem. 1847, 42, 255–256. [Google Scholar]
- Zor, T.; Selinger, Z. Linearization of the Bradford protein assay increases its sensitivity: Theoretical and experimental studies. Anal. Biochem. 1996, 236, 302–308. [Google Scholar] [CrossRef] [Green Version]
- Everette, J.D.; Bryant, Q.M.; Green, A.M.; Abbey, Y.A.; Wangila, G.W.; Walker, R.B. Thorough study of reactivity of various compound classes toward the Folin-Ciocalteu reagent. J. Agric. Food Chem. 2010, 58, 8139–8144. [Google Scholar] [CrossRef] [Green Version]
- Kurien, B.T.; Scofield, R.H. (Eds.) Western Blotting: An Introduction. Methods Mol. Biol. 2015, 1312, 17–30. [Google Scholar]
- Chang, S.K.C. Food analysis. In Protein Analysis, 3rd ed.; Nielse, S.S., Ed.; Kluwer Academic: New York, NY, USA, 2003; pp. 131–142. [Google Scholar]
- Wilson, P.R. A new instrumentation concept for nitrogen/protein analysis. A challenge to the Kjeldahl method. Asp. Appl. Biol. 1990, 25, 443–446. [Google Scholar]
- Hall, N.G.; Schonfeldt, H.C. Total nitrogen vs. amino-acid profile as indicator of protein content of beef. Food Chem. 2013, 140, 608–612. [Google Scholar] [CrossRef] [Green Version]
- Lee, P.Y.; Costumbrado, J.; Hsu, C.Y.; Kim, Y.H. Agarose gel electrophoresis for the separation of DNA fragments. J. Vis. Exp. 2012, 20, e3923. [Google Scholar] [CrossRef]
- Stellwagen, N.C. Electrophoresis of DNA in agarose gels, polyacrylamide gels and in free solution. Electrophoresis 2009, 30, S188–S195. [Google Scholar] [CrossRef] [Green Version]
- Chattopadhyay, P.K.; Gierahm, T.M.; Roederer, M.; Love, J.C. Single-cell technologies for monitoring immune systems. Nat. Immunol. 2014, 15, 128–135. [Google Scholar] [CrossRef]
- Geering, B.; Fussenegger, M. Synthetic immunology: Modulating the human immune system. Trends Biotechnol. 2015, 33, 65–79. [Google Scholar] [CrossRef]
- Shukla, A.A.; Thommes, J. Recent advances in large-scale production of monoclonal antibodies and related proteins. Trends Biotechnol. 2010, 28, 253–261. [Google Scholar] [CrossRef]
- Tomar, N.; De, R.K. Immunoinformatics: A brief review. Methods Mol. Biol. 2014, 1184, 23–55. [Google Scholar]
- Virgo, P.F.; Gibbs, G.J. Flow cytometry in clinical pathology. Ann. Clin. Biochem. 2012, 49, 17–28. [Google Scholar] [CrossRef] [Green Version]
- Deakin, T. Radisotopic characterization as an analytical tool: Current status, limitations and future challenges. Bioanalysis 2015, 7, 541–555. [Google Scholar] [CrossRef]
- Diao, B.; Wen, K.; Zhang, J.; Chen, J.; Han, C.; Chen, Y.; Wang, S.; Deng, G.; Zhou, H.; Wu, Y. Accuracy of a nucleocapsid protein antigen rapid test in the diagnosis of SARS-CoV-2 infection. Clin. Microbiol. Infect. 2021, 27, 289.e1–289.e4. [Google Scholar] [CrossRef]
- Chen, L.; Zhao, J.; Peng, J.; Li, X.; Deng, X.; Geng, Z.; Shen, Z.; Guo, F.; Zhang, Q.; Jin, Y.; et al. Detection of SARS-CoV-2 in saliva and characterization of oral symptoms in COVID-19 patients. Cell Prolif. 2020, 53, e12923. [Google Scholar] [CrossRef]
- Webb, R.H. Confocal optical microscopy. Rep. Prog. Phys. 1996, 59, 427–471. [Google Scholar] [CrossRef]
- Hoover, E.E.; Squier, J.A. Advances in multiphoton microscopy technology. Nat. Photonics 2013, 7, 93–101. [Google Scholar] [CrossRef] [Green Version]
- Zumbusch, A.; Langbein, W.; Borri, P. Nonlinear vibrational microscopy applied to lipid biology. Prog. Lipid Res. 2013, 52, 615–632. [Google Scholar] [CrossRef] [Green Version]
- D’Arco, A.; Brancati, N.; Ferrara, M.A.; Indolfi, M.; Frucci, M.; Sirleto, L. Subcellular chemical and morphological analysis by stimulated Raman scattering microscopy and image analysis techniques. Biomed. Opt. Express 2016, 7, 1853–1864. [Google Scholar] [CrossRef] [Green Version]
- Cheng, J.X.; Xie, X.S. Vibrational spectroscopic imaging of living systems: An emerging platform for biology and medicine. Science 2015, 50, 62–64. [Google Scholar] [CrossRef]
- D’Arco, A.; Ferrara, M.A.; Indolfi, M.; Tufano, V.; Sirleto, L. Label-free imaging of small lipid droplets by femtosecond-stimulated Raman scattering microscopy. J. Nonlinear Opt. Phys. Mater. 2017, 26, 1750052. [Google Scholar] [CrossRef]
- Min, W.; Freudiger, C.W.; Lu, S.; Xie, X.S. Coherent nonlinear optical imaging: Beyond fluorescence microscopy. Annu. Rev. Phys. Chem. 2011, 62, 507–530. [Google Scholar] [CrossRef] [Green Version]
- Streets, A.M.; Li, A.; Chen, T.; Huang, Y. Imaging without fluorescence: Nonlinear optical microscopy for quantitative cellular imaging. Anal. Chem. 2014, 86, 8506–8513. [Google Scholar] [CrossRef]
- Jepsen, P.U.; Cooke, D.G.; Koch, M. Terahertz spectroscopy and imaging—Modern techniques and applications. Laser Photonics Rev. 2011, 5, 124–166. [Google Scholar] [CrossRef]
- Xie, L.; Gao, W.; Shu, J.; Ying, Y.; Kono, J. Extraordinary sensitivity enhancement by metasurfaces in terahertz detection of antibiotics. Sci. Rep. 2015, 5, 8671. [Google Scholar] [CrossRef]
- Wang, Q.; Ma, Y.H. Qualitative and quantitative identification of nitrogen in terahertz region. Chemom. Intell. Lab. 2013, 127, 43–48. [Google Scholar] [CrossRef]
- Hickman, A.B.; Davies, D.R. Principle of Macromolecular X-ray Crystallography. In Current Protocols in Protein; Chapter 17; Science Wiley Interscience: New York, NY, USA, 2001. [Google Scholar]
- Lipfert, J.; Doniach, S. Small-angle X-ray scattering from RNA, proteins, and protein complexes. Annu. Rev. Biophys. Biomol. Struct. 2007, 36, 307–327. [Google Scholar] [CrossRef] [Green Version]
- Miao, J.; Ishikawa, T.; Shen, Q.; Earnest, T. Extending X-ray crystallography to allow the imaging of noncrystalline materials, cells, and single protein complexes. Annu. Rev. Phys. Chem. 2008, 59, 387–410. [Google Scholar] [CrossRef]
- Neylon, C. Small angle neutron and X-ray scattering in structural biology: Recent examples from the literature. Eur. Biophys. J. 2008, 37, 531–541. [Google Scholar] [CrossRef]
- Blamire, A.M. The technology of MRI: The next 10 years? Br. J. Radiol. Suppl. 2008, 81, 601–617. [Google Scholar] [CrossRef]
- Ishima, R.; Torchia, D.A. Protein dynamics from NMR. Nat. Struct. Biol. 2000, 7, 740–743. [Google Scholar] [CrossRef]
- McDermott, A.; Polenova, T. Solid state NMR: New tools for insight into enzyme function. Curr. Opin. Struct. Biol. 2007, 17, 617–622. [Google Scholar] [CrossRef]
- Bajar, B.T.; Wang, E.S.; Zhang, S.; Lin, M.Z.; Chu, J. A Guide to Fluorescent Protein FRET Pairs. Sensors 2016, 16, 1488. [Google Scholar] [CrossRef]
- Miura, K. An Overview of Current Methods to Confirm Protein-Protein Interactions. Protein Pept. Lett. 2018, 25, 72–733. [Google Scholar] [CrossRef]
- Dale, N.C.; Johnstone, E.K.M.; White, C.W.; Pfleger, K.D.G. NanoBRET: The Bright Future of Proximity-Based Assays. Front. Bioeng. Biotechnol. 2019, 26, 56. [Google Scholar] [CrossRef]
- Lippincott-Schwartz, J.; Snapp, E.L.; Phair, R.D. The Development and Enhancement of FRAP as a Key Tool for Investigating Protein Dynamics. Biophys. J. 2018, 115, 1146–1155. [Google Scholar] [CrossRef] [Green Version]
- Fasman, G.D. Circular Dichroism and the Conformational Analysis of Biomolecules; Plenum Press: New York, NY, USA, 1996. [Google Scholar]
- Hofmann, A.; Simon, A.; Grkovic, T.; Jones, M. Methods of Molecular Analysis in the Life Sciences; Cambridge University Press: Cambridge, UK, 2014. [Google Scholar]
- Pescitelli, G.; Di Bari, L.; Berova, N. Application of electronic circular dichroism in the study of supramolecular systems. Chem. Soc. Rev. 2014, 43, 5211–5233. [Google Scholar] [CrossRef]
- Barth, A. Infrared spectroscopy of proteins. Biochim. Biophys. Acta Bioenerg. 2007, 1767, 1073–1101. [Google Scholar] [CrossRef] [Green Version]
- Marcelli, A.; Cricenti, A.; Kwiatek, W.M.; Petibois, C. Biological applications of synchrotron radiation infrared spectromicroscopy. Biotech. Adv. 2012, 30, 1390–1404. [Google Scholar] [CrossRef]
- Piccirilli, F.; Tardani, F.; D’Arco, A.; Birarda, G.; Vaccari, L.; Sennato, S.; Casciardi, S.; Lupi, S. Infrared Nanospectroscopy Reveals DNA Structural Modifications upon Immobilization onto Clay Nanotubes. Nanomaterials 2021, 11, 1103. [Google Scholar] [CrossRef]
- Auston, D.H.; Nuss, M.C. Electrooptical generation and detection of femtosecond electrical transients. IEEE J. Quantum Electron. 1988, 24, 184–197. [Google Scholar] [CrossRef]
- Mittleman, D.; Gupta, M.; Neelamani, R.; Baraniuk, R.G.; Rudd, J.V.; Koc, M. Recent advances in terahertz imaging. Appl. Phys. B 1999, 68, 1085–1094. [Google Scholar] [CrossRef]
- Siegel, P.H. Terahertz technology in biology and medicine. IEEE Trans. Microw. Theory 2004, 52, 2438–2447. [Google Scholar] [CrossRef]
- Zhang, X.C. Terahertz wave imaging: Horizons and hurdles. Phys. Med. Biol. 2002, 47, 3667–3677. [Google Scholar] [CrossRef]
- Wallace, V.P.; Taday, P.F.; Fitzgerald, A.J.; Woodward, R.M.; Cluff, J.; Pye, R.J.; Arnone, D.D. Terahertz pulsed imaging and spectroscopy for biomedical and pharmaceutical applications. Faraday Discuss. 2004, 126, 255–263. [Google Scholar] [CrossRef]
- Withayachumnankul, W.; Png, G.M.; Yin, X.; Atakaramians, S.; Jones, I.; Lin, H.; Ung, B.S.Y.; Balakrishnan, J.; Ng, B.W.-H.; Ferguson, B.; et al. T-ray sensing and imaging. Proc. IEEE 2007, 95, 1528–1558. [Google Scholar] [CrossRef]
- Cheon, H.; Yang, H.J.; Son, J.-H. Toward Clinical Cancer Imaging Using Terahertz Spectroscopy. IEEE J. Sel. Top. Quantum Electron. 2017, 23, 8600109. [Google Scholar] [CrossRef]
- Mickan, S.; Abbott, D.; Munchb, J.; Zhang, X.C.; van Doornd, T. Analysis of system trade-offs for terahertz imaging. Microelectron. J. 2000, 31, 503–514. [Google Scholar] [CrossRef] [Green Version]
- Mou, S.; D’Arco, A.; Tomarchio, L.; Di Fabrizio, M.; Curcio, A.; Lupi, S.; Petrarca, M. Simultaneous elliptically and radially polarized THz from one-color laser-induced plasma filament. New J. Phys. 2021, 23, 063048. [Google Scholar] [CrossRef]
- Curcio, A.; Petrarca, M. Diagnosing plasmas with wideband terahertz pulses. Opt. Lett. 2019, 44, 1011–1014. [Google Scholar] [CrossRef]
- Curcio, A.; Dolci, V.; Lupi, S.; Petrarca, M. Terahertz-based retrieval of the spectral phase and amplitude of ultrashort laser pulses. Opt. Lett. 2018, 43, 783–786. [Google Scholar] [CrossRef] [Green Version]
- Curcio, A.; Marocchino, A.; Dolci, V.; Lupi, S.; Petrarca, M. Resonant plasma excitation by single-cycle THz pulses. Sci. Rep. 2018, 8, 1052. [Google Scholar] [CrossRef] [Green Version]
- Curcio, A.; Mou, S.; Palumbo, L.; Lupi, S.; Petrarca, M. Selection rules for the orbital angular momentum of optically produced THz radiation. Opt. Lett. 2021, 46, 1514–1517. [Google Scholar] [CrossRef]
- D’Arco, A.; Tomarchio, L.; Dolci, V.; Di Pietro, P.; Perucchi, A.; Mou, S.; Petrarca, M.; Lupi, S. Broadband Anisotropic Optical Properties of the Terahertz Generator HMQ-TMS Organic Crystal. Condens. Matter 2020, 5, 47. [Google Scholar] [CrossRef]
- Lupi, S.; Molle, A. Emerging Dirac materials for THz plasmonics. Appl. Mater. Today 2020, 20, 100732. [Google Scholar] [CrossRef]
- Di Pietro, P.; Ortolani, M.; Limaj, O.; Di Gaspare, A.; Giliberti, V.; Giorgianni, F.; Brahlek, M.; Bansal, N.; Koirala, N.; Oh, S.; et al. Observation of Dirac plasmons in a topological insulator. Nat. Nanotechnol. 2013, 8, 556–560. [Google Scholar] [CrossRef] [Green Version]
- D’Apuzzo, F.; Piacenti, A.R.; Giorgianni, F.; Autore, M.; Cestelli Guidi, M.; Marcelli, A.; Schade, U.; Ito, Y.; Chen, M.; Lupi, S. Terahertz and mid-infrared plasmons in three-dimensional nanoporous graphene. Nat. Commun. 2017, 8, 14885. [Google Scholar] [CrossRef]
- Giorgianni, F.; Chiadroni, E.; Rovere, A.; Cestelli-Guidi, M.; Perucchi, A.; Bellaveglia, M.; Castellano, M.; Di Giovenale, D.; Di Pirro, G.; Ferrario, M.; et al. Strong nonlinear terahertz response induced by Dirac surface states in Bi2Se3 topological insulator. Nat. Commun. 2016, 7, 11421. [Google Scholar] [CrossRef]
- Marcelli, A.; Irizawa, A.; Lupi, S. THz: Research frontiers for new sources, imaging and other advanced technologies. Condens. Matter 2019, 6, 23. [Google Scholar]
- Galstyan, V.; D’Arco, A.; Di Fabrizio, M.; Poli, N.; Lupi, S.; Comini, E. Detection of volatile organic compounds: From chemical gas sensors to terahertz spectroscopy. Rev. Anal. Chem. 2021, 40, 33–57. [Google Scholar] [CrossRef]
- Naftaly, M.; Vieweg, N.; Deninger, A. Industrial Applications of Terahertz Sensing: State of Play. Sensors 2019, 19, 4203. [Google Scholar] [CrossRef] [Green Version]
- Choi, J.; Ryu, S.Y.; Kwon, W.S.; Kim, K.S.; Kim, S. Compound Explosives Detection and Component Analysis via Terahertz Time-Domain Spectroscopy. Korean J. Opt. Photonics 2013, 17, 454–460. [Google Scholar] [CrossRef] [Green Version]
- Smith, R.M.; Arnold, M.A. Selectivity of Terahertz Gas-Phase Spectroscopy. Anal. Chem. 2015, 87, 10679–10683. [Google Scholar] [CrossRef]
- Rothbart, N.; Holz, O.; Koczulla, R.; Schmalz, K.; Hübers, H.W. Analysis of Human Breath by millimeter-Wave/Terahertz Spectroscopy. Sensors 2019, 19, 2719. [Google Scholar] [CrossRef] [Green Version]
- Giuliano, B.M.; Gavdush, A.A.; Müller, B.; Zaytsev, K.I.; Grassi, T.; Ivlev, A.V.; Palumbo, M.E.; Baratta, G.A.; Scirè, C.; Komandin, G.A.; et al. Broadband spectroscopy of astrophysical ice analogues I. Direct measurement of the complex refractive index of CO ice using terahertz time-domain spectroscopy. Astron. Astrophys. 2019, 629, A112. [Google Scholar] [CrossRef] [Green Version]
- D’Arco, A.; Di Fabrizio, M.; Dolci, V.; Marcelli, A.; Petrarca, M.; Della Ventura, G.; Lupi, S. Characterization of volatile organic compounds (VOCs) in their liquid-phase by terahertz time-domain spectroscopy. Biomed. Opt. Express 2020, 11, 1–7. [Google Scholar] [CrossRef]
- Fischer, B.; Hoffmann, M.; Helm, H.; Modjesch, G.; Uhd Jepsen, P. Chemical recognition in terahertz time-domain spectroscopy and imaging. Semicond. Sci. Technol. 2005, 20, S246. [Google Scholar] [CrossRef] [Green Version]
- Stoik, C.D.; Bohn, M.J.; Blackshire, J.L. Nondestructive evaluation of aircraft composites using transmissive terahertz time domain spectroscopy. Opt. Express 2008, 16, 17039–17051. [Google Scholar] [CrossRef]
- Heimbeck, M.S.; Ng, W.R.; Golish, D.R.; Gehm, M.E.; Everitt, H.O. Terahertz digital holographic imaging of voids within visibly opaque dielectrics. IEEE Trans. Terahertz Sci. Technol. 2015, 5, 110–116. [Google Scholar] [CrossRef]
- Tomarchio, L.; Macis, S.; D’Arco, A.; Mou, S.; Grilli, A.; Romani, M.; Cestelli Guidi, M.; Hu, K.; Kukunuri, S.; Jeong, S.; et al. Disordered photonics behavior from terahertz to ultraviolet of a three-dimensional graphene network. NPG Asia Mater. 2021, 13, 73. [Google Scholar] [CrossRef]
- Federici, J.F.; Schulkin, B.; Huang, F.; Gary, D.; Barat, R.; Oliveira, F.; Zimdars, D. THz imaging and sensing for security applications—Explosives, weapons and drugs. Semicond. Sci. Technol. 2005, 20, S266. [Google Scholar] [CrossRef]
- Ergün, S.; Sönmez, S. Terahertz Technology for Military Applications. J. Assoc. Inf. Sci. Technol. 2015, 3, 13–16. [Google Scholar] [CrossRef]
- Liu, H.B.; Zhong, H.; Karpowicz, N.; Chen, Y.; Zhang, X.C. Terahertz spectroscopy and imaging for defense and security applications. Proc. IEEE 2007, 95, 1514–1527. [Google Scholar] [CrossRef]
- D’Arco, A.; Mussi, V.; Petrov, S.; Tofani, S.; Petrarca, M.; Beccherelli, R.; Dimitrov, D.; Marinova, V.; Lupi, S.L.; Zografopoulos, D.C. Fabrication and spectroscopic characterization of graphene transparent electrodes on flexible cyclo-olefin substrates for terahertz electro-optic applications. Nanotechnology 2020, 31, 364006. [Google Scholar] [CrossRef]
- Wang, K.; Sun, D.W.; Pu, H. Emerging non-destructive terahertz spectroscopic imaging technique: Principle and applications in the agri-food industry. Trend Food Sci. Technol. 2017, 67, 93–105. [Google Scholar] [CrossRef]
- Cosentino, A. Terahertz and cultural heritage science: Examination of art and archeology. Technologies 2016, 4, 6. [Google Scholar] [CrossRef]
- Yamaguchi, S.; Yamaguchi, S.; Fukushi, Y.; Kubota, O.; Itsuji, T.; Ouchi, T.; Yamamoto, S. Brain tumor imaging of rat fresh tissue using terahertz spectroscopy. Sci. Rep. 2016, 6, 30124. [Google Scholar] [CrossRef] [Green Version]
- Bajwa, N.; Au, J.; Jarrahy, R.; Sung, S.; Fishbein, M.C.; Riopelle, D.; Ennis, D.B.; Aghaloo, T.; John, M.A.; Grundfest, W.S.; et al. Non-invasive terahertz imaging of tissue water content for flap viability assessment. Biomed. Opt. Express 2017, 8, 460–474. [Google Scholar] [CrossRef] [Green Version]
- Zaytsev, I.; Dolganova, I.N.; Chernomyrdin, N.V.; Katyba, G.M.; Gavdush, A.A.; Cherkasova, O.P.; Komandin, G.A.; Shchedrina, M.A.; Khodan, A.N.; Ponomarev, D.S.; et al. The progress and perspectives of terahertz technology for diagnosis of neoplasms: A review. J. Opt. 2020, 22, 013001. [Google Scholar] [CrossRef]
- Yang, X.; Zhao, X.; Yang, K.; Liu, Y.; Liu, Y.; Fu, W.; Luo, Y. Biomedical Applications of Terahertz Spectroscopy and Imaging. Trends Biotechnol. 2016, 34, 810–824. [Google Scholar] [CrossRef]
- Son, J.H.; Oh, S.J.; Cheon, H. Potential clinical applications of terahertz radiation. J. Appl. Phys. 2019, 125, 190901. [Google Scholar] [CrossRef]
- D’Arco, A.; Di Fabrizio, M.; Dolci, V.; Petrarca, M.; Lupi, S. THz Pulsed Imaging in Biomedical Applications. Condens. Matter 2020, 5, 25. [Google Scholar] [CrossRef] [Green Version]
- Di Fabrizio, M.; D’Arco, A.; Mou, S.; Palumbo, L.; Petrarca, M.; Lupi, S. Performance Evaluation of a THz pulsed Imaging System: Point Spread Function, Broadband THz Beam Visualization and Image Reconstruction. Appl. Sci. 2021, 11, 562. [Google Scholar] [CrossRef]
- Di Fabrizio, M.; Lupi, S.; D’Arco, A. Virus recognition with terahertz radiation: Drawbacks and potentialities. J. Phys. Photonics 2021, 3, 032001. [Google Scholar] [CrossRef]
- Lee, Y.S. Principles of Terahertz Science and Technology; Springer: Berlin/Heidelberg, Germany, 2009. [Google Scholar]
- Zhang, X.C.; Xu, J. Introduction to THz Wave Photonics; Springer: Berlin/Heidelberg, Germany, 2010. [Google Scholar]
- Walther, M.; Plochocka, P.; Fischer, B.; Helm, H.; Jepsen, P.U. Collective Vibrational Modes in Biological Molecules Investigated by Terahertz Time-domain Spectroscopy. Biopolymers 2002, 67, 310–313. [Google Scholar] [CrossRef]
- Tanabe, T.; Watanabe, K.; Oyama, Y.; Seo, K. Polarization Sensitive THz Absorption Spectroscopy for the Evaluation of Uniaxially Deformed Ultra-high Molecular Weight Polyethylene. NDT & E Int. 2010, 43, 329–333. [Google Scholar]
- Parrott, E.P.J.; Zeitler, J.A. Terahertz Time-Domain and Low-Frequency Raman Spectroscopy of Organic Materials. Appl. Spectrosc. 2015, 69, 1–25. [Google Scholar] [CrossRef]
- Cooksey, C.C.; Greer, B.J.; Heilweil, E.J. Terahertz Spectroscopy of L-Proline in Reverse Aqueous Micelles. Chem. Phys. Lett. 2009, 467, 424–429. [Google Scholar] [CrossRef]
- Yue, W.; Wang, W.; Zhao, G.; Zhang, C.; Yan, H. THz Spectrum of Aromatic Amino Acid. Chin. Phys. Soc. 2005, 54, 3094–3099. [Google Scholar]
- Kutteruf, M.R.; Brown, C.M.; Iwaki, L.K.; Campbell, M.B.; Korter, T.M.; Heilweil, E.J. Terahertz spectroscopy of short-chain polypeptides. Chem. Phys. Lett. 2003, 375, 337–343. [Google Scholar] [CrossRef]
- Manti, L.; D’Arco, A. Cooperative biological effects between ionizing radiation and other physical and chemical agents. Mutat. Res. 2010, 704, 115–122. [Google Scholar] [CrossRef]
- Lee, D.-K.; Kang, J.-H.; Know, J.; Lee, J.-S.; Lee, S.; Woo, D.H.; Kim, J.H.; Song, C.-S.; Park, Q.H.; Seo, M. Nano metamaterials for ultrasensitive terahertz biosensing. Sci. Rep. 2017, 7, 8146. [Google Scholar] [CrossRef]
- Lin, H.; Withayachumnankul, W.; Fischer, B.; Mickan, S.; Abbott, D. Gas recognition with terahertz time-domain spectroscopy and spectral catalog: A preliminary study. Terahertz Photonics 2008, 6840, 68400X. [Google Scholar]
- Kindt, J.T.; Schmuttenmaer, C.A. Far-Infrared Dielectric Properties of Polar Liquids Probed by Femtosecond Terahertz Pulse Spectroscopy. J. Phys. Chem. 1996, 100, 10373–10379. [Google Scholar] [CrossRef]
- Fedulova, E.; Nazarov, M.; Angeluts, A.; Kitai, M.; Sokolov, V.; Shkurinov, A. Studying of dielectric properties of polymers in the terahertz frequency range. In Optical technologies in biophysics and medicine XIII, Proceedings of the Saratov Fall Meeting 2011, Saratov, Russia, 27–30 September 2011; SPIE: Bellingham, WA, USA, 2011. [Google Scholar]
- Rezvani, S.J.; Di Gioacchino, D.; Tofani, S.; D’Arco, A.; Ligi, C.; Lupi, S.; Gatti, C.; Cestelli Guidi, M.; Marcelli, A. A cryogenic magneto-optical device for long wavelength radiation. Rev. Sci. Instrum. 2020, 91, 075103. [Google Scholar] [CrossRef]
- Burford, N.; El-Shenawee, M.O. Review of terahertz photoconductive antenna technology. Opt. Eng. 2017, 56, 010901. [Google Scholar] [CrossRef]
- Dexheimer, S.L. Terahertz Spectroscopy: Principles and Applications; CRC Press: Boca Raton, FL, USA, 2017. [Google Scholar]
- Naftaly, M. Terahertz Metrology; Artech House: London, UK, 2015. [Google Scholar]
- Seo, M.; Park, H.-R. Terahertz Biochemical Molecules-specific sensors. Adv. Opt. Mater. 2019, 8, 1900662. [Google Scholar] [CrossRef]
- Korter, T.M.; Balu, R.; Campbell, M.B.; Beard, M.C.; Gregurick, S.K.; Heilweil, E.J. Terahertz Spectroscopy of Solid Serine and Cysteine. Chem. Phys. Lett. 2006, 418, 65–70. [Google Scholar] [CrossRef]
- Wang, X.; Wang, W. Terahertz Time-domain Spectroscopy of Sulfur-containing Amino Acids. Acta Chim. Sin. 2008, 66, 2248–2252. [Google Scholar]
- Yamamoto, K.; Kabir, M.H.; Tominaga, K. Terahertz Time-domain Spectroscopy of Sulfur-containing Biomolecules. J. Opt. Soc. Am. B 2005, 22, 2417–2426. [Google Scholar] [CrossRef]
- Matei, A.; Drichko, N.; Gompf, B.; Dressel, M. Far-infrared Spectra of Amino Acids. Chem. Phys. 2005, 316, 61–71. [Google Scholar] [CrossRef]
- Wang, W.; Li, H.; Zhang, Y.; Zhang, C. Correlations Between Terahertz Spectra and Molecular Structures of 20 Standard α-Amino Acids. Acta Phys. Chim. Sin. 2009, 25, 2074–2079. [Google Scholar]
- Yan, Z.; Hou, D.; Huang, P.; Cao, B.; Zhang, G.; Zhou, Z. Terahertz Spectroscopic Investigation of L-Glutamic Acid and L-Tyrosine. Meas. Sci. Technol. 2008, 19, 15602–15605. [Google Scholar] [CrossRef]
- Wang, G.; Wang, W. Experimental and Theoretical Investigations on the Terahertz Vibrational Spectroscopy of Alanine Crystal. Acta Phys. Chim. Sin. 2012, 28, 1579–1585. [Google Scholar]
- Zheng, Z.; Fan, W. First Principles Investigation of L-Alanine in Terahertz Region. Biol. Phys. 2012, 38, 405–413. [Google Scholar] [CrossRef] [Green Version]
- Taulbee, A.R.; Heuser, J.A.; Spendel, W.U.; Pacey, G.E. Qualitative Analysis of Collective Mode Frequency Shifts in L-Alanine Using Terahertz Spectroscopy. Anal. Chem. 2009, 81, 2664–2667. [Google Scholar] [CrossRef] [Green Version]
- Taday, P.F.; Bradley, I.V.; Arnone, D.D. Terahertz Pulse Spectroscopy of Biological Materials L-Glutamic Acid. J. Biol. Phys. 2003, 29, 109–115. [Google Scholar] [CrossRef]
- Darkwah, J.; Smith, G.; Ermolina, I.; Mueller-Holtz, M. A THz Spectroscopy Method for Quantifying the Degree of Crystallinity in Freeze-dried Gelatin/Amino Acid Mixtures: An Application for the Development of Rapidly Disintegrating Tablets. Int. J. Pharm. 2013, 455, 357–364. [Google Scholar] [CrossRef]
- Li, Z.; Zhang, Z.; Zhao, X.; Su, H.; Yan, F. Extracting THz Absorption Coefficient Spectrum Based on Accurate Determination of Sample Thickness. Spectrosc. Spect. Anal. 2012, 32, 1043–1046. [Google Scholar]
- Yang, J.; Li, S.; Zhao, H.; Zhang, J.; Yang, N.; Jing, D.; Wang, C.; Han, J. Terahertz Study of L-Asparagine and Its Monohydrate. Acta Phys. Sin. 2014, 63, 133203. [Google Scholar] [CrossRef]
- Nishizawa, J.; Tanno, T.; Yoshida, T.; Suto, K. Consequence of a Defect on the Terahertz Spectra of L-Asparagine Monohydrate. Chem. Lett. 2007, 36, 134–135. [Google Scholar] [CrossRef]
- Chiba, M.; Derreumaux, P.; Vergoten, G. The Use of the Spasiba Spectroscopic Potential for Reproducing the Structures and Vibrational Frequencies of a Series of Acids—Acetic-Acid, Pivalic Acid, Succinic Acid, Adipic Acid And L-Glutamic Acid. J. Mol. Struct. 1994, 317, 171–184. [Google Scholar] [CrossRef]
- Yi, W.; Yu, J.; Xu, Y.; Wang, F.; Yu, Q.; Sun, H.; Xu, L.; Liu, Y.; Jiang, L. Broadband terahertz spectroscopy of amino acids. Instrum. Sci. Technol. 2017, 45, 423–439. [Google Scholar]
- Hufnagle, D.C.; Taulbee-Combs, A.R.; Spendel, W.U.; Pacey, G.E. Collective mode frequency shifts in L-serine and a series of isotopologues in the terahertz regime. Talanta 2012, 88, 61–65. [Google Scholar] [CrossRef]
- Patil, M.R.; Ganorkar, S.B.; Patil, A.S.; Shirkhedkar, A.A. Terahertz Spectroscopy: Encoding the Discovery, Instrumentation, and Applications toward Pharmaceutical Prospectives. Crit. Rev. Anal. Chem. 2020, 1–13. [Google Scholar] [CrossRef]
- Williams, M.R.C.; Aschaffenburg, D.J.; Ofori-Okai, B.K.; Schmuttenmaer, C.A. Intermolecular vibrations in hydrophobic amino acid crystals: Experiments and calculations. J. Phys. Chem. B 2013, 117, 10444–10461. [Google Scholar] [CrossRef]
- King, M.D.; Hakey, P.M.; Korter, T.M. Discrimination of chiral solids: A terahertz spectroscopic investigation of l- and dl-serine. J. Phys. Chem. A 2010, 114, 2945–2953. [Google Scholar] [CrossRef]
- Frommel, C. The apolar surface area of amino acids and its empirical correlation with hydrophobic free energy. J. Theor. Biol. 1984, 111, 247–260. [Google Scholar] [CrossRef]
- Kyte, J.; Doolittle, R.F. A simple method for displaying the hydropathic character of a protein. J. Mol. Biol. 1982, 157, 105–132. [Google Scholar] [CrossRef] [Green Version]
- Acharya, H.; Vembanur, S.; Jamadagni, S.N.; Garde, S. Mapping hydrophobicity at the nanoscale: Applications to heterogeneous surfaces and proteins. Faraday Discuss. 2010, 146, 353–365. [Google Scholar] [CrossRef]
- Jensen, J.H.; Gordon, M.S. On the number of water molecules necessary to stabilize the glycine zwitterion. J. Am. Chem. Soc. 1995, 117, 8159–8170. [Google Scholar] [CrossRef] [Green Version]
- Gontrani, L.; Mennucci, B.; Tomasi, J. Glycine and alanine: A theoretical study of solvent effects upon energetics and molecular response properties. J. Mol. Struct. THEOCHEM 2000, 500, 113–127. [Google Scholar] [CrossRef]
- Niehues, G.; Heyden, M.; Schmidt, D.A.; Havenith, M. Exploring hydrophobicity by THz absorption spectroscopy of solvated amino acids. Faraday Discuss. 2011, 150, 193. [Google Scholar] [CrossRef] [PubMed]
- Gordon, M.S.; Jensen, J.H. Understanding the hydrogen bond using quantum chemistry. Acc. Chem. Res. 1996, 29, 536–543. [Google Scholar] [CrossRef] [Green Version]
- Hecht, D.; Tadesse, L.; Walters, L. Correlating hydration shell structure with amino acid hydrophobicity. J. Am. Chem. Soc. 1993, 115, 3336–3337. [Google Scholar] [CrossRef]
- Ide, M.; Maeda, Y.; Kitano, H. Effect of hydrophobicity of amino acids on the structure of water. J. Phys. Chem. B 1997, 101, 7022–7026. [Google Scholar] [CrossRef]
- Qvist, J.; Halle, B. Thermal signature of hydrophobic hydration dynamics. J. Am. Chem. Soc. 2008, 130, 10345–10353. [Google Scholar] [CrossRef]
- Balabin, R.M. The First Step in Glycine Solvation: The Glycine−Water Complex. J. Phys. Chem. B 2010, 114, 15075–15078. [Google Scholar] [CrossRef] [PubMed]
- McLain, S.E.; Soper, A.K.; Terry, A.E.; Watts, A. Structure and Hydration of L-Proline in Aqueous Solutions. J. Phys. Chem. B 2007, 111, 4568–4580. [Google Scholar] [CrossRef] [PubMed]
- Pacios, L.F. Distinct molecular surfaces and hydrophobicity of amino acid residues in proteins. J. Chem. Inf. Comput. Sci. 2001, 41, 1427–1435. [Google Scholar] [CrossRef]
- Sato, T.; Buchner, R.; Fernandez, S.; Chiba, A.; Kunz, W. Dielectric relaxation spectroscopy of aqueous amino acid solutions: Dynamics and interactions in aqueous glycine. J. Mol. Liq. 2005, 117, 93–98. [Google Scholar] [CrossRef]
- Rodriguez-Arteche, I.; Cerveny, S.; Alegrıa, A.; Colmenero, J. Dielectric spectroscopy in the GHz region on fully hydrated zwitterionic amino acids. Phys. Chem. Chem. Phys. 2012, 14, 11352–11362. [Google Scholar] [CrossRef]
- Suzuki, M.; Shigematsu, J.; Fukunishi, Y.; Kodama, T. Hydrophobic hydration analysis on amino acid solutions by the microwave dielectric method. J. Phys. Chem. B 1997, 101, 3839–3845. [Google Scholar] [CrossRef]
- Bian, Y.; Zhang, X.; Zhu, Z.; Yang, B. Vibrational modes optimization and terahertz time-domain spectroscopy of L-Lysine and L-Lysine hydrate. J. Mol. Struct. 2021, 1232, 129952. [Google Scholar] [CrossRef]
- Morgante, P.; Peverati, R. The devil in the details: Atutorial review on some undervalued aspects of density functional theory calculations. Int. J. Quant. Chem. 2020, 120, e26332. [Google Scholar] [CrossRef]
- Fox, S.J.; Dziedzic, J.; Fox, T.; Tautermann, C.S.; Skylaris, C.K. Density functional theory calculations on entire proteins for free energies of binging: Application to a model polar binding site. Proteins 2014, 82, 3335–3346. [Google Scholar] [CrossRef] [PubMed] [Green Version]
- Pan, T.; Li, S.; Zou, T.; Yu, Z.; Zhang, B.; Wang, C.; Zhang, J.; He, M.; Zhao, H. Terahertz spectra of L-phenylalanine and its monohydrate. Spectrochim. Acta A Mol. Biomol. Spectrosc. 2017, 178, 19–23. [Google Scholar] [CrossRef] [Green Version]
- Samanta, N.; Mahanta, D.S.; Choudhury, S.; Barman, A.; Mitra, R.K. Collective hydration dynamics in some amino acid solutions: A combined GHz-THz spectroscopic study. J. Chem. Phys. 2017, 146, 125101. [Google Scholar] [CrossRef]
- Itoh, K.; Shimanouchi, T. Far-infrared spectra of N-methylacetamide and related compounds and hydrogen-bond force constraints. Biopolymers 1965, 5, 921–930. [Google Scholar] [CrossRef]
- Yamamoto, K.; Tominaga, K.; Sasakawa, H.; Tamura, A.; Murakami, H. Terahertz time-domain spectroscopy of amino acids and polypeptides. Biophys. J. 2005, 89, L22–L24. [Google Scholar] [CrossRef] [Green Version]
- Neu, J.; Stone, E.A.; Spies, J.A.; Storch, G.; Hatano, A.S.; Mercado, B.Q.; Miller, S.J.; Schmutternmaer, C.A. Terahertz Spectroscopy of Tetrameric Peptides. CA J. Phys. Chem. Lett. 2019, 10, 2624–2628. [Google Scholar] [CrossRef]
- Yoneyama, H.; Yamashita, M.; Kasai, S.; Kawase, K.; Ueno, R.; Ito, H.; Ouchi, T. Terahertz spectroscopy of native-conformation and thermally denatured bovine serum albumin (BSA). Phys. Med. Biol. 2008, 53, 3543–3549. [Google Scholar] [CrossRef]
- Xie, L.; Yao, Y.; Ying, Y. The application of terahertz spectroscopy to protein detection: A review. Appl. Spectrosc. Rev. 2014, 49, 448–461. [Google Scholar] [CrossRef]
- Sun, Y.; Zhang, Y.; Pickwell-Macpherson, E. Investigating antibody interactions with a polar liquid using terahertz pulsed spectroscopy. Biophys. J. 2011, 100, 225–231. [Google Scholar] [CrossRef] [PubMed] [Green Version]
- Falconer, R.J.; Markelz, A.G. Terahertz spectroscopic analysis of peptides and proteins. J. Infrared Millim. Terahertz Waves 2012, 33, 973–988. [Google Scholar] [CrossRef]
- Cao, C.; Zhang, Z.; Zhao, X.; Zhang, T. Terahertz spectroscopy and machine learning algorithm for non-destructive evaluation of protein conformation. Opt. Quantum Electron. 2020, 52, 225. [Google Scholar] [CrossRef]
- Markelz, A.G.; Roitberg, A.; Heilweil, E.J. Pulsed terahertz spectroscopy of DNA, bovine serum albumin and collagen between 0.1 and 2.0 THz. Chem. Phys. Lett. 2000, 320, 42–48. [Google Scholar] [CrossRef]
- Markelz, A.; Whitmire, S.; Hillebrecht, J.; Birge, R. THz time domain spectroscopy of biomolecular conformational modes. Phys. Med. Biol. 2002, 47, 3797–3805. [Google Scholar] [CrossRef] [PubMed]
- Paciaroni, A.; Orecchini, A.; Haertlein, M.; Moulin, M.; Nibali, V.C.; Francesco, A.D.; Petrillo, C.; Sacchetti, F. Vibrational collective dynamics of dry proteins in the terahertz region. J. Phys. Chem. B 2012, 116, 3861–3865. [Google Scholar] [CrossRef]
- Sun, Y.; Zhong, J.; Zhang, C.; Zuo, J.; Pickwell-MacPherson, E. Label-free detection and characterization of the binding of hemagglutinin protein and broadly neutralizing monoclonal antibodies using terahertz spectroscopy. J. Biomed. Opt. 2015, 20, 037006. [Google Scholar] [CrossRef]
- Castro-Camus, E.; Johnston, M.B. Conformational changes of photoactive yellow protein monitored by terahertz spectroscopy. Chem. Phys. Lett. 2008, 455, 289–292. [Google Scholar] [CrossRef]
- Markelz, A.G. Terahertz dielectric sensitivity to biomolecular structure and function. IEEE J. Sel. Top. Quantum Electron. 2008, 14, 180–190. [Google Scholar] [CrossRef]
- George, D.K.; Knab, J.R.; He, Y.; Kumauchi, M.; Birge, R.R.; Hoff, W.D.; Markelz, A.G. Photoactive yellow protein terahertz response: Hydration, heating and intermediate states. IEEE Trans. Terahertz Sci. Technol. 2013, 3, 288–294. [Google Scholar] [CrossRef]
- Han, X.; Yan, S.; Zang, Z.; Wie, D.; Cui, H.-L.; Du, C. Label-free protein detection using terahertz time-domain spectroscopy. Biomed. Opt. Express 2018, 9, 994–1005. [Google Scholar] [CrossRef] [PubMed] [Green Version]
- Chen, J.Y.; Knab, J.R.; Cerne, J.; Markelz, A.G. Large oxidation dependence observed in terahertz dielectric response for cytochrome c. Phys. Rev. E 2005, 72, 04090. [Google Scholar] [CrossRef] [PubMed]
- Brooks, B.; Karplus, M. Process analytical chemistry: Applications of near infrared spectrometry in environmental and food analysis: An overview. Proc. Natl. Acad. Sci. USA 1985, 82, 4995. [Google Scholar] [CrossRef] [PubMed] [Green Version]
- Kauzmannk, W. Some factors in the interpretation of protein denaturation. Adv. Protein Chem. 1959, 14, 1–63. [Google Scholar]
- Murphy, K.P. Stabilization of protein structure. Methods Mol. Biol. 2001, 168, 1–16. [Google Scholar]
- Freier, E. Thermal denaturation methods in the study of protein folding. Methods Enzymol. 1995, 259, 144–168. [Google Scholar]
- Wijayanti, H.B.; Bansal, N.; Deeth, H.C. Stability of whey proteins during thermal processing: A review. Compr. Rev. Food Sci. F 2014, 13, 1235–1251. [Google Scholar] [CrossRef]
- Wang, B.; Timilsena, Y.P.; Blanch, E.; Adhikari, B. Lactoferrin: Structure, function, denaturation and digestion. Crit. Rev. Food Sci. Nutr. 2019, 59, 580–596. [Google Scholar] [CrossRef]
- Silva, J.L. Pressure stability of proteins. Annu. Rev. Phys. Chem. 1993, 44, 89–113. [Google Scholar] [CrossRef]
- Chirgadze, Y.N.; Ovsepyan, A.M. Observation of small conformational changes in sperm-whale myoglobin by far-infrared spectra. Biopolymers 1973, 12, 637–645. [Google Scholar] [CrossRef]
- Chen, H.; Chen, G.; Li, S.; Wang, L. Reversible conformational change of PsbO Protein detected by terahertz time-domain spectroscopy. Chin. Phys. Lett. 2009, 26, 084204. [Google Scholar]
- Chen, H.; Wang, L.; Qu, Y.G.; Kuang, T.Y.; Li, L.B.; Peng, W.X. Investigation of guanidine hydrochloride induced chlorophyll protein 43 and 47 denaturation in the terahertz frequency range. J. Appl. Phys. 2007, 102, 074701. [Google Scholar] [CrossRef]
- Qu, Y.; Chen, H.; Qin, X.; Wang, L.; Li, L.; Kuang, T. The guanidine hydrochloride-induced denaturation of CP43 and CP47 studied by terahertz time-domain spectroscopy. Sci. China C Life Sci. 2007, 50, 350–355. [Google Scholar] [CrossRef] [PubMed]
- Qu, Y.; Chen, H.; Qin, X.; Li, L.; Wang, L.; Kuang, T. Thermal denaturation of CP43 studied by Fourier transform-infrared spectroscopy and terahertz time-domain spectroscopy. J. Proteins Proteom. 2007, 1774, 1614–1618. [Google Scholar] [CrossRef]
- He, Y.F.; Pei, P.I.; Knab, J.R.; Chen, J.Y.; Markelz, A.G. Protein dynamical transition does not require protein structure. Phys. Rev. Lett. 2008, 101, 178103. [Google Scholar] [CrossRef] [PubMed]
- Luong, T.Q.; Verma, P.K.; Mitra, R.K.; Havenith, M. Do hydration dynamics follow the structural perturbation during thermal denaturation of a protein: A terahertz absorption study. Biophys. J. 2011, 101, 925–933. [Google Scholar] [CrossRef] [PubMed] [Green Version]
- George, D.K.; Chen, J.Y.; He, Y.; Knab, J.R.; Markelz, A.G. Functional-state dependence of picosecond protein dynamics. J. Phys. Chem. B 2021, 125, 11134–11140. [Google Scholar] [CrossRef]
- Zhou, R.; Wang, C.; Wendao, X.; Xie, L. Biological applications of terahertz technology based on nanomaterials and nanostructures. Nanoscale 2019, 11, 3445–3457. [Google Scholar] [CrossRef] [PubMed]
- Tang, Q.; Liang, M.; Yi, L.; Wong, P.K.; Wilmink, G.J.; Zhang, D.D.; Xin, H. Microfluidic devices for terahertz spectroscopy of live cells toward lab-on-a-chip applications. Sensors 2016, 16, 476. [Google Scholar] [CrossRef]
- Zhao, X.; Zhang, M.; Wei, D.; Wang, Y.; Yan, S.; Liu, M.; Yang, X.; Yang, K.; Cui, H.; Fu, W. Label-free sensing of the binding state of MUC1 peptide and anti-MUC1 aptamer solution in fluidic chip by terahertz spectroscopy. Biomed. Opt. Express 2017, 8, 4427–4437. [Google Scholar] [CrossRef] [PubMed] [Green Version]
- Cheng, R.; Xu, L.; Yu, X.; Zou, L.; Shen, Y.; Deng, X. High-sensitivity biosensor for identification of protein based on terahertz Fano resonance metasurfaces. Opt. Commun. 2020, 473, 125850. [Google Scholar] [CrossRef]
- Amin, M.; Siddiqui, O.; Abutarboush, H.; Farhat, M.; Ramzan, R. A THz graphene metasurface for polarization selective virus sensing. Carbon 2021, 176, 580–591. [Google Scholar] [CrossRef] [PubMed]
- Ahmadivand, A.; Gerislioglu, B.; Ramezzani, Z.; Kaushik, A.; Manickam, P.; Ghoreishi, A. Functionalized terahertz plasmonic metasensors: Femtomolar-level detection of SARS-CoV-2 spike proteins. Biosens. Bioelectron. 2021, 177, 112971. [Google Scholar] [CrossRef] [PubMed]
- Xu, W.; Xie, L.; Zhu, J.; Xu, X.; Ye, Z.; Wang, C.; Ma, Y.; Ying, Y. Gold nanoparticle-based terahertz metamaterial sensors: Mechanisms and applications. ACS Photonics 2016, 3, 2308–2314. [Google Scholar] [CrossRef]
- Adak, S.; Tripathi, L.N. Nanoantenna enhanced terahertz interaction of biomolecules. Analyst 2019, 144, 6172–6192. [Google Scholar] [CrossRef] [PubMed] [Green Version]
- Zhang, Z.; Fan, F.; Shi, W.; Zhang, T.; Chang, S. Terahertz circular polarization sensing for protein denaturation based on a twisted dual-layer metasurface. Biomed. Opt. Express 2022, 13, 209–221. [Google Scholar] [CrossRef]
- Meister, K.; Ebbinghaus, S.; Xu, Y.; Duman, J.G.; DeVries, A.; Gruebele, M.; Leitner, D.M.; Havenith, M. Long-range protein–water dynamics in hyperactive insect antifreeze proteins. Proc. Natl. Acad. Sci. USA 2013, 110, 1617–1622. [Google Scholar] [CrossRef] [Green Version]
- Knab, J.; Chen, J.Y.; Markelz, A. Hydration dependence of conformational dielectric relaxation of lysozyme. Biophys. J. 2006, 90, 2576–2581. [Google Scholar] [CrossRef] [Green Version]
- Heyden, M.; Havenith, M. Combining THz spectroscopy and MD simulations to study protein–hydration coupling. Methods 2010, 52, 74–83. [Google Scholar] [CrossRef]
- Xu, J.; Plaxco, K.W.; Allen, S.J. Probing the collective vibrational dynamics of a protein in liquid water by terahertz absorption spectroscopy. Protein Sci. 2006, 15, 1175–1181. [Google Scholar] [CrossRef] [PubMed] [Green Version]
- Pal, S.; Chattopadhyay, A. Hydration dynamics in biological membranes: Emerging application of terahertz spectroscopy. J. Phys. Chem. Lett. 2021, 12, 9697–9709. [Google Scholar] [CrossRef] [PubMed]
- Wang, Y.; Wang, G.; Xu, D.; Jiang, B.; Ge, M.; Wu, L.; Yang, C.; Mu, N.; Wang, S.; Chang, C.; et al. Terahertz spectroscopic diagnosis of early blast-induced traumatic brain injury in rats. Biomed. Opt. Express 2020, 11, 4085–4098. [Google Scholar] [CrossRef] [PubMed]
- Sun, Y.; Du, P.; Lu, X.; Xie, P.; Qian, Z.; Fan, S.; Zhu, Z. Quantitative characterization of bovine serum albumin thin-films using terahertz spectroscopy and machine learning methods. Biomed. Opt. Express 2018, 9, 2917–2929. [Google Scholar] [CrossRef] [PubMed]
Figure 1.
THz region and applications in the protein field of THz radiation. The THz domain typically lies between microwave and infrared regions, which refers to the frequency band spanning 0.1–15 THz (from 3 cm−1 to 500 cm−1). The generation of THz radiation was successfully developed with both electronics and photonics, including the up-conversion of electronic radiofrequency sources and the down-conversion of optical sources. THz technology detects proteins, illustrated by their structure hierarchy.

Figure 2.
Schematic overview about the advantages and disadvantages of main techniques for protein characterization.
Figure 2.
Schematic overview about the advantages and disadvantages of main techniques for protein characterization.

Figure 3.
Refractive index of the proteins rn21, rn22, rn28, n42, n43 and n53 for samples with a concentration of 2.0 μg/μL and a quantity of 8 μg. Reprinted from Ref. [174].
Figure 3.
Refractive index of the proteins rn21, rn22, rn28, n42, n43 and n53 for samples with a concentration of 2.0 μg/μL and a quantity of 8 μg. Reprinted from Ref. [174].

Figure 4.
The imaging of the membrane: (a) the dot blot result, (b) the pseudo-color image of gray image formatted by the relative THz energy integration of transmission spectrum pixel by pixel. Reprinted from Ref. [174].
Figure 4.
The imaging of the membrane: (a) the dot blot result, (b) the pseudo-color image of gray image formatted by the relative THz energy integration of transmission spectrum pixel by pixel. Reprinted from Ref. [174].

Figure 5.
(a) Schematic diagram of the THz experimental configuration. (b) Photograph of the THz optical path of the experimental setup. (c) The geometry of the twisted dual-layer metasurface. (d) The micrograph of the metasurface. (e) Photograph of double-layer metasurface with the flexible PI substrate. (f) The appearance of BSA solution changes with temperature. Reprinted from Ref. [199].

Figure 6.
(a) The peak values of the RLCP and (b) RRCP of BSA, WP and OVA solutions change as a function of the heat-treatment temperature. The temperatures, reported in these two figures, refer to the temperature of the complete denaturation for a certain protein. Relationship of the peak value change of (c) RLCP and (d) RRCP vs. the denaturation percentage. Reprinted from Ref. [199].

Figure 7.
Sensing results of the BSA solution with different concentrations. (a) LCP spectra RLCP and (b) RRCP at 30 °C. (c) RLCP and (d) RRCP at 90 °C. The peak value (e) RLCP and (f) RRCP of BSA solution change with sample concentration. Reprinted from Ref. [199].
Figure 7.
Sensing results of the BSA solution with different concentrations. (a) LCP spectra RLCP and (b) RRCP at 30 °C. (c) RLCP and (d) RRCP at 90 °C. The peak value (e) RLCP and (f) RRCP of BSA solution change with sample concentration. Reprinted from Ref. [199].

Figure 8.
THz spectra of total protein in the hypothalamus. (a) Absorption coefficient spectra; (b) refractive index spectra; (c) the normalized absorption coefficient and refractive index values at 1.6 THz. Reprinted from Ref. [205].
Figure 8.
THz spectra of total protein in the hypothalamus. (a) Absorption coefficient spectra; (b) refractive index spectra; (c) the normalized absorption coefficient and refractive index values at 1.6 THz. Reprinted from Ref. [205].

Figure 9.
THz spectra of total protein in the hippocampus. (a) Absorption coefficient; (b) refractive index; (c) the normalized absorption coefficient and refractive index values at 1.6 THz. Reprinted from Ref. [205].
Figure 9.
THz spectra of total protein in the hippocampus. (a) Absorption coefficient; (b) refractive index; (c) the normalized absorption coefficient and refractive index values at 1.6 THz. Reprinted from Ref. [205].


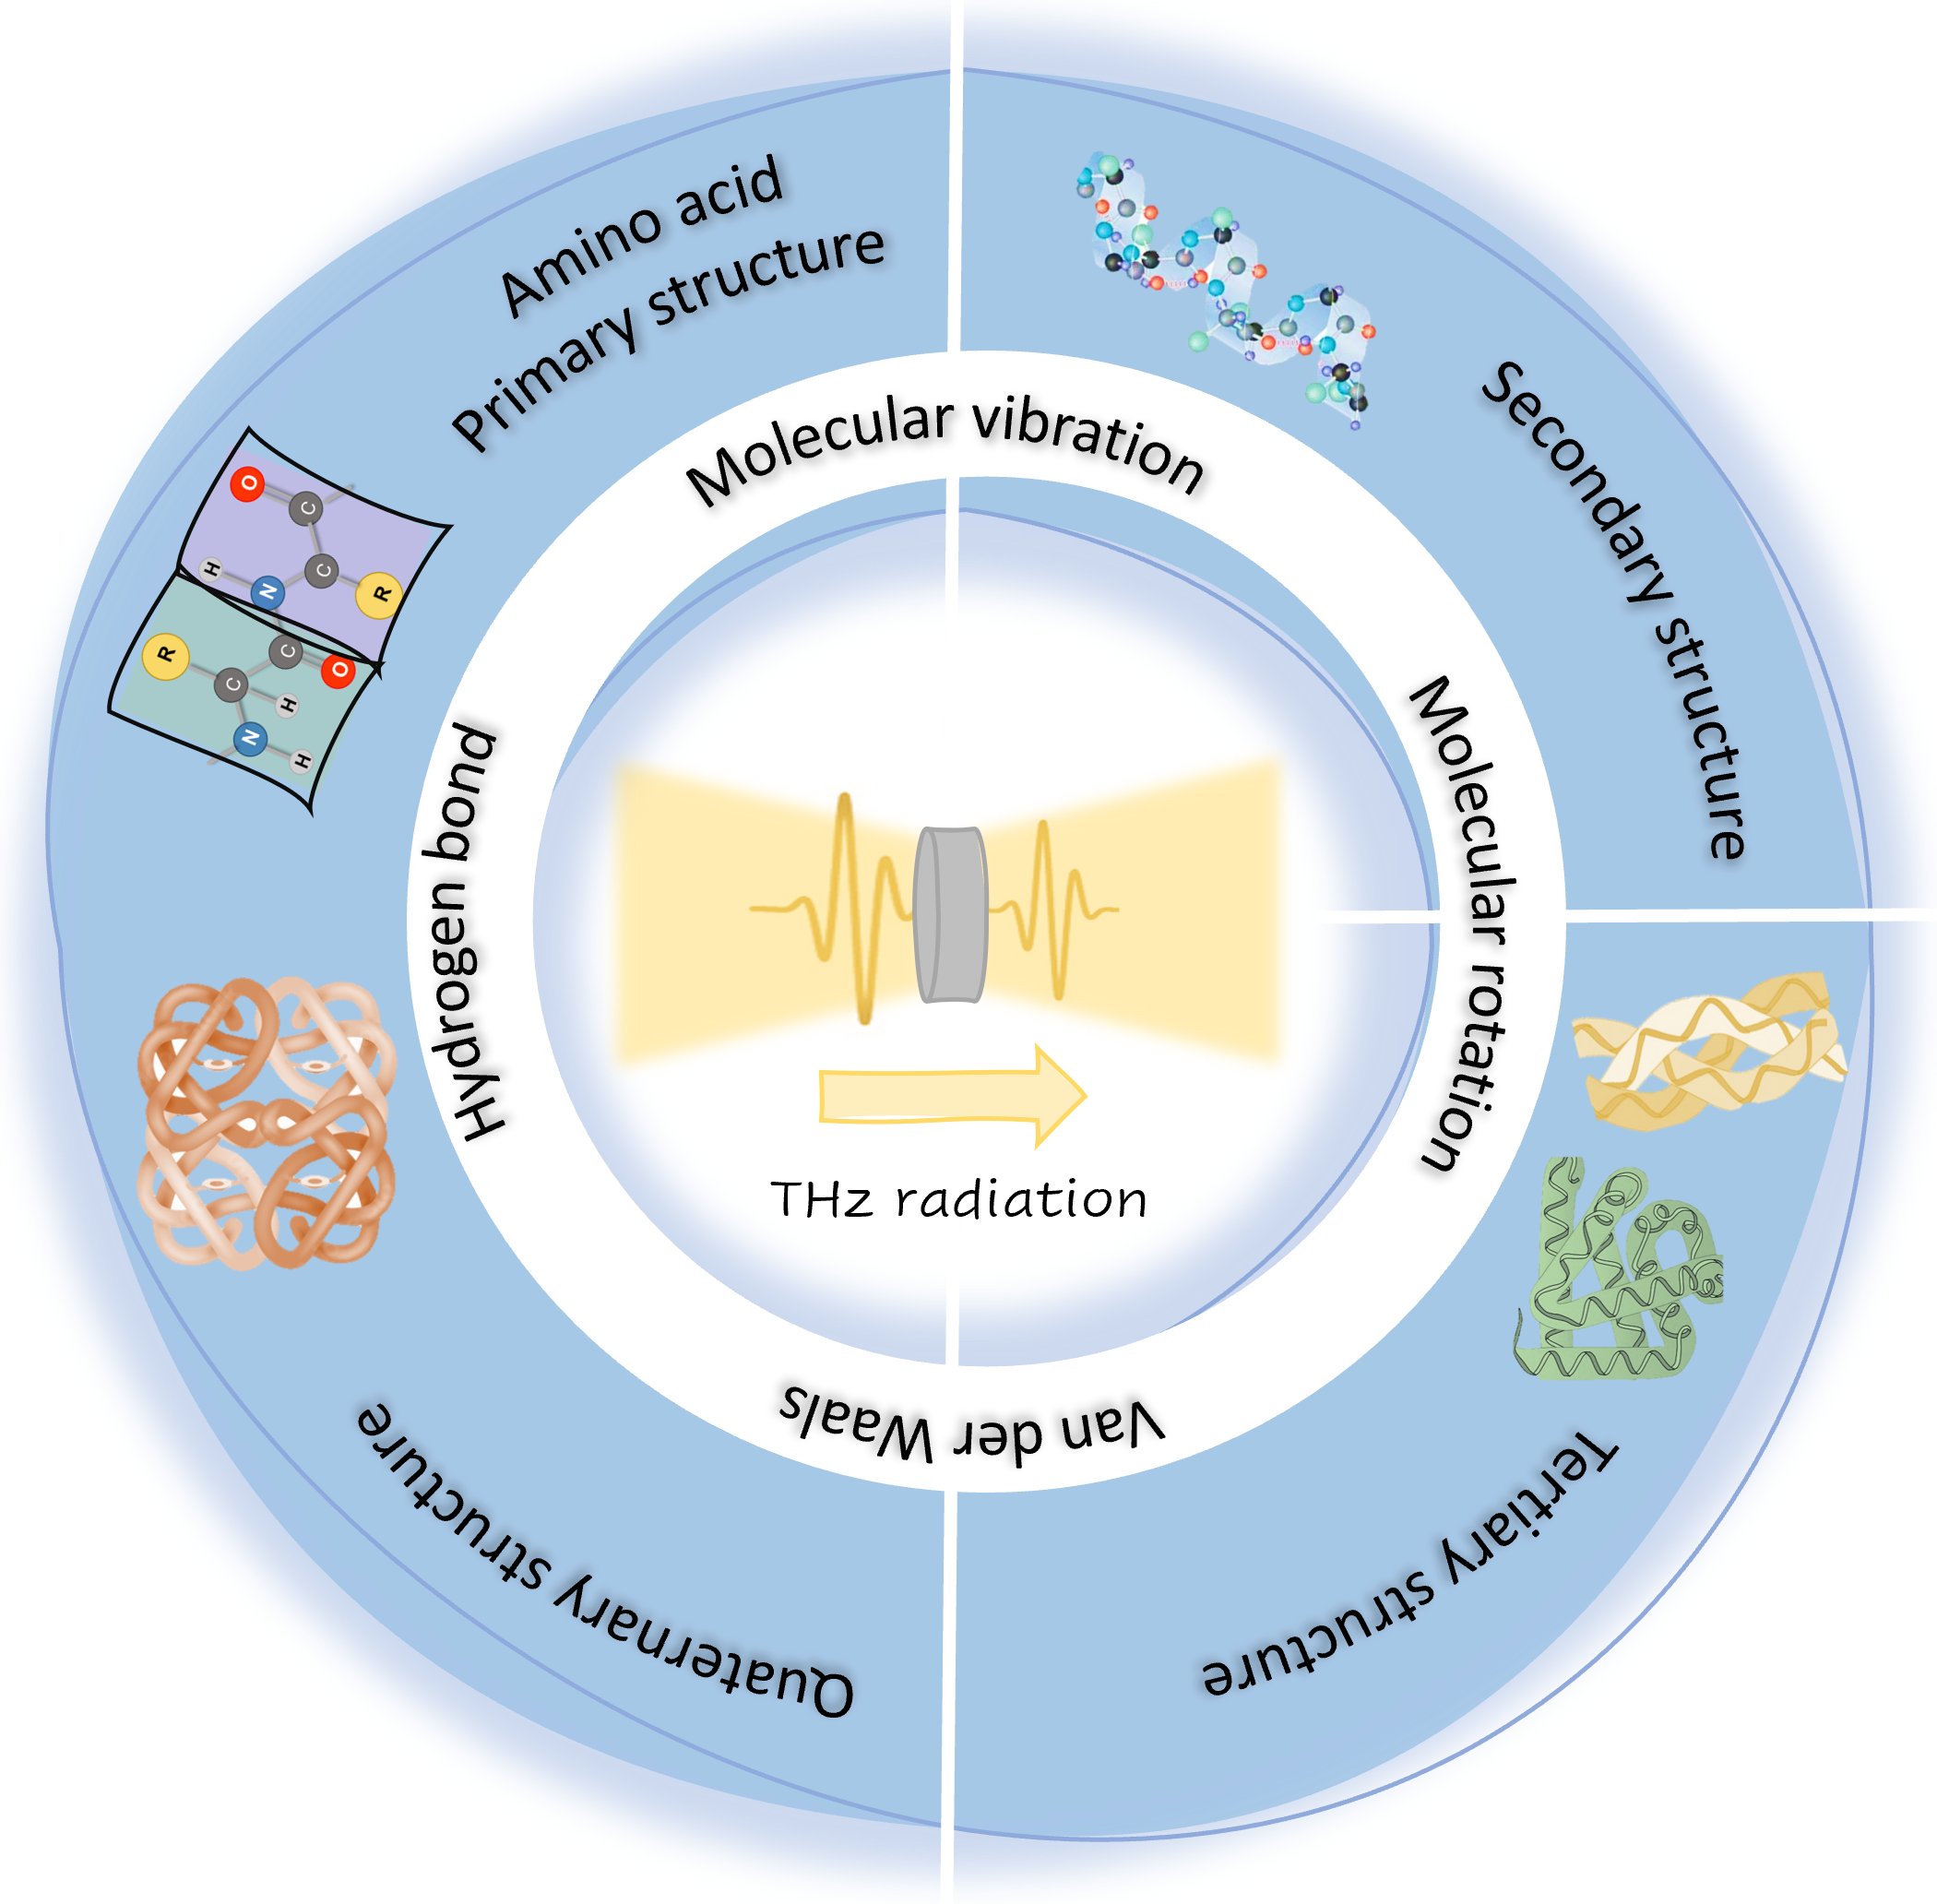
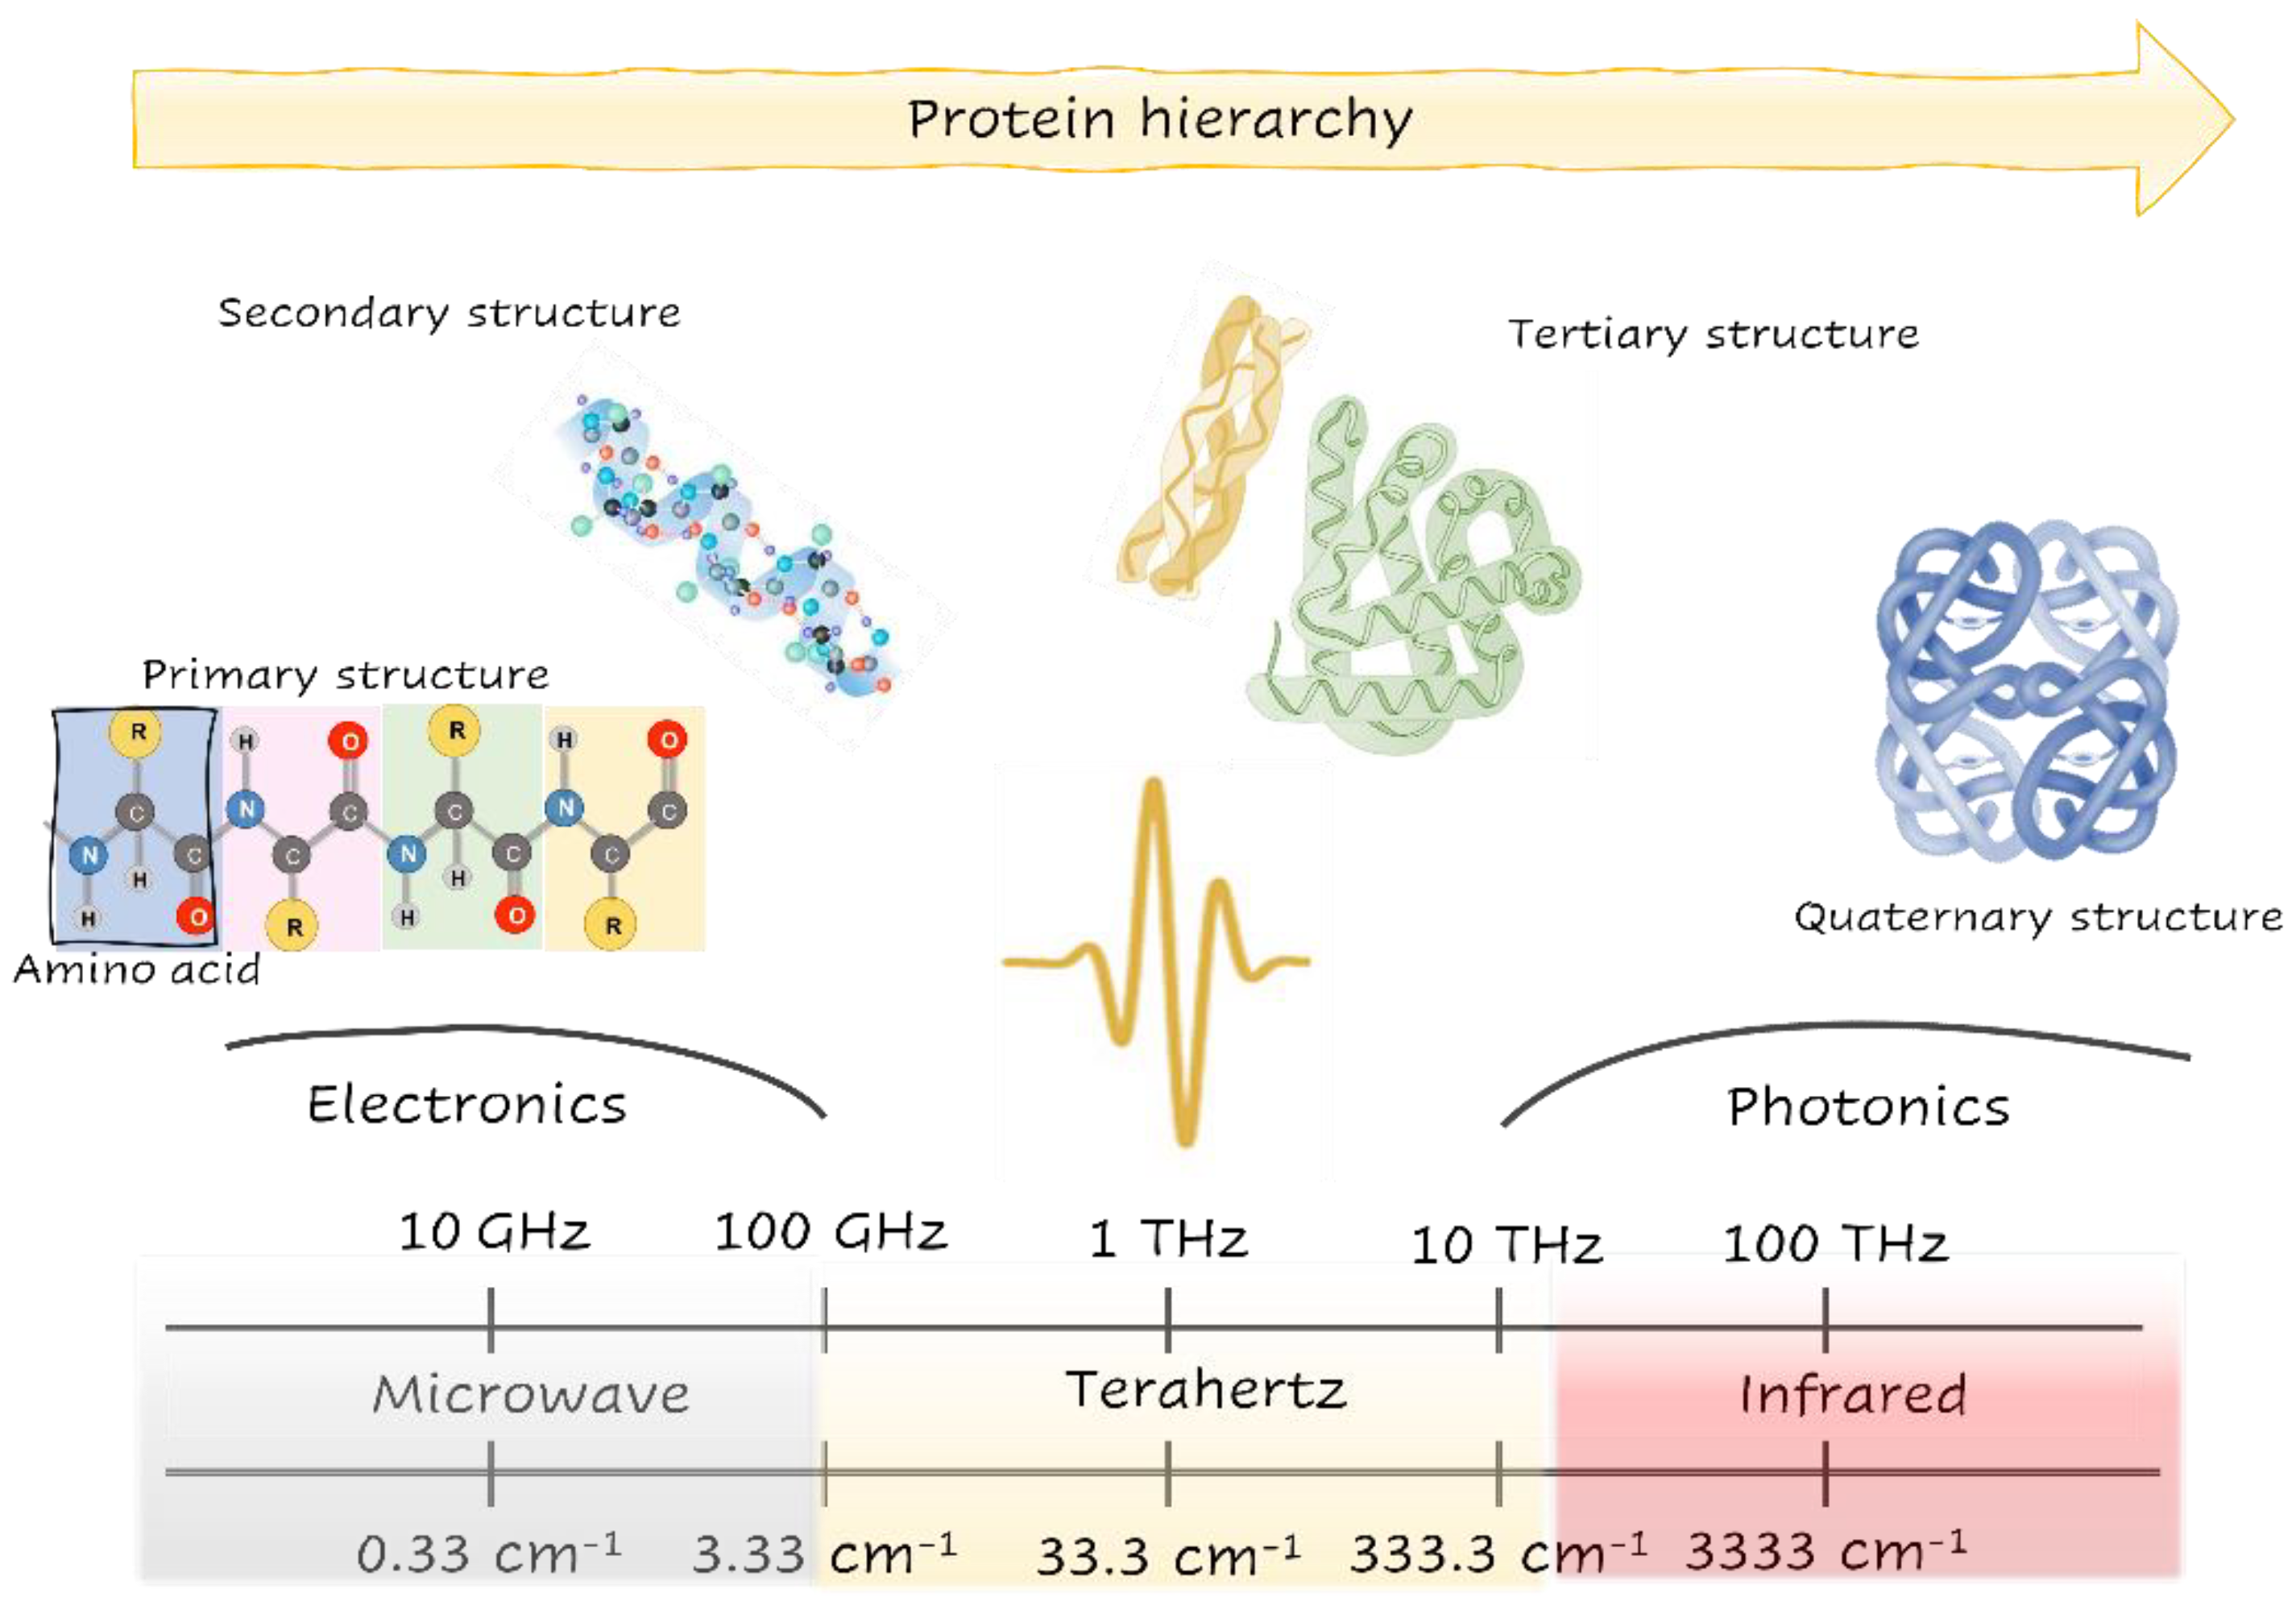
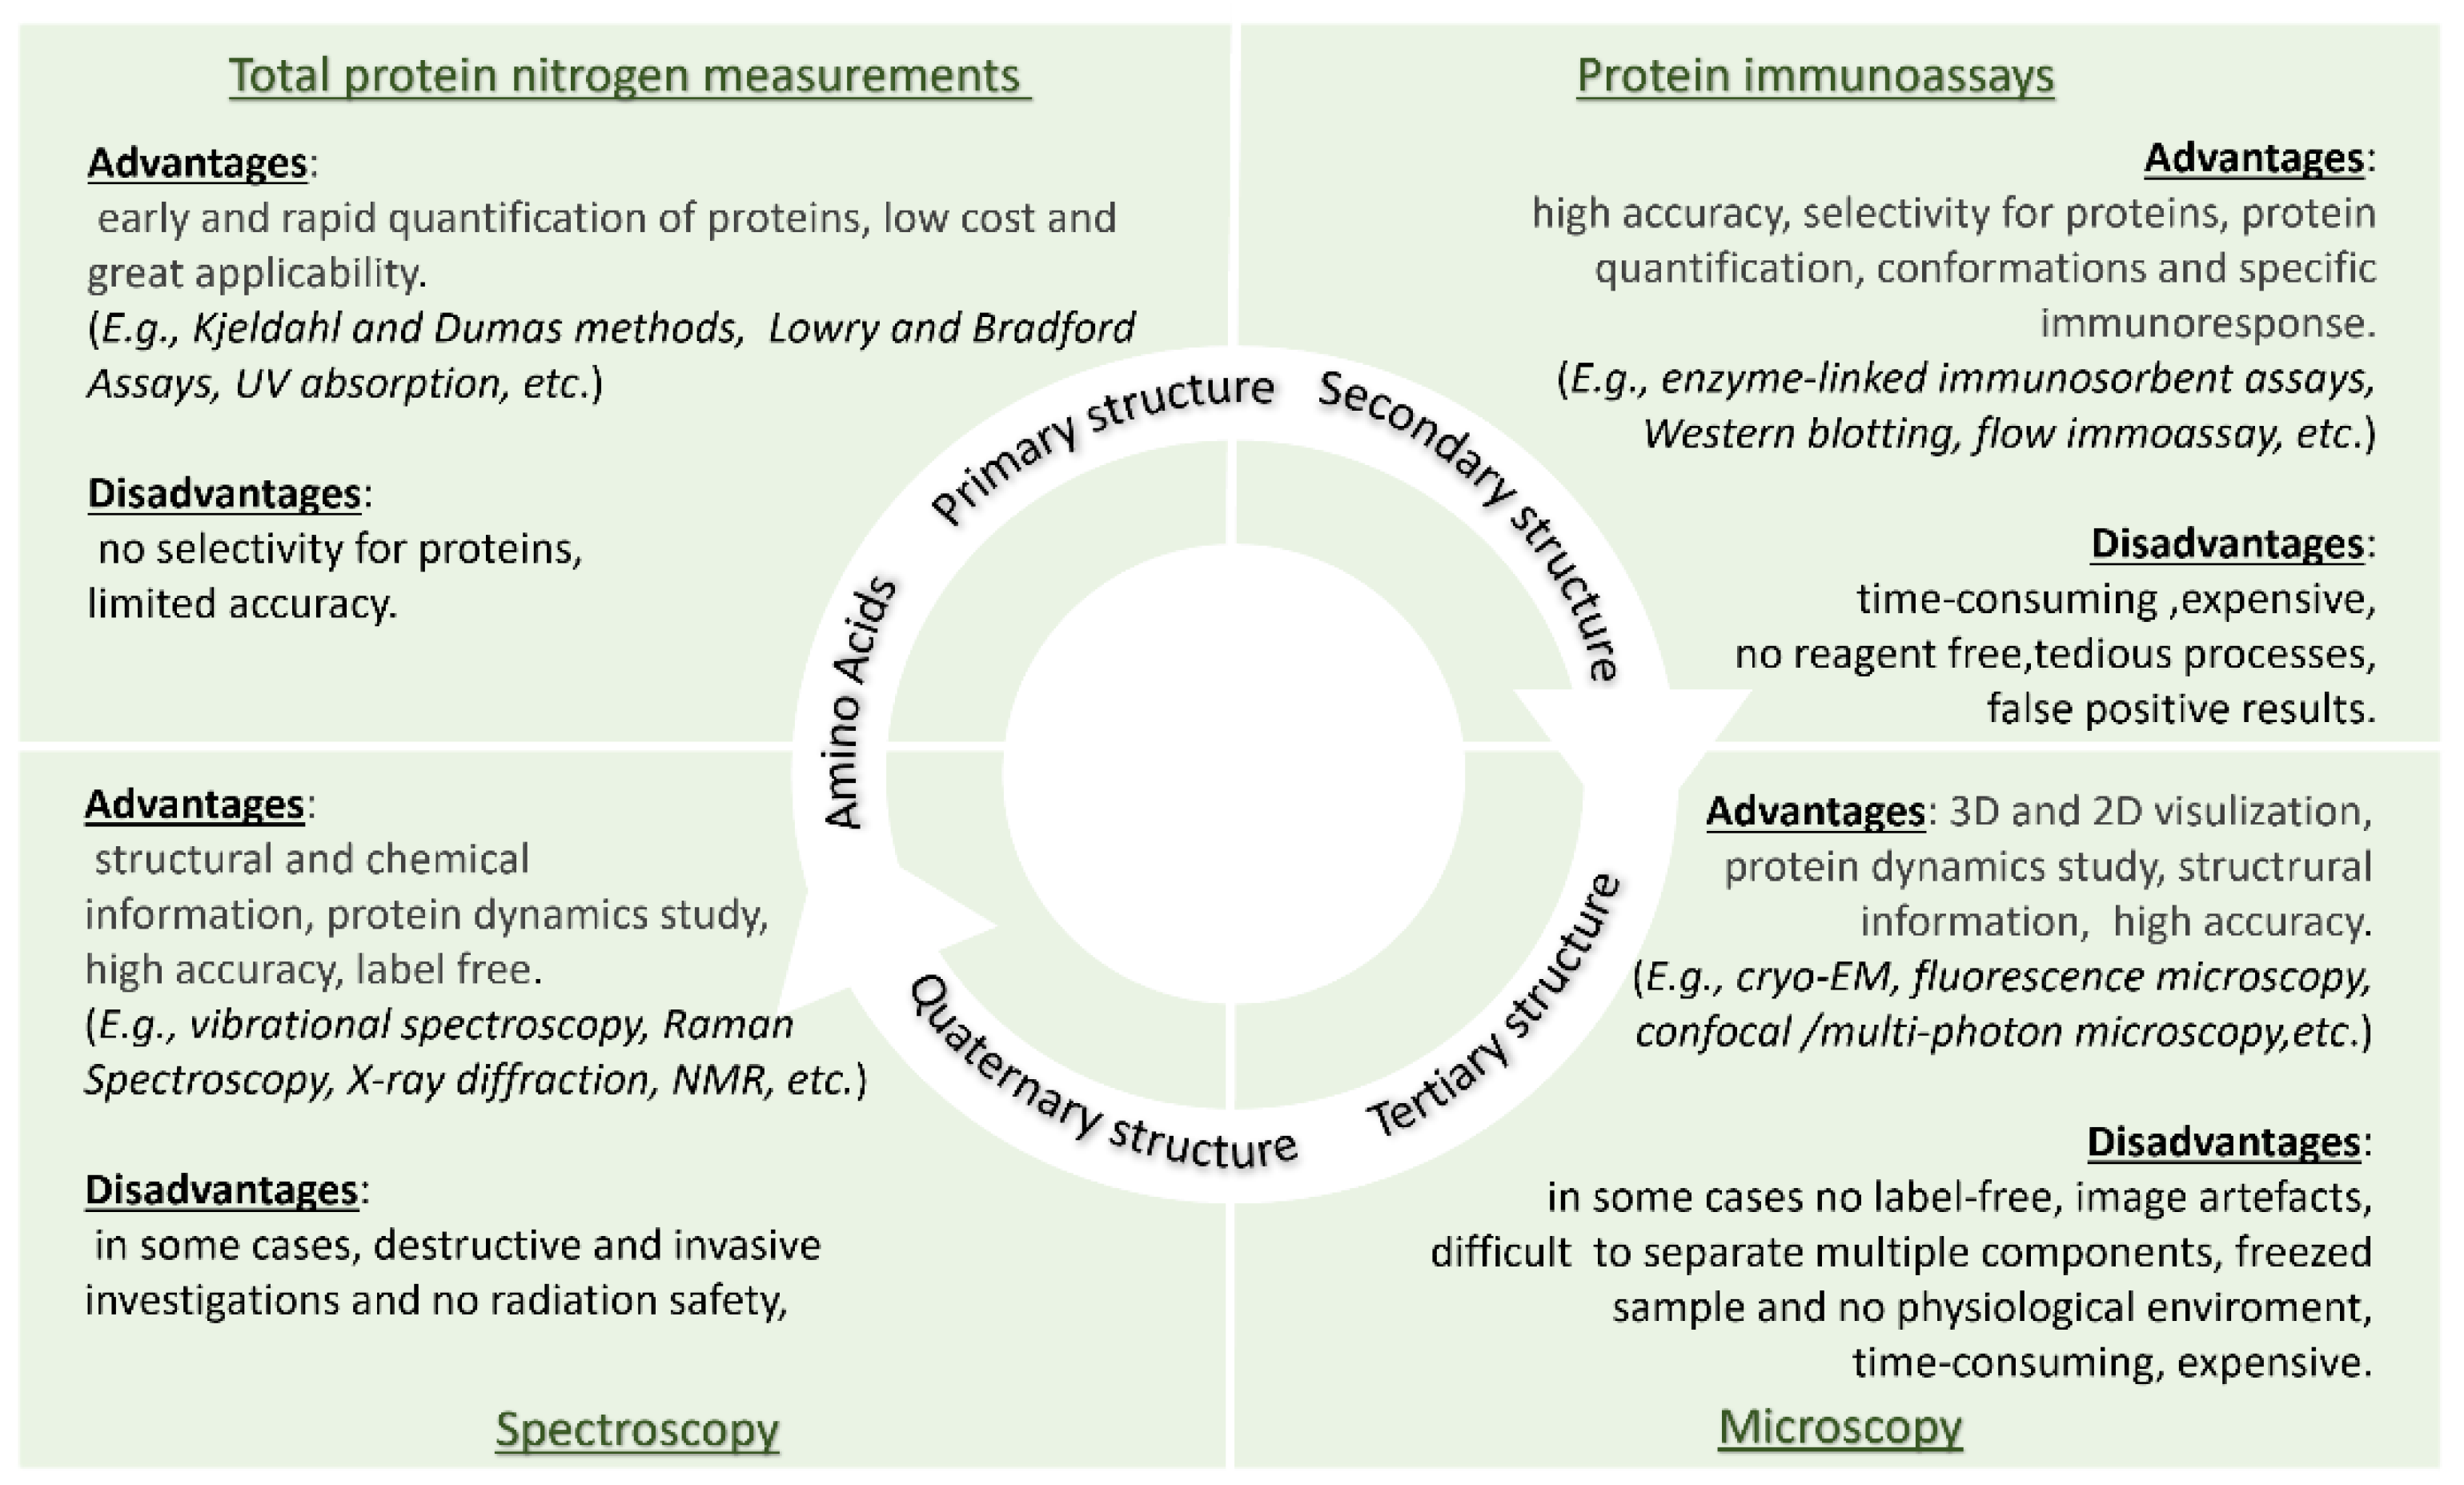
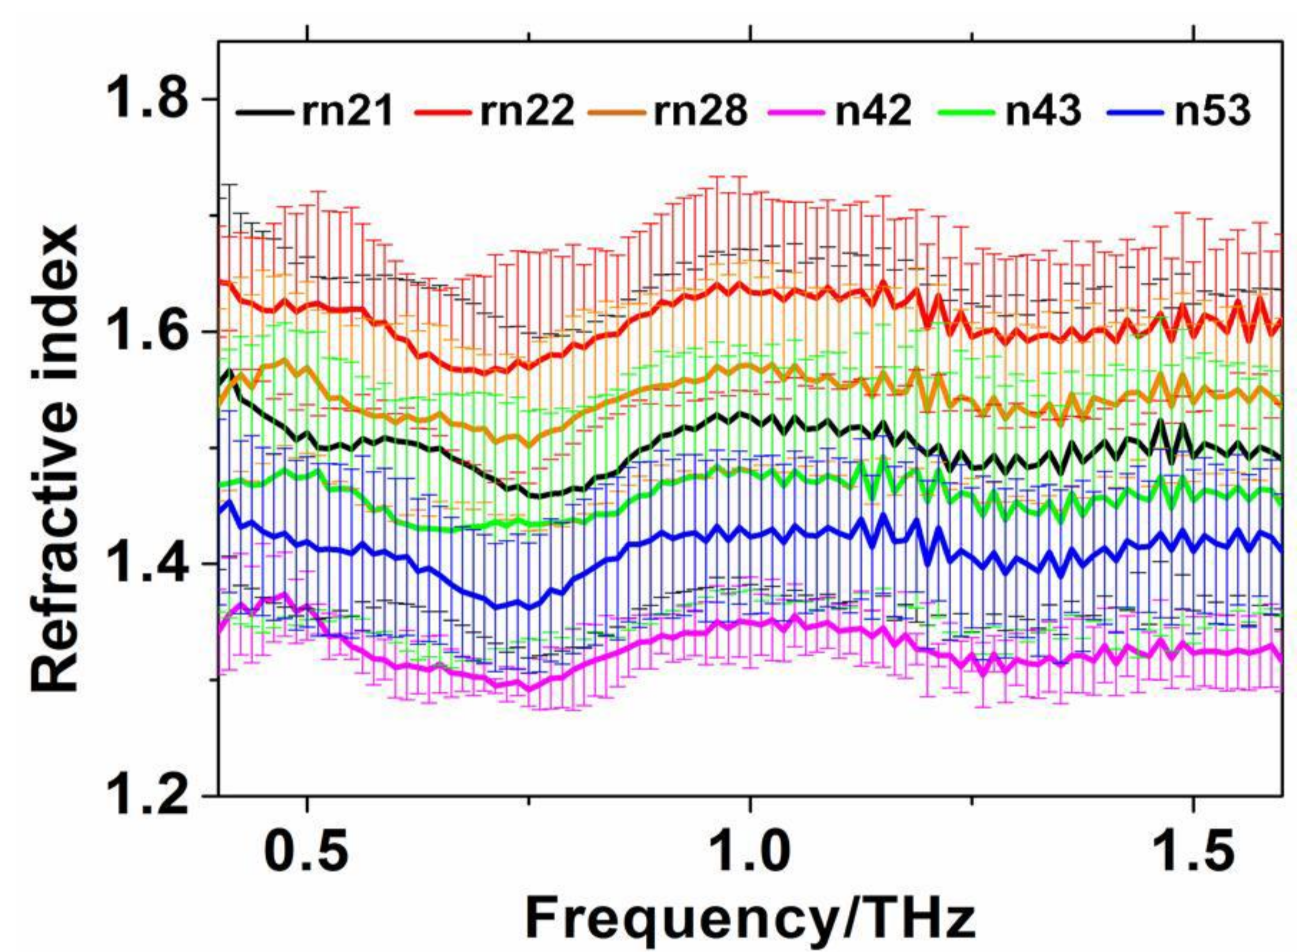
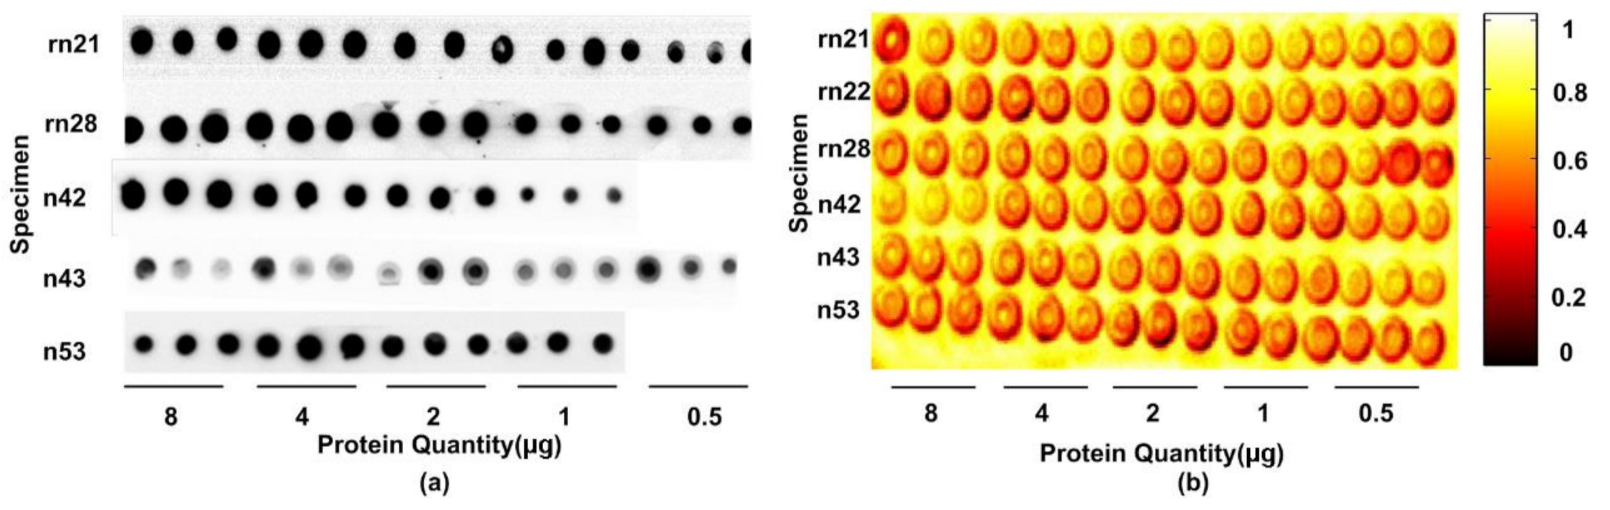
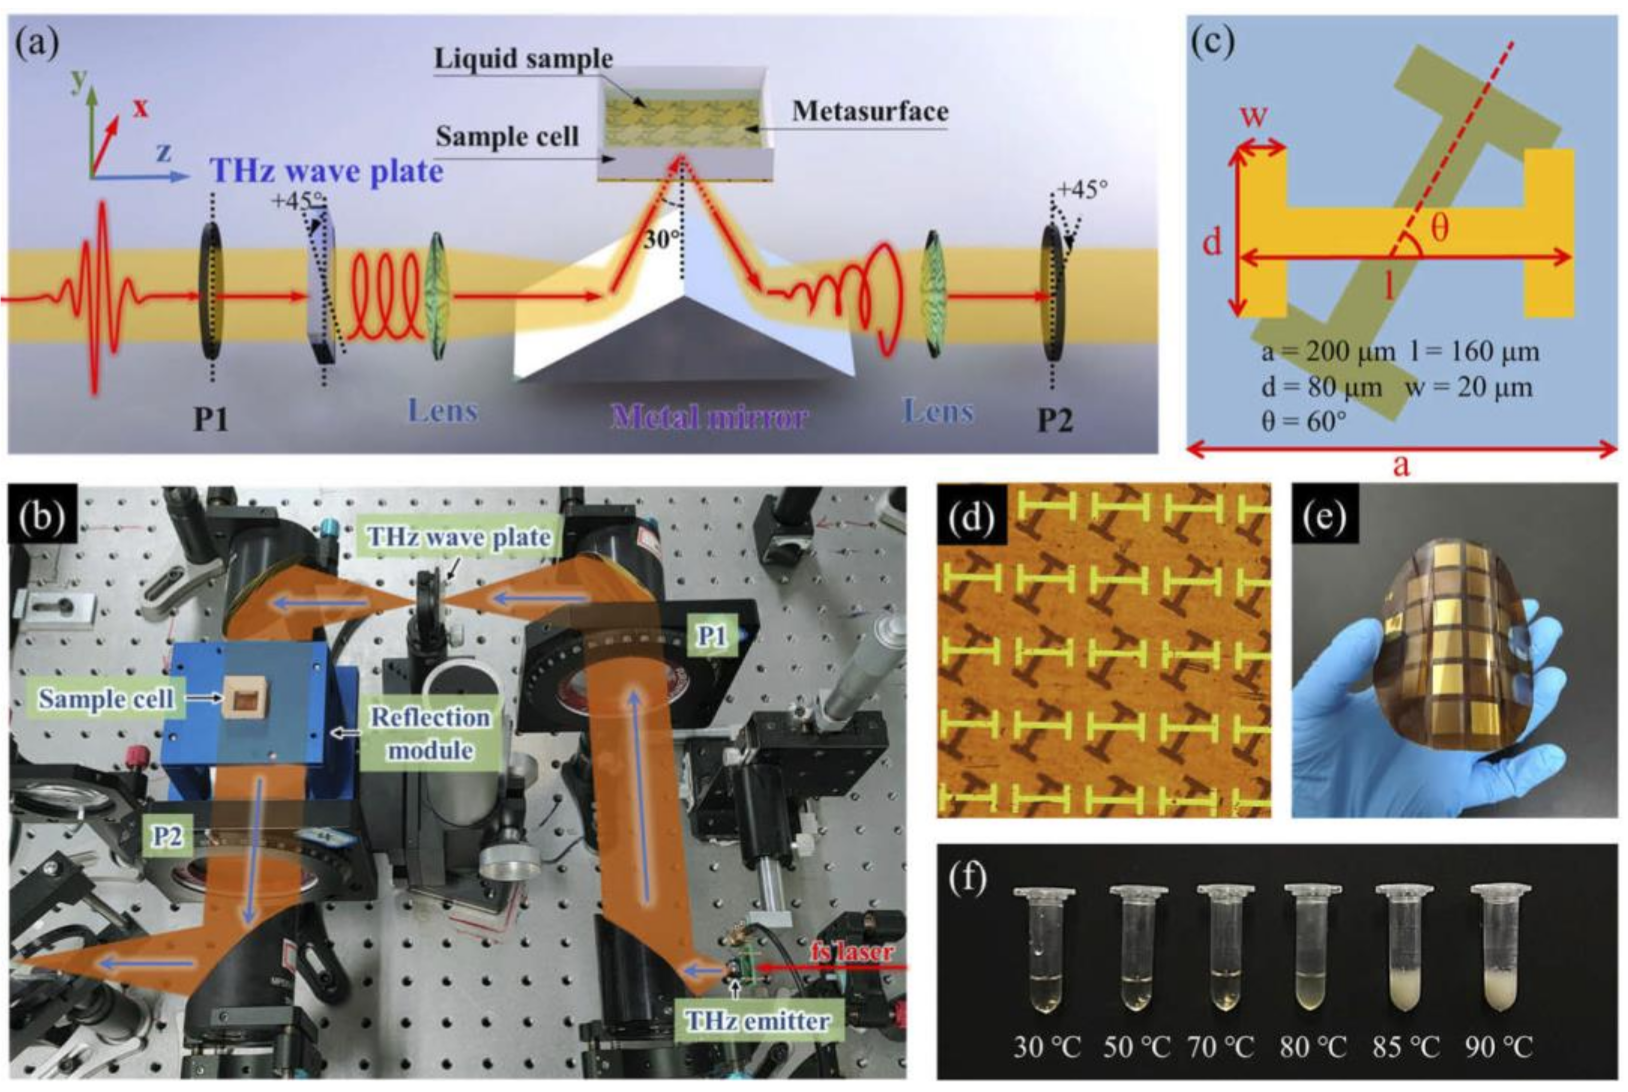
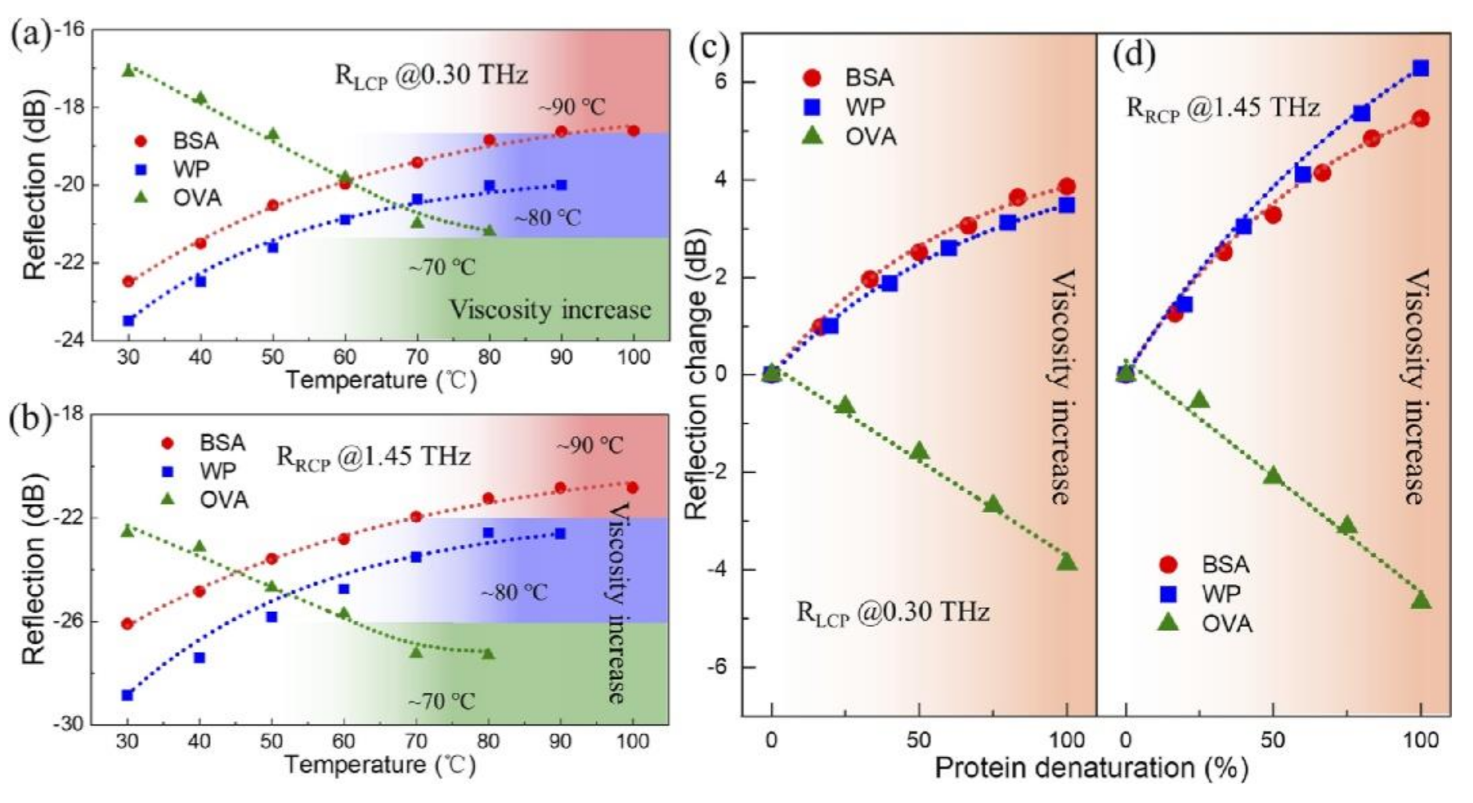
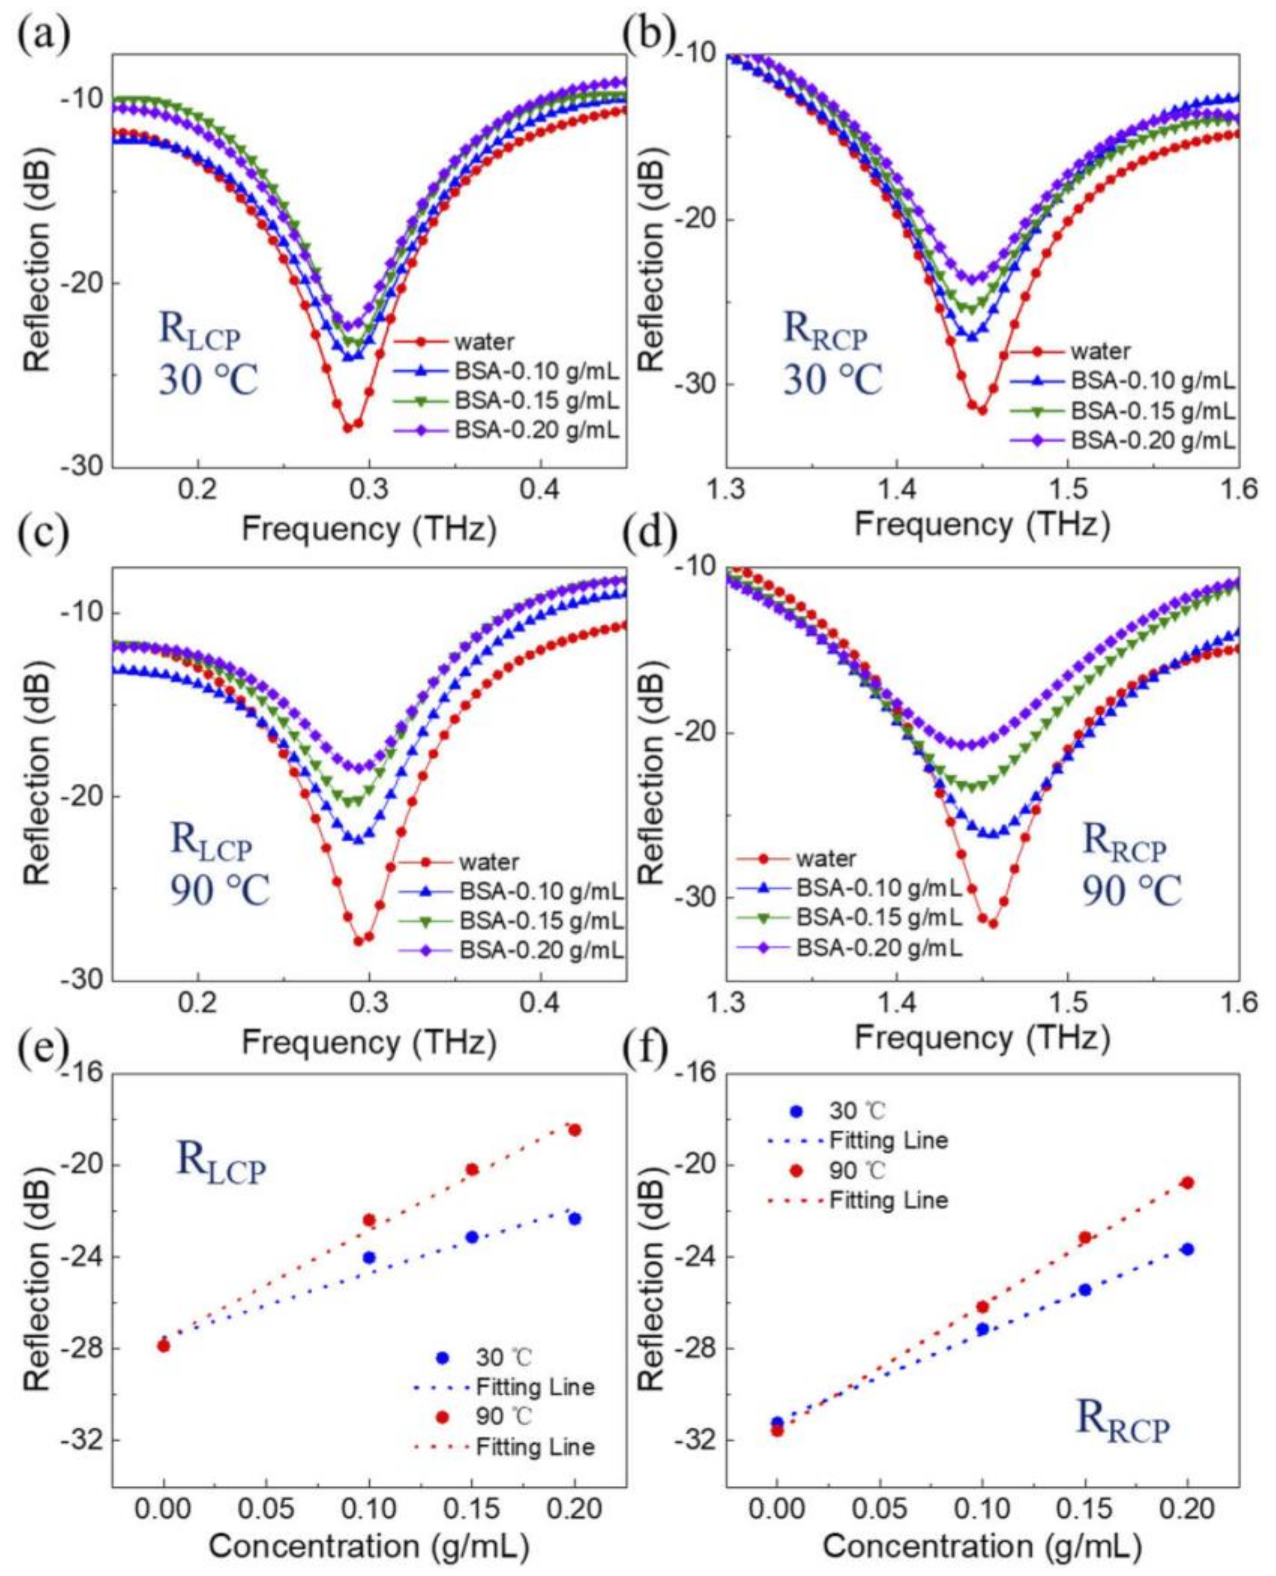
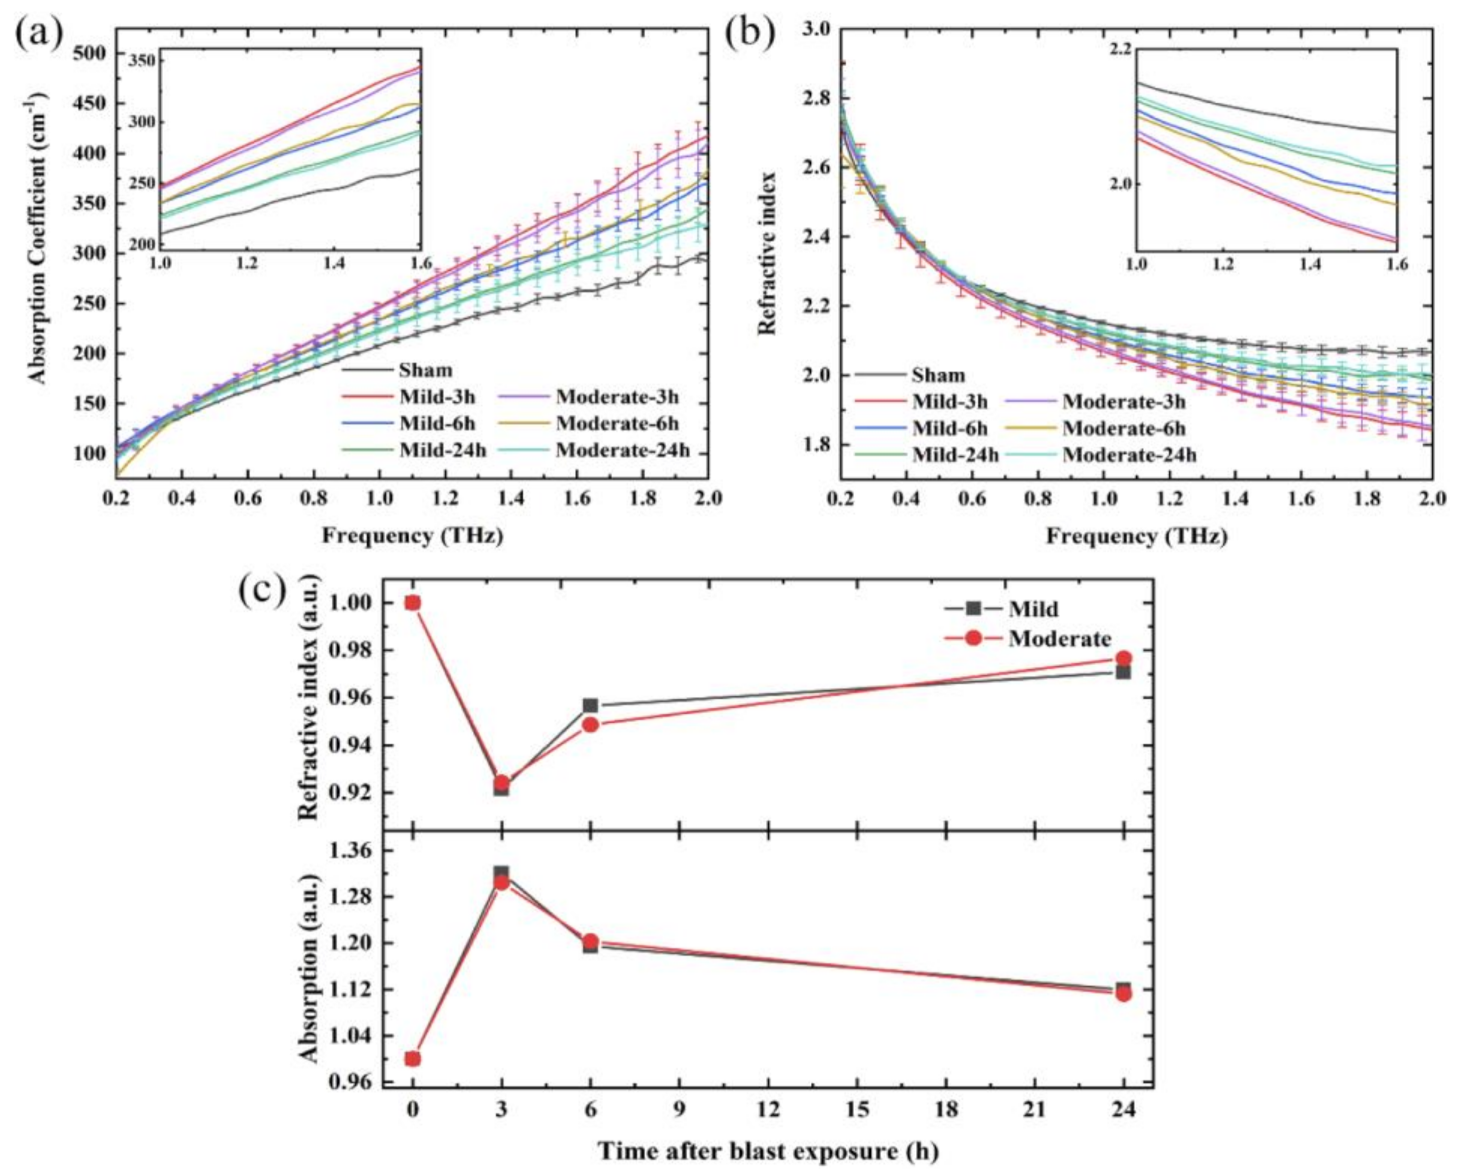
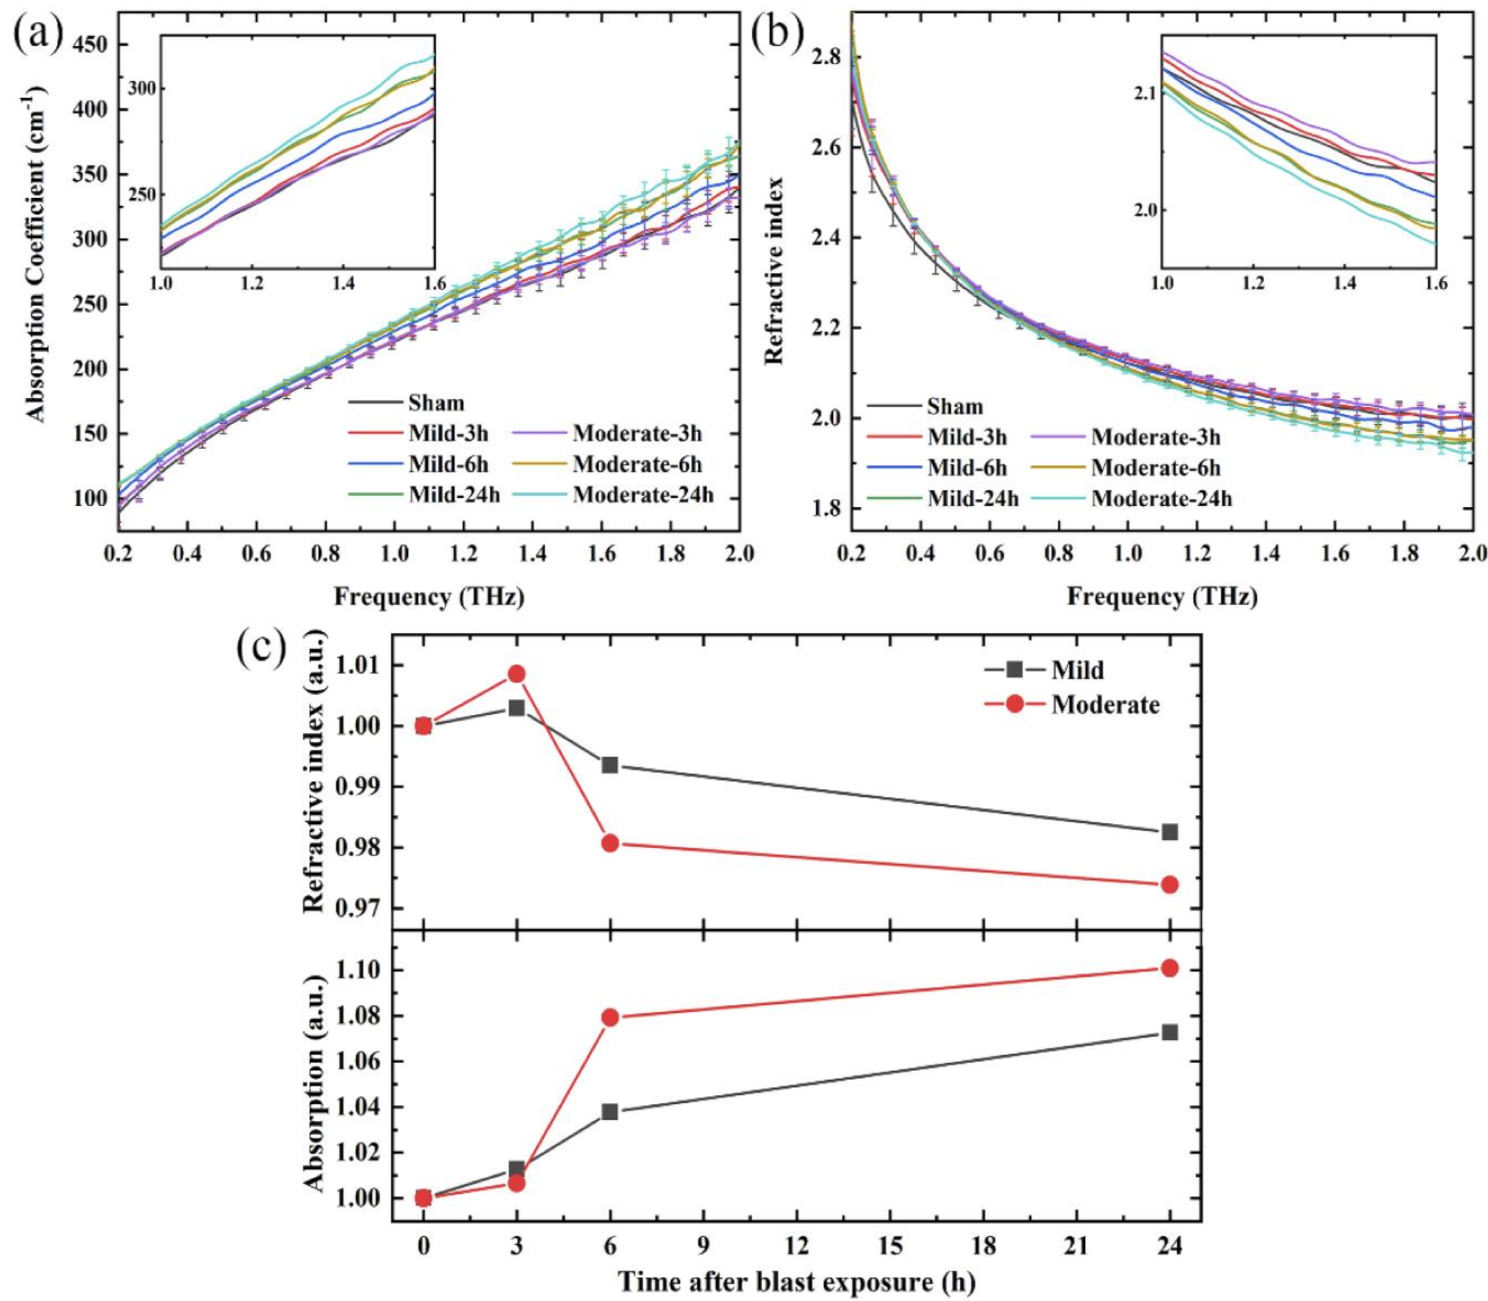
Table 1.
Main THz absorption frequencies observed in the literature [118,119,120,121,122,123,124,125,126,127,128,129,130,131,132,133,134].
| Amino Acids | THz Absorption Frequencies (THz) |
|---|---|
 Alanine (Ala) | 2.21, 2.56, 2.72, 2.91, 3.14, 3.37, 4.17 |
 Arginine (Arg) | 0.99, 1.45, 2.02, 2.62, 3.51, 3.77, 4.40 |
 Asparagine (Asn) | 1.64, 1.85, 2.06, 2.26, 2.62, 3.11, 3.57, 3.92, 4.90 |
 Aspartic acid (Asp) | 1.35, 1.71, 2.58, 3.01, 3.26, 3.98, 4.41, 5.36 |
 Cysteine (Cys) | 1.40, 1.70, 2.33, 2.78, 2.94, 3.23, 3.64, 4.44, 4.78, 5.87 |
 Glycine (Gly) | 1.83, 2.30, 2.51, 2.70, 4.07 |
 Glutamic acid (Glu) | 1.21, 2.03, 2.23, 2.48, 2.64, 2.80, 3.26, 3.58, 4.0, 4.50 |
 Glutamine (Gln) | 1.70, 2.28, 2.50, 3.37, 4.08, 4.92 |
 Histidine (His) | 0.88, 1.72, 2.08, 2.44, 2.80, 3.00, 3.39, 3.96, 4.33, 5.30 |
 Isoleucine (Iso) | 0.30, 0.85, 1.08, 1.42, 1.72, 2.41, 2.74, 3.54, 4.27, 5.26 |
 Leucine (Leu) | 0.66, 0.84, 1.46, 1.64, 2.14, 2.56, 2.74, 2.88, 2.96, 3.68, 5.11 |
 Lysine (Lys) | 0.90, 1.26, 1.79, 2.25, 2.64 |
 Methionine (Met) | 1.01, 1.79, 2.70, 2.94, 3.77 |
 Phenylalanine (Phe) | 1.25, 2.02, 2.52, 2.76, 4.16 |
 Proline (Pro) | 1.69, 2.00, 2.64, 3.12, 3.62, 4.05, 4.69 |
 Serine (Ser) | 1.97, 2.41, 2.71, 3.12, 3.98, 4.34 |
 Threonine (Thr) | 1.11, 1.42, 2.12, 2.61, 3.06, 3.33, 3.75, 4.44, 4.98, 5.30 |
 Tryptophan (Trp) | 0.91, 1.19, 1.44, 1.85, 2.26, 2.57, 3.22, 3.69, 4.02, 4.85 |
 Tyrosine (Tyr) | 0.95, 1.92, 2.06, 2.65, 2.82, 3.31, 3.48, 3.96, 4.32, 4.75, 5.13, 6.22 |
 Valine (Val) | 1.11, 1.68, 2.12, 2.22, 2.52, 2.64, 2.84, 3.53, 4.39 |
Publisher’s Note: MDPI stays neutral with regard to jurisdictional claims in published maps and institutional affiliations. |
© 2022 by the authors. Licensee MDPI, Basel, Switzerland. This article is an open access article distributed under the terms and conditions of the Creative Commons Attribution (CC BY) license (https://creativecommons.org/licenses/by/4.0/).
Share and Cite
MDPI and ACS Style
Mancini, T.; Mosetti, R.; Marcelli, A.; Petrarca, M.; Lupi, S.; D’Arco, A. Terahertz Spectroscopic Analysis in Protein Dynamics: Current Status. Radiation 2022, 2, 100-123. https://doi.org/10.3390/radiation2010008
AMA Style
Mancini T, Mosetti R, Marcelli A, Petrarca M, Lupi S, D’Arco A. Terahertz Spectroscopic Analysis in Protein Dynamics: Current Status. Radiation. 2022; 2(1):100-123. https://doi.org/10.3390/radiation2010008
Chicago/Turabian StyleMancini, Tiziana, Rosanna Mosetti, Augusto Marcelli, Massimo Petrarca, Stefano Lupi, and Annalisa D’Arco. 2022. "Terahertz Spectroscopic Analysis in Protein Dynamics: Current Status" Radiation 2, no. 1: 100-123. https://doi.org/10.3390/radiation2010008