Proceeding Paper

Preparation and Integration of a Multi-Wavelength LED Matrix for Testing Light Cell Interaction in a Novel Lens Less Optical Microscope †

1
AIT Austrian Institute of Technology GmbH, Giefinggasse 4, 1210 Vienna, Austria
2
Department of Pathology, Medical University of Vienna, Währinger Gürtel 18-20, 1090 Vienna, Austria
3
Institute of Semiconductor Technology (IHT) and Laboratory for Emerging Nanometrology (LENA), Technische Universität Braunschweig, 38106 Braunschweig, Germany
*
Author to whom correspondence should be addressed.
Presented at the Eurosensors 2018 Conference, Graz, Austria, 9–12 September 2018.
Proceedings 2018, 2(13), 1074; https://doi.org/10.3390/proceedings2131074
Published: 21 November 2018
(This article belongs to the Proceedings of EUROSENSORS 2018)

Abstract

:
In this work we studied the influence of light emitting diode (LED) generated light on living cells which were cultivated in common cell culture microtiter plates. In detail we investigated signaling side effects including apoptosis by the use of a cell permeable peroxide activatable fluorescent dye (5,6-Chloromethyl-2′,7′-dichlorodihydrofluorescein diacetate). A high level production of peroxides in UV and blue light exposed cells was measured while the light of longer wavelengths caused only minor effects on the cells.

1. Introduction

The physical laws of diffraction generally limit the spatial resolution of optical systems, being about 200 nm for light in the visible range. This is the reason why we usually cannot directly observe e.g., single proteins, DNA molecules or the development of internal cellular macromolecular complexes and structures with conventional optical microscopes. We aim to overcome this limitation by developing the scientific and technological basis for a completely new approach to optical superresolution. In detail use spatially resolved illumination instead of spatially resolved detection. To enable this approach we develop nano LED arrays with LED dimensions much smaller than the wavelength of visible light. We will use this novel approach for in-vitro imaging of inter- and intracellular processes. In order to derive appropriate designing parameters we performed a study to investigate the light cell interaction in a conventionally cell culture laboratory on the base of a custom made LED plate which was designed to act as base plate for a conventionally microtiter plate.

2. Materials and Methods

To test the potential light induced damage of cultured cells we developed a surface-mounted LED array containing 48 LEDs with selected 8 replicates of 6 different wavelengths (357, 465, 525, 588, 625 and 940 nm). A multistep encapsulation process was applied to prepare the electronic circuits for operation in state-of-the-art cell incubators. We employed sterile, cell culture treated, 96-well black microtiter plates (Corning Inc. Tewksbury, MA, USA #3720) containing a UV translucent clear bottom to culture and expose a standard cell line of human lung fibroblasts to different wavelengths for various time ranges. Figure 1 shows the LED matrix board equipped with one microtiter plate which acts as a guiding assembly for a second microtiter plate carrying the cell cultures.
In order to enable quantitative photo-toxicity evaluations by the LED matrix we characterized the optical power levels of all individual LEDs. The power levels on top of the assembled microtiter plate have been measured, which correspond to the expected power levels at the bottom of a second microtiter plate that’s put on top of the assembled one, i.e., the location of adhered cells that are cultivated within the second microtiter plate. In order to check for the decay of the optical power along the height of the second microtiter plate, the optical power has also been measured on top of the second microtiter plate. Optical power measurements have been conducted by a Nova II Laser Power Meter by Ophir Optronics (Darmstadt, Germany) using a PD300-UV Photodiode Sensor. Figure 2 shows the averaged optical power flux of each LED wavelength, as a function of the LED power which can be adjusted by the LED matrix board, which is expected on the bottom of the second microtiter plate which will carry the cell culture. Please note, for the sake of convenience a common power flux of 1.8 W/m2 for all wavelengths was chosen.

3. Results

Generally, the production of cellular peroxides is known to lead to unwanted cell signaling side effects including apoptosis (programmed cell death). We used the cell permeable, peroxide activable, fluorescent dye (5,6-Chloromethyl-2′,7′-dichlorodihydrofluorescein diacetate, CM-DCFH-DA [1] (see Figure 3)) to quantify the light induced peroxide formation. First experiments with MaDo LL47 standard human lung fibroblast showed that DM-DCFH-DA load was sufficient for in-vitro measurement of peroxide production after light exposure (see Figure 4). The cells were consecutively exposed for 10 min intervals with different wavelengths at 1.8 W/m2 and the fluorescent signal of the cells was measured on a fluorospectrometer (Figure 5). The environmental conditions during the light treatment were held on standard cell culture parameters. Biological replicates were performed in triplicates and fluorescent measurements were taken until a total exposure time of 50 min was reached (endpoint, Figure 6).

4. Discussion

As expected, this experiment strikingly demonstrated a time dependent high level production of peroxides in UV and blue light exposed cells while the other wavelengths had only minor effects on the cells (Figure 5 and Figure 6). Due to the fact that 465 nm (blue) induce peroxide production was one order of magnitude higher in compare to 525 nm (green) we propose to employ LEDs generating green light and to apply pulsed operation mode for the light generator to minimize the imaging impact on the cells.

5. Conclusions

Finally we propose to employ (i) LEDs generating green light, or light with longer wave length, and to apply a (ii) pulsed operation mode for the light generator to minimize the imaging impact on the cells.

Author Contributions

R.H., H.S.W., S.G. and S.K. conceived and designed the experiments; S.K. and J.S. performed the experiments and analyzed the data; W.W., G.S. and R.H. contributed to the experimental tools; R.H. and S.K. wrote the paper.

Acknowledgments

This work is funded by the European Union under the H2020 Grant Agreement 737089.

Conflicts of Interest

The authors declare no conflict of interest. The founding sponsors had no role in the design of the study; in the collection, analyses, or interpretation of data; in the writing of the manuscript, and in the decision to publish the results.

References

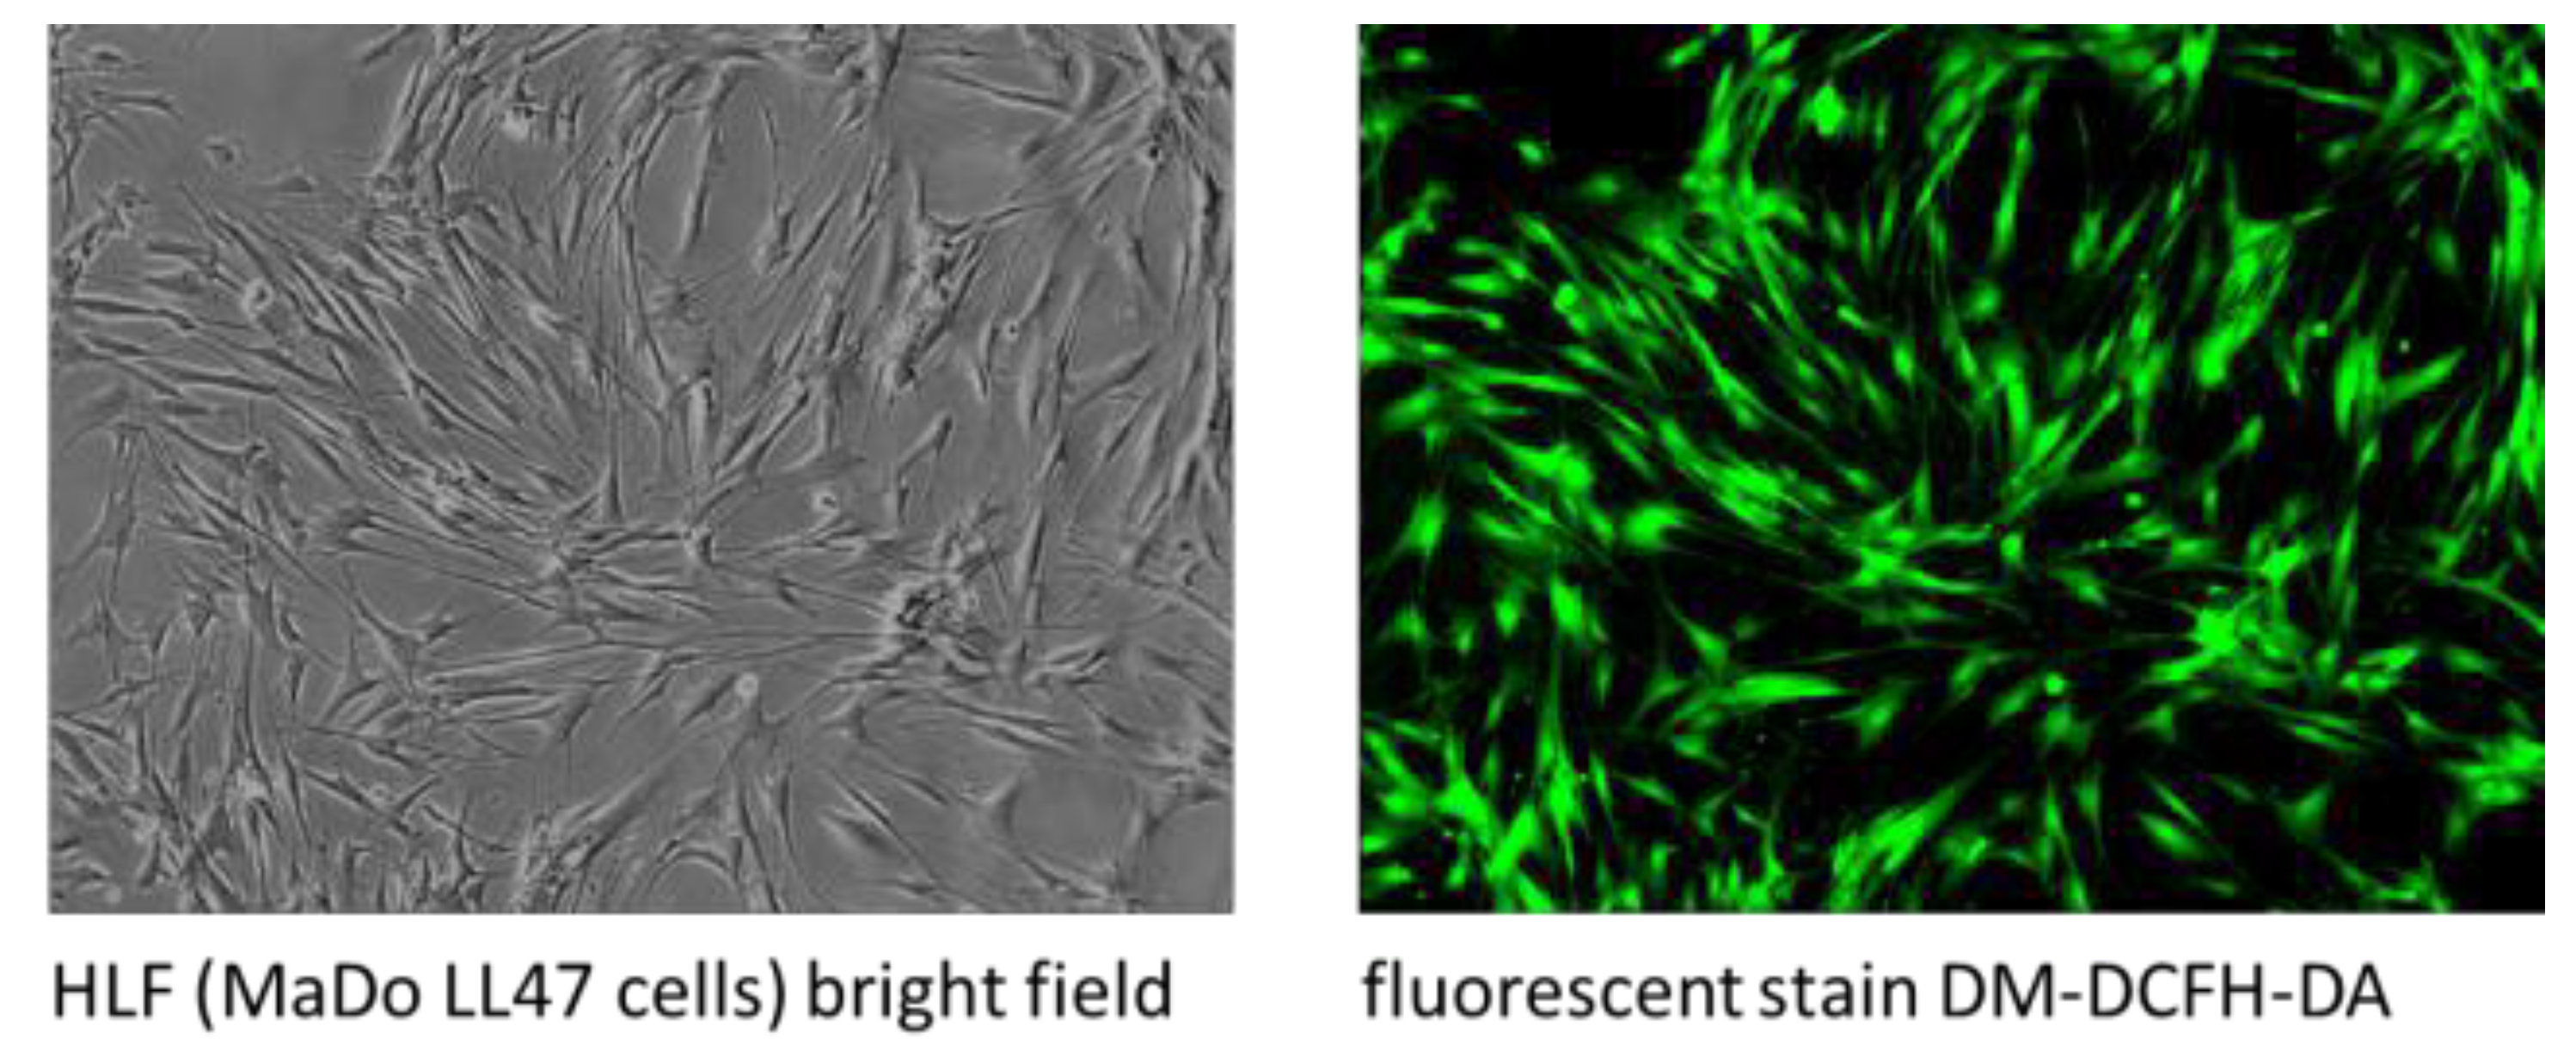
  1. Hempel, S.; Buettner, G.; O’Malley, Y.; Wessels, D.; Flaherty, D. Dihydrofluorescein diacetate is superior for detecting intracellular oxidants: comparison with 2′,7′-dichlorodihydrofluorescein diacetate, 5(and 6)-carboxy-2′,7′-dichlorodihydrofluorescein diacetate, and dihydrorhodamine 123. Free Radic. Biol. Med. 1999, 27, 146–159. [Google Scholar] [CrossRef]
Figure 1. (a) PCB board with a fixed microtiter plate, all LEDs are placed well under the corresponding holes. (b) Spectra of LEDs in the 8th line, where the infrared spectrum is out of the measurement range.
Proceedings 02 01074 g001
Figure 2. Transmission-corrected average area power of selected LEDs per color in dependence of the potentiometer level for the one plate configuration. Also plotted is the common target power flux of 1.8 W/m2 (dashed line).
Proceedings 02 01074 g002
Figure 3. Functionality of CM-DCFH-DA.
Proceedings 02 01074 g003
Figure 4. DM-DCFH-DA stained MaDo LL47 cells, mag. 10×.
Proceedings 02 01074 g004
Figure 5. High throughput detection of intracellular peroxide in living cells.
Proceedings 02 01074 g005
Figure 6. Endpoint measurement after 50 min exposure.
Proceedings 02 01074 g006
Publisher’s Note: MDPI stays neutral with regard to jurisdictional claims in published maps and institutional affiliations.

