Modelling Dimethoate Removal by Fenton-Like Process Using Response Surface Methodology †


Department of Environmental Engineering, Faculty of Engineering, Uludağ University, Bursa16059, Turkey
*
Author to whom correspondence should be addressed.
†
Presented at the 3rd EWaS International Conference on “Insights on the Water-Energy-Food Nexus”, Lefkada Island, Greece, 27–30 June 2018.
Proceedings 2018, 2(11), 649; https://doi.org/10.3390/proceedings2110649
Published: 1 August 2018
(This article belongs to the Proceedings of EWaS3 2018)
Abstract
:The (RSM) is a useful method for optimizing analytical methods and it has been applied to evaluate independent variables in FPs. In this study, the removal of dimethoate (DMT) which is a commonly used pesticide and has a toxic effect on the environment, was evaluated in terms of oxidation and mineralization efficiency using response surface methodology (RSM) in the Fenton-like process (FLP). The obtained optimum conditions for DMT oxidation and mineralization using the FLP included DMT/Fe+3/H2O2 ratio of 0.018 mM/0.03 mM/0.15 mM and reaction time of 65 min. DMT oxidation efficiency was 78% and mineralization efficiency was 18%. The initial DMT concentration was the most significant variable affecting both the oxidation and mineralization efficiency of DMT.
1. Introduction
Dimethoate (DMT) is an commonly used, high-effective pesticide in agricultural areas; however, its residues have a negative effect on the environmentandon the health of people because of its toxicity and stability. The degradation of DMT through advanced oxidation processes (AOPs), such as photocatalysis [1,2], electrolysis [3], ozonation [4,5], photolysis (UV) and UV/O3[6], has been described in the literature. In these AOPs, nonbiodegradable and inert organic compounds are oxidized by free radicals and mineralized to water and carbon dioxide. The Fenton process (FP) and Fenton-like process (FLP) are capable of producing hydroxyl radicals and are efficient, fast-acting, low-cost and easy-to-operate technologies for pesticide removal [7]. The FP and FLP are involved not only in oxidation but also in coagulation through the formation of ferrous and ferric-hydroxo complexes that act as coagulants to remove some portions of organic contaminants [8,9].
The response surface methodology (RSM) is a tool for optimizing analytical methods [10] and has been applied to optimize and evaluate the interactive effects of independent factors in the FPs, such as Fenton [11], photo-Fenton [12] photo-Fenton-like [13] and solar photoelectro-Fenton [14]. RSM designs include three-level factorial designs, central composite designs (CCDs) [15], Box-Behnken [11] and D-optimal designs [16]. CCD, which is the most widely used form of RSM, was employed to evaluate the effects of important process variables, including catalyst concentration, oxidant concentration, pH, reaction time, and organic carbon content of wastewaters, on color, organic substrate, COD and TOC removal efficiencies in the FPs [14].
In this study, the removal of DMT (C5H12NO3PS2, molecular weight of 229.3 g/mole, 0.0-dimethyl S-[2-(methylamino)-2-oxoethyl] dithiophosphate) was evaluated in terms of oxidation and mineralization efficiency using RSM in the Fenton-like process (FLP). The effectiveness of the process was investigated at different concentrations of DMT, Fe3+, H2O2 with respect to the removal efficiencies for COD and TOC.Hence, the objective of this study was to optimize DMT oxidation and mineralization by FLP using the RSM.
2. Material and Methods
2.1. Chemicals and Reagents
DMT (CAS number: [60-51-5]) was obtained from Dr. Ehrenstorfer GmbH (Augsburg, Germany. FeCl3.6H2O, H2O2 solution (30%), NaOH, H2SO4, NaHSO3 solution (40%) and acetonitrile (ACN) were obtained from Merck Chemical Company in Darmstadt.
2.2. Experimental Procedure
Fenton-like experiments were conducted in batch mode, with 100 mL of DMT solution in a multiple-magnetic stirrer at 350 rpm at a temperature of 22 ± 2 °C. All experiments were performed using different experimental conditions at pH 3, which is reported to be optimum for Fenton-like oxidations [12,17].
2.3. Analytical Methods
DMT was analyzed using a High Performance Liquid Chromatography (HPLC) system (Agilent 1200). The mobile phase was composed of H2O/acetonitrile in a ratio of 60/40, and the flow rate was 1 mL/min [18]. The detection was operated at 210 nm. A Analytik Jena: multi N/C ® 3100 TOC analyzer (Jena, Germany) TOC analyzer was used to determine the total organic carbon (TOC) content according to Standard Methods (5310.B) [19].
2.4. Experimental Design, Data Analysis and Process Optimization
The CCD considered the effects of four independent variables: initial DMT concentration, initial Fe3+ concentration, initial H2O2 concentration and reaction time. Five levels for each ith independent variable were chosen with coded values xi. The initial reaction solution pH 3 was constant and thus not considered as a variable. The DMT oxidation efficiency (y1) and DMT mineralization, referred to as the remaining TOC concentration in the reaction solution (y2), were chosen as the predicted responses, which were correlated with the coded values of the variables using the following general second-order polynomial equation [14]
where y is the predicted response; β0 is a constant; βi is the first-order model coefficient; βii is the squared coefficient for factor i; βij is the linear model coefficient for the interaction between factors i and j; k is the number of independent variables (4 in this study); ε is the random error; and xiis the coded value of the main effect. The Design Expert Software (version 7.0) was used for the statistical design of the experiments and for data analysis. Analysis of variance (ANOVA) was used for graphical analyses of the data to obtain the interactions between the process variables and the responses. The quality of the fit polynomial model was expressed by the coefficient of determination R2and Adj R2, and its statistical significance was checked with Fisher’s F-test in the same program. Five replicates of the central point were made to estimate the pure error of the experiments (runs 26–30). Model terms were selected or rejected based on the p-value (probability) at a 95% confidence level. Three-dimensional (3D) plots were obtained based on the effects of the four factors at five levels. The adequacy of the regression equations was checked by comparing the experimental data with the predicted values obtained from the equations [20].
3. Results and Discussion
3.1. Fitting the RSM to Significant Independent Variables
Experimental results were shown as DMT oxidation efficiency (y1) and DMT mineralization, referred to as the remaining TOC concentration in the reaction solution (y2). The data for runs 1–30 were modeled using the quadratic Equation (1) and the least-square method, yielding Equation (2) for y1 and Equation (3) for y2:
y1= 54.97 − 9.37x1 + 2.72x2− 0.27x3 + 2.25x4 + 2.73x12− 1.68x22− 0.87x32− 0.47x42+ 2.30x1x2− 1.63x1x3− 0.70x1x4− 1.96x2x3 + 0.11x2x4 + 0.42x3x4
y2= 1.70 + 0.325x1 + 0.092x2 + 0.025x3 + 0.183x4− 0.26x12− 0.20x22 − 0.15x32 − 0.088x42 + 0.013x1x2− 0.062x1x3 + 0.088x1x4− 0.075x2x3− 0.075x2x4 + 0.075x3x4
Two models, y1 and y2, had F values of 4.29 and 6.52 and very low probability values (p-value 0.0041 for y1 and 0.0004 for y2), implying that the terms were statistically significant at a 95% confidence level. There was only a 0.41% chance for y1 and a 0.04% chance for y2 that an F-value would occur due to noise. The ANOVA results for parameters y1 and y2 show that significant RSMs with high R2 values of 0.80 and 0.86 were obtained. These high R2 coefficients ensured a satisfactory adjustment of the quadratic models to the experimental data [11]. Models y1 and y2 showed a statistically significant lack of fit and very low probability values (p-value < 0.0001), implying that the variation of data around the fitted model was significant relative to the pure error. The pure error values of 0.3 and 0.0 were also low, indicating good reproducibility of the data obtained from the ANOVA results of models y1 and y2 [15].
3.2. DMT Oxidation
For an initial Fe3+ concentration of 0.03 mM and an initial H2O2 concentration of 0.15 mM, the DMT oxidation efficiency decreased from 76% to 47% as the initial DMT concentrations increased from 0.005 to 0.094 mM and the initial reaction times increased from 5 to 65 min, as shown in the coded values-3D surface graph in Figure 1.
The DMT oxidation efficiency decreased from 90% to 47% as the initial DMT concentration increased for an initial Fe3+ concentration of 0.03 mM, an initial H2O2 concentration of 0.15 mM and an initial reaction time of 65 min. This effect was caused by the generation of HO2• by constant Fe3+ and H2O2 concentrations, which remained constant as the concentration of DMT increased [21]. DMT oxidation efficiencies of 76% and 44% were observed after 5 min of reaction time for initial DMT concentrations of 0.005 mM and 0.094 mM, respectively, (in Figure 1). Increasing initial DMT concentrations caused a decrease in oxidation efficiency due to the constant HO2• concentration formation at constant concentrations of Fe3+ and H2O2 in the Fenton-like reaction. For initial DMT concentrations above 0.049 mM under the same reaction conditions, no further DMT decomposition was achieved by increasing the reaction time.Studies on the removal of different pollutants indicate that the initial pollutant concentration in the oxidation by Fenton, photo- Fenton and Fenton-like processes, reduces the oxidation efficiency [21,22,23]. DMT oxidation proceeded slowly as the reaction time increased, reaching 90% and 47% after 65 min of reaction time for initial DMT concentrations of 0.005 mM and 0.094mM, respectively. The Fe3+ and H2O2 concentrations were assumed to be consumed in the generation of a large amount of HO2• after 5 min of reaction time, and decreasing Fe3+ and H2O2 concentrations caused a drop in the availability of HO2• in the reaction solution. Thus, DMT oxidation proceeded at a very low steady-state concentration of HO2•, and the DMT oxidation efficiency decreased.
For an initial DMT concentration of 0.049 mM and an initial reaction time of 65 min, the DMT oxidation efficiency increased from 43% to 55% as the initial Fe3+ concentrations increased from 0.01 to 0.03 mM.As both Fe3+ concentrations increased from 0.01 to 0.03 mM and the initial H2O2 concentrations increased from 0.05 to 0.25 mM, DMT oxidation efficiency was decreased by a coefficient of −1.96 as shown in y1 model equation (Figure 2).
The DMT oxidation efficiency showed a slight decrease as the initial H2O2 concentration increased to 0.15 mM and the initial Fe3+ concentrations increased from 0.01 to 0.03. When the H2O2 concentration was constant at 0.15mM and initial Fe3+ concentration increased from 0.01 mM to 0.03 mM the oxidation efficiency increased from 43% to 55%.However, further increase of the initial concentration of Fe3+ did not increase DMT oxidation efficiency. As seen in the y1 model equation (2), the Fe3+ independent process variable affects the DMT oxidation efficiency more than the H2O2 independent process variable.
For a 65-min Fenton-like reaction, the initial DMT concentration was 0.049 mM and the initial H2O2 concentration was 0.15 mM, whereas the DMT oxidation efficiencies increased with increasing initial Fe3+ concentrations to 0.03 mM due to the catalytic effect on H2O2 (Figure 2) [24].However, at initial Fe3+ concentrations above 0.03 mM, the excess of Fe3+/Fe2+ ions in the reaction solution caused scavenging effects onHO2•/HO• [21]. In the same reaction conditions, when the initial Fe3+ concentration was 0.03 mM, the DMT oxidation efficiency decreased due to the HO•. Scavengingeffects of excess H2O2 concentration at initial H2O2 concentrations above 0.15 mM.Iron concentrations above the optimal value result in reduced process performance because more species of iron ions are produced rather than the more useful ∙OH radicals. This finding is in agreement with the previous observation of Tony and Bedri [25].
Increasing H2O2concentration results in the generation of additional reaction intermediates (OH∙) radicals which enhances the degradation process. However, at higher peroxide concentrations, the excess hydrogen peroxide can act as an OH∙ scavenger [25]. Scavenging is recombination of hydroxyl radicals and also hydroxyl radicals reaction with H2O2, contributing to the OH• scavenging capacity (Equations (4)–(6)) [26].
H2O2 +OH•→ H2O + HO2•
HO2• + OH•→ H2O + O2
OH• + OH•→ H2O2
At higher peroxide concentrations, H2O2 forms HO2∙, which is also a free radical produced in situ from theH2O2 but is a less reactive oxidizing agent and therefore has a longer life time than the OH∙ and the overall reaction rate reduces [25].
Consequently, the optimum conditions for DMT oxidation using the FLP, according to model y1, included an DMT:Fe3+:H2O2 ratio of 0.018:0.03:0.15 molar ratio and a reaction time of 65 min. These conditions yielded the highest DMT oxidation (78%) under the designed experimental conditions of the CCD. The observed stoichiometric ratio of Fe3+:H2O2 was 1:5. The experimental results agree with values reported in the literature [17,25,26,27].
3.3. DMT Mineralization
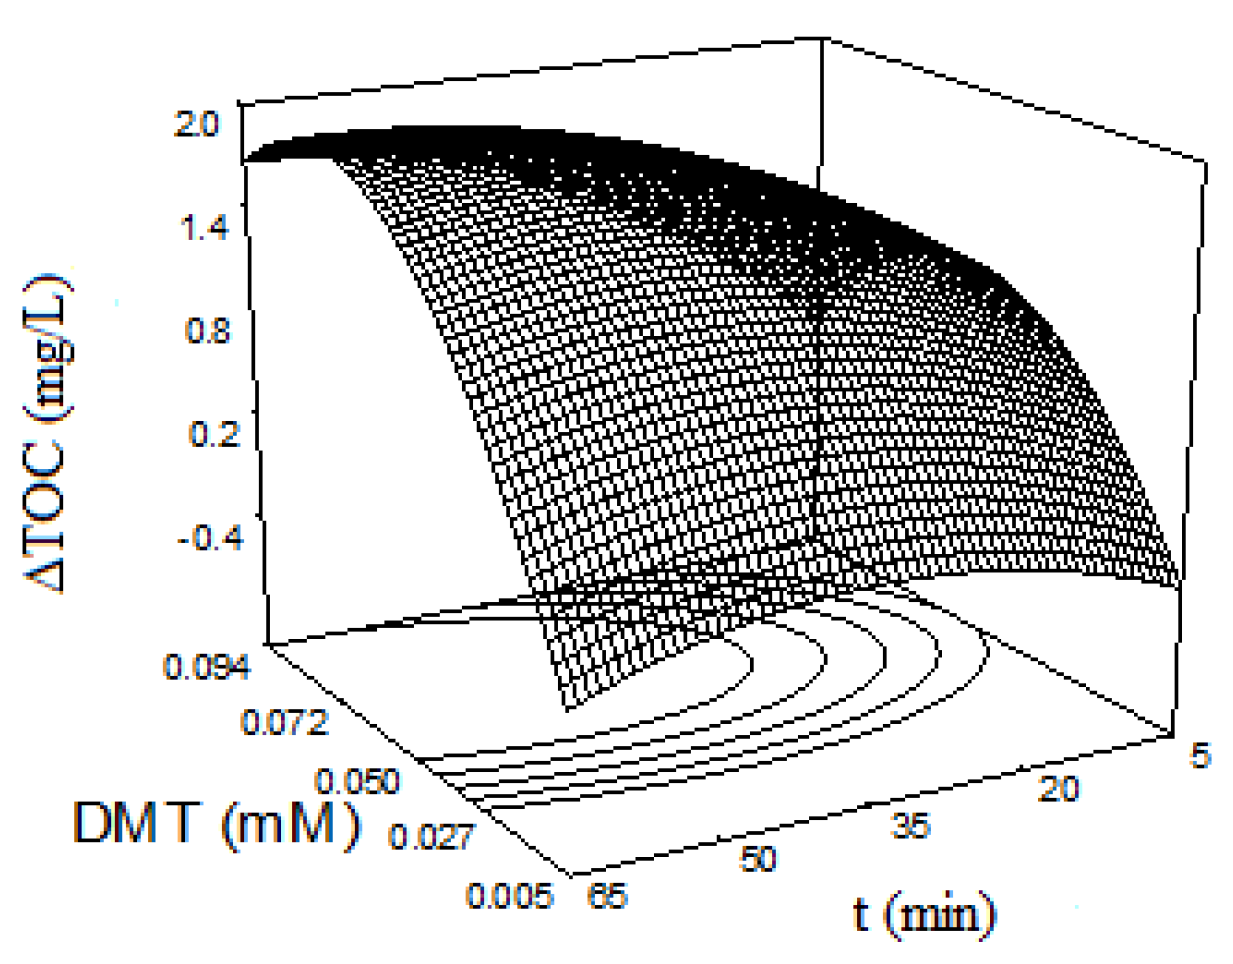
When the initial Fe3+ concentration is 0.03 mM and the initial H2O2 concentration is 0.15 mM, the TOC (ΔTOC) removal obtained in the reaction periods are shown in Figure 3.
The addition of pesticide to the reaction solution increased the TOC concentration as a result of the increasing amount of initial organic carbon content [13].For initial DMT concentrations up to 0.070 mM in the Fenton-like reaction, the amount of ΔTOC increased and for initial DMT concentrations higher than 0.070 mM, ΔTOC decreased. The duration of the Fenton-like reaction has a significant positive linear (x4) effect on the corrected TOC concentration (y2). As the reaction time increases, the amount of ΔTOC increases with the coefficient +0.183.
A slight mineralization was observed in the Fenton-like reaction performed for up to 65 min at initial concentrations of 0.03 mMofFe3+ and 0.15 mM of H2O2 for initial DMT concentrations ranging from 0.005 mM to 0.094 mM (Figure 3).The maximum amount of ΔTOC obtained in these process conditions is for0.070 mM initial DMT concentration and 2.0 mg/L for a 55 min reaction time wherethe TOC mineralization efficiency is 23%.
The effect of the initial Fe3+and initial H2O2 concentrations on ΔTOC concentration (DMT mineralization) for a reaction time of 65 min with an initial DMT concentration of 0.049 mM is shown in Figure 4.
An insignificant impact on mineralization was observed at initial Fe3+ concentrations greater than 0.03 mM and initial H2O2 concentrations greater than 0.15 mM. The reduce in the DMT mineralization wasdue to the scavenging effects of the excess concentrations of Fe3+/Fe2+ and H2O2 onHO2•/HO• [12,21]. It was known that the Fe2+ had a catalytic decomposition effect on H2O2. When Fe2+ concentration increased, the catalytic effect also accordingly increased.When the concentration of Fe2+ was higher,a great amount of Fe3+ from the process of H2O2 decomposition by Fe2+ was easy to exit in the form of Fe(OH)2+ in acidic environment [23]. Therefore, the decrease in the mineralization rate of DMT would occur.
Optimum process conditions with optimal DMT oxidationand mineralization for a reaction time of 65 min were obtained for concentrations of 0.018 mM DMT, 0.03 mM Fe3+ and 0.15 mM H2O2. The DMT oxidation efficiencyof these conditions, with an optimum Fe3+/H2O2 molar ratio of 1/5, is 78%, the ΔTOC is 0.6 mg/L and the mineralization efficiency is 18%. These results and optimum Fe3+/H2O2 molar ratios are agree withthe literature [17,27,28,29].
4. Conclusions
According to the model, the obtained optimum conditions for DMT oxidation and mineralization using the FLP included an DMT:Fe3+:H2O2 ratio of 0.018:0.03:0.15 molar ratio and reaction time of 65 min. These conditions yielded the highest DMT oxidation (78%) and mineralization (18%) under the designed experimental conditions. In this study, the optimum results showed that Fenton-like treatment of DMT was occurred by oxidation. The initial DMT concentration was the most significant variable affecting both the oxidation and mineralization efficiency of DMT by the FLP. The experimental results agree with the model predictions. Based on this study results, the use of the statistical optimization approach RSM helped to identify the most significant operating factors and the optimum levels with minimum effort and time.
Acknowledgments
This work was supported by the TUBITAK (The Scientific and Technical Research Council of Turkey) Environmental, Atmospherical, Earth and Marine Sciences Research Grant Group (Project Number: 109Y397) and the Research Fund of The University of Uludag Project Number: M-2008/50.
References
- Domínguez, C.; García, J.; Pedraz, M.A.; Torres, A.; Galán, M.A. Photocatalytic oxidation of organic pollutants in water. Catal. Today 1998, 40, 85–101. [Google Scholar] [CrossRef]
- Evgenidou, E.; Fytianos, K.; Poulios, I. Photocatalytic oxidation of dimethoate in aqueous solutions. J. Photochem. Photobiol. A Chem. 2005, 175, 29–38. [Google Scholar] [CrossRef]
- Aimer, Y.; Benali, O.; Salghi, R.; Latapie, L.; GroenenSerrano, K. Removal of Pesticides by Electrochemical Oxidation using a Boron Doped Diamond Anode. J. Mater. Environ. Sci. JMES 2017, 8, 777–783. [Google Scholar]
- Meijers, R.T.; Oderwald-Muller, E.; Nuhn, P.A.N.M.; Kruithof, J.C. Degradation of Pesticides by Ozonation and Advanced Oxidation. Ozone Sci. Eng. 1995, 17, 673–686. [Google Scholar] [CrossRef]
- Ormad, M.P.; Miguel, N.; Lanao, M.; Mosteo, R.; Ovelleiro, J.L. Effect of application of ozon combined with hydrogen peroxide and titanium dioxide in the removal of pesticides from water. Ozone Sci. Eng. 2010, 32, 25–32. [Google Scholar] [CrossRef]
- Quiroz, M.A.; Martínez-Huitle, C.A.; Bandala, E.R. Advanced oxidation processes (AOPs) for removal of pesticides from aqueous media. In Pesticides—Formulations, Effects; Stoytcheva, M., Ed.; InTech Open Access Publisher: Rjeka, Cratia, 2011; pp. 685–730. [Google Scholar]
- Park, J.H.; Cho, I.H.; Chang, S.W. Comparison of fenton and photo-fenton processes for livestock wastewater treatment. J. Environ. Sci. Health Part B 2006, 41, 109–120. [Google Scholar] [CrossRef]
- Kuo, W.G. Decolorizing dye wastewater with Fenton’s reagent. Water Res. 1992, 26, 881–886. [Google Scholar] [CrossRef]
- Yi, X.; Sun, L.; Yu, J.; Wang, S.; Yu, S. Oxidation of acetyl-pyrimidine wastewater by Fenton process. Water Sci. Technol. 2010, 62, 2630–2636. [Google Scholar] [CrossRef]
- Mason, R.L.; Gunst, R.F.; Hess, J.L. Statistical Design and Analysis of Experiments, Eighth Applications to Engineering and Science, 2nd ed.; Wiley: New York, NY, USA, 2003. [Google Scholar]
- Wu, Y.; Zhou, S.; Qin, F.; Ye, X.; Zheng, K. Modelling physical and oxidative removal properties of Fenton process for treatment of landfill leachate using response surface methodology (RSM). J. Hazard. Mater. 2010, 180, 456–465. [Google Scholar] [CrossRef]
- Segura, C.; Zaror, C.; Mansilla, H.D.; Mondaca, M.A. Imidacloprid oxidation by photo-fenton reaction. J. Hazard. Mater. 2008, 150, 679–686. [Google Scholar] [CrossRef]
- Arslan-Alaton, I.; Tureli, G.; Olmez-Hanci, T. Treatment of azo dye production wastewaters using Photo-Fenton like advanced oxidation processes: Optimization by response surface methodology. J. Photochem. Photobiol. A 2009, 202, 142–153. [Google Scholar] [CrossRef]
- Almeida, L.C.; Garcia-Segura, S.; Bocchi, N.; Brillas, E. Solar photoelectro-fenton degradation of paracetamol using a flow plant with a Pt/air-diffusion cell coupled with a compound parabolic collector: Process optimization by response surface methodology. Appl. Catal. B Environ. 2011, 103, 21–30. [Google Scholar] [CrossRef]
- Aybastier, O.; Demir, C. Optimization of immobilization conditions of thermomyceslanuginosus lipase on styrene-divinylbenzene copolymer using response surface methodology. J. Mol. Catal. BEnzym. 2010, 63, 170–178. [Google Scholar] [CrossRef]
- Sanchez-Lafuente, C.; Furlanetto, S.; Fernandez-Arevalo, M. Didanosine extended-release matrix tablets: Optimization of formulation variables using statistical experimental design. Int. J. Pharm. 2002, 237, 107–118. [Google Scholar] [CrossRef]
- Üstün, G.E.; Akal Solmaz, S.K.; Morsunbul, T.; Azak, H.S. Advanced oxidation and mineralization of 3-indole butyric acid (IBA) by fenton and fenton-like processes. J. Hazard. Mater. 2010, 180, 508–513. [Google Scholar] [CrossRef]
- Madhavana, J.; Kumar, S.S.P.; Anandan, S.; Grieser, F.; Ashokkumar, M. Sonophotocatalytic degradation of monocrotophos using TiO2 and Fe3+. J. Hazard. Mater. 2010, 177, 944–949. [Google Scholar] [CrossRef]
- American Public Health Association. Standard Methods for the Examination of Water and Wastewater, 20th ed.; American Public Health Association: Washington, DC, USA; American Water Works Association: Washington, DC, USA; Water Environment Federation: Washington, DC, USA, 1998. [Google Scholar]
- YaliliKilic, M.; Akal Solmaz, S.K.; Üstün, G.E.; Azak, S.H. Investigation of oxidation and mineralization of the pesticide dimethoate, an endocrine disruptor, using response surface methodology and Fe+2 process. In Proceedings of the Sixth International Conference on Environmental Management, Engineering, Planning & Economics, Thessaloniki, Greece, 25–30 June2017. [Google Scholar]
- Tamimi, M.; Qourzal, S.; Barka, N.; Assabbane, A.; Ait-Ichou, Y. Methomyl degradation in aqueous solutions by Fenton’s reagent and the photo-fenton system. Sep. Purif. Technol. 2008, 61, 103–108. [Google Scholar] [CrossRef]
- Lucas, M.S.; Jose, A. Peres Decolorization of the azo dye Reactive Black 5 by Fenton and photo-Fenton oxidation. Dyes Pigments 2006, 71, 236–244. [Google Scholar] [CrossRef]
- Chen, R.Z.; Pignatello, J.J. Role of quinone intermediates as election shuttle in Fenton and photoassisted Fenton oxidation of aromatic compounds. Environ. Sci. Technol. 1997, 312, 399–2406. [Google Scholar]
- Sun, J.H.; Sun, S.P.; Fan, M.H.; Guo, H.Q.; Qiao, L.P.; Sun, R.X. A kinetic study on the degradation of P-nitroaniline by fenton oxidation process. J. Hazard. Mater. 2007, 148, 172–177. [Google Scholar] [CrossRef]
- Tony, M.A.; Bredi, Z. Experimental design of photo-Fenton reactions for the treatment of car wash wastewater effluents by response surface methodological analysis. Adv. Environ. Chem. 2014, 2014, 958134. [Google Scholar] [CrossRef]
- Ghaly, M.Y.; Hartel, G.; Mayer, R.; Haseneder, R. Photochemical oxidationof P-chlorophenol by UV/H2O2 and photo-Fenton process. A comparative study. Waste Manag. 2001, 21, 41–47. [Google Scholar] [CrossRef]
- Rodriguez, M.; Malato, S.; Pulgarin, C.; Contreras, S.; Curco, D.; Gimenez, J.; Esplugas, S. Optimizing the solar photo-fenton process in the treatment of contaminated water, determination of intrinsic kinetic constants for scale-up. Solar Energy 2005, 79, 360–368. [Google Scholar] [CrossRef]
- Ying-Shih, M.; Chi-Fanga, S.; Jih-Gaw, L. Degradation of Carbofuran in aqueous solution by ultrasound and Fenton processes: Effect of system parameters and kinetic study. J.Hazard. Mater. 2010, 178, 320–325. [Google Scholar]
- Masomboon, N.; Chen, C.; Anotai, J.; Lu, M. A statistical experimental design to determine O-toluidine degradation by the photo-Fenton process. Chem. Eng. J. 2010, 159, 116–122. [Google Scholar] [CrossRef]
Figure 1.
Effects of initial DMT concentration and initial reaction time on DMT oxidation.

Figure 2.
Effects of initial Fe3+ and initial H2O2 concentrations on DMT oxidation.

Figure 3.
Effects of initial DMT concentration and initial reaction time on the removed TOC concentration.
Figure 3.
Effects of initial DMT concentration and initial reaction time on the removed TOC concentration.

Figure 4.
Effects of initial Fe3+ and initial H2O2 concentrations on the removed TOC concentration.

Publisher’s Note: MDPI stays neutral with regard to jurisdictional claims in published maps and institutional affiliations. |
© 2018 by the authors. Licensee MDPI, Basel, Switzerland. This article is an open access article distributed under the terms and conditions of the Creative Commons Attribution (CC BY) license (https://creativecommons.org/licenses/by/4.0/).
Share and Cite
MDPI and ACS Style
Nalbur, B.E.; Teksoy, A.; Solmaz, S.K.A.; Azak, H.S. Modelling Dimethoate Removal by Fenton-Like Process Using Response Surface Methodology. Proceedings 2018, 2, 649. https://doi.org/10.3390/proceedings2110649
AMA Style
Nalbur BE, Teksoy A, Solmaz SKA, Azak HS. Modelling Dimethoate Removal by Fenton-Like Process Using Response Surface Methodology. Proceedings. 2018; 2(11):649. https://doi.org/10.3390/proceedings2110649
Chicago/Turabian StyleNalbur, Berrak Erol, Arzu Teksoy, Seval Kutlu Akal Solmaz, and Hilal Safiye Azak. 2018. "Modelling Dimethoate Removal by Fenton-Like Process Using Response Surface Methodology" Proceedings 2, no. 11: 649. https://doi.org/10.3390/proceedings2110649