Modelling Surface Temperatures on 3G Artificial Turf †


School of Architecture, Building and Civil Engineering, Loughborough University, Loughborough LE11 3TU, UK
*
Author to whom correspondence should be addressed.
†
Presented at the 12th Conference of the International Sports Engineering Association, Brisbane, Queensland, Australia, 26–29 March 2018.
Proceedings 2018, 2(6), 279; https://doi.org/10.3390/proceedings2060279
Published: 13 February 2018
(This article belongs to the Proceedings of The 12th Conference of the International Sports Engineering Association)
Abstract
:High surface temperatures are often recorded on or close to the surface of an artificial turf pitch (ATP). Many literature sources from different countries have reported surface temperatures on artificial pitches rising up to 90–95 °C on hot days, which has raised numerous concerns about health risks for adult and child users. This study has investigated the thermal behavior of an instrumented 3rd generation ATP at Loughborough University in the UK, and related data also collected from several similar ATPs and a natural turf field. The data show the ATP is warming up and cooling down very quickly, up to 2.5–3.0 °C per minute. Solar radiation is the main factor driving the surface temperature fluctuations. A numerical model was developed to predict the surface temperatures and showed good approximation to the observed data. The model was used to show peak surface temperatures could be significantly reduced by increasing the albedo of the surface.
1. Introduction
The third generation (3G) of artificial turf pitch (ATP) was developed in late 1990s with the purpose to make the performance similar to that of the natural turf and allow the use of studded boots. They utilize relatively long polyethylene (or polypropylene) fibers (40–65 mm) woven into a carpet, with a layer of recycled crumb rubber infill above a sand infill layer, and in most cases a rubber shockpad below the carpet [1]. The combination of carpet and infill, and shockpad, is often referred to as the surface ‘system’. Underneath this system a solid foundation is required, often (UK and Europe) comprising a tarmacadam layer over compacted stone. This third generation of artificial pitches is common globally for many codes of football at all levels of competition [1].
Research into artificial sports pitches has primarily been focused on cost, injury risk, and user and ball performance—often empirically and contrasting data with ‘high quality’ natural turf surfaces for comparison. However, of increasing interest is the thermal response of these outdoor sport surfaces to the environmental conditions [2]. Surface temperatures observed on artificial pitches are in general significantly higher than those observed on natural turf pitches [3], especially for regions with hotter climates. Numerous example reports from the USA and Australia exist wherein surface temperatures close to or above 90 °C were measured [3], including 95 °C reported in Toronto with the strips of the coach’s shoe soles melting [4]. However, limited research has been carried out to date to explain or consider sustainable solutions to reduce the surface temperature of artificial pitches. Innovations are hampered by a lack of field data and models to describe and predict thermal behavior, especially the latter.
The surface temperatures on the synthetic turf have been observed to be 22–48 °C higher than on adjacent natural turf [3], attributed partly to the different albedo (solar reflectivity) of the surfaces [5]. Varying the color (e.g., white) of the artificial fibers [5,6] showed only a small effect. High surface temperatures have been attributed to the black crumb rubber infills, and different alternative infills were tested but with only small changes observed [2,6,7].
Some reports and studies [6,8,9] from the USA in particular, have shown a limited benefit from irrigation to cool ATPs on very hot days with reductions recorded of 35 °C and 15–20 °C for non-infilled and infilled (3G) artificial pitches respectively. However, an irrigation solution requires a significant amount of water and infrastructure, and is not considered a sustainable solution.
Several empirical studies [5,7,10] have concluded that the solar radiation is the primary cause of the high temperatures recorded on artificial pitches. It has been observed that less than 10% of the incoming solar radiation is conducted into the sub-surface, suggesting a high level of ‘insulation’ provided by the ATP’s [5].
This paper presents the key outcomes of a recent study to monitor the thermal behavior of a new 3G ATP. In addition, the aim was to build a numerical model to explain and predict thermal behavior and the effect of design changes, validated by the field measurements.
2. Materials and Methods
The experimental research programme was conducted on the Loughborough University campus, on a newly installed 3G ATP in 2016. During installation of the pitch, a series of thermocouples were buried at various depths in each construction layer and post-construction an Infra-Red (IR) sensor installed to continuously monitor the surface temperature of the ATP surface.
The four primary objectives of the research were to (1) monitor the surface and sub-surface temperatures (at high resolution) over more than one year; (2) investigate key thermal related properties of a series of ATP’s on campus; (3) develop a simple numerical model to accurately predict the surface temperatures of the 3G artificial pitch; (4) use the model to explain the heat transfer and evaluate the potential of changes in the surface system design to reduce surface temperatures.
2.1. System Construction and Materials
The instrumented 3G ATP is composed of eight components, typical of UK construction practice. The carpet comprised polyethylene green fibers of length 60 mm, green in color. The fibers are supported by two layers of infill: a lower layer of sand (approximately 15 mm in thickness and uniform size 0.2–0.6 mm); and an upper layer of black crumb rubber infill (approximately 30 mm in thickness and size range 0.5–1.5 mm). A shockpad (25 mm thick) comprises polyurethane bound recycled rubber granules 2–6 mm in size. A porous asphalt layer (40 mm thick) allows through drainage. A low fines crushed rock sub-base (300 mm thick), and the local silty clay soil substrate (a geosynthetic separator membrane is used). Thermocouples were installed during construction in (50 mm into) the soil, in the middle of the sub-base layer, at the base of the asphalt, at the base of the shockpad, under the carpet backing, and buried in the sand infill layer. No thermocouple was installed in the rubber infill due to H&S concerns for users sliding across the surface. Two sets of thermocouples were installed at each location for redundancy.
2.2. Surface Temperature and Albedo Measurements
The surface temperatures were monitored at one-second intervals, using a Calex PyroMini IR temperature sensor with battery operated data logger. A photovoltaic panel was installed to charge the battery. The IR sensor was installed at a height of 2.7 m on an adjustable bracket behind the perimeter fence to protect it from ball impact, and with an unobstructed view of the surface.
The surface albedo (solar reflectivity) of the 3G ATP and three other sport surfaces on campus were measured with an albedometer, consisting of two identical Kipp & Zonen CMP3 thermopile pyranometers mounted back to back. The albedo is the ratio of the short-wave solar radiation reflected from the surface to that incoming from the sky measured by a pair of pyranometers facing horizontally downwards and upwards. The measurements were performed away from the colored lines, in order to avoid interference, and at a height of 1.4 m. The albedo was calculated from readings at one-second intervals averaged over approximately 17 min and repeated across several locations across the pitches to check the repeatability of the results.
2.3. Numerical Model
The numerical model was developed in WUFI Pro for the calculation of the heat transport in a one-dimensional multi-layer system. WUFI® Pro is a proprietary software used commonly in industry for performing hygrothermal (movement of heat and moisture) calculations on building elements (e.g., walls), under realistic climate conditions. The development steps of the model comprised: definition of the material layers’ thermal properties and thicknesses; definition of the initial boundary conditions; input of climate on the external and internal surfaces (weather data and sub-surface temperatures). Starting from the specified initial conditions, the algorithms in WUFI compute the hourly temporal evolution of the temperature distribution in the component material layers. The direction and magnitude of heat flows through the material layers are governed by fundamental heat flux transport equations and depend on the conditions within the components, the conditions in the adjacent components, and the internal (sub-soil) and external boundaries. Sensitivity analysis indicated that heat transfer by moisture fluxes (mainly evaporation) had little impact on the results and was therefore ignored.
The thicknesses of the components and the key material intrinsic properties of thermal conductivity and heat capacity were defined from literature (shown in Table 1). The ‘effective’ thermal conductivities of the crumb rubber and shockpad were calculated with the use of the Zehner and Schlunder formula [11], to account for porosity and moisture content. The crumb rubber infill and the shockpad assumed standard values for recycled rubber (0.150 W/m K), and whilst porosity is known the moisture state was estimated from literature (and has little effect on conductivity).
The emissivity of the surface (0.95) was measured with an Infra-Red Thermographic (IRT) camera. The albedo and emissivity were set inputs in the model, enabling the explicit radiation balance to take into account the radiative cooling due to long-wave emission.
WUFI compatible weather data (average hourly) was input into the model from the Loughborough University weather station (external boundary conditions). The weather data comprised air temperature; relative humidity; solar global and diffuse horizontal radiation; wind speed. For the internal boundary condition, a constant sub-soil temperature of 18 °C at 0.46 m depth was used (average for the period). The model did not account for rain or changes in moisture condition in the layers, recognized as a limitation and a possible future refinement. However, no field water contents were available nor are they easy to collect, and the model approximated well the observed temperatures regardless. The Mean Bias Error (MBE) and Root Mean Square Error (RMSE) were calculated to assess the bias and accuracy of the model respectively.
3. Results
3.1. Surface Temperature and Albedo
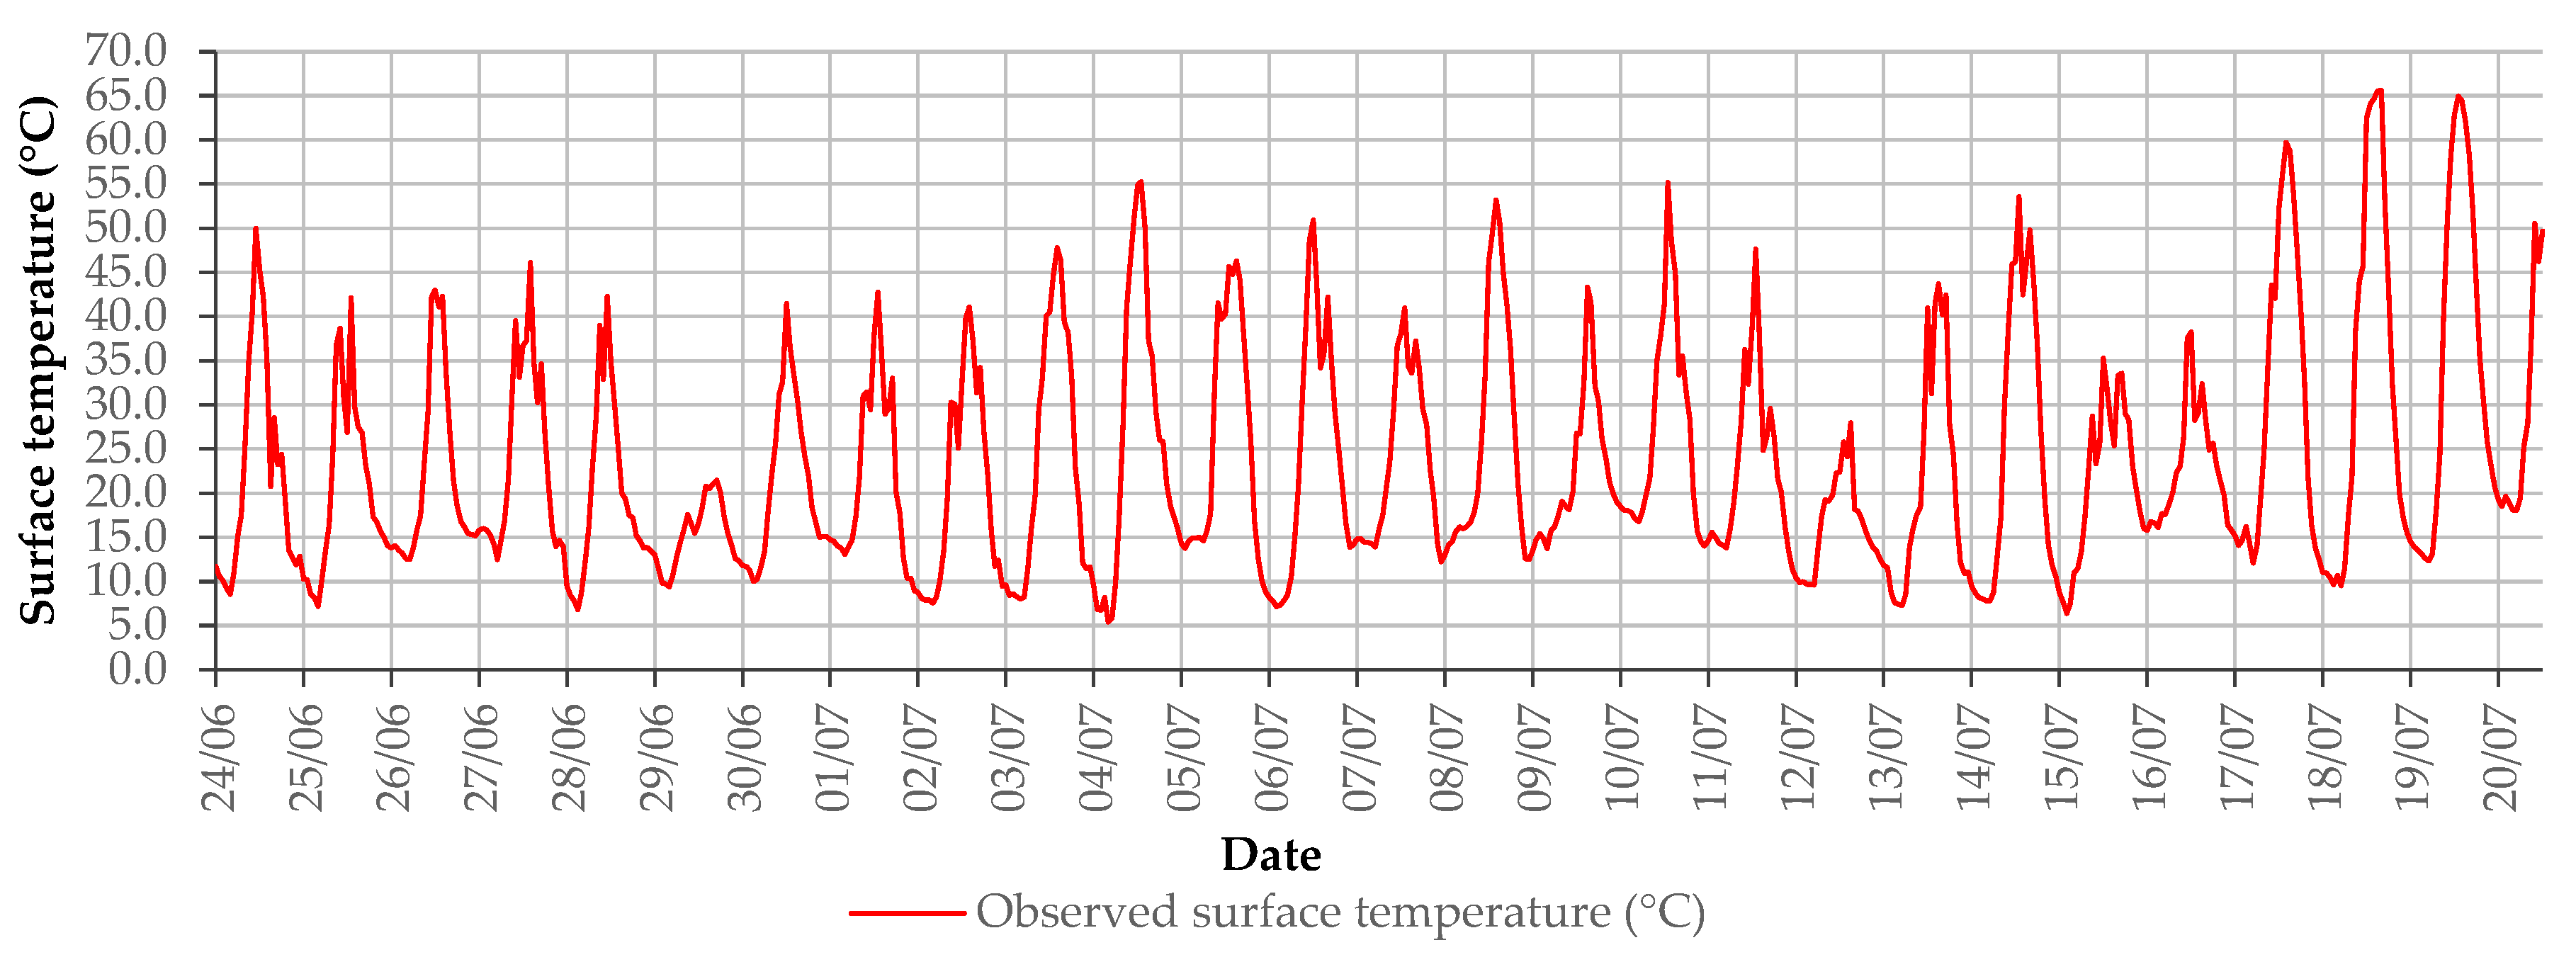
The surface temperatures on the 3G sport pitch varied greatly between night and day (Figure 1). In general, the nightly average surface temperature ranged between 5 °C and 18 °C, while the peak daytime surface temperatures rose to 65.6 °C on 18 July 2016. For the observed period, the coolest daily surface temperatures were observed on the 29 June, with the maximum surface temperature of 21.5 °C. A relatively low intensity of solar radiation due to cloudy weather (maximum hourly global horizontal solar radiation = 333.6 W/m2), and a relatively large amount of rain (daily rain = 23.6 mm) cooling the pitch and air temperature (max air temperature = 16.7 °C) was observed on this day.
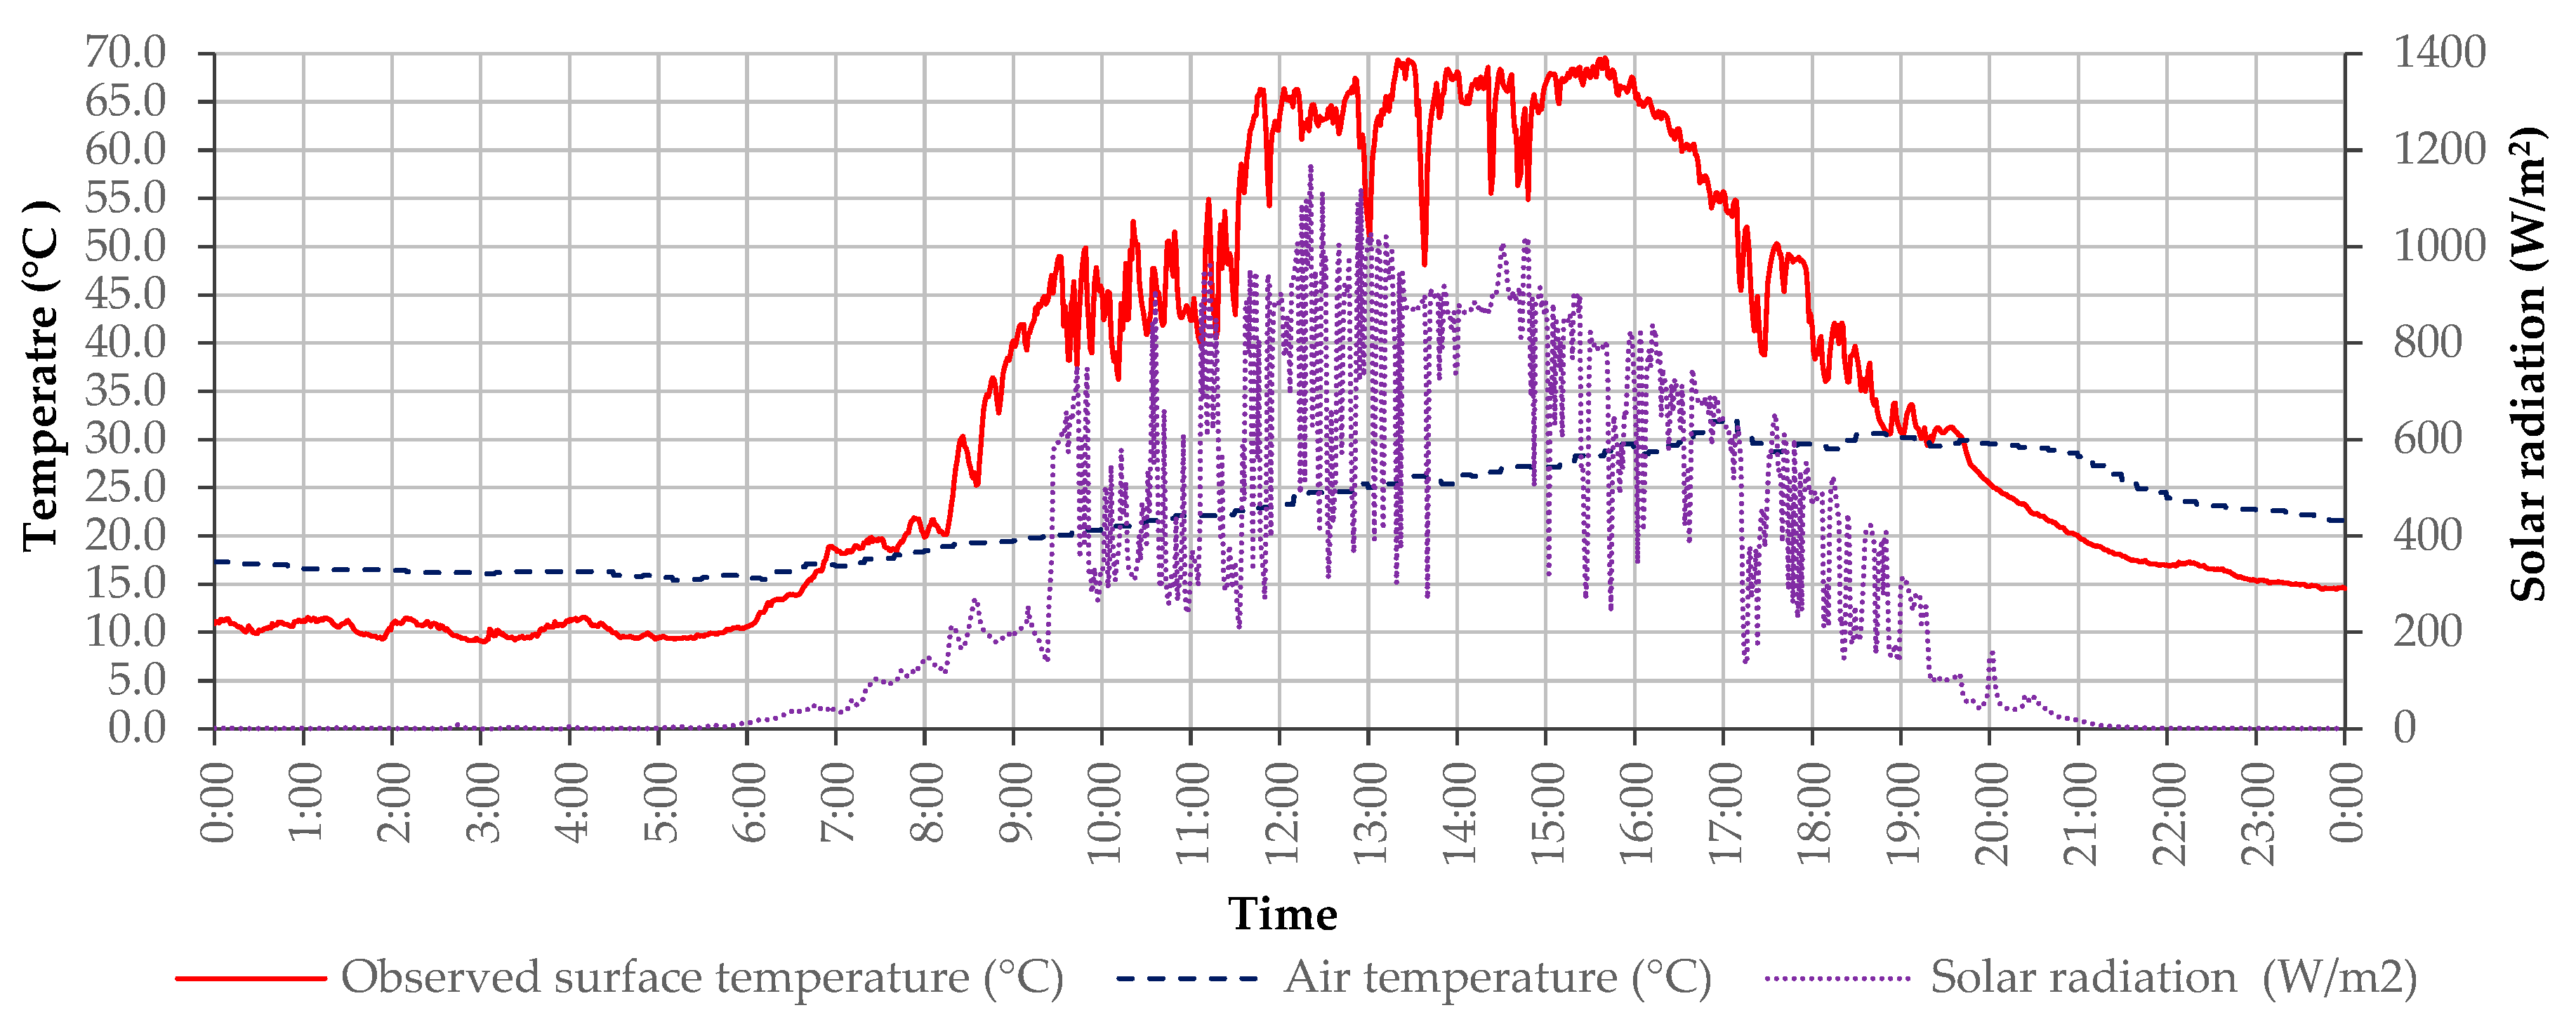
In Figure 2 are shown the surface temperatures for the 18 July 2016 at a higher resolution (minutely averages). The surface temperatures exceeded 65 °C several times during the day, with the peak temperature of 69.6 °C at 15:40. As shown in Figure 2 the biggest drop of surface temperature was observed between 13:30 and 13:38, from 69.0 °C to 48.1 °C in just 8 min and once the cloud cover passed temperatures rose quickly again from 48.1 °C to 66.9 °C in just 8 min. Thus, it appears that surface temperatures can vary by over 20 °C in just 8 min. The drop in surface temperatures was caused by the clouds reducing the solar radiation from 900 W/m2 to 269 W/m2. After the clouds moved away, the solar radiation increased again to 900 W/m2, increasing the surface temperatures almost to the same temperature as that before the cloud cover. The surface temperatures can vary very quickly, and the variations were caused mostly by changes in solar radiation. In fact, a linear regression in SPSS showed that the solar radiation accounts for 83.8% of the variance in surface temperatures (N = 1409; p < 0.0005). If air temperature is added into a stepwise multiple regression in SPSS, the explanatory power of the model (adjusted R2) rises to 91.8% (N = 1409; p < 0.0005). However, in contrast, the wind speed, relative humidity and rain precipitation were shown to be insignificant to the variation of the surface temperature in a multiple linear regression.
The average albedo of the 3G filled surface was measured to be 4.5% (σ = 0.5%), with a measuring uncertainty of ±0.4%. The albedo of the 3G ATP was lower than the albedo measured on other types of pitches inside the campus: sand dressed lacrosse pitch (albedo = 9.4%; σ = 0.3%), water-based hockey pitch (albedo = 11.0%; σ = 0.4%) and natural turf soccer pitch (albedo = 24.5%; σ = 0.9%). This lower albedo of the 3G ATP is one of the main reasons for the higher surface temperatures: 95.5% of the incoming solar radiation is absorbed by the ATP (only 4.5% reflected) compared with 75.5% for the natural turf soccer pitch (24.5% reflected).
3.2. Numerical Model
In general, the numerical model approximated the maximum surface temperatures well, or slightly over-predicted by approximately 2.0–7.0 °C. As shown in Figure 3, for the 24 June, the numerical model closely predicted the pitch surface temperatures until around 14:00. However, as it started to rain (at around 15:00), the predictions over-estimate the observed values due to the rain cooling the surface and the numerical model not accounting for this effect. The model responds well in regard the rapid changes in temperature observed in the measurements. The MBE and RMSE were calculated as 1.85 °C and 4.08 °C. However, the model limitation and lower accuracy overnight are the primary causes for the magnitude of the RMSE.
Sensitivity and parametric analyses were carried out using the numerical model to consider changes in the thermal properties of the pitch. Those changes which showed some real effects included: albedo, the conductivity of the infill, and specific heat capacity of the infill. Changes in albedo of the surface from the initial 4.5% up to the natural turf value of 24.5% suggested the peak temperatures would reduce linearly from 50 to 43 °C. Very large changes in conductivity (5-fold and 30-fold increases) of the infill alone reduced surface temperatures by 4 °C and 6 °C respectively. Further analysis suggested that saturating the infill with water does not increase the dry conductivity by more than a factor of 6, and peak reductions in temperature might be around 4 °C. Analysis of the different ATP surfaces showed that even for the unfilled hockey surface the peak temperatures were still relatively high, peaking at around 43 °C, around 7 °C cooler than the 3G infilled pitch. As an example of replacing the rubber infill with a more natural material, a moist sandy clay infill was investigated with a higher thermal conductivity and heat capacity than the rubber infill. A maximum reduction in surface temperatures of 13 °C was predicted, and a reduced rate of surface temperature fluctuations due to the greater conductivity and heat capacity.
4. Discussion and Conclusions
The field data observations have demonstrated rapid heating and cooling of the surface of a 3G ATP during peak summer daylight hours. Performing multiple linear regression has reinforced the findings of other researchers that the solar radiation and air temperature are the primary contributors to the fluctuations and magnitudes of surface temperature. However, the numerical model, developed in the WUFI software, has fully demonstrated the advantages of using the material properties of the pitch to provide more powerful estimates of the surface temperature and the effects of changes in these properties. In addition, the model approximates well the observed surface temperatures, albeit some refinement may be prudent to permit some transient cooling from rainfall. The numerical model further permits the input and predictions based on weather files for different surface constructions and geographical locations (weather profiles).
The results for an artificial 3G pitch suggest that replacing the black crumb rubber with a material with higher conductivity and higher albedo may decrease the maximum surface temperatures by 14–20 °C, compared to a green 3G ATP with black crumb rubber at 80–90 °C. More reflective fibers may also be a partial solution—however the effect of these changes on play and user experience needs to be investigated. The field measurements reinforce, however, the short-term benefits of irrigating the pitch before a match (assuming sufficient water is available). It is interesting to note that ‘hybrid’ grass systems are gaining popularity in professional sport facilities, combining the benefits of natural and artificial surfaces for play and durability and may also be a suitable compromise for surface heating effects.
Acknowledgments
This research was made possible by EPSRC support for the London-Loughborough CDT in Energy Demand (grant EP/L01517X/1).
References
- Fleming, P. Artificial Turf Systems for Sport Surfaces: Current Knowledge and Research Needs. Proc. Inst. Mech. Eng. Part P J. Sports Eng. Technol. 2011, 225, 43–63. [Google Scholar] [CrossRef]
- Villacanas, V.; Sanchez-Sanchez, J.; Garcia-Unanue, J.; Lopez, J.; Gallardo, L. The influence of various types of artificial turfs on football fields and their effects on the thermal profile of surfaces. Proc. Inst. Mech. Eng. Part P J. Sports Eng. Technol. 2016, 45, 363–367. [Google Scholar] [CrossRef]
- Twomey, D.; Petrass, L.; Harvey, J.; Otago, L.; LeRossignol, P. Heat experienced on synthetic turf surfaces: An inevitable or preventable risk? J. Sci. Med. Sport 2014, 18, e119–e120. [Google Scholar] [CrossRef]
- Nazareth Errol. Blazing Heat Burning Shoe Soles on Toronto’s Turf Fields—Toronto—CBC News. 2016. Available online: http://www.cbc.ca/news/canada/toronto/summer-heat-turf-1.3714351 (accessed on 1 September 2017).
- Devitt, D.; Baghzouz, M.; Bird, B.; Young, M. Surface temperature, heat loading and spectral reflectance of artificial turfgrasses. J. Turfgrass Sport Surf. Sci. 2007, 83, 68–82. [Google Scholar]
- Serensits, T.J. Is there any way to cool synthetic turf? SportsTurf 2011, 27, 20–22. [Google Scholar]
- Petrass, L.A.; Twomey, D.M.; Harvey, J.T. Understanding how the components of a synthetic turf system contribute to increased surface temperature. Procedia Eng. 2014, 72, 943–948. [Google Scholar] [CrossRef]
- Serensits, T.J.; McNitt, A.S.; Petrunak, D.M. Human health issues on synthetic turf in the USA. Proc. Inst. Mech. Eng. Part P J. Sports Eng. Technol. 2011, 225, 139–146. [Google Scholar] [CrossRef]
- Penn State’s Center for Sports Research. The Effect of Irrigation on Synthetic Turf Characteristics. 2015. Available online: http://plantscience.psu.edu/research/centers/ssrc/documents/irrigationsynthetic.pdf (accessed on 1 September 2017).
- Thoms, A.W.; Brosnan, J.T.; Zidek, J.M.; Sorochan, J.C. Models for Predicting Surface Temperatures on Synthetic Turf Playing Surfaces. Procedia Eng. 2014, 72, 895–900. [Google Scholar] [CrossRef]
- Kandula, M. On the Effective Thermal Conductivity of Porous Packed Beds With Uniform Spherical Particles. J. Porous Media 2011, 14, 919–926. [Google Scholar] [CrossRef]
Figure 1.
Measured surface temperatures (hourly averages) from 24 June to 20 July 2016.

Figure 2.
Surface temperatures (minutely averages), air temperature and solar radiation on 18 July 2016.
Figure 2.
Surface temperatures (minutely averages), air temperature and solar radiation on 18 July 2016.

Figure 3.
Observed surface/air temperatures, solar radiation and predicted surface temperatures on 24 June 2016.
Figure 3.
Observed surface/air temperatures, solar radiation and predicted surface temperatures on 24 June 2016.


Table 1.
Model inputs—Characteristics of the components of the 3G artificial pitch.
| Component | Thickness (mm) | Bulk Density (kg/m3) | Heat Capacity (J/kg K) | Thermal Conductivity (W/m K) |
|---|---|---|---|---|
| BCR 1 infill | 30 | 500 | 1490 | 0.082 2 |
| Sand infill | 15 | 933 | 883 | 0.410 |
| Shockpad | 25 | 550 | 2484 | 0.152 2 |
| Asphalt | 40 | 2360 | 1734 | 0.750 |
| Sub-base | 300 | 1983 | 1059 | 0.950 |
| Clay sub-soil | ∞ 3 | 1741 | 1552 | 0.870 |
1 Black Crumb Rubber; 2 Calculated with [11]; 3 Depth of the lowest thermocouple (460 mm)—Boundary condition.
Publisher’s Note: MDPI stays neutral with regard to jurisdictional claims in published maps and institutional affiliations. |
© 2018 by the authors. Licensee MDPI, Basel, Switzerland. This article is an open access article distributed under the terms and conditions of the Creative Commons Attribution (CC BY) license (https://creativecommons.org/licenses/by/4.0/).
Share and Cite
MDPI and ACS Style
Gustin, M.; Fleming, P.R.; Allinson, D.; Watson, S. Modelling Surface Temperatures on 3G Artificial Turf. Proceedings 2018, 2, 279. https://doi.org/10.3390/proceedings2060279
AMA Style
Gustin M, Fleming PR, Allinson D, Watson S. Modelling Surface Temperatures on 3G Artificial Turf. Proceedings. 2018; 2(6):279. https://doi.org/10.3390/proceedings2060279
Chicago/Turabian StyleGustin, Matej, Paul R. Fleming, David Allinson, and Stephen Watson. 2018. "Modelling Surface Temperatures on 3G Artificial Turf" Proceedings 2, no. 6: 279. https://doi.org/10.3390/proceedings2060279